Embed Size (px)
Citation preview
Review
A Systematic Review: Costing and Financing of Water, Sanitation, and Hygiene (WASH) in Schools Shannon McGinnis 1, Thomas McKeon 2, Richa Desai 2, Akudo Ejelonu 2, Stanley Laskowski 2 and Heather M. Murphy 1,*
1 College of Public Health, Temple University, Philadelphia, PA 19122, USA; [email protected] 2 Philadelphia VA Medical Center, University of Pennsylvania, Philadelphia, PA 19104, USA;
[email protected] (M.T.); [email protected] (D.R.); [email protected] (E.A.); [email protected] (L.S.)
* Correspondence: [email protected]; Tel.: +1-215-204-4766
Abstract: Despite the success of recent efforts to increase access to improved water, sanitation, and hygiene (WASH) globally, approximately one-third of schools around the world still lack adequate WASH services. A lack of WASH in schools can lead to the spread of preventable disease and increase school absences, especially among women. Inadequate financing and budgeting has been named as a key barrier for integrating successful and sustainable WASH programs into school settings. For this reason, the purpose of this review is to describe the current knowledge around the costs of WASH components as well as financing models that could be applied to WASH in schools. Results show a lack of information around WASH costing, particularly around software elements as well as there is a lack of data overall for WASH in school settings as compared to community WASH. This review also identifies several key considerations when designing WASH budgets or selecting financing mechanisms. Findings may be used to advise future WASH in school programs.
Keywords: WASH; school; developing countries; costing; financing; cost
1. Introduction
It has been estimated that 10 percent of the total global burden of disease could be prevented by improvements to water supply, sanitation, and hygiene (WASH) [1]. For example, 88 percent of diarrhea cases worldwide are attributed to inadequate WASH which results in 1.5 million preventable deaths each year, mainly among children [1]. WASH interventions can significantly reduce both the severity and prevalence of diarrhea, infectious diseases, and some vector-borne diseases and decrease child mortality rates around the globe [1]. Improved WASH can also have economic benefits through reducing medical treatment costs, preventing death, and increasing productivity [1]. Despite these advantages, in many countries around the world, a lack of finances, water quality standards, accountability, management, and a low prioritization of WASH all contribute to an inability to effectively build and maintain water and sanitation services [2], resulting in millions of preventable illnesses and deaths each year [2,3].
In order to address this problem, the UN, as part of its Millennium Development Goals (MDGs), set out to cut the proportion of people without access to safe drinking water and adequate sanitation in half by 2015 [4]. While these efforts have greatly increased the percentage of people around the globe with access to improved water sources and adequate sanitation since 1990, they have been primarily focused around WASH in the household or community, rather than at the institutional level [5]. As a result, important gaps remain in access to WASH, particularly in school settings [5]. For this reason, as a part of the Sustainable Development Goals following the 2015 MDG deadline, the Joint Monitoring Program (JMP), a collaboration between WHO and UNICEF to monitor access to drinking water and sanitation globally, has proposed to prioritize improving access to WASH at the institutional level including schools and healthcare facilities [5].
Preprints (www.preprints.org) | NOT PEER-REVIEWED | Posted: 16 March 2017 doi:10.20944/preprints201703.0114.v1
Peer-reviewed version available at Int. J. Environ. Res. Public Health 2017, 14, , 442; doi:10.3390/ijerph14040442

2 of 31
As of 2015, approximately one-third (31%) of schools globally do not have access to adequate water supply and even more do not have access to adequate sanitation (44%) [5]. Inadequate WASH is particularly concerning in schools due to the greater potential for disease transmission among children, who are considered to be a vulnerable group [5,6]. A lack of improved WASH may also contribute to school absences [7] which are associated with reduced academic performance, drop-out rates, and delays in academic and social development [8]. School absences have also been used as a proxy for health status among children in developed countries [9]. The relationship between WASH and school absences is particularly important for menstruating girls who require facilities for personal hygiene [5,7,10,11] and for this reason, WASH interventions in schools may also help reduce gender disparities in school performance and attendance [10].
The costs of implementing improved WASH services are less than the health costs associated with waterborne disease [12]. In fact, the WHO estimates that investment in WASH can lead to economic returns of $2 for every dollar spent on water and $5.5 for every dollar spent on sanitation [13]. Nevertheless, inadequate WASH is still an issue in many countries due to a lack of awareness and government policies, insufficient budget allocations, and financial resources [14]. As a result, in 2014, 80 percent of countries reported their current levels of financing are insufficient to meet their targets for drinking water and sanitation [15]. This is especially an issue in rural areas that receive less than 10 percent of WASH financing globally [15]. In order to improve budgeting and decision-making, it is important to understand the costs to implement and maintain WASH programs and infrastructure in developing countries [16]. For these reasons, improving knowledge around cost components and potential methods of financing for future WASH programs may help to support the planning and designing of interventions at the school level. The purpose of this systematic review is to understand what costing data is available on WASH in schools globally, identify financing mechanisms that have been used or could be used to help support funding of WASH in schools, and address key considerations or barriers to take into account when designing budgets or financing models for WASH in schools programs.
2. Materials and Methods
2.1. Research Questions
In an effort to recover all existing costing and financing data relevant to WASH in schools in a developing country context, two research questions were addressed in this review:
1. What are the elements, and associated costs, that could apply to a WASH in schools program in a developing country context?
2. How can or how is WASH in schools financed in a developing country context?
The first question seeks to identify the various elements that could be included in a WASH in schools program along with their associated costs. The second question aims to recover any information available on financing methods used in schools for financing of WASH.
2.2. Review Protocol
A review protocol was developed using the ‘Cochrane Handbook for Systematic Reviews of Interventions’ [17]. In December 2015, literature was searched using the PubMed/MEDLINE database. In an effort to capture relevant “grey literature” and reduce publication bias, Google Scholar, Google, and ProQuest Dissertations and Theses electronic databases were also employed. For the searches performed in Google Scholar and Google, the first 100 relevant articles were exported to Zotero reference software [18,19]. Titles, abstracts, and keywords were searched using terms outlined in Table 1. When performing searches, terms were separated by the Boolean terms OR/AND.
Preprints (www.preprints.org) | NOT PEER-REVIEWED | Posted: 16 March 2017 doi:10.20944/preprints201703.0114.v1
Peer-reviewed version available at Int. J. Environ. Res. Public Health 2017, 14, , 442; doi:10.3390/ijerph14040442
3 of 31
Table 1. Search terms used in systematic review of literature on WASH in Schools costing and financing, 1990-2015.
Question 1 WASH terms Cost/ Financing Terms WASH element terms What are the elements, and associated costs, that could apply to a WASH in Schools program in a developing country context?
water; sanitation; hygiene
tariff; price; scale; scaling; “cost structure”; investment; money; cost; financing; finance; “cost effective”; costing; microfinance; subsidies; subsidy; loan; loans; capital; recurring
"operation and maintenance”; training; evaluation; replacement; "water supply"; sanitation; hygiene; latrine; "point of use"; "household water treatment"; borehole; soap; "rainwater harvesting"; chlorine; hardware; software; education; "teacher training"; "menstrual hygiene management”; "cleaning materials"; "cleaning staff”; "hand washing"; construction
Question 2 WASH terms Cost/ Financing Terms Community/ School termsHow can or how is WASH in schools financed in a developing country context?
water; sanitation; hygiene
"willingness to pay"; finance; "microfinance"; "public sector finance”; "private sector finance"; "financial model"; government finance; financing; subsidies; “official development assistance" scaling; taxes; tax; school fees; tariff
community; schools; school; local; decentralized; centralized, "parent teacher association"; clinic; hospital; healthcare
To capture all relevant literature, the search for question 1 was not restricted to WASH in
schools, as initial rapid literature scans determined that including the term “school” reduced the number of articles recovered significantly. For question 2, search terms were broadened to include financing models from the healthcare sector that may be applied to WASH in schools. These sources were included to get a broader understanding of possible financing mechanisms as literature around financing of WASH in schools is limited. These terms were selected based on initial rapid literature scans that recovered interesting financial models from the healthcare sector. Only studies published in English were included in this review. The oldest sources recovered in the initial rapid literature scans dated back to 1991, therefore a date range of 1990 to 2015 was selected. Literature recovered from the four databases were exported into Zotero reference software, merged, and de-duplicated.
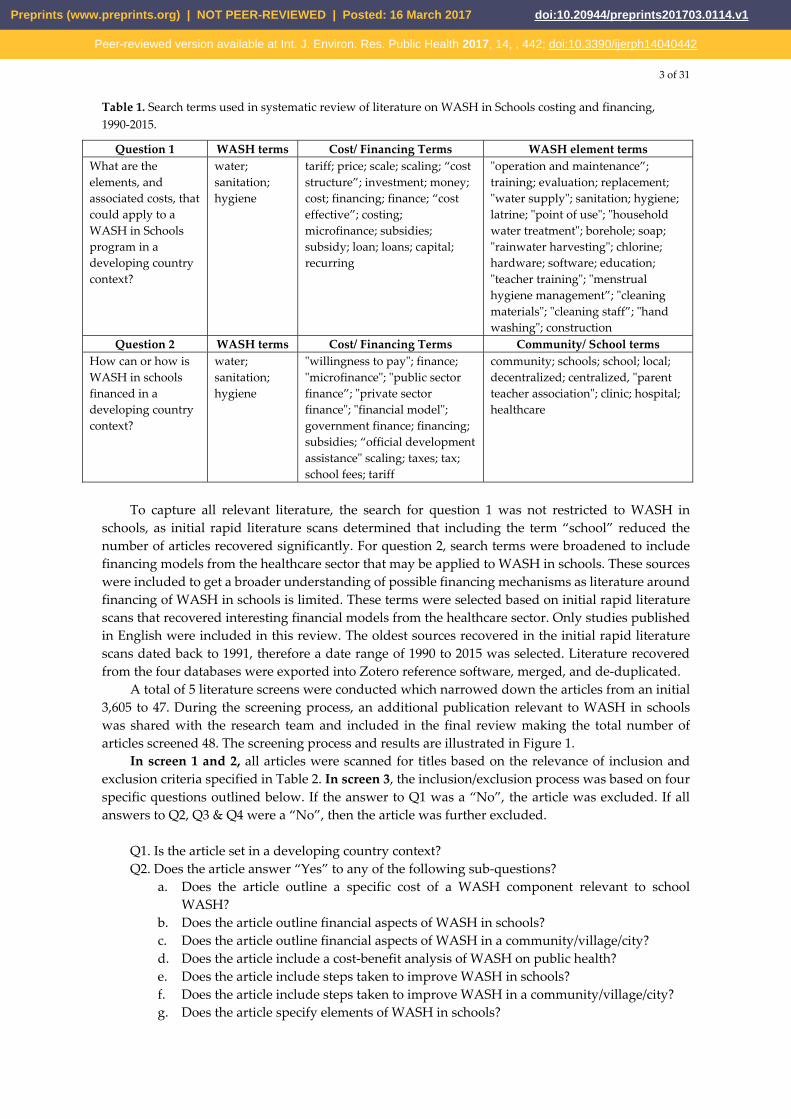
A total of 5 literature screens were conducted which narrowed down the articles from an initial 3,605 to 47. During the screening process, an additional publication relevant to WASH in schools was shared with the research team and included in the final review making the total number of articles screened 48. The screening process and results are illustrated in Figure 1.
In screen 1 and 2, all articles were scanned for titles based on the relevance of inclusion and exclusion criteria specified in Table 2. In screen 3, the inclusion/exclusion process was based on four specific questions outlined below. If the answer to Q1 was a “No”, the article was excluded. If all answers to Q2, Q3 & Q4 were a “No”, then the article was further excluded.
Q1. Is the article set in a developing country context? Q2. Does the article answer “Yes” to any of the following sub-questions?
a. Does the article outline a specific cost of a WASH component relevant to school WASH?
b. Does the article outline financial aspects of WASH in schools? c. Does the article outline financial aspects of WASH in a community/village/city? d. Does the article include a cost-benefit analysis of WASH on public health? e. Does the article include steps taken to improve WASH in schools? f. Does the article include steps taken to improve WASH in a community/village/city? g. Does the article specify elements of WASH in schools?
Preprints (www.preprints.org) | NOT PEER-REVIEWED | Posted: 16 March 2017 doi:10.20944/preprints201703.0114.v1
Peer-reviewed version available at Int. J. Environ. Res. Public Health 2017, 14, , 442; doi:10.3390/ijerph14040442
4 of 31
Q3. Does the article outline programs or financial models for systems in other sectors that may be applied to WASH in schools (e.g. in healthcare)?
Q4. If Y to Question 3, a. Does the article present specifics costs associated with the program? b. Does the article propose or describe financing mechanisms?
Figure 1. Systematic review article screening process and results for screens 1-5 for the review of WASH in Schools costing and financing, 1990-2015.
Scre
enin
g In
clud
ed
Elig
ibili
ty
Iden
tific
atio
n
Records identified through database searching
(n = 3,605 articles)
Records after duplicates removed (n = 3,599)
Scanned by 2 Researchers
Screen 1: Title Scan (n = 3,599)
Scanned by 2 researchers
Records excluded (n = 1,825)
Screen 2: Title and Abstract Scan (n = 1,774)
Scanned by 8 researchers
Records excluded (n = 1,440)
Screen 3: Abstract Scan (n = 334)
Scanned by 8 researchers
Full Article scan for Eligibility (n = 125)
Scanned by 5 researchers
Full Article scan for Eligibility (n = 77)
Scanned by 5 researchers
Articles Included in Review (n = 48)
Scanned by 4 researchers
Records excluded (n = 209)
Full text articles excluded • Did not include information on WASH costing or
financing (n=37) • Unable to recover full text (n=9) • Information from a developed country (n=2)
Full text articles excluded • Included costs or financing that may not apply
school WASH (e.g., willingness to pay for household interventions, desalination plant) (n=30)
Articles added in Final Review • Relevant costing article published after final article
scan (n=1)
Preprints (www.preprints.org) | NOT PEER-REVIEWED | Posted: 16 March 2017 doi:10.20944/preprints201703.0114.v1
Peer-reviewed version available at Int. J. Environ. Res. Public Health 2017, 14, , 442; doi:10.3390/ijerph14040442

5 of 31
Table 2. Inclusion and exclusion criteria used during systematic review of literature for screens 1-4.
Research Question
Population Cost/Financing Schools Include
Q1 Must be representative of a developing country context
Identifies specific costs of WASH program elements
Must be relevant to schools
If it specifies cost or elements of WASH in schools such as training, hardware, software, monitoring, admin costs, evaluation costs, etc.
Q2 Restricted to following regions: Africa, Asia, South/Central America
Identifies sources of funding / financing for WASH or another sector that could be applied to WASH
Financing mechanisms need to be relevant for schools (i.e. personal microfinance exclude)
If it mentions: Source of financing in schools, if it evaluates school WASH, if it evaluates financing of a health care program or system or community program that could potentially be applied to School WASH
In scans 4 & 5, the screening data extraction was based on three specific areas: country and setting, WASH elements and costs, and financing mechanisms. Finalist articles were classified into three major categories: 1) Articles that outlined cost for WASH elements relevant to WASH in Schools; 2) Articles that outlined either successful/ theoretical financing mechanisms relevant for WASH in Schools; 3) Articles that discussed both 1 & 2. For each category, there was a set of data extraction questions used to extract relevant information into an Excel database. Data extraction questions involved identifying the specific WASH program elements and their associated costs breaking down elements into hardware, software, and recurring costs. For financing mechanisms, extraction questions involved identifying whether the mechanisms were successful or theoretical and the types of financing used (i.e. government, private sector, NGO financing, user fees etc.). Results from the data extraction process were analyzed by category in a qualitative manner highlighting regional trends and identifying data and knowledge gaps in the literature. The remaining sources described either community WASH, financing models for WASH, other applicable financing models, or some combination of these. All dollar amounts reported in this review are in USD.
3. Results & Discussion
A total of 48 articles retrieved from our search are included in this review. Sources referenced both rural and urban settings and included journal articles, government documents, graduate theses, NGO reports, and books. Among the articles included after the final screen (n=48), only 12 made some reference to WASH in schools. Of these articles, one focused on hygiene education and latrine cleaning [20], one lists support tools that could be used for WASH in school programs [16], one discussed the benefits of funding school WASH [21], and nine discussed comprehensive WASH (including water supply, sanitation, and hygiene) in schools through a number of case studies in Kenya [22–24], the Asian-Pacific region [25], Ethiopia [26], India [27], Uganda [28], Bangladesh [29], and Latin American Countries [30]. These results show a lack of published information around WASH in schools as compared to community WASH.
3.1. WASH Costing
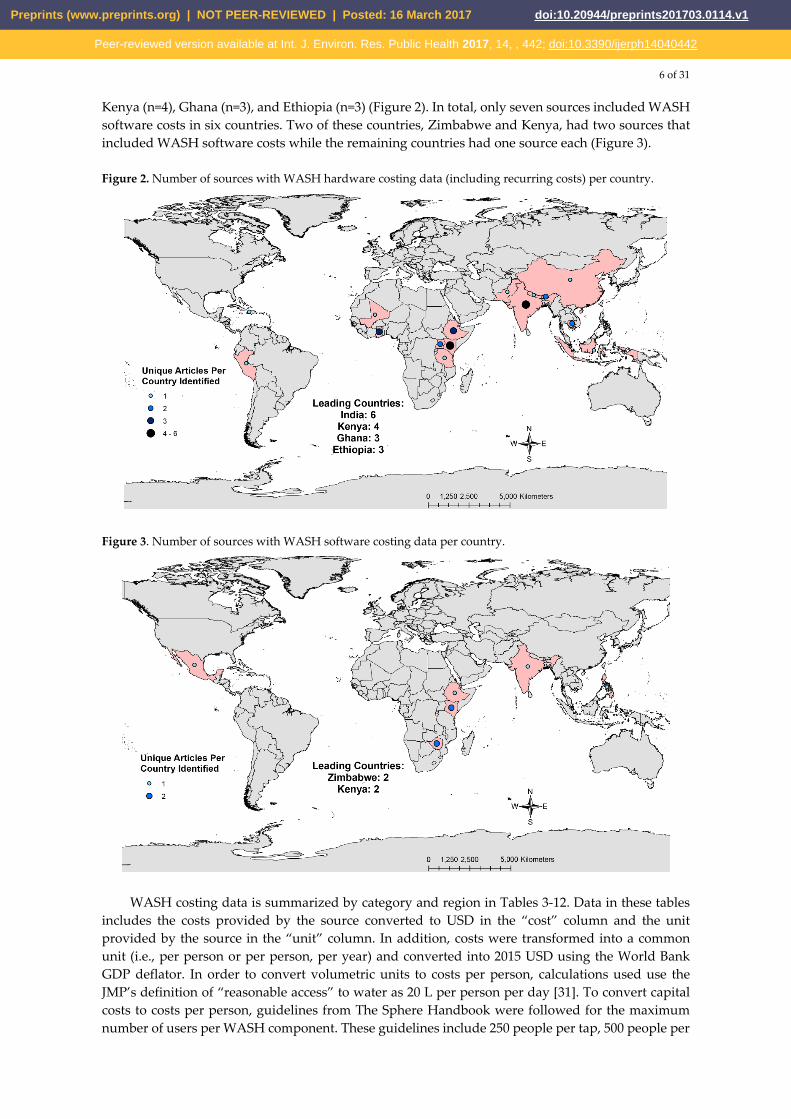
In general, there appears to be regional trends in the availability of WASH costing data displayed in Figures 2 & 3. These maps show the number of sources that included WASH hardware costs per country (Figure 2) and WASH software costs per country (Figure 3). Areas where WASH costing data is most concentrated include Africa, Southeast Asia and India, and parts of Latin America. The country with the most sources providing hardware costs was India (n=6), followed by
Preprints (www.preprints.org) | NOT PEER-REVIEWED | Posted: 16 March 2017 doi:10.20944/preprints201703.0114.v1
Peer-reviewed version available at Int. J. Environ. Res. Public Health 2017, 14, , 442; doi:10.3390/ijerph14040442
6 of 31
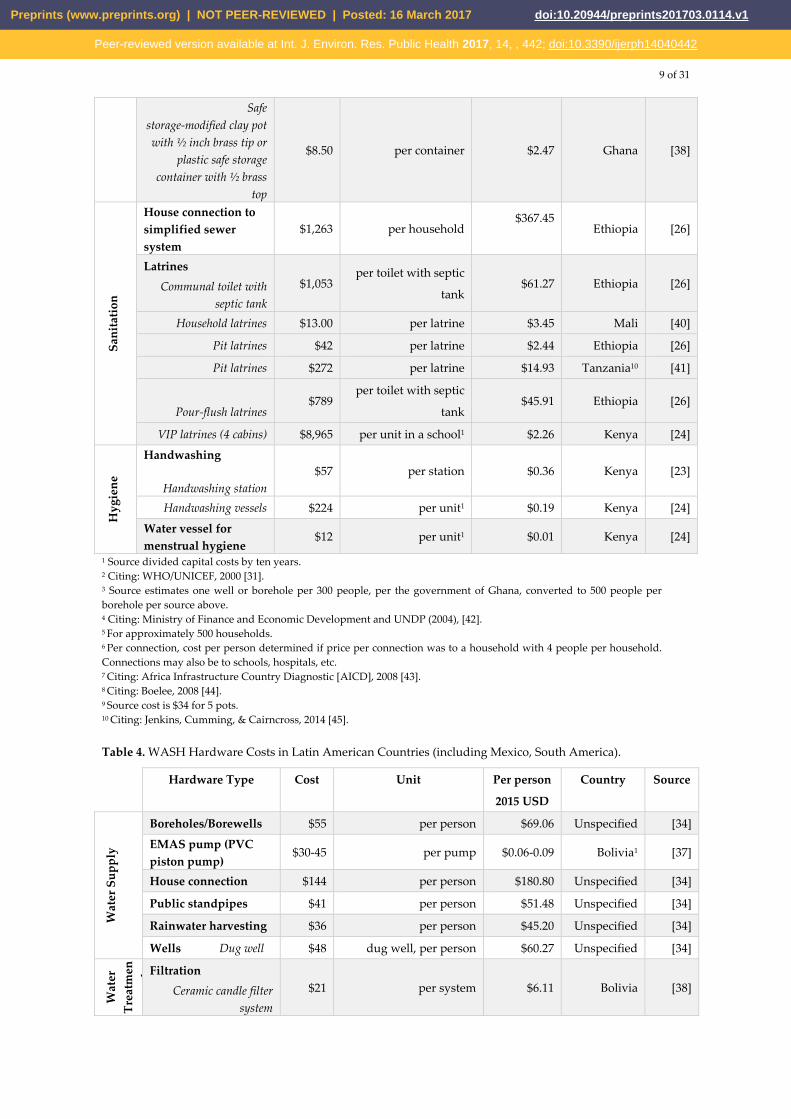
Kenya (n=4), Ghana (n=3), and Ethiopia (n=3) (Figure 2). In total, only seven sources included WASH software costs in six countries. Two of these countries, Zimbabwe and Kenya, had two sources that included WASH software costs while the remaining countries had one source each (Figure 3).
Figure 2. Number of sources with WASH hardware costing data (including recurring costs) per country.
Figure 3. Number of sources with WASH software costing data per country.
WASH costing data is summarized by category and region in Tables 3-12. Data in these tables includes the costs provided by the source converted to USD in the “cost” column and the unit provided by the source in the “unit” column. In addition, costs were transformed into a common unit (i.e., per person or per person, per year) and converted into 2015 USD using the World Bank GDP deflator. In order to convert volumetric units to costs per person, calculations used use the JMP’s definition of “reasonable access” to water as 20 L per person per day [31]. To convert capital costs to costs per person, guidelines from The Sphere Handbook were followed for the maximum number of users per WASH component. These guidelines include 250 people per tap, 500 people per
Preprints (www.preprints.org) | NOT PEER-REVIEWED | Posted: 16 March 2017 doi:10.20944/preprints201703.0114.v1
Peer-reviewed version available at Int. J. Environ. Res. Public Health 2017, 14, , 442; doi:10.3390/ijerph14040442

7 of 31
handpump, 400 people per single-user open well, and 20 people per toilet [32]. In order to convert values from a cost per person year to a single cost per person, the lifespan of the technology as prescribed in the sources was used, unless stated otherwise.
For the purpose of this review, WASH costing data was divided into three main categories: hardware costs (i.e. capital costs of infrastructure and hardware), software costs (i.e. education, promotion, administration, and staff costs), and recurring costs (i.e. hardware that needs to be replaced on an ongoing basis, consumables, cleaning, operation, and maintenance costs). Although, some software costs are also recurring, it was decided to group all software costs together to highlight the importance of WASH software components and demonstrate the lack of software costing data. Hardware and recurring data were further grouped into subcategories including: water supply, water treatment and storage, sanitation, and hygiene. Software data were not organized into subcategories due to the lack of available data in this category and the difficulty of organizing program-specific software components.
A total of 22 sources included costs of WASH hardware components, 7 sources included costs of software components, and 20 sources included recurring hardware costs. Sources that did not reference a specific country or included data aggregated across multiple regions are included in the “unspecified” country tables (Tables 6 & 12). In some cases, articles referenced other primary sources for their WASH costing data, indicated in footnotes below.
3.1.1. Hardware
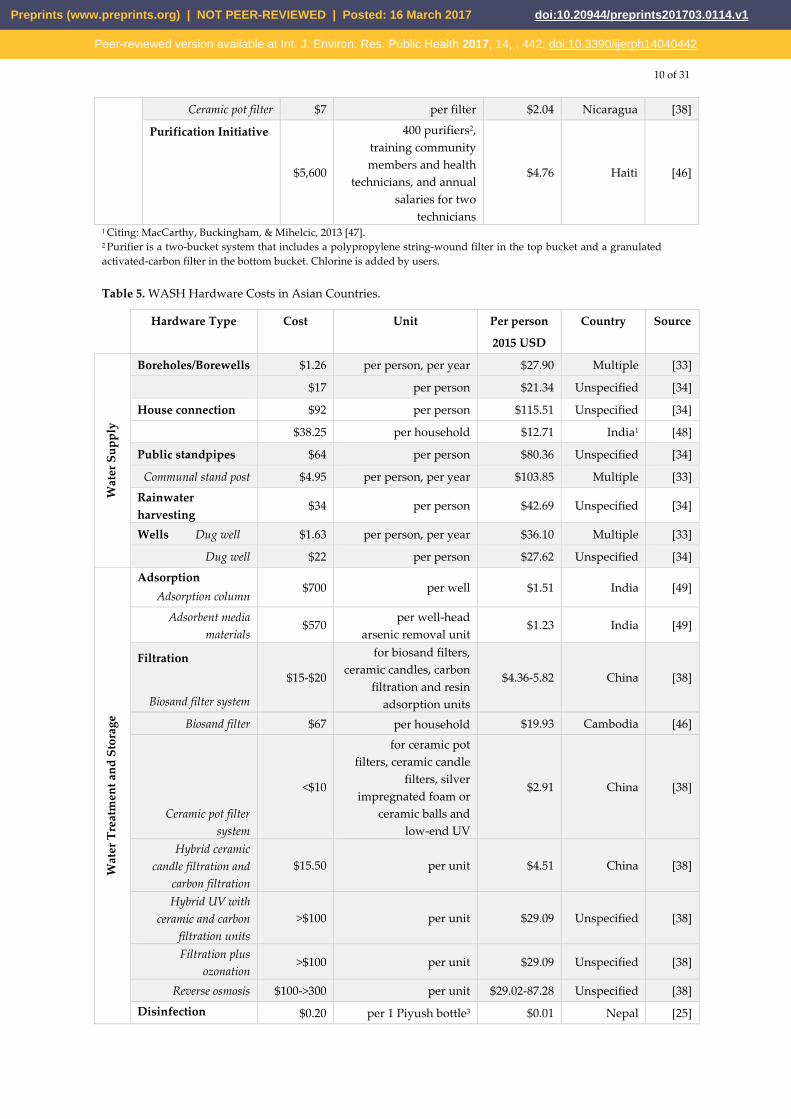
Of all three categories, the most costing information was available for hardware. Hardware costs include one-time costs of building and initiating WASH programs and interventions. The number of sources that included direct costs for WASH hardware totaled 13 for African countries (Table 3), 4 for Latin American Countries (Table 4), 10 for Asian countries (Table 5), and 6 for unspecified countries (Table 6). Out of the 101 individual costing data points gathered across all regions, 50 (50%) were for water supply. Hardware costs of water supply included costs for boreholes and tube wells (n=11), standpipes or communal stand posts (n=9), rainwater harvesting (n=8), wells (n=7), house/private connections to water supply (n=7), handpumps (n=4), spring sources (n=2), small town piped water (n=1), and EMAS pump (n=1). Hardware costs for water treatment and storage accounted for 32 (32%) of all cost data gathered. These include filtration (n= 17), water storage jars or bottles (n=8), disinfection or purification (n=4), adsorption (n=2), and a UV light source (n=1). Hardware costs for sanitation accounted for 16 (16%) of all hardware costs. Sanitation infrastructure included costs for latrines or toilets (n=13) and household sewer connections (n=3). Finally, hygiene infrastructure accounted for only 3 (3%) of all hardware costs. Hygiene infrastructure included handwashing infrastructure (n=2) and a water vessel for menstrual hygiene (n=1).
Table 3. WASH Hardware Costs in African Countries.
Hardware Type Cost Unit Per person 2015 USD
Country Source
Wat
er S
uppl
y
Boreholes/Borewells $1.70 per person, per year $37.65 Multiple [33]
for school WASH $2.38 per student, per year1 $24.05 Kenya [24]
$23 per person $28.88 Multiple2 [34]
fitted w/ handpump $42 per person $27.49 Ghana3 [35]
$7,605.93 per borehole $16.96 Ghana2 [36]
$8,316 per borehole $19.79 Ethiopia4 [26]
Tube well $15–40 per person5 $16.73-44.60 Uganda [34]
Tube well > $150 per person5 $167.27 Ethiopia [34]
Communal stand post $2.40 per person, per year $50.35 Multiple [33]
Preprints (www.preprints.org) | NOT PEER-REVIEWED | Posted: 16 March 2017 doi:10.20944/preprints201703.0114.v1
Peer-reviewed version available at Int. J. Environ. Res. Public Health 2017, 14, , 442; doi:10.3390/ijerph14040442

8 of 31
Standpipe $31 per person $38.92 Unspecified [34]
Service connection- Standpipe
$282 per connection $80.236 Ethiopia7 [26]
Town water $70-90 per person $78.06-100.36 Ethiopia [34]
Handpump
EMAS pump (PVC piston pump)
$43 or less
per pump $0.09 Uganda [37]
Rope pump (low cost handpump)
$80-100 per pump $0.16-0.21 Uganda [37]
Community handpump $15
0-1,000 for 250 people or
more $0.62-4.11 Uganda [37]
House Connection $102 per person $128.07 Unspecified [34]
$111 per household $30.94 Ethiopia [26]
Rainwater Harvesting $30 per person $33.45 Uganda [34]
$49 per person $61.52 Unspecified [34]
Gutters for rainwater catchment
$0.05 per student1 $0.51 Kenya [24]
Water tank for rainwater catchment
$2,690 per year, 10,000L
tank1 $0.68 Kenya [24]
Water tank for rainwater catchment
$6,726 per year, 25,000L
tank1 $1.70 Kenya [24]
Small town piped water
$79 per person $86.18 Ghana [35]
Spring source with gravity distribution
$15 per person $16.73 Uganda [34]
$17-$20 per person $18.96-22.30 Ethiopia [34]
Wells Dug well $1.55 per person, per year $34.33 Unspecified [33]
Dug well $21 per person $26.37 Unspecified [34]
Protected well $2,401.87 per protected well $8.93 Ghana [36]
Wat
er T
reat
men
t and
Sto
rage
Filtration Biosand filter
$13 per filter $3.78 Kenya [38]
Biosand filter $15 per filter with
50L plastic bucket $4.36 Ghana [38]
Ceramic pot filter $15-20 per filter $4.36-5.82 Ghana [38]
Ceramic candle filter $13 per unit, $2 per candle $3.78 Kenya [38]
Ultra-Filtration system $4,003.12
per filtration system, 20 m3 /day
capacity
$4.46 Ghana [36]
Disinfection Household chlorination
$7 per person $2.04 Kenya [38]
Water storage jar Clay jar
$5 per 40L $2.74 Ethiopia8 [39]
Clay pot $6.80 per 40L9 $4.12 Kenya [23]
Drinking water vessels $90 unit cost1 $0.07 Kenya [24]
Plastic water bottle
$0.19 per 500 mL $7.68 Kenya [20]
Plastic tank $16 per 100-220L $1.76-3.88 Kenya [23]
Safe storage-modified clay pot
$6 per pot $1.75 Kenya [38]
Preprints (www.preprints.org) | NOT PEER-REVIEWED | Posted: 16 March 2017 doi:10.20944/preprints201703.0114.v1
Peer-reviewed version available at Int. J. Environ. Res. Public Health 2017, 14, , 442; doi:10.3390/ijerph14040442
9 of 31
Safe storage-modified clay pot with ½ inch brass tip or
plastic safe storage container with ½ brass
top
$8.50 per container $2.47 Ghana [38]
Sani
tatio
n
House connection to simplified sewer system
$1,263 per household $367.45
Ethiopia [26]
Latrines Communal toilet with
septic tank $1,053
per toilet with septic
tank $61.27 Ethiopia [26]
Household latrines $13.00 per latrine $3.45 Mali [40]
Pit latrines $42 per latrine $2.44 Ethiopia [26]
Pit latrines $272 per latrine $14.93 Tanzania10 [41]
Pour-flush latrines $789
per toilet with septic
tank $45.91 Ethiopia [26]
VIP latrines (4 cabins) $8,965 per unit in a school1 $2.26 Kenya [24]
Hyg
iene
Handwashing
Handwashing station $57 per station $0.36 Kenya [23]
Handwashing vessels $224 per unit1 $0.19 Kenya [24]
Water vessel for menstrual hygiene
$12 per unit1 $0.01 Kenya [24]
1 Source divided capital costs by ten years. 2 Citing: WHO/UNICEF, 2000 [31]. 3 Source estimates one well or borehole per 300 people, per the government of Ghana, converted to 500 people per borehole per source above. 4 Citing: Ministry of Finance and Economic Development and UNDP (2004), [42]. 5 For approximately 500 households. 6 Per connection, cost per person determined if price per connection was to a household with 4 people per household. Connections may also be to schools, hospitals, etc. 7 Citing: Africa Infrastructure Country Diagnostic [AICD], 2008 [43]. 8 Citing: Boelee, 2008 [44]. 9 Source cost is $34 for 5 pots. 10 Citing: Jenkins, Cumming, & Cairncross, 2014 [45].
Table 4. WASH Hardware Costs in Latin American Countries (including Mexico, South America).
Hardware Type Cost Unit Per person
2015 USD
Country Source
Wat
er S
uppl
y
Boreholes/Borewells $55 per person $69.06 Unspecified [34]
EMAS pump (PVC piston pump)
$30-45 per pump $0.06-0.09 Bolivia1 [37]
House connection $144 per person $180.80 Unspecified [34]
Public standpipes $41 per person $51.48 Unspecified [34]
Rainwater harvesting $36 per person $45.20 Unspecified [34]
Wells Dug well $48 dug well, per person $60.27 Unspecified [34]
Wat
er
Trea
tmen
tdFiltration
Ceramic candle filter system
$21 per system $6.11 Bolivia [38]
Preprints (www.preprints.org) | NOT PEER-REVIEWED | Posted: 16 March 2017 doi:10.20944/preprints201703.0114.v1
Peer-reviewed version available at Int. J. Environ. Res. Public Health 2017, 14, , 442; doi:10.3390/ijerph14040442
10 of 31
Ceramic pot filter $7 per filter $2.04 Nicaragua [38]
Purification Initiative
$5,600
400 purifiers2, training community members and health
technicians, and annual salaries for two
technicians
$4.76 Haiti [46]
1 Citing: MacCarthy, Buckingham, & Mihelcic, 2013 [47]. 2 Purifier is a two-bucket system that includes a polypropylene string-wound filter in the top bucket and a granulated activated-carbon filter in the bottom bucket. Chlorine is added by users.
Table 5. WASH Hardware Costs in Asian Countries.
Hardware Type Cost Unit Per person
2015 USD
Country Source
Wat
er S
uppl
y
Boreholes/Borewells $1.26 per person, per year $27.90 Multiple [33]
$17 per person $21.34 Unspecified [34]
House connection $92 per person $115.51 Unspecified [34]
$38.25 per household $12.71 India1 [48]
Public standpipes $64 per person $80.36 Unspecified [34]
Communal stand post $4.95 per person, per year $103.85 Multiple [33]
Rainwater harvesting
$34 per person $42.69 Unspecified [34]
Wells Dug well $1.63 per person, per year $36.10 Multiple [33]
Dug well $22 per person $27.62 Unspecified [34]
Wat
er T
reat
men
t and
Sto
rage
Adsorption Adsorption column
$700 per well $1.51 India [49]
Adsorbent media materials
$570 per well-head
arsenic removal unit $1.23 India [49]
Filtration
Biosand filter system
$15-$20
for biosand filters, ceramic candles, carbon
filtration and resin adsorption units
$4.36-5.82 China [38]
Biosand filter $67 per household $19.93 Cambodia [46]
Ceramic pot filter system
<$10
for ceramic pot filters, ceramic candle
filters, silver impregnated foam or
ceramic balls and low-end UV
$2.91 China [38]
Hybrid ceramic candle filtration and
carbon filtration $15.50 per unit $4.51 China [38]
Hybrid UV with ceramic and carbon
filtration units >$100 per unit $29.09 Unspecified [38]
Filtration plus ozonation
>$100 per unit $29.09 Unspecified [38]
Reverse osmosis $100->300 per unit $29.02-87.28 Unspecified [38]
Disinfection $0.20 per 1 Piyush bottle3 $0.01 Nepal [25]
Preprints (www.preprints.org) | NOT PEER-REVIEWED | Posted: 16 March 2017 doi:10.20944/preprints201703.0114.v1
Peer-reviewed version available at Int. J. Environ. Res. Public Health 2017, 14, , 442; doi:10.3390/ijerph14040442

11 of 31
Chlorination
Iodine based disinfection
$32-103 per unit $9.31-29.97 Unspecified [38]
Water Storage Bottles
Plastic bottles for solar disinfection
$0.80 per person $0.93 Indonesia [46]
Sani
tatio
n
Household Sewer
Connection $68.85 per household $22.88 India1 [48]
$100 per household4 $34.82 Pakistan5 [50]
Toilet $10 per toilet $0.56 India [25]
$10-$1,000 per private toilet $0.61-60.57 India [51]
Ecosan Toilet $96 per household $27.93 Rural India6 [52] 1 Citing: Altaf, 1994 [53]. 2 Stainless steel (SS-304) adsorption column with valves, internals, water meter and connections with the existing well-head hand pump, for arsenic removal. 3 0.5% chlorine solution, 60 millilitre dropper bottles, 3 drops per L. 4 Reduced cost from standard $1,000 per household. 5 Citing: Hasan, 1990 [54]. 6 Citing: McCann, 2005 [55].
Table 6. WASH Hardware Costs in Unspecified Countries.
Hardware Type Cost Unit Per person
2015 USD
Country Source
Wat
er S
uppl
y
Handpump
On drilled well $17-55 per person $21.34-69.06 Rural Areas1 [56]
Public Standpipe $101,149.74-
359.070.38 per village2 $30.64-76.59 Unspecified [48]
Standpost $31-64 per person $38.92-80.36 Rural Areas1 [56]
House connection $484,608-1,0
51,793 per village3 $318.56-366.94 Unspecified [48]
$92-$144 per person $115.51-180.80 Unspecified1 [56]
Rainwater harvesting $34-49 per person $42.69-61.52 Rural Areas1 [56]
Wells Dug well $21-48 per person $26.37-60.27 Rural Areas1 [56]
Wat
er T
reat
men
t and
St
orag
e
Filtration
Biosand filter $25-100 per filter4 $6.86-27.44 Multiple [57]
Ceramic filter $8-10 per filter unit $2.20-2.74 Multiple [57]
Ceramic candle filters $5-$10 per filter $1.45-2.91 Multiple [38]
UV light source $10-200
per unit with transformer and electric cord
$2.91-$58.19 Unspecified [38]
Sani
tatio
n
Latrine
Pour-flush latrine $50-$91 per household $15.69-28.56 Multiple1 [52]
Pour-flush latrine <$100 per unit $6.72 Unspecified5 [50]
Simple pit latrine $26-$60 per household $8.16-18.83 Multiple1 [52]
VIP latrine $50-57 per household $15.69-17.89 Multiple1 [52] 1 Citing: WHO/UNICEF, 2000 [31].
Preprints (www.preprints.org) | NOT PEER-REVIEWED | Posted: 16 March 2017 doi:10.20944/preprints201703.0114.v1
Peer-reviewed version available at Int. J. Environ. Res. Public Health 2017, 14, , 442; doi:10.3390/ijerph14040442
12 of 31
2 $101,149.74 for a small village, 252,424.42 for a medium village, 359,070.38 for a large village. 3 $484,608 for a small village, $715,737 for a medium village, $1,051,793 for a large village. 4 Or 0.001- .01$/L. 5 Citing:. Kalbermatten, et al., 1982 [58].
3.1.2. Software Costs
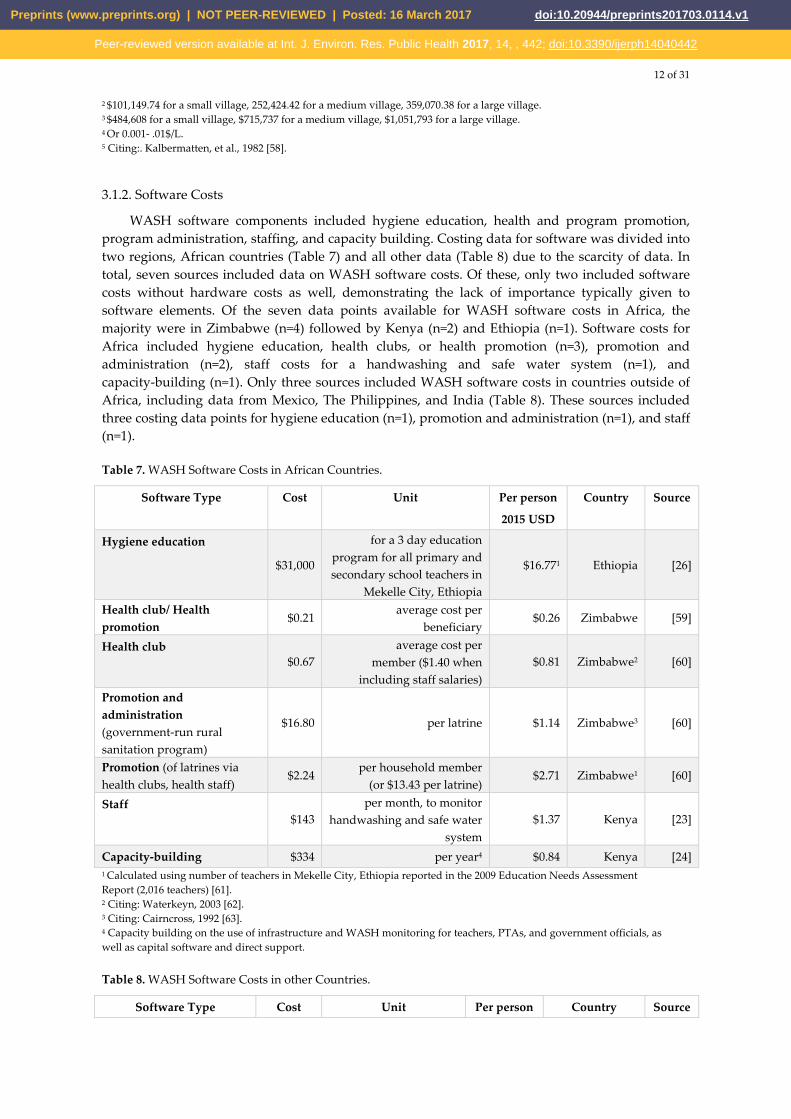
WASH software components included hygiene education, health and program promotion, program administration, staffing, and capacity building. Costing data for software was divided into two regions, African countries (Table 7) and all other data (Table 8) due to the scarcity of data. In total, seven sources included data on WASH software costs. Of these, only two included software costs without hardware costs as well, demonstrating the lack of importance typically given to software elements. Of the seven data points available for WASH software costs in Africa, the majority were in Zimbabwe (n=4) followed by Kenya (n=2) and Ethiopia (n=1). Software costs for Africa included hygiene education, health clubs, or health promotion (n=3), promotion and administration (n=2), staff costs for a handwashing and safe water system (n=1), and capacity-building (n=1). Only three sources included WASH software costs in countries outside of Africa, including data from Mexico, The Philippines, and India (Table 8). These sources included three costing data points for hygiene education (n=1), promotion and administration (n=1), and staff (n=1).
Table 7. WASH Software Costs in African Countries.
Software Type Cost Unit Per person
2015 USD
Country Source
Hygiene education
$31,000
for a 3 day education program for all primary and secondary school teachers in
Mekelle City, Ethiopia
$16.771 Ethiopia [26]
Health club/ Health promotion
$0.21 average cost per
beneficiary $0.26 Zimbabwe [59]
Health club $0.67
average cost per member ($1.40 when
including staff salaries) $0.81 Zimbabwe2 [60]
Promotion and administration (government-run rural sanitation program)
$16.80 per latrine $1.14 Zimbabwe3 [60]
Promotion (of latrines via health clubs, health staff)
$2.24 per household member
(or $13.43 per latrine) $2.71 Zimbabwe1 [60]
Staff $143
per month, to monitor handwashing and safe water
system $1.37 Kenya [23]
Capacity-building $334 per year4 $0.84 Kenya [24] 1 Calculated using number of teachers in Mekelle City, Ethiopia reported in the 2009 Education Needs Assessment Report (2,016 teachers) [61]. 2 Citing: Waterkeyn, 2003 [62]. 3 Citing: Cairncross, 1992 [63]. 4 Capacity building on the use of infrastructure and WASH monitoring for teachers, PTAs, and government officials, as well as capital software and direct support.
Table 8. WASH Software Costs in other Countries.
Software Type Cost Unit Per person Country Source
Preprints (www.preprints.org) | NOT PEER-REVIEWED | Posted: 16 March 2017 doi:10.20944/preprints201703.0114.v1
Peer-reviewed version available at Int. J. Environ. Res. Public Health 2017, 14, , 442; doi:10.3390/ijerph14040442
13 of 31
2015 USD
Hygiene education $2-$5 per household per year1 $1.63 Mexico [64]
Promotion and administration (government-run rural sanitation program) $20 per latrine
$1.36 The Philippines2 [60]
Staff $37.57 per month for 2 persons $0.16 India [25] 1 Includes costs of carrying out ongoing campaigns and maintaining contact with target clients. 2 Citing: Cairncross, 1992 [63].
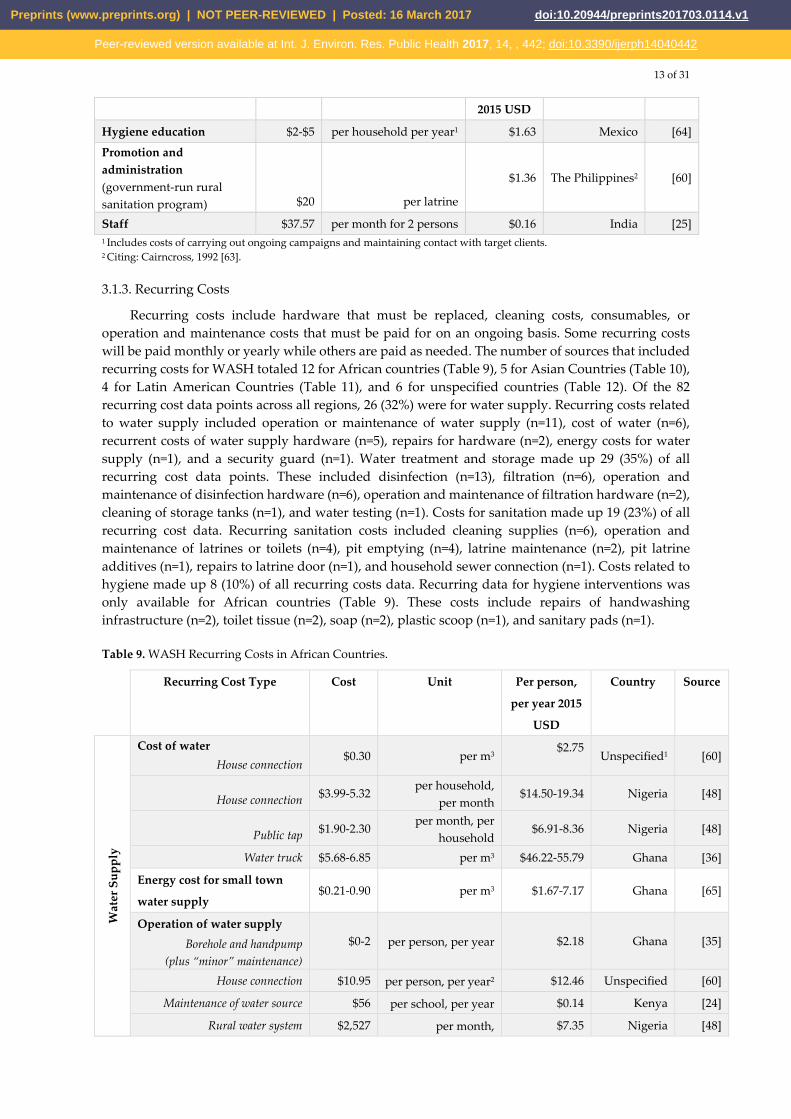
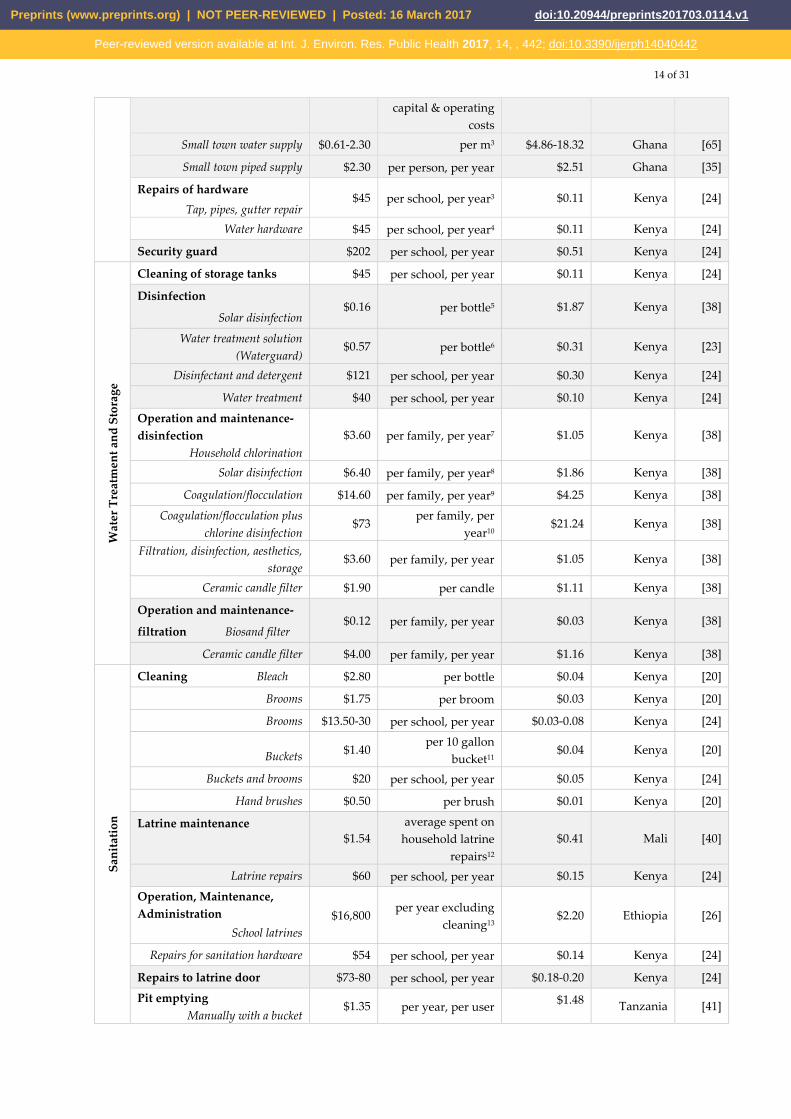
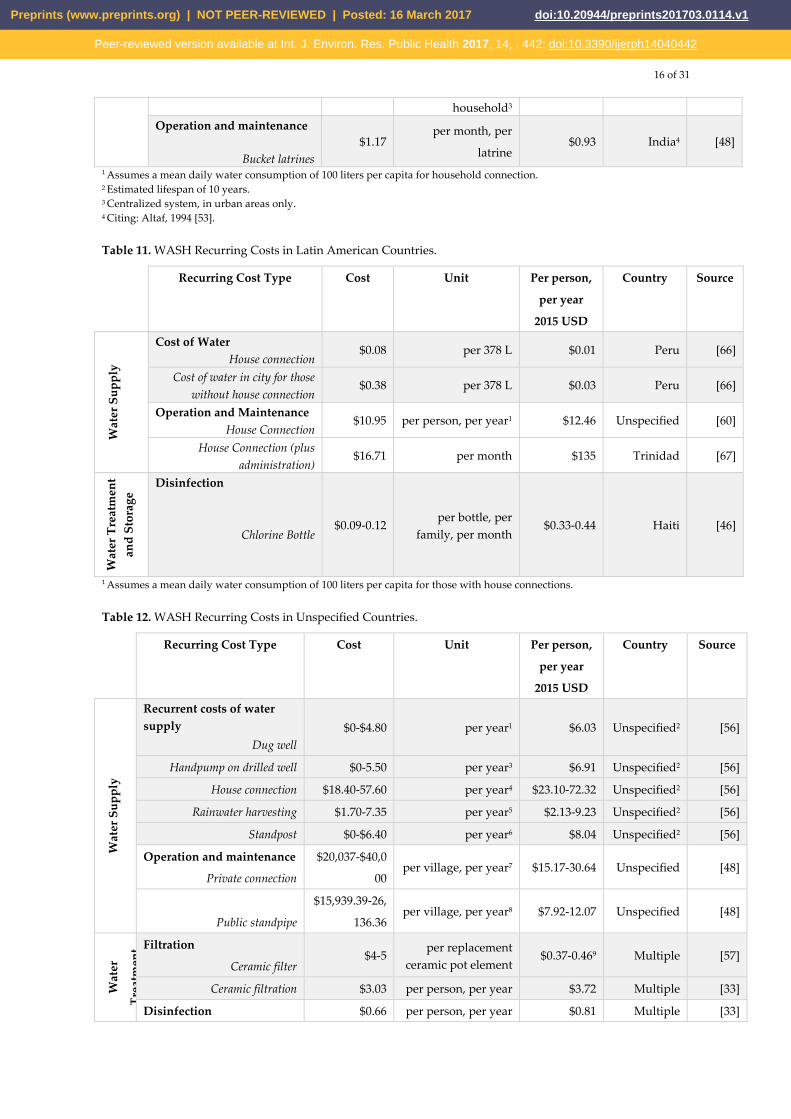
3.1.3. Recurring Costs
Recurring costs include hardware that must be replaced, cleaning costs, consumables, or operation and maintenance costs that must be paid for on an ongoing basis. Some recurring costs will be paid monthly or yearly while others are paid as needed. The number of sources that included recurring costs for WASH totaled 12 for African countries (Table 9), 5 for Asian Countries (Table 10), 4 for Latin American Countries (Table 11), and 6 for unspecified countries (Table 12). Of the 82 recurring cost data points across all regions, 26 (32%) were for water supply. Recurring costs related to water supply included operation or maintenance of water supply (n=11), cost of water (n=6), recurrent costs of water supply hardware (n=5), repairs for hardware (n=2), energy costs for water supply (n=1), and a security guard (n=1). Water treatment and storage made up 29 (35%) of all recurring cost data points. These included disinfection (n=13), filtration (n=6), operation and maintenance of disinfection hardware (n=6), operation and maintenance of filtration hardware (n=2), cleaning of storage tanks (n=1), and water testing (n=1). Costs for sanitation made up 19 (23%) of all recurring cost data. Recurring sanitation costs included cleaning supplies (n=6), operation and maintenance of latrines or toilets (n=4), pit emptying (n=4), latrine maintenance (n=2), pit latrine additives (n=1), repairs to latrine door (n=1), and household sewer connection (n=1). Costs related to hygiene made up 8 (10%) of all recurring costs data. Recurring data for hygiene interventions was only available for African countries (Table 9). These costs include repairs of handwashing infrastructure (n=2), toilet tissue (n=2), soap (n=2), plastic scoop (n=1), and sanitary pads (n=1).
Table 9. WASH Recurring Costs in African Countries.
Recurring Cost Type Cost Unit Per person,
per year 2015
USD
Country Source
Wat
er S
uppl
y
Cost of water House connection
$0.30 per m3 $2.75
Unspecified1 [60]
House connection $3.99-5.32 per household,
per month $14.50-19.34 Nigeria [48]
Public tap $1.90-2.30 per month, per
household $6.91-8.36 Nigeria [48]
Water truck $5.68-6.85 per m3 $46.22-55.79 Ghana [36]
Energy cost for small town
water supply $0.21-0.90 per m3 $1.67-7.17 Ghana [65]
Operation of water supply Borehole and handpump
(plus “minor” maintenance) $0-2 per person, per year $2.18 Ghana [35]
House connection $10.95 per person, per year2 $12.46 Unspecified [60]
Maintenance of water source $56 per school, per year $0.14 Kenya [24]
Rural water system $2,527 per month, $7.35 Nigeria [48]
Preprints (www.preprints.org) | NOT PEER-REVIEWED | Posted: 16 March 2017 doi:10.20944/preprints201703.0114.v1
Peer-reviewed version available at Int. J. Environ. Res. Public Health 2017, 14, , 442; doi:10.3390/ijerph14040442
14 of 31
capital & operating costs
Small town water supply $0.61-2.30 per m3 $4.86-18.32 Ghana [65]
Small town piped supply $2.30 per person, per year $2.51 Ghana [35]
Repairs of hardware Tap, pipes, gutter repair
$45 per school, per year3 $0.11 Kenya [24]
Water hardware $45 per school, per year4 $0.11 Kenya [24]
Security guard $202 per school, per year $0.51 Kenya [24]
Wat
er T
reat
men
t and
Sto
rage
Cleaning of storage tanks $45 per school, per year $0.11 Kenya [24]
Disinfection
Solar disinfection $0.16 per bottle5 $1.87 Kenya [38]
Water treatment solution (Waterguard)
$0.57 per bottle6 $0.31 Kenya [23]
Disinfectant and detergent $121 per school, per year $0.30 Kenya [24]
Water treatment $40 per school, per year $0.10 Kenya [24]
Operation and maintenance- disinfection
Household chlorination $3.60 per family, per year7 $1.05 Kenya [38]
Solar disinfection $6.40 per family, per year8 $1.86 Kenya [38]
Coagulation/flocculation $14.60 per family, per year9 $4.25 Kenya [38]
Coagulation/flocculation plus chlorine disinfection
$73 per family, per
year10 $21.24 Kenya [38]
Filtration, disinfection, aesthetics, storage
$3.60 per family, per year $1.05 Kenya [38]
Ceramic candle filter $1.90 per candle $1.11 Kenya [38]
Operation and maintenance-
filtration Biosand filter $0.12 per family, per year $0.03 Kenya [38]
Ceramic candle filter $4.00 per family, per year $1.16 Kenya [38]
Sani
tatio
n
Cleaning Bleach $2.80 per bottle $0.04 Kenya [20]
Brooms $1.75 per broom $0.03 Kenya [20]
Brooms $13.50-30 per school, per year $0.03-0.08 Kenya [24]
Buckets $1.40 per 10 gallon
bucket11 $0.04 Kenya [20]
Buckets and brooms $20 per school, per year $0.05 Kenya [24]
Hand brushes $0.50 per brush $0.01 Kenya [20]
Latrine maintenance $1.54
average spent on household latrine
repairs12 $0.41 Mali [40]
Latrine repairs $60 per school, per year $0.15 Kenya [24]
Operation, Maintenance, Administration
School latrines $16,800
per year excluding cleaning13
$2.20 Ethiopia [26]
Repairs for sanitation hardware $54 per school, per year $0.14 Kenya [24]
Repairs to latrine door $73-80 per school, per year $0.18-0.20 Kenya [24]
Pit emptying Manually with a bucket
$1.35 per year, per user $1.48 Tanzania [41]
Preprints (www.preprints.org) | NOT PEER-REVIEWED | Posted: 16 March 2017 doi:10.20944/preprints201703.0114.v1
Peer-reviewed version available at Int. J. Environ. Res. Public Health 2017, 14, , 442; doi:10.3390/ijerph14040442

15 of 31
Through diversion $0.68 per year, per user $0.75 Tanzania [41]
Emptying service $2.20 per month, per
property owner $10.43 Tanzania [41]
Pit emptying $38 per school, per year
(one pit) $0.10 Kenya [24]
Pit latrine additives $17 per treatment14 $0.47 Tanzania [41]
Hyg
iene
Repairs Handwashing taps $9 per school, per year $0.02 Kenya [24]
Handwashing hardware $31 per school, per year $0.08 Kenya [24]
Soap $7.30 per 3.5 kg bag Omo powdered soap
$0.11 Kenya [20]
$60 per school, per year $0.15 Kenya [24]
Sanitary pads $60 per school, per year $0.15 Kenya [24]
Plastic scoop (for soap) $0.12 per 1 cup
scoop $0.002 Kenya [20]
Toilet tissue $29.92
for 150 rolls of toilet tissue per
pupil, per term15
$0.30 Kenya [20]
$325 per school, per year $0.82 Kenya [24] 1 Citing WHO/UNICEF, 2000 [31]. 2 Assumes a mean daily water consumption of 100 liters per capita by those with household connections. 3 For rainwater catchment. 4 Includes either a borehole or rainwater catchment with gutters and four storage tanks for schools where a borehole could not be built. 5 Assumes 40 2 L bottles per family per year. 6 $8/month spent for 14 bottles of Waterguard, school invested $72 per year for waterguard. 7 $0.60/ per 500 ml bottle lasting 2 months per family. 8 40 2 L bottles @ $0.16 per bottle. 9 $0.01/10L or per sachet treats 10L, 4 treatments per day. 10 $0.05/10L or per sachet treats 10L, 4 treatments per day. 11 Source says $2.80 for 2. 12 Costs for repairs or maintenance paid by households/families since the construction of the latrine. 13 Janitorial salary= $15,916, latrine emptying fee=$884. 14 Additives include salt, ashes, old batteries, diesel of parrafine to reduce "sludge volume." Assumed treatments occur 2 times per year. 15 ½ roll of toilet tissue per pupil.
Table 10. WASH Recurring Costs in Asian Countries.
Recurring Cost Type Cost Unit Per person,
per year
2015 USD
Country Source
Wat
er
Supp
ly
Operation and maintenance
House connection $7.30 per person, per year1 $8.31 Unspecified [60]
Wat
er T
reat
men
t and
St
orag
e
Filtration Ceramic candles for candle filter
$0.90-1.30 per ceramic candle $0.52-0.76 India [38]
Ceramic pot filter $0.20 median cost per m3 $1.83 Unspecified [60]
Ceramic pot filter $7-12 per filter $2.04-3.49 Cambodia [38]
Kanchan™ arsenic filter (KAF) $20 per filter, 15L/hr $0.132 Nepal [25]
Water testing $60 per month with
a replicate $0.01 India [49]
S a Household sewer connection $0.92 per month, per $3.34 India [48]
Preprints (www.preprints.org) | NOT PEER-REVIEWED | Posted: 16 March 2017 doi:10.20944/preprints201703.0114.v1
Peer-reviewed version available at Int. J. Environ. Res. Public Health 2017, 14, , 442; doi:10.3390/ijerph14040442
16 of 31
household3
Operation and maintenance
Bucket latrines $1.17
per month, per
latrine $0.93 India4 [48]
1 Assumes a mean daily water consumption of 100 liters per capita for household connection. 2 Estimated lifespan of 10 years. 3 Centralized system, in urban areas only. 4 Citing: Altaf, 1994 [53].
Table 11. WASH Recurring Costs in Latin American Countries.
Recurring Cost Type Cost Unit Per person,
per year
2015 USD
Country Source
Wat
er S
uppl
y
Cost of Water House connection
$0.08 per 378 L $0.01 Peru [66]
Cost of water in city for those without house connection
$0.38 per 378 L $0.03 Peru [66]
Operation and Maintenance House Connection
$10.95 per person, per year1 $12.46 Unspecified [60]
House Connection (plus administration)
$16.71 per month $135 Trinidad [67]
Wat
er T
reat
men
t an
d St
orag
e
Disinfection
Chlorine Bottle $0.09-0.12
per bottle, per family, per month
$0.33-0.44 Haiti [46]
1 Assumes a mean daily water consumption of 100 liters per capita for those with house connections.
Table 12. WASH Recurring Costs in Unspecified Countries.
Recurring Cost Type Cost Unit Per person,
per year
2015 USD
Country Source
Wat
er S
uppl
y
Recurrent costs of water supply
Dug well $0-$4.80 per year1 $6.03 Unspecified2 [56]
Handpump on drilled well $0-5.50 per year3 $6.91 Unspecified2 [56]
House connection $18.40-57.60 per year4 $23.10-72.32 Unspecified2 [56]
Rainwater harvesting $1.70-7.35 per year5 $2.13-9.23 Unspecified2 [56]
Standpost $0-$6.40 per year6 $8.04 Unspecified2 [56]
Operation and maintenance
Private connection
$20,037-$40,0
00 per village, per year7 $15.17-30.64 Unspecified [48]
Public standpipe
$15,939.39-26,
136.36 per village, per year8 $7.92-12.07 Unspecified [48]
Wat
er
Trea
tmen
t Filtration
Ceramic filter $4-5
per replacement ceramic pot element
$0.37-0.469 Multiple [57]
Ceramic filtration $3.03 per person, per year $3.72 Multiple [33]
Disinfection $0.66 per person, per year $0.81 Multiple [33]
Preprints (www.preprints.org) | NOT PEER-REVIEWED | Posted: 16 March 2017 doi:10.20944/preprints201703.0114.v1
Peer-reviewed version available at Int. J. Environ. Res. Public Health 2017, 14, , 442; doi:10.3390/ijerph14040442

17 of 31
Chlorination
Chlorine bottle $1.00 per bottle10 $0.15 Multiple [57]
Chlorine tablets $0.001-0.01 per L $8.01-80.14 Multiple [57]
Coagulant-chlorine disinfection system (PuR sachet)
$0.003-0.010 per L $24.04-80.14 Multiple [57]
PuR sachet $0.25 per sachet $106.19 Unspecified [38]
Flocculation- disinfection $4.95 per person, per year $6.07 Unspecified [33]
PuR sachet $0.035 per sachet plus
shipping $34.74 Unspecified [46]
Solar disinfection $0.63 per person, per year $0.77 Unspecified [33]
Sani
tatio
n Operation and Maintenance
Private toilet $113
per toilet plus septic tank, per year
$6.84 Unspecified [48]
1 Calculated as 0-10% of cost of hardware, annual cost (hardware ranges from $21-48 per person. 2 Citing WHO/UNICEF, 2000 [31]. 3 Calculated as 0-10% of cost of hardware, annual cost (hardware ranges from $17-55 per person for handpump. 4 Calculated as 20-40% recurrent annual cost of hardware (hardware $92-144 per person. 5 Calculated as 5-15% recurrent annual cost of hardware (hardware ranges from $34-49 per person. 6 Calculated as 0-10% recurrent annual cost of hardware (hardware $31-64 per person. 7 $20,037 for a small village, 26,890 for a medium village, $40,000 for a large village. 8 $15,939.39 for a small village, $17,757,58 for a medium village, $26,136.36 for a large village. 9 Assumed 3 year lifespan. 10 Can treat >1000L of water and last months.
3.1.4. Costing Trends & Gaps
The costs of WASH components varied across regions. For example, the per capita capital cost of a borehole in 2015 USD was $16.96-37.65 in Africa, $69.06 in Latin America, and $21.34-27.90 in Asia (Tables 3-5). In addition, the per capita capital cost of a dug well ranged from $26.37-34.33 in Africa, $27.62-36.10 in Asia, and $60.27 in Latin America (Tables 3-4). Tables 3-12 also showed variations in the types of costing data available by region. For example, while boreholes were the most frequently mentioned water supply source in African countries, house connections, boreholes, and wells were mentioned about evenly in Latin American and Asian countries. Although a lack of available data makes it difficult to compare costs across regions, past studies have supported that costs of WASH elements vary by geographic area due to differing local costs of labor and materials [24,34,46]. Other local factors such as geography, culture, or funding availability may also influence the WASH components included.
Of all three categories, the most data were available for hardware costs. Within this category, data was more available for water supply (e.g., boreholes, house connections, wells) and water treatment and storage (e.g., filtration, disinfection). The least amount of data was available for hygiene hardware with only three data points available for capital hardware costs and eight data points available for recurring hardware costs for hygiene interventions (e.g., handwashing facilities, water vessel for menstrual hygiene, soap). Evidence suggests that hygiene is particularly important for reducing waterborne disease mortality and morbidity [60], yet these interventions may also be particularly sensitive to cultural norms and educational approaches [16]. Further, only one source included specific costing information around infrastructure designed for menstrual hygiene management [24], which is important for promoting gender equity by reducing school absences among young women [5,7,11]. These results suggest that more costing hardware data is needed around hygiene infrastructure and menstrual hygiene management.
In general, there were large gaps in the availability of software costing data, especially in regions outside of Africa. This finding is consistent with past studies that found implementing software aspects of WASH, such as hygiene promotion, community education, and training
Preprints (www.preprints.org) | NOT PEER-REVIEWED | Posted: 16 March 2017 doi:10.20944/preprints201703.0114.v1
Peer-reviewed version available at Int. J. Environ. Res. Public Health 2017, 14, , 442; doi:10.3390/ijerph14040442
18 of 31
programs, were more challenging than implementing hardware aspects, such as installing infrastructure [30]. Unlike hardware costs, most software costing information recovered in this review, focused on hygiene programming. In addition, software costs appear to be specific to individual program designs and therefore may be less generalizable than hardware costs. Despite this, data around the cost of WASH software components is critical for future planning and budgeting for school WASH, as hardware alone is not enough to deliver health benefits of water and sanitation interventions [27].
Including costs for maintaining, repairing, and replacing infrastructure in WASH budgeting is important to ensure that interventions are sustainable in the long-term [46]. Types of recurring hardware costs identified in this review were highly variable, ranging from small cleaning supplies to larger scale repairs, and were dependent on the individual program or intervention strategy. These recurring costs may be difficult to predict during budgeting, which may explain the lack of data on these costs in the literature. Like hardware costs, most recurring cost data was for water supply maintenance and water treatment rather than for hygiene and sanitation. Since ongoing costs of repairs and maintenance may be difficult to account for during planning, it is important for future research to investigate long-term recurring costs of WASH interventions to assist in planning and ensure program sustainability.
3.2. Financing
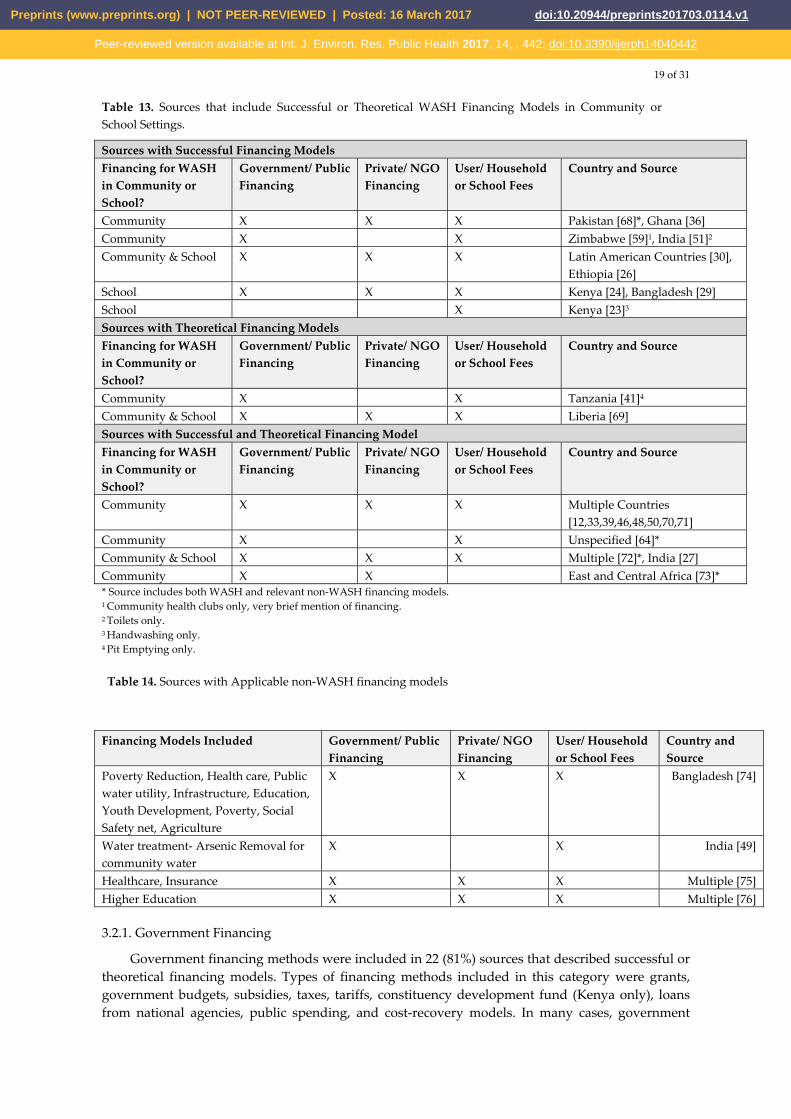
Financial planning is particularly important to ensure WASH facilities are maintained and programs are sustainable [11]. However, many school WASH programs suffer from a lack of financial planning and management [11]. To address this issue, this review gathered information around financing mechanisms and successful financing models that may be applied to WASH in schools. Out of the 48 sources included in this review, a total of 27 included financing models applicable WASH in schools. Table 13 includes sources that outlined successful or theoretical financing models for WASH in the community or school setting and Table 14 includes sources that outlined potentially applicable non-WASH successful financing models. Successful models are defined as those that have been implemented in the field while theoretical models include aggregated data sets from multiple programs or sources that mention potential financing mechanisms but do not outline specific examples of how these mechanisms have been used previously.
In Tables 13 and 14, financing mechanisms are divided into three groups: government financing, private or NGO financing, and user fees. Tables 13 and 14 are organized by whether the source referenced community or school WASH and which combination of the three financing categories was used in the source’s financing model(s). The region with the most sources available for successful or theoretical WASH financing models was Africa (n=7), followed by Asia (n=4), and Latin America (n=1). Ten sources included successful or theoretical WASH financing models for countries in multiple regions or an undefined geographic area. Five sources described financing for WASH in the community setting, three sources described financing for WASH in both communities and schools, and only one source described financing for WASH in schools (Table 13).
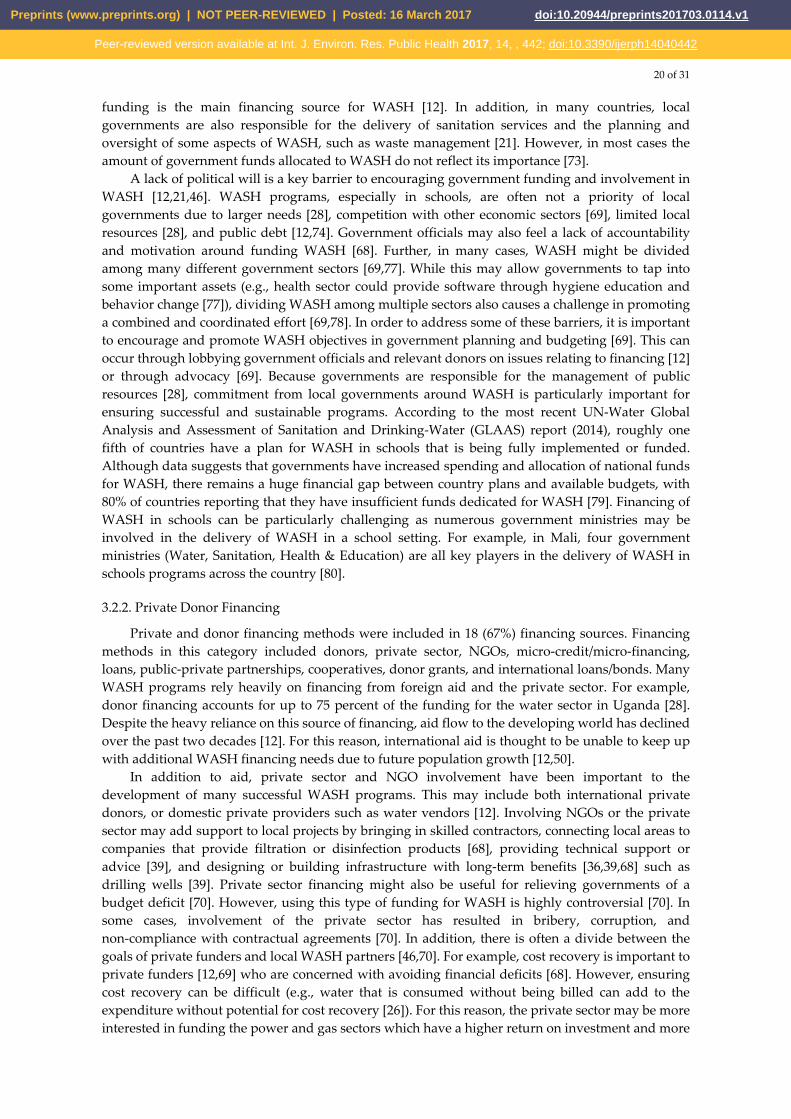
Table 14 includes sources that discussed relevant non-WASH successful financing models that may be applicable to WASH in schools. A total of four sources are included in this table; two reference programs in Asian countries and two include information on countries across multiple regions. Types of financing models included were public water supply and water treatment, health care, infrastructure, education, youth development, poverty, social safety net, agriculture, and insurance. Sources that included only challenges or recommendations around financing models and mechanisms were not included in Tables 13-14. However, key findings from these sources are included in the discussion below.
Preprints (www.preprints.org) | NOT PEER-REVIEWED | Posted: 16 March 2017 doi:10.20944/preprints201703.0114.v1
Peer-reviewed version available at Int. J. Environ. Res. Public Health 2017, 14, , 442; doi:10.3390/ijerph14040442
19 of 31
Table 13. Sources that include Successful or Theoretical WASH Financing Models in Community or School Settings.
Sources with Successful Financing Models Financing for WASH in Community or School?
Government/ Public Financing
Private/ NGOFinancing
User/ Household or School Fees
Country and Source
Community X X X Pakistan [68]*, Ghana [36] Community X X Zimbabwe [59]1, India [51]2
Community & School X X X Latin American Countries [30], Ethiopia [26]
School X X X Kenya [24], Bangladesh [29] School X Kenya [23]3
Sources with Theoretical Financing Models Financing for WASH in Community or School?
Government/ Public Financing
Private/ NGOFinancing
User/ Household or School Fees
Country and Source
Community X X Tanzania [41]4
Community & School X X X Liberia [69] Sources with Successful and Theoretical Financing Model Financing for WASH in Community or School?
Government/ Public Financing
Private/ NGOFinancing
User/ Household or School Fees
Country and Source
Community X X X Multiple Countries [12,33,39,46,48,50,70,71]
Community X X Unspecified [64]* Community & School X X X Multiple [72]*, India [27] Community X X East and Central Africa [73]* * Source includes both WASH and relevant non-WASH financing models. 1 Community health clubs only, very brief mention of financing. 2 Toilets only. 3 Handwashing only. 4 Pit Emptying only.
Table 14. Sources with Applicable non-WASH financing models
Financing Models Included Government/ Public Financing
Private/ NGO Financing
User/ Household or School Fees
Country and Source
Poverty Reduction, Health care, Public water utility, Infrastructure, Education, Youth Development, Poverty, Social Safety net, Agriculture
X X X Bangladesh [74]
Water treatment- Arsenic Removal for community water
X X India [49]
Healthcare, Insurance X X X Multiple [75] Higher Education X X X Multiple [76]
3.2.1. Government Financing
Government financing methods were included in 22 (81%) sources that described successful or theoretical financing models. Types of financing methods included in this category were grants, government budgets, subsidies, taxes, tariffs, constituency development fund (Kenya only), loans from national agencies, public spending, and cost-recovery models. In many cases, government
Preprints (www.preprints.org) | NOT PEER-REVIEWED | Posted: 16 March 2017 doi:10.20944/preprints201703.0114.v1
Peer-reviewed version available at Int. J. Environ. Res. Public Health 2017, 14, , 442; doi:10.3390/ijerph14040442
20 of 31
funding is the main financing source for WASH [12]. In addition, in many countries, local governments are also responsible for the delivery of sanitation services and the planning and oversight of some aspects of WASH, such as waste management [21]. However, in most cases the amount of government funds allocated to WASH do not reflect its importance [73].
A lack of political will is a key barrier to encouraging government funding and involvement in WASH [12,21,46]. WASH programs, especially in schools, are often not a priority of local governments due to larger needs [28], competition with other economic sectors [69], limited local resources [28], and public debt [12,74]. Government officials may also feel a lack of accountability and motivation around funding WASH [68]. Further, in many cases, WASH might be divided among many different government sectors [69,77]. While this may allow governments to tap into some important assets (e.g., health sector could provide software through hygiene education and behavior change [77]), dividing WASH among multiple sectors also causes a challenge in promoting a combined and coordinated effort [69,78]. In order to address some of these barriers, it is important to encourage and promote WASH objectives in government planning and budgeting [69]. This can occur through lobbying government officials and relevant donors on issues relating to financing [12] or through advocacy [69]. Because governments are responsible for the management of public resources [28], commitment from local governments around WASH is particularly important for ensuring successful and sustainable programs. According to the most recent UN-Water Global Analysis and Assessment of Sanitation and Drinking-Water (GLAAS) report (2014), roughly one fifth of countries have a plan for WASH in schools that is being fully implemented or funded. Although data suggests that governments have increased spending and allocation of national funds for WASH, there remains a huge financial gap between country plans and available budgets, with 80% of countries reporting that they have insufficient funds dedicated for WASH [79]. Financing of WASH in schools can be particularly challenging as numerous government ministries may be involved in the delivery of WASH in a school setting. For example, in Mali, four government ministries (Water, Sanitation, Health & Education) are all key players in the delivery of WASH in schools programs across the country [80].
3.2.2. Private Donor Financing
Private and donor financing methods were included in 18 (67%) financing sources. Financing methods in this category included donors, private sector, NGOs, micro-credit/micro-financing, loans, public-private partnerships, cooperatives, donor grants, and international loans/bonds. Many WASH programs rely heavily on financing from foreign aid and the private sector. For example, donor financing accounts for up to 75 percent of the funding for the water sector in Uganda [28]. Despite the heavy reliance on this source of financing, aid flow to the developing world has declined over the past two decades [12]. For this reason, international aid is thought to be unable to keep up with additional WASH financing needs due to future population growth [12,50].
In addition to aid, private sector and NGO involvement have been important to the development of many successful WASH programs. This may include both international private donors, or domestic private providers such as water vendors [12]. Involving NGOs or the private sector may add support to local projects by bringing in skilled contractors, connecting local areas to companies that provide filtration or disinfection products [68], providing technical support or advice [39], and designing or building infrastructure with long-term benefits [36,39,68] such as drilling wells [39]. Private sector financing might also be useful for relieving governments of a budget deficit [70]. However, using this type of funding for WASH is highly controversial [70]. In some cases, involvement of the private sector has resulted in bribery, corruption, and non-compliance with contractual agreements [70]. In addition, there is often a divide between the goals of private funders and local WASH partners [46,70]. For example, cost recovery is important to private funders [12,69] who are concerned with avoiding financial deficits [68]. However, ensuring cost recovery can be difficult (e.g., water that is consumed without being billed can add to the expenditure without potential for cost recovery [26]). For this reason, the private sector may be more interested in funding the power and gas sectors which have a higher return on investment and more
Preprints (www.preprints.org) | NOT PEER-REVIEWED | Posted: 16 March 2017 doi:10.20944/preprints201703.0114.v1
Peer-reviewed version available at Int. J. Environ. Res. Public Health 2017, 14, , 442; doi:10.3390/ijerph14040442
21 of 31
frequent payback periods [12]. Private financers may also be more willing to finance communities with a greater potential for profitability, rather than ensuring access for poor [70] or underserved areas [12], causing most private financing to be concentrated in major cities [21,39]. In addition, private financers may also find other ways to cut costs, such as hiring fewer contractors, which may be detrimental to program efficacy on the local level [46]. As a result many argue that private sector financing may be unable to fulfill the investment needs for WASH on its own [12,21,70].
In order to secure private or donor financing for WASH, it is important to present “implementable programs” with “a focus on cost recovery” [69]. In addition, it is important to ensure that there is transparency and accountability in the way funds are managed and used as well as quality implementation of WASH programs [69]. When international donors or financiers are involved it is also important to ensure that they work at the local level with the government or community leaders to implement locally relevant and sustainable programs [46,68]. Because private and donor financing is often unreliable, it is recommended that projects using on this financing should build plans to be self-financed after the donor or investor leaves to ensure sustainability [46].
3.2.3. User Fees
Finally, 22 (81%) sources included user and household fees as a part of their financing models. This category included user fees, costs for beneficiaries, community financing, credit, school budget, parent-teacher association, fees for parents, service charge, and volumetric based water charges. Keeping financing at the user-level, may help ensure project ownership, making this financing method more likely to be sustainable in the long term [46]. However, this financing mechanism also has some challenges. In most cases, user fees or tariffs are too low to meet the financial requirements of WASH [48,71]. This may be due to a low willingness to pay for these services because beneficiaries might not understand the full benefit of their investment [77] or some households choose to use cheaper or free water sources [36]. Similarly, schools may forgoe recurring costs, such as costs of water treatment, when they lack finances [57]. There may also be issues with collecting fees [36] and in the school setting; it is often difficult to encourage financial support from parents [30]. Finally, securing user fees might be particularly difficult in rural settings where there is a lack of available credit to fill temporary gaps in finances [77]. In order to effectively gather and use user fees, it is recommended to take steps to make sure that fees are not too costly for the poor [21,39] or to provide a menu of different payment options to take into account varying consumer needs [48]. In addition, it is important to take into account users’ willingness to pay for different service types when designing WASH programs [29,40,41,67].
3.2.4. Financing Trends
Due to the limitations of each of the three financing mechanisms described above and the debate around the relative importance of each [76], almost all financing models included in this review used a variety of different financing mechanisms (Tables 13-14). Only one school WASH program used a exclusively school fees to fund its initiative, however, this was a private school and this model is likely not generalizable [23]. Examples of successful financing models that used multiple financing mechanisms are described below:
Community WASH in Ghana: Government and NGO financing pays for installation costs while the maintenance is to be covered by the community. NGOs often support the communities by paying up to 95% of the borehole cost, while the community raises 5% of the borehole cost (Government of Ghana, 2007). [36] School WASH in Kenya: Financing comes from a combination of NGOs who paid for the majority of capital hardware and WASH infrastructure, government offices in the form of the Constituency Development Fund [CDF] (which were in the form of grants so amount differed by school), government resources devolved from the federal to local level, parent teacher associations and school budgets [24].
Preprints (www.preprints.org) | NOT PEER-REVIEWED | Posted: 16 March 2017 doi:10.20944/preprints201703.0114.v1
Peer-reviewed version available at Int. J. Environ. Res. Public Health 2017, 14, , 442; doi:10.3390/ijerph14040442
22 of 31
Many sources directly addressed the importance of using diverse financing mechanisms for
WASH [12,27,76,77]. Using multiple financing methods can help to ensure financial sustainability for programs by including back-up mechanisms [68] or financial reserves [76] if one financing stream becomes reduced or unavailable. However, different goals, philosophies, and levels of commitment may limit the ability of the government, private sector and donors, and users to work together [30]. In addition, different funding agencies may have different budgets, rules, and reporting requirements [39]. For this reason, it is important to facilitate communication and coordination between these different groups [81,82] through donor conferences and meetings [26,30], as well as maintain financial transparency [29]. It is also important to consider the local needs and the availability of local resources when selecting different financing mechanisms [77] and to build financing models in a way where projects can become financially self-contained [46].
3.3. Considerations for WASH Budgeting and Financing
Due to the large variety of financing mechanisms and models used for community and school WASH, it is difficult to make clear recommendations around financing. In addition, large discrepancies in available costing data and types of costing data by region; make it clear that decisions around budgeting and implementation will largely vary by geographic area, local context, and project needs. Despite this, this review identified several key considerations for WASH budgeting and financing that are important to address to design successful and effective WASH programs.
3.3.1. Addressing Inequities
A lack of equitable coverage for WASH has been noted as a challenge in improving WASH access in many countries [69,71,74]. Both social and financial inequities may decrease access and use of WASH programs and infrastructure and influence hygiene practices [27]. Specifically, poor populations [21,74] and those with disabilities are often ignored in program design [12,27,29]. For example, a study of school WASH in Bangladesh found that there were 135 disabled students in 65 out of the 117 schools included in the study and most these students used the same toilets as other children and in 6 of the 65 schools disabled children did not use the latrine facilities at all [29]. In addition, minorities, and disparaged groups, such as women or those who are HIV positive, are also important to consider when designing WASH and designating funding [27], as sanitation is seen to have a central role in removing gender biases and addressing social equity [21]. Access to WASH is also limited in rural areas [27,74]. It is estimated that 80 percent of people without access to sanitation live in rural areas and one-third of rural residents lack access to improved drinking water sources [83]. This is particularly an issue in areas where rural populations are growing, creating an expected increase in future demand [73].
Despite the need to improve WASH access to disparaged or underserved groups, our search found no costing data for targeting underserved populations or building infrastructure that can be accessed by those with disabilities. However, sources did provide some suggestions for allowing for more equitable access. These suggestions include prioritizing underserved populations [12] and reallocating investments to reach these groups [12,27,81]. To ensure access for poor populations, WASH programs may be integrated into poverty reduction strategies or other national planning initiatives [12,21,28]. For example, the poverty eradication plan or (PEAP) in Uganda gives priority to water supply and sanitation as an intervention area for poverty eradication [28]. Encouraging poor communities to participate in WASH planning and decision making [12] and providing subsidies for the poor to access services [41] may also increase equity in WASH programs. Further, it is important for future WASH programs to consider using alternative technologies for students with disabilities that would allow them to also access WASH infrastructure [29].
Preprints (www.preprints.org) | NOT PEER-REVIEWED | Posted: 16 March 2017 doi:10.20944/preprints201703.0114.v1
Peer-reviewed version available at Int. J. Environ. Res. Public Health 2017, 14, , 442; doi:10.3390/ijerph14040442

23 of 31
3.3.2. Community Involvement and Education
Several sources identified the need for more community involvement in WASH planning and implementation to ensure more effective [28,50] and sustainable programs [30]. In fact, almost every source included in the review named sustainability of WASH to be a pressing challenge that is important for ensuring that WASH infrastructure does not “fall into disrepair” [30]. Involving the community was suggested to be one of the most important methods to improve sustainability by making users more responsible for the operation and maintenance of programs once donors or private financers are no longer involved [28]. By encouraging community involvement, it may be easier to take advantage of local resources, build local capacity for WASH, ensure user satisfaction [38], and involve underrepresented groups such as women [49]. For this reason, decentralized decision making for WASH is supported by many NGOs who support ownership and management of projects to the lowest possible level [46]. Strategies to facilitate community involvement may include community mobilization through health clubs, community groups, meetings [26,27] or school WASH committees [29]. Only one source in our review included costing data around community health clubs in Zimbabwe which ranged to approximately $0.21-0.67 per beneficiary or up to $1.40 when including the cost of staff [60].
Raising awareness is also an effective method for creating demand for better sanitation [73] and is known to promote sustainability [82]. Effective strategies to educate community members about WASH can both encourage community involvement and facilitate behavior change [26,27]. In fact, some argue that educational programs that encourage behavior change are necessary to ensuring success of WASH programs and are the most effective method to improve hygiene, especially among women [46]. Two sources are referenced in costing data for hygiene education programs. One, in Mexico, was estimated to cost approximately $2-5 per household per year which included the cost of carrying out ongoing campaigns and maintaining contact with target clients [64]. The other source, in Mekelle City, Ethiopia, cost approximately $31,000 for a three-day educational event for all current primary and secondary school teachers in the city [26]. These very different cost estimates and education methods further highlight the importance of local context in program planning.
In order to both educate and involve the local community in WASH, it is recommended to use a mix of different media types [27,28] and to use lessons from commercial advertising to reach a wide range of audiences [27]. Tools such as social marketing and communication for behavior change are key aspects of successful WASH programs [46]. Advocacy is another recommended strategy that may encourage community involvement [69]. In school settings, encouraging education, leadership, and advocacy among school children is suggested to encourage youth involvement [27]. In addition, integrating WASH into the school curriculum may also help to encourage and educate students on the purpose and proper use of new infrastructure or programs [28]. It is also suggested to inform school management committees about new WASH programs [24,29], and to involve both parents and students to facilitate effective community involvement around school WASH [29].
3.3.3. Monitoring and Evaluation
The integration of monitoring and evaluation into WASH programs is recommended to improve efficiency and quality of WASH services [12,16,28,50]. A lack of monitoring and evaluation may lead to poor construction or dysfunctional infrastructure (e.g., due to full pit or septic tanks, chocked pan/pipes, wrong location, etc.) [27]. Monitoring and evaluation may also help to reduce environmental impact [12], foster more efficient spending and budgeting [21], and ensure financial viability and sustainability [68]. Because of this, several sources identified a need for improved monitoring and evaluation [12,21,27,38] as well as for improved evaluation metrics [29]. However, our search found no data on the costs of monitoring and evaluating WASH programs. Despite this, two sources included examples of monitoring strategies such as household surveys [21], or in the case of school WASH, unannounced school visits [30]. Other methods such as using a state mandated social audit and encouraging community level monitoring have also been suggested [27].
Preprints (www.preprints.org) | NOT PEER-REVIEWED | Posted: 16 March 2017 doi:10.20944/preprints201703.0114.v1
Peer-reviewed version available at Int. J. Environ. Res. Public Health 2017, 14, , 442; doi:10.3390/ijerph14040442
24 of 31
Barriers to monitoring and evaluating WASH programs may include a lack of capacity and knowledge around these strategies [27]. To address this issue, it is suggested to develop useful and relevant indicators of success and integrate evaluation into the training of WASH staff or managers [30]. Further, it is recommended for programs to keep track of both process and outcome measures and to include incentives for positive outcomes [46]. Finally, developing common metrics used to evaluate WASH programs that address behavior change, long-term adoption, and sustained use may improve monitoring and evaluation across different projects and settings [38].
3.3.4. Management
Related to monitoring, sources also identified a need for better management when designing WASH programs [24,26,29,38,74]. This can include the operational management of programs and infrastructure [24,26,29,38] as well as financial management [26]. Responsibility for managing WASH programs and infrastructure may fall on the national or local government or the local community [28]. Improving management of WASH programs and infrastructure can enhance efficiency [26,74], control waste, and ensure more timely repairs [26]. In addition, including management in the budgeting and financing scheme, can save future costs. For example, in Trinidad, water shortages that occurred due to leakages were attributed to a lack of routine maintenance by engineers and politicians [67]. Eleven sources in our review included costing data on operation and maintenance of WASH infrastructure including repairs, pit emptying, and the cost of a security guard, reflecting the importance of proper management of programs and infrastructure. Despite this, there remains a need for increased budget allocations and attention towards program operation and management [67,74].
Effective financial management can improve accountability, transparency, and cost-recovery [39]. For example, more open financial reporting will ensure that payments go towards maintaining for improving WASH [73] and better management user fees can result in more efficient revenue collection and billing for services [26,36]. Financial management assistance at the sector level can also help to avoid fragmented projects without lasting service improvements [69]. Finally, improved financial management may also help WASH programs to pay creditors and avoid losing credibility with the banking community which may create difficulties in receiving future financing [67]. However, despite these benefits, no sources in this review provided costing information for financial management of WASH.
In order to ensure there is sufficient financial support for WASH management it is important to include the costs of operation and management of programs and infrastructure in budget allocations [24,74]. In addition, it is important to build capacity for effective program [69] and financial management in program design [68,73]. To improve community involvement in WASH management, programs may choose to create a system to pay community members for maintenance services [36] or provide financial incentives to grassroots workers [27]. For financial management, it is important to improve institutional framework in budgetary management [74] and to consider involving the local government to assist in financial audits and provide management and technical advice [73].
3.3.5. Lack of Guidance and Technical Assistance
Inadequate data and information [28], a lack of technical support [81], and a lack of trained staff [68] may be important barriers when implementing WASH programs and infrastructure. For example, there is a lack of information around the cost-effectiveness of different intervention strategies which is important for budgeting and decision making [38]. Further, it is often difficult to gather information on school budgeting for WASH, as one source noted relying on head-teacher or principal accounts and could not get specific data to guide the programs [24]. Overall, this review found a lack of costing data available for school WASH, highlighting a need for better guidance, information sharing, and technical assistance.
Preprints (www.preprints.org) | NOT PEER-REVIEWED | Posted: 16 March 2017 doi:10.20944/preprints201703.0114.v1
Peer-reviewed version available at Int. J. Environ. Res. Public Health 2017, 14, , 442; doi:10.3390/ijerph14040442

25 of 31
To improve the available data and technical assistance to guide future WASH programs, it is recommended for current programs to share and document best practices [38,68] including WASH programs that have been evaluated [68]. This can be accomplished through better information sharing that is available both online and in hard copy for areas without internet access [16] including tools for implementation, formative research, information on selecting infrastructure, etc. [38]. In addition, local training programs may be offered to improve financial management and program leadership [30] and to help key players such as technicians, health professionals, and social development specialists to work together [21]. For example, the government of India includes mandatory training of central and state officials engaged in the sanitation sector and ensures funding is available for those trainings [27]. Other successful WASH models have also integrated technical assistance for implementers [46]. Similarly, one source suggested improving human resources and encouraged hiring individuals with backgrounds in community development or engineering [68].
4. Conclusion
The goal of this research was to conduct a systematic review of the literature to understand what costing data is available and what financing mechanisms have been used or could be used to help support WASH programs in schools. Our search found a lack of WASH costing data overall and identified large gaps in the available costing data for hygiene infrastructure (handwashing with soap, menstrual hygiene management) and software programming (hygiene education, monitoring and evaluation, training, curriculum development, project management). Further, the majority of available costing data for WASH was centered around the African region, demonstrating a need for more information in other geographic areas.
The costing data recovered in this review may be helpful for high-level planning and costing of WASH in schools. These data may assist government officials and others involved in education sector planning to conceptualize the various components of WASH programs that are needed for their local programs and subsequently estimate costs and allocate sufficient funds to meet these needs. The authors acknowledge that the data recovered in the review is limited and there remains significant regional gaps in costing data for certain hardware and recurring costs as well significant gaps in costing of software activities such as: hygiene education, program coordination/management, and menstrual hygiene management. This is consistent with previous research that reports a lack of useful costing information available to make decisions around WASH [16]. Because costs will likely vary by country and within country, more local data is ideal for any planning activities. Nevertheless, the information presented herein may be a good starting point for planning and advocacy purposes. This research highlights the need for costing information to be collected, documented, and published in accessible forums so that those in the WASH and education sectors may use the information in planning of school WASH programs.
In addition, our review recovered a variety of successful and theoretical financing models that have been used to fund community and school WASH programs or other relevant non-WASH programs. The three main financing mechanisms identified were: government and public financing, private and donor financing, and user fees. Due to the benefits and drawbacks of these three methods, almost all sources used a variety of different mechanisms for their financing models. Further, because financing decisions depend largely on program goals, local context, and available resources, it is difficult to identify specific recommendations for WASH financing globally.
Finally, we identified key considerations when designing budgets and selecting financing mechanisms for WASH in schools. These considerations included: addressing inequalities, involving and educating the local community, including effective monitoring and evaluation, integrating strategies for proper program and financial management, and improving information, guidance, and technical assistance for new programs and managers.
Although the current WASH literature provides some costing data around WASH hardware and software components, more information is needed to guide future WASH programs in the school setting. Future evaluations of WASH intervention strategies in schools should also include
Preprints (www.preprints.org) | NOT PEER-REVIEWED | Posted: 16 March 2017 doi:10.20944/preprints201703.0114.v1
Peer-reviewed version available at Int. J. Environ. Res. Public Health 2017, 14, , 442; doi:10.3390/ijerph14040442

26 of 31
detailed documentation of program costs, as well as an examination of the financing schemes used to ensure program sustainability. Lessons learned from WASH implementations need to be documented in order to improve data sharing and decision-making around WASH programs globally.
Supplementary Materials:
Acknowledgments: The authors would like to acknowledge the contribution of the following students who contributed to the early stages of the systematic review: Shuang Song, Shahana Joshi, and Shubhneet Grover. In addition, the authors would like to acknowledge and thank the following UNICEF staff members for providing comments and review of the final version of the manuscript: Guy Hutton, Irene Amongin, and Brooke Yamakoshi.
Author Contributions: Heather M. Murphy and Stanley Laskowski conceived and designed the systematic review and established the research questions. Heather M. Murphy and Richa Desai designed the systematic review protocol. Heather M. Murphy, Stanley Laskowski, Richa Desai, Akudo Ejelonu and Thomas McKeon were involved in executing the various stages of the systematic review process. Heather M. Murphy, Thomas McKeon and Shannon McGinnis performed the data analysis/ synthesis for the review. Shannon McGinnis wrote the majority of the manuscript and prepared all the tables. Heather M Murphy and Richa Desai wrote the materials and methods section. Thomas McKeon created the maps presented in the manuscript. Akudo Ejelonu, Heather M. Murphy and Thomas McKeon reviewed the tables in the manuscript. All authors reviewed the final versions of the manuscript and provided detailed comments and revisions.
Conflicts of Interest: “The authors declare no conflict of interest."
References
1. Prüss-Üstün, A.; Bos, R.; Gore, F.; Bartram, J.; others Safer water, better health: costs, benefits
and sustainability of interventions to protect and promote health.; World Health Organization, 2008.
2. Montgomery, M.A.; Elimelech, M. Water and sanitation in developing countries: including health
in the equation. Environ. Sci. Technol. 2007, 41, 17–24.
3. WHO/UNICEF. Meeting the MDG drinking water and sanitation target: a mid-term assessment of
progress; Joint Monitoring Programme for Water Supply and Sanitation: Geneva, Switzerland, 2004.
4. Sachs, J.D. Investing in Development: A Practical Plan to Achieve the Millennium Development
Goals; UN Millennium Project: New York, 2005.
5. WHO/UNICEF. Progress on Sanitation and Drinking Water – 2015 update and MDG assessment;
World Health Organization: Geneva, Switzerland, 2015.
6. UNICEF. A Manual on School Sanitation and Hygiene; Water, Environment and Sanitation
Section Programme Division, UNICEF: New York, NY, 1998.
7. Pearson, J.; Mcphedran, K. A literature review of the non-health impacts of sanitation. Waterlines
2008, 27, 48–61.
8. Lamdin, D.J. Evidence of Student Attendance as an Independent Variable in Education Production
Functions. J. Educ. Res. 1996, 89, 155–162.
9. Houghton, F.; Gleeson, M.; Kelleher, K. The use of primary/national school absenteeism as a proxy
retrospective child health status measure in an environmental pollution investigation. Public Health
2003, 117, 417–423.
10. Freeman, M.C.; Greene, L.E.; Dreibelbis, R.; Saboori, S.; Muga, R.; Brumback, B.; Rheingans, R.
Assessing the impact of a school-based water treatment, hygiene and sanitation programme on pupil
absence in Nyanza Province, Kenya: a cluster-randomized trial. Trop. Med. Int. Health 2012, 17,
380–391.
Preprints (www.preprints.org) | NOT PEER-REVIEWED | Posted: 16 March 2017 doi:10.20944/preprints201703.0114.v1
Peer-reviewed version available at Int. J. Environ. Res. Public Health 2017, 14, , 442; doi:10.3390/ijerph14040442

27 of 31
11. Mooijman, A. Water, Sanitation and Hygiene (WASH) in Schools; A companion to the child
friendly schools manual; UNICEF: New York, NY, 2012.
12. Annamraju, S.; Calaguas, B.; Gutierrez, E. Financing water and sanitation: Key issues in
increasing resources to the sector 2001.
13. Hutton, G. Global costs and benefits of drinking-water supply and sanitation interventions to
reach the MDG target and universal coverage; World Health Organization: Geneva, Switzerland,
2012.
14. Olukanni, D.O. Assessment of wash program in public secondary schools in south-western
Nigeria. ARPN J. Eng. Appl. Sci. 2013, 8, 222.
15. WHO. Investing in water and sanitation: increasing access, reducing inequalities; World Health
Organization: Geneva, Switzerland, 2014.
16. Palaniappan, M.; Lang, M.; Gleick, P. A Review of Decision-Making Support Tools in the Water,
Sanitation, and Hygiene Sector; Pacific Institute, Environmental Change and Security Program,
2008.
17. Higgins, J.P.T.; Green, S. Cochrane Handbook for Systematic Reviews of Interventions; John
Wiley & Sons, 2011.
18. Brooks, J.; Waylen, K. A.; Mulder, M. B. Assessing community-based conservation projects: A
systematic review and multilevel analysis of attitudinal, behavioral, ecological, and economic
outcomes. Environ. Evid. 2013, 2, 2.
19. Freeman, M.K.; Lauderdale, S. A.; Kendrach, M. G.; Woolley, T. W. Google Scholar versus
PubMed in locating primary literature to answer drug-related questions. Ann. Pharmacother. 2009, 43, 478–484.
20. Caruso, B.A.; Freeman, M.C.; Garn, J.V.; Dreibelbis, R.; Saboori, S.; Muga, R.; Rheingans, R.
Assessing the impact of a school-based latrine cleaning and handwashing program on pupil absence
in Nyanza Province, Kenya: a cluster-randomized trial. Trop. Med. Int. Health TM IH 2014, 19,
1185–1197.
21. Evans, B.E.; Haller, L.; Hutton, G. Closing the sanitation gap: the case for better public funding
of sanitation and hygiene; OECD: Paris, 2004.
22. Nzengya, D. Designing Institutions and Health Education Interventions for Sustainable Supply of
Safe Water in Urban Informal Settlements: The Case of Kenya. Ph.D., Arizona State University: Ann
Arbor, 2014.
23. Migele, J.; Ombeki, S.; Ayalo, M.; Biggerstaff, M.; Quick, R. Diarrhea prevention in a Kenyan
school through the use of a simple safe water and hygiene intervention. Am. J. Trop. Med. Hyg. 2007, 76, 351–353.
24. Alexander, K.T.; Mwaki, A.; Adhiambo, D.; Cheney-Coker, M.; Muga, R.; Freeman, M. C. The
Life-Cycle Costs of School Water, Sanitation and Hygiene Access in Kenyan Primary Schools. Int. J.
Environ. Res. Public. Health 2016, 13.
25. UN-HABITAT. Local Actions for Sustainable Development: Water and Sanitation in
Asia-Pacific Region; United Nations Human Settlements Programme: Nairobi, Kenya, 2007.
26. Castro, A.; Maoulidi, M.; MCI A Water and Sanitation Needs Assessment for Mekelle City,
Ethiopia; MCI Social Sector Working Paper Series; Millennium Cities Initiative, Columbia
University: New York, NY, 2009.
Preprints (www.preprints.org) | NOT PEER-REVIEWED | Posted: 16 March 2017 doi:10.20944/preprints201703.0114.v1
Peer-reviewed version available at Int. J. Environ. Res. Public Health 2017, 14, , 442; doi:10.3390/ijerph14040442

28 of 31
27. Ministry of Drinking Water and Sanitation. Twelfth Five Year Plan—2012-2017; Government of
India, 2011.
28. Directorate of Water Development; World Water Assessment Program. National Water
Development Report: Uganda; Prepared for the 2nd UN World Water Development Report; World
Water Assessment Programme, 2006.
29. Ahmed, M.F.; Rahman, M.M. Water supply & sanitation: Rural and low income urban
communities; ITN-Bangladesh: Dhaka, Bangladesh, 2000.
30. Tiberghien, J.E. School Water, Sanitation and Hygiene Education + Community Impact (Mi
Escuela Saludable SWASH+): Ex post evaluation of the “Mi Escuela Saludable” SWASH +
Community Impact Project; BPD Water and Sanitation: London, UK, 2012.
31. WHO/UNICEF. Global water supply and sanitation assessment 2000 report; World Health
Organization and United Nations Children’s Fund: Geneva, Switzerland, 2000.
32. Chapter 2: Minimum Standards in Water Supply, Sanitation and Hygiene Promotion. In The
Sphere Handbook: Humanitarian Charter and Minimum Standards in Humanitarian Response; The
Sphere Project, 2011; pp. 52–102.
33. Clasen, T.; Haller, L.; Walker, D.; Bartram, J.; Cairncross, S. Cost-effectiveness of water quality
interventions for preventing diarrhoeal disease in developing countries. J. Water Health 2007, 5,
599–608.
34. Martinson, D. Improving the Viability of Roofwater Harvesting in Low-Income Countries,
School of Engineering, University of Warwick, 2007.
35. Appiah-Effah, E.; Nyarko, K. B.; Dwumfour-Asare, B.; Moriarty, P. Cost of Rural and Small
Town Water Service Delivery in the Bosomtwe District. In; Ministry of Water Resources, Works and
Housing Ghana: Accra, Ghana, 2011; pp. 102–107.
36. Rossiter, H. M.A.; Owusu, P.A.; Awuah, E.; Macdonald, A. M.; Schäfer, A. I. Chemical drinking
water quality in Ghana: water costs and scope for advanced treatment. Sci. Total Environ. 2010, 408,
2378–2386.
37. Carpenter, J. D. An Assessment of the EMAS Pump and its Potential for Use in Household Water
Systems in Uganda. M.S.C.E., University of South Florida: Ann Arbor, 2014.
38. Murcott, S. Implementation, Critical Factors and Challenges to Scale-Up of Household Drinking
Water Treatment and Safe Storage Systems. In Household Water Treatment and Safe Storage HWTS;
USAID/Hygiene Improvement Project, 2006.
39. van Koppen, B.; Smits, S.; Moriarty, P.; Penning de Vries, F.; Mikhail, M.; Boelee, E. Climbing
the Water Ladder: Multiple-use water services for poverty reduction; IRC International Water and
Sanitation Centre and International Water Management Institute: The Hague, The Netherlands, 2009.
40. Meeks, J.V. Willingness-to-Pay for Maintenance and Improvements to Existing Sanitation
Infrastructure: Assessing Community-Led Total Sanitation in Mopti, Mali. M.S.C.E., University of
South Florida: Ann Arbor, 2012.
41. Jenkins, M.W.; Cumming, O.; Cairncross, S. Pit latrine emptying behavior and demand for
sanitation services in Dar Es Salaam, Tanzania. Int. J. Environ. Res. Public. Health 2015, 12, 2588–
2611.
42. Ministry of Finance and Economic Development; UNDP. Ethiopia – Millennium Development
Goals Needs Assessment Final Report; Republic of Ethiopia Ministry of Finance and Economic
Development: Addis Ababa, Ethiopia, 2004.
Preprints (www.preprints.org) | NOT PEER-REVIEWED | Posted: 16 March 2017 doi:10.20944/preprints201703.0114.v1
Peer-reviewed version available at Int. J. Environ. Res. Public Health 2017, 14, , 442; doi:10.3390/ijerph14040442

29 of 31
43. Africa Infrastructure Country Diagnostic. Unit Costs of Infrastructure Projects in Sub-Saharan
Africa; Africon, World Bank: Washington, D.C., 2008.
44. Boelee, E. Mitigating poor water quality by point-of-use treatment in Ethiopia. In; Ecohealth
Forum: Mérida, Mexico, 2008.
45. Jenkins, M.W.; Cumming, O.; Scott, B.; Cairncross, S. Beyond “improved” towards “safe and
sustainable” urban sanitation: assessing the design, management and functionality of sanitation in
poor communities of Dar es Salaam, Tanzania. J. Water Sanit. Hyg. Dev. 2014, 4.
46. Water Stories: Expanding Opportunities in Small-Scale Water and Sanitation Projects;
Environmental Change and Security Program’s Navigating Peace Initiative; Woodrow Wilson
International Center for Scholars, 2011.
47. MacCarthy, M.F.; Buckingham, J. W.; Mihelcic, J. R. Increasing Access to Low-Cost Water
Supplies in Rural Areas: EMAS Household Water Supply Technologies in Bolivia; RWSN, 2013.
48. Ukoli-Onodipe, G.O. Designing optimal water supply systems for developing countries. Ph.D.,
The Ohio State University: Ann Arbor, 2003.
49. Sarkar, S.; Greenleaf, J.E.; Gupta, A.; Ghosh, D.; Blaney, L.M.; Bandyopadhyay, P.; Biswas,
R.K.; Dutta, A.K.; Sengupta, A.K. Evolution of community-based arsenic removal systems in remote
villages in West Bengal, India: assessment of decade-long operation. Water Res. 2010, 44, 5813–
5822.
50. Briscoe, J. When the cup is half full: Improving water and sanitation services in the developing
world. Environ. Sci. Policy Sustain. Dev. 1993, 35, 6–37.
51. Jha, P.K. Health and social benefits from improving community hygiene and sanitation: an Indian
experience. Int. J. Environ. Health Res. 2003, 13 Suppl 1, S133-140.
52. Graham, J. Sanitation and Hygiene: Taking Stock After Three Decades. In Water and
Sanitation-Related Diseases and the Environment: Challenges, Interventions, and Preventive
Measures; Selendy, J. M., Ed.; John Wiley & Sons, 2011; pp. 17–27.
53. Altaf, M.A. Household demand for improved water and sanitation in a large secondary city.
Habitat Int. 1994, 18, 45–55.
54. Hasan, A. Community groups and non-government organizations in the urban field in Pakistan.
Environ. Urban. 1990, 2, 74–86.
55. McCann, B. The sanitation of ecosan. Water 2005, 21, 29.
56. Cameron, J.; Hunter, P.; Jagals, P.; Pond, K. Valuing Water, Valuing Livelihoods: Guidance on
Social Cost-benefit Analysis of Drinking-water Interventions, with special reference to Small
Community Water Supplies 2011.
57. Sobsey, M.D.; Stauber, C.E.; Casanova, L.M.; Brown, J.M.; Elliott, M.A. Point of use household
drinking water filtration: a practical, effective solution for providing sustained access to safe drinking
water in the developing world. Environ. Sci. Technol. 2008, 42, 4261–4267.
58. Kalbermatten, J.M.; Julius, D.S.; Gunnerson, C.G.; Mara, D. Appropriate sanitation alternatives:
a planning and design manual; World Bank studies in Water Supply and Sanitation; The World
Bank: Washington, D.C., 1982.
59. Waterkeyn, J.; Cairncross, S. Creating demand for sanitation and hygiene through Community
Health Clubs: a cost-effective intervention in two districts in Zimbabwe. Soc. Sci. Med. 1982 2005, 61, 1958–1970.
Preprints (www.preprints.org) | NOT PEER-REVIEWED | Posted: 16 March 2017 doi:10.20944/preprints201703.0114.v1
Peer-reviewed version available at Int. J. Environ. Res. Public Health 2017, 14, , 442; doi:10.3390/ijerph14040442
30 of 31
60. Cairncross, S.; Valdmanis, V. Water supply, sanitation, and hygiene promotion. In Disease
Control Priorities in Developing Countries; The International Bank for Reconstruction and
Development/The World Bank Group, Oxford University Press: Washington, D.C., 2006; pp. 771–
792.
61. Lopez, J.; Maoulidi, M.; MCI Education Needs Assessment for Mekelle City, Ethiopia; MCI
Social Sector Working Paper Series; Millennium Cities Initiative, Columbia University: New York,
NY, 2009.
62. Waterkeyn, J. Cost-effective health promotion: community health clubs. In; Water, Engineering
and Development Centre, Loughborough University of Technology, WEDC: Loughborough, UK,
2003.
63. Cairncross, S. Sanitation and water supply: practical lessons from the decade; World Bank:
Washington, D.C., 1992; Vol. 9.
64. Varley, R.C.; Tarvid, J.; Chao, D. N. A reassessment of the cost-effectiveness of water and
sanitation interventions in programmes for controlling childhood diarrhoea. Bull. World Health
Organ. 1998, 76, 617.
65. Tenkorang, S.J.; Odai, S.N.; Annor, F.O.; Adjei, K.A. Impacts of Energy Price Changes on the
Financial Sustainability of Water Facilities: Case from Ghana. In; Ministry of Water Resources,
Works and Housing Ghana: Accra, Ghana, 2011; pp. 203–209.
66. Gilman, R.H.; Marquis, G.S.; Ventura, G.; Campos, M.; Spira, W.; Diaz, F. Water cost and
availability: key determinants of family hygiene in a Peruvian shantytown. Am. J. Public Health
1993, 83, 1554–1558.
67. Mycoo, M. Water provision improvements: A case study of Trinidad. Willingness to pay, pricing
policy, cost reduction and institutional strengthening. Ph.D., McGill University (Canada): Ann Arbor,
1996.
68. Impact of Rural Water Supply and Sanitation in Punjab, Pakistan; Independent Evaluation
Department, Asian Development Bank, 2009.
69. Government of Liberia. WASH Sector Investment Plan 2012-2017 Summary Report; Liberia
Water Supply, Sanitation, and Hygiene, Government of Liberia, 2012.
70. Prasad, N. Privatisation results: private sector participation in water services after 15 years. Dev.
Policy Rev. 2006, 24, 669–692.
71. Krause, M. The political economy of water and sanitation; Routledge: New York, NY, 2009.
72. Arrigo, J.A.S. Observational analyses of hydrologic scaling: The roles of heterogeneity and
non-local interaction as inferred from soil moisture and precipitation data. Ph.D., Boston University:
Ann Arbor, 2005.
73. Mathew, B. Ensuring Sustained Beneficial Outcomes for Water and Sanitation (WATSAN)
Programmes in the Developing World. PhD, Cranfield University: Cranfield, England, 2004.
74. Financing Growth and Poverty Reduction: Policy Challenges and Options in Bangladesh;
General Economics Division, Planning Commission, Government of the People’s Republic of
Bangladesh & UNDP Bangladesh, 2009.
75. Mills, A.; Ally, M.; Goudge, J.; Gyapong, J.; Mtei, G. Progress towards universal coverage: the
health systems of Ghana, South Africa and Tanzania. Health Policy Plan. 2012, 27 Suppl 1, i4-12.
76. Johnstone, D.B.; Arora, A.; Experton, W. The financing and management of higher education: A
status report on worldwide reforms; World Bank Washington, DC, 1998.
Preprints (www.preprints.org) | NOT PEER-REVIEWED | Posted: 16 March 2017 doi:10.20944/preprints201703.0114.v1
Peer-reviewed version available at Int. J. Environ. Res. Public Health 2017, 14, , 442; doi:10.3390/ijerph14040442
31 of 31
77. Hutton, G.; Haller, L.; Bartram, J. Global cost-benefit analysis of water supply and sanitation
interventions. J. Water Health 2007, 5, 481–502.
78. Akuoko-Asibey, A. Socioeconomic impact of a rural water supply programme in the Upper East
Region of Ghana. Ph.D., University of Alberta (Canada): Ann Arbor, 1994.
79. UN Water; WHO. Investing in Water and Sanitation: Increasing Access, Reducing Inequalities;
GLAAS 2014 Report; WHO Press: Geneva, Switzerland, 2014.
80. Dubai Cares’ WASH in School Initiative in Mali (DCWSIM) 2011.
81. Poletti, T.; Balabanova, D.; Ghazaryan, O.; Kocharyan, H.; Hakobyan, M.; Arakelyan, K.;
Normand, C. The desirability and feasibility of scaling up community health insurance in low-income
settings--lessons from Armenia. Soc. Sci. Med. 1982 2007, 64, 509–520.
82. Welle, K. Contending discourses on “Partnership”. A comparative analysis of the rural water
and sanitation sector in Ghana; University of London: Water Issues Study Group, School of Oriental
and African Studies, 2001.
83. UNESCO-World Water Assessment Program; (UNESCO-WWAP) Water for people, water for
life: The UN world water development report.; UNESCO & Berghahn Books: Barcelona, 2003.
© 2017 by the authors. Licensee Preprints, Basel, Switzerland. This article is an open access article distributed under the terms and conditions of the Creative Commons by Attribution (CC-BY) license (http://creativecommons.org/licenses/by/4.0/).
Preprints (www.preprints.org) | NOT PEER-REVIEWED | Posted: 16 March 2017 doi:10.20944/preprints201703.0114.v1
Peer-reviewed version available at Int. J. Environ. Res. Public Health 2017, 14, , 442; doi:10.3390/ijerph14040442