Embed Size (px)
Citation preview

Resource
A Systematic p53 Mutation
Library Links DifferentialFunctional Impact to Cancer Mutation Pattern andEvolutionary ConservationHighlights
d Multiplexed quantification of the effect of thousands of
distinct p53 mutations
d Differential mutation outcomes reflect functional evolutionary
constraints
d Neutral SNPs may interact with acquired mutations to
modulate phenotypic outcome
d Hotspot p53 mutations confer a relative competitive
advantage in vivo
Kotler et al., 2018, Molecular Cell 71, 178–190July 5, 2018 ª 2018 Elsevier Inc.https://doi.org/10.1016/j.molcel.2018.06.012
Authors
Eran Kotler, Odem Shani,
Guy Goldfeld, ..., Debora S. Marks,
Moshe Oren, Eran Segal
[email protected] (M.O.),[email protected] (E.S.)
In Brief
Are all p53 mutations alike? Kotler et al.
compare the functional impact of
thousands of variations in the p53 tumor
suppressor protein in human cells in vitro
and in vivo and characterize the
differential outcome of distinct p53
mutations.
Data Resources
GSE115072

Molecular Cell
Resource
A Systematic p53 Mutation Library LinksDifferential Functional Impact to Cancer MutationPattern and Evolutionary ConservationEran Kotler,1,2 Odem Shani,1 Guy Goldfeld,1 Maya Lotan-Pompan,2 Ohad Tarcic,1 Anat Gershoni,1 Thomas A. Hopf,3
Debora S. Marks,3 Moshe Oren,1,4,* and Eran Segal1,2,*1Department of Molecular Cell Biology, Weizmann Institute of Science, Rehovot 7610001, Israel2Department of Computer Science and Applied Mathematics, Weizmann Institute of Science, Rehovot 7610001, Israel3Department of Systems Biology, Harvard Medical School, Boston, MA 02115, USA4Lead Contact
*Correspondence: [email protected] (M.O.), [email protected] (E.S.)
https://doi.org/10.1016/j.molcel.2018.06.012
SUMMARY
The TP53 gene is frequently mutated in human can-cer. Research has focused predominantly on six ma-jor ‘‘hotspot’’ codons, which account for only �30%of cancer-associated p53 mutations. To comprehen-sively characterize the consequences of the p53mutation spectrum, we created a synthetically de-signed library and measured the functional impactof �10,000 DNA-binding domain (DBD) p53 variantsin human cells in culture and in vivo. Our results high-light the differential outcome of distinct p53 muta-tions in human patients and elucidate the selectivepressure driving p53 conservation throughout evolu-tion. Furthermore, while loss of anti-proliferativefunctionality largely correlates with the occurrenceof cancer-associated p53 mutations, we observethat selective gain-of-function may further favorparticular mutants in vivo. Finally, when combinedwith additional acquired p53 mutations, seeminglyneutral TP53 SNPs may modulate phenotypicoutcome and, presumably, tumor progression.
INTRODUCTION
The TP53 tumor suppressor gene, which encodes the p53 tran-
scription factor, is the most frequently mutated gene in human
cancer (Kandoth et al., 2013; Olivier and Taniere, 2011). In
response to a variety of cellular stress conditions, p53 is acti-
vated to suppress transformation by inducing cell cycle arrest,
DNA damage repair, senescence, or apoptosis (Bieging et al.,
2014; Levine and Oren, 2009). In concordance with its pivotal
role in suppressing tumorigenesis, mutations disrupting wild-
type p53 (wtp53) function are extremely common in human can-
cers (Brosh and Rotter, 2009), with variable prevalence between
tumor types (Blons and Laurent-Puig, 2003; Iacopetta, 2003;
Peller and Rotter, 2003; Schuijer and Berns, 2003). Unlike other
tumor suppressors, the majority of cancer-associated muta-
tions in p53 are missense mutations residing in its DNA-binding
178 Molecular Cell 71, 178–190, July 5, 2018 ª 2018 Elsevier Inc.
domain (DBD) (Bouaoun et al., 2016; Olivier et al., 2010) and
leading to loss of tumor suppressive activity and possible gain
of novel oncogenic functions (reviewed in Oren and Rotter,
2010). In its wild-type (WT) form, p53 binds as a homo-tetramer
to DNA response elements of its target genes and orchestrates
gene expression patterns to cope with cellular stress. In
contrast, the effects of mutant p53 (mutp53) on target gene
expression are more complex (Weisz et al., 2007) and are
thought to interfere with pivotal signaling pathways (Riley
et al., 2008). Previous studies in yeast have shown that different
mutp53 variants exhibit altered transactivation capacity to-
wards wtp53 target genes in a mutant- and target-dependent
manner (Kato et al., 2003; Resnick and Inga, 2003). This com-
prises a general reduction in transactivation capacity or an
altered spectrum of regulated genes, including non-wtp53
target genes (Menendez et al., 2006; Resnick and Inga, 2003).
Interestingly, the residual transcriptional activity of a particular
mutant is not directly indicative of the extent of its tumor sup-
pressive functionality or of its ability to induce apoptosis (Ka-
kudo et al., 2005). Moreover, some p53 mutants (‘‘super-trans
mutants’’) exhibit increased transactivation potential towards
particular targets when compared to wtp53 (Resnick and
Inga, 2003). Thus, in order to determine the tumor-suppressive
capacity of specific p53 mutations, the phenotypic impact of
each mutation should be experimentally quantified. Such
knowledge is of particular importance for the personalized
treatment of cancer.
However, while the availability of patients’ genomic se-
quences constantly increases, our understanding of mutation-
specific biological effects remains a limiting factor. Specifically,
detailed studies assessing the effects of p53mutations in human
cells have been largely limited to the most prevalent ‘‘hotspot’’
mutations, which account for�30%of cancer-associated muta-
tions; this leaves the remaining �70% mostly uncharacterized.
Deep mutational scanning (Fowler and Fields, 2014) offers a
high-throughput approach for revealing the consequences of
genetic variation both in regulatory and coding sequences
(Brenan et al., 2016; Keren et al., 2016; Majithia et al., 2016;
Tewhey et al., 2016; Ulirsch et al., 2016; Weingarten-Gabbay
et al., 2016). Yet, although the construction of a large-scale
mutp53 library has recently been reported (Kitzman et al.,

2015), phenotypic characterization of such p53 mutants has not
been performed.
To address this important knowledge gap, we devised a
massively parallel mutational scan and measured the functional
impact of thousands of distinct p53 DBD variants in vitro and
in vivo. This provides the first comprehensive phenotypic cata-
logue of p53 mutations in human cells, quantifying the relative
fitness effect of each mutation in culture and its selective advan-
tage in vivo—presumably representing context-dependent
gain-of-function. Our findings demonstrate tight sequence-
fitness relationships underpinning evolutionary selection and
recapitulate the prevalence and clinical impact of particular
mutations in human tumors.
RESULTS
Massively Parallel Measurement of the FunctionalImpact of p53 MutationsTo quantitatively measure the anti-proliferative functional capac-
ity of thousands of mutp53 variants, we designed a synthetic
library of 9,833 unique, �200-nucleotide-long, single-stranded
DNA oligonucleotides encoding variations in the p53 DBD (Fig-
ure S1). To delineate the impact of mutations derived from
cancer samples and of asymptomatic natural polymorphisms,
the library design included: (1) nearly all DBD mutations occur-
ring in 28,869 tumor samples (Bouaoun et al., 2016), most of
which were previously unstudied; (2) all possible permutations
at each hotspot codon (378 variants), allowing their in-depth
characterization; and (3) combinations of naturally occurring
SNPs (within the DBD) with additional DBD mutations, which
aimed to unravel possible genetic interactions (1,139 variants).
In addition, to systematically characterize the effect of mutations
across the entire DBD, we created all single-nucleotide substitu-
tions, deletions, and insertions (3,874 variants); all single amino
acid substitutions requiring up to 2 nucleotide changes
(3,480 variants); and dinucleotide transitions (e.g., CC > TT and
GG > AA, 97 variants), as well as premature stop codons (304
variants) and in-frame single and double (consecutive) amino
acid deletions at each position (363 variants).
To achieve accurate mutagenesis of the entire DBD (residues
102–292, 573 bp long), we generated 4 sub-libraries (labeled
‘‘A,’’ ‘‘B,’’ ‘‘C,’’ and ‘‘D’’), covering consecutive 141–144 bp
fragments of the DBD flanked by wtp53-homologues regions
(Figure 1A). These sub-libraries were separately amplified and
cloned into lentiviral vectors, yielding amutp53 coding sequence
followed by an internal ribosome entry site (IRES)-driven
enhanced green fluorescent protein (EGFP) reporter. This
bi-cistronic cassette allows estimation of relative mutp53
expression levels based on EGFP intensity. Library-encoding
viruses were used to transduce p53-null H1299 (non-small-cell
lung cancer) cells at a low multiplicity of infection (MOI = 0.1)
so that each transduced cell would express only a single
mutp53 variant (Figures S2A–S2C). Infected cultures were
sampled at 2, 6, 9, and 14 days post-infection (PI), and the rela-
tive abundance of each variant at each time point was assessed
using next-generation sequencing (STAR Methods). Setting a
minimum threshold of 200 reads per variant at the first time point
(Figure S2D), we were able to capture the dynamics of 9,516
unique DNA sequence variants (97% of the designed variants)
corresponding to 5,708 protein sequence variants. To piece
together information on the entire DBD, data in each sub-library
was normalized according to the dynamics of synonymous
(‘‘silent’’) mutation variants compared across all sub-libraries
(Figure S2E and STAR Methods).
To determine the relative changes in clonal abundance, we
compared the fraction of reads corresponding to each sequence
variant at 9 days PI to the fraction at 2 days PI (Figure 1B). Impor-
tantly, the relative abundance of all 571 synonymous sequence
variants encoding wtp53 in the library decreased much faster
within this time frame than that of the 8,945 non-synonymous
variants (mean depletion of �6.55-fold versus �1.45-fold for
synonymous and non-synonymous, respectively; Mann-Whitney
U, p < 10�187). This is concordant with thewell-documented anti-
proliferative effect of bona fide wtp53, as measured by flow
cytometry and qRT-PCR in comparison to the entire library or
to a p53-null control (Figures S2E–S2H). Furthermore, in contrast
to all synonymous mutations, variants encoding the ten most
prevalent p53 mutations across all tumor types (Bouaoun
et al., 2016) were robustly retained in the population, demon-
strating the ability of our system to recapitulate in vivo behavior
and simultaneously map the phenotypic outcome of thousands
of unique mutations (Figures 1C, S2I, and S3A). Similarly, vari-
ants encoding missense mutations in the 6 hotspot codons
(averaged across all mutations in each codon) lacked a WT-
like tumor-suppressive effect and were well retained (ANOVA,
p < 10�10), although they did not show a proliferative advantage
over p53-null control cells. The latter might be because H1299
cells, which are naturally not ‘‘addicted’’ to mutp53, may require
excessive mutp53 expression to elicit oncogenic gain-of-func-
tion (GOF), while a single integrated copy of our lentiviral vector
only yields relatively low p53 levels in non-stressed cells.
To allow quantitative comparison between variants and
improve measurement robustness, we took advantage of the
repeated measurements at 6, 9, and 14 days PI and calculated
a relative fitness score (RFS) for each variant based on its reten-
tion (or depletion) across these three measurements (STAR
Methods). Comparing the RFS calculated for different DNA
sequence variants encoding the same amino acid substitution
verified the robustness of our measurements (Figure S3B;
R = 0.89, p < 10�100). To further assess this measure’s accuracy
and reproducibility, we performed independent replications of
time-course experiments. Reassuringly, RFS scores of
sequence variants were highly correlated between biological
replicates (Figure S3C; R = 0.94, p < 10�100).
Unexpectedly, when averaging the effects of all DNA
sequence variants encoding the same amino acid substitution
(‘‘protein variants’’), a bimodal distribution is observed (Fig-
ure 1D); in this distribution, the great majority of p53 alterations
can be discretely categorized as either retaining wtp53 function-
ality (strongly depleted in the population) or abrogating it (stably
retained). A similar separation is evident when variants are
displayed according to their DNA sequence (Figures S3D
and S3E).
To explore the generality of our findings, we examined the
distribution of effects in a different cellular context. We per-
formed an identical time-course experiment using sub-library
Molecular Cell 71, 178–190, July 5, 2018 179

Figure 1. A High-Throughput Experimental System for Measuring the Effects of p53 Variations
(A) Experimental design: a library of 9,833 designed p53 sequence variants was synthesized on Agilent microarrays in 4 separate pools spanning consecutive
parts of the DBD (labeled A, B, C, and D) and cloned into a lentiviral vector expressing p53 followed by an IRES-driven EGFP reporter. p53-null H1299 cells were
infected with packaged viruses at MOI = 0.1 to ensure integration of a single variant per cell. Infected cells were sampled along a 14-day time course, and the
relative abundance of each variant at each time point was assessed by next-generation sequencing, allowing extraction of a growth curve and a relative fitness
score (RFS; calculated as described in STAR Methods) for each individual variant.
(B) Relative fraction of reads for each variant (n = 9,516) at 9 days (y axis) versus 2 days (x axis) post-infection of H1299 cells with the p53 library. Variants along the
y = x diagonal retain stable relative abundance in the population. Parallel red diagonal lines represent a 2-fold increase or decrease in abundance between day 2
and day 9. Green dots represent synonymous sequence variants (encoding wtp53 amino acid sequence). Inset: distribution of fraction of reads (log, base 2) for
synonymous (green) and non-synonymous (blue) mutations at 2d and 9d.
(C) Time course growth curves comparing the dynamics of all synonymousmutations to that of all non-synonymousmutations,mean of the 10most abundant p53
amino-acid substitutions in the IARC database, and means of all non-synonymous mutations in each of the six commonly mutated hotspot codons. Plotted lines
represent means ± STE at each time point post-infection. ‘‘n’’ denotes the number of different DNA sequence variants averaged to calculate each mean value.
(D) Distribution of RFS values across all protein sequence variants. Dashed line showsmedian RFS of all synonymous variants. n = 6,837. See also Figure S3D and
Table S2.
180 Molecular Cell 71, 178–190, July 5, 2018
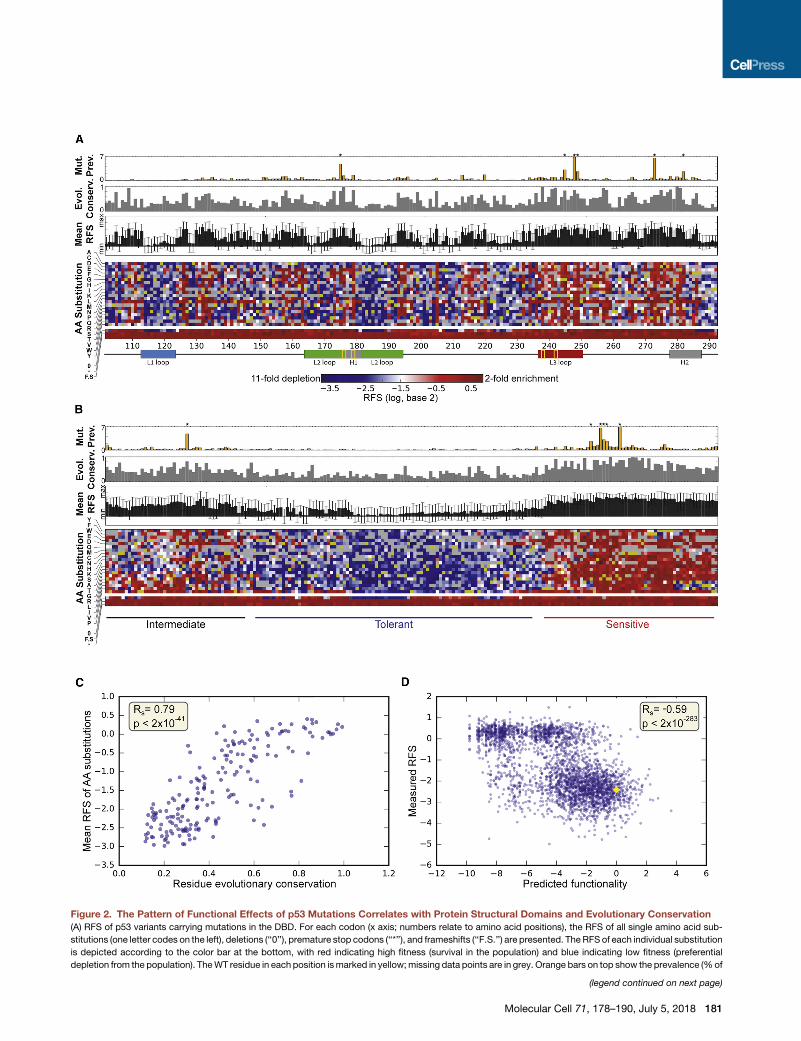
Figure 2. The Pattern of Functional Effects of p53 Mutations Correlates with Protein Structural Domains and Evolutionary Conservation
(A) RFS of p53 variants carrying mutations in the DBD. For each codon (x axis; numbers relate to amino acid positions), the RFS of all single amino acid sub-
stitutions (one letter codes on the left), deletions (‘‘0’’), premature stop codons (‘‘*’’), and frameshifts (‘‘F.S.’’) are presented. The RFS of each individual substitution
is depicted according to the color bar at the bottom, with red indicating high fitness (survival in the population) and blue indicating low fitness (preferential
depletion from the population). TheWT residue in each position ismarked in yellow;missing data points are in grey. Orange bars on top show the prevalence (%of
(legend continued on next page)
Molecular Cell 71, 178–190, July 5, 2018 181

‘‘D’’ in HCT116 colorectal carcinoma cells in which both endog-
enous wtp53 alleles had been knocked out using CRISPR-Cas9
(Figure S3E; generous gift of Prof. K. Vousden). We found high
correlations between RFS measurements of sequence variants
(R = 0.73, p < 10�200) and protein variants (R = 0.81,
p < 10�200) in the two contexts (Figures S3E and S3H). At the
same time, the functional effects of p53mutations span a slightly
more continuous spectrum in HCT116 than in H1299 cells,
suggesting that a minority of variants exhibit context-dependent
effects in these settings.
The Functional Impact of Distinct p53 MutationsCorrelates with Protein Structural Domains andEvolutionary ConservationWe next examined how amino acid sequence variations affect
the RFS as an indicator of wtp53-like anti-proliferative capacity.
To this end we calculated, for each assayed amino acid substi-
tution at each position along theDBD, themedian RFSmeasured
for all DNA sequence variants encoding the same particular
substitution in H1299 cells (Figure 2A). Notably, regardless of
position along the DBD, premature termination codons and
frameshift mutations resulted in a similarly strong disruption of
p53 functionality (Figure 2A, bottom rows in heatmap; Fig-
ure S3E). In contrast, the effects of substituting or deleting a sin-
gle amino acid were strongly dependent on its position within the
DBD. Thus, the L1 loop (residues F113–T123) and most of the L2
loop (residues K164–C176 and C182–L194) are rather robust to
alterations. Conversely, most mutations in the L3 loop (residues
M237–P250) and the specific residues involved in coordination
of zinc binding (R175, C176, H179, C238, and C242) compro-
mise p53 functionality, which is in line with the documented
importance of the zinc ion for the thermodynamic stability of
the DBD (Bullock et al., 1997; Duan and Nilsson, 2006). Further-
more, hierarchical clustering of the relative fitness scores across
the DBD (Figures 2B and S4A) grouped amino acids with similar
biochemical properties close to one another. Thus, valine co-
clustered with isoleucine and leucine while aspartate co-clus-
teredwith glutamate and phenylalanine co-clustered with trypto-
phan and tyrosine. Hence the effects of mutations on relative
fitness capture the sequence-structure-function relationships
in p53. Notably, as observed for specific protein variants (Fig-
ure 1D), the majority of codons also segregated into two major
groups that display opposing phenotypic responses to muta-
genesis (Figure S4B).
We then calculated an evolutionary conservation score (ECS;
STAR Methods) for each residue along the DBD from a multiple
sequence alignment of 1,887 homologous sequences, which
total mutated cases) of somaticmutations in each indicated residue across all tum
the evolutionary conservation score of each position across 1,887 homologous se
codon (mean across each heatmap column). Bottom: linear scheme of major stru
ion. See also Table S3.
(B) Same data as in (A) hierarchically clustered in both dimensions, grouping togeth
positions (columns) are either tolerant tomutations (predominantly blue) or highly s
the codons (grey bars). See also Figure S4.
(C) Mean RFS, calculated for each amino acid position across all missense mutat
that position (0, completely variable; 1, fully conserved). n = 191.
(D) Measured RFS of each amino acid substitution plotted against predicted effe
evolutionary sequences (log-odds ratio of mutant and WT sequence probabilitie
182 Molecular Cell 71, 178–190, July 5, 2018
correspond to 246 non-redundant sequences when clustering
sequences that are more than 80% identical. Comparing ECS
values with codon mean RFS measurements revealed a strong
correlation (Figures 2A and 2C; Rs = 0.79, p < 2 3 10�41), high-
lighting the tight coupling between p53 protein sequence evolu-
tionary conservation and vulnerability to functional alteration.
Consequently, we attempted to blindly predict the effects of
amino acid substitutions on protein functionality using a statisti-
cal model of sequence variation in the alignment based on evolu-
tionary bias towards or away from specific residues at each
position (Figure 2D; STAR Methods). This unsupervised model,
which accounts for site-specific amino acid constraints alone
and does not explicitly model a specific phenotypic functionality,
showed a correlation with our experimental measurements
(Rs = �0.59, p < 2 3 10�283), suggesting that RFS reflects a
p53 functionality that is under evolutionary selection. Despite
this correlation, some variants that were predicted to retain at
least partial wtp53 functionality exhibited complete loss of anti-
proliferative activity. This discrepancy may suggest the exis-
tence of additional context-dependent functionalities that are
not evident in unstressed H1299 cells, which would be in line
with p53’s involvement in multiple non-redundant processes
(Kakudo et al., 2005; Pfister and Prives, 2017).
Residues within the DBD exhibit differential robustnessto modificationCloser examination of the mutational effects within specific
codons revealed 3 distinct response patterns of codons to mu-
tations: (1) positions highly susceptible tomutation (i.e., substitu-
tion to nearly any amino acid abolished anti-proliferative p53
functionality), including the hotspot codons G245, R248, R249,
and R273 (Figures 3A and S4C); (2) positions resilient to muta-
tions, tolerating practically all substitutions (with the frequent
exception of proline) without losing p53 functionality (Figures
3B and S4D); and (3) codons in which a continuous phenotypic
spectrum is observed, with mutation outcome largely depending
on the specific substitution (Figures 3C and S4E). Interestingly,
the latter group includes the hotspot residues R175 and R282,
extending earlier observations (Ory et al., 1994). Altogether,
our findings demonstrate themerit of in-depth functional charac-
terization of p53 mutations, even at hotspot positions.
Overlaying the relative evolutionary representation (i.e., the
percent of species in which that particular amino acid is present
at a given position) over themeasured phenotypic effect for each
of the substitutions reveals that the mean relative representation
of variants retaining wtp53 functionality is dramatically higher
than in non-functional variants (Figures 3A–3D; Student’s t test,
or types (Bouaoun et al., 2016); asterisksmarkmajor hotspots. Grey bars depict
quences (see STARMethods); black bars represent mean RFS (± STD) for each
ctural motifs in the DBD. Yellow rectangles denote residues engaging the zinc
er amino acid positions with similar robustness tomodification. Note that most
ensitive (predominantly red). This is concordant with the conservation scores of
ions at that position and plotted against the evolutionary conservation score of
ct of its substitution on p53 functionality, as derived from a statistical model of
s, WT = 0; see STAR Methods). Yellow diamond represents wtp53. n = 2,990.

Figure 3. Residues within the DBD Exhibit Different Patterns of Robustness to Modification
(A–C) For each indicated p53 codon, we show the median RFS measured for all assayed amino acid substitutions at that position (blue, decrease in relative
abundance, presumably retaining wtp53 activity; red, relative enrichment, presumably due to loss of wtp53 function). Grey bars on top indicate relative rep-
resentation (% of sequenced species in which the indicated amino acid is present at that particular position, according to ConSurf (Ashkenazy et al., 2016)
multiple sequence alignment). The amino acid occupying that position in wtp53 is indicated at the bottom. See also Figure S4C–S4E.
(D) p53 variants were divided by their RFS into two groups: retaining wtp53-like functionality (blue) or dysfunctional (red). Threshold for separation was set to �1
(equivalent to 2-fold depletion). Bars = % relative representation (mean ± STE) for each group, calculated as in (A–C). Student’s t test p < 10�38; n = 1,152 in red
group, n = 2,005 in blue group.
(E) Mean RFS for each amino acid position superimposed over the p53 structure (a monomer bound to DNA). Blue and red colors represent tolerant (low mean
RFS) and susceptible (high mean RFS) positions, respectively.
Molecular Cell 71, 178–190, July 5, 2018 183
Figure 4. Mutation Prevalence in Human
Tumors Is Highly Correlated with Loss of
wtp53 Anti-proliferative Effect
(A) The RFS of each p53 variant is plotted against
its relative abundance across all human tumors
(IARC p53 database). Grey circles, missense mu-
tations; red triangles, nonsense mutations; orange
triangles, frameshift mutations; green diamonds,
synonymous mutations. The ten most frequent
hotspot mutations are indicated. Dashed triangle
indicates mutations observed at low abundance
despite having lost p53 functionality. Dashed hor-
izontal line indicates median RFS of all synony-
mous variants. n =1,465. See also Table S3.
(B) Same as in (A), but including only amino acid
substitutions achievable by a single transition
mutation. Colors signify the evolutionary conser-
vation score of each residue; see color bar on the
right. Triangular dots represent nonsense muta-
tions. Dashed line represents a sigmoidal fit of the
form y = c / (1 + e�k*(x�x0)) + y0, created using least
squares residual minimization. R2 = 0.49; n = 526.
p < 10�38). Thus, the functional impact of mutations in human
cells faithfully reproduces the constraints that shape the DBD
sequence during evolution. Notably, the differences in robust-
ness of codons to modification are concordant with known p53
structure-function dependencies: superimposing the mean
RFS of each codon on the protein’s 3D structure shows that
residues positioned in proximity to the DNA are generally more
functionally vulnerable (Figure 3E). Together, these strong asso-
ciations between our functional measurements, conservation,
and structure position canonical anti-proliferative p53 capacity
as a pivotal property under strong evolutionary selection.
Mutation Prevalence in Human Tumors Is Correlatedwith Loss of Anti-proliferative CapacityAssessing the contribution of specific mutations to cancer
features is key to patient-specific tailoring of treatment. We
therefore asked whether the relative fitness effects measured
in vitro correspond with the prevalence of particular p53 muta-
tions in human tumors. Reassuringly, this analysis (Figure 4A) re-
vealed that p53 mutation prevalence across all tumor types
184 Molecular Cell 71, 178–190, July 5, 2018
(Bouaoun et al., 2016) is positively corre-
lated with RFS (Rs = 0.4, p < 4 3 10�57).
Intriguingly, in apparent discordance
with the overall picture, we also observed
mutations that are rare in tumors despite
having lost p53 functionality (dashed tri-
angle, Figure 4A). Thus, the importance
of such variants could not be deduced
from mutation prevalence, emphasizing
the necessity of direct functional mea-
surement. Closer examination of these
mutations revealed a marked enrichment
in variants requiring more than a single
nucleotide change or a purine-pyrimidine
transversion. When excluding such vari-
ants from the analysis and retaining only
protein sequence alterations achievable by a single A-G or C-T
transition, the correlation between mutation prevalence and
loss of functionality increases (Figure 4B, Rs = 0.52, p < 2 3
10�38). Fitting a logistic function to the data managed to explain
a large fraction of the variability (R2 = 0.49) in relative fitness of
transition mutants on the basis of clinical prevalence. The sig-
moid relationship—and the apparent separation of the �10
most prevalent mutations without a further increase in relative
fitness—suggest that additional explanations underlie the high
prevalence of those hotspot mutations. These may include
oncogenic effects not captured by our in vitro assay or a mech-
anistic tendency towards accrual of mutations at those sites.
p53Mutations that DisruptWT-like Functionality In Vitro
Span a Broad Phenotypic Spectrum In Vivo and MayExhibit Selective GOFIntrigued by the fact that, in both examined cellular systems,
hotspot p53 mutations did not confer a growth advantage rela-
tive to the rest of the disruptive mutations, we hypothesized
that such GOF is more likely to be revealed under selective

Figure 5. p53Mutations that DisruptWT-Like Functionality In VitroSpan aBroad Phenotypic Spectrum In Vivo andMay Exhibit Selective GOF
(A) Schematic representation of the experimental workflow for measuring the effects of p53 variants in vivo. 9 days following infection with sub-library ‘‘D,’’
positive cells were sorted by EGFP expression. 2 weeks later, cells were transplanted into nude Foxn1nu mice. After �3 weeks, tumors were extracted, and the
relative enrichment/depletion of each variant was assessed (compared to its abundance in the injected pool). Only variants that disrupted p53 functionality in vitro
(high RFS scores) were included in the analysis.
(B) Enrichment scores of sequence variants measured in two different tumors. A representative example is shown.
(C) Median in vivo enrichment scores versus in vitro RFS of non-disruptive sequence variants.
(legend continued on next page)
Molecular Cell 71, 178–190, July 5, 2018 185

pressures operating in vivowithin a growing tumor. We therefore
FACS-sorted mutp53-positive HCT116 cells transduced with
sub-library ‘‘D’’ (which includes 6 of the 10 most prevalent muta-
tions), injected them subcutaneously into nude mice, and
measured the relative enrichment of each variant in the formed
tumors in comparison to its abundance in the initial injected
pool (Figure 5A). Of note, this pool is already largely depleted
ofmutants that retain anti-proliferative capacity in vitro.Reassur-
ingly, variant enrichment scores were highly correlated between
individual tumors (Figures 5B, 5D, and S5A). In contrast, no cor-
relation was found between in vivo enrichment score and in vitro
RFS (Figure 5C), highlighting the difference in selective forces
between these environments. Interestingly, p53 mutations that
equally disrupt wild-type p53 functionality in vitro were found
to span a broad phenotypic spectrum in vivo (Figures 5E and
S5B). Notably, enrichment scores of sequence variants encod-
ing amino acid substitutions that are among the 10 most preva-
lent cancer-associated mutations were higher than those of
truncating (nonsense or frameshift) and missense mutations
encoding less prevalent amino acid substitutions (Figure 5F;
Kruskal-Wallis, p < 10�12), suggesting that they elicit in vivo
GOF in both human cancer and experimental mouse tumors.
While traditional two-dimensional (2D) cell culture is
commonly used in cancer research, cultivation of cells in three-
dimensional (3D) space is believed to more faithfully approxi-
mate the in vivo conditions. In fact, hotspot p53 mutations
have been implicated in disruption of tissue architecture by up-
regulating the mevalonate pathway (Freed-Pastor et al., 2012)
as well as in enabling anchorage-independent growth of tumor
cells via fibronectin production in 3D culture (Iwanicki et al.,
2016). Puzzled by our observation that hotspot p53 mutants
were advantageous in vivo but not in 2D culture, we asked
whether such selective advantage might be revealed in 3D cul-
ture. To preserve sufficient representation of library complexity
in this experimental setting, we focused on a panel of 66
missense mutations in sub-library ‘‘D,’’ all of which occur in
human tumors. This mini-library was synthesized, cloned into
lentiviral vectors, and used to transduce HCT116 cells, essen-
tially as done with the large-scale library. FACS-sorted,
mutp53-positive cells were then either maintained in standard
2D conditions or cultured in low-adherence conditions, resulting
in formation of growing 3D spheroids (Figures S6A and S6B;
STAR Methods). The relative abundance of each variant in the
harvested spheroids was then compared to its abundance in
the initial cell pool and to its enrichment in 2D conditions. As
expected, variant enrichment scores were highly correlated
between replicates in each culture condition (Figures S6C,
S6D, and S6F). Notably, whereas a significant correlation was
observed between the enrichment profiles in 2D versus 3D (Fig-
ure S6E; R = 0.34, p < 0.01), nomarked correlation was observed
(D) Heatmap showing the correlation between enrichment scores across 8 tumors
variants (upper-right triangle). Tumor labels ending with a letter represent differe
(E) Median enrichment of protein variants in tumors (calculated for each variant a
prevalent mutations in human cancer.
(F) Relative enrichment of sequence variants in mouse tumors (aggregated over a
missense, excluding the 6 mutations highlighted in (e); orange: variants encodi
(Kruskal-Wallis H). See Tables S4, S5, and S6.
186 Molecular Cell 71, 178–190, July 5, 2018
between 3D and in vivo enrichment profiles (Figure S6E). Thus,
unlike the in vivo picture, there was no observable enrichment
for hotspot mutants in 3D culture (Figure S6H). Hence mere
growth in 3D, as represented by this simplified spheroid model,
is insufficient to reproduce the conditions that select for partic-
ular hotspot p53 mutations in the much more complex in vivo
setting.
Models for Predicting Cancer Prevalence andFunctional Impact of Distinct p53 MutationsTo further elucidate the forces shaping the spectrum of cancer-
associated p53mutations, we trained a ‘‘random forest’’ learning
algorithm to predict mutation prevalence in human tumors. We
applied 200-fold cross-validation (CV) using 90% of our data to
predict mutation abundance according to mutation type and
outcome, position, the probability of occurrence of similar sub-
stitutions (genome-wide, along evolution), residue evolutionary
conservation, and the phenotypic measurements we obtained
in H1299 cells in vitro. This model predicted relative mutation
abundance with an R = 0.72 (p < 10�100) and R = 0.75 (p < 3 3
10�27) on CV and 10% unseen test cases, respectively (Figures
S7A and S7B). Importantly, the most contributing feature in this
prediction task was our measured RFS score (Figure S7C),
demonstrating the importance of direct systematic assessment
of pan-mutation effects and underscoring the connection be-
tween loss of anti-proliferative capacity and prevalence in
cancer.
Next, we attempted the complementary task of predicting
variants’ RFS using the above mutation features, substituting
all experimental measurements with mutation prevalence (Fig-
ures S7D–S7F). Once again, our trained model enabled accurate
prediction of mutational outcome (R = 0.87, p < 10�100 and
R = 0.88, p < 23 10�47 in CV and on unseen test cases, respec-
tively), providing a reliable estimation of the phenotypic effects of
p53 variants of unknown significance (VUS). Such knowledge is
very valuable—for example, in assessing the possible implica-
tions of a particular TP53 germline mutation identified by pre-
or postnatal genetic testing.
The Differential Impact of Distinct Mutations IsReflected in Germline p53 Mutation CarriersTP53 germline mutations underpin the majority of cases of
Li-Fraumeni syndrome (LFS), an inherited cancer predisposition
resulting in early-onset tumors including sarcomas, breast can-
cers, and adrenocortical tumors (Li et al., 1988; Malkin et al.,
1990). Importantly, tumors are observed at an earlier age in
LFS family members harboring p53 DBDmutations that compro-
mise anti-proliferative functionality in cultured H1299 cells
(RFS > �1) than are those bearing TP53 germline mutations
that retain anti-proliferative capacity (RFS % �1), highlighting
(biological replicates) for sequence variants (lower-left triangle) and for protein
nt tumors extracted from the same mouse. See also Figure S5.
cross eight tumors). Red dots indicate mutations that are among the ten most
ll tumors) divided by mutation type and effect. Red: nonsense, frameshift, and
ng the six most prevalent protein alterations in this sub-library. ***p < 10�12

Figure 6. p53 Mutation Functional Impact Is Reflected in Age at Tumor Onset in LFS Family Members
(A) Age at diagnosis of LFS family members presenting with tumors of different tissue origin (Bouaoun et al., 2016). Tumors are divided according to the functional
impact of the corresponding germline TP53 mutations as measured in H1299 cells in vitro. Blue: retaining wtp53-like anti-proliferative functionality (RFS% �1);
red: disrupting functionality (RFS > �1). p values: Mann-Whitney U.
(B) Box plots show the age at diagnosis of tumors in LFS family members across all tumor types. Tumors are stratified by mutation type and in vitro effect. Blue:
missense mutations retaining wtp53-like anti-proliferative functionality (RFS % �1); red: nonsense, frameshift, and missense mutations that disrupt wtp53-
functioanlity (RFS > �1), excluding the six most prevalent hotspot mutations; orange: hotspot mutations (R175H, R273H, R248Q, R248W, R273C, and R282W).
p values: Kruskal-Wallis H.
(C) Age at diagnosis of LFS family members bearing mutations that disrupt wtp53 functionality in HCT116 cells in vitro (RFS > �0.5), stratified by their median
relative enrichment in mouse tumors. Blue and red: below and above, respectively, the average in vivo enrichment score,. p value: Mann-Whitney U.
the prognostic value of the RFS score (Figure 6A; Mann–Whitney
U, p < 10�9 across all cancers). Of note, the age at tumor diag-
nosis (ATD) is similar in LFS family members with truncating
TP53 mutations (frameshift or nonsense) and in members with
functionally disruptive missense mutations, as predicted by our
functional in vitro measurements. Yet, individuals with the six
most prevalent hotspot mutations even exhibit a somewhat
lower ATD (Figure 6B; Kruskal-Wallis p < 0.01), suggesting that
Molecular Cell 71, 178–190, July 5, 2018 187

Figure 7. The Phenotypic Outcome of Missense Mutations Is Affected by the V217M SNP
(A) For each variant, we plotted its standardized relative fitness (Z scores) when the mutation is on a SNP R213R background as compared to a wtp53 back-
ground. n = 388. Variant type colors are shown at the bottom.
(B) Same as (A), but for SNP V217M. n = 385.
they elicit additional gain-of-function effects. Concordantly, tu-
mors are observed at a younger age in LFS family members
with mutations exhibiting high in vivo enrichment scores (in
HCT116 xenografts) than in those bearing mutations that were
depleted from mouse tumors (Figure 6C; Mann-Whitney
U, p < 0.01).
The V217M SNP Affects the Phenotypic Outcome ofMissense p53 MutationsFinally, we took advantage of our assay to evaluate the signifi-
cance of SNPs within the p53 DBD. Although highly conserved,
the DBD nevertheless harbors several polymorphic variations.
For example, V217M (rs35163653, resulting from a G > A transi-
tion), a non-synonymous validated SNP (Whibley et al., 2009),
has been functionally studied in yeast, where it induced elevated
expression of CDKN1A, BAX, and NOXA (Kato et al., 2003), and
in human cells, where its transcriptional signature was indistin-
guishable from that of wtp53 (Wang et al., 2014). Another rare
polymorphism within the DBD is R213R (rs1800372), which is
caused by a synonymous A > G transition in exon 6. So far, these
SNPs have not been associated with cancer risk (Ganci et al.,
2011; Pilger et al., 2007; Sharma et al., 2014). Nevertheless, in
the presence of secondary acquired mutations, these SNPs
may affect cancer predisposition or aggressiveness. In search
for combinatorial effects, we combined these SNPs with all sin-
gle-base mutations residing in sub-library ‘‘C.’’ Interestingly,
while on both backgrounds nonsense and frameshift mutations
yielded a similar complete loss of p53 functionality, the effects
of missense mutations were found to largely depend on genetic
background (Figure 7): while the R213R background slightly
enhanced p53 functionality, the V217M background rendered
the acquisition of ‘‘mild’’ missense mutations more disruptive
to p53 function (higher RFS on SNP background relative to WT
background). These results exemplify the importance of back-
ground (asymptomatic) coding sequence polymorphisms in
shaping the outcome of cancer gene mutations, underscoring
the merit of personalized genetic analyses.
188 Molecular Cell 71, 178–190, July 5, 2018
DISCUSSION
Our findings provide a first comprehensive catalogue for the func-
tional consequences of thousands of p53 DBD mutations in hu-
mancells, and theypotentially hold important clinical implications.
Our cell-based in vitro and in vivomeasurements are highly indic-
ative of the functional outcome of p53 mutations. Thus, tumor-
associated p53 mutations retaining wtp53-like anti-proliferative
functionality are rather unlikely to be driver mutations. In addition,
our observations highlight the importance of direct measurement
of mutation impact to determine the outcome of VUS and justify
large-scale systematic scans aimed to broaden our understand-
ing of mutation-driven phenotypic landscapes.
Of note, our assay quantifies the relative competitive advan-
tage of cells that are fully identical to each other except for the
presence of different p53 mutations. Undoubtedly, the compet-
itive forces that operate during tumor progression are much
more complex, encompassing cells that share the same TP53
mutation but differ in other aspects as well as a plethora of
non-cell-autonomous effects of mutp53. Nevertheless, the fact
that our relative fitness landscape is highly similar to the actual
distribution of cancer-associated p53 mutants argues that we
are able to capture an important determinant of the in vivo
advantage conferred by TP53 mutations.
Conceivably, p53 mutations that retain wtp53-like function-
ality under specific conditions may nevertheless endow can-
cer-supportive phenotypes in a context-dependent manner.
However, the high correlation of mutation phenotypic outcomes
across cell types—and their concordance with human mutation
prevalence, structural motifs, and evolutionary conservation—
argues that biochemical features underpinning the anti-prolifer-
ative effects of p53 in this model are also seminal for its tumor
suppressor activity as well as for its primordial biological func-
tions. Furthermore, our results stress the context dependence
of mutp53 GOF activity; while we did not observe a proliferative
advantage for hotspot p53mutations in vitro, these variants were
significantly enriched in heterotopic mouse tumors, providing an

additional explanation for their high prevalence in human can-
cers. The fact that a similar enrichment was not observed in a
3D culture setting suggests that some factors or selective pres-
sures that act in vivo were absent in both 2D and 3D cell culture
models. These may include (but are not limited to) variable levels
of nutrients such as glucose or essential amino acids, hypoxic
conditions, or other metabolic factors. Plausibly, in an actual
tumor microenvironment which involves interactions with the
immune system and with additional factors, the variant-specific
effects of p53 mutations might be further modified or
augmented. Future studies should further expand our under-
standing of context-dependent mutational effects.
STAR+METHODS
Detailed methods are provided in the online version of this paper
and include the following:
d KEY RESOURCES TABLE
d CONTACT FOR REAGENT AND RESOURCE SHARING
d EXPERIMENTAL MODEL AND SUBJECT DETAILS
B Cell culture
B Animal models
d METHOD DETAILS
B Plasmids
B Quantitative real-time PCR (qPCR)
B Western blot
B Library synthesis and amplification
B Construction of backbone plasmids
B Library cloning into master plasmids
B Lentivirus production and infections
B Sample preparation for sequencing
B In vivo assays
B Genomic DNA extraction from mouse tumors
B 3D culture relative proliferation assay
B Deep sequencing
d QUANTIFICATION AND STATISTICAL ANALYSIS
B Computational analysis
B Mutation prevalence and RFS prediction models
B Statistical analyses
d DATA AND SOFTWARE AVAILABILITY
B Data Resources
SUPPLEMENTAL INFORMATION
Supplemental Information includes seven figures and seven tables and can be
found with this article online at https://doi.org/10.1016/j.molcel.2018.06.012.
ACKNOWLEDGEMENTS
We thank Shira Weingarten-Gabbay, David Zeevi, Michal Levo, Leeat Keren,
Noa Furth, Yael Aylon, and Adina Weinberger for fruitful discussions and valu-
able inputs. We gratefully acknowledge Zohar Yakhini for help with library syn-
thesis, N. Rahm and A. Telenti for the lentiviral bicistronic constructs, Karen
Vousden for providing p53-knockout HCT116 cells, Jonathan Weinstein for
help with structural models, and Yoav Peleg for cloning assistance. This
work was supported by grants from the European Research Council
(614504, to E.S.) and from the Dr. Miriam and Sheldon G. Adelson Medical
Research Foundation (119494) and by a Center of Excellence grant (1779/
11) from the Israel Science Foundation (to M.O.).
AUTHOR CONTRIBUTIONS
E.K. conceived the project, devised the experiments, designed the synthetic
library, performed experiments, analyzed the data, and wrote the manuscript;
G.G. performed experiments; E.K., O.S., and M.L.-P. cloned the libraries;
T.A.H. and D.S.M. performed analyses; O.T. and A.G. performed in vivo exper-
iments; E.S. and M.O. conceived the project and experiments, supervised the
work, and wrote the manuscript.
DECLARATION OF INTERESTS
The authors declare no competing interests.
Received: December 16, 2017
Revised: March 23, 2018
Accepted: June 6, 2018
Published: June 21, 2018; corrected online: August 13, 2018
REFERENCES:
Ashkenazy, H., Abadi, S., Martz, E., Chay, O., Mayrose, I., Pupko, T., and Ben-
Tal, N. (2016). ConSurf 2016: an improved methodology to estimate and visu-
alize evolutionary conservation in macromolecules. Nucleic Acids Res. 44
(W1), W344–W350.
Baker, S.J., Markowitz, S., Fearon, E.R., Willson, J.K., and Vogelstein, B.
(1990). Suppression of human colorectal carcinoma cell growth by wild-type
p53. Science 249, 912–915.
Bieging, K.T., Mello, S.S., and Attardi, L.D. (2014). Unravelling mechanisms of
p53-mediated tumour suppression. Nat. Rev. Cancer 14, 359–370.
Blecher-Gonen, R., Barnett-Itzhaki, Z., Jaitin, D., Amann-Zalcenstein, D.,
Lara-Astiaso, D., and Amit, I. (2013). High-throughput chromatin immunopre-
cipitation for genome-wide mapping of in vivo protein-DNA interactions and
epigenomic states. Nat. Protoc. 8, 539–554.
Blons, H., and Laurent-Puig, P. (2003). TP53 and head and neck neoplasms.
Hum. Mutat. 21, 252–257.
Bouaoun, L., Sonkin, D., Ardin, M., Hollstein, M., Byrnes, G., Zavadil, J., and
Olivier, M. (2016). TP53 Variations in Human Cancers: New Lessons from
the IARC TP53 Database and Genomics Data. Hum. Mutat. 37, 865–876.
Brenan, L., Andreev, A., Cohen, O., Pantel, S., Kamburov, A., Cacchiarelli, D.,
Persky, N.S., Zhu, C., Bagul, M., Goetz, E.M., et al. (2016). Phenotypic
Characterization of a Comprehensive Set of MAPK1/ERK2 Missense
Mutants. Cell Rep. 17, 1171–1183.
Brosh, R., and Rotter, V. (2009). When mutants gain new powers: news from
the mutant p53 field. Nat. Rev. Cancer 9, 701–713.
Bullock, A.N., Henckel, J., DeDecker, B.S., Johnson, C.M., Nikolova, P.V.,
Proctor, M.R., Lane, D.P., and Fersht, A.R. (1997). Thermodynamic stability
of wild-type and mutant p53 core domain. Proc. Natl. Acad. Sci. USA 94,
14338–14342.
Cleary, M.A., Kilian, K., Wang, Y., Bradshaw, J., Cavet, G., Ge,W., Kulkarni, A.,
Paddison, P.J., Chang, K., Sheth, N., et al. (2004). Production of complex
nucleic acid libraries using highly parallel in situ oligonucleotide synthesis.
Nat. Methods 1, 241–248.
Duan, J., andNilsson, L. (2006). Effect of Zn2+ onDNA recognition and stability
of the p53 DNA-binding domain. Biochemistry 45, 7483–7492.
Fowler, D.M., and Fields, S. (2014). Deep mutational scanning: a new style of
protein science. Nat. Methods 11, 801–807.
Freed-Pastor, W.A., Mizuno, H., Zhao, X., Langerød, A., Moon, S.H.,
Rodriguez-Barrueco, R., Barsotti, A., Chicas, A., Li, W., Polotskaia, A., et al.
(2012). Mutant p53 disrupts mammary tissue architecture via the mevalonate
pathway. Cell 148, 244–258.
Ganci, F., Conti, S., Fontemaggi, G., Manciocco, V., Donzelli, S., Covello, R.,
Muti, P., Strano, S., Blandino, G., and Spriano, G. (2011). Allelic expression
imbalance of TP53 mutated and polymorphic alleles in head and neck tumors.
OMICS 15, 375–381.
Molecular Cell 71, 178–190, July 5, 2018 189

Geiser, M., Cebe, R., Drewello, D., and Schmitz, R. (2001). Integration of PCR
fragments at any specific site within cloning vectors without the use of restric-
tion enzymes and DNA ligase. Biotechniques 31, 88–90, 92.
Hoffman, Y., Bublik, D.R., Pilpel, Y., and Oren, M. (2014). miR-661 downregu-
lates both Mdm2 and Mdm4 to activate p53. Cell Death Differ. 21, 302–309.
Hopf, T.A., Ingraham, J.B., Poelwijk, F.J., Sch€arfe, C.P., Springer, M., Sander,
C., and Marks, D.S. (2017). Mutation effects predicted from sequence co-vari-
ation. Nat. Biotechnol. 35, 128–135.
Iacopetta, B. (2003). TP53 mutation in colorectal cancer. Hum. Mutat. 21,
271–276.
Iwanicki, M.P., Chen, H.Y., Iavarone, C., Zervantonakis, I.K., Muranen, T.,
Novak, M., Ince, T.A., Drapkin, R., and Brugge, J.S. (2016). Mutant p53 regu-
lates ovarian cancer transformed phenotypes through autocrine matrix depo-
sition. JCI Insight 1, e86829.
Kakudo, Y., Shibata, H., Otsuka, K., Kato, S., and Ishioka, C. (2005). Lack of
correlation between p53-dependent transcriptional activity and the ability to
induce apoptosis among 179 mutant p53s. Cancer Res. 65, 2108–2114.
Kandoth, C., McLellan, M.D., Vandin, F., Ye, K., Niu, B., Lu, C., Xie, M., Zhang,
Q., McMichael, J.F., Wyczalkowski, M.A., et al. (2013). Mutational landscape
and significance across 12 major cancer types. Nature 502, 333–339.
Kato, S., Han, S.Y., Liu, W., Otsuka, K., Shibata, H., Kanamaru, R., and Ishioka,
C. (2003). Understanding the function-structure and function-mutation rela-
tionships of p53 tumor suppressor protein by high-resolution missense muta-
tion analysis. Proc. Natl. Acad. Sci. USA 100, 8424–8429.
Kazadi, K., Loeuillet, C., Deutsch, S., Ciuffi, A., Munoz, M., Beckmann, J.S.,
Moradpour, D., Antonarakis, S.E., and Telenti, A. (2008). Genomic determi-
nants of the efficiency of internal ribosomal entry sites of viral and cellular
origin. Nucleic Acids Res. 36, 6918–6925.
Keren, L., Hausser, J., Lotan-Pompan, M., Vainberg Slutskin, I., Alisar, H.,
Kaminski, S., Weinberger, A., Alon, U., Milo, R., and Segal, E. (2016).
Massively parallel interrogation of the effects of gene expression levels on
fitness. Cell 166, 1282–1294.e1218.
Kitzman, J.O., Starita, L.M., Lo, R.S., Fields, S., and Shendure, J. (2015).
Massively parallel single-amino-acid mutagenesis. Nat Methods 12, 203–
206.e204. https://www.ncbi.nlm.nih.gov/entrez/query.fcgi?cmd=Retrieve&db=
PubMed&list_uids=18978018&dopt=Abstract.
LeProust, E.M., Peck, B.J., Spirin, K., McCuen, H.B., Moore, B., Namsaraev,
E., and Caruthers, M.H. (2010). Synthesis of high-quality libraries of long
(150mer) oligonucleotides by a novel depurination controlled process.
Nucleic Acids Res. 38, 2522–2540.
Levine, A.J., and Oren, M. (2009). The first 30 years of p53: growing ever more
complex. Nat. Rev. Cancer 9, 749–758.
Li, F.P., Fraumeni, J.F., Jr., Mulvihill, J.J., Blattner, W.A., Dreyfus, M.G.,
Tucker, M.A., and Miller, R.W. (1988). A cancer family syndrome in twenty-
four kindreds. Cancer Res. 48, 5358–5362.
Majithia, A.R., Tsuda, B., Agostini, M., Gnanapradeepan, K., Rice, R., Peloso,
G., Patel, K.A., Zhang, X., Broekema, M.F., Patterson, N., et al.; UKMonogenic
Diabetes Consortium; Myocardial Infarction Genetics Consortium; UK
Congenital Lipodystrophy Consortium (2016). Prospective functional classifi-
cation of all possible missense variants in PPARG. Nat. Genet. 48, 1570–1575.
Malkin, D., Li, F.P., Strong, L.C., Fraumeni, J.F., Jr., Nelson, C.E., Kim, D.H.,
Kassel, J., Gryka, M.A., Bischoff, F.Z., Tainsky, M.A., et al. (1990). Germ line
p53 mutations in a familial syndrome of breast cancer, sarcomas, and other
neoplasms. Science 250, 1233–1238.
Martin, P., Albagli, O., Poggi, M.C., Boulukos, K.E., and Pognonec, P. (2006).
Development of a new bicistronic retroviral vector with strong IRES activity.
BMC Biotechnol. 6, 4.
Menendez, D., Inga, A., and Resnick, M.A. (2006). The biological impact of the
human master regulator p53 can be altered by mutations that change the
spectrum and expression of its target genes. Mol. Cell. Biol. 26, 2297–2308.
Olivier, M., and Taniere, P. (2011). Somatic mutations in cancer prognosis and
prediction: lessons from TP53 and EGFR genes. Curr. Opin. Oncol. 23, 88–92.
190 Molecular Cell 71, 178–190, July 5, 2018
Olivier, M., Hollstein, M., and Hainaut, P. (2010). TP53mutations in human can-
cers: origins, consequences, and clinical use. Cold Spring Harb. Perspect.
Biol. 2, a001008.
Oren, M., and Rotter, V. (2010). Mutant p53 gain-of-function in cancer. Cold
Spring Harb. Perspect. Biol. 2, a001107.
Ory, K., Legros, Y., Auguin, C., and Soussi, T. (1994). Analysis of the most
representative tumour-derived p53 mutants reveals that changes in protein
conformation are not correlated with loss of transactivation or inhibition of
cell proliferation. EMBO J. 13, 3496–3504.
Pedregosa, F., Varoquaux, G., Gramfort, A., Michel, V., Thirion, B., Grisel, O.,
Blondel, M., Prettenhofer, P., Weiss, R., Dubourg, V., et al. (2011). Scikit-learn:
Machine Learning in Python. J. Mach. Learn. Res. 12, 2825–2830.
Peller, S., and Rotter, V. (2003). TP53 in hematological cancer: low incidence of
mutations with significant clinical relevance. Hum. Mutat. 21, 277–284.
Pfister, N.T., and Prives, C. (2017). Transcriptional Regulation by Wild-Type
and Cancer-Related Mutant Forms of p53. Cold Spring Harb. Perspect.
Med. 7, a026054.
Pilger, D.A., Lopez, P.L., Segal, F., and Leistner-Segal, S. (2007). Analysis of
R213R and 13494 g–>a polymorphisms of the p53 gene in individuals with
esophagitis, intestinal metaplasia of the cardia and Barrett’s Esophagus
compared with a control group. Genomic Med. 1, 57–63.
Resnick, M.A., and Inga, A. (2003). Functional mutants of the sequence-spe-
cific transcription factor p53 and implications for master genes of diversity.
Proc. Natl. Acad. Sci. USA 100, 9934–9939.
Riley, T., Sontag, E., Chen, P., and Levine, A. (2008). Transcriptional control of
human p53-regulated genes. Nat. Rev. Mol. Cell Biol. 9, 402–412.
Sander, C., and Schneider, R. (1991). Database of homology-derived protein
structures and the structuralmeaning of sequence alignment. Proteins 9, 56–68.
Schuijer, M., and Berns, E.M. (2003). TP53 and ovarian cancer. Hum. Mutat.
21, 285–291.
Sharma, S., Sambyal, V., Guleria, K., Manjari, M., Sudan, M., Uppal, M.S.,
Singh, N.R., Bansal, D., andGupta, A. (2014). TP53 polymorphisms in sporadic
North Indian breast cancer patients. Asian Pac. J. Cancer Prev. 15, 6871–6879.
Sharon, E., Kalma, Y., Sharp, A., Raveh-Sadka, T., Levo, M., Zeevi, D., Keren,
L., Yakhini, Z., Weinberger, A., and Segal, E. (2012). Inferring gene regulatory
logic from high-throughput measurements of thousands of systematically de-
signed promoters. Nat. Biotechnol. 30, 521–530.
Tewhey, R., Kotliar, D., Park, D.S., Liu, B., Winnicki, S., Reilly, S.K., Andersen,
K.G., Mikkelsen, T.S., Lander, E.S., Schaffner, S.F., and Sabeti, P.C. (2016).
Direct Identification of Hundreds of Expression-Modulating Variants using a
Multiplexed Reporter Assay. Cell 165, 1519–1529.
Toth-Petroczy, A., Palmedo, P., Ingraham, J., Hopf, T.A., Berger, B., Sander,
C., and Marks, D.S. (2016). Structured states of disordered proteins from
genomic sequences. Cell 167, 158–170.e112.
Ulirsch, J.C., Nandakumar, S.K., Wang, L., Giani, F.C., Zhang, X., Rogov, P.,
Melnikov, A., McDonel, P., Do, R., Mikkelsen, T.S., and Sankaran, V.G.
(2016). Systematic Functional Dissection of Common Genetic Variation
Affecting Red Blood Cell Traits. Cell 165, 1530–1545.
Unger, T., Jacobovitch, Y., Dantes, A., Bernheim, R., and Peleg, Y. (2010).
Applications of the Restriction Free (RF) cloning procedure for molecular ma-
nipulations and protein expression. J. Struct. Biol. 172, 34–44.
Wang, B., Niu, D., Lam, T.H., Xiao, Z., and Ren, E.C. (2014). Mapping the p53
transcriptome universe using p53 natural polymorphs. Cell Death Differ. 21,
521–532.
Weingarten-Gabbay, S., Elias-Kirma, S., Nir, R., Gritsenko, A.A., Stern-
Ginossar, N., Yakhini, Z., Weinberger, A., and Segal, E. (2016). Comparative
genetics. Systematic discovery of cap-independent translation sequences in
human and viral genomes. Science 351, aad4939.
Weisz, L., Oren, M., and Rotter, V. (2007). Transcription regulation by mutant
p53. Oncogene 26, 2202–2211.
Whibley, C., Pharoah, P.D., and Hollstein, M. (2009). p53 polymorphisms: can-
cer implications. Nat. Rev. Cancer 9, 95–107.
STAR+METHODS
KEY RESOURCES TABLE
REAGENT or RESOURCE SOURCE IDENTIFIER
Antibodies
Mouse anti-p53: PAb1801 Kind gift from David Lane N/A
Mouse anti-p53: DO-1 Kind gift from David Lane N/A
Mouse anti-vinculin Sigma-Aldrich Cat#V9131; RRID: AB_477629
Critical Commercial Assays
Herculase II Fusion DNA polymerase Agilent Technologies Cat#600675
Phusion DNA polymerase NEW ENGLAND BioLabs Inc. Cat#M0530
T4 ligase NEW ENGLAND BioLabs Inc. Cat#M0202
CpoI (RsrII) restriction enzyme Thermo Scientific Cat#ER0741
SgsI (AscI) restriction enzyme Thermo Scientific Cat# ER1891
BamHI restriction enzyme NEW ENGLAND BioLabs Inc. Cat#R0136
NotI restriction enzyme NEW ENGLAND BioLabs Inc. Cat#R0189
DpnI restriction enzyme NEW ENGLAND BioLabs Inc. Cat#R0176
FastAP Alkaline Phosphatase Thermo Scientific Cat# EF0651
E. cloni 10G electro-competent cells Lucigen Cat#LC-60117-2
Electroporation Cuvettes, 0.1 cm gap Bio-Rad Cat#1652083
KAPA HiFi Hot Start Ready Mix PCR Kit Novagen Cat#KK2601
SPRI beads Agencourt AMPure XP Beckman Coulter Cat#A63881
T4 Polynucleotide Kinase - 2,500 units 10,000 units/ml NEW ENGLAND BioLabs Inc. Cat#M0201L
T4 DNA Polymerase - 750 units 3,000 units/ml NEW ENGLAND BioLabs Inc. Cat#M0203L
Klenow Fragment (3’-5’ exo-) - 1,000 units 5,000 units/ml NEW ENGLAND BioLabs Inc. Cat#M0212L
High Sensitivity D1000 ScreenTape Agilent Technologies Cat#5067-5584
Lambda Exonuclease Epicentre Cat#LE032K
Qubit dsDNA HS Assay kit, 500 Assays Invitrogen Cat#Q32854
NextSeq 500/550 Mid Output v2 kit (300 cycles) Illumina FC-404-2003
Miseq Reagent Micro Kit ,v2 (300 cycles) Illumina MS-103-1002
jetPEI DNA transfection reagent Polyplus Transfection Cat#101-10N
Polybrene Sigma Cat#AL-118
RNaseA Sigma Cat# R5500
GelStar Nucleic Acid Gel Stain 10,000x concentrate LONZA Cat#50535
Nucleospin Gel and PCR Clean-up kit MACHEREY-NAGEL Cat#740609
QIAquick PCR Purification Kit QIAGEN Cat#28104
MinElute PCR Purification Kit QIAGEN Cat#28004
DNeasy blood and tissue kit QIAGEN Cat#69504
Gel extraction kit QIAGEN Cat#28704
NucleoBond Xtra maxi kit MACHEREY-NAGEL Cat#740414
Plasmid DNA mini kit RBC BioScience Cat#YPD100
REDExtract-N-Amp PCR ready mix Sigma Cat#R4775
Fast SYBR Green Master Mix Thermo Scientific Cat#4385614
Spheroid microplate, 96-well, Ultra-low attachment Corning Cat#4515
CellCarrier spheroid plates, 96-well, Ultra-low attachment PerkinElmer Cat#6055330
(Continued on next page)
Molecular Cell 71, 178–190.e1–e8, July 5, 2018 e1

Continued
REAGENT or RESOURCE SOURCE IDENTIFIER
Deposited Data
Raw data files for DNA sequencing NCBI Gene Expression Omnibus GEO: GSE115072
Microscopy images of growing spheroids Mendeley data https://doi.org/10.17632/
zp64zv5bf3.1
Experimental Models: Cell Lines
Human: 293T cells ATCC CRL-3216; RRID: CVCL_0063
Human: H1299 cells ATCC CRL-5803; RRID: CVCL_0060
Human: HCT116 p53 CRISPR Knock out cells Kind gift from Karen Vousden N/A
Experimental Models: Organisms/Strains
Mouse: Hsd: Athymic Nude-Foxn1nu Harlan Biotech RRID: MGI: 5652489
Oligonucleotides
Full list of primers is presented in Table S1
Recombinant DNA
pC53-SN3 (Baker et al., 1990) N/A
pPRIG-Hd-HA-Red (Martin et al., 2006) N/A
pEF1_EMCV_ (pSIN.EF1.cPPT.mRFP.IRESEMCV.eGFP.WPRE) (Kazadi et al., 2008) N/A
pMDL helper plasmid for lentiviral packaging Lab of Sima Lev (Wiezmann Institute) N/A
pVSV-G helper plasmid for lentiviral packaging Lab of Sima Lev (Wiezmann Institute) N/A
pRSV-Rev helper plasmid for lentiviral packaging Lab of Sima Lev (Wiezmann Institute) N/A
Software and Algorithms
Data analysis was performed using Python 2.7, Pandas, SciPy,
NumPy and Scikitlearn
ConSurf (Ashkenazy et al., 2016)
EVmutation (Hopf et al., 2017)
CONTACT FOR REAGENT AND RESOURCE SHARING
Further information and requests for resources and reagents should be directed to and will be fulfilled by the Lead Contact Moshe
Oren ([email protected]) in accordance with the Weizmann Institute of Science’s material transfer agreement (MTA).
EXPERIMENTAL MODEL AND SUBJECT DETAILS
Cell cultureHuman embryonic kidney cells 293T (HEK 293T) were cultured in Dulbecco’s modified Eagle’s medium (Biological Industries, Beit-
Haemek, Israel (BI)) supplemented with 10% heat-inactivated fetal bovine serum (HI-FBS, BI) and 1% penicillin and streptomycin
(P.S., BI). H1299 human lung carcinoma cells were cultured in RPMI1640 medium (BI), supplemented with 10% HI-FBS and 1%
P.S (BI). p53 CRISPR knock-out HCT116 human colorectal carcinoma cells were a kind gift from Prof. Karen Vousden. These cells
were cultured inMcCoy 5Amedium, supplemented with 10%HI-FBS, 1%L-Glutamine 200mM (BI) and 1%P.S. All cells were kept at
37�C in a humidified atmosphere containing 5% CO2 and were frozen in freezing medium (90% HI-FBS + 10% dimethyl sulfoxide
(DMSO, Sigma). Trypsin-EDTA solution C (BI) was used to detach cells from culture dishes.
Animal modelsProcedures involving animals were approved by the Animal Ethics Committee of the Weizmann Institute (Institutional Animal Care
and Use Committee number 35960617-1) and conformed to the guidelines of the Israel Council for Experiments in Animals. Athymic
nude male mice (Hsd: Athymic Nude-Foxn1nu) were ordered from Harlan Biotech. At time of injection, mice were 8-10 weeks old.
METHOD DETAILS
PlasmidsThe pPRIG plasmid (pPRIG-Hd-HA-Red (Martin et al., 2006)) was kindly provided by the Pognonec lab (Universite de Nice Sophia
Antipolis, Nice, France). pEF1_EMCV_ (pSIN.EF1.cPPT.mRFP.IRESEMCV.eGFP.WPRE (Kazadi et al., 2008)) was a gift from A.
e2 Molecular Cell 71, 178–190.e1–e8, July 5, 2018

Telenti (The Institute of Microbiology of the University Hospital Center, Lausanne, Switzerland). pMDL, pVSV-G, and pRSV-Rev
helper plasmids for lentivirus packaging were kindly provided by S. Lev (Weizmann Institute of Science, Israel).
Quantitative real-time PCR (qPCR)DNA was purified using DNeasy blood and tissue kit (Qiagen) and qPCR was performed on a StepOne real-time PCR machine
(Applied Biosystems) using SYBR Green PCR master mix (Thermo Scientific). Standard curve values for each amplicon were
measured and the relative quantity in each sample was normalized to an intergenic region upstream of the KCNA4 gene. The
following primers used to assess the relative abundance of p53-positive cells: Fw- CTGTGCAGCTGTGGGTTGATTC and Rv-
CCAAATACTCCACACGCAAATTTC, and for the intergenic normalization region: Fw- TTTTTCCCCATCTGTTGGCT and Rv-
TCTCCAGCTCTGCAACAACCT.
Western blotImmunoblot analysis was performed as previously described (Hoffman et al., 2014). Antibodies used were: p53 (mixture of DO1 +
PAb1801); vinculin (Sigma).
Library synthesis and amplificationInitial library synthesis and amplification were based on a protocol previously used for yeast promoter libraries(Sharon et al., 2012).
Pools of fully-designed �200-residue long single-stranded DNA oligonucleotides were obtained from Agilent Technologies (Santa
Clara, CA). To achieve accurate mutagenesis of the entire DBD (573bp long, total of 9,833 sequence variants), the complete library
is composed of 4 sub-libraries, each covering a different 141-144bp fragment of the DBD (‘‘DBD-A’’ covers residues 102-149,
‘‘DBD-B’’: 150-197, ‘‘DBD-C’’: 198-245, and ‘‘DBD-D’’: 246-292). Each modified segment contains common wtp53-homologous
sequences (at least 20 nucleotides long) at both ends, to enable initial PCR amplification and restriction-free (RF) cloning into the
vector (described below). To avoid non-specific concatamerization due to overlapping sequences, these 4 sub-libraries were
obtained in two separate pools, each covering sequence variations in non-overlapping sub-fragments: parts A & C together (203
nucleotides-long), and parts B & D together (197 nucleotides-long).
Libraries were synthesized using Agilent’s on-array synthesis technology (Cleary et al., 2004; LeProust et al., 2010), and provided
as DNA oligo pools in two separate tubes (10pmol). Each pool was dissolved in 200ml Tris-ethylenediaminetetraacetic acid (Tris-
EDTA), creating solutions of 3.35 and 3.25 ng/ml of A&C and of B&D, respectively. An aliquot of each library was diluted (1:100
and 1:50 dilutions for A&C and B&D, respectively), and used as template for PCR amplification of each of the 4 sub-libraries. To
reduce PCR bias, 24 identical reactions were performed in parallel for each sub-library. Each 50ml reaction tube contained 5ml of
library template, 10ml of 53Herculase II reaction buffer, 5ml of 2.5mM deoxynucleotide triphosphate (dNTPs) each, 10ml of 10mM
forward (Fw) primer, 10ml of 10mM reverse (Rv) primer and 2ml HerculaseII fusion DNA polymerase (Agilent Technologies,
#600679). PCR parameters used were: 95�C for 1 min, 14 cycles of 95�C for 20s, and 68�C for 80s, each, and finally one cycle of
68�C for 4min. Primers used:
DBD-A Fw- TGTCATCTTCTGTCCCTTCCCAGAAA, Rv-ATGGCGCGGACGCGGGT; DBD-B Fw-CTGTGCAGCTGTGGGTTG
ATTC, Rv-CCAAATACTCCACACGCAAATTTC; DBD-C Fw-CCCTCCTCAGCATCTTATCCGAGT, Rv-AGGATGGGCCTCCGGTT;
DBD-D Fw-TGTGTAACAGTTCCTGCATGGG, Rv-GCAGCTCGTGGTGAGGCT. Products from all 24 identical reactions were pooled
together and separated from non-specific fragments by electrophoresis on a 2.5% agarose gel stained with GelStar (LONZA),
extracted from the gel, and purified using a gel extraction kit (Nucleospin).
Construction of backbone plasmidsAs a cloning intermediate for efficient insertion of the libraries into plasmids, we used a pPRIG-wtp53-EMCV-EGFP backbone
(�6.5kb) created by substituting the dsRed sequence of pPRIG-Hd-HA-Red(Martin et al., 2006) with wtp53 coding sequence.
Thus, we PCR-amplified a wtp53 coding sequence from pC53-SN3(Baker et al., 1990) using the primers Fw- GATGTCATGGATC
CATGGAGGAGCCGCAGTC and Rv-GTACTGATGCGGCCGCTCAGTCTGAGTCAGGCCCTTC adding 5’ BamHI and 3’ NotI restric-
tion sites. PCR was performed using Kapa HiFi Polymerase (KAPA Biosystems). Products were purified using a PCR purification kit
(Qiagen), digested with BamHI and NotI (New England Biolabs, NEB) for 75min at 37�C. 4mg of pPRIG-dsRed-EMCV-EGFP were
digested with BamHI and NotI (NEB) for 1h at 37C to remove the dsRed sequence. Digested amplicon and plasmid were separated
from nonspecific fragments by electrophoresis on a 1%agarose gel using a gel extraction kit (Nucleospin), and ligated using T4 ligase
(NEB) for 2h at 24�C. Ligated plasmids were transformed into Escherichia coli (HIT-DH5a, RBC Bioscience) by heat shock, positive
colonies were grown in Luria broth (LB) media, and the plasmids were purified using a plasmid mini-kit (RBC BioScience).
For cloning of the p53 libraries into lentiviral vectors, we first cloned a pEF1a-wtp53-EMCV-EGFP master plasmid by substituting
the mRFP sequence of pEF1_EMCV_ (Kazadi et al., 2008) with a wtp53 sequence using restriction-free (RF) cloning (Unger et al.,
2010). Thus, the wtp53 coding sequence was amplified by PCR from pC53-SN3 (Baker et al., 1990) using Kapa HiFi Polymerase
(KAPA Biosystems) with primers adding restriction sites (5’ AscI, 3’ RsrII) and flanking sequences that are homologous to the
pEF1a plasmid on both sides of the mRFP sequence (Fw-CTAGCCTCGAGGTTTAAACGGTACCGGCGCGCCCACTGCCATGGAG
GAGCCGCAGTCAGATC, Rv-GGGGGGGCGGAATCCTCAGGCTAGTCGGTCCGGACAATCGCCATGTCAACGCGTGAATGTCAG
TCTGAGTCAGGCCCTTCTG). The product was purified using PCR purification kit (Qiagen), and used as a mega-primer for
Molecular Cell 71, 178–190.e1–e8, July 5, 2018 e3

cloning into pEF1a plasmid. The RF reaction was carried out using 1ml Phusion DNA polymerase and 10ml Phusion buffer (NEB), 1ml
dNTPs (10mM), 2.5ml DMSO, 40ng template plasmid and 200ng of the mega-primer. 30 PCR cycles were performed (95�C for 30s,
60�C for 60s, 72�C for 8 min.) followed by a final elongation step of 10 min. at 72�C. To digest remaining non-amplified plasmids, 1ml
DpnI (NEB) was added to the reaction and following a 2hr incubation at 37�C, products were used for bacterial transformation as
described above. Single colonies were picked and sequenced (Sanger sequencing at the Weizmann institute’s Life Sciences
Core Facilities) for validation of the entire wtp53 sequence.
Library cloning into master plasmidsPurified amplified library fragments were used as large PCR primers for amplification of the entire vector in a RF cloning reaction(Ge-
iser et al., 2001; Unger et al., 2010) so that each sub-library replaces the equivalent part of the wtp53 DBD sequence within the target
(pPRIG) plasmid (Step 1). pPRIG-cloned libraries (each sub-library as a separate pool) were then transferred to the pEF1a lentiviral
vector by conventional restriction-ligation cloning of the p53 variants (Step 2).
In Step 1, 50ml RF reactionswere carried out using 1ml Phusion DNA polymerase and 10ml Phusion buffer (NEB), 1ml dNTPs (10mM),
2.5ml DMSO, 20ng template plasmid and 10ml of gel-purified library amplicons. 30 PCR cycles were performed (95�C for 30s, 60�C for
60s, 72�C for 5min.) followed by a final elongation step of 7min. at 72�C. To digest remaining non-amplified plasmids (wtp53), 12ml
from each product were incubated with 1.2ul Dpn1 (NEB) for 2hr at 37�C. Then, an additional 1.2ul Dpn1 were added and samples
were incubated for another 2hr at 37�C.RF products were purified using PCR purification kit (Qiagen) and transformed into E. cloni 10G electro-competent cells (Lucigen).
Each bacteria tube was divided into seven aliquots (25ml each) for electroporation with 2ml of plasmids using 0.1cm gap cuvettes
(Biorad) according to the manufacturer’s protocol. All transformation tubes from each sub-library were pooled together and seeded
on LB agar (200 mg/ml ampicillin) 15cm plates. 16 hours after transformation, to ensure adequate preservation of library complexity,
we collected a total of 73000, 76500, 113500 and 122300 colonies, representing a sampling of 44-, 44-, 38- and 35-fold over de-
signed library sizes of sub-libraries A, B, C and D, respectively. To assess the percentage of remaining wtp53 (vector-only) colonies,
RF no-insert control reactions were performed in parallel, replacing library amplicons with 10ul water. Following Dpn1 digestion and
transformation, the percentage of remaining wtp53 colonies was assessed. For validation of RF products, we performed colony PCR
on 24 random colonies from each sub-library. Each reaction was performed in 20ml and contained a colony picked from the plate, 8ml
of double distilled water (DDW), 10ml of REDExtract-N-Amp PCR ready mix (Sigma) and 1ml of each primer (Fw- GAGCCGCAGTCAG
ATCCTAG; Rv- GCAGCTCGTGGTGAGGCT). Collected colonies were scraped from plates into LB medium, and pooled plasmids
were purified using a NucleoBond Xtra maxi kit (Macherey Nagel).
For Step 2, we PCR amplified each p53 sub-library from the intermediate pPRIG plasmids (Step 1 products) using primers that
add restriction sites (5’ AscI, 3’ RsrII) for ligation into the pEF1a vector (Fw-ACGGTACCGGCGCGCCCACTGCCATGGAGGAGCCGC
AGTCAGATC; Rv-AGGCTAGTCGGTCCGGACAATCCAGATGTCAACGCGTGAATGTCAGTCTGAGTCAGGCCCTTCTG). To reduce
variant representation bias, for each sub-library we performed 14 identical PCR reactions using 25ml 2xKapa HiFi ready-mix
(KAPA Biosystems), 50ng of pPRIG-library template, 0.2uM from each primer and DDW to a final volume of 50ml. The parameters
for PCR were 95�C for 10 min, 9 cycles of 98�C for 30 sec, 68�C for 30 sec and 72�C for 1.5 min and a final elongation of 72�Cfor 5 min. The fourteen reactions were pooled together, purified using 3 QIAquick PCR purification columns (Qiagen), and products
were pooled again after the elution step. Purified amplicons were then digested with CpoI (RsrII, Catalog No. ER0741) and SgsI (AscI,
Catalog No. ER1891) (Thermo Fisher Scientific, Fermentas) restriction enzymes. Digestion reaction mixtures contained: 12 ml Fast
Digest buffer (Fermentas), 3mg of the purified library, 7.5ml CpoI, 2.4ml SgsI and DDW up to a total volume of 120ml. The mixture
was incubated for 2hr at 37 �C, followed by 20 min inactivation at 65�C. Target vector (pEF1a-wtp53-EMCV-EGFP) digestion was
performed using the same enzymes, in a reaction-mixture containing: 18ml Fast Digest buffer, 15mg of the plasmid library, 9ml of
each enzymes and DDW up to a total volume of 180ml. The mixture was divided into three tubes and incubated for 2.5 hours at
37�C, followed by 20 min inactivation at 65�C. Then, alkaline phosphatase (FastAP, Thermo Fisher Scientific) was added to each
tube (3ml of Fast AP buffer, 3ml of FastAP enzyme and DDW up to a total volume of 30ml). The mixture was incubated for an additional
30 min at 37�C, followed by 20 min inactivation at 65�C.Restriction-digested libraries and plasmid were separated by electrophoresis on a 1.5% agarose gel stained with ethidium
bromide. Fragments of the correct size were excised from the gel and samples were purified first using Qiagen Gel extraction kit
(cat #28704) and then with a Gel and PCR clean-up purification kit (NucleoSpin, cat #740609). Next, library-vector ligations were per-
formed using 1ml of Lucigen ligase, 10xLucigen buffer, molar ratio of 1:1 (vector: library) and DDW to a final volume of 10ml. Ligation
products were transformed into E.cloni (Lucigen) with 2ml of ligation mix, as described in Step 1, collecting a total of 2.75x10⁵,
1.53x10⁵, 3.57x10⁵ and 3.94x10⁵ colonies from libraries A, B, C and D, respectively. Colony PCRs were performed for validation
as described above, and plasmids were extracted using NecleoBond Xtra Maxi kit (cat #740414.10).
Cloning of the DBD-D mini-library was performed as described above for the large scale library, with a minimum of 4000 colonies
collected after each transformation step, to ensure adequate preservation of library complexity.
Lentivirus production and infectionsFor lentiviral packaging, 2.1x10⁶ HEK293T cells were seeded on 10cm plates pre-coated with poly-L-lysine 0.001% (Sigma),
incubated for 20 min, and washed three times with phosphate-buffered saline (PBS). 16hr later, cells were co-transfected with three
e4 Molecular Cell 71, 178–190.e1–e8, July 5, 2018

helper plasmids (5.2mg pMDL, 3.2mg pVSVG and 2mg pRSV-Rev) and 8mg of library-encoding plasmid. Transfections were performed
using jetPEI DNA transfection reagents (Polyplus Transfection) according to the manufacturer‘s instructions and medium was
replaced after 6-8hr. Virus containing medium was collected at 48 and 72hr post-transfection, filtered with 0.45-mm filters (Mercury),
aliquoted and stored at -80C.
To determine viral titer, 6x10⁵ H1299 cells were plated in 10cm dishes 16 hours prior to infection. A single aliquot from each viral
library was thawed at 370C, and serially diluted in RPMI1640. Diluted virus-containing medium was added to the plates in a final
volume of 5ml, supplemented with 8mg/ml polybrene (Sigma, AL-118). 8hr later, cells were washed three times with PBS, and fresh
RPMI1640 mediumwas added. 48hr post-infection, cells were harvested in trypsin, washed with PBS and the percent of EGFP-pos-
itive cells was determined for each virus dilution using a Guava EasyCyte flow cytometer (Merck Millipore). We computed the virus
dilution required for multiplicity of infection (MOI) of 0.1 and repeated the infection protocol accordingly in large scale. To maintain
variant representation and to control for lentiviral random genomic integration, the number of cells infected with each library was
planned according to the number of designed variants in that library (1665, 1743, 2974 and 3451 in libraries A, B, C and D, respec-
tively). Thus, we plated 6 x 10cmplates with 6x10⁵ H1299 cells 16hr prior to infectionwith each of libraries A andB, and 12 such plates
for infection with libraries C and D. A total of �3.6x10⁵ and �7.2x10⁵ cells were infected with each of libraries A & B, and C & D,
respectively, so that on average each designed sequence was independently integrated into >200 individual cells. The percentage
of infected cells was verified 48hr post-infection by flow cytometry as described above. Independent biological replications of H1299
time-course experiments were performed as described above, for libraries A and B. For HCT116 infections, titers were calibrated as
described for H1299 cells, and cells were plated on 8 x 10cmplates with 1.6x10⁶ cells/plate 16hr prior to infection. Cells were infected
with library D in low multiplicity (MOIz0.05). Infection of HCT116 cells with the mini-library was performed using 2 x 10cm plates as
above, at MOIz0.08.
Sample preparation for sequencingTo maintain the complexity of the input libraries, PCR reactions were carried out on a genomic DNA (gDNA) amount calculated to
contain an average of at least 200 copies of each variant included in the assayed library. Thus, at each time point along the time
course experiments, gDNA was purified from a minimum of 1x10⁷, 1.3x10⁷, 2.5x10⁷, and 2.5x10⁷ H1299 cells infected with libraries
A, B, C and D, respectively. gDNA was purified using DNeasy blood and tissue kit (Qiagen). For each measurement, a two-step
nested PCR was performed: First, the entire DBD region was amplified (performed identically for all 4 sub-libraries). Then, in each
experiment the relevant sub-library DBD fragment was amplified using primers specific to the modified region in that sub-library.
In the first step (performed in multiple tubes to include the required amount of gDNA), each reaction contained a total volume of
100ml with 10mg gDNA, 50ml of Kapa Hifi ready mix X2 (KAPA Biosystems) and 5ml of each (10mM) primer. The parameters for
PCR were 950C for 5min, 18 cycles of 94�C for 30s, 65�C for 30s, and 72�C for 30s, followed by one cycle of 72�C for 5 min. The
primers used for this reaction were CTGAAGACCCAGGTCCAGATGAAG (Fw) and GGAGAGGAGCTGGTGTTGTTGG (Rv). In the
second PCR step each reaction contained a total volume of 50ml with 2.5ml of the first PCR product (uncleaned), 25ml of Kapa Hifi
ready mix X2 (KAPA Biosystems) and 2.5ml of each (10mM) primer. The parameters for PCR were as in the first step, performing
24 cycles. Primers used for this reaction included 5 random nucleotides at their 5’-end to increase sequence complexity and facilitate
cluster calling during sequencing, and were specific for each of the 4 sub-libraries: sub-library A: Fw- NNNNNTGTCATC
TTCTGTCCCTTCCCAGAAA, Rv- NNNNNATGGCGCGGACGCGGGT; sub-library B: Fw-NNNNNCTGTGCAGCTGTGGGTTGATTC,
Rv-NNNNNCCAAATACTCCACACGCAAATTTC; sub-library C: Fw-NNNNNCCCTCCTCAGCATCTTATCCGAGT, Rv-NNNNNAGGA
TGGGCCTCCGGTT; sub-library D: Fw-NNNNNTGTGTAACAGTTCCTGCATGGG, Rv-NNNNNGCAGCTCGTGGTGAGGCT. Alterna-
tively, for sequencing runs including samples from various experiments or time points, this reaction was performed using alternatively
barcoded Fw primers, employed to barcode the different experimental samples. These primers included 3 random nucleotides at
their 5’ to increase sequence complexity, followed by a unique 4-nucleotide barcode (see Table S1 for sequences).
Amplicons were separated from nonspecific fragments by electrophoresis on a 1% agarose gel stained with EtBr, extracted from
the gel and purified using a gel purification kit (Nucleospin). Products were further cleaned using a MinElute PCR Purification kit
(Qiagen) and eluted in 12ul DDW. Concentration wasmeasured using amonochromator (Tecan i-control), and sample size and purity
were assessed by Tape-station using a high-sensitivity D1K screen tape (Agilent Technologies). 50ng DNAwere used for library prep-
aration for next-generation sequencing, specific Illumina adaptors were added, and DNAwas enriched by 14 amplification cycles by
a protocol adopted from Blecher-Gonen et al. (Blecher-Gonen et al., 2013). Samples were reanalyzed by Tape-station prior to
sequencing.
In vivo assays9 days post infection with lentiviruses expressing sub-library ‘‘D’’, 3x10⁶ EGFP-positive HCT116 cells were sorted using a Becton
Dickinson FACSAria III cytometer, expanded in culture for a week and frozen down. Thawed cells were then expanded for an addi-
tional week in culture and injected subcutaneously into the back of athymic nude mice. Each mouse was inoculated with a total of
2x10⁶ cells (suspended in 100ul PBS). At the time of injection, 50x106 cells were pelleted, their genomic DNA was purified as
described above to serve as a time-0 reference for enrichment.
Molecular Cell 71, 178–190.e1–e8, July 5, 2018 e5
Genomic DNA extraction from mouse tumorsPrimary tumors were dissectedmanually and flash-frozen in liquid nitrogen. Although eachmouse was injected in a single location, in
cases where more than a single clearly separated tumor was visible during dissection, each tumor was collected separately (labeled
‘T2a’, ‘T2b’, etc.). For DNA extraction, samples were thawed and divided to 2ml tubes each containing 25mg tissue. Genomic DNA
was extracted using DNeasy blood and tissue kit (Qiagen) according to the manufacturer’s protocol. For lysis, each sample was
suspended in 180ul ATL buffer and homogenized for 10 minutes in a Qiagen TissueLyser LT with a single 5mm stainless steel
bead (Qiagen). Following removal of the bead, 20ul proteinase K were added and samples were incubated for 1 hour at 56�C.Then, after samples cooled down to room temperature, they were supplemented with 4ul RNAse and incubated for 2 minutes at
RT. To avoid bias due to tumor heterogeneity, DNA from the entire tumor was purified. Thus, all lysates originating from the same
tumor were pooled together and purified using the kit’s columns and the manufacturer’s protocol. Amplicons of the DBD-D region
and Illumina library preparations were then prepared as described above.
3D culture relative proliferation assayTwenty days post-infection with lentiviruses expressing the mini-library (of sub-library ‘‘D’’), 1.3x10⁵ EGFP-positive HCT116 cells
were sorted using a Becton Dickinson FACSAria III cytometer, expanded in culture for a week and frozen down. Thawed cells
were then expanded for an additional week in culture, harvested in trypsin, filtered to create a single-cell suspension and seeded
in ultra-low adherence spheroid plates (1000 cells/well in 200ul McCoy culture media). To preserve library complexity, each exper-
imental replicate was composed of a 96-well plate, providing a factor of �1000-fold over the designed library size. A total of 4 rep-
licates were performed (two using Corning spheroid microplates and two using PerkinElmer Cell-Carrier spheroid plates). Spheroid
formation and expansion was monitored using a Nikon eclipse Ti-S microscope. In parallel to spheroid seeding, 1.5x10⁶ cells were
plated in each of two (regular) 10cm plates for 2D growth. At time of seeding, 107 cells were pelleted and their genomic DNA was
purified as described above to serve as a time-0 reference for enrichment. Spheroid plates were harvested at 7 and 9 days after seed-
ing (two plates at each time-point), pooling together all spheroids in each plate. At each of these time-points, 5x10⁶ cells were
sampled from each 2D-culture plate for comparison. DNA purification and sample preparation were performed as described above.
Deep sequencingAmplified DBD fragments were sequenced on an Illumina NextSeq-500 sequencer using NextSeq 500/550 Mid Output kits (300
cycles), producing paired-end reads in the length of 150nt. For time course measurements, we obtained a minimum of �3.5x10⁶
reads for each time point for libraries A-C and �8.5x10⁶ reads for library D (mean of �6.5x10⁶ reads per sample in libraries A and
B, and �9.5x10⁶ in C and D). Sequencing of 3D culture experiments (mini-library) was performed on an Illumina MiSeq desktop
sequencer using a MiSeq reagent kit (300 cycles) with a minimum of 200,000 reads per sample.
QUANTIFICATION AND STATISTICAL ANALYSIS
Computational analysisPaired-end reads weremerged using Usearch (http://www.drive5.com/usearch/) setting aminimal overlap of 80 andmerge length of
180-220. Merged reads in each sample were mapped to the library design, requiring a perfect sequence match, and the number of
reads corresponding to each sequence variant were counted. We required a minimal coverage of >200 reads for each sequence
variant at the first experimental time point. This stringent threshold, together with the large number of cells infected with each library
variant as described above, enabled to average out the effects of random lentivirus integration and reduce measurement noise.
�97% of the designed sequence variants (9,516 of 9,833) passed this threshold and were further used in the analysis.
As each of the 4 sub-libraries was measured separately, data in each sub-library was normalized according to the dynamics of
synonymous mutation variants, compared across all sub-libraries. Thus, for each sequence variant, we calculated the log
(base 2) fold-change (FC) at each time point and normalized the log-FC of all variants in each sub-library so that the mean log-FC
across synonymous variants (encoding a wtp53 amino acid sequence) in that sub-library will equal the mean log-FC of all synony-
mous variants (across all libraries).
The relative fitness (RFS) score for each variant was calculated as:
RFS=Median�Rt1;Rt2;Rt3
�
Where Rti is the relativeenrichment
depletionof the variant at time point ti :
rti represents the fraction of reads corresponding to a variant at the given time point (t1, t2 and t3, represent sampling at 6, 9 and
14 days post-infection, respectively.
e6 Molecular Cell 71, 178–190.e1–e8, July 5, 2018
Similarly, an in vivo enrichment score for each variant in each tumor was calculated by:
RiT = log2
�riTri0
�
where riT represents the fraction of reads corresponding to a variant (i) in tumor T, and ri0 represents the fraction of reads correspond-
ing to that variant at time 0 (i.e. at time of injection). We then calculated the median enrichment for each variant across all mouse
tumors. Only variants with high RFS scores in cultured HCT116 cells (R-0.5) were used in the in vivo analyses.
For the 3D culture experiment, enrichment scores for each variant in the mini-library in each sample (either in 2D or 3D culture) was
calculated by:
Rij = log2
�rijri0
�
where rij represents the fraction of reads corresponding to a variant (i) in sample j, and ri0 represents the fraction of reads correspond-
ing to that variant at time 0 (i.e. at time of seeding). Since variant enrichment scores within each growth condition were similarly corre-
lated regardless of their harvesting time at 7 or 9 days, we regarded each 4 samples from the same growth condition as replicates and
calculated the median enrichment for each variant in each growth condition (2D or 3D) across these replicates. Only missense
mutants with high RFS scores in cultured HCT116 cells (R-0.5) and for which an in vivo enrichment score was available were
used in the analysis.
The evolutionary conservation score (ECS) measures how conserved each position is in a multiple sequence alignment of the
protein family (Sander and Schneider, 1991). It is defined as the normalized entropy of the distribution of amino acid frequencies
fi in position i, i.e.
ECSðiÞ= 1+
Pa
fiðaÞlnðfiðaÞÞln q
and sums over all amino acid characters a in the alignment including the gap, and q=21. ECS(i) ranges from 0 (completely variable) to
1 (fully conserved). Amino acid frequencies were obtained from a sequence alignment of 1887 homologous sequences obtained by a
jackhmmer search against the UniRef100 sequence database (5 iterations, E-value threshold: 1E-01). To reduce sequence redun-
dancy when calculating the frequencies, the counts for each sequence were weighted by 1/m, where m is the number of sequences
in the alignment that are at least 80% identical (redundancy-reduced number of sequences: 246) (Hopf et al., 2017).
Relative evolutionary representation of amino acid residues was calculated using the ConSurf (Ashkenazy et al., 2016) tool using
default parameters (homologous sequences taken from UniRef90 database, and filtered for sequence homology ranging between
35-95%). Relative representation is defined as the percent out of the 150 examined species in which that particular amino acid is
present at a given position.
To predict the effects of individual amino acid substitutions from evolutionary sequences, a statistical model of the family sequence
alignment was inferred (Hopf et al., 2017). Since there is only limited evolutionary sequence diversity in the family alignment (redun-
dancy-reduced number of sequences: 246), we chose to infer a simple site-independent model rather than an epistatic model that
considers amino acid dependencies between pairs of positions, as described previously (Hopf et al., 2017). This choice is supported
by the observation that only 29 significant long-range evolutionary couplings between pairs of positions could be detected at a 90%
probability cutoff when inferring an epistatic model (Toth-Petroczy et al., 2016).
Briefly, the independent model describes the probability of any amino acid sequence s in the family by
PðsÞ= 1
Zexp
(Xi
hiðsiÞ)
with single-site amino acid constraints hi(si) capturing the preference for amino acid si in position i. These parameters are inferred
from the sequence alignment using l2-penalizedmaximum likelihood inference. The effect of a substitutionDE can then quantified by
the log-odds ratio of the probabilities of the mutant and wild-type sequences under the model:
DE�smut;swt
�= log
PðsmutÞPðswtÞ
A score of 0 putatively corresponds to neutral substitutions, scores < 0 to deleterious substitutions, and scores > 0 to beneficial
substitutions.
The structural model of p53 was created with PyMol using the 1TSR p53 structure downloaded from the Protein Data Bank (http://
www.rcsb.org/pdb/).
Mutation prevalence and RFS prediction modelsAll predictions were performed with Random Forest regression models, using the scikit-learn (Pedregosa et al., 2011)
RandomForestRegressor class. In each of the prediction tasks, we randomly partitioned the data into a 90% training set and a
Molecular Cell 71, 178–190.e1–e8, July 5, 2018 e7
10% test set which was left aside and not used for model fitting and optimization. To tune model parameters and assess its perfor-
mance on training data we used a 200-fold cross validation scheme. Model parameters were adjusted to maximize the Pearson
correlation between predicted and measured values. These parameters were then used for fitting the model using the entire training
data set and final prediction on unseen test data.
Model features include: mutation prevalence (Bouaoun et al., 2016), measured RFS; variant enrichment at 6, 9 and 14 days (log-FC
of read fractions over the 2d time point) and relative abundance at 2 days; mean enrichment at 6, 9 and 14 days; position within the
DBD; residue evolutionary conservation and residue percent variability; ‘‘independent model’’ prediction of protein functionality;
‘epistatic model’ prediction of protein functionality calculated using EVmutation (Hopf et al., 2017); minimal number of transitions
and transversions required to achieve the given amino acid alteration; type of mutations (substitution, deletion, insertion or tandem
base transitions) and their outcome (missense, nonsense, silent); and PAM250 and BLOSUM62 substitution matrix values. Feature
importance was assessed by mean decrease in impurity, as implemented in scikit-learn (Pedregosa et al., 2011).
Statistical analysesStatistical tests performed are reported in the Main text, Figures, and Figure legends. All performed statistical tests were two-sided.
All error bars represent ±SEM (standard error of the mean), unless specifically noted otherwise. Heatmap hierarchical clustering was
performed using a Euclidean distance matrix. To assess the difference between two groups of values that are distributed approxi-
mately normal, we used Student’s t test. When this was not the case we performed nonparametric tests: Mann–Whitney U test for
independent samples, or Wilcoxon signed-rank test for matched samples. To assess the difference between the dynamics of
different mutation groups (e.g. in Figure 1C) we performed a within-subjects two-way analysis of variance (ANOVA). For comparison
betweenmultiple groups of values that were not distributed normally (e.g. Figures 5F and 6B) we performed a one-way Kruskal-Wallis
H test. Statistical analyses were performed using the scipy python package.
DATA AND SOFTWARE AVAILABILITY
Data ResourcesRaw data has been deposited to NCBI GEO: GSE115072. Processed data are available in Tables S2, S3, S4, S5, S6, and S7.
e8 Molecular Cell 71, 178–190.e1–e8, July 5, 2018