Embed Size (px)
Citation preview

Contents lists available at ScienceDirect
Fuel
journal homepage: www.elsevier.com/locate/fuel
Full Length Article
A systematic experimental investigation on the synergistic effects of aqueousnanofluids on interfacial properties and their implications for enhanced oilrecovery
Wendi Kuang⁎, Soheil Saraji, Mohammad Piria Department of Petroleum Engineering, University of Wyoming, 1000 E. University Avenue, Laramie, WY 82071-2000, USA
A R T I C L E I N F O
Keywords:NanofluidsInterfacial propertiesSpontaneous imbibitionCore-floodingEnhanced oil recovery
A B S T R A C T
Nanofluids have been proposed as potential enhanced oil recovery agents and additives to hydraulic fracturingfluids. The underlying mechanisms responsible for effectiveness of these fluids, however, are not well under-stood. In this study, we experimentally investigate synergistic effects of aqueous nanofluids on interfacialproperties of oil/brine/rock systems and their role in influencing oil displacement from sandstone and carbonaterock samples. The nanofluids were prepared by dispersing three widely-used nanoparticles (i.e., SiO , Al Ox 2 3, andTiO2) and five different chemical agents (i.e., oleic acid, polyacrylic acid, a cationic, an anionic, and a nonionicsurfactant) in base brine solutions. The efficacy of the mixtures was examined using a framework that includinga comprehensive stability analysis, IFT and wettability characterizations, and oil recovery tests at ambient aswell as high pressure and high temperature conditions (i.e., spontaneous imbibition and core-flooding experi-ments, respectively). Effects of stable nanofluids, identified from stability analysis, on interfacial tension anddynamic contact angle were carefully investigated. We show that co-adsorption and self-structuring of na-noaggregates and chemical agents at the solid interface leads to wettability alteration. Both spontaneous im-bibition and high pressure and high temperature core-flooding results reveal the effectiveness of SiOx +nonionicsurfactant nanofluid in enhancing oil recovery in Berea sandstone due to a synergistic effect between nano-particles and surfactant molecules. In contrast, the stability of nanofluids was highly compromised in Edwardslimestone due to dissolution and interaction of calcium ions with nanoaggregates at high temperature. This wasevident in the drastic difference between oil recoveries obtained through ambient-temperature spontaneousimbibition and high-temperature core-flooding experiments conducted on carbonate core samples. Finally, weprovide new insights on interfacial interactions in nanofluid/oil/rock systems as they relate to wettability al-teration, IFT reduction, and the effect of dissolved ions such as calcium in carbonate rocks. We use this improvedunderstanding to explain the recovery trends observed in our study.
1. Introduction
Nanofluids, here defined as suspensions of nanometer-sized mate-rials in base fluids [1–4], have been studied for applications in variousdisciplines such as heat transfer [5], biomedicine ([6]), and soil re-mediation [7] due to their significant impacts on interfacial properties.Nanofluids and nanoparticles also have many potential applications inthe oil and gas industry. They have been used as additives to drillingfluids due to their ability to manipulate thermal, rheological, andelectrical properties of solutions [8]. Furthermore, nanofluids are con-sidered as potential replacements for traditional Enhanced Oil Recovery(EOR) agents since they have the tendency to reduce interfacial tension(IFT) and alter the wettability of rock surfaces even at high salinity and
high temperature conditions [9].Nanoparticles have high surface area to volume ratio and hence
possess high adsorption affinity [10], which grants them the ability toactively interact with fluid-fluid interfaces. Therefore, nanofluids mayexhibit smaller interfacial tensions compared to the base fluids[1,11,12]. Murshed et al. [1] conducted IFT measurements using pen-dent drop method and observed approximately 20mN/m decrease byintroducing hydrophilic TiO2 nanoparticles into deionized water. In asimilar study, Amraei et al. [11] used du Nouy ring method and mea-sured the IFT of SiO2 nanofluids/n-hexane fluid system at differentnanoparticle concentrations. The authors reported a decrease in IFTfrom 44.13mN/m to values as low as 1.76mN/m at 8% SiO2 nanofluidconcentration (solution of distilled water, isopropyl alcohol, and
https://doi.org/10.1016/j.fuel.2018.01.102Received 17 July 2017; Received in revised form 10 January 2018; Accepted 26 January 2018
⁎ Corresponding author.E-mail addresses: [email protected] (W. Kuang), [email protected] (S. Saraji), [email protected] (M. Piri).
Fuel 220 (2018) 849–870
0016-2361/ © 2018 Elsevier Ltd. All rights reserved.
T

ethylene glycol). Binks et al. [13] showed silica nanoparticles and ca-tionic surfactant molecules have synergistic effects on the stability ofoleic-aqueous microemulsions. Similar synergistic effects were reportedby Eskandar et al. [14] between silica nanoparticles and two conven-tional surfactants (i.e., lecithin and oleylamine) in stabilizing negativelyand positively charged sub-micron paraffin oil-in-water emulsions. Topromote the stabilizing effects, Saleh et al. [15] utilized hydrophilicsilica nanoparticles modified with polystyrene sulfonate (PSS) asemulsifiers and found better emulsion stability compared to the otheremulsifiers reported in the literature.
Furthermore, nanofluids can physically interact with fluid-solid in-terfaces and consequently alter the wettability of solid surfaces. Forinstance, nanoparticles have been proposed in oil industry as wett-ability alteration agents [2,9–11,16–22]. Amraei et al. [11] and Karimiet al. [9] reported a decrease in contact angles on carbonates by in-troducing different nanofluids (i.e., SiO2 and ZrO2, respectively). Ad-ditionally, TiO2 [10], polysilicon [18], and Al O2 3 [20] were used toconduct similar tests on sandstones, and significant changes in wett-ability of rock surfaces from oil-wet to intermediate-wet or water-wetconditions were observed. Karimi et al. [9] reported the formation ofnanometer-sized ribbons and nanoflower-like morphologies on rocksurfaces after aging carbonate plates in nanofluids. They suggested thatthe wetting properties of the newly-developed surface was changed dueto the adsorption of nanoparticles. It is also found that the spreadingand wetting of nanofluids on solids are impacted by self-structuring ofnanoparticles in the confined three-phase contact region that is locatedinside the wedge film within aqueous phase between an oil drop and asolid surface [4,23,16].
Owing to their role in reducing brine/oil interfacial tension, stabi-lization of oil-in-water and water-in-oil microemulsions, and enhance-ment of wetting behavior, nanofluids potentially have significant ap-plications in enhanced oil recovery processes. Esfandyari Bayat et al.[24] studied the effect of different metal oxide nanoparticles on EORfrom limestone samples. Based on their displacement tests, it was foundthat SiO , Al O2 2 3, and TiO2 nanoparticles all have the potential of beingused as EOR agents due to their effects on viscosity and interfacialtension as well as wettability. Similarly, ZrO2 nanofluid was suggestedas a candidate EOR agent in carbonate rock systems because of itsability to alter wettability [9]. In another study, SiO2 nanoparticleswere reported to enhance the performance of water-alternating-gasrecovery scheme in oil-wet carbonate [25]. The promising performanceof nanofluids in enhancing oil recovery is not limited to carbonates[10,19,26–29]. Hendraningrat et al. [19] conducted core-flooding testsin Berea sandstone samples using SiO2 nanofluids. Although both hy-drophobic and hydrophilic SiO2 nanoparticles were found to lower in-terfacial tension and contact angle, the authors indicated that nano-particles may not provide a better recovery due to the impairment ofporosity and permeability in the core samples. This may have beencaused by instability of their nanofluids at experimental conditions.Similarly, Youssif et al. [30] reported 0.1 wt% as the optimum con-centration of silica nanofluids for enhancing oil recovery, and theyclaimed that any further concentration increment leads to formationdamage. In contrary to the previous findings, enhancement of oil pro-duction due to deposition of nanoparticles is reported by Li and Tor-sæter [31]. They observed improvement in the sweep efficiency due tochannel plugging effects caused by precipitation of nanoparticles. Bycomparing the results of core-flooding tests to those of interfacial ten-sion and contact angle measurements, Hendraningrat and Torsæter[26] concluded that wettability alteration is the dominant mechanismresponsible for the effectiveness of nanofluids in enhancing oil re-covery. Additional recovery in sandstone samples due to both wett-ability alteration and reduction in interfacial tension using modifiedSiO2 and TiO2 nanoparticles was also reported [10,27].
Moreover, nanoparticles have potential applications in hydraulicfracturing. Although polymer solutions have been used as stimulationfluids for decades, they leave residues behind that can impair
permeability of reservoir rock and sandpacks within fractures. This isone of the biggest challenges that limits application of polymer solu-tions as fracturing fluids. Therefore, breakers (e.g., enzymes) have beenused to degrade polymers remaining in the solution and filter cake([32]). Delayed release or encapsulation of these breakers is critical insuccessful removal of remaining polymers. Barati et al. [32,33] haveproposed that nanoparticles could successfully entrap and delay therelease of enzymes in fracturing fluids, which could protect the en-zymes against severe conditions such as alkaline brine and high tem-perature. Additionally, the ultra small size of nanoparticles could helpdistribute the enzyme more uniformly [32,33]. In another example,researchers have proposed to use viscoelastic surfactant (VES) solutionsas fracturing fluids to overcome the drawbacks of polymers solutions.Yet, VES systems have their own limitations due to excessive fluid leak-off and poor thermal stability. Crews et al. [34] demonstrated that theuse of pyroelectric nanoparticles not only could increase the low shearrate viscosity of VES solutions by 10-fold, but also could reduce theleak-off rate of these fluids.
In this study, we evaluate nanofluid mixtures as EOR agents oradditives to fracturing fluids through a detailed investigation of theirinterfacial properties and impacts on oil recovery. Nanofluids are pre-pared by dispersing nanoparticles in brine solutions in the presence ofdifferent chemical agents. First, we carefully study the stability of thesecolloidal solutions by applying different techniques proposed in theliterature and critically comparing the results. Once stable nanofluidsare identified, interfacial tension between crude oil and aqueous phasesas well as wettability of reservoir rock samples are studied in the pre-sence of nanofluids. In the next step, the effect of nanofluids on oilrecovery is investigated using spontaneous imbibition experiments atambient conditions, and core-flooding tests at high pressure and hightemperature. The results are then analyzed based on interfacial prop-erties of nanofluids in the brine/oil/rock systems investigated. Thisstudy extends our fundamental knowledge on the underlying mechan-isms involved in enhanced oil recovery using nanofluids.
In the following sections, we first present materials and methodsused in this study. Afterward, stability analysis and effects of nanofluidson IFT and contact angle are discussed in detail. We then present anddiscuss the results of spontaneous imbibition and core-flooding ex-periments conducted in sandstone and carbonate rock samples. Finally,we include a section on conclusions and proposed future work.
2. Materials and methods
2.1. Fluids
Materials include n-Decane (99%, Extra Dry, AcroSeal), SiliconOxide (SiOx, 99.5+%, S-type, 15–20 nm spherical particles, amor-phous, bulk density< 0.10 g/cm3, US Research Nanoparticles, Inc.),Aluminum Oxide (< 50 nm, molecular weight= 101.96 g/mol, gammaphase, Aldrich), Titanium Dioxide (99+wt%, 10–25 nm, Anatase, USResearch Nanoparticles, Inc.), Sodium Chloride (100%, ACS-grade,Fisher Scientific), distilled-deionized water (Conducivity × −1.48 10 4 S/m, produced by Auto distill WG280, Yamato), oleic acid (99+%,Sigma-Aldrich) (OA), polyacrylic acid (Sigma-Aldrich) (PAA), liquidnonionic surfactant (linear alcohol, −C9 11, Ethoxylate, Stepan Co.), li-quid anionic surfactant (ammonium alkyl, −C6 10, Ether Sulfate, StepanCo.), liquid cationic surfactant (n-Alkyl dimethyl benzyl ammoniumchloride, Stepan Co.), Sodium dodecyl sulfate (BioReagent, Sigma-Aldrich) (SDS), Toluene (99.9%, Certified ACS, Fisher Scientific),Methanol (99.9%, Certified ACS, Fisher Scientific), and Acetone(99.9%, Certified ACS, Fisher Scientific).
Nanofluids were prepared by dispersing 0.1 wt% nanopowders (i.e.,SiO , Al Ox 2 3, and TiO2 ) in 1mM NaCl brine solution with or withoutchemical agents (i.e., OA, PAA, and cationic, anionic, and nonionicsurfactants). NaCl brine solution with 1mM concentration was selectedin this study in order to be consistent with slick water composition that
W. Kuang et al. Fuel 220 (2018) 849–870
850

has been used frequently in the field applications for hydraulic frac-turing. In this manuscript, ‘pure solution’ refers to colloidal mixture ofnanoparticles without chemical agents, while ’blank solution’ is used todescribe surfactant solution without nanoparticles. The colloidal solu-tions were homogenized using magnetic stirrer at 600 rpm and ultra-sonic agitation (90W with fixed 35 kHz frequency), each for two ses-sions of 30min. The solutions were then left for 12 h beforemeasurements.
A crude oil sample from a producing tight oil reservoir was used forimbibition studies and nanofluid injection experiments. The fluid wasfirst centrifuged for 1 h at 6000 rpm and then filtered using a 5μm filterto remove solid particles prior to testing. The sample had a density of0.81 g/cc, viscosity of 2.804 cP at 20 °C, and asphaltene content of0.45 wt%. The readers are referred to Mirchi et al. [35] for more in-formation on properties of this crude oil.
2.2. Rock samples
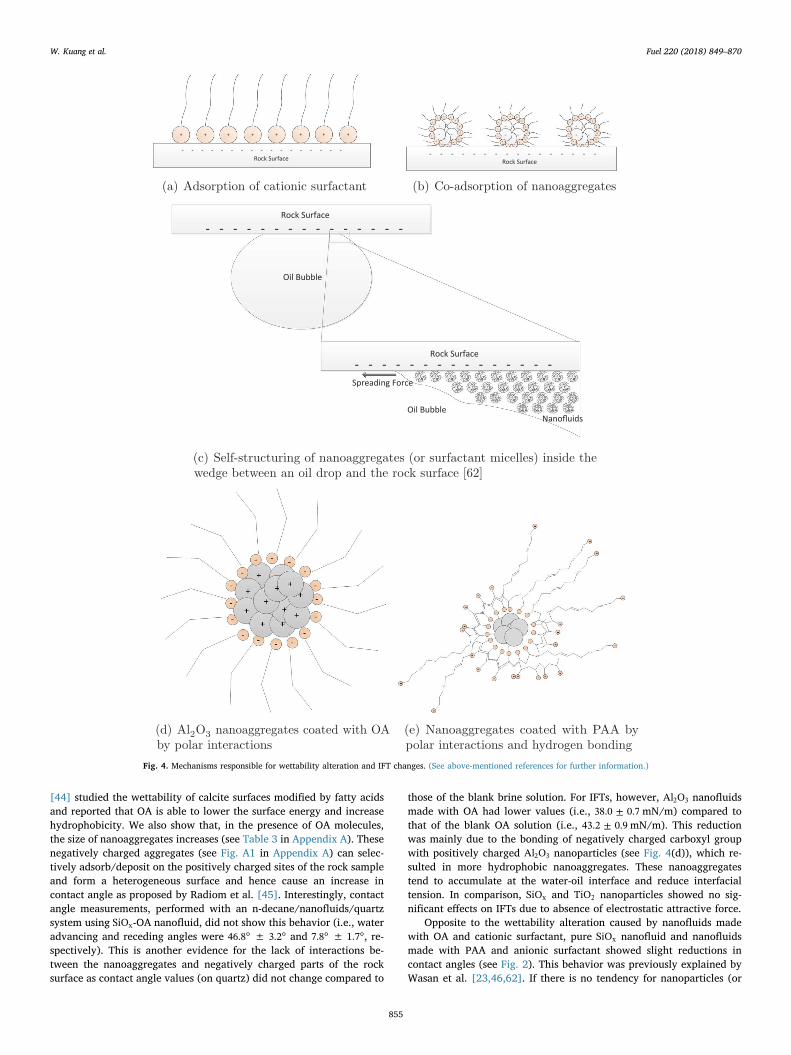
A preserved rock sample from a producing tight oil reservoir wasused as solid substrate for contact angle measurements. An SEM mi-crograph and elemental composition map for this rock sample areshown in Figs. 1(a) and 1(b). The sample was a tight (porosity< 2%)clay-rich dolomitic sandstone that contained insignificant amount oforganic matter (see Saraji and Piri [36] for more information). Rec-tangular substrates (≈0.8 in ×0.6 in) were cut from the rock sampleusing a precision saw. These pieces were prepared to be compatiblewith a crystal holder in the experimental apparatus utilized for contactangle measurements. The samples were then polished with an auto-matic polishing apparatus using silicon carbide powder (18μm) anddiamond suspension (3μm) at 50 rpm each for 30min. A comparisonbetween static contact angles measured on polished and unpolishedrock substrates showed comparable results, indicating insignificant ef-fect of the polishing process on the wetting nature of the rock substrate.However, to minimize bubble/drop pinning due to surface roughness,we used polished substrates for all the measurements in this study.
Additionally, core samples, 1 inch in diameter and 2 inches inlength, were cut from Berea sandstone and Edwards limestone blocksand used in spontaneous imbibition studies. These outcrop rock sampleswere selected to represent two dominant minerals in the reservoir rocksample. The core plugs were then washed using water, and dried at105 °C for at least 2 days. Subsequently, weight, dimensions, porosity,and absolute gas permeability (under a confining pressure of 1000 psig)of the dry core plugs were measured. Dimensions and basic petrophy-sical properties of the samples are listed in Table 1. For core-floodingexperiments, additional core samples (1.5 inches in diameter and 10inches in length) were cut from the aforementioned blocks and thensubjected to basic petrophysical characterization. Porosity was mea-sured using Boyle’s porosimeter, while absolute brine permeability wasobtained using steady-state method prior to the injection of nanofluids.Furthermore, to characterize pore size distributions, high-resolutionthree-dimensional images of the rock samples were acquired utilizingX-ray microtomography technique. The images were then filtered andsegmented using Avizo 9.1 software to generate a labeled image foreach core sample. Afterward, a filter called ’separate objects’ was uti-lized to identify each individual pore. Finally, a label analysis modulewas applied to each data set to generate the pore size distribution in-formation (Fig. 7).
2.3. Experimental setup and procedure
2.3.1. Interfacial tension and contact angle measurementsInterfacial tension (IFT) and dynamic contact angles (CA) of nano-
fluid/oil/rock systems were measured using an experimental setup withrising/captive bubble and pendent/sessile drop configurations. Thissetup includes a Hastelloy measurement cell, a high-resolution camera,and a dual-cylinder 5000-series Hastelloy Quizix pump to supply stable
flow rates during experiments. Fluid densities were measured at theexperimental conditions using an Anton Paar PMA 5000 density meter.The details of the experimental setup are provided in the work of Sarajiet al. [37].
The experimental procedure used in this study is as follows: Thesystem was throughly cleaned prior to any measurements to provide acontamination-free system (see Saraji et al. [37] for more information).Rock substrates were mounted on the crystal holder located inside thecell [37] and nanofluids were then injected gradually into the chamberusing a Quizix pumping system. The solid and nanofluid were kept inthe cell for at least two hours to establish equilibrium before mea-surements were started. It is worth noting that the equilibrium time wasdetermined by conducting a set of static contact angle measurementswith different soaking times. Subsequently, oil bubbles were createdthrough a needle (0.896 or 2.11mm OD) from the bottom of the cellapproaching the rock surface from beneath (captive bubble configura-tion). In some cases, when nanofluids were opaque, sessile drop con-figuration was employed instead. In these cases, first, the substrateswere soaked inside the nanofluids for at least two hours. These solidswere then mounted inside the measurement cell filled with the oilphase. A drop of nanofluid was introduced to the rock surface through aneedle from the top of the cell. The camera was tilted 2° below (orabove) the rock substrate so that the mirror image of the oil bubble/nanofluid drop on the solid surface could be obtained. This step wasnecessary to find the exact three-phase contact points. Multiple imageswere taken (every 20 s) while the oil bubble/nanofluid drop was beinginjected or retracted through the needle with a flow rate of 0.002ml/min. The sizes of the bubbles in this study were typically in the range of0.003–0.03 cm3. In order to analyze the data, the cutoff pixel (i.e.,three-phase contact points) were obtained from the images and thenused as an input in a Matlab program developed to determine contactangles [38]. Afterwards, the IFT values were measured by pulling theneedle back from the solid surface, making new bubbles/drops, andacquiring images for extended period of time. For static IFT measure-ments, the equilibrium time was 300 s, while for dynamic IFT, wecontinuously acquired images for about 5 h. For each IFT test, at leastthree measurements were conducted to ensure reproducibility of theresults. We employed Asymmetric Drop Shape Analysis (ADSA) in thecalculations. In contact angle measurements, averaged values wereobtained using more than 300 data points recorded during the advan-cing or receding processes. Reported data in this study are the averagevalues along with corresponding standard variations.
2.3.2. Adsorption measurementsIn order to further confirm our wettability characterization results
generated through contact angle measurements, real-time in situ mon-itoring of nanoaggregates adsorption onto selected surfaces was per-formed using a Quartz Crystal Microbalance with Dissipation (QCM-D)instrument coupled with flow cells. Since silica is one of the majorminerals of Berea sandstone (used in imbibition and core-flooding tests)and the preserved reservoir rock sample (used in contact angle studies),silica sensors were selected as the model surface in these tests. Theadsorption of nanoaggregates was measured by flowing different col-loidal solutions over the surface of silica sensors. Prior to the test, silicaQ-sensors were immersed in 2 wt% sodium dodecyl sulfate solution,and sonicated for 30min. Subsequently, the sensors were rinsed withdistilled water, dried with nitrogen, and treated with UV/ozone for15min to ensure that surface was clean and hydrophilic [39]. The flowrate of 50μL/min was used for these experiments, and temperature wascontrolled at 25 °C. Before the tests, the flow cell was flushed with abuffer fluid (i.e., 0.1 mM NaCl brine) for at least one hour to stabilizethe system and establish a baseline for the measurement. For each test,nanofluid or surfactant solution was continuously injected into the cell,containing a silica sensor, until frequency and dissipation parametersbecome stable. These data were then used to calculate the mass changesover time using either Sauerbery or Viscoelastics model incorporated
W. Kuang et al. Fuel 220 (2018) 849–870
851

into the QCM-D software (i.e., QTools). The adsorption figures pre-sented here are curves fitted to the measured data with correspondingstandard deviations.
2.3.3. Spontaneous imbibition measurementsCore samples were vacuumed for 24 h under a vacuum pressure of
about 10−5 torr. The samples were, while under vacuum, graduallysaturated with the crude oil by slightly opening the valve connected to
Fig. 1. (a) SEM micrograph of the preserved reservoir rock sample in backscattered mode [1 kV voltage, 100 pA current, and 25 nm image resolution], (b) Elemental composition mapusing EDS [5 kV voltage, 3200 nA current, and 50 nm image resolution].
W. Kuang et al. Fuel 220 (2018) 849–870
852
an oil reservoir and controlling the oil flow rate at 20 drops/min.Subsequently, the cores were kept immersed in the oil for 12 h. Thetotal oil saturations were then calculated from the weight difference(material balance) for each plug and are listed in Table 1. Spontaneousimbibition experiments were performed by immersing the core samplesin nanofluids using standard Amott cells at ambient pressure andtemperature conditions. The oil production was recorded as a functionof time with an accuracy of 0.05 cm3. Each test was repeated at leastthree times, and the trends presented here are fitted curves along withthe measured data with corresponding standard deviations.
2.3.4. Nanofluid injection experimentsCore-flooding tests were conducted using a group of nanofluids se-
lected based on their spontaneous imbibition results. Rock samples withsimilar porosities were selected for the flooding tests using the fol-lowing procedure. First, all samples were fully saturated with pre-equilibrated brine, after displacing air with CO2 and being subjected toa vacuum for several hours. Subsequently, pressure drops across thecore samples were measured at brine flow rates of 0.05, 0.10, 0.15, and0.3 ml/min and used to obtain absolute permeability. Next, sampleswith permeabilities within a desired range were kept for furtherflooding tests, while the others were discarded. After establishing acommonly reported initial water saturation of 35% ([40]) by injectingcrude oil into the sample, an imbibition process was initiated by in-troducing an aqueous solution and gradually increasing its flow rate to0.0696ml/min. The flow rate was selected to achieve a capillarynumber less than −10 5. In the meantime, oil recovery was recorded untilresidual oil saturation was reached. Here, each core sample is con-sidered to be at residual oil saturation when no oil was produced bydoubling the flow rate [41]. To examine reproducibility of the results,the core-flooding experiment using one of the nanofluids was repeatedand no significant difference in the oil recovery was observed.
3. Results and discussion
3.1. Stability analysis
We employed methods presented in the literature, such as sedi-mentation test, dynamic light scattering (DLS), zeta potential mea-surement, and SEM imaging of nanoaggregates, to perform a compre-hensive analysis of the stability of nanofluids. Fourteen stable colloidalsolutions were identified and selected for further studies includingcharacterization of their interfacial properties and effectiveness in en-hancing oil recovery. Detailed results of the aforementioned stabilityanalysis are presented in the Appendix A. In the following paragraph,we include a brief summary of the findings.
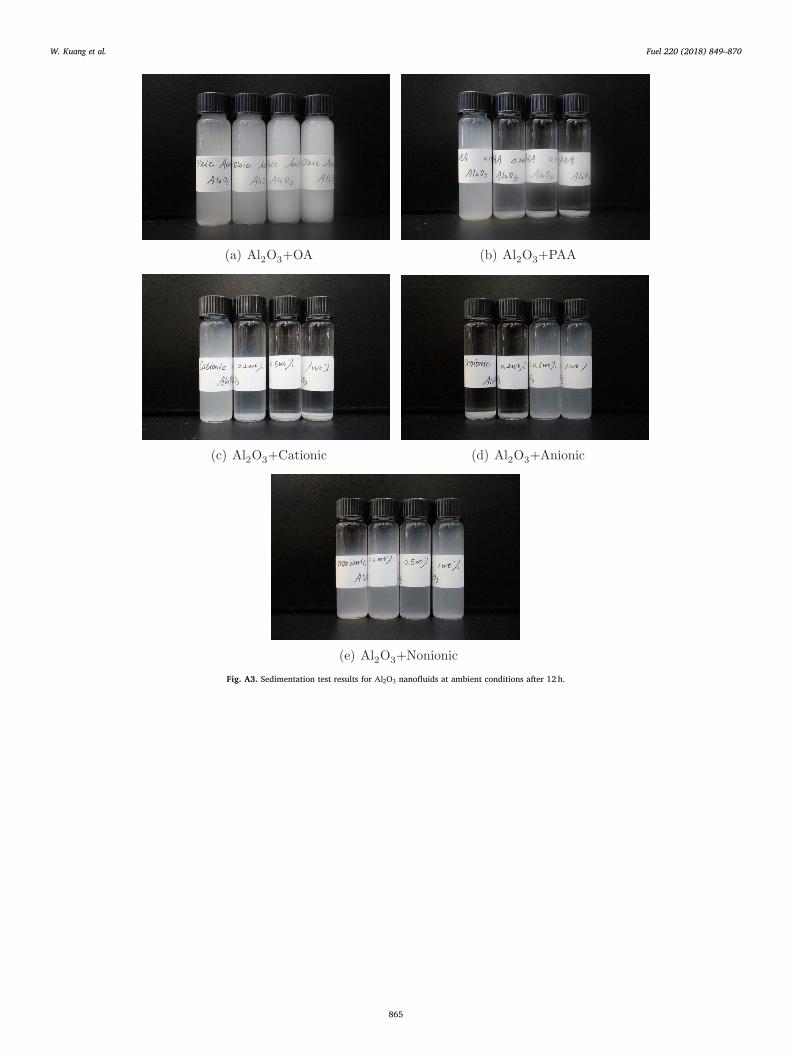
We found that SiOx nanofluids were stable in all cases, while thestability of Al O2 3 and TiO2 nanofluids were found to depend on theconcentration of the added chemical agents. For example, as seen inFig. A3, 0.1 wt% of PAA and cationic surfactant made the most stableAl O2 3 nanofluids, while any further addition of both chemicals ad-versely affected the stability. Similar trends were observed for the caseof TiO2 +PAA nanofluids. It is worth noting that, the above-mentionedrelationships were previously overlooked when the stability of nano-fluids were merely investigated using zeta potential. Therefore, webelieve any individual method will produce inconclusive results andonly a comprehensive study, integrating multiple methods, could pro-vide the most accurate conclusions. As mentioned earlier, detailed re-sults and discussion regarding stability of these nanofluids are includedin the Appendix A.
3.2. Interfacial tension and contact angle
Nanoparticles, due to their large surface area to volume ratio, pos-sess high adsorption affinity and can interact with solid-fluid and fluid-fluid interfaces and hence are able to modify IFTs and alter wettabilityof rock surfaces [42]. Therefore, careful investigations of both wett-ability and interfacial tension of nanofluid/oil/rock systems are ne-cessary to develop an improved understanding of the mechanisms
Table 1Properties of the core samples used in this study. (The numbers are average values for several cores used for each nanofluid.)
Berea Sandstone Edward Carbonate
D, mm L, mm ϕ, % K, md Soinit , % D, mm L, mm ϕ, % K, md So
init , %
Spontaneous imbibitionBrine 25.1 ± 0.0 50.1 ± 0.2 19.5 ± 0.2 156.5 ± 6.4 99 ± 0 25.2 ± 0.1 48.4 ± 1.5 22.8 ± 0.8 17.6 ± 1.0 96 ± 0SiOx 25.4 ± 0.2 50.8 ± 0.4 20.1 ± 0.5 171.1 ± 18.7 97 ± 1 25.2 ± 0.0 50.6 ± 1.0 22.7 ± 0.3 14.1 ± 0.2 98 ± 0Al O2 3 25.2 ± 0.0 50.3 ± 0.2 20.5 ± 0.2 186.0 ± 12.8 97 ± 0 25.2 ± 0.0 50.1 ± 1.0 23.3 ± 0.3 16.5 ± 2.0 97 ± 0
OA 25.2 ± 0.0 49.8 ± 0.2 20.1 ± 0.2 172.2 ± 10.7 98 ± 0 25.3 ± 0.0 49.9 ± 0.0 23.9 ± 0.2 20.1 ± 2.0 98 ± 1SiOx +OA 25.2 ± 0.0 50.2 ± 0.5 20.0 ± 0.3 171.1 ± 17.8 99 ± 1 25.2 ± 0.0 47.5 ± 1.0 23.6 ± 0.6 18.9 ± 1.8 97 ± 1Al O2 3 +OA 25.1 ± 0.0 50.0 ± 0.3 19.6 ± 0.2 165.1 ± 15.0 99 ± 1 25.2 ± 0.1 47.8 ± 0.1 22.3 ± 0.0 15.0 ± 3.7 96 ± 0TiO2 +OA 25.1 ± 0.0 50.3 ± 0.0 19.4 ± 0.1 150.6 ± 6.4 99 ± 0 25.1 ± 0.1 48.7 ± 0.3 24.6 ± 0.1 20.2 ± 0.6 97 ± 1
PAA 25.3 ± 0.0 50.9 ± 0.3 19.9 ± 0.1 155.7 ± 1.3 98 ± 1 25.2 ± 0.0 49.3 ± 0.8 24.3 ± 0.2 20.5 ± 2.7 97 ± 0SiOx +PAA 25.2 ± 0.1 49.4 ± 0.6 19.9 ± 0.3 167.8 ± 14.6 99 ± 1 25.2 ± 0.0 50.0 ± 0.6 23.5 ± 0.9 17.0 ± 3.9 96 ± 1Al O2 3 +PAA 25.3 ± 0.0 51.0 ± 0.0 19.9 ± 0.1 175.9 ± 17.2 98 ± 0 25.2 ± 0.0 50.0 ± 0.0 23.4 ± 0.4 15.7 ± 0.7 97 ± 1TiO2 +PAA 25.2 ± 0.0 49.0 ± 1.4 20.0 ± 0.2 172.0 ± 20.9 98 ± 0 25.2 ± 0.1 49.8 ± 0.7 23.0 ± 0.9 14.4 ± 3.9 96 ± 0
Anionic 25.2 ± 0.0 50.0 ± 0.1 20.1 ± 0.1 185.8 ± 12.7 97 ± 0 25.1 ± 0.0 47.8 ± 1.5 24.2 ± 0.0 19.4 ± 0.4 96 ± 0SiOx +Anionic 25.2 ± 0.0 49.8 ± 0.3 19.9 ± 0.3 167.4 ± 13.8 97 ± 1 25.2 ± 0.1 47.8 ± 0.7 22.9 ± 0.5 16.4 ± 1.8 97 ± 0
Nonionic 25.2 ± 0.0 50.1 ± 0.4 19.9 ± 0.1 175.7 ± 10.2 99 ± 1 25.2 ± 0.1 48.7 ± 0.5 23.1 ± 0.8 17.0 ± 1.7 96 ± 1SiOx +Nonionic 25.2 ± 0.0 49.3 ± 1.0 20.0 ± 0.0 183.8 ± 8.0 99 ± 1 25.2 ± 0.0 48.7 ± 0.9 23.8 ± 0.4 18.5 ± 2.4 96 ± 0Al O2 3 +Nonionic 25.2 ± 0.0 49.7 ± 0.2 20.3 ± 0.1 181.7 ± 5.8 96 ± 2 25.2 ± 0.0 47.9 ± 1.3 23.2 ± 0.2 13.4 ± 1.1 96 ± 0
Core-floodingBrine 37.5 ± 0.0 257.0 ± 0.2 23.3 ± 0.3 170.7 65.8 37.5 ± 0.2 257.2 ± 0.2 24.21 ± 0.1 28.89 65.4SiOx 37.5 ± 0.1 257.1 ± 0.2 23.6 ± 0.3 167.1 63.5 37.5 ± 0.1 257.3 ± 0.1 23.50 ± 0.2 23.52 65.1SiOx +Nonionic 37.5 ± 0.1 257.0 ± 0.3 23.6 ± 0.0 173.2 63.4 37.5 ± 0.5 257.4 ± 0.2 24.23 ± 0.7 23.61 67.8
W. Kuang et al. Fuel 220 (2018) 849–870
853

responsible for oil recovery using these fluids. Dynamic contact anglesand IFTs of nanofluid/decane/rock systems were measured for allfourteen stable nanofluids utilizing an experimental setup with rising/captive bubble and pendent/sessile drop configurations. We used thecaptive bubble configuration for contact angle measurements on alltransparent samples. While for a few opaque nanofluids, a sessile dropconfiguration was employed. Changing the measurement configurationdid not adversely impact contact angle measurements. To ensure thatthe results obtained using these two approaches were comparable, dy-namic contact angle tests were conducted for pure-brine/n-decane/rocksystems with both configurations. We found comparable results withinthe experimental repeatability range, i.e., 26.3° ± 3.7° and31.1° ± 1.3° for water advancing angles. The contact angle results areplotted in Figs. 2(a) and 2(b), while IFT measurements are shown inFig. 3. These data are the average values of several measurements andare presented with the corresponding standard deviations. For somenanofluids, we were unable to obtain water advancing contact anglesdue to pinning of the three-phase contact line in multiple measurementscaused by heterogeneous adsorptions on the rock surface.
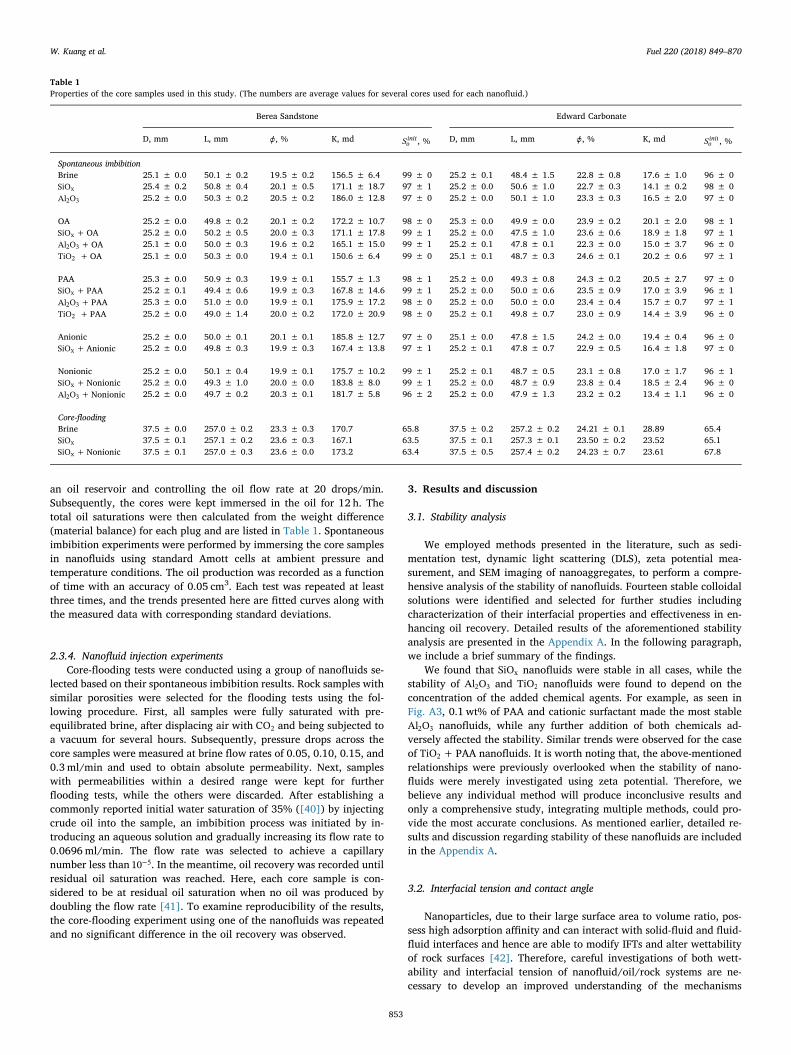
The nanofluids made with cationic surfactant showed only a slightdecrease in IFT compared to that of the blank cationic surfactant so-lution, however, a considerable change was observed in the contactangles. These nanofluids altered the wettability of rock surface towardless water-wet or even oil-wet conditions compared to pure brinesystem. To explain this behavior, we performed zeta potential mea-surements using powdered rock sample (particles size ≤75μm) in blankcationic surfactant solutions (see Fig. A1(d) in Appendix A). The pre-sence of cationic surfactant changed the sign of zeta potential on rockparticles from a negative value (i.e.,−19.3 mV) to a positive value (i.e.,+45.7mV), which is an indication of the adsorption of cationic sur-factant molecules onto the surface of rock substrate. We believe thatcationic surfactants adsorbed with their hydrophilic head to the nega-tively charged rock surface, due to the electrostatic attractive forces,and exposed the alkane tail to the bulk solution. This made the surfacemore hydrophobic and less water-wet (see Fig. 4(a)). According toFig. 2, the contact angles were increased by introduction of nano-particles into the cationic surfactant solution except for Al O2 3. The so-lution without nanoparticles changed the water advancing contactangle from °26.3 ± °3.7 to °53.1 ± °5.4 , while introducing SiOx andTiO2 nanoparticles to the cationic surfactant solution modified the ad-vancing contact angles to °131.3 ± °3.1 and °58.1 ± °5.0 , respectively.The observed wettability alteration of rock surfaces toward a less water-wet condition is the result of the co-adsorption of nanoparticles andsurfactant molecules and hence formation of nanostructures on the rocksubstrate (see Fig. 4(b)) [9]. We expect that cationic surfactant mole-cules act as links between two negatively charged surfaces (i.e., nano-particles and rock surface). This is similar to the ion binding phe-nomena responsible for rupturing thin brine films suggested by Buckleyand Liu [43]. In order to confirm this hypothesis, a similar test wasconducted on a smooth pure quartz surface (surface roughness≤0.5 nm) using the TiO2-cationic surfactant nanofluid. The resultsshowed less water-wet quartz surface in the presence of nanofluid. Thewater advancing contact angle increased from °63.5 ± °2.0 to
°142.6 ± °2.9 , while the water-receding contact angle increased from°29.2 ± °3.0 to °116.4 ± °1.6 . These changes in contact angles on
quartz surface were comparable to the changes we observed on thereservoir rock surface. Furthermore, there was not a significant changein contact angles using Al O2 3-cationic surfactant nanofluid compared tothe blank solution. This was expected because of minimal co-adsorptionof nanoparticles and surfactant molecules owing to the presence ofelectrostatic (positive) repulsive forces.
Similarly, nanofluids made with OA altered the wettability of rocksurfaces toward less water-wet conditions. Although the net surfacecharge on rock particles was negative, there were considerable amountsof calcite and dolomite minerals in the rock sample (see Fig. 1(b)) thatcould interact with carboxyl groups in the OA molecules. Gomari et al.
0
20
40
60
80
100
120
140
160
180C
onta
ct A
ngle
(deg
)
Blank SiOx Al2O3
TiO2
Pure OA PAA Cationic AnionicChemicals
(a) Water advancing
0
20
40
60
80
100
120
140
160
180
Con
tact
Ang
le (d
eg)
Blank SiOx
Al2O3
TiO2
Pure OA PAA Cationic Anionic Nonionic
Chemicals
(b) Water receding
Fig. 2. Dynamic contact angles for nanofluids (0.1 wt% nanoparticles+ 0.1 wt% che-mical agents in 1mM brine)/n-decane/rock system at ambient conditions.
0
10
20
30
40
50
60 Blank SiOx
Al2O3
TiO2
IFT
(mN
/m)
Pure OA PAA Cationic Anionic Nonionic
Chemicals
Fig. 3. Equilibrium IFTs between nanofluids (0.1 wt% nanoparticles+ 0.1 wt% chemicalagents in 1mM brine) and n-decane at ambient conditions.
W. Kuang et al. Fuel 220 (2018) 849–870
854
[44] studied the wettability of calcite surfaces modified by fatty acidsand reported that OA is able to lower the surface energy and increasehydrophobicity. We also show that, in the presence of OA molecules,the size of nanoaggregates increases (see Table 3 in Appendix A). Thesenegatively charged aggregates (see Fig. A1 in Appendix A) can selec-tively adsorb/deposit on the positively charged sites of the rock sampleand form a heterogeneous surface and hence cause an increase incontact angle as proposed by Radiom et al. [45]. Interestingly, contactangle measurements, performed with an n-decane/nanofluids/quartzsystem using SiOx-OA nanofluid, did not show this behavior (i.e., wateradvancing and receding angles were °46.8 ± °3.2 and °7.8 ± °1.7 , re-spectively). This is another evidence for the lack of interactions be-tween the nanoaggregates and negatively charged parts of the rocksurface as contact angle values (on quartz) did not change compared to
those of the blank brine solution. For IFTs, however, Al O2 3 nanofluidsmade with OA had lower values (i.e., ±38.0 0.7 mN/m) compared tothat of the blank OA solution (i.e., ±43.2 0.9 mN/m). This reductionwas mainly due to the bonding of negatively charged carboxyl groupwith positively charged Al O2 3 nanoparticles (see Fig. 4(d)), which re-sulted in more hydrophobic nanoaggregates. These nanoaggregatestend to accumulate at the water-oil interface and reduce interfacialtension. In comparison, SiOx and TiO2 nanoparticles showed no sig-nificant effects on IFTs due to absence of electrostatic attractive force.
Opposite to the wettability alteration caused by nanofluids madewith OA and cationic surfactant, pure SiOx nanofluid and nanofluidsmade with PAA and anionic surfactant showed slight reductions incontact angles (see Fig. 2). This behavior was previously explained byWasan et al. [23,46,62]. If there is no tendency for nanoparticles (or
+ + + + + + + +
- - - - - - - - - - - - - - - - - Rock Surface
(a) Adsorption of cationic surfactant
- - - - - - - - - - - - - - - - Rock Surface
-
-
-
--
+ + ++
+
+
++
+++
+
+
+-
-
-
--
+ + ++
+
+
++
+++
+
+
+- -
-
-
--
+ + ++
+
+
++
+++
+
+
+
(b) Co-adsorption of nanoaggregates
- - - - - - - - - - - - - - - Rock Surface
- - - - - - - - - - - - - - -Rock Surface
Oil Bubble
Oil Bubble
Spreading Force
Nanofluids
(c) Self-structuring of nanoaggregates (or surfactant micelles) inside the
wedge between an oil drop and the rock surface [62]
(d) Al2O3 nanoaggregates coated with OA
by polar interactions
(e) Nanoaggregates coated with PAA by
polar interactions and hydrogen bonding
Fig. 4. Mechanisms responsible for wettability alteration and IFT changes. (See above-mentioned references for further information.)
W. Kuang et al. Fuel 220 (2018) 849–870
855

surfactant micelles) to adsorb on a solid surface, nanoparticles confinedin a thin film tend to arrange in well-ordered layers and force them-selves between the discontinuous phase and the substrate, which resultsin an excess pressure compared to the bulk solution, called disjoiningpressure. The increase in disjoining pressure helps the spreading ofnanofluids and causes lower water contact angles (see Fig. 4(c)). It isimportant to note that this mechanism is only effective when the sub-strate and suspended particles have the same surface charges [47]. Forinstance, in the case of Al O2 3 nanoaggregates, the opposite charge ofparticles and rock surface promoted adsorption of nanoaggregates in-stead of the self-structuring phenomenon mentioned above. The in-herent wettability of Al O2 3 is believed to be less water-wet compared tothe substrate ([48–50]). After the adsorption of Al O2 3 nanoaggregates,the substrate is coated by a less water-wet Al O2 3 nanoparticle layer andhence it become less water-wet. In the case of IFT, additions of nano-particles to the base PAA solution resulted in slight increases in IFTvalues. We think that the hydrogen bonding between carboxyl groups inPAA molecules and hydroxyl groups on hydrophilic nanoparticlesmight be responsible for this behavior. We hypothesize that the poly-meric nature of PAA molecules gives them the ability to form multiplehydrogen bonding with nanoparticles, which results in adsorption ofthe first layer of PAA molecules on nanoparticle surfaces. The presenceof excess PAA molecules in the suspension along with the van der Waalsinteractions between their alkane tails and those of adsorbed moleculesleads to adsorption of another layer of polymer molecules (seeFig. 4(e)). Accumulation of multiple layers of polymer molecules onnanoaggregates makes them more hydrophilic and hence more stable inthe bulk solution. At the same time, this process reduces the amount of
PAA molecules that could move toward the interface between waterand oil phases. Therefore, nanofluids made by combining nanoparticlesand PAA produced relatively higher IFT values than the blank PAAsolution.
To further verify the proposed mechanism for wettability alteration(i.e., co-adsorption of nanoaggregates and chemical agents on mineralsurfaces), a set of supplemental tests were conducted using QCM-Dtechnique [51]. Fig. 5 shows the adsorption results for blank cationicsurfactant, pure SiOx, and SiOx-cationic surfactant nanofluids. The ad-sorption amount for SiOx-cationic surfactant nanofluid is much higherthan those of pure SiOx nanofluid and blank cationic surfactant solu-tion. The minimal amount of adsorption of pure SiOx nanofluid is due tothe absence of attractive electrostatic forces between the negativelycharged nanoparticles and silica sensor. While cationic surfactant mo-lecules act as binding elements between both negatively charged na-noparticles and silica sensors, which lead to a much higher adsorption.Furthermore, SEM images clearly show complex structures formed byco-adsorption of SiOx-cationic surfactant nanoaggregates onto silicasurface (see Fig. 5(c)), which are absent in the case of pure SiOx na-nofluid (see Fig. 5(b)). These results are direct evidences of co-ad-sorption of nanoparticles and surfactant solutions proposed in thisstudy.
3.3. Spontaneous imbibition tests
In the previous section, we studied the complex behavior of nano-fluids and their effects on IFT and wettability of brine/decane/rocksystems. Motivated by the influences of nanoparticles on interfacial
0 10 20 30 400
100
200
300
400
500
600
700 Cationic SiOx
Cationic+SiOx
Sur
face
con
cent
ratio
n (n
g/cm
2 )
Time (minutes)
(a) adsorption results using QCM-D
(b) pure SiOx nanofluid (c) Cationic+SiOx nanofluid
Fig. 5. Adsorption of nanoaggregates on the surface of silica sensor at 25 °C, and SEM micrograph of the silica surfaces in secondary electron mode after adsorption test. [1 kV voltage,13 pA current, and 10 nm image resolution.]
W. Kuang et al. Fuel 220 (2018) 849–870
856

properties, next the effect of nanofluids on oil production is in-vestigated by conducting spontaneous imbibition experiments.Sandstone and carbonate core samples were employed to study theeffects of different mineralogies on nanofluid imbibition efficiency andoil production. In this section, dynamic IFT values between crude oiland aqueous phases were also measured since they are more relevant tospontaneous imbibition process than static IFTs. However, IFTs be-tween TiO2 nanofluids and crude oil could not be measured due to thefact that the solutions were opaque. The measurements were performedfor multiple bubbles per nanofluid and for duration of 5 h for eachbubble. The results presented in Fig. 6 show a similar trend compared tothe equilibrium IFT values between decane and nanofluids depicted inFig. 3.
In imbibition tests, we monitored not only the total amount of oilrecovered but also the rate of oil recovery since both parameters woulddetermine the efficiency of nanofluids as EOR agents and additives tofracturing fluids. Spontaneous imbibition is the main active mechanismduring the shut-in period after hydraulic fracturing. Therefore, rapidfluid imbibition can potentially decrease the shut-in period and im-prove the economy of production from hydraulically-fractured wells.The imbibition curves reported here were fitted to several independentmeasurements. We also include their corresponding standard devia-tions. The results for all imbibition tests are reported in Fig. 8. Theaverage values of porosity, permeability, and initial oil saturation foreach group are listed in Table 1. The primary goal of this study is tounderstand the mechanisms involved in oil recovery from porous rocksusing nanofluids; therefore, in this section we include the results of allthe tests that were conducted regardless of their performance. Due tothe absence of IFT values for TiO2 nanofluids, their imbibition curvesare not included here.
Fig. 8(a), (b), (g), and (h) show crude oil recovery versus time usingpure and anionic nanofluids. The recovery performance of these na-nofluids were better than that of the brine in both sandstone and car-bonate cores. We believe that IFT reduction was the main mechanismresponsible for better performance of pure and anionic nanofluids. Infact, the final oil recoveries correlated inversely with the values of IFT(i.e., higher recovery by nanofluids with lower IFT). For instance, theIFT between crude oil and SiOx-anionic surfactant nanofluid was ap-proximately 8 mN/m lower than that of the pure brine (see Fig. 6), andthe oil recovery from sandstone and carbonate cores were 2.8% and1.7% higher, respectively. Interestingly, the presence of silica nano-particles slightly decreased the oil recovery compared to the blankanionic solution due to its marginally higher IFT value (see Fig. 6).Furthermore, pure Al O2 3 nanofluid (IFTequilibrium =15.6mN/m, Fig. 6)had a better performance than pure SiOx nanofluid(IFTequilibrium =20.1mN/m, Fig. 6) in both rock samples. One shouldnote that pure nanofluids did not have any significant effect on dynamiccontact angles and anionic nanofluids only slightly reduced the valuesof contact angles. Therefore, we do not expect wettability alteration tobe a factor significantly impacting oil recovery using the above-men-tioned nanofluids.
Nonionic nanofluids, however, were the best performing colloidalsolutions in terms of oil recovery in both sandstone and carbonate coresamples (see Fig. 8(i) and (j)). For instance, Al O2 3 +nonionic surfactantnanofluid improved the final oil recovery by 5.7% and 6.3% in sand-stone and carbonate cores, respectively. Their performances were su-perior to those of pure brine and surfactant solutions. These nanofluidspossessed very low IFTs compared to other nanolfuids in this study. Thepresence of Al O2 3 and SiOx nanoparticles improved the efficiency of theblank nonionic surfactant solution. This can be attributed to the sy-nergistic effect of nanoparticles/nanoaggregates and surfactant mole-cules on the fluid/fluid interface and hence their slightly lower dynamicIFT values (see Fig. 6). Similar to previous group of nanofluids, becauseof minimal changes in wettability, we do not expect wettability al-teration to play a considerable role in enhancing oil recovery by thesenanofluids. Mirchi et al. [35] studied affinity of the same nonionic
0 50 100 150 200 250 3000
2
4
6
8
Vol
ume
%
Equivalent diameter (μm)(a) Berea sandstone
0 100 200 300 400 500 600 7000
5
10
15
20
Vol
ume
%
Equivalent diameter (μm)
(b) Edwards limestone
Fig. 7. Pore size distributions for (a) Berea sandstone; (b) Edwards limestone.
0 50 100 150 200 250 300 3500
5
10
15
20
25
30
NonionicPAA
AnionicIFT
(mN
/m)
Time (minutes)
Blank SiOx
Al2O3
Pure
Fig. 6. Dynamic interfacial tensions between nanofluids (0.1 wt% nanoparticles +0.1wt% chemical agents in 1mM brine) and crude oil at ambient conditions.
W. Kuang et al. Fuel 220 (2018) 849–870
857

surfactant to rock surfaces and measured contact angles at ambient andreservoir conditions. They reported insignificant wettability alterationsdue to the lack of electrostatic attractive forces.
Unlike previous nanofluids, sandstone and carbonate rocks showed
completely different production trends using OA and PAA nanofluids.We believe that wettability alteration due to co-adsorption of nanoag-gregate and chemical agent was partly responsible for this significantdifference. According to Austad and Standnes [52], the negatively
100 101 102 103 104 1050
10
20
30
40
50
60
Brine SiOX
Al2O3
Rec
over
y fa
ctor
(%)
Time (minutes)
(a) Pure-Sandstone
100 101 102 103 104 1050
10
20
30
40
50
60
Brine SiOX
Al2O3
Rec
over
y fa
ctor
(%)
Time (minutes)
(b) Pure-Carbonate
0
10
20
30
40
50
60
Brine OA OA+SiOX
OA+Al2O3
Rec
over
y fa
ctor
(%)
(c) OA-Sandstone
0
10
20
30
40
50
60 Brine OA OA+SiOX
OA+Al2O3
Rec
over
y fa
ctor
(%)
(d) OA-Carbonate
0
10
20
30
40
50
60
Brine PAA PAA+SiOX
PAA+Al2O3
Rec
over
y fa
ctor
(%)
(e) PAA-Sandstone
0
10
20
30
40
50
60
Brine PAA PAA+SiOX
PAA+Al2O3
Rec
over
y fa
ctor
(%)
(f) PAA-Carbonate
100 101 102 103 104 105
Time (minutes)100 101 102 103 104 105
Time (minutes)
100 101 102 103 104 105
Time (minutes)100 101 102 103 104 105
Time (minutes)
Fig. 8. Spontaneous imbibition conducted at ambient conditions.
W. Kuang et al. Fuel 220 (2018) 849–870
858

charged carboxyl groups, the most polar functional groups in crude oil,tend to adsorb onto carbonate rock surfaces. In this study, the coreswere left inside the crude oil for 12 h at ambient conditions, whichmight have been sufficient amount of time for the adsorption of crudeoil components to take place. In the case of carbonates, electrostaticattraction provides an extra driving force for the carboxyl groups tomigrate toward the positively-charged surface of the rock. Additionally,both oleic and polyacrylic acids contain carboxylic groups. The pre-viously-adsorbed crude oil components during vacuum-saturation ofdry carbonate cores would behave as anchor molecules during theimbibition process and promote co-adsorption of nanoaggregatescoated with OA and PAA molecules (see Fig. 4(d) and (e)) through bothpolar and hydrophobic interactions. In the case of sandstones, however,a weaker driving force exists for adsorption of oil components, nano-particles, and chemical agents on the rock surface. Therefore, we expectthat with the help of nanofluids made with OA and PAA, the carbonatesurfaces became less water-wet (i.e., intermediate-wet), while sand-stone surfaces remained water-wet. Consequently, the rate of oil re-covery and final oil production using both OA and PAA groups werelower than that of the brine in carbonate samples. While in sandstone,the water-wet surfaces and lower IFT values provided the most favor-able conditions for oil production [53]. We observed that more than50% of the oil inside the pore space was produced by the OA and PAAnanofluids in sandstones. However, the presence of nanoparticles did
not seem to have any positive effect, compared to blank solutions, onthe oil recovery in sandstone samples used in this study.
Cationic nanofluids were also tested for their spontaneous imbibi-tion behavior in this study. However, only a few drops of oil was pro-duced during the first few hours and oil production was insignificantafterwards for several weeks. As we showed earlier through dynamicadsorption and contact angle measurements, co-adsorption of nanoag-gregates and cationic surfactants on the mineral surfaces causes a sig-nificant alteration of wettability from water-wet to oil-wet. Under thiscondition, capillary pressure of the system becomes negative, whichmakes spontaneous imbibition unfavorable.
3.4. Nanofluid injection experiments
Using the spontaneous imbibition results, we selected one of thebest performing nanofluids (i.e., SiOx +nonionic surfactant) to conductcore-flooding measurements at 1000 psig and 60 °C. To generate datafor comparison, two more tests were conducted using SiOx nanofluidand base brine at the same experimental conditions. The oil productioncurves and the pressure drop across the core samples are presented inFig. 9. Interfacial tension and contact angle values between these so-lutions, crude oil, and rock samples were also measured at the sameexperimental conditions.
Similar trend as spontaneous imbibition was observed for Berea
0
10
20
30
40
50
60
Brine Nonionic Nonionic+SiOX
Nonionic+Al2O3
Rec
over
y fa
ctor
(%)
(i) Nonionic-Sandstone
0
10
20
30
40
50
60
Brine Nonionic Nonionic+SiOX
Nonionic+Al2O3
Rec
over
y fa
ctor
(%)
(j) Nonionic-Carbonate
0
10
20
30
40
50
60
Brine Anionic Anionic+SiOX
Rec
over
y fa
ctor
(%)
(g) Anionic-Sandstone
0
10
20
30
40
50
60
Brine Anionic Anionic+SiOX
Rec
over
y fa
ctor
(%)
(h) Anionic-Carbonate
100 101 102 103 104 105
Time (minutes)100 101 102 103 104 105
Time (minutes)
100 101 102 103 104 105
Time (minutes)100 101 102 103 104 105
Time (minutes)
Fig. 8. (continued)
W. Kuang et al. Fuel 220 (2018) 849–870
859

10-2 10-1 100 1010
10
20
30
40
50
60
70
Rec
over
y fa
ctor
(%)
Pore Volume Injected
Brine SiOx
Nonionic+SiOx
(a) Berea sandstone production curves
0 1 2 3 4 50
1
2
3
4 Brine SiOx
Nonionic+SiOx
Diff
eren
tial P
ress
ure
(psi
)
Pore Volume Injected
(b) Berea sandstone differentialpressure curves
10-2 10-1 100 1010
10
20
30
40
50
60
70
Rec
over
y fa
ctor
(%)
Pore Volume Injected
Brine SiOx Nonionic+SiOx
Nonionic+SiOx #2
(c) Edwards limestone production curves
0 1 2 3 4 50
5
10
15
20 Brine SiOx
Nonionic+SiOxD
iffer
entia
l Pre
ssur
e (p
si)
Pore Volume Injected
(d) Edwards limestone differentialpressure curves
0
20
40
60
80
100
120
140
160
180
SiOx+N91-8SiOxBrine
Con
tact
ang
le (d
eg)
Black --- Advancing contact angleRed --- Receding contact angle
Quartz Edwards
Brine SiOx SiOx+N91-8
(e) Contact angle
0
10
20
30
SiOx+N91-8SiOxBrine
IFT
(mN
/m)
(f) IFT
Fig. 9. Nanofluids injection along with corresponding dynamic contact angle and IFT results measured at 1000 psig and 60 °C.
W. Kuang et al. Fuel 220 (2018) 849–870
860

sandstone in terms of final recovery. For instance, the use of SiOx na-nofluid improved the recovery by 3.7%. This behavior is attributed tothe increase in viscosity from 0.467 to 0.634mPa s (measured at 1000psig and 60 °C, see Table 2) upon addition of SiOx to the solution. Thisphenomenon is also manifested by a relatively higher pressure dropduring SiOx nanofluid flooding compared to that of blank brine injec-tion in Fig. 9(b). On the other hand, IFT change can not be fully re-sponsible for this improved recovery since IFT of the blank brine so-lution and SiOx nanofluid are very similar. For SiOx +nonionicsurfactant nanofluid, however, the addition of nonionic surfactanthelped disperse the nanoparticles and created smaller nanoaggregatescompared to pure SiOx nanofluids (see Table 3). Therefore,SiOx +nonionic surfactant nanofluid had a lower viscosity that wascomparable to that of brine (i.e., 0.467 and 0.485mPa s, respectively).This resulted in lower differential pressure compared to SiOx nanofluidsduring flooding tests. In addition, the IFT of SiOx+nonionic surfactantnanofluid is one order of magnitude lower than that of the brine (13.2compared to 0.50mN/m). Therefore, a reduction in IFT due to sy-nergistic interaction between nanoparticles and surfactant molecules isthe main factor responsible for the incremental enhancement in oilrecovery (i.e., 6.2%).
In the case of Edwards limestone, similar to Berea sandstone, in-jection of SiOx nanofluid, which has a higher viscosity compared to thatof brine, resulted in a greater incremental recovery of 4.2%.Nevertheless, in contrast to the spontaneous imbibition results, an un-expectedly lower recovery was observed for SiOx +nonionic surfactantnanofluid. In order to interpret this result, a set of sedimentation tests(bottle tests) for SiOx +nonionic surfactant nanofluids made withbrine, pre-equilibrated with either sandstone or carbonate rocks, wasperformed at 60 °C using two see-through pressure cells. The results arepresented in Fig. 9. After 5 h, SiOx +nonionic surfactant nanofluidmade with pre-equilibrated brine with carbonate was unstable andlarge aggregates were formed and precipitated at the bottom of the cell.This is attributed to the presence of calcium ion in the brine equili-brated with carbonate. We believe that positively charged calcium ionstend to behave as bridging elements connecting negatively chargedcomplex micelles of nanoaggregates and surfactant molecules (see Fig.A1(a)). This effect could be aggravated at higher temperatures becauseof faster dissolution kinetics of carbonates and higher solubility ofcalcium ion. Furthermore, as shown in Fig. 7, Edwards limestone has awider pore size distribution with multiple peaks at both large and smallpore sizes compared to that of Berea sandstone. Therefore, there is agreater chance for the unstable nanoaggregates to plug throats as well
as small pores in the carbonate sample and cause formation damage.The pressure drop plots along the core sample in carbonate cores arepresented in Fig. 9(d). The use of SiOx+nonionic surfactant nanofluidin carbonate resulted in the highest differential pressure among allthree tests. This abnormal behavior in pressure drop is a clear indica-tion of pore-blockage. It is also worth mentioning that the electrostaticattraction between rock surface (positively charged) and SiOx nanoag-gregates (negatively charged) promotes adsorption/deposition in car-bonate rocks. Therefore, we believe that formation damage caused byunstable SiOx+nonionic surfactant nanoaggregates induced by hightemperature and the presence of calcium ions is responsible for thelower recovery seen in the case of Edwards limestone.
4. Conclusions
This study was focused on developing an improved understanding ofthe mechanisms responsible for oil recovery enhancement when na-nofluids are used. We first investigated the effects of fourteen nano-fluids on interfacial properties of nanofluid/oil/rock systems. The ex-perimental results revealed complex interactions betweennanoparticles/nanoaggregates, molecules of the chemical agents, androck surfaces. With the help of chemical agents the nanofluids studiedhere were able to reduce the interfacial tension between oil and brinephases. Furthermore, the initially water-wet rock surfaces showed twodistinct behaviors when they were exposed to nanofluids. A number ofnanofluids, such as the solutions made with the cationic surfactant andoleic acid, altered the wettability of the rock surfaces towards lesswater-wet, or even oil-wet. The co-adsorption of nanoaggregates andthe chemical agents at the rock surface was identified as the mechanismfor the observed wettability alteration. On the other hand, nanofluidsmade with the anionic surfactant made the surface slightly more water-wet. The arrangement of nanoparticles/nanoaggregates and surfactantmicelles at the brine film near the three-phase contact line and con-sequent increase in the disjoining pressure was considered responsiblefor the slightly smaller contact angles measured with these nanofluids.
We then examined the efficacy of nanofluids as additives to hy-draulic fracturing fluids and as enhanced oil recovery agents thoughspontaneous imbibition experiments. We found that while pure andanionic nanofluids enhanced oil production from both sandstone andcarbonate core samples, nonionic nanofluids were the most effectivecolloidal solutions for oil recovery from these mediums. The reductionin IFT was the main factor responsible for the trend observed. Similarly,PAA and OA nanofluids performed well in sandstone samples in termsof final oil recovery; however, in carbonate samples, they were noteffective compared to the performance shown by the blank brine so-lution. Low oil production in carbonates was believed to be caused bywettability alteration in these samples. SiOx +nonionic surfactant na-nofluid was further tested at high pressure and high temperature con-ditions by conducting core-flooding experiments in both sandstone andcarbonate rock samples. The results in Berea sandstone were promisingwith recovery enhancements up to 6.2%, while in carbonate samples,the presence of calcium ion at high temperatures was a prohibiting
Table 2Viscosity of fluids.
Fluids Viscosity, mPa s
Oil 1.352Water 0.467SiOx 0.634SiOx +Non 0.485
Table 3Aggregate sizes in nanofluids prepared with 0.1 wt% nanoparticles and 0.1 wt% chemical agents. The results are average values calculated from at least 10 SEM images and 3 DLSmeasurements.
Chemicals SiOx , nm Al O2 3, nm TiO2 , nm
SEM DLS SEM DLS SEM DLS
Blank 167 ± 29 258 ± 0 177 ± 20 179 ± 1 385 ± 171 269 ± 9OA 262 ± 41 219 ± 1 210 ± 54 279 ± 21 246 ± 45 268 ± 3PAA 139 ± 8 219 ± 4 132 ± 0 254 ± 7 114 ± 16 212 ± 12Cationic 248 ± 56 244 ± 1 223 ± 96 247 ± 1 225 ± 61 223 ± 6Anionic 250 ± 42 201 ± 1 277 ± 27 506 ± 32 – 417 ± 9Nonioinc 150 ± 56 198 ± 3 114 ± 59 167 ± 10 – 452 ± 14
W. Kuang et al. Fuel 220 (2018) 849–870
861
factor for a successful application of this specific nanofluid.We believe this study expands our fundamental understanding of
the underlying mechanisms involved in using nanofluids as fracturingfluids and EOR agents. However, further studies, such as in situ mon-itoring of fluid distributions before and after introduction of nanofluids,are required to provide more experimental evidences on the pore-scaledisplacement mechanisms responsible for the recovery trends observedin this study. We expect to establish a clear link between interfacialinteractions of different nanofluids to fluid distributions at the pore
scale and final oil recovery in our future studies.
Acknowledgement
We gratefully acknowledge the financial support of HessCorporation and the School of Energy Resources at the University ofWyoming. We also thank Dr. Patrick Johnson (University of Wyoming)for providing access to the DLS and QCM-D instruments.
Appendix A. Appendix: Stability analysis of nanofluids
A.1. Background
Stability of nanofluids is of great importance for engineering applications such as enhanced oil recovery. The high adsorption affinity of na-noparticles makes them susceptible to aggregation and consequently phases separation. This characteristic can hinder the potency of nanofluids tomanipulate the interfacial properties of reservoir rock and fluids. Furthermore, it may cause deposition of a solid phase near wellbore, which in turncan result in formation damage. The stability of nanofluids can be established by electrostatic stabilization (pH adjustment, ionic concentrationcontrol), steric stabilization (addition of surfactants or adsorption of polymers), and depletion stabilization (introduction of free polymers) [54].Since there is not any well-developed protocols to study the stability of nanofluids in the literature, researchers have been using wide range oftechniques for this purpose. Sedimentation test is the simplest and the most direct method to study this phenomenon. After a certain amount of time,the unstable nanoparticles in the solution will aggregate at the bottom of the bottle [54,55], which is a sign of instability. DLS can be used to test thestability of nanofluids by monitoring aggregate sizes in the solution [56]. Zeta potential measurement has also been used as a quantitative techniquefor characterization of colloidal stability [10,54,55,57,58]. The higher zeta potential at the surface of particles translates to higher electrostaticrepulsion forces, which results in more stable solutions. Moreover, Transmission Electron Microscopy (TEM) and Scanning Electron Microscopy(SEM) imaging techniques have been widely used as qualitative methods for this type of characterization [10,55,57,59,60]. The images can also beanalyzed quantitatively to obtain information regarding size and shape of particles or aggregates. However, each of these individual methods has itsdrawbacks and is not sufficient by itself. For instance, relying only on zeta potential measurements for the stability analysis of the solution un-dermines steric stabilization of nanoparticles. Similarly, sedimentation test and DLS measurements might not be reliable for opaque solutions. Also,sample preparations in TEM or SEM involve drying a drop of colloidal solution on TEM grids, which may cause larger aggregate sizes than in thesolution. Therefore, deploying any of these individual methods for stability studies will not lead to conclusive results.
A.2. Methods
A Zeta potential analyzer (ZetaPALS, Brookhaven) and a Helios 650 Nanolab (FEI) were used to measure zeta potential of nanopareticles, size ofnanoaagregates in colloidal solutions, and acquire images of nanoaggregates. A procedure was adopted from Ghadimi et al. [5] to prepare nanofluidsamples on TEM grids. Multiple SEM micrographs were then acquired in bright field mode from each sample (on TEM grid). The images were thenanalyzed by segmenting the aggregates (dark spots) compared to the white background in bright-field SEM micrographs using gray-scale thresh-holding in Image J software. The aggregate size results reported in this manuscript represents averaged nanoaggregate size and were obtainedthrough an extensive image analysis. The reported numbers are an average number obtained by averaging values for more than 600 of aggregatesover, at least, 10 micrographs for each individual value. The size of nanoaggregates was also calculated independently using DLS method (fornanoaggregates inside the colloidal solutions).
A.3. Stability analysis
We utilized several stability analysis methods reported in the literature including sedimentation test, zeta potential measurement, dynamic lightscattering, and SEM imaging of aggregates to perform a comprehensive stability study of nanofluids. Different mixtures of three nanoparticles (i.e.,SiO , Al Ox 2 3, and TiO2 ) and five chemical agents (i.e., OA, PAA, and a cationic, an anionic, and a nonionic surfactants) were used to prepare complexnanofluids.
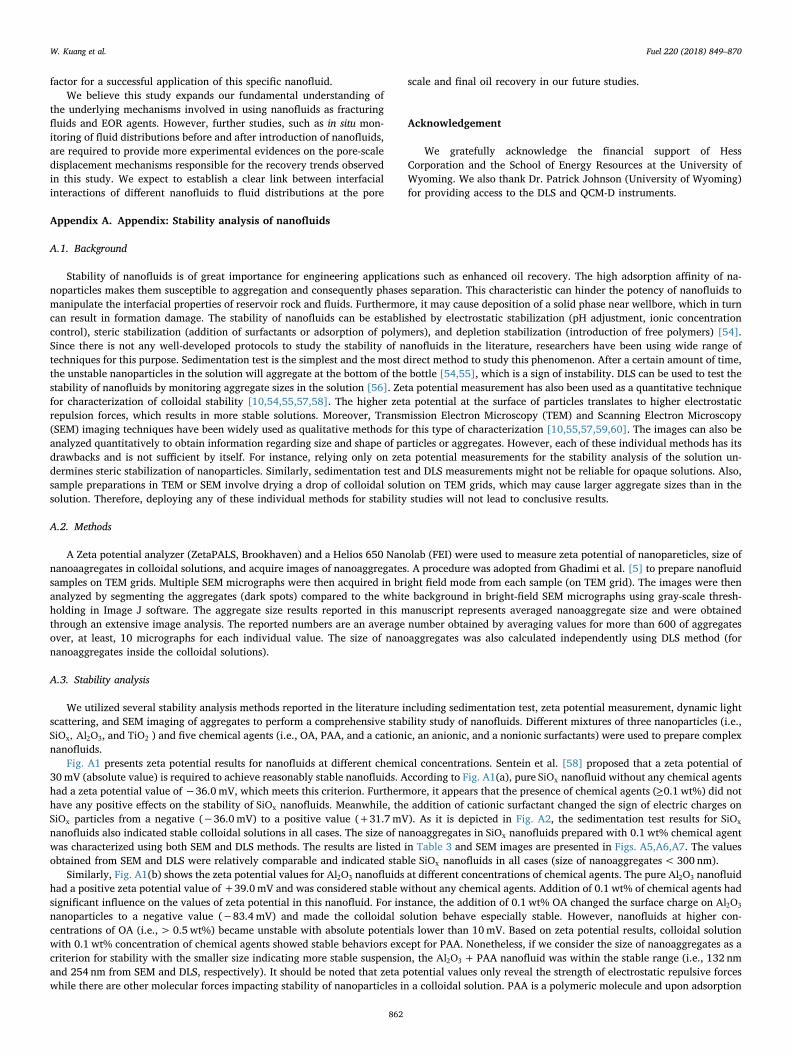
Fig. A1 presents zeta potential results for nanofluids at different chemical concentrations. Sentein et al. [58] proposed that a zeta potential of30 mV (absolute value) is required to achieve reasonably stable nanofluids. According to Fig. A1(a), pure SiOx nanofluid without any chemical agentshad a zeta potential value of −36.0 mV, which meets this criterion. Furthermore, it appears that the presence of chemical agents (≥0.1 wt%) did nothave any positive effects on the stability of SiOx nanofluids. Meanwhile, the addition of cationic surfactant changed the sign of electric charges onSiOx particles from a negative (−36.0 mV) to a positive value (+31.7mV). As it is depicted in Fig. A2, the sedimentation test results for SiOxnanofluids also indicated stable colloidal solutions in all cases. The size of nanoaggregates in SiOx nanofluids prepared with 0.1 wt% chemical agentwas characterized using both SEM and DLS methods. The results are listed in Table 3 and SEM images are presented in Figs. A5,A6,A7. The valuesobtained from SEM and DLS were relatively comparable and indicated stable SiOx nanofluids in all cases (size of nanoaggregates< 300 nm).
Similarly, Fig. A1(b) shows the zeta potential values for Al O2 3 nanofluids at different concentrations of chemical agents. The pure Al O2 3 nanofluidhad a positive zeta potential value of +39.0mV and was considered stable without any chemical agents. Addition of 0.1 wt% of chemical agents hadsignificant influence on the values of zeta potential in this nanofluid. For instance, the addition of 0.1 wt% OA changed the surface charge on Al O2 3nanoparticles to a negative value (−83.4 mV) and made the colloidal solution behave especially stable. However, nanofluids at higher con-centrations of OA (i.e., > 0.5 wt%) became unstable with absolute potentials lower than 10mV. Based on zeta potential results, colloidal solutionwith 0.1 wt% concentration of chemical agents showed stable behaviors except for PAA. Nonetheless, if we consider the size of nanoaggregates as acriterion for stability with the smaller size indicating more stable suspension, the Al O2 3 +PAA nanofluid was within the stable range (i.e., 132 nmand 254 nm from SEM and DLS, respectively). It should be noted that zeta potential values only reveal the strength of electrostatic repulsive forceswhile there are other molecular forces impacting stability of nanoparticles in a colloidal solution. PAA is a polymeric molecule and upon adsorption
W. Kuang et al. Fuel 220 (2018) 849–870
862

on Al O2 3 nanoparticles provides additional repulsive forces by steric hindrance, which resulted in an unexpectedly stable nanofluid. A previous studyby Viota et al. [61] reported that steric repulsion between polymer-covered particles could impose an energy barrier that hinders particle coagulationand stabilizes suspensions. Furthermore, the visual observation revealed deposition of Al O2 3 nanoparticles in anionic surfactant solution at thebottom of the container (see Fig. A3(d)). Fig. A6(e) presents an SEM micrograph of the aggregates in Al O2 3 +Anionic nanofluid. The nanofluid madewith anionic surfactant had the largest aggregate size (i.e., 277 nm and 506 nm from SEM and DLS, respectively), which further indicated a lessstable colloidal solution. Therefore, Al O2 3-anionic surfactant nanofluid was not used for further studies. Moreover, further addition of PAA andcationic surfactant (more than 0.1 wt%) destabilized the nanofluids since more and more deposits had settled at the bottom of the bottle (see Fig.A3).
The zeta potential results for TiO2 nanofluids are shown in Fig. A1(c). Pure TiO2 nanofluid without any chemical agents seemed to be unstablewith a zeta potential value of−6mV. Fig. A7(a) shows an example of TiO2 nanoaggregates suspended in a brine solution. The average aggregate sizeof pure TiO2 nanofluid was much larger than those of the others (i.e, 385 nm and 269 nm from SEM and DLS, respectively). The addition of 0.1 wt%OA decreased the zeta potential to −80mV and reduced the average diameter of TiO2 aggregates to 246 nm (SEM) and 268 nm (DLS), producing astable nanofluid (Fig. A7(b)). The addition of PAA and cationic surfactants also resulted in more stable fluids with −19.6 mV and +24.6 mV zetapotentials, respectively. The nanofluid made with PAA was the most stable one with the smallest aggregate diameter (i.e., 114 nm and 212 nm fromSEM and DLS, respectively). Similar to the zeta potential results for SiOx and Al O2 3 nanofluids, the addition of more than 0.1 wt% chemical agentshad either no significant effect or destabilized nanofluids. In addition, the visual observation of TiO2 +Anionic surfactant and TiO2 +Nonionicsurfactant nanofluids (see Fig. A4) revealed significant amounts of deposits at the bottom of the bottles after 12 h. This is further supported by thenanoaggregate sizes characterized by DLS and SEM methods. Both TiO2 +Anionic and TiO2 +Nonionic nanofluids had extremely large aggregate of417 nm (SEM) and 452 nm (DLS). These nanofluids were unstable and therefore were not included for further studies.
0.0 0.2 0.4 0.6 0.8 1.0-60
-40
-20
0
20
40
60OAPAACationicAnionicNonionic
Zeta
Pot
entia
l (m
V)
Chemical Agents Concentration (wt%)
(a) SiOx
0.0 0.2 0.4 0.6 0.8 1.0-100
-80
-60
-40
-20
0
20
40
60
Zeta
Pot
entia
l (m
V)
Chemical Agents Concentration (wt%)
OAPAACationicAnionicNonionic
(b) Al2O3
0.0 0.2 0.4 0.6 0.8 1.0-100
-80
-60
-40
-20
0
20
40
60
Zeta
Pot
entia
l (m
V)
Chemical Agents Concentration (wt%)
OAPAACationicAnionicNonionic
(c) TiO2
Pure OA PAA Cationic Anionic Nonionic-30
-20
-10
0
10
20
30
40
50
60
Zeta
Pot
entia
l (m
V)
Chemicals
(d) Crushed rock
Fig. A1. Zeta potential results for (a) SiOx , (b) Al O2 3, and (c) TiO2 nanofluids as a function of chemical agent concentration, (d) crushed rock samples dispersed in different blanksolutions.
W. Kuang et al. Fuel 220 (2018) 849–870
863

(a) SiOx+OA (b) SiOx+PAA
(c) SiOx+Cationic (d) SiOx+Anionic
(e) SiOx+Nonionic
Fig. A2. Sedimentation test results for SiOx nanofluids at ambient conditions after 12 h.
W. Kuang et al. Fuel 220 (2018) 849–870
864
(a) Al2O3+OA (b) Al2O3+PAA
(c) Al2O3+Cationic (d) Al2O3+Anionic
(e) Al2O3+Nonionic
Fig. A3. Sedimentation test results for Al O2 3 nanofluids at ambient conditions after 12 h.
W. Kuang et al. Fuel 220 (2018) 849–870
865

(a) TiO2+OA (b) TiO2+PAA
(c) TiO2+Cationic (d) TiO2+Anionic
(e) TiO2+Nonionic
Fig. A4. Sedimentation test results for TiO2 nanofluids at ambient conditions after 12 h.
W. Kuang et al. Fuel 220 (2018) 849–870
866

(a) Pure SiOx (b) SiOx+OA
(c) SiOx+PAA (d) SiOx+Cationic
(e) SiOx+Anionic (f) SiOx+Nonionic
Fig. A5. Bright field SEM micrographs of SiOx nanoaggregates.
W. Kuang et al. Fuel 220 (2018) 849–870
867

(a) Pure Al2O3 (b) Al2O3+OA
(c) Al2O3+PAA (d) Al2O3+Cationic
(e) Al2O3+Anionic (f) Al2O3+Nonionic
Fig. A6. Bright field SEM micrographs of Al O2 3 nanoaggregates.
W. Kuang et al. Fuel 220 (2018) 849–870
868

References
[1] Murshed SS, Tan S-H, Nguyen N-T. Temperature dependence of interfacial prop-erties and viscosity of nanofluids for droplet-based microfluidics. J Phys D: ApplPhys 2008;41(8):085502.
[2] Chaudhuri RG, Paria S. The wettability of PTFE and glass surfaces by nanofluids. JColloid Interface Sci 2014;434:141–51.
[3] Li S, Kaasa AT, Hendraningrat L, Torster O. Effect of silica nanoparticles adsorptionon the wettability index of Berea sandstone. Paper SCA2013-059 presented at theinternational symposium of the society of core analysts held in Napa ValleyCalifornia USA; 2013. p. 16–19.
[4] Wasan D, Nikolov A, Kondiparty K. The wetting and spreading of nanofluids onsolids: Role of the structural disjoining pressure. Curr Opin Colloid Interface Sci2011;16(4):344–9.
[5] Ghadimi A, Saidur R, Metselaar H. A review of nanofluid stability properties andcharacterization in stationary conditions. Int J Heat Mass Transf2011;54(17):4051–68.
[6] Rubilar O, Rai M, Tortella G, Diez MC, Seabra AB, Durán N. Biogenic nanoparticles:copper, copper oxides, copper sulphides, complex copper nanostructures and theirapplications. Biotechnol Lett 2013;35(9):1365–75.
[7] Tungittiplakorn W, Lion LW, Cohen C, Kim J-Y. Engineered polymeric nanoparticlesfor soil remediation. Environ Sci Technol 2004;38(5):1605–10.
[8] Abdo J, Haneef M. Clay nanoparticles modified drilling fluids for drilling of deephydrocarbon wells. Appl Clay Sci 2013;86:76–82.
[9] Karimi A, Fakhroueian Z, Bahramian A, Pour Khiabani N, Darabad JB, Azin R, AryaS. Wettability alteration in carbonates using zirconium oxide nanofluids: EOR im-plications. Energy Fuels 2012;26(2):1028–36.
[10] Ehtesabi H, Ahadian MM, Taghikhani V, Ghazanfari MH. Enhanced heavy oil re-covery in sandstone cores using TiO2 nanofluids. Energy Fuels 2013;28(1):423–30.
[11] Amraei A, Fakhroueian Z, Bahramian A. Influence of new SiO2 nanofluids on sur-face wettability and interfacial tension behaviour between oil-water interface inEOR processes. J Nano Res 2014;26:1–8.
[12] Ravera F, Santini E, Loglio G, Ferrari M, Liggieri L. Effect of nanoparticles on theinterfacial properties of liquid/liquid and liquid/air surface layers. J Phys Chem B2006;110(39):19543–51.
[13] Binks BP, Rodrigues JA, Frith WJ. Synergistic interaction in emulsions stabilized bya mixture of silica nanoparticles and cationic surfactant. Langmuir2007;23(7):3626–36.
[14] Eskandar NG, Simovic S, Prestidge CA. Interactions of hydrophilic silica nano-particles and classical surfactants at non-polar oil-water interface. J ColloidInterface Sci 2011;358(1):217–25.
[15] Saleh N, Sarbu T, Sirk K, Lowry GV, Matyjaszewski K, Tilton RD. Oil-in-wateremulsions stabilized by highly charged polyelectrolyte-grafted silica nanoparticles.
Langmuir 2005;21(22):9873–8.[16] Vafaei S, Borca-Tasciuc T, Podowski M, Purkayastha A, Ramanath G, Ajayan P.
Effect of nanoparticles on sessile droplet contact angle. Nanotechnology2006;17(10):2523.
[17] Cieśliński JT, Krygier KA. Sessile droplet contact angle of water–Al2O3, water–TiO2
and water–Cu nanofluids. Exp Thermal Fluid Sci 2014;59:258–63.[18] Ju B, Fan T. Experimental study and mathematical model of nanoparticle transport
in porous media. Powder Technol 2009;192(2):195–202.[19] Hendraningrat L, Li S, Torster O. A coreflood investigation of nanofluid enhanced
oil recovery. J Petrol Sci Eng 2013;111:128–38.[20] Giraldo J, Benjumea P, Lopera S, Corteüs FB, Ruiz MA. Wettability alteration of
sandstone cores by alumina-based nanofluids. Energy Fuels 2013;27(7):3659–65.[21] Dehghan Monfared A, Ghazanfari MH, Jamialahmadi M, Helalizadeh A. The po-
tential application of silica nanoparticles for wettability alteration of oil-wet calcite:a mechanistic study, Energy Fuels.
[22] Dai C, Wang X, Li Y, Lv W, Zou C, Gao M, Zhao M. Spontaneous imbibition in-vestigation of self-dispersing silica nanofluids for enhanced oil recovery in low-permeability cores. Energy Fuels 2017;31(3):2663–8.
[23] Wasan DT, Nikolov AD. Spreading of nanofluids on solids. Nature2003;423(6936):156–9.
[24] Esfandyari Bayat A, Junin R, Samsuri A, Piroozian A, Hokmabadi M. Impact ofmetal oxide nanoparticles on enhanced oil recovery from limestone media at severaltemperatures. Energy Fuels 2014;28(10):6255–66.
[25] Moradi B, Pourafshary P, Jalali F, Mohammadi M, Emadi M. Experimental study ofwater-based nanofluid alternating gas injection as a novel enhanced oil-recoverymethod in oil-wet carbonate reservoirs. J Nat Gas Sci Eng 2015;27:64–73.
[26] Hendraningrat L, Torster O. Metal oxide-based nanoparticles: revealing their po-tential to enhance oil recovery in different wettability systems. Appl Nanosci2015;5(2):181–99.
[27] Roustaei A, Saffarzadeh S, Mohammadi M. An evaluation of modified silica nano-particles efficiency in enhancing oil recovery of light and intermediate oil re-servoirs. Egypt J Petrol 2013;22(3):427–33.
[28] Joonaki E, Ghanaatian S. The application of nanofluids for enhanced oil recovery:effects on interfacial tension and coreflooding process. Pet Sci Technol2014;32(21):2599–607.
[29] Shahrabadi A, Bagherzadeh H, Roostaie A, Golghanddashti H. Experimental in-vestigation of HLP nanofluid potential to enhance oil recovery: A mechanistic ap-proach. In: SPE International Oilfield Nanotechnology Conference and Exhibition.
[30] Youssif MI, El-Maghraby RM, Saleh Sayed M, Elgibaly A. Silica nanofluid floodingfor enhanced oil recovery in sandstone rocks. Elsevier; 2017.
[31] Li S, Torsæter O. An experimental investigation of EOR mechanisms for nano-particles fluid in glass micromodel. Paper SCA2014-022 was prepared for pre-sentation at the International Symposium of the Society of Core Analysts held inAvignon, France; 2014. 8–11.
(a) Pure TiO2 (b) TiO2+OA
(c) TiO2+PAA (d) TiO2+Cationic
Fig. A7. Bright field SEM micrographs of TiO2 nanoaggregates.
W. Kuang et al. Fuel 220 (2018) 849–870
869

[32] Barati R, Johnson SJ, McCool S, Green DW, Willhite GP, Liang J-T. Fracturing fluidcleanup by controlled release of enzymes from polyelectrolyte complex nano-particles. J Appl Polym Sci 2011;121(3):1292–8.
[33] Barati R, Johnson SJ, McCool S, Green DW, Willhite GP, Liang J-T. Polyelectrolytecomplex nanoparticles for protection and delayed release of enzymes in alkaline pHand at elevated temperature during hydraulic fracturing of oil wells. J Appl PolymSci 2012;126(2):587–92.
[34] Crews JB, Huang T, et al. Performance enhancements of viscoelastic surfactantstimulation fluids with nanoparticles. In: Europec/EAGE Conference andExhibition, Society of Petroleum Engineers; 2008.
[35] Mirchi V, Saraji S, Goual L, Piri M. Dynamic interfacial tension and wettability ofshale in the presence of surfactants at reservoir conditions. Fuel 2015;148:127–38.
[36] Saraji S, Piri M. The representative sample size in shale oil rocks and nano-scalecharacterization of transport properties. Int J Coal Geol 2015;146:42–54.
[37] Saraji S, Goual L, Piri M, Plancher H. Wettability of supercritical carbon dioxide/water/quartz systems: simultaneous measurement of contact angle and interfacialtension at reservoir conditions. Langmuir 2013;29(23):6856–66.
[38] Saraji S, Goual L, Piri M. Wettability in CO2/Brine/Quartz Systems: AnExperimental Study at Reservoir Conditions. SPE Annual Technical Conference andExhibition.
[39] Hovgaard MB, Dong M, Otzen DE, Besenbacher F. Quartz crystal microbalancestudies of multilayer glucagon fibrillation at the solid-liquid interface. Biophys J2007;93(6):2162–9.
[40] Hu X, Hu S, Jin F, Huang S. Physics of petroleum reservoirs. Springer; 2017.[41] Alizadeh A, Khishvand M, Ioannidis M, Piri M. Multi-scale experimental study of
carbonated water injection: an effective process for mobilization and recovery oftrapped oil. Fuel 2014;132:219–35.
[42] Hashemi R, Nassar NN, Almao PP. Nanoparticle technology for heavy oil in-situupgrading and recovery enhancement: opportunities and challenges. Appl Energy2014;133:374–87.
[43] Buckley J, Liu Y. Some mechanisms of crude oil/brine/solid interactions. J PetrolSci Eng 1998;20(3):155–60.
[44] Gomari KR, Denoyel R, Hamouda A. Wettability of calcite and mica modified bydifferent long-chain fatty acids (C18 acids). J Colloid Interface Sci2006;297(2):470–9.
[45] Radiom M, Yang C, Chan WK. Dynamic contact angle of water-based titanium oxidenanofluid. Nanoscale Res Lett 2013;8(1):1.
[46] Chengara A, Nikolov AD, Wasan DT, Trokhymchuk A, Henderson D. Spreading ofnanofluids driven by the structural disjoining pressure gradient. J Colloid InterfaceSci 2004;280(1):192–201.
[47] Mcelfresh PM, Olguin C, Ector D. The application of nanoparticle dispersions to
remove paraffin and polymer filter cake damage. SPE International Symposium andExhibition on Formation Damage Control.
[48] Seid Mohammadi M, Moghadasi J, Naseri S. An experimental investigation ofwettability alteration in carbonate reservoir using γ -Al2O3 nanoparticles. Iran J OilGas Sci Technol 2014;3(2):18–26.
[49] Singh SK, Khandekar S, Pratap D, Ramakrishna SA. Wetting dynamics and eva-poration of sessile droplets on nano-porous alumina surfaces. Colloids Surf, A2013;432:71–81.
[50] Ran C, Ding G, Liu W, Deng Y, Hou W. Wetting on nanoporous alumina surface:transition between Wenzel and Cassie states controlled by surface structure.Langmuir 2008;24(18):9952–5.
[51] Abudu A, Goual L. Adsorption of crude oil on surfaces using quartz crystal micro-balance with dissipation (QCM-D) under flow conditions. Energy Fuels2009;23(3):1237–48.
[52] Austad T, Standnes DC. Spontaneous imbibition of water into oil-wet carbonates. JPetrol Sci Eng 2003;39(3):363–76.
[53] Blunt MJ. Physically-based network modeling of multiphase flow in intermediate-wet porous media. J Petrol Sci Eng 1998;20(3):117–25.
[54] Witharana S, Palabiyik I, Musina Z, Ding Y. Stability of glycol nanofluids the theoryand experiment. Powder Technol 2013;239:72–7.
[55] Yang L, Du K, Zhang XS, Cheng B. Preparation and stability of Al2O3 nano-particlesuspension of ammonia–water solution. Appl Therm Eng 2011;31(17):3643–7.
[56] Fedele L, Colla L, Bobbo S, Barison S, Agresti F. Experimental stability analysis ofdifferent water-based nanofluids. Nanoscale Res Lett 2011;6(1):1–8.
[57] Metin CO, Lake LW, Miranda CR, Nguyen QP. Stability of aqueous silica nano-particle dispersions. J Nanopart Res 2011;13(2):839–50.
[58] Sentein C, Guizard B, Giraud S, Yé C, Ténégal F. Dispersion and stability of TiO2nanoparticles synthesized by laser pyrolysis in aqueous suspensions. J Phys: ConfSer 2009;170(1):012013.
[59] Chung SJ, Leonard JP, Nettleship I, Lee J-K, Soong Y, Martello DV, Chyu MK.Characterization of ZnO nanoparticle suspension in water: effectiveness of ultra-sonic dispersion. Powder Technol 2009;194(1):75–80.
[60] Chang H, Tsung T-T, Chen L-C, Yang Y-C, Lin H-M, Han L-L, Lin C-K. TiO2 nano-particle suspension preparation using ultrasonic vibration-assisted arc-submergednanoparticle synthesis system (ASNSS). Mater Trans 2004;45(3):806–11.
[61] Viota J, De Vicente J, Duran J, Delgado A. Stabilization of magnetorheologicalsuspensions by polyacrylic acid polymers. J Colloid Interface Sci2005;284(2):527–41.
[62] Zhang H, Nikolov A, Wasan D. Enhanced oil recovery (EOR) using nanoparticledispersions: underlying mechanism and imbibition experiments. Energy Fuels2014;28(5):3002–9.
W. Kuang et al. Fuel 220 (2018) 849–870
870