Embed Size (px)
Citation preview

Article
A Systematic Evaluation o
f Methods for TailoringGenome-Scale Metabolic ModelsGraphical Abstract
Highlights
d Hundreds of models have been built for four cancer cell lines
d The performance of model extraction algorithms and
parameter sets are evaluated
d Different parameters and algorithms yielded diverse models
d Extraction method most strongly affected accuracy of gene-
essentiality predictions
Opdam et al., 2017, Cell Systems 4, 1–12March 22, 2017 ª 2017 Elsevier Inc.http://dx.doi.org/10.1016/j.cels.2017.01.010
Authors
Sjoerd Opdam, Anne Richelle,
Benjamin Kellman, Shanzhong Li,
Daniel C. Zielinski, Nathan E. Lewis
In Brief
This study presents a comparative
analysis of hundreds of models built for
four different cancer cell lines using
several prominent model extraction
algorithms. The evaluation provides
insights into how their assumptions affect
the prediction capabilities of context-
specific models.

Please cite this article in press as: Opdam et al., A Systematic Evaluation of Methods for Tailoring Genome-Scale Metabolic Models, Cell Systems(2017), http://dx.doi.org/10.1016/j.cels.2017.01.010
Cell Systems
Article
A Systematic Evaluation of Methods for TailoringGenome-Scale Metabolic ModelsSjoerd Opdam,1,2,6 Anne Richelle,2,3,6 Benjamin Kellman,2,4 Shanzhong Li,2,5 Daniel C. Zielinski,2,5
and Nathan E. Lewis2,3,4,7,*1Department of Biomedical Engineering, Computational Biology, Eindhoven University of Technology, 5612 AZ Eindhoven, the Netherlands2Novo Nordisk Foundation Center for Biosustainability at UC San Diego3Department of Pediatrics
University of California, San Diego, School of Medicine, La Jolla, CA 92093, USA4Bioinformatics and Systems Biology Program, University of California, San Diego, La Jolla, CA 92093, USA5Department of Bioengineering, University of California, San Diego, La Jolla, CA 92093, USA6Co-first author7Lead Contact
*Correspondence: [email protected]
http://dx.doi.org/10.1016/j.cels.2017.01.010
SUMMARY
Genome-scale models of metabolism can illumi-nate the molecular basis of cell phenotypes. Sincesome enzymes are only active in specific cell types,several algorithms use omics data to constructcell-line- and tissue-specific metabolic models fromgenome-scale models. However, these methodsare often not rigorously benchmarked, and it is un-clear how algorithm and parameter selection (e.g.,gene expression thresholds, metabolic constraints)affects model content and predictive accuracy. Toinvestigate this, we built hundreds of models offour different cancer cell lines using six algorithms,four gene expression thresholds, and three sets ofmetabolic constraints. Model content varied sub-stantially across different parameter sets, but thealgorithms generally increased accuracy in geneessentiality predictions. However, model extractionmethod choice had the largest impact on modelaccuracy. We further highlight how assumptionsduring model development influence model pre-diction accuracy. These insights will guide furtherdevelopment of context-specific models, thusmore accurately resolving genotype-phenotype re-lationships.
INTRODUCTION
Large-scale omics experiments are now standard in many
biological studies, and many methods exist to interpret these
data. One emerging approach uses genome-scale metabolic
models (GEMs) as valuable systems biology platforms for
model-guided data analysis of large omics datasets, since they
provide cellular context to the data (Hyduke et al., 2013). Further-
more, they allow the integration of diverse omics data since they
catalog all metabolic reactions in an organism, and the reactions
directly link metabolites to enzymes. They can further elucidate
how changes in one component affect other pathways and
cell phenotypes since these models connect genes to measur-
able cell phenotypes (e.g., growth, cell energetics, pathway
fluxes, biosynthesis of cell components, byproduct secretion,
etc.) (Lewis et al., 2012). Thus, these systems biology models
can provide a mechanistic link from genotype to phenotype,
leading to novel insights and guiding further experiments. For
example, these models have helped identify antimicrobial and
anti-cancer drug targets (Folger et al., 2011; Frezza et al.,
2011; Ho Sui et al., 2012; Kim et al., 2014; Lewis and Abdel-Ha-
leem, 2013; Shen et al., 2010; Yizhak et al., 2015) and identify
mechanisms underlying other diseases (Lewis et al., 2010; Mar-
dinoglu et al., 2014), among many other applications (Bordbar
et al., 2014).
Recent algorithmic developments have claimed to allow
researchers to build GEMs that more accurately capture the
metabolism of individual tissues or cell types. Specifically,
GEMs include all reactions in an organism, but not all enzymes
are active in a given tissue or cell line (Uhlen et al., 2015). There-
fore, algorithms have been developed to extract cell-line- or
tissue-specific models (sometimes referred to more generally
as context-specific models) that recapitulate the metabolism of
specific cell types (Becker and Palsson, 2008; Wang et al.,
2012; Zur et al., 2010). A context-specific model is a subset of
the GEM, in which inactive reactions are removed. Reaction
removal is determined by the algorithm used, gene expression
levels, presence of proteins or metabolites, experimental data
availability, literature knowledge, and/or predefined metabolic
functions of the cell type that need to be maintained in the ex-
tracted model.
It is assumed that context-specific models better represent
the actual metabolism of a cell or tissue. Initial procedures for
testing context-specific models have been proposed (Pa-
checo et al., 2015), but the assumptions underlying the extrac-
tion methods have not been rigorously tested for mammalian
models. Thus, here we evaluate the performance of several
prominent model extraction algorithms, analyze the impact of
their assumptions, and quantify the influence of key decisions
that must be made when building cell-line- and tissue-specific
Cell Systems 4, 1–12, March 22, 2017 ª 2017 Elsevier Inc. 1

Table 1. The MEMs Tested in This Study
MEM Description Data Type and Usage
Handling Missing
Expression Evidence
(Orphan/Missing Data)
Requires
Metabolic
Objective
FASTCORE
(Vlassis et al., 2014)
Define one set of core reactions that is
guaranteed to be active in the extracted
model and find the minimum number of
reactions possible to support the core.
Any data type can be used
to define the core reaction set.
removed if not necessary
to support core reactions
no
GIMME (Becker and
Palsson, 2008)
Minimize usage of low-expression
reactions while keeping the objective
(e.g., biomass) above a certain value.
Does not favor inclusion of reactions
not related to the objective.
Transcriptomic data are most
straightforward to define
low-expressed reactions and
their respective weights.
does not explicitly favor
removal or inclusion
yes
iMAT (Shlomi et al.,
2008) (Zur et al., 2010)
Find the optimal trade-off between
including high-expression reactions
and removing low-expression reactions.
Any data type can be used to
define high- and low-expression
reactions.
does not explicitly favor
removal or inclusion
no
INIT (Agren et al.,
2012)
Find the optimal trade-off between
including and removing reactions
based on their given weights. If
desired, accumulation of certain
metabolites can be allowed or even
forced.
Any data type can be used to
define the weights. Assignment
of weights based on the data
can be done in multiple ways.
removal or inclusion
determined by user-
defined weights
no
MBA (Jerby et al.,
2010)
Define high-confidence reactions to
ensure activity in the extracted model.
Medium confidence reactions are only
kept when a certain parsimony trade-off
is met. In random order, prune other
reactions and remove them if not
required to support high- or medium-
confidence reactions.
Any data type can be used to
define the high- and medium
confidence reactions.
removed if not necessary
to support high- or medium
confidence reactions
no
mCADRE (Wang et al.,
2012)
Define a set of core reactions and prune
all other reactions based on their
expression, connectivity to core and
confidence score. Remove reactions
not necessary to support the core or
defined functionalities. Core reactions
are only removed if supported by a
certain number of zero-expression
reactions.
Transcriptomic data are most
straightforward to determine
the order of pruning, the core
reactions, and the zero-
expression reactions.
removed if not necessary
to support core reactions
no
Please cite this article in press as: Opdam et al., A Systematic Evaluation of Methods for Tailoring Genome-Scale Metabolic Models, Cell Systems(2017), http://dx.doi.org/10.1016/j.cels.2017.01.010
models. We do this through the comparative analysis of hun-
dreds of models, extracted for four cancer cell lines (A375,
HL60, K562, and KBM7). Models were built after constraining
the genome-scale model of human metabolism using three
sets of constraints based on exometabolomics data. Six algo-
rithms (MBA, mCADRE, GIMME, INIT, iMAT, and FastCore)
were used to build extracted models based on four gene
expression thresholds to specify the active genes in each cell
line from RNA sequencing (RNA-seq). We analyzed the con-
tent of the models and tested their ability to predict gene
essentiality, as measured using CRISPR-Cas9-mediated loss-
of-function screens. We further test the ability of algorithms
to discover the metabolic functions of individual cell types,
based solely on omics data. Through this effort we elucidate
a hierarchy of three key decisions (i.e., algorithm used, gene
expression threshold, and input model constraint) that signifi-
cantly affect the accuracy of cell-line- and tissue-specific
models, and also provide guidelines for the future development
of more accurate algorithms.
2 Cell Systems 4, 1–12, March 22, 2017
RESULTS
Model extraction methods (MEMs) employ diverse algorithms
to extract cell-line- or tissue-specific models from a GEM
(Table 1). The MEMs we have considered can be categorized
into three families: ‘‘GIMME-like’’ (i.e., GIMME), ‘‘iMAT-like’’
(i.e., iMAT and INIT), and ‘‘MBA-like’’ (i.e., MBA, FASTCORE,
and mCADRE), as proposed previously (Robaina Estevez and
Nikoloski, 2014). The GIMME-like family minimizes flux through
reactions associated with low gene expression. The iMAT-like
family finds an optimal trade-off between removing reactions
associated with low gene expression, and keeping reactions
whose genes/enzymes are highly expressed. In the MBA-like
family, the algorithms use sets of core reactions that should be
retained and active, while removing other reactions if possible.
Different MEMs were often explicitly designed to integrate
specific omics data types (e.g., transcriptomics, proteomics,
metabolomics, etc.), but can easily and intuitively be adapted
to use other types, such as RNA-seq and exometabolomics,

Semi-constrained
Constrained
Inputmodels
Unconstrained
Contemodels
v. Evaluate performance
of modelsii. Applydi erent
constraints
iv. Applydi erent
MEMs
Recon1
FPKM (log10)-4 -3 -2 -1 0 1 2 3 4
Freq
uenc
y
0
100
200
300
400
500K562 Gene-expression
top 10%Meantop 25%top 50%
A
B
dnegeLi. Addition
of biomass function
iii. Applydi erent
geneexpressionthresholds
GeneEssentiality
MetabolicFunctionality
Model with biomass functionModel without biomass functionTop 10 percentTop 25 percent
MeanTop 50 percent
FastCoreINIT
iMATmCADREMBAGIMME*
*GIMME was not used to extract model without biomass function
Figure 1. Hundreds of Cancer Cell-Line-Specific Models Were Constructed to Evaluate Different Approaches to Model Extraction
(A) For four cell lines, 528 cell-line-specific models were built from three input models with different metabolite uptake/secretion constraint sets, six different
MEMs, and four expression thresholds.
(B) Most algorithms require users to define which genes are ‘‘expressed,’’ so we defined four thresholds, as shown here for the K562 cell line.
Please cite this article in press as: Opdam et al., A Systematic Evaluation of Methods for Tailoring Genome-Scale Metabolic Models, Cell Systems(2017), http://dx.doi.org/10.1016/j.cels.2017.01.010
which we use in this study. See STAR Methods for detailed de-
scriptions of the MEMs tested in this study, parameter selection,
and details on small simplifications to MEMs to ensure consis-
tency of comparisons (e.g., use of a single threshold for iMAT).
Models are Extracted for Four Cancer Cell LinesWhen extracting a cell-line-specific model, several decisions
must be made. Three most salient are (1) how to constrain
theuptakeandsecretionfluxes in themodel prior tomodel extrac-
tion, (2) which MEM algorithm to use for extraction, and (3) the
threshold used to call a gene ‘‘expressed.’’ In this study, we
analyzed how these decisions affect the model content, predic-
tive capacity for geneessentiality, andability to capturemetabolic
functionality (Figure 1A) for four different cancer cell lines (i.e.,
A375melanomacells andHL60, KBM7, andK562 leukemia cells).
We built models from Recon 1 (Duarte et al., 2007). Models were
built both with and without the addition of a biomass function,
consisting of 56 metabolites required for growth (Table S1). To
ensure the robustnessof the resultsof this study,we further varied
the setup parameters. For example, qualitatively similar results
were obtained with a recently published update to the human
GEM, Recon 2.2 (Swainston et al., 2016). Moderate variations of
the biomass function composition and non-growth-associated
maintenance factor also resulted in similar results (see STAR
Cell Systems 4, 1–12, March 22, 2017 3

A375 HL60 K562 KBM7
Num
ber o
f Rea
ctio
ns
200
400
600
800
1000
1200
1400
1600
1800
2000
A375 HL60 K562 KBM7
Num
ber o
f Rea
ctio
ns
200
400
600
800
1000
1200
1400
1600
1800
2000
2 4 6 81 3 5 70
105%
20
30
40
Exp
lain
ed v
aria
nce
(%)
1 2 3 41 2 3 40
20
40
60
80
Principal component
Principal component
Exp
lain
ed v
aria
tion
in e
ach
PC
(%)
ThresholdMethodConstraint
−3 −2 −1 0 1 2 3−4
−3
−2
−1
0
1
2
PC1 (41.9485%)
PC2
(11.
0524
%)
−3 −2 −1 0 1 2 3−4
−3
−2
−1
0
1
2
PC1 (41.9%)
PC2
(11.
1%)
Threshold
top 10%Meantop 25%top 50%
−3 −2 −1 0 1 2 3−5
−4
−3
−2
−1
0
1
2
3
PC1 (41.9485%)
PC3
(8.9
676%
)
−3 −2 −1 0 1 2 3−5
−4
−3
−2
−1
0
1
2
3
PC1 (41.9%)
PC3
(9.0
%)
Constraint
UnconstrainedSemi-constrainedConstrained
A375HL60K562KBM7
A B
C
ED
Figure 2. Decisions in Cell-Line-Specific
Model Extraction Considerably Affect Model
Content
(A) Seventy-two different combinations of algorithms
and reasonable parameter sets led to a large diversity
of cell-line-specific models of different sizes.
(B) The first four principal components (PCs) explain
most of the variance in reaction content of themodels.
(C) The gene expression threshold contributes the
most to the first PC for all cell lines and the model
constraint selection dominates the third PC. TheMEM
contributes significantly to each PC. Error bars indi-
cate SE across the four cell lines.
(D and E) The influence of expression threshold
selection is clear in the first PC for the K562 cell line
(D), while the model scores of the third principal
component for the K562 cell line is clearly influenced
by the constraint type that was used to extract the
models (E).
Please cite this article in press as: Opdam et al., A Systematic Evaluation of Methods for Tailoring Genome-Scale Metabolic Models, Cell Systems(2017), http://dx.doi.org/10.1016/j.cels.2017.01.010
Methods and Figures S1 and S2). Finally, some MEMs can pro-
duce multiple models that differ in a small number of reactions
(e.g., iMATandMBA) and these alternatemodels provided similar
results in this study (see STAR Methods and Figures S3 and S4).
To allow the comparison of different constraints, we developed
three different inputmodels for the twodifferent setupsof Recon 1
(i.e., with and without a biomass function). We call the three
input models the ‘‘unconstrained,’’ ‘‘semi-constrained,’’ and
‘‘constrained’’ models (Figure 1A), and these three input models
differed in if andhowexometabolomicdatawereused toconstrain
exchange reactions (metabolite uptake and secretion reactions) in
Recon 1. Specifically, the unconstrained model has all exchange
reactions open, so it can take up or excrete all metabolites
allowed by the reconstruction. For the semi-constrained models,
exchange reactions are qualitatively constrained to a specific
directionality based on if the metabolites were taken up or
secreted in exometabolomic datasets (Jain et al., 2012). The con-
strained models have quantitatively constrained uptake and
secretion rates for the measured metabolites. Quantitative values
were based on changes in metabolite levels in the media of a
panel of cancer cell lines (Jain et al., 2012). In each input model,
biomass was constrained to the experimentally measured growth
rate of the cell lines (see STAR Methods for more detail).
We built cell-line-specific models using RNA-seq data
(B€urckst€ummer et al., 2013; Di Ruscio et al., 2013; Pawlikowski
et al., 2013; Zhang et al., 2015) to specify active genes in each
cell line. Active genes are identified by many algorithms based
on a quantitative threshold of expression. To cover a range of
4 Cell Systems 4, 1–12, March 22, 2017
representative thresholds, four gene expres-
sion thresholds were defined to specify
which genes are ‘‘expressed’’ in the models:
top 10%, mean, top 25%, and top 50% (Fig-
ures 1B and S5).
To test the predictive capacity of the
models against experimental gene essenti-
ality, we used CRISPR-Cas9 loss-of-func-
tion screens for each cell line (Shalem
et al., 2014; Wang et al., 2014, 2015). We
also tested the capacity of each extracted
model to recover a panel of metabolic functionalities defined
based on the biomass function.
In summary, 528models were built from Recon 1 (288 and 240
models with and without the biomass function, respectively)
using three types of constraints, six MEMs (Table 1), and four
expression thresholds for four different cancer cell lines. Thus,
these provided a controlled set of models to assess the influence
of experimental data, algorithm, and related parameter settings
on the content and performance of the extracted model.
Model Content Is Most Affected by Threshold SelectionDecisions regarding gene expression threshold, algorithm
choice, and the exchange constraints affect the content of our
cell-line-specific models. Specifically, the extracted cell-line-
specific models varied considerably in size from <600 reactions
to >1,800 reactions (Figure 2A). To assess the impact of each de-
cision on model content, we conducted a principal component
analysis (PCA) of the reactions in all models for each cell line.
The first principal component explains >40% of the overall vari-
ance in reaction content for each cell line (Figure 2B). In all four
cell lines, the choice of gene expression threshold provides the
most significant contribution to the variation in the first principal
component (p < 1.53 10�13; Figures 2C, 2D, and S6).
MEM selection provides a moderate contribution to the ex-
plained variation in each principal component (Figure 2C). Mean-
while, the type of uptake/secretion constraint only significantly
contributes to the third principal component (p < 1.33 10�6; Fig-
ures 2C, 2E, and S6), which accounts for�10%of the variance in

Please cite this article in press as: Opdam et al., A Systematic Evaluation of Methods for Tailoring Genome-Scale Metabolic Models, Cell Systems(2017), http://dx.doi.org/10.1016/j.cels.2017.01.010
model content. These results are consistent across cell lines and
indicate that the content of a cell-line-specific model is most
heavily affected by the choice of gene expression threshold,
followed by the choice of MEM and constraints placed on
metabolite uptake and secretion.
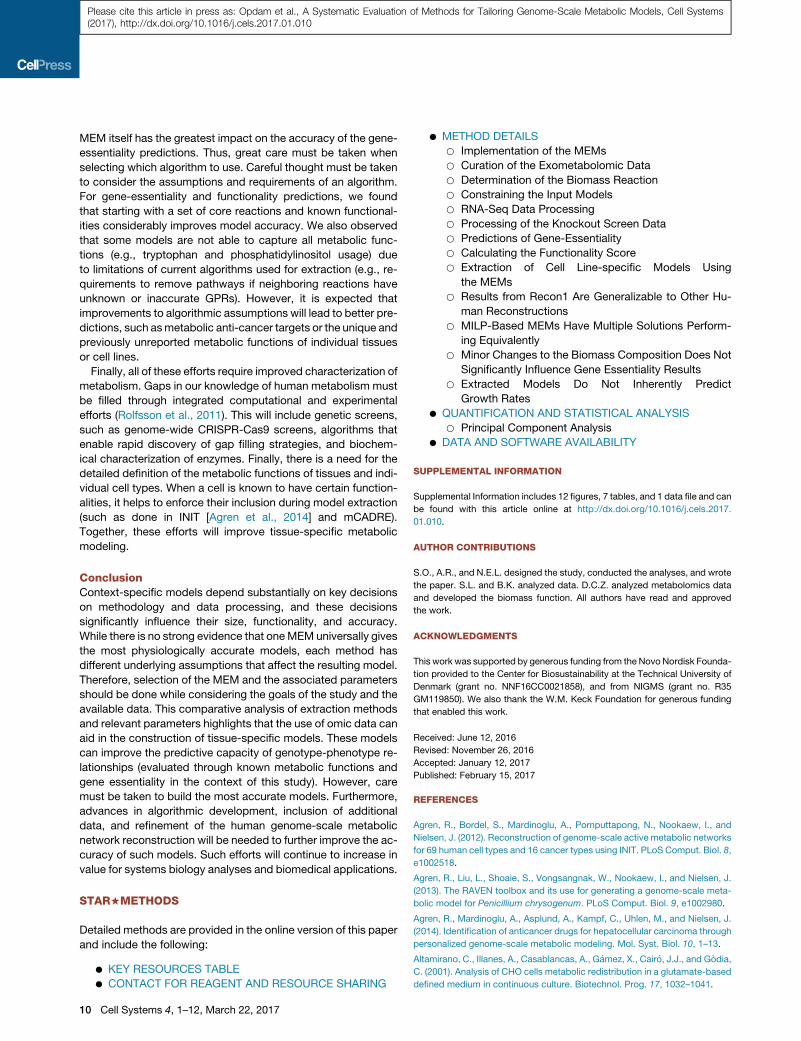
Model Extraction Improves Gene-EssentialityPredictionGEMs contain the genetic basis of cell growth and maintenance.
Thus, microbial GEMs have been particularly successful in pre-
dicting gene knockout phenotypes (Covert et al., 2004; Edwards
and Palsson, 2000). Further work demonstrated that some gene
knockdown phenotypes can be predicted for human cell lines
(Folger et al., 2011; Gatto et al., 2015). However, it is unclear
how accurately human cell-line-specific models predict essen-
tial genes, and how sensitive the accuracy is to the different de-
cisions made for model extraction.
To address this, we compared model-predicted gene essenti-
ality with data from genome-wide CRISPR-Cas9 loss-of-func-
tion screens for the four cancer cell lines (Shalem et al., 2014;
Wang et al., 2014, 2015). In these screens, essential genes are
identified by quantifying single guide RNA (sgRNA) abundance
for each knockout before and after growth selection. A large
decrease in sgRNA abundance indicates a strong impairment
of growth. We systematically deleted each gene in each of the
288 models with the biomass function, and then used flux
balance analysis (Schellenberger et al., 2011) to test models
for normal or impaired growth. We then tested if the sgRNA
abundances decreased significantly for the model-predicted
essential genes (one-tailedWilcoxon rank-sum test). The p value
from this test quantifies accuracy, with a lower p value indicating
a better agreement between model prediction and experimental
data (see STAR Methods).
During model extraction, reactions are removed from the input
model, and through the process, genes that are initially non-
essential in the GEM can become essential in the cell-line-spe-
cific model. Different combinations of MEMs, thresholds, and
uptake constraints lead to different sets of predicted essential
genes for the extractedmodel. However, almost all cell-line-spe-
cific models more accurately predict essential genes than the
input GEMs (Figure 3A). Furthermore, the different decisions
in model construction affect the accuracy of gene-essentiality
predictions (Figure S7). First, more stringent gene expression
thresholds lead to more accurate gene-essentiality predictions
(Figure 3B). Second, constrained models are more accurate
than unconstrained models (Figure 3C). Third, the MEMs differ
in accuracy at predicting gene essentiality (Figure 3D). Combina-
tions of different parameters and MEMs can be analyzed to find
models with more accurate gene-essentiality predictions (Fig-
ures 3E, 3F, and S8). Across all cell lines, we found that gene-
essentiality predictions of INIT, MBA, and mCADRE are the
most accurate, especially when using the most stringent
gene expression thresholds (top 10% and mean). However,
iMAT and INIT have a larger spread in p values than MBA and
mCADRE (Figure 3D), since accuracy decreases substantially
for when using the unconstrained (iMAT and INIT) and semi-con-
strained (iMAT) setups for model extraction.
To identify which decision has the greatest impact on the abil-
ity to accurately predict gene essentiality with cell-line-specific
models, we quantified the proportion of the variance in the
accuracy scores explained by each decision (Figure 3G).
Surprisingly, MEM choice had the greatest impact on the accu-
racy, in contrast to gene expression threshold, which had the
largest impact on whether reactions were included in a model
(Figure 2C).
Metabolic Functionalities Are Not Always Maintainedafter Model ExtractionMany human tissues have unique metabolic functions they
accomplish. However, it can be difficult to define all tissue-spe-
cific metabolic functions a priori in an unbiased fashion, since
they are often poorly defined for a given tissue. Can extracted
models capture these metabolic functions in an unbiased
fashion when tissue- or cell-line-specific data are used to build
the models? To answer this, we tested the extent to which the
MEMs can recapitulate a panel of essential metabolic functions
for the four cell lines studied here.
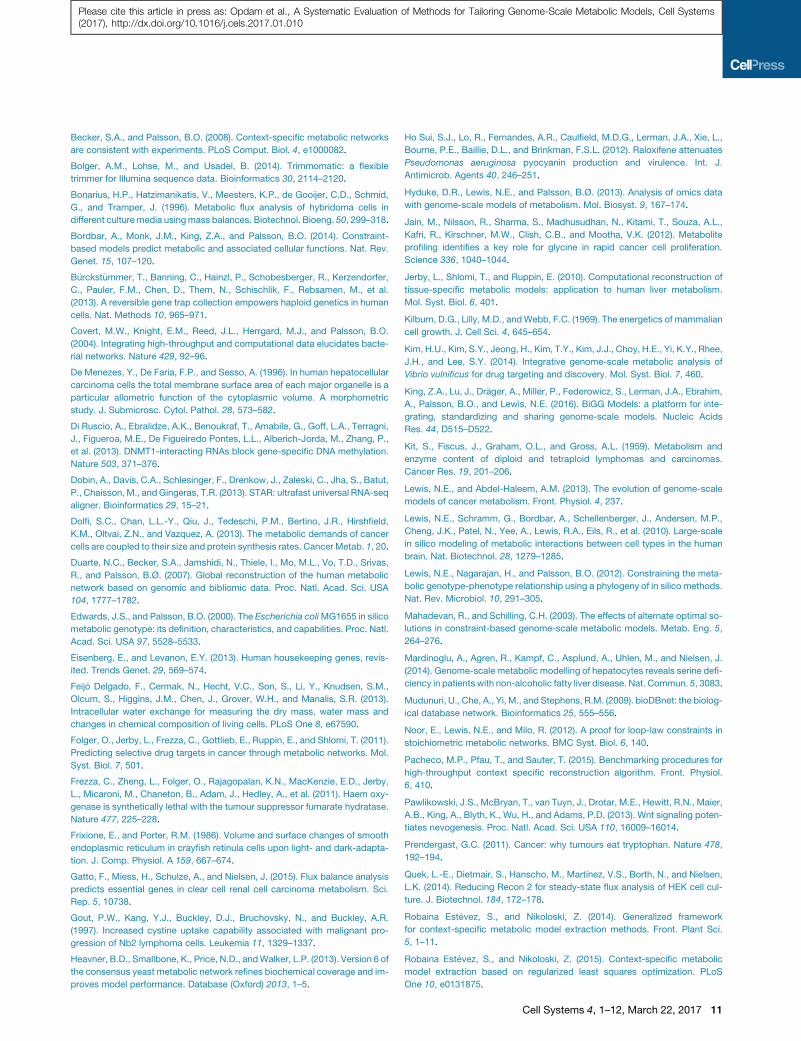
Not all metabolic functions are known, but we defined 56
metabolic functions that are essential for cancer cell growth,
based on the biomass function (Figure 4A). This includes the
synthesis of non-secreted metabolites (e.g., ATP, carnitine,
and glutathione). To this end, 240 models were built for the
four cell lines using Recon 1 without a biomass function, along
with the various gene thresholds, uptake constraints and
MEMs in this study (except for GIMME, since it requires the
prior definition of metabolic functions). We then tested if the 56
functions were predicted to be included in each extracted
model without a priori definition of these functionalities, and a
‘‘functionality score’’ was assigned to each model. The score
represents the number of additional functionalities of a cell-
line-specific model exhibited beyond the number for the 99th
quantile of comparable models of the same size generated
from randomized data (see STAR Methods).
Almost all cell-line-specific models achieve more metabolic
functions than expected by random chance (Figure 4B). How-
ever, some important metabolic functions are inactivated in
many individual models (Figure 4A). A PCA of the functionalities
that were present or absent across the cell lines demonstrated
that the gene expression threshold explained, on average,
51% of the variation in the first principal component, while
the MEM choice explained 17% of the variation (Figure 4C).
Constraint selection was the dominant decision in the second
principal component, but only explained 19% of the variation.
To understand why some functionalities are missed more often,
we analyzed two cancer-relevant metabolites (phosphatidylino-
sitol and tryptophan) that are not available inmany of themodels.
Phosphatidylinositol is a substrate of the phosphatidylinositol
3-kinase enzymes, which are over-active in many tumors and
can drive tumor progression (Vivanco and Sawyers, 2002). Phos-
phatidylinositol exists in several different phosphorylated states,
and the transitions between different states form ametabolic cy-
cle (Figure 4E). Some reactions associated with the cycle, such
as PI3P4K, are highly expressed and therefore are present in
the cell-line-specific models. Since the reactions form a cycle,
the steady-state assumption underlying GEMs allows the cycle
to be included, even when the reaction supplying metabolites
into this cycle, phosphatidylinositol synthase (CDIPTr), or up-
stream reactions are removed, as seen for 61% of the models
Cell Systems 4, 1–12, March 22, 2017 5

1
2
3
4
5
6
7
8
A37
5
HL6
0
K562
KBM
7
Genome-scale modelExtracted models
−12
−10
−8
−6
−4
−2
0
top
25%
top
50%
log 1
0 P−v
alue
−12
−10
−8
−6
−4
−2
0
top
10%
Mea
n
log 10
P−v
alue
K562−12
−10
−8
−6
−4
−2
0
Unc
onst
.
Sem
icon
st.
Cons
t.
log 1 0
P−v
alue
−12
−10
−8
−6
−4
−2
0
log 10
P−v
alue
K562
−12
−10
−8
−6
−4
−2
0
Fast
core
Gim
me
Non
e
iMA
T
INIT
MBA
mCA
DRE
log 10
P−v
alue
−12
−10
−8
−6
−4
−2
0
log 10
P−v
alue
K562
Fast
Core
GIM
ME
iMA
T
INIT
MBA
mCA
DRE
A375
top 10%
Mean
top 25%
top 50%
Fast
Core
GIM
ME
iMA
T
INIT
MBA
mCA
DRE
K562
top 10%
Mean
top 25%
top 50%
Threshold Methods Constraints0
10
20
30
40
50
60
% e
xpla
ined
var
iatio
n
Threshold Methods Constraints
0
10
20
30
40
50
60
% e
xpla
ined
var
iatio
n
1x10
−15
1x10
−10
1x10
−51
A375HL60K562KBM7
P−value
A B C D
E F G
Rela
tive
accu
racy
at p
redi
ctin
g es
sent
ial g
enes
(log
10(P
GS
/ PM
))
Figure 3. Cell-Line-Specific Models Predict Gene Essentiality, but Accuracy Is Most Strongly Influenced by the MEM
(A) We compared the accuracy of the unconstrained, semi-constrained, and constrained GEMs without MEM use (red) and after MEM use (blue). The relative
accuracy is the log10 of the averageWilcoxon p values of theGEMs (PGS), divided by the p value (PM) for each genome-scale (red) or cell-line-specificmodel (blue).
(B) More stringent threshold cutoffs resulted in more accurate gene-essentiality predictions, as shown for the K562 cell line.
(C and D) Constrained models resulted in slightly more accurate gene-essentiality predictions in the K562 cell line (C), and the different MEMs demonstrated
different levels of accuracy in predicting gene essentiality (D).
(E and F) Combinations of different thresholds and algorithms result in more accurate models, as shown using the constrained input model for the K562 (E) and
A375 (F) cell lines.
(G) When all decisions are assessed, the selection of MEM contributes the most to the accuracy of the model-predicted gene essentiality.
Please cite this article in press as: Opdam et al., A Systematic Evaluation of Methods for Tailoring Genome-Scale Metabolic Models, Cell Systems(2017), http://dx.doi.org/10.1016/j.cels.2017.01.010
(Figure 4D). This inhibits the net production of phosphatidylinosi-
tol by most cell-line-specific models (Figures 4D and 4E). Thus,
even if a metabolite is present in a cell-line-specific model, the
model may not be able to predict the physiological metabolic
function of producing the metabolite due to ‘‘loops’’ resulting
from the steady-state assumption of COBRA models (Noor
et al., 2012).
Tryptophan consumption is also absent from many models,
despite its critical role in facilitating escape from the immune
response in progressive cancer (Prendergast, 2011). This is
6 Cell Systems 4, 1–12, March 22, 2017
achieved as tryptophan is converted to kynurenine (Lkynr) due
to high activity of indoleamine-2,3-dioxygenase 1 and 2 (IDO1
and IDO2) and tryptophan-2,3-dioxygenase (TDO). The models
fail to predict tryptophan-associated functions because of multi-
ple problems (Figure 4F). First, tryptophan is an essential amino
acid, used for the synthesis of protein and several hormones and
metabolites. Thus, it must be taken up from the medium. How-
ever, the confidence intervals on the exometabolomic data
used in this study were so wide that their range of values include
zero, and so even the constrained models are not forced to take

0
2
4
6
8
10
12
14
16
A37
5
HL6
0
K562
KBM
7
0
2
4
6
8
10
12
14
16
Func
tiona
lity
scor
e
0
50
100
atp
L-gl
utam
ine
L-gl
utam
ate
glyc
ine
L-se
rine
putre
scin
eL-
aspa
rtate
amp
gmp
dcm
pum
pdg
mp
L-cy
stei
necm
pdt
mp
hexa
deca
noat
esp
erm
idin
esp
erm
ine
L-al
anin
eL-
aspa
ragi
neL-
argi
nine
chol
este
rol
carn
itine
L-va
line
L-is
oleu
cine
L-ty
rosi
neda
mp
phos
phat
idat
eL-
prol
ine
L-m
ethi
onin
edi
glyc
erid
egl
utat
hion
e (r
educ
ed)
L-ly
sine na
dph
osph
atid
ylch
olin
eph
osph
atid
ylet
hano
lam
ine
L-ph
enyl
alan
ine
phos
phat
idyl
serin
e3'
-Pho
spho
aden
ylyl
SO
4na
dp q10
hexa
dece
noat
esp
hing
omye
lin b
etai
nete
trahy
drob
iopt
erin
card
iolip
inL-
leuc
ine
octa
deca
noat
eL-
hist
idin
ely
soph
osph
atid
ylch
olin
ech
oles
tero
l est
eroc
tade
ceno
ate
L-try
ptop
han
mon
oacy
lgly
cero
lph
osph
atid
y m
yo-in
osito
lgl
ycog
enL-
thre
onin
e
K562
0
50
100HL60
0
50
100KBM7
0
50
100A375
Metabolite
% o
ccur
renc
e
C
B
1 20
10
20
30
40
50
60ThresholdMethodConstraint
Principal component
Exp
lain
ed v
aria
tion
in e
ach
PC
(%)
EX_trp-L (e) TRPt TRPO2 FKYNH
Kynureninasetrp-L (e) trp-L Lfmkynr
o2h2o
h
for
Lkynr anth
h2o
ala-L
h
E
F
Highly expressed
Low expression, in model
Low expressionnot in model
High expressionnot in model
PIK3
PI3P4K PI34P5K
PI345P3P
PI45P5PPI4PPCDIPTr
pail
pail3p
h
atp
adp
pail34p
adpatp
h
pail345padpatp
h
pail45p
h2o
pi
h2opi
pail4p
h2opiinositol
h
CDP diacyl-glycerol
cmp
K562, top 10% threshold
phosphatidylinositol functionality
Produces
phosphatidyl-
inositol
39%
CDIPTr
absent: 19%
CDP diacylglycerol
not made: 2%
Inositol
not made:
28%
CDP
diacylglycerol
and inositol
not made:
12%
Upstre
am
me
tab
oli
tes
ab
sent
Why 61% of modelscannot produce
phosphatidylinositol
A
D
Figure 4. Cell Line-Specific Models Automatically Contain Many, but Not All Native Metabolic Functionalities
We tested how likelymetabolic functionalities can be discovered de novo from integrating RNA-seq with themodels. For each cell line, 60models were built using
combinations of thresholds and MEMs. We tested if the models could synthesize 56 metabolites that are necessary for cancer growth, without a priori
requirement of these metabolic functions.
(A) Many known metabolic functions were active in most models.
(B) Almost all models had more metabolic functionalities than 99% of models of equal size, built with permuted data.
(legend continued on next page)
Cell Systems 4, 1–12, March 22, 2017 7
Please cite this article in press as: Opdam et al., A Systematic Evaluation of Methods for Tailoring Genome-Scale Metabolic Models, Cell Systems(2017), http://dx.doi.org/10.1016/j.cels.2017.01.010

Please cite this article in press as: Opdam et al., A Systematic Evaluation of Methods for Tailoring Genome-Scale Metabolic Models, Cell Systems(2017), http://dx.doi.org/10.1016/j.cels.2017.01.010
up tryptophan. Second, since tryptophan uptake can be zero,
the pathways using tryptophan will only be activated if down-
stream reactions are associated with highly expressed genes
that force their inclusion in the cell-line-specific model. Since
many reactions in the tryptophan-consuming pathway show
low gene expression, many MEMs remove the entire pathway.
It is possible that high thresholds fail to include important genes
if they show high catalytic rates or function at low metabolic
rates. Third, some algorithms will eliminate reactions even
when they are associated with highly expressed genes if they
are involved in a pathway with more reactions with low gene
expression (e.g., iMAT, mCADRE, etc.). Fourth, the GPRs for
the tryptophan 2,3-dioxygenase reaction (TROP2) in Recon 1
are missing for two of the three enzymes that catalyze it. These
include the IDO1 and IDO2 isozymes that are highly expressed
in some cancers (Prendergast, 2011). Therefore, the tryptophan
2,3-dioxygenase reaction (TRPO2) is not always assigned to a
gene expression level and the MEMs favor its removal.
As shown here, many combinations of decisions in the extrac-
tion process can producemodels that accurately predict most of
the known metabolic functionalities in the four cell lines. How-
ever, the tryptophan and phosphatidylinositol usage represent
functions that were missed in most models for several reasons
including the selection of a generic threshold for all reactions,
incomplete or non-existent GPRs, imprecise quantification of
exometabolomics, and the steady-state assumptions of the al-
gorithms. Many of these concerns could be addressed in future
algorithm development to allowMEMs to more comprehensively
predict metabolic functionalities de novo for a cell line or tissue.
DISCUSSION
Several methods have been developed to extract context-
specific models from GEMs. Here we investigated the extraction
procedure of cell line- or tissue-specific metabolic models. We
compared and contrasted hundreds of models that were con-
structed using transcriptomics and exometabolomics data
with several different combinations of algorithms (Table 1) and
parameters (Figure 1A). Through this we showed that human
cell-line-specific models more accurately predict the cell geno-
type-phenotype relationship than GEMs. We further quantified
the influence of key decisions on model prediction accuracy
and identified assumptions that limit themetabolic functionalities
of amodel. These analyses lead to important insights to consider
when constructing context-specific models (Table 2). Thus, this
study highlights (1) the importanceof includingdiversedata types
for model construction and validation, (2) the influence of select-
(C) The gene expression threshold contributes the most to the first PC for all cell li
selection dominates the second PC. Error bars indicate SE across the four cell li
(D–F) Some metabolic functions failed to be added to most models, such as the
tidylinositol cannot be obtained from the model if the upstream reactions or metab
can synthesize phosphatidylinositol (purple, 39%ofmodels) or cannot do so (blue
reaction (synthesizes themetabolite) is absent (green, 19%) or when the required u
inositol (gray). (E) Even when these reactions or metabolites are missing, phosph
enzymes in the cycle are expressed. However, with no input into the cycle, pho
metabolic function. (F) Tryptophan is unavailable in most models since (1) the alg
etc.), (2) the GPR of a key reaction was incomplete (TRPO2), and (3) too many rea
for metabolite and reaction abbreviations.
8 Cell Systems 4, 1–12, March 22, 2017
ing gene expression thresholds, and (3) the need for refinements
to MEMs to construct more accurate context-specific models.
Our analysis showed that the decision of how to constrain
the uptake and secretion fluxes in the model prior to model
extraction has a lesser effect on the accuracy of gene-es-
sentiality prediction than the other decisions. However, the use
of proper constraints influences the capacity of the model to
recover metabolic functionality when they were not defined a
priori. Furthermore, uptake constraint selection significantly
affected the ability to predict growth rates (see STAR Methods).
Therefore, the development of more physiologically accurate
models will be accelerated, when substrate consumption rates
are determined and used. Beyond exometabolomics data,
more diverse data are available to improve model content and
validate model simulations. For example, the use of endometa-
bolomic data (such as normally permitted by INIT) can be of great
interest to capture key metabolite dynamics and allow their in-
clusion in extracted models. Doing so, the extraction process
will gain in predictive power of some important metabolic fea-
tures and help to drive discovery of metabolic functionalities of
specific cell lines and tissues.
More so than constraint selection, the choice of the gene
expression threshold at which a gene is considered ‘‘expressed’’
had the highest impact on model content (Figure 2C) and the
ability to predict metabolic functionalities without predefining
them (Figure 4C). However, the question remains on how to
select the best threshold. A seemingly intuitive approach to avoid
an arbitrary selection would be to select a threshold based on
housekeeping genes, but some important housekeeping genes
have low expression (Eisenberg and Levanon, 2013). Thus, it
remains unclear how to use such genes to define a threshold
(Figure S9). To address the challenge of identifying a reasonable
threshold in our study, we compared model simulations with
genome-wide loss-of-function screens. Our analysis suggests
that stringent thresholds lead tomore accurate gene-essentiality
predictions. However, this improvement in accuracy comes at a
cost, since smaller models with more stringent thresholds have
fewer metabolic functions, if all relevant metabolic functions are
not enforced a priori (Figure S10). Thus, if metabolic functions
are known, more stringent thresholds should be considered.
However, if the aim is to include previously unknown metabolic
functions, lower thresholds could be considered, but external
data should be used to evaluate the validity of predicted model
functions (e.g., using knockout phenotypes, metabolomics, or
fluxomics). Finally, we note that to ensure a consistent compari-
son of methods, we used a single threshold value. However,
iMAT, for example, was originally designed to use two different
nes with a lesser contribution of MEM choice. Meanwhile, the model constraint
nes.
synthesis of phosphatidylinositol and availability of tryptophan. (D) Phospha-
olites are missing. A pie chart demonstrates the fraction of all 240 models that
, 61%). Models fail to predict the phosphatidylinositol functionality if the CDIPTr
pstream substrates for CDIPTr are missing, such as CDP diacylglycerol and/or
atidylinositol is often found in the model in a metabolic cycle since individual
sphatidylinositol cannot leave the cycle at steady state and contribute to the
orithms often remove reactions without known genes (e.g., TRPt, EX_trp-L (e),
ctions in the pathways using the metabolite have low expression. See Table S2
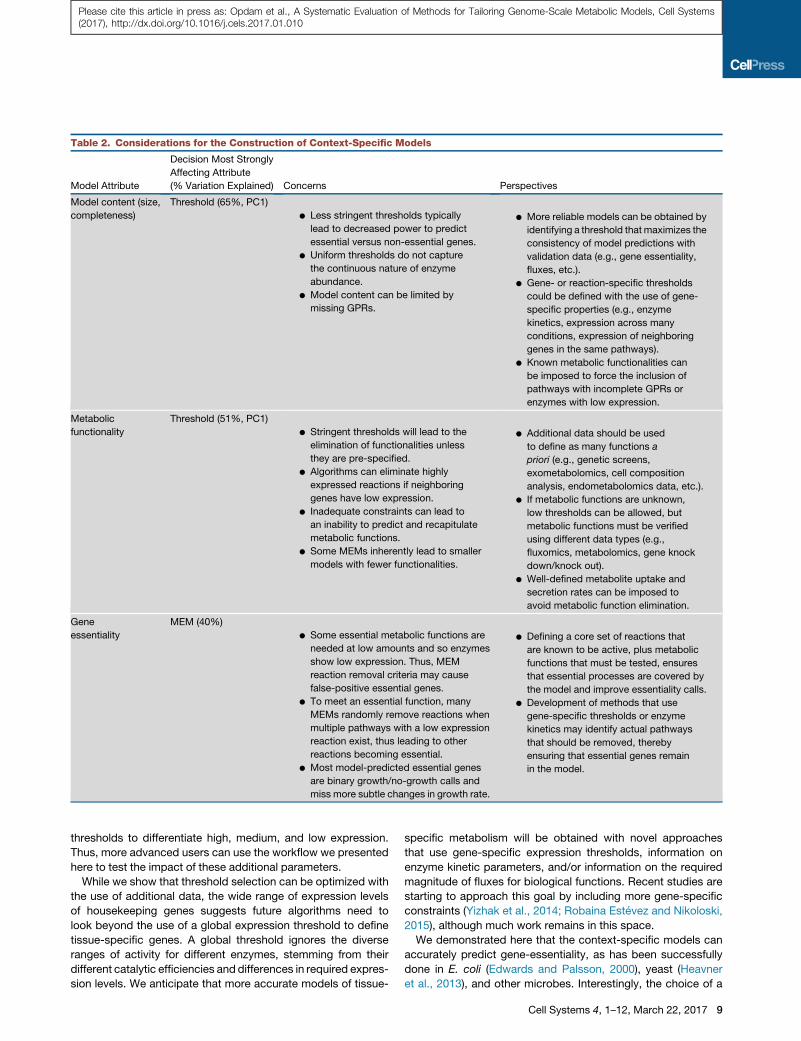
Table 2. Considerations for the Construction of Context-Specific Models
Model Attribute
Decision Most Strongly
Affecting Attribute
(% Variation Explained) Concerns Perspectives
Model content (size,
completeness)
Threshold (65%, PC1)
d Less stringent thresholds typically
lead to decreased power to predict
essential versus non-essential genes.
d Uniform thresholds do not capture
the continuous nature of enzyme
abundance.
d Model content can be limited by
missing GPRs.
d More reliable models can be obtained by
identifying a threshold thatmaximizes the
consistency of model predictions with
validation data (e.g., gene essentiality,
fluxes, etc.).
d Gene- or reaction-specific thresholds
could be defined with the use of gene-
specific properties (e.g., enzyme
kinetics, expression across many
conditions, expression of neighboring
genes in the same pathways).
d Known metabolic functionalities can
be imposed to force the inclusion of
pathways with incomplete GPRs or
enzymes with low expression.
Metabolic
functionality
Threshold (51%, PC1)
d Stringent thresholds will lead to the
elimination of functionalities unless
they are pre-specified.
d Algorithms can eliminate highly
expressed reactions if neighboring
genes have low expression.
d Inadequate constraints can lead to
an inability to predict and recapitulate
metabolic functions.
d Some MEMs inherently lead to smaller
models with fewer functionalities.
d Additional data should be used
to define as many functions a
priori (e.g., genetic screens,
exometabolomics, cell composition
analysis, endometabolomics data, etc.).
d If metabolic functions are unknown,
low thresholds can be allowed, but
metabolic functions must be verified
using different data types (e.g.,
fluxomics, metabolomics, gene knock
down/knock out).
d Well-defined metabolite uptake and
secretion rates can be imposed to
avoid metabolic function elimination.
Gene
essentiality
MEM (40%)
d Some essential metabolic functions are
needed at low amounts and so enzymes
show low expression. Thus, MEM
reaction removal criteria may cause
false-positive essential genes.
d To meet an essential function, many
MEMs randomly remove reactions when
multiple pathways with a low expression
reaction exist, thus leading to other
reactions becoming essential.
d Most model-predicted essential genes
are binary growth/no-growth calls and
miss more subtle changes in growth rate.
d Defining a core set of reactions that
are known to be active, plus metabolic
functions that must be tested, ensures
that essential processes are covered by
the model and improve essentiality calls.
d Development of methods that use
gene-specific thresholds or enzyme
kinetics may identify actual pathways
that should be removed, thereby
ensuring that essential genes remain
in the model.
Please cite this article in press as: Opdam et al., A Systematic Evaluation of Methods for Tailoring Genome-Scale Metabolic Models, Cell Systems(2017), http://dx.doi.org/10.1016/j.cels.2017.01.010
thresholds to differentiate high, medium, and low expression.
Thus, more advanced users can use the workflow we presented
here to test the impact of these additional parameters.
While we show that threshold selection can be optimized with
the use of additional data, the wide range of expression levels
of housekeeping genes suggests future algorithms need to
look beyond the use of a global expression threshold to define
tissue-specific genes. A global threshold ignores the diverse
ranges of activity for different enzymes, stemming from their
different catalytic efficiencies and differences in required expres-
sion levels. We anticipate that more accurate models of tissue-
specific metabolism will be obtained with novel approaches
that use gene-specific expression thresholds, information on
enzyme kinetic parameters, and/or information on the required
magnitude of fluxes for biological functions. Recent studies are
starting to approach this goal by including more gene-specific
constraints (Yizhak et al., 2014; Robaina Estevez and Nikoloski,
2015), although much work remains in this space.
We demonstrated here that the context-specific models can
accurately predict gene-essentiality, as has been successfully
done in E. coli (Edwards and Palsson, 2000), yeast (Heavner
et al., 2013), and other microbes. Interestingly, the choice of a
Cell Systems 4, 1–12, March 22, 2017 9
Please cite this article in press as: Opdam et al., A Systematic Evaluation of Methods for Tailoring Genome-Scale Metabolic Models, Cell Systems(2017), http://dx.doi.org/10.1016/j.cels.2017.01.010
MEM itself has the greatest impact on the accuracy of the gene-
essentiality predictions. Thus, great care must be taken when
selecting which algorithm to use. Careful thought must be taken
to consider the assumptions and requirements of an algorithm.
For gene-essentiality and functionality predictions, we found
that starting with a set of core reactions and known functional-
ities considerably improves model accuracy. We also observed
that some models are not able to capture all metabolic func-
tions (e.g., tryptophan and phosphatidylinositol usage) due
to limitations of current algorithms used for extraction (e.g., re-
quirements to remove pathways if neighboring reactions have
unknown or inaccurate GPRs). However, it is expected that
improvements to algorithmic assumptions will lead to better pre-
dictions, such asmetabolic anti-cancer targets or the unique and
previously unreported metabolic functions of individual tissues
or cell lines.
Finally, all of these efforts require improved characterization of
metabolism. Gaps in our knowledge of human metabolism must
be filled through integrated computational and experimental
efforts (Rolfsson et al., 2011). This will include genetic screens,
such as genome-wide CRISPR-Cas9 screens, algorithms that
enable rapid discovery of gap filling strategies, and biochem-
ical characterization of enzymes. Finally, there is a need for the
detailed definition of the metabolic functions of tissues and indi-
vidual cell types. When a cell is known to have certain function-
alities, it helps to enforce their inclusion during model extraction
(such as done in INIT [Agren et al., 2014] and mCADRE).
Together, these efforts will improve tissue-specific metabolic
modeling.
ConclusionContext-specific models depend substantially on key decisions
on methodology and data processing, and these decisions
significantly influence their size, functionality, and accuracy.
While there is no strong evidence that oneMEM universally gives
the most physiologically accurate models, each method has
different underlying assumptions that affect the resulting model.
Therefore, selection of the MEM and the associated parameters
should be done while considering the goals of the study and the
available data. This comparative analysis of extraction methods
and relevant parameters highlights that the use of omic data can
aid in the construction of tissue-specific models. These models
can improve the predictive capacity of genotype-phenotype re-
lationships (evaluated through known metabolic functions and
gene essentiality in the context of this study). However, care
must be taken to build the most accurate models. Furthermore,
advances in algorithmic development, inclusion of additional
data, and refinement of the human genome-scale metabolic
network reconstruction will be needed to further improve the ac-
curacy of such models. Such efforts will continue to increase in
value for systems biology analyses and biomedical applications.
STAR+METHODS
Detailed methods are provided in the online version of this paper
and include the following:
d KEY RESOURCES TABLE
d CONTACT FOR REAGENT AND RESOURCE SHARING
10 Cell Systems 4, 1–12, March 22, 2017
d METHOD DETAILS
B Implementation of the MEMs
B Curation of the Exometabolomic Data
B Determination of the Biomass Reaction
B Constraining the Input Models
B RNA-Seq Data Processing
B Processing of the Knockout Screen Data
B Predictions of Gene-Essentiality
B Calculating the Functionality Score
B Extraction of Cell Line-specific Models Using
the MEMs
B Results from Recon1 Are Generalizable to Other Hu-
man Reconstructions
B MILP-Based MEMs Have Multiple Solutions Perform-
ing Equivalently
B Minor Changes to the Biomass Composition Does Not
Significantly Influence Gene Essentiality Results
B Extracted Models Do Not Inherently Predict
Growth Rates
d QUANTIFICATION AND STATISTICAL ANALYSIS
B Principal Component Analysis
d DATA AND SOFTWARE AVAILABILITY
SUPPLEMENTAL INFORMATION
Supplemental Information includes 12 figures, 7 tables, and 1 data file and can
be found with this article online at http://dx.doi.org/10.1016/j.cels.2017.
01.010.
AUTHOR CONTRIBUTIONS
S.O., A.R., and N.E.L. designed the study, conducted the analyses, and wrote
the paper. S.L. and B.K. analyzed data. D.C.Z. analyzed metabolomics data
and developed the biomass function. All authors have read and approved
the work.
ACKNOWLEDGMENTS
This work was supported by generous funding from the Novo Nordisk Founda-
tion provided to the Center for Biosustainability at the Technical University of
Denmark (grant no. NNF16CC0021858), and from NIGMS (grant no. R35
GM119850). We also thank the W.M. Keck Foundation for generous funding
that enabled this work.
Received: June 12, 2016
Revised: November 26, 2016
Accepted: January 12, 2017
Published: February 15, 2017
REFERENCES
Agren, R., Bordel, S., Mardinoglu, A., Pornputtapong, N., Nookaew, I., and
Nielsen, J. (2012). Reconstruction of genome-scale active metabolic networks
for 69 human cell types and 16 cancer types using INIT. PLoS Comput. Biol. 8,
e1002518.
Agren, R., Liu, L., Shoaie, S., Vongsangnak, W., Nookaew, I., and Nielsen, J.
(2013). The RAVEN toolbox and its use for generating a genome-scale meta-
bolic model for Penicillium chrysogenum. PLoS Comput. Biol. 9, e1002980.
Agren, R., Mardinoglu, A., Asplund, A., Kampf, C., Uhlen, M., and Nielsen, J.
(2014). Identification of anticancer drugs for hepatocellular carcinoma through
personalized genome-scale metabolic modeling. Mol. Syst. Biol. 10, 1–13.
Altamirano, C., Illanes, A., Casablancas, A., Gamez, X., Cairo, J.J., and Godia,
C. (2001). Analysis of CHO cells metabolic redistribution in a glutamate-based
defined medium in continuous culture. Biotechnol. Prog. 17, 1032–1041.
Please cite this article in press as: Opdam et al., A Systematic Evaluation of Methods for Tailoring Genome-Scale Metabolic Models, Cell Systems(2017), http://dx.doi.org/10.1016/j.cels.2017.01.010
Becker, S.A., and Palsson, B.O. (2008). Context-specific metabolic networks
are consistent with experiments. PLoS Comput. Biol. 4, e1000082.
Bolger, A.M., Lohse, M., and Usadel, B. (2014). Trimmomatic: a flexible
trimmer for Illumina sequence data. Bioinformatics 30, 2114–2120.
Bonarius, H.P., Hatzimanikatis, V., Meesters, K.P., de Gooijer, C.D., Schmid,
G., and Tramper, J. (1996). Metabolic flux analysis of hybridoma cells in
different culturemedia usingmass balances. Biotechnol. Bioeng. 50, 299–318.
Bordbar, A., Monk, J.M., King, Z.A., and Palsson, B.O. (2014). Constraint-
based models predict metabolic and associated cellular functions. Nat. Rev.
Genet. 15, 107–120.
B€urckst€ummer, T., Banning, C., Hainzl, P., Schobesberger, R., Kerzendorfer,
C., Pauler, F.M., Chen, D., Them, N., Schischlik, F., Rebsamen, M., et al.
(2013). A reversible gene trap collection empowers haploid genetics in human
cells. Nat. Methods 10, 965–971.
Covert, M.W., Knight, E.M., Reed, J.L., Herrgard, M.J., and Palsson, B.O.
(2004). Integrating high-throughput and computational data elucidates bacte-
rial networks. Nature 429, 92–96.
De Menezes, Y., De Faria, F.P., and Sesso, A. (1996). In human hepatocellular
carcinoma cells the total membrane surface area of each major organelle is a
particular allometric function of the cytoplasmic volume. A morphometric
study. J. Submicrosc. Cytol. Pathol. 28, 573–582.
Di Ruscio, A., Ebralidze, A.K., Benoukraf, T., Amabile, G., Goff, L.A., Terragni,
J., Figueroa, M.E., De Figueiredo Pontes, L.L., Alberich-Jorda, M., Zhang, P.,
et al. (2013). DNMT1-interacting RNAs block gene-specific DNA methylation.
Nature 503, 371–376.
Dobin, A., Davis, C.A., Schlesinger, F., Drenkow, J., Zaleski, C., Jha, S., Batut,
P., Chaisson,M., andGingeras, T.R. (2013). STAR: ultrafast universal RNA-seq
aligner. Bioinformatics 29, 15–21.
Dolfi, S.C., Chan, L.L.-Y., Qiu, J., Tedeschi, P.M., Bertino, J.R., Hirshfield,
K.M., Oltvai, Z.N., and Vazquez, A. (2013). The metabolic demands of cancer
cells are coupled to their size and protein synthesis rates. CancerMetab. 1, 20.
Duarte, N.C., Becker, S.A., Jamshidi, N., Thiele, I., Mo, M.L., Vo, T.D., Srivas,
R., and Palsson, B.Ø. (2007). Global reconstruction of the human metabolic
network based on genomic and bibliomic data. Proc. Natl. Acad. Sci. USA
104, 1777–1782.
Edwards, J.S., and Palsson, B.O. (2000). The Escherichia coliMG1655 in silico
metabolic genotype: its definition, characteristics, and capabilities. Proc. Natl.
Acad. Sci. USA 97, 5528–5533.
Eisenberg, E., and Levanon, E.Y. (2013). Human housekeeping genes, revis-
ited. Trends Genet. 29, 569–574.
Feijo Delgado, F., Cermak, N., Hecht, V.C., Son, S., Li, Y., Knudsen, S.M.,
Olcum, S., Higgins, J.M., Chen, J., Grover, W.H., and Manalis, S.R. (2013).
Intracellular water exchange for measuring the dry mass, water mass and
changes in chemical composition of living cells. PLoS One 8, e67590.
Folger, O., Jerby, L., Frezza, C., Gottlieb, E., Ruppin, E., and Shlomi, T. (2011).
Predicting selective drug targets in cancer through metabolic networks. Mol.
Syst. Biol. 7, 501.
Frezza, C., Zheng, L., Folger, O., Rajagopalan, K.N., MacKenzie, E.D., Jerby,
L., Micaroni, M., Chaneton, B., Adam, J., Hedley, A., et al. (2011). Haem oxy-
genase is synthetically lethal with the tumour suppressor fumarate hydratase.
Nature 477, 225–228.
Frixione, E., and Porter, R.M. (1986). Volume and surface changes of smooth
endoplasmic reticulum in crayfish retinula cells upon light- and dark-adapta-
tion. J. Comp. Physiol. A 159, 667–674.
Gatto, F., Miess, H., Schulze, A., and Nielsen, J. (2015). Flux balance analysis
predicts essential genes in clear cell renal cell carcinoma metabolism. Sci.
Rep. 5, 10738.
Gout, P.W., Kang, Y.J., Buckley, D.J., Bruchovsky, N., and Buckley, A.R.
(1997). Increased cystine uptake capability associated with malignant pro-
gression of Nb2 lymphoma cells. Leukemia 11, 1329–1337.
Heavner, B.D., Smallbone, K., Price, N.D., andWalker, L.P. (2013). Version 6 of
the consensus yeast metabolic network refines biochemical coverage and im-
proves model performance. Database (Oxford) 2013, 1–5.
Ho Sui, S.J., Lo, R., Fernandes, A.R., Caulfield, M.D.G., Lerman, J.A., Xie, L.,
Bourne, P.E., Baillie, D.L., and Brinkman, F.S.L. (2012). Raloxifene attenuates
Pseudomonas aeruginosa pyocyanin production and virulence. Int. J.
Antimicrob. Agents 40, 246–251.
Hyduke, D.R., Lewis, N.E., and Palsson, B.Ø. (2013). Analysis of omics data
with genome-scale models of metabolism. Mol. Biosyst. 9, 167–174.
Jain, M., Nilsson, R., Sharma, S., Madhusudhan, N., Kitami, T., Souza, A.L.,
Kafri, R., Kirschner, M.W., Clish, C.B., and Mootha, V.K. (2012). Metabolite
profiling identifies a key role for glycine in rapid cancer cell proliferation.
Science 336, 1040–1044.
Jerby, L., Shlomi, T., and Ruppin, E. (2010). Computational reconstruction of
tissue-specific metabolic models: application to human liver metabolism.
Mol. Syst. Biol. 6, 401.
Kilburn, D.G., Lilly, M.D., andWebb, F.C. (1969). The energetics of mammalian
cell growth. J. Cell Sci. 4, 645–654.
Kim, H.U., Kim, S.Y., Jeong, H., Kim, T.Y., Kim, J.J., Choy, H.E., Yi, K.Y., Rhee,
J.H., and Lee, S.Y. (2014). Integrative genome-scale metabolic analysis of
Vibrio vulnificus for drug targeting and discovery. Mol. Syst. Biol. 7, 460.
King, Z.A., Lu, J., Dr€ager, A., Miller, P., Federowicz, S., Lerman, J.A., Ebrahim,
A., Palsson, B.O., and Lewis, N.E. (2016). BiGG Models: a platform for inte-
grating, standardizing and sharing genome-scale models. Nucleic Acids
Res. 44, D515–D522.
Kit, S., Fiscus, J., Graham, O.L., and Gross, A.L. (1959). Metabolism and
enzyme content of diploid and tetraploid lymphomas and carcinomas.
Cancer Res. 19, 201–206.
Lewis, N.E., and Abdel-Haleem, A.M. (2013). The evolution of genome-scale
models of cancer metabolism. Front. Physiol. 4, 237.
Lewis, N.E., Schramm, G., Bordbar, A., Schellenberger, J., Andersen, M.P.,
Cheng, J.K., Patel, N., Yee, A., Lewis, R.A., Eils, R., et al. (2010). Large-scale
in silico modeling of metabolic interactions between cell types in the human
brain. Nat. Biotechnol. 28, 1279–1285.
Lewis, N.E., Nagarajan, H., and Palsson, B.O. (2012). Constraining the meta-
bolic genotype-phenotype relationship using a phylogeny of in silico methods.
Nat. Rev. Microbiol. 10, 291–305.
Mahadevan, R., and Schilling, C.H. (2003). The effects of alternate optimal so-
lutions in constraint-based genome-scale metabolic models. Metab. Eng. 5,
264–276.
Mardinoglu, A., Agren, R., Kampf, C., Asplund, A., Uhlen, M., and Nielsen, J.
(2014). Genome-scale metabolic modelling of hepatocytes reveals serine defi-
ciency in patients with non-alcoholic fatty liver disease. Nat. Commun. 5, 3083.
Mudunuri, U., Che, A., Yi, M., and Stephens, R.M. (2009). bioDBnet: the biolog-
ical database network. Bioinformatics 25, 555–556.
Noor, E., Lewis, N.E., and Milo, R. (2012). A proof for loop-law constraints in
stoichiometric metabolic networks. BMC Syst. Biol. 6, 140.
Pacheco, M.P., Pfau, T., and Sauter, T. (2015). Benchmarking procedures for
high-throughput context specific reconstruction algorithm. Front. Physiol.
6, 410.
Pawlikowski, J.S., McBryan, T., van Tuyn, J., Drotar, M.E., Hewitt, R.N., Maier,
A.B., King, A., Blyth, K., Wu, H., and Adams, P.D. (2013). Wnt signaling poten-
tiates nevogenesis. Proc. Natl. Acad. Sci. USA 110, 16009–16014.
Prendergast, G.C. (2011). Cancer: why tumours eat tryptophan. Nature 478,
192–194.
Quek, L.-E., Dietmair, S., Hanscho, M., Martınez, V.S., Borth, N., and Nielsen,
L.K. (2014). Reducing Recon 2 for steady-state flux analysis of HEK cell cul-
ture. J. Biotechnol. 184, 172–178.
Robaina Estevez, S., and Nikoloski, Z. (2014). Generalized framework
for context-specific metabolic model extraction methods. Front. Plant Sci.
5, 1–11.
Robaina Estevez, S., and Nikoloski, Z. (2015). Context-specific metabolic
model extraction based on regularized least squares optimization. PLoS
One 10, e0131875.
Cell Systems 4, 1–12, March 22, 2017 11

Please cite this article in press as: Opdam et al., A Systematic Evaluation of Methods for Tailoring Genome-Scale Metabolic Models, Cell Systems(2017), http://dx.doi.org/10.1016/j.cels.2017.01.010
Rolfsson, O., Palsson, B.Ø., and Thiele, I. (2011). The human metabolic recon-
struction Recon 1 directs hypotheses of novel human metabolic functions.
BMC Syst. Biol. 5, 155.
Roschke, A.V., Tonon, G., Gehlhaus, K.S., McTyre, N., Bussey, K.J., Lababidi,
S., Scudiero, D.A., Weinstein, J.N., and Kirsch, I.R. (2003). Karyotypic
complexity of the NCI-60 drug-screening panel. Cancer Res. 63, 8634–8647.
Schellenberger, J., Que, R., Fleming, R.M.T., Thiele, I., Orth, J.D., Feist, A.M.,
Zielinski, D.C., Bordbar, A., Lewis, N.E., Rahmanian, S., et al. (2011).
Quantitative prediction of cellular metabolism with constraint-based models:
the COBRA Toolbox v2.0. Nat. Protoc. 6, 1290–1307.
Shalem, O., Sanjana, N.E., Hartenian, E., Shi, X., Scott, D.A., Mikkelsen, T.S.,
Heckl, D., Ebert, B.L., Root, D.E., Doench, J.G., and Zhang, F. (2014).
Genome-scale CRISPR-Cas9 knockout screening in human cells. Science
343, 84–87.
Sheikh, K., Forster, J., and Nielsen, L.K. (2005). Modeling hybridoma cell meta-
bolism using a generic genome-scale metabolic model of Mus musculus.
Biotechnol. Prog. 21, 112–121.
Shen, Y., Liu, J., Estiu, G., Isin, B., Ahn, Y.-Y., Lee, D.-S., Barabasi, A.-L.,
Kapatral, V., Wiest, O., and Oltvai, Z.N. (2010). Blueprint for antimicrobial hit
discovery targeting metabolic networks. Proc. Natl. Acad. Sci. USA 107,
1082–1087.
Shlomi, T., Cabili, M.N., Herrgard, M.J., Palsson, B.Ø., and Ruppin, E. (2008).
Network-based prediction of human tissue-specific metabolism. Nat.
Biotechnol. 26, 1003–1010.
Swainston,N., Smallbone, K.,Hefzi,H., Dobson,P.D., Brewer, J., Hanscho,M.,
Zielinski, D.C., Ang, K.S., Gardiner, N.J., Gutierrez, J.M., et al. (2016). Recon
2.2: from reconstruction to model of human metabolism. Metabolomics
12, 109.
Thiele, I., Swainston, N., Fleming, R.M.T., Hoppe, A., Sahoo, S., Aurich, M.K.,
Haraldsdottir, H., Mo, M.L., Rolfsson, O., Stobbe, M.D., et al. (2013). A com-
munity-driven global reconstruction of human metabolism. Nat. Biotechnol.
31, 419–425.
Trapnell, C., Williams, B.A., Pertea, G., Mortazavi, A., Kwan, G., van Baren,
M.J., Salzberg, S.L., Wold, B.J., and Pachter, L. (2011). Transcript assembly
and abundance estimation from RNA-seq reveals thousands of new tran-
scripts and switching among isoforms. Nat. Biotechnol. 28, 511–515.
12 Cell Systems 4, 1–12, March 22, 2017
Uhlen, M., Fagerberg, L., Hallstrom, B.M., Lindskog, C., Oksvold, P.,
Mardinoglu, A., Sivertsson, A., Kampf, C., Sjostedt, E., Asplund, A., et al.
(2015). Tissue-based map of the human proteome. Science 347, 1260419.
Vivanco, I., and Sawyers, C.L. (2002). The phosphatidylinositol 3-Kinase AKT
pathway in human cancer. Nat. Rev. Cancer 2, 489–501.
Vlassis, N., Pacheco, M.P., and Sauter, T. (2014). Fast reconstruction of
compact context-specific metabolic network models. PLoS Comput. Biol.
10, e1003424.
Wang, Y., Eddy, J.A., and Price, N.D. (2012). Reconstruction of genome-scale
metabolic models for 126 human tissues using mCADRE. BMC Syst. Biol.
6, 153.
Wang, T., Wei, J.J., Sabatini, D.M., and Lander, E.S. (2014). Genetic screens in
human cells using the CRISPR-Cas9 system. Science 343, 80–84.
Wang, T., Birsoy, K., Hughes, N.W., Krupczak, K.M., Post, Y., Wei, J.J.,
Lander, E.S., and Sabatini, D.M. (2015). Identification and characterization of
essential genes in the human genome. Science 350, 1096–1101.
Yang, H., Krumholz, E.W., Brutinel, E.D., Palani, N.P., Sadowsky, M.J.,
Odlyzko, A.M., Gralnick, J.A., and Libourel, I.G.L. (2014). Genome-scale meta-
bolic network validation of Shewanella oneidensis using transposon insertion
frequency analysis. PLoS Comput. Biol. 10, e1003848.
Yizhak, K., Gaude, E., Le Devedec, S., Waldman, Y.Y., Stein, G.Y., van de
Walter, B., Frezza, C., and Ruppin, E. (2014). Phenotype-based cell-specific
metabolic modeling reveals metabolic liabilities of cancer. Elife 3, e03641.
Yizhak, K., Chaneton, B., Gottlieb, E., and Ruppin, E. (2015). Modeling cancer
metabolism on a genome scale. Mol. Syst. Biol. 11, 817.
Yuan, H., Cheung, C.Y.M., Hilbers, P.A.J., and van Riel, N.A.W. (2016). Flux
balance analysis of plant metabolism: the effect of biomass composition
and model structure on model predictions. Front. Plant Sci. 7, 537.
Zhang, J., Lieu, Y.K., Ali, A.M., Penson, A., Reggio, K.S., Rabadan, R., Raza,
A., Mukherjee, S., and Manley, J.L. (2015). Disease-associated mutation in
SRSF2 misregulates splicing by altering RNA-binding affinities. Proc. Natl.
Acad. Sci. USA 112, E4726–E4734.
Zur, H., Ruppin, E., and Shlomi, T. (2010). iMAT: an integrative metabolic anal-
ysis tool. Bioinformatics 26, 3140–3142.

Please cite this article in press as: Opdam et al., A Systematic Evaluation of Methods for Tailoring Genome-Scale Metabolic Models, Cell Systems(2017), http://dx.doi.org/10.1016/j.cels.2017.01.010
STAR+METHODS
KEY RESOURCES TABLE
Reagent or Resource Source Identifier
Deposited Data
mRNA-sequencing datasets for KBM7 B€urckst€ummer et al., 2013 GEO: GSE48848
mRNA-sequencing datasets for HL60 Di Ruscio et al., 2013 GEO: GSE41279
mRNA-sequencing datasets for A375 Pawlikowski et al., 2013 GEO: GSE46818
mRNA-sequencing datasets for K562 Zhang et al., 2015 GEO: GSE71299
Exometabolomics data for NCI-60 Jain et al., 2012 PMID: 22628656
Genome-scale CRISPR-Cas9 knockout
screens
Shalem et al., 2014; Wang et al.,
2014, 2015
PMID: 24336571
PMID: 26472758
PMID: 24336569
Software and Algorithms
Trimmomatic Bolger et al., 2014 www.usadellab.org
STAR Dobin et al., 2013 code.google.com/archive/p/rna-star
Cufflinks Trapnell et al., 2011 cufflinks.cbcb.umd.edu
bioDBnet 2.0 Mudunuri et al., 2009 biodbnet-abcc.ncifcrf.gov
fastCC Vlassis et al., 2014 PMID: 24453953
COBRA Toolbox 2.0 Schellenberger et al., 2011 PMID: 21886097
Other
Recon1 model Duarte et al., 2007 bigg.ucsd.edu
Recon 2.2 model Swainston et al., 2016 PMID: 27358602
BiGG Database King et al., 2016 bigg.ucsd.edu
CONTACT FOR REAGENT AND RESOURCE SHARING
Further information and requests for reagents may be directed to, and will be fulfilled by the corresponding author, Dr. N.E. Lewis
METHOD DETAILS
Implementation of the MEMsFASTCORE
The implementation of FASTCORE (Vlassis et al., 2014) is freely available at http://bio.uni.lu/systems_biology/software/. The only
alterations made for this study were the use of Gurobi instead of CPLEX as a solver and the change of an internal scaling constant
to 13 103, when it was originally 13 105. This was necessary to allow the algorithm to adequately determine whether a reaction was
active when small-valued constraints are present. The gene expression thresholds were used to determine the core reactions set.
Reactions without expression data were never considered core reactions. The biomass reaction and ATP demand reaction were
always added to the set of core reactions except when models were extracted for evaluation of the metabolic functionalities.
GIMME
The implementation of GIMME is a slightly modified version of the implementation from the COBRA toolbox. In this study, the gene
expression data were not discretized but the expression levels were used directly as weights in the objective function, as done in the
original publication of GIMME (Becker and Palsson, 2008). The gene expression thresholdwas subtracted from the expression for the
reactions, thus determining whether it would be assigned a positive or negative weight in the objective. Reactions without expression
data were given a weight of zero. The minimal fraction of the biomass objective value was set to 90%.
iMAT
In the original version of iMAT (Shlomi et al., 2008), three sets of reactions were defined (‘‘high expression’’, ‘‘low expression’’ and
‘‘moderately expressed/no data’’). To maintain consistency and simplify comparison with the other extraction methods, we merged
low and high expressed sets into a single group. All reactions without expression data were put in the ‘‘moderately expressed/no
data’’ reaction set. The biomass reaction and ATP demand reaction were always added to the ‘‘high expression’’ reaction set, except
whenmodels were extracted for evaluation of the metabolic functionalities. When the unconstrained or semi-constrained model was
Cell Systems 4, 1–12.e1–e6, March 22, 2017 e1

Please cite this article in press as: Opdam et al., A Systematic Evaluation of Methods for Tailoring Genome-Scale Metabolic Models, Cell Systems(2017), http://dx.doi.org/10.1016/j.cels.2017.01.010
used as input, the flux activation threshold (ε) was set to 1, which was also done in the original publication. When the constrained
model was used as input, a flux activation threshold of 13 10�6 was used. This value was chosen because it is smaller than the small-
est exchange reaction constraint but still larger than the threshold of 13 10�8, used to define consistent reactions. Amaximum solve
time of one hour was used for theMILP for the unconstrained and semi-constrained inputmodels. This was increased to two hours for
the constrained input model. After this time the solution was always near-optimal (<10% variation around the best known objective
value). Equivalent optimal models could be acquired, but when different models from the same parameter set were analyzed, they
provide qualitatively similar results (Figures S3 and S4).
INIT
An implementation of INIT is provided in the RAVEN toolbox (Agren et al., 2013). However, this implementation is meant to work with
models that are structured in a slightly different manner than the COBRAmodels. Moreover, the accumulation of metabolites as used
in the original version of INIT (Agren et al., 2012) was not used here because we did not have endometabolomics data for the cell lines.
Thus, after the simplification, each reaction was given a (non-zero) weight according to Equation 1. Reactions with positive weights
were put in the ‘‘high expression’’ set and reactions with negative weights were put in the ‘‘low expression’’ set. Reactions with
missing expression data were given a weight of -2. The biomass reaction and ATP demand reaction were assigned a weight equal
to the maximum across all reactions, except when models were extracted for evaluation of the metabolic functionalities (see
Methods). These methods of weighting are similar to those used in the original publication of INIT. The objective of the resulting
MILP was amaximization of the sum of weights. Specifically, the weight of a high-expression-reaction was added when it was active
and the absolute value of theweight of a low-expression-reactionwas addedwhen it was inactive. The flux activation thresholdswere
the same as used for iMAT. A maximum solve time of one hour was used for the MILP for the unconstrained and semi-constrained
input models. This was increased to two hours for the constrained input model. After this time the solution was always near-optimal
(<10% variation around the best known objective value).
weight = 5,log
�Expression level
Threshold
�(Equation 1)
Assignment of weights for INIT. As logarithms for very small expression levels can approach –inf, a minimum weight equal to the
negative of the maximum weight across the reactions was used.
MBA
Implementation of MBA followed the pseudo-code in the publication (Jerby et al., 2010). The gene expression threshold was used to
determine the high-confidence reaction set. The medium confidence reactions set was always left empty such that only one expres-
sion threshold was used to maintain consistency with other methods. The biomass reaction and ATP demand reaction were always
added to the high-confidence reactions set, except whenmodels were extracted for evaluation of themetabolic functionalities. Since
MBA prunes reactions in a random order, output models may differ even when the input was identical. Thus, while multiple models
were built, the analyses in the paper used only 1 randomly chosen one for each set of parameters, unless specified otherwise. How-
ever, results were qualitatively similar for different models constructed with the same parameter set (Figures S3 and S4).
mCADRE
The implementation of mCADRE is freely available at https://github.com/jaeddy/mcadre. Originally, mCADRE used microarray data
as input to determine which reactions should be in the core. Here, we used RNA-Seq. The gene expression threshold of the RNA-Seq
data was used to determine the set of core reactions. The biomass reaction and ATP demand reaction was always added to the set of
core reactions, except whenmodels were extracted for evaluation of themetabolic functionalities (seeMethods). Reactions with zero
expression were given a negative expression value and reactions with no GPRs or no measured expression data will be given an
expression of zero. Then, all reactions that were not in the corewere orderedwith respect to their expression, their connectivity score,
and their confidence score, respectively. The ratio of inactivated core reactions to inactivated non-core reactions was set to 1/3, as
done in the original publication (Wang et al., 2012). The metabolic function and salvage pathway checks that were standard in
mCADRE were also used.
Curation of the Exometabolomic DataPublished metabolite uptake and release (exometabolomic) data on the NCI-60 lines (Jain et al., 2012) was re-processed in a semi-
automated process. The original dataset was processed by correcting for drift in the peak area standardization across runs. This was
done by a linear L1 regression of blank media standards. However, upon detailed inspection of the drift for different metabolites, it
was apparent that the drift was highly non-linear for some metabolites. The effect of applying a linear approximation in these non-
linear cases was that metabolite uptakes were significantly misrepresented, and in some cases, metabolites were actually not
exchanged substantially at all, once a non-linear drift correction was applied. Wemanually created non-linear approximations of drift
for each metabolite in Mathematica based on the media standards for each metabolite. We applied these non-linear corrections to
the raw data to recalculate the metabolite uptake and release profiles.
The metabolites from the exometabolomics data used in this study were previously measured in the media using LC-MS/MS. The
absolute concentrations were determined using standards for each metabolite. Metabolites were identified based on having the
same m/z values and LC retention times as standards, as described previously (Jain et al., 2012).
e2 Cell Systems 4, 1–12.e1–e6, March 22, 2017

Please cite this article in press as: Opdam et al., A Systematic Evaluation of Methods for Tailoring Genome-Scale Metabolic Models, Cell Systems(2017), http://dx.doi.org/10.1016/j.cels.2017.01.010
Determination of the Biomass ReactionCell biomass is composed of protein, lipids, DNA, RNA and small molecules, in weight fractions determined by cell composition
studies (Table S1). The average amino acid composition of protein was taken from literature (Altamirano et al., 2001; Bonarius
et al., 1996; Sheikh et al., 2005). Approximate DNA deoxyribonucleotide composition was set based on genomic base frequency,
taking into account the karyotype of the NCI-60 lines (Roschke et al., 2003). RNA ribonucleotide composition was determined based
on measured mass fractions (Altamirano et al., 2001; Bonarius et al., 1996; Sheikh et al., 2005). Lipid composition was set based on
measured lipid composition for high concentration lipids. Small molecule weight fractions were determined for several high concen-
tration non-essential metabolites using literature concentrations and a typical cell dry weight of 0.2 ng/cell and cell volume of 2 pL/cell
when unit conversions were necessary.
We chose to set the macromolecule weight fractions to be constant between cell lines. Previous studies show minimal variance
between macromolecule weight fractions for particular types of cells, such as hybridoma cells and Chinese hamster ovary cells (Al-
tamirano et al., 2001; Bonarius et al., 1996; Sheikh et al., 2005). Other cell types, such as liver cells, may have significantly different
macromolecule weight fractions, but cell lines derived from such tissues are not present in the NCI-60 panel. Also, although cell
composition has also been reported to change across growth conditions (Feijo Delgado et al., 2013), the NCI-60 panel was subject
to uniform growth conditions in the studies generating the data used in this study. Furthermore, there is the question of whether cell
composition changes with cell size. One study showed that doubling of cell size resulted in approximate doubling of respiration, sug-
gesting the protein content scales proportionally to size (Kit et al., 1959). Also, as volume changes, the cell surface area (SA) to volume
(V) ratio changes, and thus it is possible that the lipid weight fraction of the cell changes aswell. However, compartment size has been
shown to be approximately linearly correlated with total volume (De Menezes et al., 1996), and ER membrane alone is reported to be
over 10 times the fraction of the total membrane as the cytoplasmic membrane (Frixione and Porter, 1986), suggesting SA/V differ-
ences mean little in terms of lipid requirements. Thus, we assumed that the macromolecule composition was invariant across cell
lines, although cell sizes differ. Protein content and cell volume data for the NCI-60 was recently published (Dolfi et al., 2013). How-
ever, these data were insufficient to set cell-specific biomass macromolecule weight fractions, since the cell dry weight was not
measured.
To determine the cell-specific dry weights, we integrated cell volume data with the uptake rates as follows. First, the amount of
biomass sustainable by each cell was determined by maximizing the growth for each cell line using FBA, while constrained by
measured metabolite uptake rates in units of ‘‘per cell’’. Then, this sustainable biomass was corrected using measured protein con-
tent data as follows. If the sustainable protein, taking protein as 0.70 of total cell drymass, is less than themeasured protein, a value of
95%of the sustainable protein measurement was used as the estimate of cellular protein. This was done because themeasured pro-
tein could not be sustained by the measured uptake rates, which we assumed was due to error in the measured protein. Measured
protein was assumed to be the greater source of error because the measured uptake rates are highly correlated and there was no
general bias of sustainable protein being greater or less than measured protein. Furthermore, the measured protein showed a rela-
tively low agreement with cell volumes (Pearson R2 = 0.23) and we observed certain spurious data points causing concern. For
example, the SR line was reported to have a protein content of 0.021 ng/cell, which, given the reported cell volume and average pro-
tein density, would result in a dry weight fraction of protein of approximately 0.08, which is substantially lower than measured values
around 0.7. Volumemeasurements were based inmicroscopy, and thus were seen as less error prone than protein content measure-
ments which require cell count estimation, which can be a significant source of error. When sustainable protein was greater than
measured protein, the measured value was used to correct the sustainable protein, using the formula: mestimate = mmeasured +
0.25*(msustainable - mmeasured). This formula was chosen based on resulting agreement with cell volume data. The correlation of esti-
mated protein content with cell volume (Pearson R2 = 0.60) was higher than either measured protein (Pearson R2 = 0.23) or sustain-
able protein (Pearson R2 = 0.52).
Constraining the Input ModelsRecon1 (Duarte et al., 2007) was downloaded from the BiGG Database (King et al., 2016). A few reactions were curated in the model,
as described in Table S3. A biomass reaction (Table S1, see Methods) was added with a lower bound equal to the measured growth
rate (Table S4). The non-growth associated ATP maintenance (NGAM) has been previously reported as 1.833 mmol gDW�1 h�1 (Kil-
burn et al., 1969), although results in our study were robust to variations in NGAM (Figure S2).
In the unconstrained inputmodel, carbon-source exchanges are constrained to amaximumuptake of 10mmol gDW�1 h�1 to avoid
internal reaction bounds limiting the uptake of large polymeric carbohydrate molecules, which when catabolized lead to large fluxes
in the model. Carbon-sources include all model metabolites with at least one carbon atom, except for CO2 and HCO3. Other ex-
change reactions use the original flux bounds of the Recon 1model (either 1000 or -1000mmol gDW�1 h�1). As no exometabolomics
data are used to constrain the unconstrained model, it is the same for each of the four cell lines.
The constrained and semi-constrained models use exometabolomics data measured for the NCI-60 cell lines (Jain et al., 2012). To
correct for mass spectrometer drift in the peak area quantification of the data, we used a nonlinear correction since the drift was non-
linear. Exchange reactions were constrained by using themaximum andminimum fluxesmeasured for the biological replicates of the
corresponding cell lines. Bounds were expanded to include zero flux to ensure to not force uptake or secretion. For the constrained
model quantitative values are used. For the semi-constrained model the directionality of the measured exchanges is qualitatively
constrained by values of either �10, 0 or 10, based on the flux direction suggested by the exometabolomics data. Metabolite ex-
changes that were not in the data can only be excreted in the semi-constrained and constrained models, except for metabolites
Cell Systems 4, 1–12.e1–e6, March 22, 2017 e3

Please cite this article in press as: Opdam et al., A Systematic Evaluation of Methods for Tailoring Genome-Scale Metabolic Models, Cell Systems(2017), http://dx.doi.org/10.1016/j.cels.2017.01.010
that are not carbon sources, for which default bounds are used. Since the A375 cell line is not in the NCI-60 and no exometabolomics
data are available, exchanges were constrained using data for all other melanoma cell lines in the NCI-60. Specifically, we con-
strained the model using the median of the forward fluxes and the median of the backward fluxes across all melanoma cell lines.
To ensure that the constrained and semi-constrained models can produce biomass, we reconsidered four exchange reactions in
all of the cell types: histidine, methionine, saturated- and unsaturated octadecanoate exchange. These metabolites were not
measured in the exometabolomic data, hence their uptakewas constrained to zero. However, uptake of thesemetabolites is required
for biomass production. For the semi-constrained models the maximum uptake is set to 10 mmol gDW�1 h�1 for these metabolites,
consistent with all other metabolites that can be taken up in the semi-constrained models. For the constrained models the maximum
uptake rates for these metabolites are set to the minimum possible flux, based on a flux variance analysis (FVA) (Mahadevan and
Schilling, 2003) in which biomass is constrained to have at least the flux it would have when uptakes of these metabolites were un-
bounded. The same is done for cysteine, which is not measured in the exometabolomic data but is assumed to be taken up by the
cells (Gout et al., 1997). This resulted in constrained uptake rates comparable to other metabolites is the exometabolomics data.
All blocked reactions that are unable to carry flux above a certain threshold are removed. For the constrainedmodels a threshold of
13 10�8 is chosen. For the unconstrained and semi-constrained models a threshold of 13 10�6 is chosen since metabolite uptakes
were higher for these. A summary of the input models is given in Table S5. To verify that the results in this study were generalizable to
other human metabolic networks, we also tested the main analyses in this study on Recon 2.2 (Swainston et al., 2016), which was
published after this study had been completed. All analyses resulted in similar results based on Recon 1, as shown in Methods.
RNA-Seq Data ProcessingThemRNA-sequencing datasets (B€urckst€ummer et al., 2013; Di Ruscio et al., 2013; Pawlikowski et al., 2013; Zhang et al., 2015) were
downloaded, and Trimmomatic (Bolger et al., 2014) was used to trim low quality reads. The reads were aligned to the GRCh38 refer-
ence human genome using STAR (Dobin et al., 2013) (4 STAR parameters were set: ’–outSAMstrandField intronMotif’, ’–outFilter-
Type BySJout’, ’–outFilterIntronMotifs RemoveNoncanonicalUnannotated’, ’–outSAMtype BAM SortedByCoordinate’, others are
set as default), and then quantified using Cufflinks with all parameters set as defaults (Trapnell et al., 2011), using the unit of fragments
per kilobase of exon per million fragments (FPKM) for all genes. Gene expression threshold cutoffs were determined from the data for
each cell line (Table S6). The gene expression data were mapped to reactions using the GPRs, with OR logic using the maximum of
the expression of all corresponding genes, and AND logic using the minimum of the expression of all the genes. Reactions without a
GPR or where expression data is missing are not assigned a value.
Processing of the Knockout Screen DataGenome-scale CRISPR-Cas9 knockout screens (Shalem et al., 2014; Wang et al., 2014, 2015) were used to determine gene-essen-
tiality in each cell line to validate the models. For each cell line, the mean log2 sgRNA ratio (before vs. after screen) is calculated for
each gene. The mean ratio is computed from the mean of all sgRNAs mapping to the same gene. For A375, K562 and KBM7, the
ratios were calculated between days 3 and 14 post infection (Shalem et al., 2014; Wang et al., 2015). For HL60, the ratios compared
24 hr after infection and after twelve cell doublings (Wang et al., 2014). Gene identifiers are translated using bioDBnet 2.0 (Mudunuri
et al., 2009). The numbers of genes in the data that could be mapped to genes in the model are shown in Table S7.
Predictions of Gene-EssentialityTo predict gene-essentiality, the FBA algorithm from the COBRA Toolbox (Schellenberger etal., 2011) was used to optimize biomass
production following the removal of each reaction in the cell line-specific models that would be affected by gene removal based on
the GPRs. Using previously published criteria (Yang et al., 2014), a gene is essential when themaximum growth rate after knockout is
less than 1% of the maximum growth rate before knockout. However, our results are qualitatively robust to changes in threshold
choice for essentiality. A 1-tailed Wilcoxon rank sum test was used to test whether the log2 sgRNA ratios were significantly lower
for the genes that the model predicted to be essential. The p-value resulting from this test is used as an accuracy score. The contri-
bution to the variance in p-values due to the different factors (constraint type, MEM and expression threshold) is calculated as fol-
lows. For each factor, themaximumPearson correlation coefficient (R) of the p-values and categories is calculated across all possible
orderings of the categories. The explained variance of each test reported is the R2, scaled to percentage.
Calculating the Functionality ScoreMetabolic functionalities are the ability to synthesize individual metabolites of relevance to the cell line. As a proxy for all possible
metabolic functionalities, we defined 56 different functionalities, which are 56 metabolites required for cancer growth. Prior to model
extraction, the biomass reaction was removed and a sink reaction is added for each of the 56 metabolites to ensure they can be syn-
thesized in the inputmodel. All parameter sets were used in this analysis, and all MEMswere tested except for GIMME, whichwas not
included because it includes the optimization of biomass, thus not allowing an unbiased assessment of its ability to perform themeta-
bolic functions.
Following model extraction, all 56 functionalities were tested on each cell line-specific model as follows. First, the flux through the
sink reaction for each functionality wasmaximized using FBA. If the sink can carry flux above the reaction activity threshold, the func-
tionality is considered active. The reaction activity threshold is 13 10�8 for models extracted from a constrained input model and 13
10�6 for models extracted from unconstrained and semi-constrained input models.
e4 Cell Systems 4, 1–12.e1–e6, March 22, 2017

Please cite this article in press as: Opdam et al., A Systematic Evaluation of Methods for Tailoring Genome-Scale Metabolic Models, Cell Systems(2017), http://dx.doi.org/10.1016/j.cels.2017.01.010
The absolute number of active functionalities varies depending on model size. Therefore, a metric was developed to assess
the efficacy of parameters and MEMs at predicting functionalities while controlling for model size. Specifically, the number of active
functionalities was calculated for each model, compared to 1000 models of the same size, generated by randomly removing reac-
tions from the input model. These randommodels are checked to ensure their stoichiometric consistency by also removing reactions
that have been inactivated by the initial random removal. A quadratic relationship is then fitted between the number of reactions of
each model and the number of functionalities they yield. The 99% confidence interval (non-simultaneous observation bounds) is
calculated for the quadratic fits. Resulting is an upper bound for the 99% confidence interval for each unique input model. The score
of a cell line-specific model is the distance from the 99% confidence interval at the same number of reactions (Figure S11). This is the
number of functionalities the cell line-specific model has beyond the number exhibited by the top 1% of random models of the
same size.
Extraction of Cell Line-specific Models Using the MEMsTwo sets of models were extracted. The first set consisting of 288 models is used in the PCA, growth rate predictions and gene-es-
sentiality analyses. For this set of models the biomass reaction is always given a lower bound equal to the in vitro growth rate of the
corresponding cell before model extraction (Table S4). The second set consisting of 240 models is used for the metabolic function-
ality analysis. For these models, the biomass reaction is not given a constraint and will always be removed during model extraction.
Whenever a consistency check is performed during or after model extraction, fastCC (Vlassis et al., 2014) was used with a reaction
activity threshold of 13 10�8 for the constrained model and 13 10�6 for the unconstrained and semi-constrained models. All MEMs
are implemented inMATLAB and simulations are done using the COBRA Toolbox 2.0 (Schellenberger et al., 2011) inMATLAB 2013b.
Gurobi5 is used as solver.
Results from Recon1 Are Generalizable to Other Human ReconstructionsRecon 1 was used in this study because of its availability, quality, and because its size was more amenable to rapid model construc-
tion and analysis. However, more recent reconstructions, Recon 2 (Thiele et al., 2013) and Recon 2.2 (Swainston et al., 2016), and
other updates (Quek et al., 2014) have been published and providemore extensive views of humanmetabolism. Thus, we tested if the
results in our study with Recon 1 were generalizable to other human reconstructions. To do this we constructed models of the K562
cell line using Recon 2.2. Models were constructed using GIMME, FASTCORE, iMAT, INIT, and mCADRE. First, we found that, as
seen using Recon 1, the gene expression threshold choice had the largest influence on the first principal component (Figure S12A),
while the choice of constraint had its greatest contribution to the fourth principal component. However, when gene essentiality of the
models was compared to data from the CRISPR-Cas9 loss of function screens, the MEM choice had the greatest influence onmodel
accuracy (Figure S7). Furthermore, the pattern of optimal threshold and MEMs for gene essentiality predictions for Recon 2.2 (Fig-
ure S12B) is comparable with the results from Recon 1. Lastly, when models were constructed without the biomass function, the
models were able to recapitulate most metabolic functions, but the few missing metabolic functions (Figure S12C) were comparable
to those missing from models built with Recon 1 (Figure 4). Thus, the results seen with Recon 1 are generalizable to other human
reconstructions.
MILP-Based MEMs Have Multiple Solutions Performing EquivalentlySome MEMs, such as iMAT and MBA, utilize mixed integer linear programming (MILP), and as a result, the MEMs can yield multiple
solutions for a model extraction that would be equally ‘‘fit’’ to the input data. We tested here how different the equivalently optimal
models are from each other, and demonstrated that they exhibit similar levels of accuracy. Specifically, we generated equivalent
optimal models of the A375 cell line constructed using iMAT or MBA (with the p25 threshold) by running the algorithms ten different
times, using different random seeds to start the algorithm. We found that the ability to predict gene essentiality did not drastically
change (Figure S3). Indeed, for example, the results from the analyses in which we predicted gene essentiality for the 10 different
optimal MBA models represent yielded similar results. Furthermore, while the models show some differences in reaction content,
we found them to vary far less in reaction content among the alternative optimal models, compared to models generated with
different MEMs (Figure S4).
Minor Changes to the Biomass Composition Does Not Significantly Influence Gene Essentiality ResultsThe biomass function was built from previously published studies (Table S1). However, we carefully curated it to qualitatively cover
many of themetabolic needs ofmost, if not all cancer cell lines. Thus, it accounts for the components that are necessary for an immor-
talized cell line to grow. This includes the amino acids, nucleotides, sugars, energy equivalents, and essential small metabolites (poly-
amines, glutathione, q10, paps, carnitine, tetrahydrobiopterin, etc.). The quantitative values should be near the actual values for the
cell lines, but they are estimates based on published sources of cancer cell lines and a few others immortalized mammalian cell lines
(Altamirano et al., 2001; Bonarius et al., 1996; Sheikh et al., 2005). While the values will vary across cell lines, we note that the quan-
titative values in a biomass function only rarely affect gene essentiality predictions (only if substrate uptake rates end up conflicting,
which would not accurately reflect the biology since actual cell lines would merely reduce uptake of any conflicting metabolite).
Indeed, a recent study demonstrated that predictions of growth rates and metabolic flux predictions are largely robust to changes
in the quantitative values of a biomass function (Yuan et al., 2016). To test the validity of this statement in the context of our study, we
used mCADRE to generate 10 additional models for the A375 cell line. For each of these models, all biomass coefficients were
Cell Systems 4, 1–12.e1–e6, March 22, 2017 e5

Please cite this article in press as: Opdam et al., A Systematic Evaluation of Methods for Tailoring Genome-Scale Metabolic Models, Cell Systems(2017), http://dx.doi.org/10.1016/j.cels.2017.01.010
randomly varied by 20%. We do not see any difference in the accuracy results (i.e., the accuracy scores for gene essentiality pre-
dictions were the same for all 10 models, and predicted growth rates varied by <6%). This analysis demonstrates that modest
changes in the biomass coefficients do not significantly impact the construction of models, nor the accuracy of gene essentiality pre-
dictions using these models. We further tested if the results were also robust to changes in the composition to the biomass function.
Specifically, while a thorough characterization wasmade to include even low abundance essential vitamins in the biomass function, it
is possible that the biomass function could bemissing components. In this situation, themodels could erroneously miss some essen-
tial genes. To test if this could potentially impact the claims of our study, we have performed a supplementary analysis in which we
built 10 more models of the A375 cell line using mCADRE after randomly adding a non-biomass metabolite to the biomass function.
After adding thesemetabolites, our results were qualitatively the same (Figure S1), and well within the range seen for the models built
using the standard biomass function used for this study (Figure S7).
Extracted Models Do Not Inherently Predict Growth RatesConstraint-based modeling is particularly valuable in its ability to successfully simulate cellular functions and phenotypes, based on
an organism’s metabolic network. Thus, to assess the ability for the models to predict phenotypes, we tested their ability to predict
growth rates. Cell line-specific models that are extracted from constrained input models are directly used to predict growth rate. Cell
line-specific models that are extracted from a semi-constrained or unconstrained input model were constrained by the measured
uptake rates for all exchange reactions that remained after model extraction. Prior to model extraction, the experimentally measured
growth rate (see Table S4) was added as a lower bound on the biomass reaction. This constraint is removed since models might not
be able to achieve this growth rate after the exchange reaction constraints were added. The growth rate is then predicted by maxi-
mizing the biomass reaction using FBA. We found that in nearly all cases, the unconstrained and semi-constrained models failed to
recapitulate the experimentally measured growth rate of the cell. Out of all cell line-specificmodels extracted from unconstrained and
semi-constrained input models, only 7% could achieve a biomass production above 50% of the experimentally measured growth
rate. This failure results because when starting with the non-quantitative uptake and secretion rates, the MEMs are not constrained
to keep the pathways required by the exometabolomics data. Thus, important cell pathways are eliminated since the required exper-
imentally measured growth rates can easily bemetwith unrealistic uptake rates of specificmetabolites that can be used to synthesize
many other biomass metabolites. This occurs since many pathways and uptakes are deemed redundant during extraction and are
therefore removed. Then, when measured uptake rates are added, the cell line-specific models are lacking pathways and cannot
produce sufficient biomass. Thus, cell-line specificmodels can only accurately recapitulate growth rates if uptake and secretion rates
from exometabolomic data are set prior to model extraction (i.e., in the constrained input model) and the biomass reaction itself is
given a lower bound as well.
QUANTIFICATION AND STATISTICAL ANALYSIS
Principal Component AnalysisA binary matrix is constructed in which each row represents one of the 72 extractedmodels and each column represents a variable: a
reaction being present (1) or absent (0) in a model for the model content PCA. Reactions in all or no models were removed from the
matrix. Similarly for the metabolic functionality PCA, the matrix had each row as an extracted model and each column a variable: a
functionality being present (1) or absent (0) in themodel. For the PCAs, the matrix was centered to have zero mean within each row. A
PCA analysis on this matrix was conducted. The variance explained by the different factors (constraint type, MEM and expression
threshold) within each of the principal components is calculated as follows. Within one factor, the maximum Pearson correlation co-
efficient (R) of the component scores and categories is calculated across all possible orderings of the categories. Reported is the R2
scaled to percentages.
DATA AND SOFTWARE AVAILABILITY
The mRNA-sequencing datasets were acquired from previous publications (B€urckst€ummer et al., 2013; Di Ruscio et al., 2013; Paw-
likowski et al., 2013; Zhang et al., 2015) and genome-scale CRISPR-Cas9 knockout screens were obtained from (Shalem et al., 2014;
Wang et al., 2014, 2015). Matlab code for running extraction methods and performing analysis are provided in Data S1 (see also
https://github.com/LewisLabUCSD/Context_Specific_Models_from_GeMS).
e6 Cell Systems 4, 1–12.e1–e6, March 22, 2017


![Genome-Based Metabolic Mapping and 13C Flux Analysis ... · Genome-Based Metabolic Mapping and13C Flux Analysis Reveal Systematic Properties of an Oleaginous Microalga Chlorella protothecoides1[OPEN]](https://img.pdfslide.us/doc/110x75/5eba3cbedcb7624207539cc5/genome-based-metabolic-mapping-and-13c-flux-analysis-genome-based-metabolic.jpg)