Embed Size (px)
Citation preview
1 Abstract—In this paper, we evaluate the resilience of the smart
grid system in the presence of multiple cyber-physical attacks on its distinct functional components. We discuss attack-defense scenarios and their effect on smart grid resilience. Through contingency simulations in the Network and PowerWorld Simulator, we analyze multiple cyber-physical attacks that propagate from the cyber domain to power systems and discuss how such attacks destabilize the underlying power grid. The analysis of such simulations helps system administrators develop more resilient systems and improves the response of the system in the presence of cyber-physical attacks.
Keywords—Smart grid, resilience, gas pipeline, cyber-physical
attack, security.
I. INTRODUCTION ODAY’S Smart Grid (SG) relies on Information and Communication Technology (ICT) to monitor and control
operations. The adoption of state-of-the-art ICT in the power sector enhances the ability to make efficient use of resources and make it smarter than before. One example of ICT deployment is Advanced Metering Infrastructure (AMI). AMI is responsible for communication between Smart Meters (SM) and the Smart Grid Utility (SGU). SM gathers power consumption data at customer’s premises and sends it to the SGU. The SGU uses this information for billing purposes, maintaining load profile of clients, and more importantly enables features such as Demand Response (DR), Time-of-use (TOU) pricing and Real Time Pricing (RTP). AMI has become the backbone of the SGU. This is how deployment of one technology gives rise to different functionalities that enhance SG operations. The growing interdependence of SGU on ICT imposes extraordinary challenges on the security of such Cyber-Physical Systems (CPS). To reduce the resilience of the SG system, the attackers can conduct cyber attacks, physical attacks or Cyber-Physical Attacks (CPA) [4] directly or indirectly on its distinct functional components.
A study conducted by Tripwire [13] states that 82% of the oil and gas administrators reported their organization were subject to cyber attacks in 2015, and 69% were not sure whether their system could detect a cyber attack. The Stuxnet attack [11] on industrial computer systems of Iran’s nuclear program was responsible for causing substantial damage to the nuclear physical processes. Recently, a cyber attack on the Ukraine’s SGU [14] caused power substations to disconnect
Yatin Wadhawan and Clifford Neuman are with the Department of
Computer Science, ISI, University of Southern California, Los Angeles, USA (e-mail: [email protected], [email protected]).
Anas Al Majali is with the Department of Computer Engineering, The Hashemite University, Jordan (e-mail: [email protected]).
for three hours, which affected approximately 80,000 customers and forced system operators to switch to manual mode. Cyber-attacks on other SG components, such as gas distribution pipelines connected to the SGU also affect resilience. Attacks on natural gas pipeline infrastructure cause a delay in gas delivery to Gas Fired Peaker Plants (GFPP) preventing them from generating power causing loss of generation during peak demand hours and affecting Smart Grid Resilience (SGR). Considering the natural gas distribution pipeline as a target increases the surface area of attack.
Researchers have focused on analyzing the impact of the CPA on one of the functions of the SGU [3]-[9]. Today’s attackers use multiple attack vectors as we see in Ukraine power grid attack [14]. To counter those efforts, we consider a larger surface area to attack for evaluating the SGR. We need to incorporate attacks on different direct and indirect functions and components of the SGU. Such a detailed description about evaluating the SGR in the presence of multiple simultaneous CPA is largely unaddressed by the current literature.
The primary contribution of this paper is to address the question: “How can we evaluate the resilience of a given Smart Grid system in the presence of multiple simultaneous cyber-physical attacks on its distinct functional components?”
Our contributions are twofold. First, we evaluate the resilience of the SGU in the presence of multiple simultaneous CPA. We show that it is important to consider multiple attacks on the SGU while performing resilience analysis and how it benefits system engineers to understand the system dynamics in the presence of ongoing attacks. Second, we consider the attack scenarios on the power system, natural gas distribution pipeline, and communication network. We consider: 1) worm propagation attack to compromise SM that control DERs remotely and manipulate the generation; 2) the pressure integrity attack on the natural gas distribution pipeline and 3) Distributed Denial of Service (DDoS) attack on the pipeline communication network. We use the output of these attack scenarios as input to the PowerWorld Simulator and see how such attacks destabilize the underlying power system. Furthermore, we present security metrics that should be considered by the system engineers to build more robust and resilient power systems. The analysis of multiple attack scenarios on the SGU helps system engineers to develop more resilient systems and improves the response of the system to ongoing attacks.
This research paper extends the work in [1], [2]. The outline of the paper is as follows. Section II discusses the
A Systematic Approach for Analyzing Multiple Cyber-Physical Attacks on the Smart Grid
Yatin Wadhawan, Clifford Neuman, Anas Al Majali
T
related work. Section III states what do we mean by SGR. Section IV discusses the attack scenarios corresponding to each functionality and how resilience is affected if those functions are compromised. Section V presents the simulation setup and analysis methodology. Finally, in Section VI we conclude the paper by discussing the results of the simulation and the future work.
II. RELATED WORK Researchers focused on modeling and analyzing the impact
of CPA on the functions and components of the SG such as in [3]-[9], [23]. In [3], the authors introduced combined data integrity and availability attacks to expand the attack scenarios against power system state estimation. In [4], the authors described ways that how CPAs propagate between the cyber and physical domains. The authors in [5] formulated a differential game that demonstrates stealthy strategies for attackers to disrupt transient stability by leveraging control over DERs. In [6], the authors demonstrated the load drop attack and analyzed its impact on the underlying power system in the PowerWorld Simulator.
Ryutov et al. [22] presented a security mechanism that monitors and controls load as per the security policies during normal operations as well as in the presence of load-altering attacks. The load-altering attacks are classified as direct or indirect. The load control policies are dependent on 1) government requirements, 2) utility policies, 3) customer policies, and 4) third party policies. Through PowerWorld simulations, the authors performed load drop attack scenario. The results of the study state that it is important to determine whether to authorize the DR and AMI commands when a system is reaching critical states. In [7], worm propagation in AMI is simulated, and probabilistic model is derived.
A graph theoretic approach is presented in [8] that captures the interdependencies between oil pipelines and power networks. These systems are connected by physical and functional interdependencies. The cyber attacks are performed on the network by attacking a small fraction of nodes and analyzing its effect on the connected network. These sources don’t address how nodes in the oil and power network fail.
A resilience quantification framework is proposed in [19] that specifies all the phases in which power system resides in the presence of an event (more specifically extreme weather conditions). The authors proposed the time-dependent operational and infrastructure resilience metrics based on various indicators with a motive to quantify the resilience of the critical system. The cyber attacks are more prevalent than weather conditions. The paper fails to explain whether such methodology is applicable in the presence of CPAs or not.
An integrated simulation model for analyzing electricity and gas systems by assuming random failures in the power system is described in [9]. They have examined the effect of that random failure on the gas network. The problem with their approach is that they have assumed random failures of components and failed to describe how those failures arise.
A methodology to identify the vulnerable components within the microgrid infrastructure and how disruptions can
affect its resilience is proposed in [10]. The paper fails to describe how such disruptions can happen. Furthermore, the authors assumed that there is an increase in cost due to disruptions and formulated a cost optimization problem to see the effect of the disruption cost. The requirement is to define the attack path within system of systems so that system administrators can either block the path or isolate the system so that the attack does not propagate to other parts of the systems.
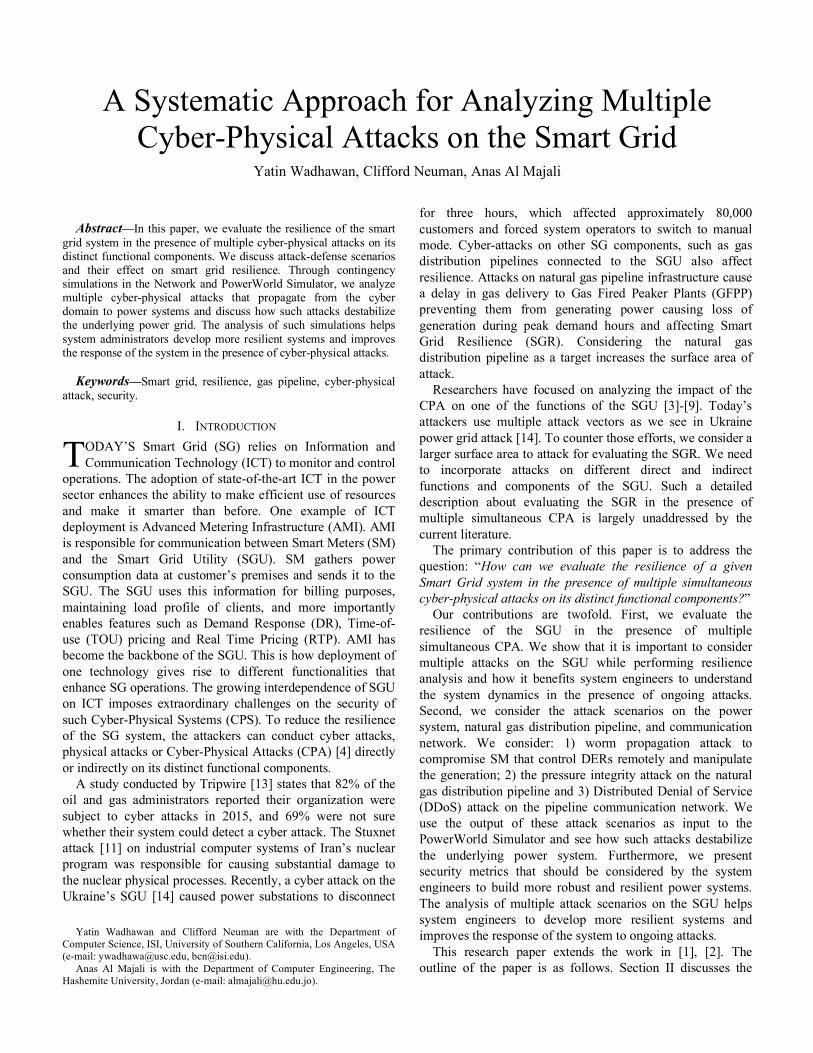
Fig. 1 Attack (A)-Defense (D) Diagram
In this paper, we evaluate the resilience of the SG in the presence of three CPAs. First, we evaluate a worm propagation attack that compromises SM to control DERs remotely. In response to this attack, system engineers instruct GFPP to produce power to meet the unsatisfied demand. Second, we analyze a pressure integrity attack on a segment of natural gas transmission pipeline that delivers gas to the GFPP. The system engineers will send control signals to the remote terminal units and compressor station to maintain proper pressure in response to the attack. And finally, we consider a DDoS attack on the pipeline communication network to reduce the response of the system engineers. We use the combination of these simulations with the PowerWorld simulation and see step-by-step how such attacks destabilize the underlying power system. The attack-defense scenarios described above is shown in Fig. 1.
III. SMART GRID RESILIENCE SGR [2] is the ability of the SG system to avoid failure of
its functions in the presence of non-malicious and malicious activities and to recover from those failures to an acceptable safe state without affecting function delivery. The main function of the SG is power delivery. The variety of attack vectors [4] is available to attackers to attack the SG components and prevent power delivery. An attack in the cyber domain can propagate to the physical domain and destabilize the SG. This is achieved by manipulating the power demand-supply mismatch. The sources of energy are baseload coal (or nuclear and hydro) plants, peaker power plants, storage of electricity, DERs, DR and AGC as spinning reserves. The attackers compromise cyber components such as remote terminal units, and programmable logic controllers

to control the physical processes such as AGC, DR or even gas pipeline flow and manipulate the power demand and supply. The consequences of such attacks are load shedding, islanding, and partial or complete power system shut down. Now we describe attack scenarios on various system components and functions.
IV. CPA SCENARIOS In this section, we describe attack scenarios on distinct
functional components of the SG system. We describe how cyber attacks originate, what system components are compromised, how they escalate within the system and what the physical impacts of these attacks on the SGR are. Note, due to space constraint we do not provide the description of the SG components and functions. The details of such components have already been described in our previous paper [2], in addition, it is common in the SG literature.
A. Attack on Distributed Energy Resources (Attack I) SM are installed at the customer’s premises that are
responsible for two-way communication between the SGU and local control center. They are accessible from the Wireless Mesh Network (WMN). Also, the energy storage device is attached to the DER. SGU sends control signals to SM to dispatch power from the DER system or to operate as an independent operator [15]. Since SM are connected to WMN, they are accessible over the network and exposed to CPAs. We simulate worm propagation attack on the AMI network, which consists of SM and use its output in further simulating the power system. In this attack scenario, we assume that the attacker has access to one of the houses in a particular area and infected the SM of that house. We use worm propagation model [7]. The worm installed at the SM now seeks to infect other meters present in the neighboring area and execute the payload it carries. We assume that the payload the worm carries prevents the SM from dispatching the DER stored energy. Since SGU is unable to dispatch the stored energy, it is not able to meet the power demand. And hence there is a decrease in frequency of the system. When generation is not able to meet demand, the power line frequency in the area decreases. In response to this attack, the system engineers start GFPP to produce power. Now attackers perform an attack on the gas pipeline system to prevent the natural gas reaching peaker plants as described in the next subsection.
B. Attack on Natural Gas Distribution Pipeline (Attack II) The gas distribution pipeline system is a CPS that is
controlled remotely from the cyber domain where operators use SCADA system to send control signals and receive state information. Remote Terminal Units (RTU) are present along the pipeline segments, and they capture the state information about the flowing gas. If a gas pressure in a pipe segment is
reduced/increased below/above a threshold (which may be a sign of pipeline leakage), RTUs send this information to the SCADA system so that the system engineers can take appropriate steps to subdue the condition.
In this attack scenario, we model the attacks on the gas distribution pipeline that connects to the GFPP. The gas is delivered to the GFPP so that it can generate power during peak hours. According to our attack-defense tree, when DERs are not useful in meeting increased demand (other than base demand), system engineers ask GFPP to produce power as a defense action. In response to this defense action, attackers perform pressure integrity attack [1] on the gas distribution pipeline. The attacker compromises a percentage of RTUs and RCVs present along the pipeline infrastructure and prevents the correct information reaching SCADA system. Because of this, SCADA system does not know the correct pressure and other physical properties of the gas flowing through the pipeline. The attacker then instructs the compressor station to increase the pressure at which gas should be delivered and RCVs to close the pipe segment. The compressor station will increase the gas pressure in response to the change in delivery pressure. Every pipeline has Maximum Allowable Operating Pressure (MAOP) [16] below which gas typically flows without damaging the pipe. After some time of this attack, SCADA system can determine that gas pressure has increased.
The RTUs present along the further pipe segments will detect the change in pressure of the gas and notify SCADA system about an abnormal increase in pressure. In response to an abnormal increase in pressure, SCADA system starts sending control signals (to reduce pressure) to RTUs, RCVs and compressor station. If commands are delivered before gas pressure reaches MAOP, the pressure is reduced, and everything will work normally. And the system will be in a safe recovery state. But what if attackers perform an attack on the communication infrastructure of the pipeline to reduce the response of the SCADA system when there is an ongoing attack (like we saw in Ukraine’s power grid attack [17])?
C. Attack on Communication Network (Attack III) In this attack scenario, the attacker’s motive is to prevent
the SCADA control commands from reaching RTUs of the pipeline segment. The attackers perform a DDoS attack on the WMN by compromising wireless nodes and sending packets to jam the network. Since the network is crowded, legitimate control signals are not able to reach RTUs and pressure crosses MAOP. This attack reduces the response of the SCADA system and thereby completing the attack-defense scenario proposed in Fig. 1. Similarly, attackers can also perform an attack on the WMN of the SG system and manipulate the state variables maintained by the SCADA system. We have not included this case in this study.
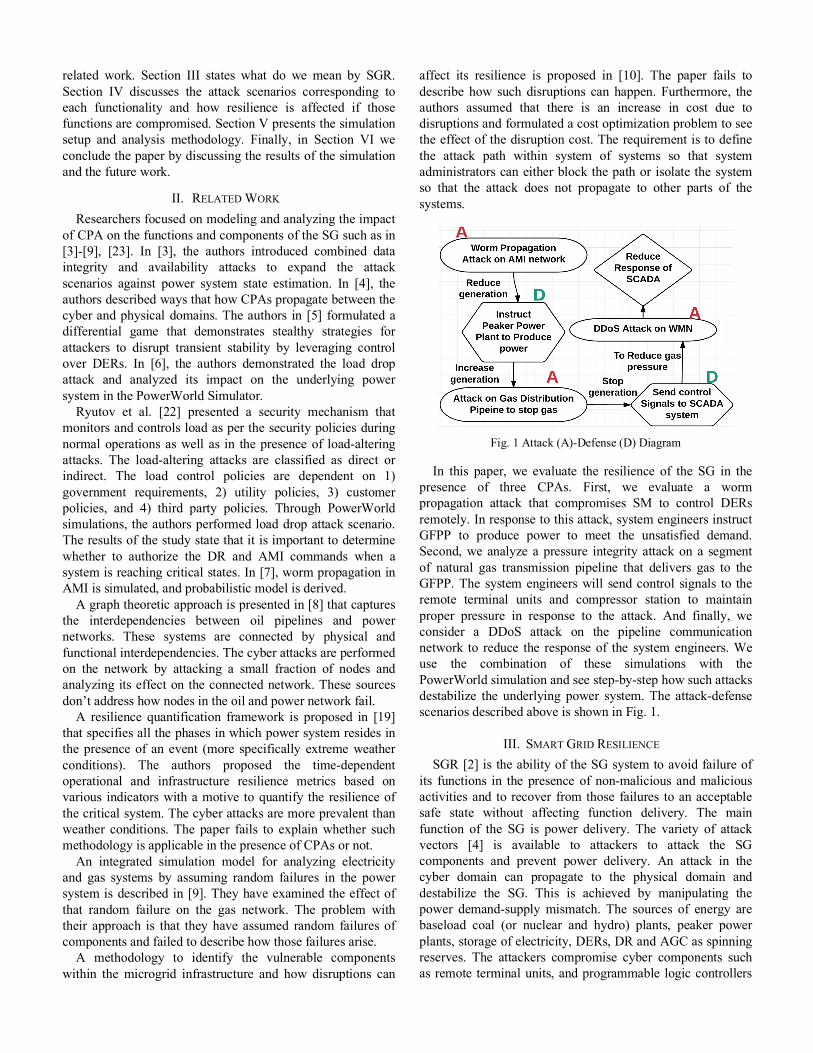
Fig. 2 IEEE 9-bus Power Model
Fig. 3 Gas Pipeline Model: Pipeflow Software [1]
V. SIMULATION AND ANALYSIS In this section, we present the simulation setup and then,
we discuss the analysis methodology and results.
A. Simulation Setup 1) AMI Network Setup: We have modeled the WMN using
the Network Simulator (NS2) [7]. There are 100 meters, each representing a residential house, with a gateway placed at the center of the simulation area. Each meter is configured with the transmission rate of 1Mbps and Ad-hoc On-demand Distance Vector (AODV) is used as a routing protocol [18]. The meters send their readings to the gateway server.
2) Gas Pipeline Setup: The Pipeflow software is used to understand the MAOP limits of the gas flowing through pipeline [1]. The motive of pipeline segment (in Fig. 3) is to deliver natural gas at the sink placed at a distance of 160 miles from the source. The compressor station is positioned at 96 miles from the origin and 64 miles from the sink. MAOP of the pipe segment is 1200 psig. The natural gas should be delivered at 900 psig. The pressure must not go beyond MAOP, if that happens, the pipeline inner coating may get damaged due to pressure increase, pipe leakage or pipeline can explode (similar to what happened with Turkish pipeline [24] where attackers inserted a malware into the control center that led to pipeline explosion). Compressor station should pressurize the gas at 1196.61psig to deliver gas at 900psig at the sink node and it changes the pressure according to the delivery requirements. The difference in pumping and delivery pressure is because of energy loss due to friction when gas flows through a pipeline segment. The above software provides the details of the pipeline model but does not allow us to simulate attack scenarios at different pressures. And there is no educational software that
allows us to simulate the gas pressure. Therefore, we consider different models of pressure increase to cover different scenarios manually. The cases for increase in pressure are 1) instantly, 2) linearly and 3) logarithmic with various rates at which compromised commands are delivered to RTUs (see Fig. 12).
3) Wireless Mesh Network Setup: We have modeled the WMN that supports the pipeline system using NS2 [1]. WMN is in between 1) the compromised cyber node and RTUs and 2) SCADA and RTUs. RTUs are present along the pipeline segment and communicates with the SCADA system over WMN. RTUs capture the properties of the gas flowing through the pipe. In total, we modeled 300 nodes with uniform distribution in a region of the pipeline. There are 170 RTUs, a wireless router, a compromised node, and SCADA node and the wireless network nodes for communication. The wireless router is responsible for routing messages over the internet to the SCADA system. UDP/IP as transport layer protocol and AODV [18] as a wireless routing protocol are used to simulate the WMN. The configuration [20] of meters operating over a radio network is Radio Frequency: 900MHz, Data Rate: 10 Mb, Transmitter Output: 30 dBm and Receiver Sensitivity: -97 dBm. The shadowed [21] propagation model is used to simulate outdoor communication because it predicts the mean received power and computes its variation at a certain distance. The configuration of the shadow distribution model is: Path Loss Exponent: 2.7, Standard deviation: 4 and Reference Distance: 4.0 m.
4) SG Setup: We have used the PowerWorld Simulator to model the SG component to perform simulation analysis [2]. The power system is simulated using IEEE 9-bus system (see Fig. 2). We have modelled three generators of IEEE 9-bus model as: Bus 1 Gen (B1G) serve as Base Load, Bus 2 Gen (B2G) as Peaker power plant and Bus 3 Gen (B3G) as DER PV. We have not changed the default generation units of the IEEE 9-bus model except the generation and frequency limits and load requirements. B3G is modelled as a DER and configured using WECC

Solar PV (Photo Voltaic) dynamic model specification [12]. We use frequency as a metric to determine whether system shuts down. Each generator is assigned with the frequency boundaries with the pick up time. Normally, the limit of frequency is 60 Hz, the over frequency protection is enabled with a threshold of 62.4 Hz and under frequency is 57.60 Hz with pickup time of 2 seconds. The generators will trip due to over frequency protection mechanism if frequency exceeds 62.4 Hz for more than 2 seconds [2]. The reason behind frequency increase is more generation than load. Similarly, generators will also trip when there is low generation than load (frequency drops below 57.60 Hz).
B. Analysis Methodology The following list describes our analysis methodology.
Steps 1 to 4 represent the simulation steps of worm propagation. Step 5 represents the response of the SCADA system. Steps 6 to 11 describe the attack scenario when attackers attack the gas pipeline system with a motive to prevent gas from reaching GFPP. Step 12 describes the response of the SCADA. Finally, steps 13 and 14 presents the DDOS attack to reduce the response of the SCADA. 1. Create the background traffic in the AMI WMN of the
SM installed at the customer premises in a particular area as described in V-A-1. Each command assumed to be the size of 1000 bytes. We start the attack 150 secs after the simulation starts. The reason behind this is that WMN gets stabilize with the flow of the traffic.
2. The adversary who controls the compromised node in the system installs a worm on the SM. The worm then propagates over the AMI network and compromise the other SM present in the space. The worm is programmed to disconnect the DER resource at customer’s premises from the power network.
3. We capture the time at which SM get affected by the worm and disconnect the DER from the network.
4. When DERs at various homes are disconnected, there is loss in the power generation. In order to simulate DER disconnect attack, we assume that the power supplied by the DER is through B3G generator. Therefore, to demonstrate this loss of power generation, we shutdown the B3G at 400 seconds of the B3G in the PowerWorld Simulator. This causes system to get shutdown (see Figs. 7 and 8).
5. In response to this attack, the system engineers ask GFPP (generator modeled as peaker power plant) to generate more power to cover the loss because of previous attack. The peaker power plant starts generating more power and the loss of DER is covered. To demonstrate this action, we increase the exciter set point of B2G by 10% at 401 secs during the simulation (see Fig. 9) just after B3G shutdown. If we delay the time, it will only make the situation worse.
6. In order to disrupt the power generation of B2G, the attackers conduct pressure integrity attack on the natural gas pipeline to prevent the gas reaching GFPP. We start
the simulation by creating the background traffic where RTUs are sending data to the nearest CS and the SCADA system, about the status of a pipeline. Each command is assumed to have a size of 500 bytes.
7. The adversary controlling the compromised node generates a series of commands targeting each RTU meter along the pipeline segment & compressor station. The time interval between consecutive commands is varied using uniform distribution (0, T) for different values of T.
8. We capture the time at which commands are received by each meter. The attacker sends re-program commands to the RTUs to show misleading pressure readings to the CS and SCADA and instructs CS to increase the pressure of the natural gas (see Fig. 10).
9. Once the attacker compromises RTUs, the correct information about the pipeline status is reduced and compressor station starts increasing the pressure to meet the pressure delivery rate at the sink. The attack is performed on a particular pipeline segment (see Fig. 11). If pressure goes beyond MAOP, the pipeline segment may burst and leakage would happen. This stops the gas delivery and cause great loss to the pipeline segment.
10. To demonstrate this attack on the power system, we shutdown the B2G at 500 secs in the PowerWorld Simulator (see Figs. 12 and 13).
11. Since the natural gas is flowing through the pipeline, it is very hard for the attacker to hide the pressure increase from the SCADA for too long. SCADA system will discover that pressure is deliberately increased in a particular pipe segment.
12. In order to reduce pressure, SCADA system sends signals to RTUs and CS to increase the information about the pipeline segment and to reduce the gas pressure.
13. Now attacker performs a DDOS attack by compromising particular nodes in the WMN. Each node in the WMN sends data at a time chosen from the uniform distribution (0, T), for different values of T.
14. We capture the cumulative number of RTUs received commands by varying the number of nodes compromised during the DDOS attack (see Figs. 14 and 15). Finally, we analyze the results of the simulation and describe the metric to consider for developing robust systems.
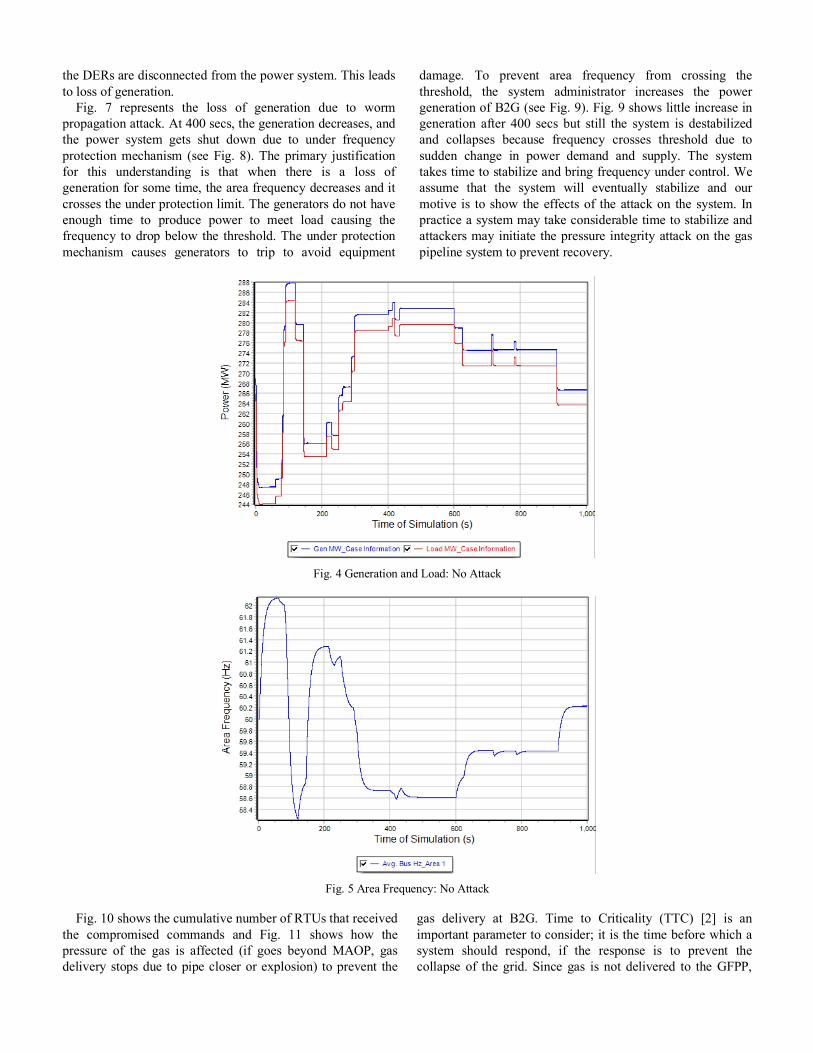
C. Simulation Analysis Fig. 4 represents the generation and load requirements
when there are no attacks on the system. The blue line stands for generation and red line for the load. The generation is slightly less than load because of the loss of power during transmission over the buses. Fig. 5 shows the area frequency of the IEEE 9-bus system. During simulation, frequency does not go beyond its protection thresholds as described in section V-A-4. Fig. 6 represents the simulation result of the worm propagation attack. The cumulative number of meters infected over a period is shown in the graph. The speed at which meters are infected depends on the size of the worm, which we have not evaluated in this study. Once meters are infected,
the DERs are disconnected from the power system. This leads to loss of generation.
Fig. 7 represents the loss of generation due to worm propagation attack. At 400 secs, the generation decreases, and the power system gets shut down due to under frequency protection mechanism (see Fig. 8). The primary justification for this understanding is that when there is a loss of generation for some time, the area frequency decreases and it crosses the under protection limit. The generators do not have enough time to produce power to meet load causing the frequency to drop below the threshold. The under protection mechanism causes generators to trip to avoid equipment
damage. To prevent area frequency from crossing the threshold, the system administrator increases the power generation of B2G (see Fig. 9). Fig. 9 shows little increase in generation after 400 secs but still the system is destabilized and collapses because frequency crosses threshold due to sudden change in power demand and supply. The system takes time to stabilize and bring frequency under control. We assume that the system will eventually stabilize and our motive is to show the effects of the attack on the system. In practice a system may take considerable time to stabilize and attackers may initiate the pressure integrity attack on the gas pipeline system to prevent recovery.
Fig. 4 Generation and Load: No Attack
Fig. 5 Area Frequency: No Attack
Fig. 10 shows the cumulative number of RTUs that received the compromised commands and Fig. 11 shows how the pressure of the gas is affected (if goes beyond MAOP, gas delivery stops due to pipe closer or explosion) to prevent the
gas delivery at B2G. Time to Criticality (TTC) [2] is an important parameter to consider; it is the time before which a system should respond, if the response is to prevent the collapse of the grid. Since gas is not delivered to the GFPP,

generation is impacted. To demonstrate this attack, we shut down power generation due to B2G in the PowerWorld Simulator. Fig. 12 represents the loss of power in the system, and the frequency crosses under protection limit causing the system to shut down. To prevent this attack, system engineers send control commands to the RTUs and compressor station along the pipeline. The attackers perform the DDoS attack to reduce the response of the system so that system remains in the unstable state. Fig. 14 represents how Packet Delivery Ratio (PDR) in the WMN is affected by the DDoS attack when some nodes (f) are compromised to perform DDoS.
Fig. 6 Worm Propagation over WMN: Attack I
Fig. 7 Generation and Load: Attack I
Fig. 8 Area Frequency: Attack I
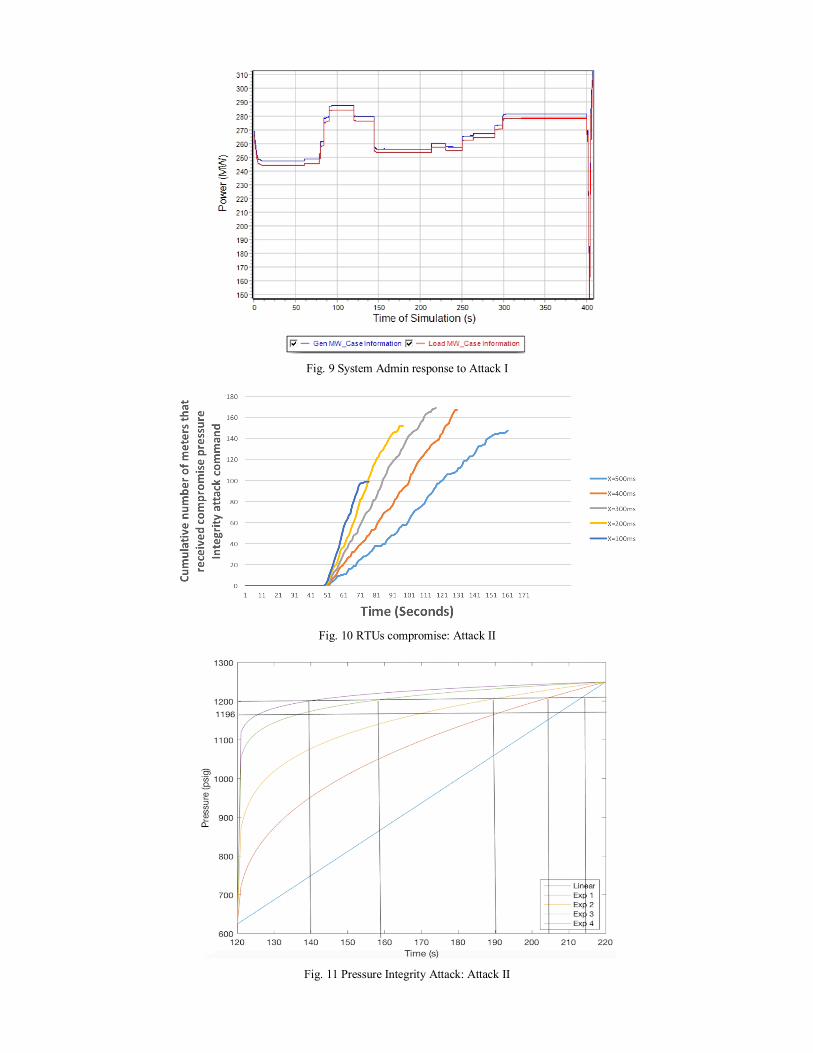
Fig. 9 System Admin response to Attack I
Fig. 10 RTUs compromise: Attack II
Fig. 11 Pressure Integrity Attack: Attack II

Fig. 12 Generation and Load: Attack II
Fig. 13 Area Frequency: Attack II
Fig. 14 DDoS on WMN of Pipeline: Attack III
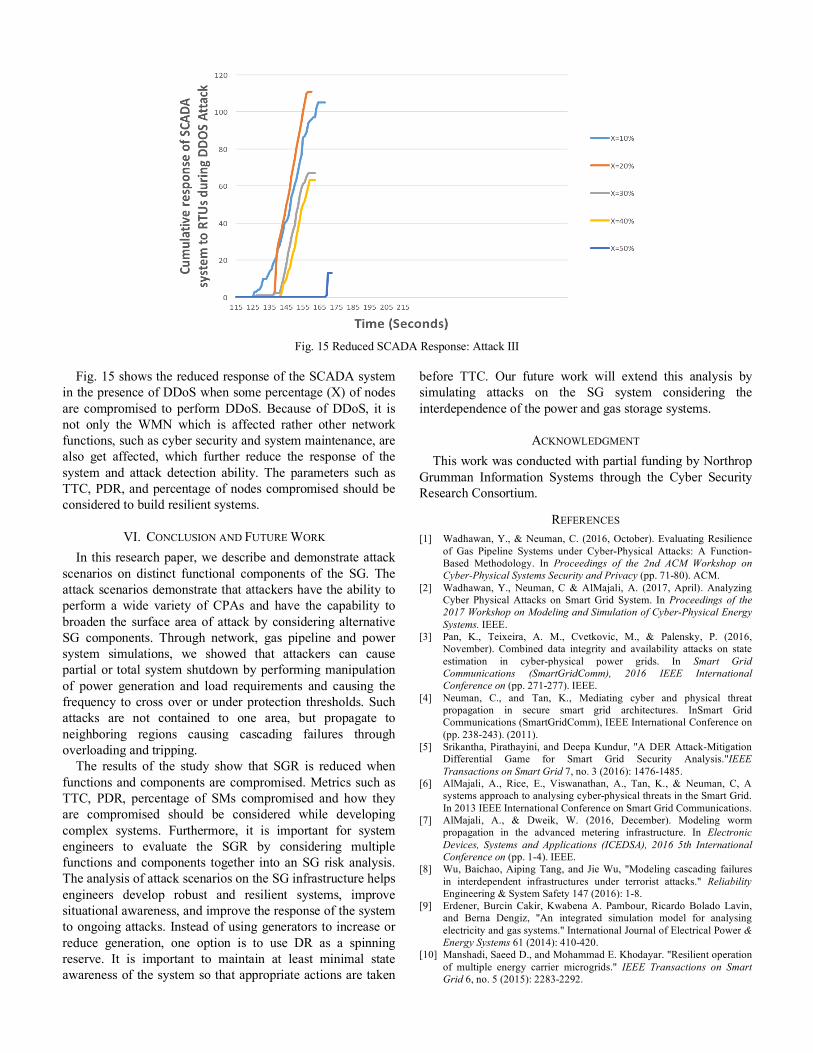
Fig. 15 Reduced SCADA Response: Attack III
Fig. 15 shows the reduced response of the SCADA system
in the presence of DDoS when some percentage (X) of nodes are compromised to perform DDoS. Because of DDoS, it is not only the WMN which is affected rather other network functions, such as cyber security and system maintenance, are also get affected, which further reduce the response of the system and attack detection ability. The parameters such as TTC, PDR, and percentage of nodes compromised should be considered to build resilient systems.
VI. CONCLUSION AND FUTURE WORK In this research paper, we describe and demonstrate attack
scenarios on distinct functional components of the SG. The attack scenarios demonstrate that attackers have the ability to perform a wide variety of CPAs and have the capability to broaden the surface area of attack by considering alternative SG components. Through network, gas pipeline and power system simulations, we showed that attackers can cause partial or total system shutdown by performing manipulation of power generation and load requirements and causing the frequency to cross over or under protection thresholds. Such attacks are not contained to one area, but propagate to neighboring regions causing cascading failures through overloading and tripping.
The results of the study show that SGR is reduced when functions and components are compromised. Metrics such as TTC, PDR, percentage of SMs compromised and how they are compromised should be considered while developing complex systems. Furthermore, it is important for system engineers to evaluate the SGR by considering multiple functions and components together into an SG risk analysis. The analysis of attack scenarios on the SG infrastructure helps engineers develop robust and resilient systems, improve situational awareness, and improve the response of the system to ongoing attacks. Instead of using generators to increase or reduce generation, one option is to use DR as a spinning reserve. It is important to maintain at least minimal state awareness of the system so that appropriate actions are taken
before TTC. Our future work will extend this analysis by simulating attacks on the SG system considering the interdependence of the power and gas storage systems.
ACKNOWLEDGMENT This work was conducted with partial funding by Northrop
Grumman Information Systems through the Cyber Security Research Consortium.
REFERENCES [1] Wadhawan, Y., & Neuman, C. (2016, October). Evaluating Resilience
of Gas Pipeline Systems under Cyber-Physical Attacks: A Function-Based Methodology. In Proceedings of the 2nd ACM Workshop on Cyber-Physical Systems Security and Privacy (pp. 71-80). ACM.
[2] Wadhawan, Y., Neuman, C & AlMajali, A. (2017, April). Analyzing Cyber Physical Attacks on Smart Grid System. In Proceedings of the 2017 Workshop on Modeling and Simulation of Cyber-Physical Energy Systems. IEEE.
[3] Pan, K., Teixeira, A. M., Cvetkovic, M., & Palensky, P. (2016, November). Combined data integrity and availability attacks on state estimation in cyber-physical power grids. In Smart Grid Communications (SmartGridComm), 2016 IEEE International Conference on (pp. 271-277). IEEE.
[4] Neuman, C., and Tan, K., Mediating cyber and physical threat propagation in secure smart grid architectures. InSmart Grid Communications (SmartGridComm), IEEE International Conference on (pp. 238-243). (2011).
[5] Srikantha, Pirathayini, and Deepa Kundur, "A DER Attack-Mitigation Differential Game for Smart Grid Security Analysis."IEEE Transactions on Smart Grid 7, no. 3 (2016): 1476-1485.
[6] AlMajali, A., Rice, E., Viswanathan, A., Tan, K., & Neuman, C, A systems approach to analysing cyber-physical threats in the Smart Grid. In 2013 IEEE International Conference on Smart Grid Communications.
[7] AlMajali, A., & Dweik, W. (2016, December). Modeling worm propagation in the advanced metering infrastructure. In Electronic Devices, Systems and Applications (ICEDSA), 2016 5th International Conference on (pp. 1-4). IEEE.
[8] Wu, Baichao, Aiping Tang, and Jie Wu, "Modeling cascading failures in interdependent infrastructures under terrorist attacks." Reliability Engineering & System Safety 147 (2016): 1-8.
[9] Erdener, Burcin Cakir, Kwabena A. Pambour, Ricardo Bolado Lavin, and Berna Dengiz, "An integrated simulation model for analysing electricity and gas systems." International Journal of Electrical Power & Energy Systems 61 (2014): 410-420.
[10] Manshadi, Saeed D., and Mohammad E. Khodayar. "Resilient operation of multiple energy carrier microgrids." IEEE Transactions on Smart Grid 6, no. 5 (2015): 2283-2292.

[11] Chen, T. M., & Abu-Nimeh, S. (2011). "Lessons from stuxnet." Computer, 44(4), 91-93.
[12] Generic Solar Photovoltaic System Dynamic Simulation Model Specification. https://www.powerworld.com/files/WECC-Solar-PV- Dynamic-Model-Specification-September-2012.pdf.
[13] Tripwire Study: Cyber Attackers Successfully Targeting Oil and Gas Industry, (2016) http://www.tripwire.com/company/news/press- release/tripwire-study-cyber-attackers-successfully-targeting- oil-and- gas-industry/.
[14] Analysis of the Cyber Attack on the Ukrainian Power Grid, March2016. http://www.nerc.com/pa/CI/ESISAC/Documents/E- ISAC_SANS_Ukraine_DUC_18Mar2016.pdf.
[15] Solar Energy Grid Integration System (SEGIS) 2007. https://www1.eere.energy.gov/solar/pdfs/segis_concept_paper.pdf.
[16] Pipeline Pressure Limits. http://www.hse.gov.uk/pipelines/resources/pipelinepressure.htm.
[17] Analysis of the Cyber Attack on the Ukrainian Power Grid, March 2016. http://www.nerc.com/pa/CI/ESISAC/Documents/E- ISAC_SANS_Ukraine_DUC_18Mar2016.pdf.
[18] C. Perkins, E. Belding-Royer, and S. Das, “Ad hoc on-demand distance vector (aodv) routing,” Tech. Rep., 2003.
[19] Panteli, M., Mancarella, P., Trakas, D., Kyriakides, E., & Hatziargyriou, N. (2017). Metrics and Quantification of Operational and Infrastructure Resilience in Power Systems. IEEE Transactions on Power Systems.
[20] Communications Module for Electricity Meters. (2013) http://www.silverspringnet.com/pdfs/SilverSpring-Datasheet-Communications-Modules.pdf.
[21] Radio Propagation Model used in Ns-2 http://kom.aau.dk/group/05gr1120/ref/Channel.pdf.
[22] Ryutov, T., AlMajali, A., & Neuman, C. (2015, April). Modeling security policies for mitigating the risk of load altering attacks on smart grid systems. In Modeling and Simulation of Cyber-Physical Energy Systems (MSCPES), 2015 Workshop on (pp. 1-6). IEEE.
[23] AlMajali, A., Viswanathan, A., & Neuman, C. (2016). Resilience Evaluation of Demand Response as Spinning Reserve under Cyber-Physical Threats. Electronics, 6(1), 2.
[24] The Map That Shows Why a Pipeline Explosion in Turkey Matters to the U.S. http://www.bloomberg.com/news/2014- 12-10/the-map-that-shows-why-a-pipeline-explosion-inturkey- matters-to-the-u-s-.html.


![Tutorial Powerworld Ingles[1]](https://img.pdfslide.us/doc/110x75/55721341497959fc0b91ef24/tutorial-powerworld-ingles1.jpg)