Embed Size (px)
Citation preview
A System for Video Surveillance and Monitoring�
Robert T. Collins, Alan J. Lipton and Takeo KanadeRobotics Institute, Carnegie Mellon University, Pittsburgh, PA
E-MAIL : frcollins,ajl,[email protected] PHONE:412-268-1450HOMEPAGE: http://www.cs.cmu.edu/�vsam
AbstractThe Robotics Institute at Carnegie Mellon University (CMU) and the Sarnoff Corporation are developing a systemfor autonomous Video Surveillance and Monitoring. The technical objective is to use multiple, cooperative videosensors to provide continuous coverage of people and vehicles in cluttered environments. This paper presents anoverview of the system and significant results achieved to date.
1 Introduction
The DARPA Image Understanding (IU) program is funding basic research in the area of Video Surveillance andMonitoring (VSAM) to provide battlefield awareness. The thrust of CMU’s VSAM research is to develop auto-mated video understanding algorithms that allow a network of active video sensors to automatically monitor objectsand events within a complex, urban environment. We have developed video understanding technology that can au-tomatically detect and track multiple people and vehicles within cluttered scenes, and to monitor their activities overlong periods of time. Human and vehicle targets are seamlessly tracked through the environment using a networkof active sensors to cooperatively track targets over areas that cannot be viewed continuously by a single sensoralone. Each sensor transmits symbolic events and representative imagery back to a central operator control station,which provides a visual summary of activities detected over a broad area. The user interacts with the system usingan intuitive map-based interface. For example, the user can specify that objects entering a region of interest shouldtrigger an alert, relieving the burden of continually watching that area. The system automatically allocates sensorsto optimize system performance while fulfilling user commands.
Although developed within a context of providing battlefield awareness, we believe this technology has great poten-tial for applications in remote monitoring of nuclear facilities. Sample tasks that could be automated are verificationthat routine maintainance activities are being performed according to schedule, logging and tracking visitors andpersonnel as they enter and move through the site, and providing security against unauthorized intrusion. Otherapplications in military and law enforcement scenarios include providing perimeter security for troops, monitoringpeace treaties or refugee movements using unmanned air vehicles, providing security for embassies or airports, andstaking out suspected drug or terrorist hide-outs by collecting time-stamped pictures of everyone entering and exitingthe building.
The following sections present an overview of video surveillance algorithms developed at CMU over the last twoyears (Section 2) and their incorporation into a prototype system for remote surveillance and monitoring (Section 3).
�This work is funded by the DARPA IU program under VSAM contract number DAAB07-97-C-J031.
– 1 – Collins-1
2 Video Understanding Technologies
Keeping track of people, vehicles, and their interactions in a complex environment is a difficult task. The role ofVSAM video understanding technology in achieving this goal is to automatically “parse” people and vehicles fromraw video, determine their geolocations, and automatically insert them into a dynamic scene visualization. We havedeveloped robust routines for detecting moving objects (Section 2.1) and tracking them through a video sequence(Section 2.2) using a combination of temporal differencing and template tracking. Detected objects are classifiedinto semantic categories such as human, human group, car, and truck using shape and color analysis, and these labelsare used to improve tracking using temporal consistency constraints (Section 2.3). Further classification of humanactivity, such as walking and running, has also been achieved (Section 2.4). Geolocations of labeled entities aredetermined from their image coordinates using either wide-baseline stereo from two or more overlapping cameraviews, or intersection of viewing rays with a terrain model from monocular views (Section 2.5). The computedgeolocations are used to provide higher-level tracking capabilities, such as tasking multiple sensors with variablepan, tilt and zoom to cooperatively track an object through the scene (Section 2.6).
2.1 Moving Target Detection
The initial stage of the surveillance problem is the extraction of moving targets from a video stream. There are threeconventional approaches to automated moving target detection: temporal differencing (two-frame or three-frame)[Andersonet al., 1985]; background subtraction[Haritaogluet al., 1998, Wrenet al., 1997]; and optical flow (see[Barronet al., 1994] for an excellent discussion). Temporal differencing is very adaptive to dynamic environments,but generally does a poor job of extracting all relevant feature pixels. Background subtraction provides the mostcomplete feature data, but is extremely sensitive to dynamic scene changes due to lighting and extraneous events.Optical flow can be used to detect independently moving targets in the presence of camera motion; however, mostoptical flow computation methods are very complex and are inapplicable to real-time algorithms without specializedhardware.
The approach presented here is similar to that taken in[Grimson and Viola, 1997], and is an attempt to makebackground subtraction more robust to environmental dynamism. The key idea is to maintain an evolving statisticalmodel of the background to provide a mechanism that adapts to slow changes in the environment. For each pixelvalue pn in the nth frame, a running averagepn and a form of standard deviationσpn are maintained by temporalfiltering, implemented as:
pn+1 = αpn+1+(1�α)pnσn+1 = αjpn+1� pn+1j+(1�α)σn
(1)
whereα = τ� f , f is the frame rate andτ is a time constant specifying how fast (responsive) the backgroundmodel should be to intensity changes. the influence of old observations decays exponentially over time, and thus thebackground gradually adapts to reflect current environmental conditions.
If a pixel has a value which is more than 2σ from pn, then it is considered a foreground pixel. At this point a multiplehypothesis approach is used for determining its behavior. A new set of statistics(p0;σ0) is initialized for this pixeland the original set is remembered. If, after timet = 3τ, the pixel value has not returned to its original statisticalvalue, the new statistics are chosen as replacements for the old.
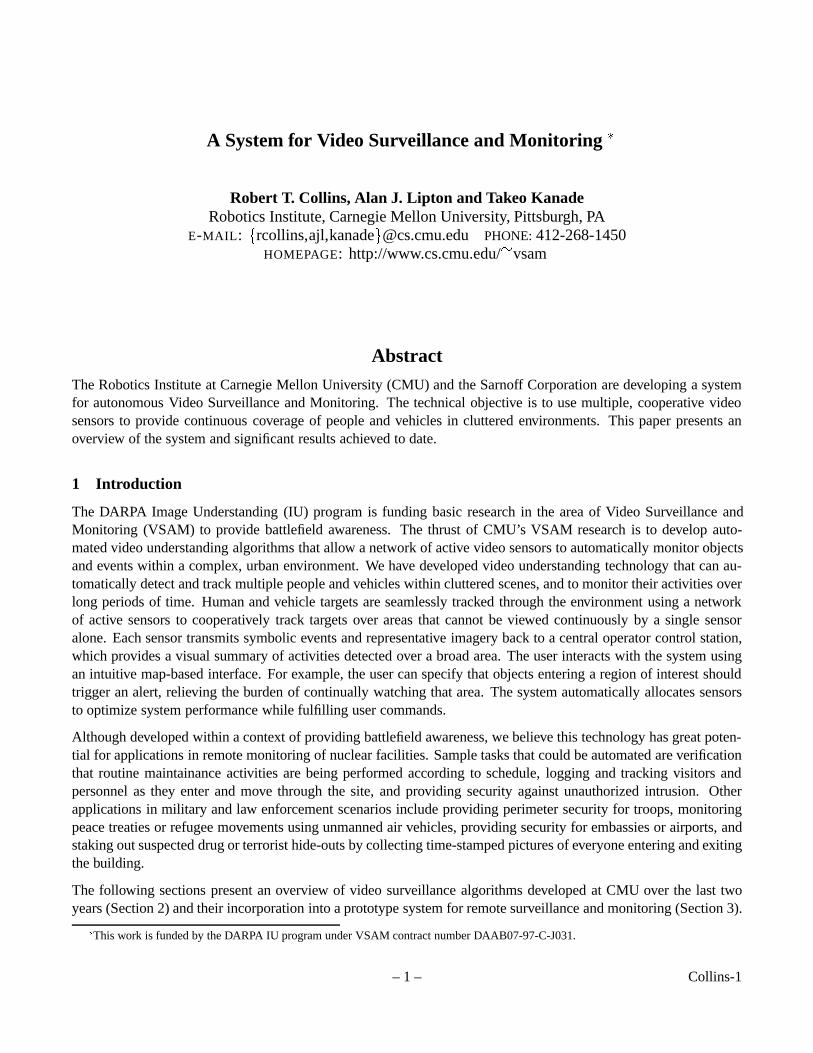
Foreground (moving) pixels are aggregated using a connected component approach so that individual target “blobs”can be extracted. Transient moving objects cause short term changes to the image stream that are not included in thebackground model, but are continually tracked, whereas more permanent changes are (after a time increment of 3τhas elapsed) absorbed into the background (see Figure 1).
The moving target detection algorithm described above is prone to three types of error: incomplete extraction of
– 2 – Collins-1
(A) (B)
Figure 1: Example of moving target detection by dynamic background subtraction.
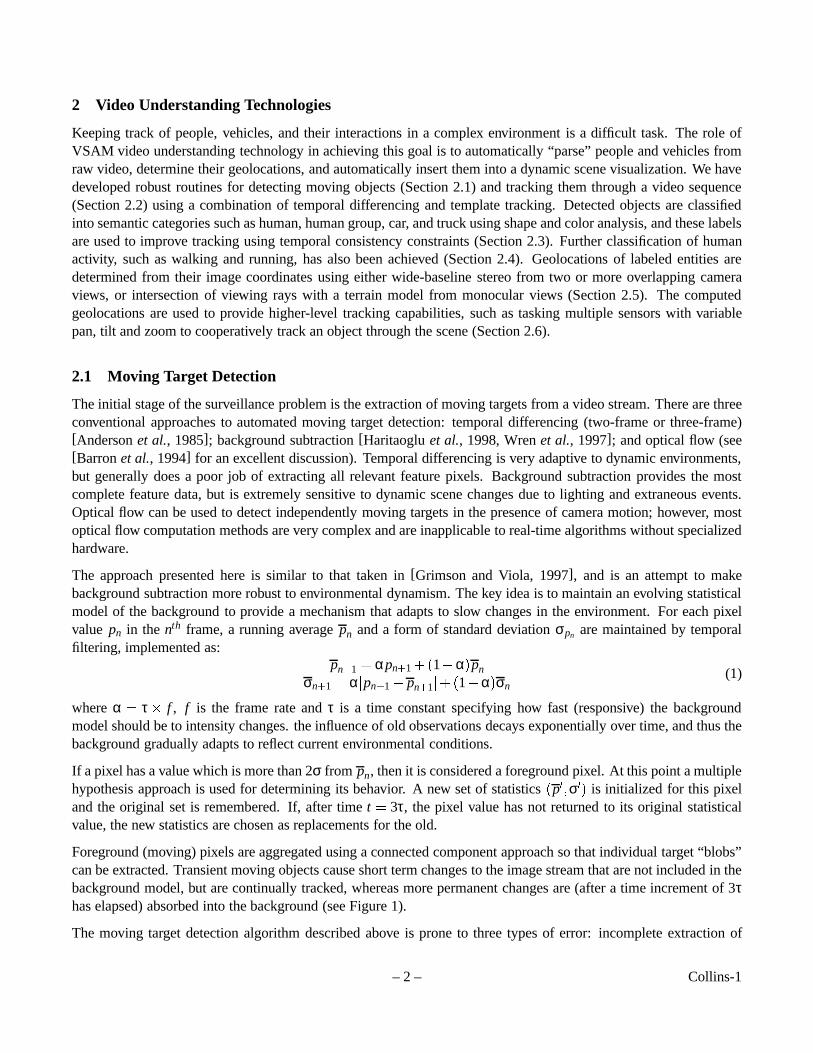
Figure 2: Target pre-processing. A moving target region is morphologically dilated (twice), eroded and then itsborder is extracted.
a moving object; erroneous extraction of non-moving pixels; and legitimate extraction of illegitimate targets (suchas trees blowing in the wind). Incomplete targets are partially reconstructed by blob clustering and morphologicaldilation (Figure 2). Erroneously extracted “noise” is removed using a size filter whereby blobs below a certaincritical size are ignored. Illegitimate targets must be removed by other means such as temporal consistency anddomain knowledge. This is the purview of the target tracking algorithm.
2.2 Target Tracking
To begin to build a temporal model of activity, individual objects must be tracked over time. The first step in thisprocess is to take the blobs generated by motion detection and match them between frames of a video sequence.
Many systems for target tracking are based on Kalman filters. However, as Isard and Blake point out, these areof limited use because they are based on unimodal Gaussian densities that cannot support simultaneous alternativemotion hypotheses[Isard and Blake, 1996]. Isard and Blake present a new stochastic algorithm called CONDEN-SATION that does handle alternative hypotheses. Work on the problem of multiple data association in radar trackingcontexts is also relevant[Bar-Shalom and Fortmann, 1988].
We employ a much simpler approach based on a frame-to-frame matching cost function. A record of each blob iskept with the following information:
� image trajectory (positionp(t) and velocityv(t) as functions of time) of the object centroid,
� blob “appearance” in the form of an image template,
– 3 – Collins-1
� blob sizes in pixels,
� color histogramh of the blob.
The position and velocity of each blobTi is determined from the last time steptlast and used to predict a new imageposition at the current timetnow:
pi(tnow)� pi(tlast)+vi(tlast)� (tnow� tlast) (2)
Using this information a matching cost is determined between a known targetTi and a candidate moving blobRj
C(Ti ;Rj) = f (jpi � pj j; jsi �sj j; jhi �hj j): (3)
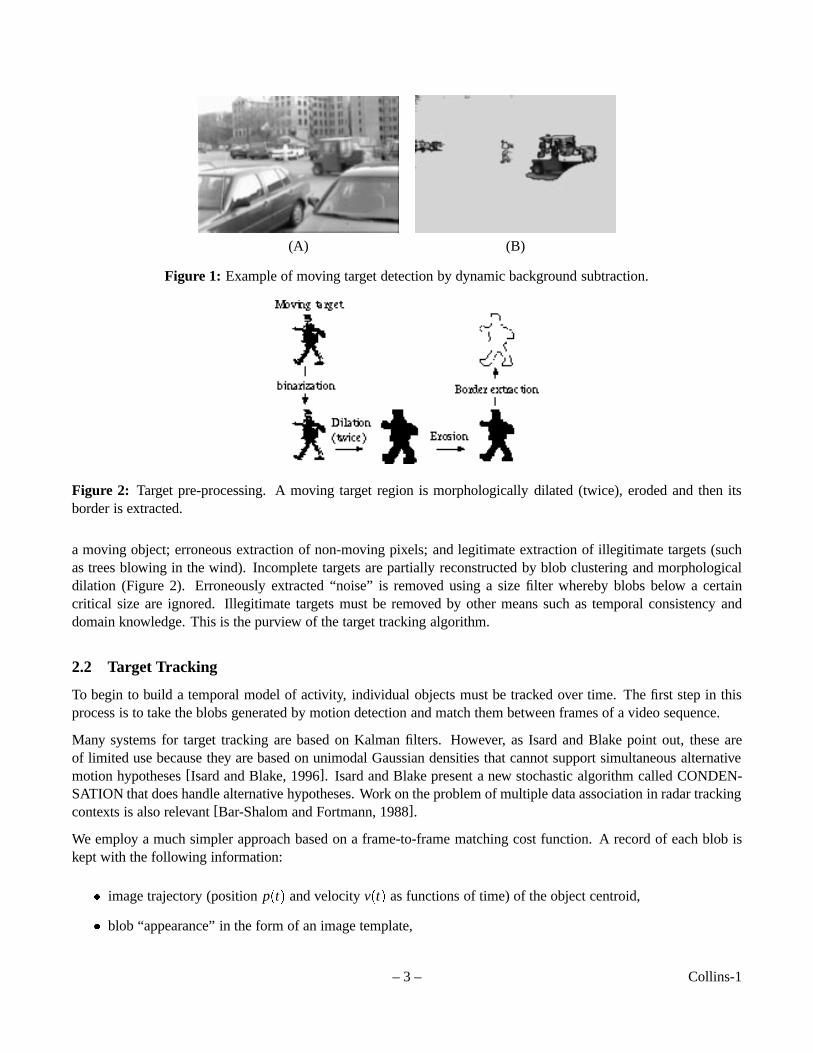
Targets that are “close enough” in cost space are considered to be potential matches. To lend more robustness tochanges in appearance and occlusions, the full tracking algorithm uses a combination of cost and adaptive templatematching, as described in detail in[Lipton et al., 1998]. Recent results from the system are shown in Figure 3.
Figure 3: Recent results of moving entity detection and tracking showing detected objects and trajectories overlaidon original video imagery. Note that tracking persists even when targets are temporarily occluded or motionless.
2.3 Target Classification
The ultimate goal of the VSAM effort is to be able to identify individual entities (such as the “FedEx truck”, the“4:15pm bus to Oakland” and “Fred Smith”) and determine what they are doing. As a first step, entities are classifiedinto specific class groupings such as “humans” and “vehicles”.
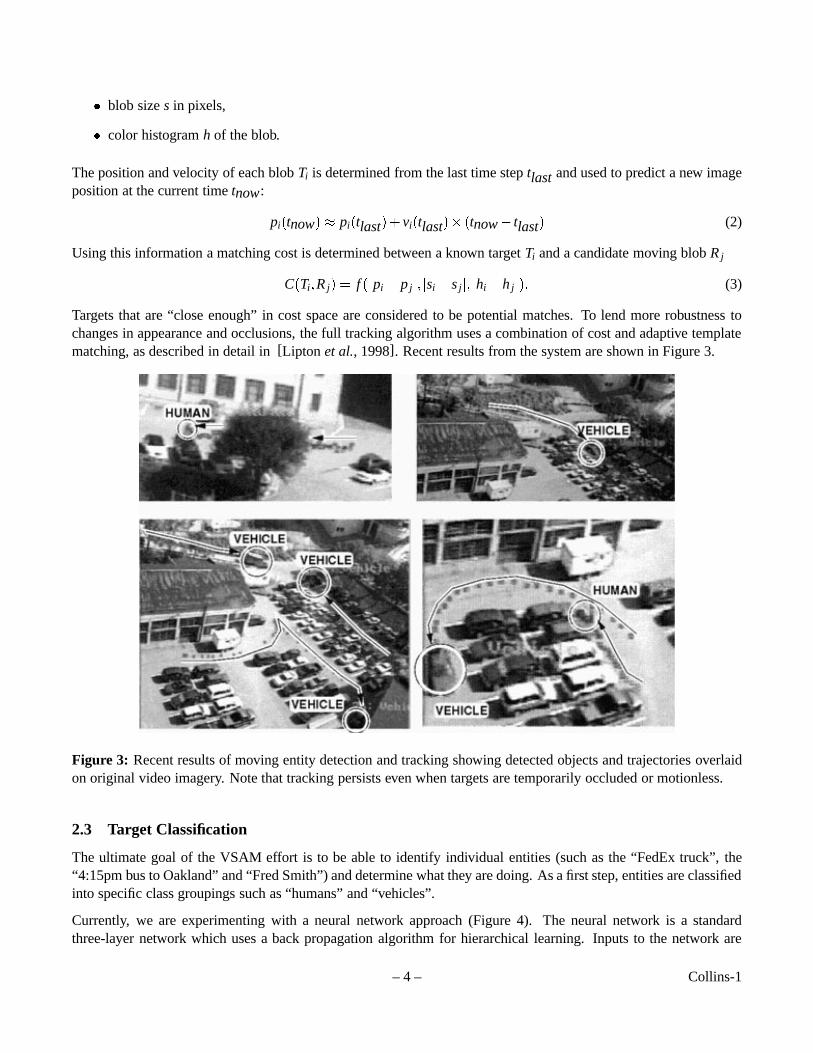
Currently, we are experimenting with a neural network approach (Figure 4). The neural network is a standardthree-layer network which uses a back propagation algorithm for hierarchical learning. Inputs to the network are
– 4 – Collins-1
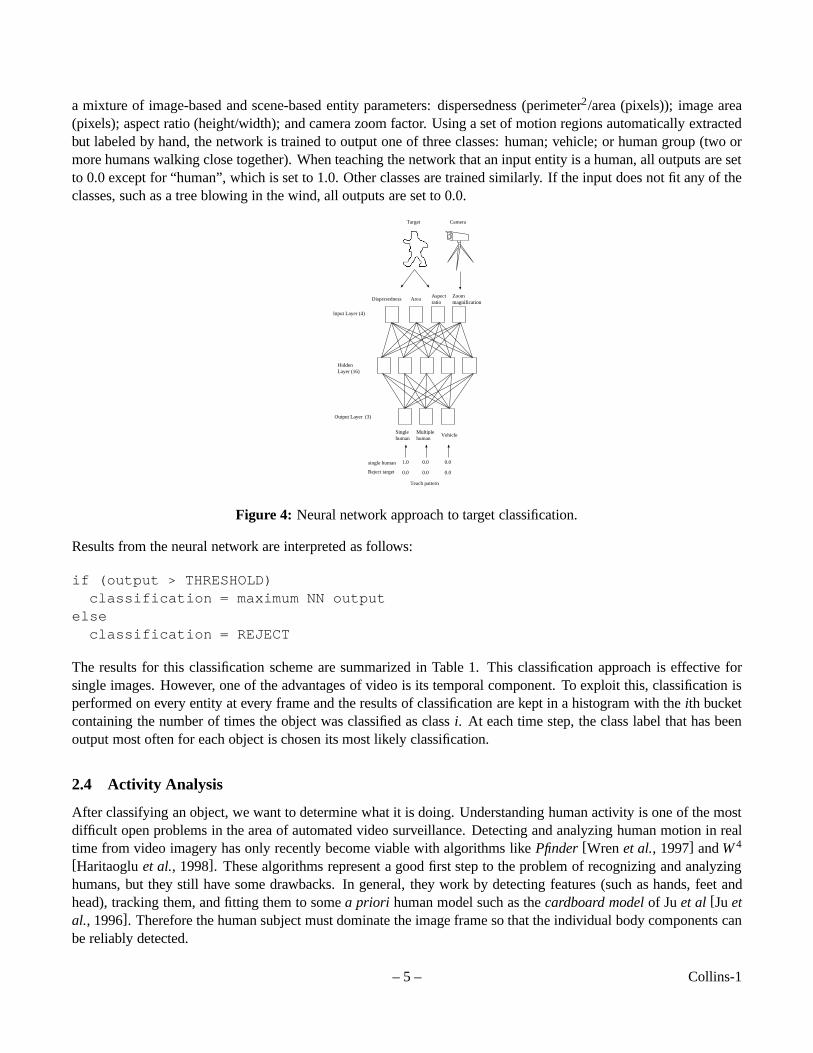
a mixture of image-based and scene-based entity parameters: dispersedness (perimeter2/area (pixels)); image area(pixels); aspect ratio (height/width); and camera zoom factor. Using a set of motion regions automatically extractedbut labeled by hand, the network is trained to output one of three classes: human; vehicle; or human group (two ormore humans walking close together). When teaching the network that an input entity is a human, all outputs are setto 0.0 except for “human”, which is set to 1.0. Other classes are trained similarly. If the input does not fit any of theclasses, such as a tree blowing in the wind, all outputs are set to 0.0.
Input Layer (4)
HiddenLayer (16)
Output Layer (3)
Teach pattern
AreaDispersedness
VehicleSinglehuman
1.0 0.0
Multiplehuman
0.0
Aspectratio
Reject target
single human
0.0 0.00.0
Zoommagnification
Target Camera
Figure 4: Neural network approach to target classification.
Results from the neural network are interpreted as follows:
if (output > THRESHOLD)classification = maximum NN output
elseclassification = REJECT
The results for this classification scheme are summarized in Table 1. This classification approach is effective forsingle images. However, one of the advantages of video is its temporal component. To exploit this, classification isperformed on every entity at every frame and the results of classification are kept in a histogram with theith bucketcontaining the number of times the object was classified as classi. At each time step, the class label that has beenoutput most often for each object is chosen its most likely classification.
2.4 Activity Analysis
After classifying an object, we want to determine what it is doing. Understanding human activity is one of the mostdifficult open problems in the area of automated video surveillance. Detecting and analyzing human motion in realtime from video imagery has only recently become viable with algorithms likePfinder[Wrenet al., 1997] andW4
[Haritaogluet al., 1998]. These algorithms represent a good first step to the problem of recognizing and analyzinghumans, but they still have some drawbacks. In general, they work by detecting features (such as hands, feet andhead), tracking them, and fitting them to somea priori human model such as thecardboard modelof Juet al [Juetal., 1996]. Therefore the human subject must dominate the image frame so that the individual body components canbe reliably detected.
– 5 – Collins-1
Class Samples % Correctly ClassifiedHuman 430 99.5
Human group 96 88.5Vehicle 508 99.4
False alarms 48 64.5Total 1082 96.9
Table 1: Results for neural network classification algorithm.
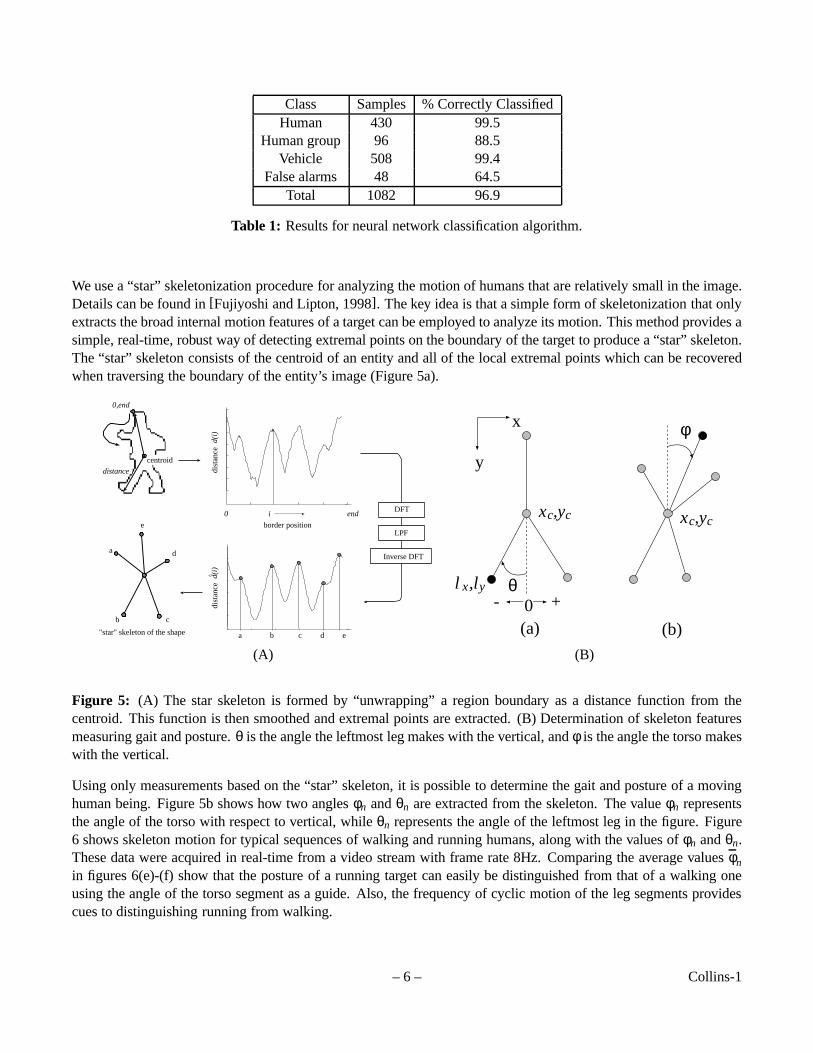
We use a “star” skeletonization procedure for analyzing the motion of humans that are relatively small in the image.Details can be found in[Fujiyoshi and Lipton, 1998]. The key idea is that a simple form of skeletonization that onlyextracts the broad internal motion features of a target can be employed to analyze its motion. This method provides asimple, real-time, robust way of detecting extremal points on the boundary of the target to produce a “star” skeleton.The “star” skeleton consists of the centroid of an entity and all of the local extremal points which can be recoveredwhen traversing the boundary of the entity’s image (Figure 5a).
0,end
distance
border position
dist
ance
dist
ance
iDFT
LPF
Inverse DFT
0 end
a b c d e
a
b c
d
e
"star" skeleton of the shape
d(i)
d(i)
^
centroid
θ- +0
x
y
x ,yc c
l ,lx y
(a) (b)
φ
x ,yc c
(A) (B)
Figure 5: (A) The star skeleton is formed by “unwrapping” a region boundary as a distance function from thecentroid. This function is then smoothed and extremal points are extracted. (B) Determination of skeleton featuresmeasuring gait and posture.θ is the angle the leftmost leg makes with the vertical, andφ is the angle the torso makeswith the vertical.
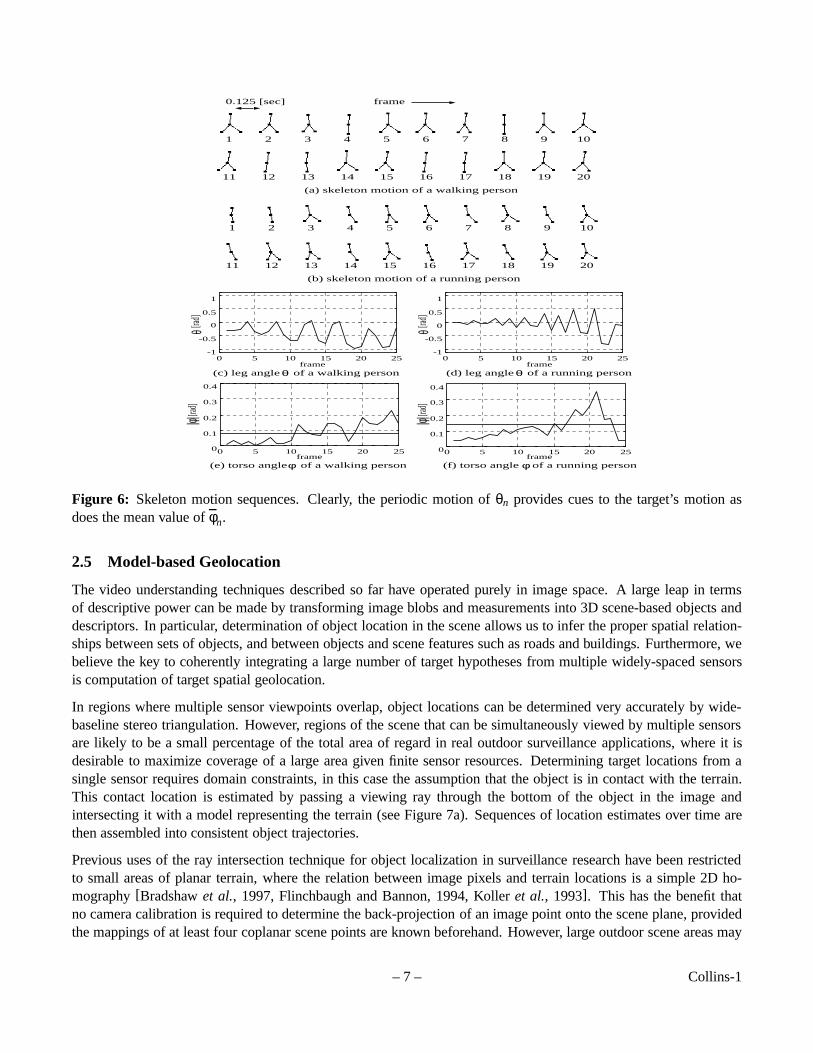
Using only measurements based on the “star” skeleton, it is possible to determine the gait and posture of a movinghuman being. Figure 5b shows how two anglesφn andθn are extracted from the skeleton. The valueφn representsthe angle of the torso with respect to vertical, whileθn represents the angle of the leftmost leg in the figure. Figure6 shows skeleton motion for typical sequences of walking and running humans, along with the values ofφn andθn.These data were acquired in real-time from a video stream with frame rate 8Hz. Comparing the average valuesφnin figures 6(e)-(f) show that the posture of a running target can easily be distinguished from that of a walking oneusing the angle of the torso segment as a guide. Also, the frequency of cyclic motion of the leg segments providescues to distinguishing running from walking.
– 6 – Collins-1
frame
11 12 13 14 15 16 17 18 19 20
0.125 [sec]
(a) skeleton motion of a walking person
1 2 3 4 5 6 7 8 9 10
(b) skeleton motion of a running person
11 12 13 14 15 16 17 18 19 20
1 2 3 4 5 6 7 8 9 10
frame
[rad]
frame
-1
-0.5
0
0.5
1
0 5 10 15 20 25-1
-0.5
0
0.5
1
0 5 10 15 20 25
θ[rad]
θ
(d) leg angle of a running personθ(c) leg angle of a walking personθ
0
0.1
0.2
0.3
0.4
0 5 10 15 20 250
0.1
0.2
0.3
0.4
0 5 10 15 20 25frameframe
[rad]
|φ|[rad]
|φ|
(f) torso angle of a running personφ(e) torso angle of a walking personφ
Figure 6: Skeleton motion sequences. Clearly, the periodic motion ofθn provides cues to the target’s motion asdoes the mean value ofφn.
2.5 Model-based Geolocation
The video understanding techniques described so far have operated purely in image space. A large leap in termsof descriptive power can be made by transforming image blobs and measurements into 3D scene-based objects anddescriptors. In particular, determination of object location in the scene allows us to infer the proper spatial relation-ships between sets of objects, and between objects and scene features such as roads and buildings. Furthermore, webelieve the key to coherently integrating a large number of target hypotheses from multiple widely-spaced sensorsis computation of target spatial geolocation.
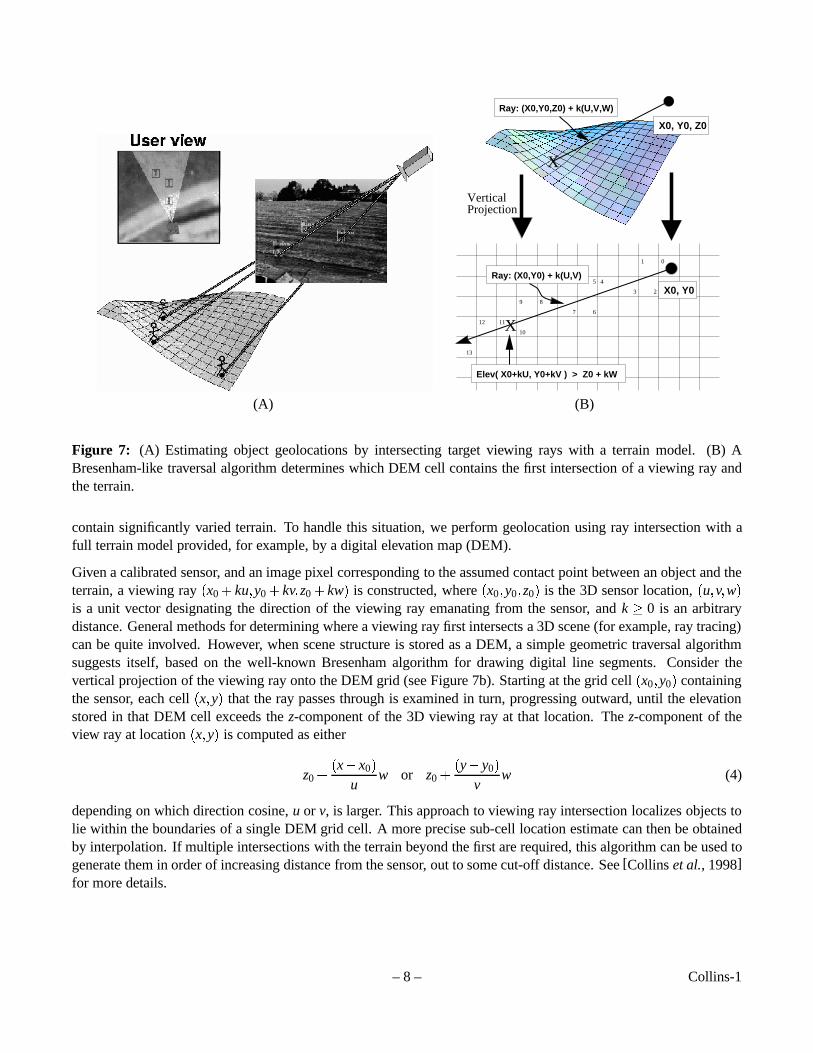
In regions where multiple sensor viewpoints overlap, object locations can be determined very accurately by wide-baseline stereo triangulation. However, regions of the scene that can be simultaneously viewed by multiple sensorsare likely to be a small percentage of the total area of regard in real outdoor surveillance applications, where it isdesirable to maximize coverage of a large area given finite sensor resources. Determining target locations from asingle sensor requires domain constraints, in this case the assumption that the object is in contact with the terrain.This contact location is estimated by passing a viewing ray through the bottom of the object in the image andintersecting it with a model representing the terrain (see Figure 7a). Sequences of location estimates over time arethen assembled into consistent object trajectories.
Previous uses of the ray intersection technique for object localization in surveillance research have been restrictedto small areas of planar terrain, where the relation between image pixels and terrain locations is a simple 2D ho-mography[Bradshawet al., 1997, Flinchbaugh and Bannon, 1994, Kolleret al., 1993]. This has the benefit thatno camera calibration is required to determine the back-projection of an image point onto the scene plane, providedthe mappings of at least four coplanar scene points are known beforehand. However, large outdoor scene areas may
– 7 – Collins-1
Elev( X0+kU, Y0+kV ) > Z0 + kW
11
X0, Y0, Z0
X
01
2
10
8
7
4
6
9
3
5
12
13
Projection
X0, Y0
Ray: (X0,Y0) + k(U,V)
Ray: (X0,Y0,Z0) + k(U,V,W)
Vertical
X
(A) (B)
Figure 7: (A) Estimating object geolocations by intersecting target viewing rays with a terrain model. (B) ABresenham-like traversal algorithm determines which DEM cell contains the first intersection of a viewing ray andthe terrain.
contain significantly varied terrain. To handle this situation, we perform geolocation using ray intersection with afull terrain model provided, for example, by a digital elevation map (DEM).
Given a calibrated sensor, and an image pixel corresponding to the assumed contact point between an object and theterrain, a viewing ray(x0+ ku;y0+ kv;z0+ kw) is constructed, where(x0;y0;z0) is the 3D sensor location,(u;v;w)is a unit vector designating the direction of the viewing ray emanating from the sensor, andk� 0 is an arbitrarydistance. General methods for determining where a viewing ray first intersects a 3D scene (for example, ray tracing)can be quite involved. However, when scene structure is stored as a DEM, a simple geometric traversal algorithmsuggests itself, based on the well-known Bresenham algorithm for drawing digital line segments. Consider thevertical projection of the viewing ray onto the DEM grid (see Figure 7b). Starting at the grid cell(x0;y0) containingthe sensor, each cell(x;y) that the ray passes through is examined in turn, progressing outward, until the elevationstored in that DEM cell exceeds thez-component of the 3D viewing ray at that location. Thez-component of theview ray at location(x;y) is computed as either
z0+(x�x0)
uw or z0+
(y�y0)
vw (4)
depending on which direction cosine,u or v, is larger. This approach to viewing ray intersection localizes objects tolie within the boundaries of a single DEM grid cell. A more precise sub-cell location estimate can then be obtainedby interpolation. If multiple intersections with the terrain beyond the first are required, this algorithm can be used togenerate them in order of increasing distance from the sensor, out to some cut-off distance. See[Collinset al., 1998]for more details.
– 8 – Collins-1
2.6 Multi-Sensor Cooperation
In most complex outdoor scenes, it is impossible for a single sensor to maintain its view of an object for long periodsof time. Objects become occluded by environmental features such as trees and buildings, and sensors have limitedeffective fields of regard. A promising solution to this problem is to use a network of video sensors to cooperativelytrack an object through the scene. Tracked objects are thenhanded-offbetween cameras to greatly extend the totaleffective area of surveillance coverage.
There has been little work done on autonomously coordinating multiple active video sensors to cooperatively tracka moving target. One approach is presented by Matsuyama for a controlled indoor environment where four cameraslock onto onto a particular object moving across the floor[Matsuyama, 1998]. We approach the problem moregenerally by using the object’s 3D geolocation as computed in the last section to determine where each sensorshould look. The pan, tilt and zoom of the closest sensors are then controlled to bring the object within their fieldsof view, while a viewpoint independent cost function is used to determine which of the moving objects they find arethe specific target of interest. These steps are described below.
Assume that at timet0 a sensor with pan, tilt value(θ0;φ0) has been tasked to track a particular object with 3D groundlocationX0 and velocityX. Given a functionG(X) that converts a ground coordinate to a pan, tilt point (determinedby camera calibration), the object’s locationX0 is converted to a desired sensor pan, tilt value(θd;φd) =G(X0). Thebehavior of the pan, tilt unit is approximated by a linear system with infinite acceleration and maximum velocity(�θ;�φ) as
θ(t) = θ0� θ(t� t0)φ(t) = φ0� φ(t� t0)
(5)
Substituting the desired sensor pan, tilt(θd;φd) into the lefthand side of this equation and solving for(t� t0) yieldsa prediction of the acquisition time, that is, how long it would take for the pan, tilt device to point at the object’scurrent location. However, the object will have moved further along its trajectory by that time. This new objectposition is estimated as
X(t) = X0+ X(t� t0) (6)
This predicted object position is then converted into a new desired sensor pan, tilt, and the whole procedure iteratesuntil the time increments(t � t0) become small (convergence) or start to increase (divergence). This algorithmguarantees that if it converges, the sensor will be able to reacquire the object.
An appropriate camera zoom setting can be determined directly given a desired size of the object’s projection in theimage. Knowing the classification of the objectC (as determined from Section 2.3), we employ the heuristic thathumans are approximately 6 (2m) feet tall and vehicles are approximately 15 feet (5m) long to set the zoom. Giventhe position of the object and the sensor and, therefore the ranger to the object, the angleρ subtended by the imageof the object is approximately
ρ =�
tan�1 2r ; human
tan�1 5r ; vehicle
Knowing the focal length of the sensor as a function of zoom, as determined from camera calibration, the appropriatezoom setting is easily chosen.
Once the sensor is pointing in the right direction at the right zoom factor, all moving targets extracted are compared tothe specific target of interest to see if they match. This need to re-acquire a specific target is a key feature necessaryfor multi-camera cooperative surveillance. Obviously viewpoint-specific appearance criteria are not useful, sincethe new view of the target may be significantly different from the previous view. Therefore, recognition features areneeded that are independent of viewpoint. In our work we use two such criteria: the object’s 3D scene trajectoryas determined from geolocation, and a normalized color histogram of the object’s image region. Candidate motionregions are tested by applying a matching cost function in a manner similar to that described in Section 2.2.
– 9 – Collins-1
3 A VSAM Testbed System
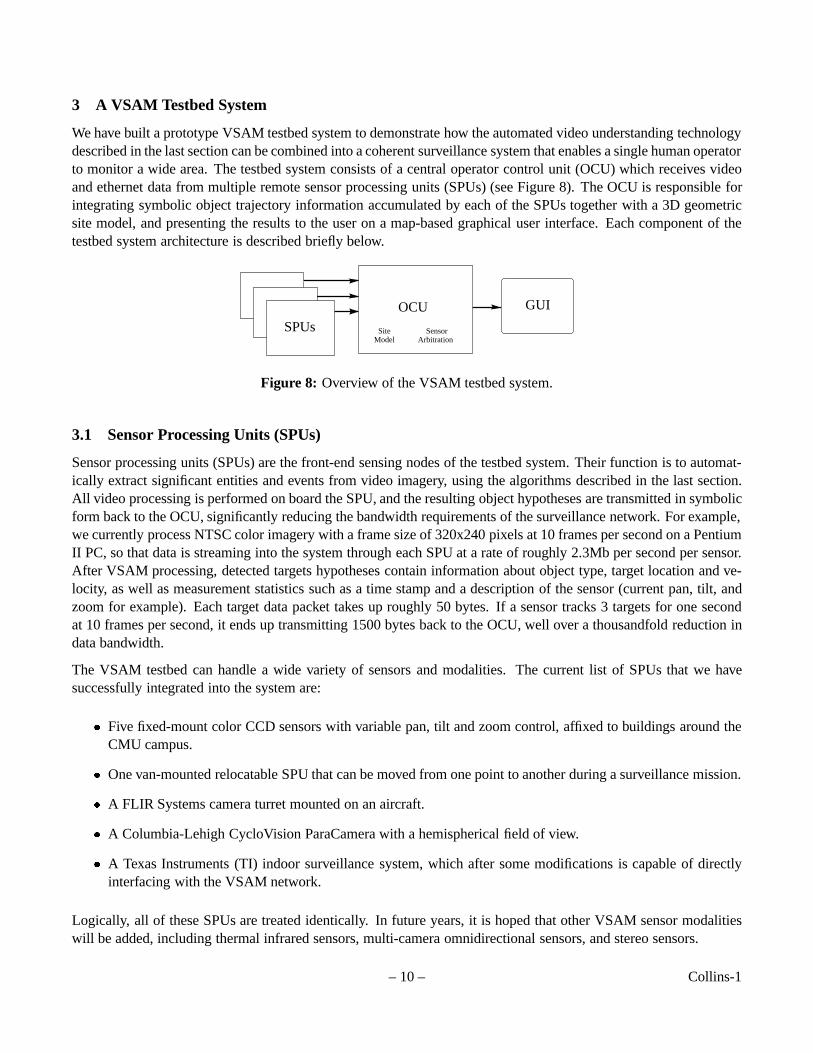
We have built a prototype VSAM testbed system to demonstrate how the automated video understanding technologydescribed in the last section can be combined into a coherent surveillance system that enables a single human operatorto monitor a wide area. The testbed system consists of a central operator control unit (OCU) which receives videoand ethernet data from multiple remote sensor processing units (SPUs) (see Figure 8). The OCU is responsible forintegrating symbolic object trajectory information accumulated by each of the SPUs together with a 3D geometricsite model, and presenting the results to the user on a map-based graphical user interface. Each component of thetestbed system architecture is described briefly below.
SiteModel
Sensor
OCU
ArbitrationSPUs
GUI
Figure 8: Overview of the VSAM testbed system.
3.1 Sensor Processing Units (SPUs)
Sensor processing units (SPUs) are the front-end sensing nodes of the testbed system. Their function is to automat-ically extract significant entities and events from video imagery, using the algorithms described in the last section.All video processing is performed on board the SPU, and the resulting object hypotheses are transmitted in symbolicform back to the OCU, significantly reducing the bandwidth requirements of the surveillance network. For example,we currently process NTSC color imagery with a frame size of 320x240 pixels at 10 frames per second on a PentiumII PC, so that data is streaming into the system through each SPU at a rate of roughly 2.3Mb per second per sensor.After VSAM processing, detected targets hypotheses contain information about object type, target location and ve-locity, as well as measurement statistics such as a time stamp and a description of the sensor (current pan, tilt, andzoom for example). Each target data packet takes up roughly 50 bytes. If a sensor tracks 3 targets for one secondat 10 frames per second, it ends up transmitting 1500 bytes back to the OCU, well over a thousandfold reduction indata bandwidth.
The VSAM testbed can handle a wide variety of sensors and modalities. The current list of SPUs that we havesuccessfully integrated into the system are:
� Five fixed-mount color CCD sensors with variable pan, tilt and zoom control, affixed to buildings around theCMU campus.
� One van-mounted relocatable SPU that can be moved from one point to another during a surveillance mission.
� A FLIR Systems camera turret mounted on an aircraft.
� A Columbia-Lehigh CycloVision ParaCamera with a hemispherical field of view.
� A Texas Instruments (TI) indoor surveillance system, which after some modifications is capable of directlyinterfacing with the VSAM network.
Logically, all of these SPUs are treated identically. In future years, it is hoped that other VSAM sensor modalitieswill be added, including thermal infrared sensors, multi-camera omnidirectional sensors, and stereo sensors.
– 10 – Collins-1
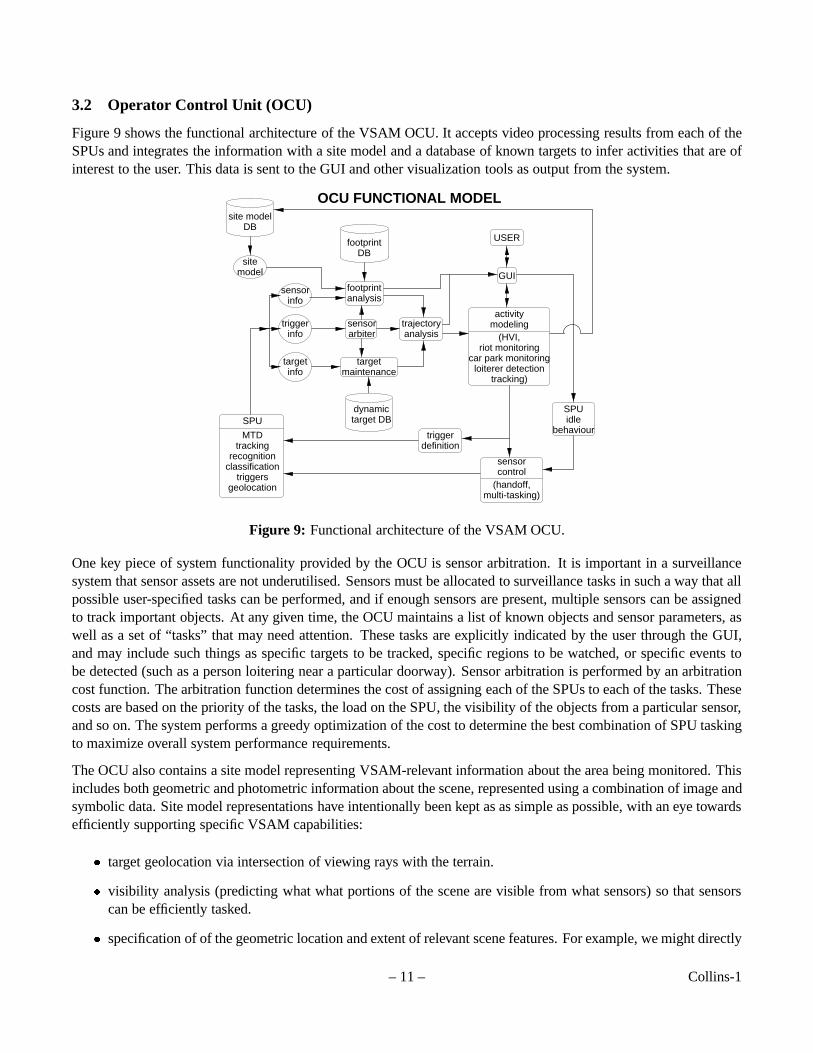
3.2 Operator Control Unit (OCU)
Figure 9 shows the functional architecture of the VSAM OCU. It accepts video processing results from each of theSPUs and integrates the information with a site model and a database of known targets to infer activities that are ofinterest to the user. This data is sent to the GUI and other visualization tools as output from the system.
info
sitemodel
info arbitersensortrigger
OCU FUNCTIONAL MODEL
SPU
geolocationtriggers
classificationrecognition
trackingMTD behaviour
analysisfootprint
activity
DBfootprint
target DB
site modelDB
target
dynamic
analysistrajectory
maintenance
modeling
multi-tasking)(handoff,controlsensor
target
infosensor
idleSPU
tracking)loiterer detection
car park monitoringriot monitoring
(HVI,
definitiontrigger
USER
GUI
Figure 9: Functional architecture of the VSAM OCU.
One key piece of system functionality provided by the OCU is sensor arbitration. It is important in a surveillancesystem that sensor assets are not underutilised. Sensors must be allocated to surveillance tasks in such a way that allpossible user-specified tasks can be performed, and if enough sensors are present, multiple sensors can be assignedto track important objects. At any given time, the OCU maintains a list of known objects and sensor parameters, aswell as a set of “tasks” that may need attention. These tasks are explicitly indicated by the user through the GUI,and may include such things as specific targets to be tracked, specific regions to be watched, or specific events tobe detected (such as a person loitering near a particular doorway). Sensor arbitration is performed by an arbitrationcost function. The arbitration function determines the cost of assigning each of the SPUs to each of the tasks. Thesecosts are based on the priority of the tasks, the load on the SPU, the visibility of the objects from a particular sensor,and so on. The system performs a greedy optimization of the cost to determine the best combination of SPU taskingto maximize overall system performance requirements.
The OCU also contains a site model representing VSAM-relevant information about the area being monitored. Thisincludes both geometric and photometric information about the scene, represented using a combination of image andsymbolic data. Site model representations have intentionally been kept as as simple as possible, with an eye towardsefficiently supporting specific VSAM capabilities:
� target geolocation via intersection of viewing rays with the terrain.
� visibility analysis (predicting what what portions of the scene are visible from what sensors) so that sensorscan be efficiently tasked.
� specification of of the geometric location and extent of relevant scene features. For example, we might directly
– 11 – Collins-1
task a sensor to monitor the door of a building, or to look for vehicles passing through a particular intersection.
3.3 Graphical User Interface
One of the technical goals of the VSAM project is to demonstrate that a single human operator can effectivelymonitor a significant area of interest. Keeping track of multiple people, vehicles, and their interactions, within acomplex urban environment is a difficult task. The user obviously shouldn’t be looking at two dozen screens showingraw video output – that amount of sensory overload virtually guarantees that information will be ignored and wouldrequire a prohibitive amount of transmission bandwidth. Our approach is to provide an interactive, graphical userinterface (GUI) that uses VSAM technology to automatically place dynamic agents representing people and vehiclesinto a synthetic view of the environment. This approach has the benefit that visualization of scene events is no longertied to the original resolution and viewpoint of a single video sensor. The GUI currently consists of a map of thearea, with all target and sensor platform locations overlaid on it.
In addition to scene visualization, the GUI is also used for sensor suite tasking. Through this interface, the operatorcan task individual sensor units, as well as the entire testbed sensor suite, to perform surveillance operations such asgenerating a quick summary of all target activities in the area.
4 VSAM Demonstrations
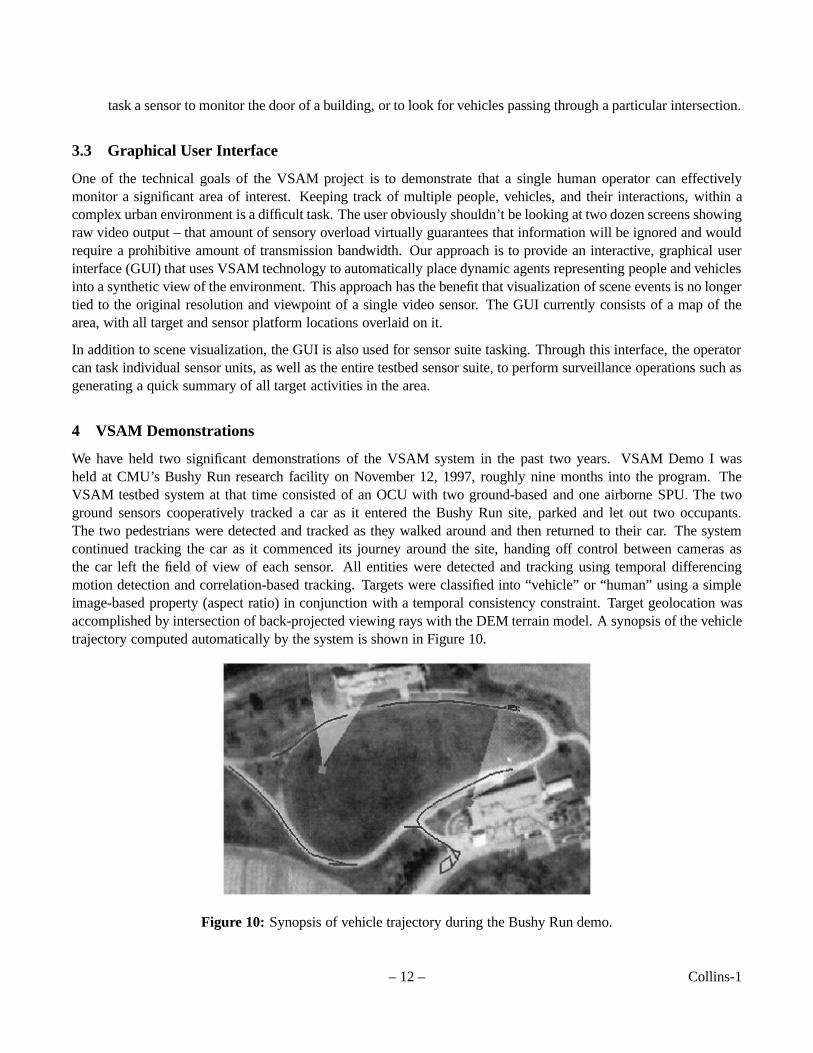
We have held two significant demonstrations of the VSAM system in the past two years. VSAM Demo I washeld at CMU’s Bushy Run research facility on November 12, 1997, roughly nine months into the program. TheVSAM testbed system at that time consisted of an OCU with two ground-based and one airborne SPU. The twoground sensors cooperatively tracked a car as it entered the Bushy Run site, parked and let out two occupants.The two pedestrians were detected and tracked as they walked around and then returned to their car. The systemcontinued tracking the car as it commenced its journey around the site, handing off control between cameras asthe car left the field of view of each sensor. All entities were detected and tracking using temporal differencingmotion detection and correlation-based tracking. Targets were classified into “vehicle” or “human” using a simpleimage-based property (aspect ratio) in conjunction with a temporal consistency constraint. Target geolocation wasaccomplished by intersection of back-projected viewing rays with the DEM terrain model. A synopsis of the vehicletrajectory computed automatically by the system is shown in Figure 10.
Figure 10: Synopsis of vehicle trajectory during the Bushy Run demo.
– 12 – Collins-1
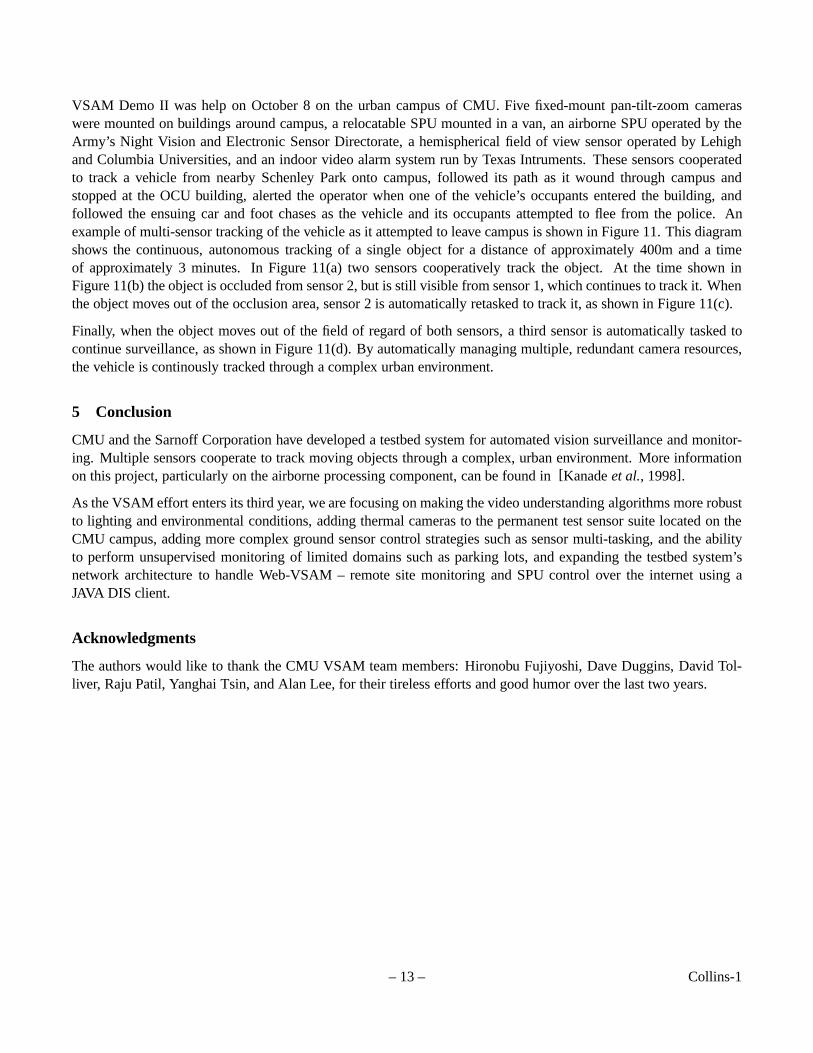
VSAM Demo II was help on October 8 on the urban campus of CMU. Five fixed-mount pan-tilt-zoom cameraswere mounted on buildings around campus, a relocatable SPU mounted in a van, an airborne SPU operated by theArmy’s Night Vision and Electronic Sensor Directorate, a hemispherical field of view sensor operated by Lehighand Columbia Universities, and an indoor video alarm system run by Texas Intruments. These sensors cooperatedto track a vehicle from nearby Schenley Park onto campus, followed its path as it wound through campus andstopped at the OCU building, alerted the operator when one of the vehicle’s occupants entered the building, andfollowed the ensuing car and foot chases as the vehicle and its occupants attempted to flee from the police. Anexample of multi-sensor tracking of the vehicle as it attempted to leave campus is shown in Figure 11. This diagramshows the continuous, autonomous tracking of a single object for a distance of approximately 400m and a timeof approximately 3 minutes. In Figure 11(a) two sensors cooperatively track the object. At the time shown inFigure 11(b) the object is occluded from sensor 2, but is still visible from sensor 1, which continues to track it. Whenthe object moves out of the occlusion area, sensor 2 is automatically retasked to track it, as shown in Figure 11(c).
Finally, when the object moves out of the field of regard of both sensors, a third sensor is automatically tasked tocontinue surveillance, as shown in Figure 11(d). By automatically managing multiple, redundant camera resources,the vehicle is continously tracked through a complex urban environment.
5 Conclusion
CMU and the Sarnoff Corporation have developed a testbed system for automated vision surveillance and monitor-ing. Multiple sensors cooperate to track moving objects through a complex, urban environment. More informationon this project, particularly on the airborne processing component, can be found in[Kanadeet al., 1998].
As the VSAM effort enters its third year, we are focusing on making the video understanding algorithms more robustto lighting and environmental conditions, adding thermal cameras to the permanent test sensor suite located on theCMU campus, adding more complex ground sensor control strategies such as sensor multi-tasking, and the abilityto perform unsupervised monitoring of limited domains such as parking lots, and expanding the testbed system’snetwork architecture to handle Web-VSAM – remote site monitoring and SPU control over the internet using aJAVA DIS client.
Acknowledgments
The authors would like to thank the CMU VSAM team members: Hironobu Fujiyoshi, Dave Duggins, David Tol-liver, Raju Patil, Yanghai Tsin, and Alan Lee, for their tireless efforts and good humor over the last two years.
– 13 – Collins-1
��������
��������
����������
����������
���������������
��������������� Object
Sensor 2
Sensor 1
Sensor 3
(a)
��������
��������
���������������
���������������
����������
����������
ObjectSensor 2
Sensor 1
Sensor 3
(b)
��������
��������
���������������
���������������
����������
����������
Object
Sensor 2
Sensor 1
Sensor 3
(c)
��������
��������
���������������
���������������
����������
����������
Object
Sensor 1
Sensor 2Sensor 3
(d)
Figure 11: Cooperative, multi-sensor tracking (see text for description).
– 14 – Collins-1
References
[Andersonet al., 1985] C. Anderson, Peter Burt, and G. van der Wal. Change detection and tracking using pyramidtransformation techniques. InProceedings of SPIE - Intelligent Robots and Computer Vision, volume 579, pages72–78, 1985.
[Bar-Shalom and Fortmann, 1988] Yaakov Bar-Shalom and Thomas Fortmann.Tacking and data association. Aca-demic Press, Boston, 1988.
[Barronet al., 1994] J. Barron, D. Fleet, and S. Beauchemin. Performance of optical flow techniques.InternationalJournal of Computer Vision, 12(1):42–77, 1994.
[Bradshawet al., 1997] K. Bradshaw, I. Reid, and D. Murray. The active recovery of 3d motion trajectories andtheir use in prediction.PAMI, 19(3):219–234, March 1997.
[Collins et al., 1998] Robert Collins, Yanghai Tsin, J.Ryan Miller, and Alan Lipton.Using a DEM to DetermineGeospatial Object Trajectories. CMU technical report CMU-RI-TR-98-19, 1998.
[Flinchbaugh and Bannon, 1994] B. Flinchbaugh and T. Bannon. Autonomous scene monitoring system. InProc.10th Annual Joint Government-Industry Security Technology Symposium. American Defense Preparedness Asso-ciation, June 1994.
[Fujiyoshi and Lipton, 1998] Hironobu Fujiyoshi and Alan Lipton. Real-time human motion analysis by imageskeletonization. InProceedings of IEEE WACV98, 1998.
[Grimson and Viola, 1997] Eric Grimson and Paul Viola. A forest of sensors. InProceedings of DARP - VSAMworkshop II, November 1997.
[Haritaogluet al., 1998] I. Haritaoglu, Larry S. Davis, and D. Harwood.w4 who? when? where? what? a real timesystem for detecing and tracking people. InFGR98 (submitted), 1998.
[Isard and Blake, 1996] M. Isard and A. Blake. Contour tracking by stochastic propagation of conditional density.In Proceedings of European Conference on Computer Vision 96, pages 343–356, 1996.
[Juet al., 1996] S. Ju, M. Black, and Y. Yacoob. Cardboard people: A parameterized model of articulated imagemotion. InProceedings of International Conference on Face and Gesture Analysis, 1996.
[Kanadeet al., 1998] Takeo Kanade, Robert Collins, Alan Lipton, Peter Burt, and Lambert Wixson. Advances incooperative multi-sensor video surveillance. InProceedings of DARPA Image Understanding Workshop, vol-ume 1, pages 3–24, November 1998.
[Koller et al., 1993] D. Koller, K. Daniilidis, and H. Nagel. Model-based object tracking in monocular image se-quences of road traffic scenes.IJCV, 10(3):257–281, June 1993.
[Lipton et al., 1998] Alan Lipton, Hironobu Fujiyoshi, and Raju S. Patil. Moving target detection and classificationfrom real-time video. InProceedings of IEEE WACV98, 1998.
[Matsuyama, 1998] Takashi Matsuyama. Cooperative distributed vision. InProceedings of DARPA Image Under-standing Workshop, volume 1, pages 365–384, November 1998.
[Wrenet al., 1997] C. Wren, A. Azarbayejani, T. Darrell, and Alex Pentland. Pfinder: Real-time tracking of thehuman body.IEEE Transactions on Pattern Analysis and Machine Intelligence, 19(7):780–785, 1997.
– 15 – Collins-1