Embed Size (px)
Citation preview

A System Dynamics View of Stress: TowardsHuman-Factor Modelling for Computer Agents
Alexis MorrisWilliam Ross
Mihaela Ulieru
Adaptive Risk Management LabThe University of New Brunswick
{alexis.morris, l5i6z, ulieru}@unb.ca
Abstract. Human factor models are important for computer systems toi) make such systems more human aware (ie. better calculations of humanbehavior) and ii) make such systems demonstrate more realistic humanbehaviors (ie. display more human-like AI). Having these capabilities isbeneficial in that they allow for technologies that are better aligned withthe human social context in which the technology ultimately resides.However, human factor calculations are difficult to quantify, validate,and encode because human behavior is both fuzzy and complex. Thispaper applies system dynamics, a modelling technique for understand-ing complex systems, to human factors. It is a way that is computation-ally useful, and may be validated by experts in human studies. We firstmodel stress as a causal loop diagram, and stock/flow diagram for use as“mental models” in computer programs, agent systems, and simulations.
1 Motivation: Enhancing Agent Systems withHuman-Factor Intelligence
“The failure of large complex systems to meet their deadlines, costs, andstakeholder expectations are not, by and large, failures of technology.Rather, these...fail because they do not recognize the social and organiza-tional complexity of the environment in which the systems are deployed.The consequences of this are unstable requirements, poor systems designand user interfaces that are inefficient and ineffective.” - Baxter andSommerville, [1]
According to lead research in socio-technical systems (see [2] for a survey),neglecting social and organizational complexity can cause large, and often se-rious, technological failures, especially where computer systems are concerned.This is a result of a growing gap between technology and the social need thattechnology serves. According to Vicente, [3], rapid advances in today’s techno-logical systems have made such systems less human friendly, and difficult tocontrol or understand from several perspectives (namely physical, psychological,

social/team, organizational, and political domains). Recognizing these needs for“Human-tech” friendly systems, in this case computer systems, is an importantstep in a wide variety of applications, whether for simulations, interfaces, or otherprograms. One way to bridge this socio-technical gap is to provide computerprograms with cognitive models of human factors like stress, burnout, emotion,trust, personality, leadership, expertise, or decision making ability. There aretwo main benefits that such human factor enhanced systems would have. Firstthey would be able to be more human-aware, and second they would be able tobe more human-like.
1.1 Human-Factor Intelligence in Computer Systems
A more “human-aware” system, by the addition of a human-factor module, wouldbe able to interface with real people in an improved way. For instance applica-tions that must present sensitive information to a user under stressful situationsmay calculate an optimum level of information display for that user based on itsprediction of the user’s level of stress. A wireless body area network application,for instance, could provide this information display control program with keydata about the user’s state that can be combined with knowledge of how stressworks. This kind of usage bridges the gap between a computer system and userwith cognitive mental maps; just as humans have mental models of how the sys-tems they use operate, the system itself could benefit by having a mental modelof its user. This notion of balancing mental models is suggested by Leveson, etal, in the safety science community where they focus on system theoretic acci-dent modelling, for instance, although they steer away from focusing on fuzzyhuman-factors, [4].
More “human-like” computer systems, through the addition of human fac-tor modules, would be able add a more subjective domain to typical artificialintelligence that could provide increased realism in its varied applications. Inparticular agent programs based on a deliberative architecture, such as the pop-ular belief-desire-intention (BDI) framework, [5], [6], could make use of humanfactor models in both single and multi-agent situations. For instance, simulat-ing organizations for emergency response, or crisis management could benefit byhaving agents that more closely reflect human complexity in their environments.This would mean that the results of such simulations would incorporate a newdimension. This is particularly important for projects which use organizationsimulation as a means of validating corporate policies, and business processes.A more complex agent more accurately represents human complex agents. Afurther application could involve the study of human-agent interaction (HAI);a relatively new concept, [7], [8], [9] where humans must work in concert withagent programs to achieve a shared objective. An example domain for this wouldbe 3D gaming environments or virtual worlds such as SecondLife, or World ofWarcraft, where virtual agents can interact with human-driven avatars, makingfor interesting studies in this area.
2

1.2 Problem: Capturing Human-Factor Intelligence
In either case there is an underlying problem; these human factors are noto-riously fuzzy, and are not easily standardized or computable, as is needed forprogramming purposes. How to make such models quantifiable and computableis an open research problem, and is the focus of this paper. The human factor ofstress is selected as the first of several to be modeled and eventually implementedinto computer programs. In doing so, definitions from the literature involvingpsychological studies from the University of Toronto, [10], [11], [12], [13], anddefinitions from Hobfoll, [14], are extracted and used to begin the models. Vali-dation of human-factor models by experts (in psychology, sociology, economics,mathematics, etc) is highly important, especially considering the vast literatureon any human factor. Global standard definitions that are concrete, and agreedupon are difficult to find yet critical to the production of computable humanfactor models that have actual explanatory power, where human behavior isconcerned.
The remainder of this paper looks at an approach to producing a model ofstress that is computable. Section 2 discusses the system dynamics tools andmethodology for complex system study. Section 3 describes a system dynamicsmodel of stress and coping behavior, including design decisions, causal loopdiagrams, and stocks/flows. Section 4 presents the output of this stress model.Section 5 provides a brief discussion and conclusion.
2 System DynamicsSystem Dynamics is a methodology and set of modelling tools to describe andunderstand the seemingly complex and “counter-intuitive behavior of systems”,[15], which may be social, technical, or otherwise. The field was pioneered by theearly work of Jay Forrester, at the MIT school of management in the forties, andhas since grown into a respected discipline that promotes systems thinking as acore concept. It has been used as a principle method in many varied studies, suchas climate monitoring, economical forecasting, predicting social trends like tech-nology adoption, market saturation, and predicting changes in population versusurban sprawl, etc (see [16] for more). Its results are well established and flexiblefor many such complex systems and display high predictive value of actual sys-tem behavior. From a managerial perspective, system dynamic models are alsoeasy to explain, and intuitive; an important asset when it comes to discussingcomplex system behavior with experts and non-experts. Its diagrams have highexplanatory value for the systems they model, and are computable, with a strongmathematical foundation. This means that system dynamics models are goodfor translating into or use within computer programs. Furthermore, there are anumber of tools available for both modelling and simulation in system dynamics,two of which have been used in this paper.
2.1 System Dynamics Components
As a method System Dynamics is composed of two primary components that aidin the understanding of systems, namely the use of the causal loop diagram, and
3

the stocks and flows diagram. Causal loop diagramming describes a system interms of the causal relationships among its components, which may be tangible,or intangible, as in supply chain management, [17]; this all means system dy-namics can describe notions that are inherently “fuzzy” such as human-factorsand behaviors in terms of their causes. Further the causal loop diagram, as seenin figure 1 below, can be used to explore the overall result of behavioral loops ina system, and hence explain behavior.
Fig. 1. A causal loop diagram showing behavioral loops. A balancing loop (B) stabilizesa component of the system while a reinforcing loop (R) escalates such a component’sbehavior. Image taken from chapter 5 of [16] for more.
A stock and flows diagram, on the other hand builds off of its causal loopcounterpart by providing quantification of key components in the system. Astock represents a feature of the system that tracks the level or quantity of acertain item in the system. Stocks are like wells or collections that can buildup, or diminish over time. The building up or diminishing of a stock is calleda flow, representing the transfer of units into or out of the stock. Flows canconnect stocks together if the units are the same (or these can be used in equa-tions according to established formulas of rates of change, or constant values
4

that depend on the stock and its flows into either another stock, or a sink. Thecombination of levels, rates, and constant values allow for taking a causal dia-gram and translating it into a quantifiable entity. See figure 2 for more detailsabout this. This diagram allows researchers to visualize the system over time,in simulated activity, under varied conditions (by changing equations and theinitial values of the levels, rates, and constants).
Fig. 2. A stock and flows diagram showing the levels, rates, etc, which describe acomponent’s behavior through equations, and an example of population flow. Imagetaken from chapter 6 of [16] for more.
2.2 System Dynamics Software Tools
As mentioned, there are a number of special purpose software applications avail-able for system dynamics modelling and simulation. These typically allow forconstructing the causal loop and stock and flow diagrams described previously.In addition they usually output the system behavior as a graph showing thebehavior of system variables over time. A selection of these tools may be foundonline in [18]. After a survey of available tools this work has selected Simtegra’sMapSys 3.0, [19], for causal loop diagramming (see figures 3 and 4), and SimGua,[20], for stock and flows models, and simulation charts (see figures 5, 6, 7, and8). The Mapsys tool has powerful causal loop diagramming functionality, whilethe SimGua tool specializes in stock and flow tools, graphs and, more impor-tantly, the ability to write code in addition to basic equations (thus making itvery useful for future integration with customized programs).
5

3 System Dynamics of Stress
The previous sections gave a motivation for adding human-factors to computerprograms, and introduced system dynamics as a modelling paradigm of choicefor representing fuzzy human-factors concepts. Stress, is the subject of this sec-tion, and below is presented a definition of stress gleaned from literature inthe psychology domain, and a proposed system dynamics model based on thisliterature.
3.1 Stress Definitions
The following terms all relate to factors of stress and have been derived fromresearch papers from the University of Toronto, [10], [11], [12], [13], as mentionedpreviously, as well as the work by Hobfoll, [14]. Table 1 shows these definitionsin a concise format.
Table 1. Definitions used in the proposed model of stress.
3.2 Causal Loop Diagrams of Stress
Causal loop diagrams are an effective method for capturing the relationship be-tween inherently fuzzy concepts, like the ones recently defined for stress. Ratherthan having to precisely describe these relationships, these diagrams allow di-rected arcs, which represent relationships, to be labelled in terms of the correla-tion between two concepts. Concepts that are positively correlated (i.e., when oneincreases or decreases so does the other) are represented with a “+” sign, whileconcepts that are negatively correlated (i.e., when one increases or decreasesthe other does the opposite) are represented with a “-” sign. It is exactly this
6
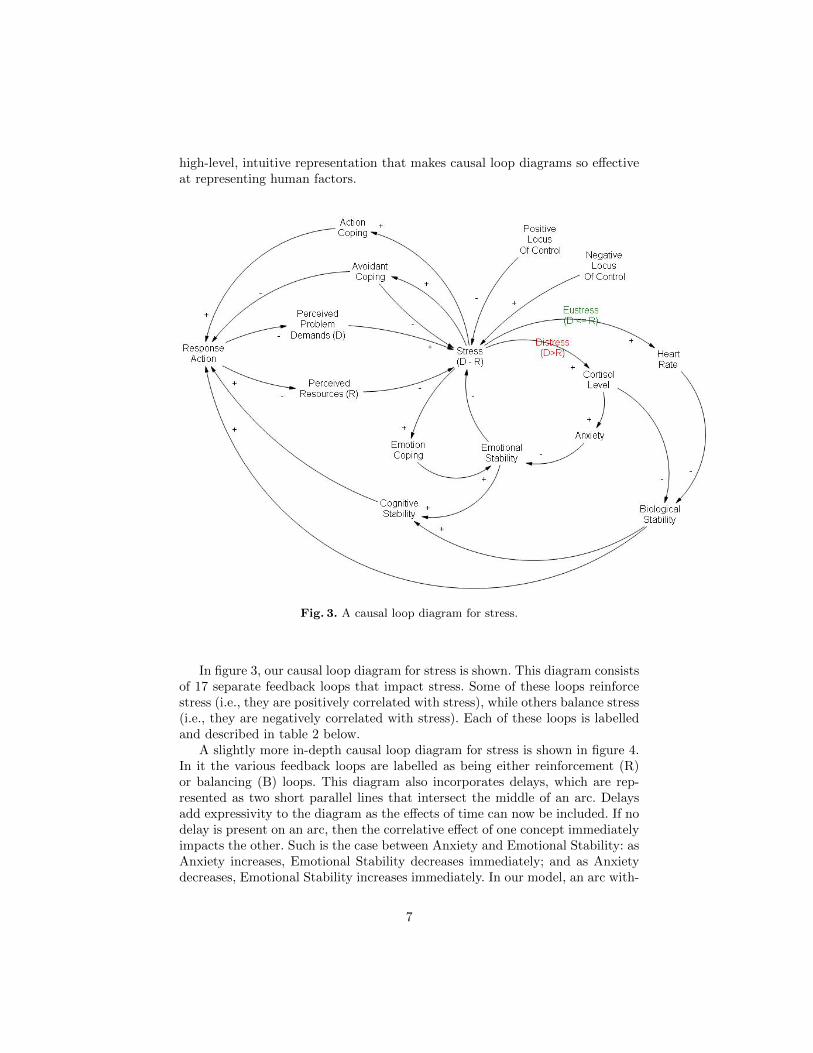
high-level, intuitive representation that makes causal loop diagrams so effectiveat representing human factors.
Fig. 3. A causal loop diagram for stress.
In figure 3, our causal loop diagram for stress is shown. This diagram consistsof 17 separate feedback loops that impact stress. Some of these loops reinforcestress (i.e., they are positively correlated with stress), while others balance stress(i.e., they are negatively correlated with stress). Each of these loops is labelledand described in table 2 below.
A slightly more in-depth causal loop diagram for stress is shown in figure 4.In it the various feedback loops are labelled as being either reinforcement (R)or balancing (B) loops. This diagram also incorporates delays, which are rep-resented as two short parallel lines that intersect the middle of an arc. Delaysadd expressivity to the diagram as the effects of time can now be included. If nodelay is present on an arc, then the correlative effect of one concept immediatelyimpacts the other. Such is the case between Anxiety and Emotional Stability: asAnxiety increases, Emotional Stability decreases immediately; and as Anxietydecreases, Emotional Stability increases immediately. In our model, an arc with-
7

Table 2. Feedback loops in the model are shown in the table below. Note there areslightly more balancing than reinforcing loops.
8
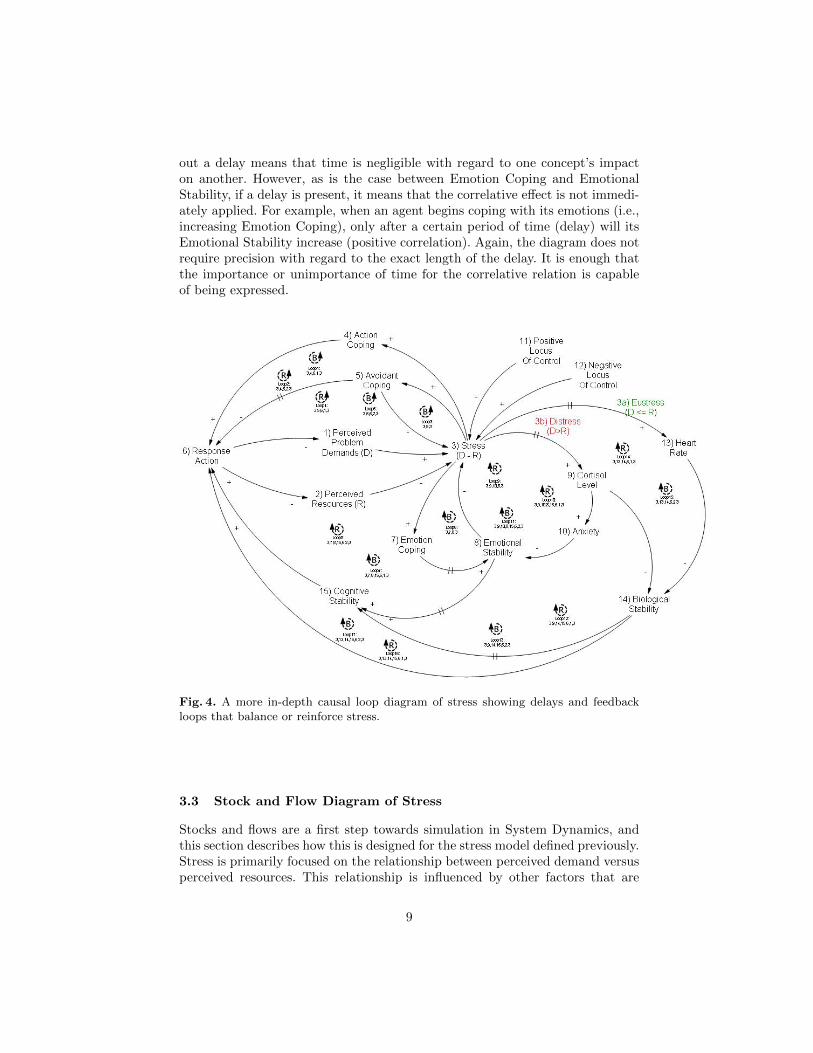
out a delay means that time is negligible with regard to one concept’s impacton another. However, as is the case between Emotion Coping and EmotionalStability, if a delay is present, it means that the correlative effect is not immedi-ately applied. For example, when an agent begins coping with its emotions (i.e.,increasing Emotion Coping), only after a certain period of time (delay) will itsEmotional Stability increase (positive correlation). Again, the diagram does notrequire precision with regard to the exact length of the delay. It is enough thatthe importance or unimportance of time for the correlative relation is capableof being expressed.
Fig. 4. A more in-depth causal loop diagram of stress showing delays and feedbackloops that balance or reinforce stress.
3.3 Stock and Flow Diagram of Stress
Stocks and flows are a first step towards simulation in System Dynamics, andthis section describes how this is designed for the stress model defined previously.Stress is primarily focused on the relationship between perceived demand versusperceived resources. This relationship is influenced by other factors that are
9

networked, according to the causal loop diagram described above. Translatingthese notions into the stock and flow terminology of system dynamics there aresix main stocks and flows that are networked according to several importantparameters. These stocks are in terms of Demand, Resource, Stress, PositiveEmotion, Cortisol, and Heart Rate. The flows increase or decrease the levels ofthese stocks using varied parameters, as seen in figure 5 below.
Fig. 5. A stocks and flow diagram of stress, modelled in SimGua, [20].
In this version of the stock and flow diagram the first thing to notice is the useof the coping style parameter, which represents the three styles of coping as threediscrete variables which have an influence on various flow computations. This isan early design decision that investigates the behavior of each style of copingindependent of the other. In the context of the causal loop diagram earlier, thethree styles may be occurring at the same time in the same individual, whichis congruent to realistic behavior. In future iterations this will be addressed,however here they are quantified separately according the setting of the CopingStyle parameter of figure 5.
1. Task Oriented Coping represents taking a response action through us-ing a resource to reduce a demand. Response actions (seen in figure 3) areconsidered as a result of resource depletion and demand reduction formulas.
10

2. Emotion Oriented Coping factors into the well of positive emotion thatcontributes to an individual’s emotional stability level.
3. Avoidance Oriented Coping is used as a factor in the reduction of stress.
Additionally, there are no stock for response action, biological stability, orcognitive stability in this version of the diagram (although they may be addedin future). Other factors are shown as parameters (represented as oval shapes).Inflow and outflow calculations are shown moving from sources through thestock (rectangles) and out into sink states (both source/sink are represented asclouds). Below are brief descriptions of the stocks and flows of figure 5:
Fig. 6. A sample of possible results from stock and flow modelling.
Demand In this system Demand begins at an initial level of 10 units thatmust be serviced. It is influenced by an inflow of New Demand at a rate of twounits per hour (in our test cases). It is reduced by a rate of 1 unit per hourwhenever there is Eustress or Distress. This computation of reducing demandmust factor in the coping style being performed, since its flows, along with thoseof the Resource stock, are combined to represent the response action.
Resource Resources in the system begin with a value of 12 units. The rate ofincrease for a new resource is set arbitrarily at one unit per hour. The depletion
11

Fig. 7. A sample view of stress levels of eustress, distress, and stress.
of resources is computed as a function of Distress, Eustress, Demand, and theCoping style selected. For both action-oriented, and emotion-oriented coping aresponse action is represented by a depletion of a resource that affects demandas long as there is either Eustress or Distress present. Avoidant coping has noeffect on demand or resources in this version of the model. Future versions maylikely incorporate avoidant coping.
Stress Stress is set initially at 0 units, and grows according to the ComputeStress inflow of figure 5. Stress is computed as a function of Demand, Resource,Emotion, and Locus of Control. Stress is reduced according to coping style, andthe computation of demand minus the ratio of demand to positive emotion,resources and previous stress level multiplied by the ratio of locus of control.Locus of control is a parameter that is either positive or negative, representinginternal, and external locus of control, respectively.
Additionally, Stress is subdivided into two groups, distress, and eustress,according to the ratio of resources to demands. If demands are greater thanresources then the value of stress will be positive, representing distress; if demandis less than resources stress will then be negative, corresponding to the state ofdistress. If the computation is zero then it is assumed that both distress andeustress are zero.
12
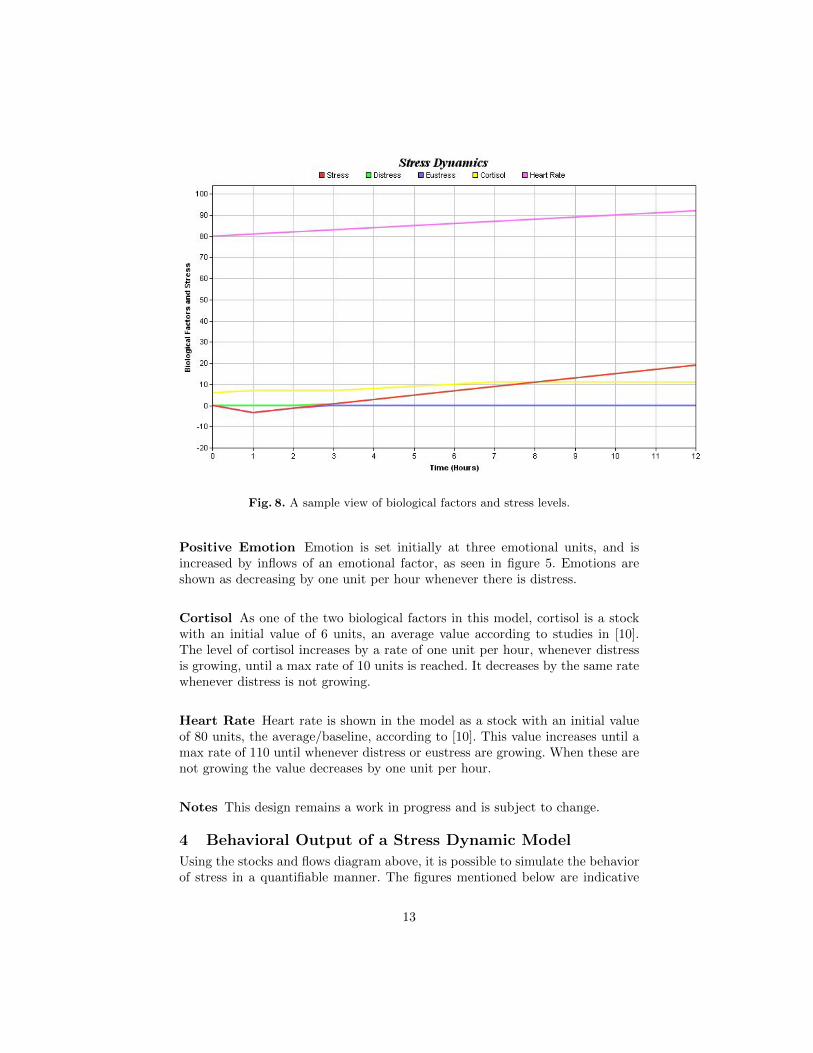
Fig. 8. A sample view of biological factors and stress levels.
Positive Emotion Emotion is set initially at three emotional units, and isincreased by inflows of an emotional factor, as seen in figure 5. Emotions areshown as decreasing by one unit per hour whenever there is distress.
Cortisol As one of the two biological factors in this model, cortisol is a stockwith an initial value of 6 units, an average value according to studies in [10].The level of cortisol increases by a rate of one unit per hour, whenever distressis growing, until a max rate of 10 units is reached. It decreases by the same ratewhenever distress is not growing.
Heart Rate Heart rate is shown in the model as a stock with an initial valueof 80 units, the average/baseline, according to [10]. This value increases until amax rate of 110 until whenever distress or eustress are growing. When these arenot growing the value decreases by one unit per hour.
Notes This design remains a work in progress and is subject to change.
4 Behavioral Output of a Stress Dynamic Model
Using the stocks and flows diagram above, it is possible to simulate the behaviorof stress in a quantifiable manner. The figures mentioned below are indicative
13
of what can be derived from these systems using the SimGua tool, [20], basedon the design decisions described previously. They represent a proof of conceptto show that the use of system dynamics for fuzzy human factor modelling isviable. For example, in figure 6 one can see that as demand exceeds resources attimestep 3, it causes the level of stress to change from eustress to distress aftersome delay, at timestep 5. Also, it is possible to isolate certain key variables suchas the components of stress, as in figure 7, or the biological factors and resultingstress over time, as in figure 8.
5 DiscussionThe models above are a preliminary step to studies involving human-factor mod-ules for use in computer programs. It has been derived from earlier definitionsin psychology, and assembled into system dynamics causal loop diagrams anda resulting stock and flows diagram. Other similar modelling approaches in theliterature remain, and need to be assessed against this current approach. Sev-eral main questions remain, namely about how we can extend and translatethis model (and approach) so it may be useful for quantifying other interest-ing human factors. In a longer term perspective it will be interesting to explorehow these different human factors interrelate in order to better understand thecomplexities of human behavior for different applications.
It is important to validate any such model of human factors rigorously toensure that the models have explanatory value that approximates behavior. Inorder to do this they should be reviewed by domain experts, most likely usingcausal loop diagrams to facilitate discussion since they are easily understoodin relation to more subjective, fuzzy definitions. This paper has explored thegeneral question of how to quantify such fuzzy notions in a way that may becomputable for future studies and implementations, such as agent based simu-lations of organizational policies and work practices.
References
1. Baxter, G., Sommerville, I.: Socio-technical systems: From design methods tosystems engineering. Submitted to The journal of human-computer studies (2008)
2. Morris, A.: Socio-Technical Systems in ICT: A Comprehensive Survey. Techni-cal Report. University of Trento. http://eprints.biblio.unitn.it/archive/00001670/.(2009)
3. Vicente, K.: The human factor: revolutionizing the way people live with technology.Routledge (2004)
4. Leveson, N., Daouk, M., Dulac, N., Marais, K.: Applying STAMP in accidentanalysis. In: NASA CONFERENCE PUBLICATION, NASA; 1998 (2003) 177–198
5. Wooldridge, M., Jennings, N.: Intelligent agents: Theory and practice. The knowl-edge engineering review 10 (2009) 115–152
6. Rao, A., Georgeff, M.: BDI agents: From theory to practice. In: Proceedings of thefirst international conference on multi-agent systems (ICMAS-95), San Francisco,CA (1995) 312–319
14

7. Lewis, M.: Designing for human-agent interaction. AI Magazine 19 (1998) 67–788. Sierhuis, M., Bradshaw, J., Acquisti, A., van Hoof, R., Jeffers, R., Uszok, A.:
Human-agent teamwork and adjustable autonomy in practice. In: Proceedingsof the Seventh International Symposium on Artificial Intelligence, Robotics andAutomation in Space (i-SAIRAS). (2003)
9. Bradshaw, J., Sierhuis, M., Acquisti, A., Feltovich, P., Hoffman, R., Jeffers, R.,Prescott, D., Suri, N., Uszok, A., Van Hoof, R.: Adjustable autonomy and human-agent teamwork in practice: An interim report on space applications. Agent Au-tonomy (2003) 243–280
10. Regehr, C., LeBlanc, V., Jelley, R., Barath, I., Daciuk, J.: Previous trauma expo-sure and PTSD symptoms as predictors of subjective and biological response tostress. Canadian Journal of Psychiatry 52 (2007) 675
11. LeBlanc, V., MacDonald, R., McArthur, B., King, K., Lepine, T.: Paramedicperformance in calculating drug dosages following stressful scenarios in a humanpatient simulator. Prehospital Emergency Care 9 (2005) 439–444
12. LeBlanc, V., Regehr, C., Jelley, R., Barath, I.: The relationship between copingstyles, performance, and responses to stressful scenarios in police recruits. Inter-national Journal of Stress Management 15 (2008) 76–93
13. LeBlanc, V.: The Effects of Acute Stress on Performance: Implications for HealthProfessions Education. Academic Medicine 84 (2009) S25
14. Hobfoll, S.: The ecology of stress. Taylor & Francis (1988)15. Forrester, J.: Counterintuitive behavior of social systems. Theory and Decision 2
(1971) 109–14016. Sterman, J., Sterman, J.: Business dynamics: Systems thinking and modeling for
a complex world with CD-ROM. Irwin/McGraw-Hill (2000)17. Angerhofer, B., Angelides, M.: System dynamics modelling in supply chain man-
agement: research review. In: Proceedings of the 32nd conference on Winter sim-ulation, Society for Computer Simulation International (2000) 351
18. SystemsWiki: Simulation software. http://www.systemswiki.org/index.php?title=simulation software (2010)
19. Simtegra: System dynamics modeling. http://www.simtegra.com/ (2010)20. SimGua: Complex simulation made easy. http://simgua.com/index.php (2010)
15