Embed Size (px)
Citation preview
A SYSTEM DYNAMICS MODEL OF FLOW OF PATIENTS FROM THE ICU THROUGH THE STEP-DOWN UNITS
Ozge Civit
Oakland University
Industrial and Systems Engineering
2200 N. Squirrel Road, Rochester, MI 48309
Email:[email protected]
Sankar Sengupta*
Oakland University
Industrial and Systems Engineering
2200 N. Squirrel Road, Rochester, MI 48309
Tel: +1-248-370-2218, email: [email protected]
ABSTRACT
A System Dynamics (SD) model is presented to study the flow of patients from the ICU to the step-down
units in a local hospital. The model maps the current state of the system and quantifies the impact of
future increase in demand on system performance. Two measures of performance are used in the model
that relate to customer dissatisfaction and the need for future capacity expansion respectively. The
model captures a number of elements and their interactions that include current operating procedure,
current efficiency and resource capacity. The model offers the capability to study different “what if”
conditions based on a SD model that will help make good decisions to improve system performance. A
follow-up research, currently in progress, combines a SD model with a Discrete-Event Simulation (DES)
model to develop a framework to study the proposed system both at strategic as well as at operational
level.
Key words: System Dynamics model, ICU capacity expansion and Healthcare system design.
1 INTRODUCTION
Demand of healthcare services has accelerated its pace over the years due to aging population, varying
demographic trends, increased expectations, government regulations, etc. This substantial increase has
led to growing need for more resources such as beds, medicine and medical staff delivering various
services. There is an urgent need now to balance the cost of resources with the service quality and
availability. The unbalance between supply and demand of resources requires effective tools to capture
315
the causes and analyze the effects by observing the relations of various components in the system with
each other and exogenous factors as well.
*Corresponding author: Sankar Sengupta
Moreover, increasing patient volumes will entail advance planning to maintain the same level of care
(Marmor et al. 2011).
Eldabi et al (2007) describe that there is dramatic increase in healthcare studies since 2000. Healthcare
organizations show complexity in both detailed and dynamic, and consist of many interrelated drivers
and subsystems. This complexity has encouraged policy makers to use simulation-based models due to
importance of resource and budget allocation through more informed and effective decisions.
Integrated care units such as Intensive Care Unit (ICU), Progressive Care Unit (PCU) or Regular Care Unit
(RCU) provide different levels of care as the patients advance through their treatment. Yet ICU is the
most critical unit in a hospital, the availability of ICU beds has direct impact on system performance. Bed
blocking occurs when the patient cannot be transferred from high level of care to reduced care due to
non-availability of beds in step-down units. Incoming patients in turn cannot be placed because of
shortage of bed and must wait leading to delayed discharge. Increase in patient volume requires
detailed planning to maintain the same level of service.
This paper presents the current state of the system under study and evaluates the adequacy of existing
capacity of Intensive Care Unit (ICU) and two step-down units (Progressive Care Unit and Regular Care
Unit). The objective of this study is to understand how the system responds to increase in demand and
to ascertain if there is a need for possible capacity expansion to improve system performance. A System
Dynamics model is used as a decision support tool to capture the complexity of the overall system and
model how the patients flow among different resources.
2 LITERATURE REVIEW
System dynamics is an analytical modeling approach based on the philosophy that the components or
different elements of the system influence each other and the resulting interaction determines the
behavior of the system as a whole over time. SD was first introduced in the 1950s by Jay Forrester under
the name of “Industrial Dynamics” at the Massachusetts Institute of Technology (Forrester 1960). It has
been applied in wide range of areas, yet it is not a well-known approach in the Operation Research
community. SD models clarify the cause and effect of the problem, demonstrating the components along
with internal feedback loops and time delays leading to observed dynamic behavior. SD models used to
help managers improve their understanding of the industrial processes and now being used in both
public and private sector for policy analysis and design.
Qualitative and quantitative are two distinct aspects of SD (Brailsford, 2008). This qualitative side is
represented as a casual loop diagram. A casual loop diagram (CLD) simply reveals the structure by
capturing the interaction between components. CLD enhances understanding the behavior over time
and shed light on the system being analyzed. The elements are connected with arrows and they have
signs to indicate increasing or decreasing relationship between the elements. There are two types of
316
feedback loops: balancing and reinforcing. Balancing loops keep the system in balance, whereas
reinforcing loops cause system to get out of control.
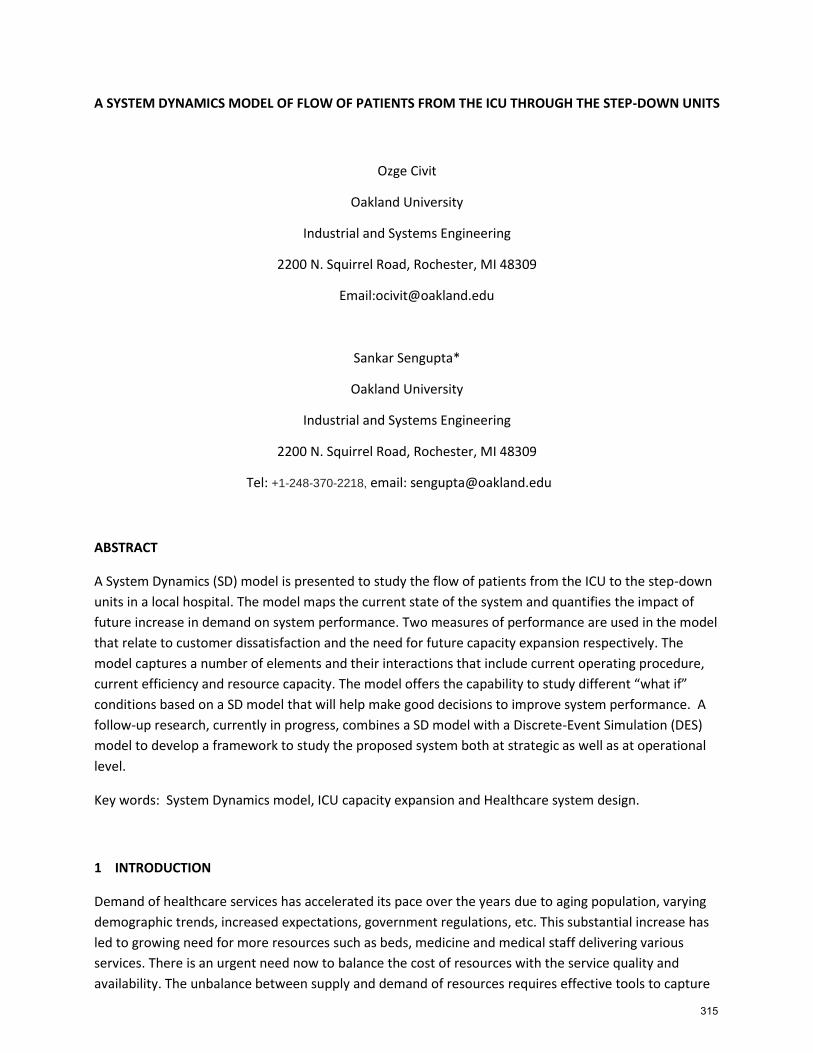
Brailsford and Hilton (2001) explain CLD with an example to demonstrate notation. While eating
increases food in stomach, shown by a “+”; as digestion increases, food in stomach decreases and it is
shown by a “-“. Balanced loops have an odd number of “-“signs, whereas reinforcing loops contain an
even number of “-“signs. The figure represents a balanced loop, keeps the system in control. Authors
argue that the hungrier we are, the more we want to eat. Food increases in our stomach by eating. This
eventually causes feeling less hungry and then stops eating.
Figure 1: Influence diagram to demonstrate notation (Brailsford and Hilton, 2001)
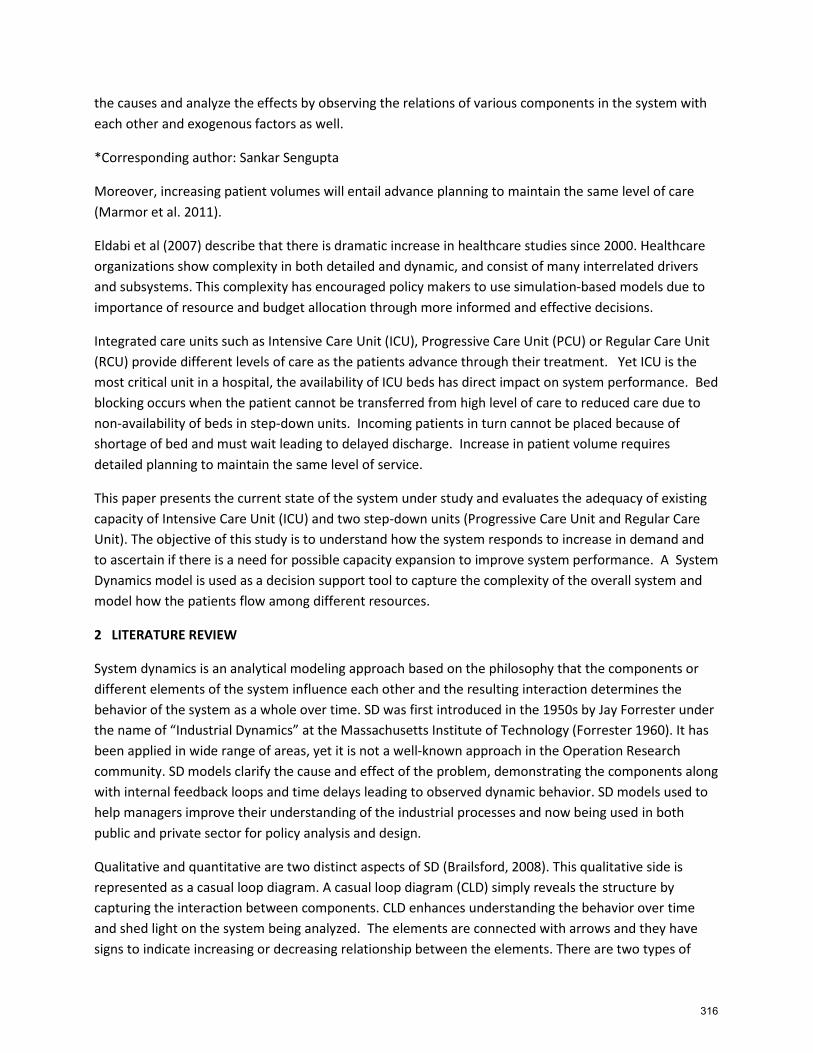
Stock-flow diagrams are quantitative form of SD transformed from CLD, assist to gain more insight of the
system. Stock-flow diagrams are built and simulated by computer software. A stock is the expressions
for continuous entities that accumulates or lessen over time. A flow is the rate of change in a stock.
Figure 2: Simple stock and flow diagram
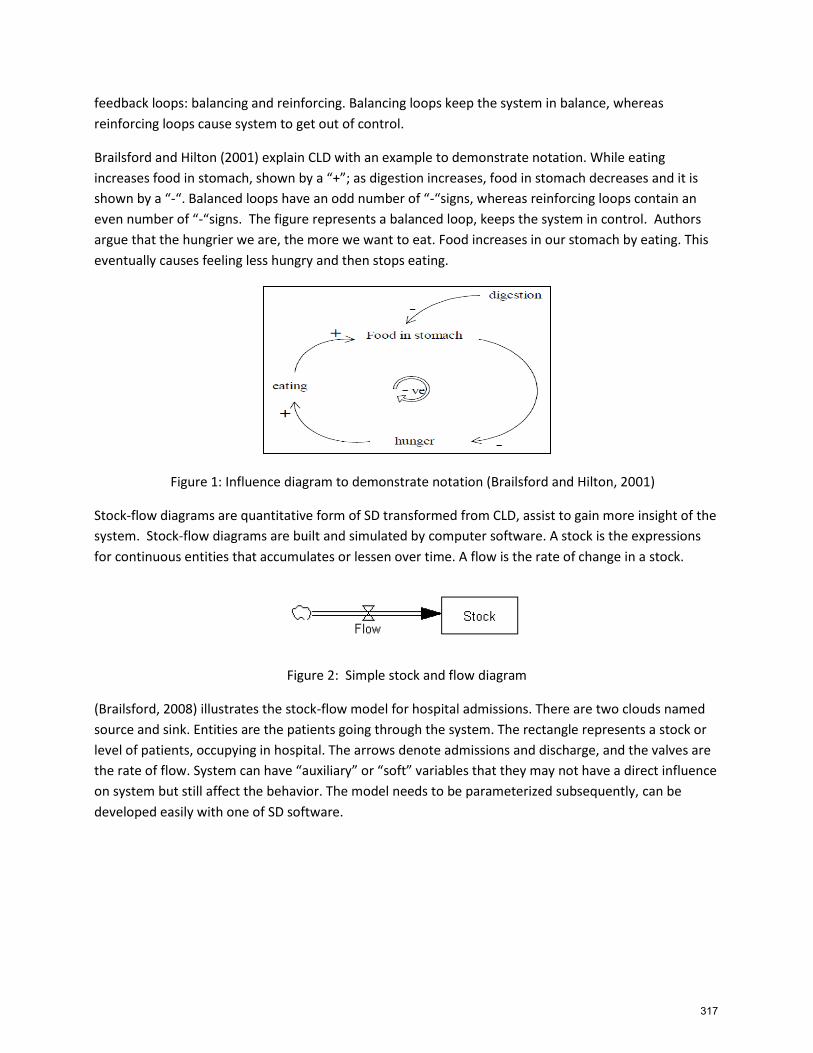
(Brailsford, 2008) illustrates the stock-flow model for hospital admissions. There are two clouds named
source and sink. Entities are the patients going through the system. The rectangle represents a stock or
level of patients, occupying in hospital. The arrows denote admissions and discharge, and the valves are
the rate of flow. System can have “auxiliary” or “soft” variables that they may not have a direct influence
on system but still affect the behavior. The model needs to be parameterized subsequently, can be
developed easily with one of SD software.
317
Figure 3: Stock-flow model for hospital admissions (Brailsford, 2008)
The use of SD has exhibited a considerable increase over last ten years, essentially in healthcare domain.
The system dynamic approach has been applied to population health issues since 1970s (Homer and
Hirsch 2006). System dynamics model assists policy makers to gain more insight of the complexity
inherited in the system. System dynamic modeling aims to understand the relative impacts of alternative
assumptions and interventions rather than predict future values of the system (Homer et al. 2006).
Lane et al (2000) described the formulation and calibration of a SD model of the interaction of demand
pattern, A&E resource deployment, other hospital processes and bed numbers; and the outputs of policy
analysis runs of the model under different operating conditions. The important result was that
reductions in bed numbers do not increase waiting times for emergency admissions; instead they
increase sharply the number of cancellations of admissions for elective surgery. They suggested that A&E
policy solely on any single criterion will transfer the effects of a resource deficit to a different patient
group.
Lane et al (2003) evaluated the collaborative process of building a SD model in order to understand
patient waiting times in an A&E department. They explored the issues that arise when health care
professionals are involved in model development.
Lattimer et al (2004) described the components of an emergency and urgent care system within one
health authority and to investigate ways in which patient flows and system capacity could be improved.
They used a qualitative system dynamics (SD) approach to build a conceptual map of the system
illustrating patient pathways from entry to discharge. Then map is used to construct stock-flow diagram
to experiment different scenarios.
Brailsford et al (2004) described how system dynamics is used as a central part of a whole-system review
of emergency and on-demand health care. They developed a ‘conceptual map’ of the system based on
interviews with 30 key individuals across health and social care, showing potential patient pathways
through the system. The result was used to construct a stock-flow model to simulate patient flows and to
identify system bottlenecks. Modeling indicated a range of undesirable outcomes associated with
continued growth in demand for emergency care, but also considerable potential to intervene to
alleviate these problems, in particular by increasing the care options available in the community.
318
Evenden et al (2005) analyzed genital Chlamydia trachomatis infection with the help of System Dynamics
model to capture dynamics within a population, including different risk groups, and provide a cost-
benefit study for screening. They also demonstrated key risk groups to determine the overall infection
dynamics of the system, and quantify screening rates in order to manage infection prevalence within the
wider population.
Cooke et al. (2007) discussed the use of system thinking and system dynamics modeling as tool for
evaluating alternative health policy decision working in emergency care services and colorectal cancer
screening, in Alberta, Canada.
Lane and Husemann (2008) aimed to assess the usefulness of SD to elicit proposals concerning ways of
improving patient experience. Initial interviews and hospital site visits generated a series of stock/flow
maps. NHS staff was able to propose ideas for improving patient flows and the elicited data was
subsequently employed to create a finalized suite of maps of a general acute hospital through the
workshops held. The maps and ideas were communicated back to the DH and subsequently assisted the
work of the Modernization Agency.
Faezipour and Ferreira (2013) explored important factors and their relationships in healthcare social
sustainability regarding patient satisfaction using system dynamics approach. They applied system
thinking approach to analyze the social aspect in healthcare systems.
User-friendly SD software has led modelers to make simultaneous and quick decisions without any
programming knowledge. Stella and Vensim are the two of them having drag and drop interfaces as
some of DES software provide to their users. The objects can simply be connected through setting up
desired properties. Both paradigms have their own proponents. Some vendors, for example
Technomatix, have been trying to integrate continuous process modeling to their DES software to
capture dynamics of the system. In addition to that, some of them, for example Anylogic, have standard
libraries for each area providing multi-method simulation modeling.
3 PROBLEM STATEMENT
The objective of this study is to develop a system dynamics model that captures the flow of patients
form the Intensive Care Unit to the step-down units in a hospital. This is necessary to take care of new
arrivals to the ICU. The capital intensive resource such as ICU bed cannot be put into service in the short
run to take care of spike in demand. The usual practice is to move some patients who are in less critical
condition from the ICU to next step-down unit, termed Progressive Bed. Overflow from the Progressive
Bed unit is routed to the next step-down unit termed Regular Bed. The level of care offered to a patient
drops down as the patient moves through the step-down units. Capacity constraints also become less
severe as we move through the step-down units. For example, it is relatively easy to add extra beds in
the Regular Bed unit.
The SD model presented in this paper captures the flow of patients through the step-down units
including both regular flow and over flow among the units. The objectives of this study are as follows:
(1) Is current capacity adequate to meet the current demand? (2) Is the facility capable of handling
efficiently expected increase in future demand?
319
-
-
+
+ +
+
+ +
+
+ + +
-
The SD model presents a deterministic model that also includes daily demand for ICU, Progressive and
Regular beds as random elements. Each random element is represented by a suitable statistical
distribution. The model closely resembles the operation of a local hospital. The model parameters are
also set at values based on discussion with domain expert of a local hospital.
3.1 The Causal Loop Diagram
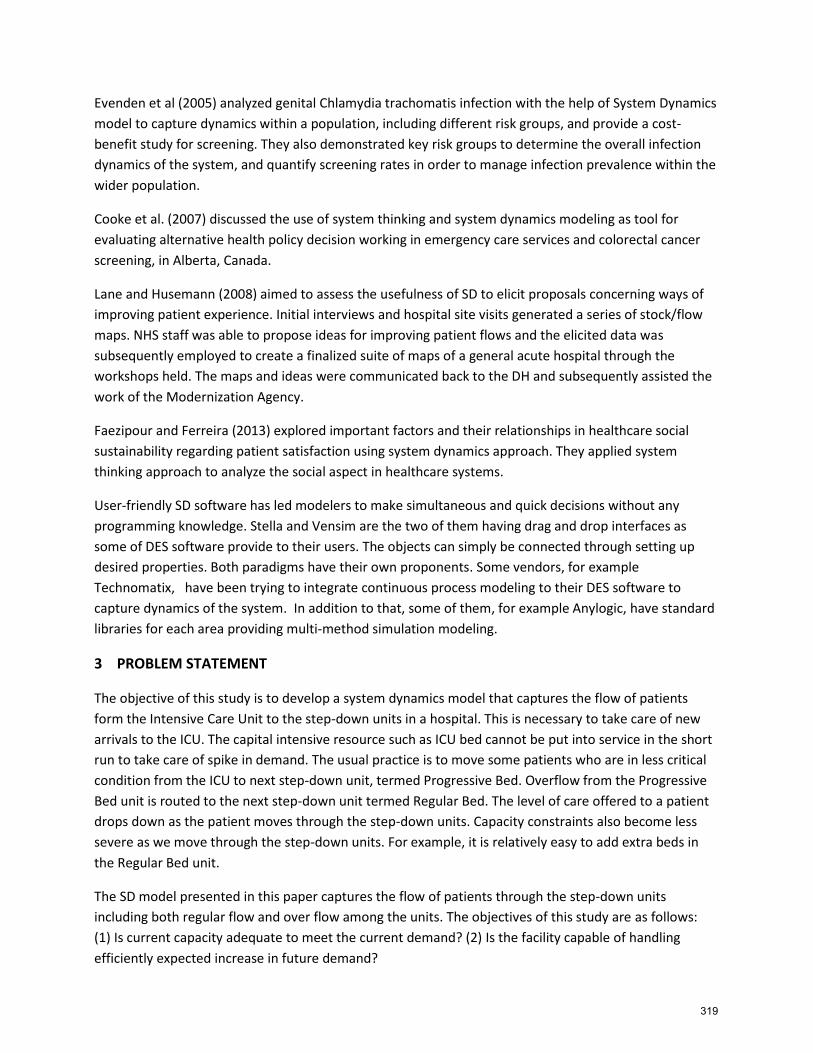
The causal loop diagram (CLD) is shown next. The diagram shows the cause and effect relationships
among different elements of the system. Each node represents an element of the system that may be
quantitative or qualitative in nature. The CLD shows that increase in demand increases ICU backup, PB
occupancy as well as Regular Bed occupancy. “Customer Dissatisfaction” and “Need for more capacity”
are examples of qualitative or soft variables. The CLD also shows that increase in “Available Capacity”
will lower ICU backup, PB Occupancy as well as Regular Bed Occupancy. The CLD diagram shows the
different interactions that are converted into mathematical equations shown next in Figure 6 through 9.
Demand
ICU Backup PB Occupancy
Customer Dissatisfaction Regular Bed Occupancy
Available Capacity
Need for more capacity
Figure 4: Casual loop diagram (CLD) for system elements and their effects on capacity
320
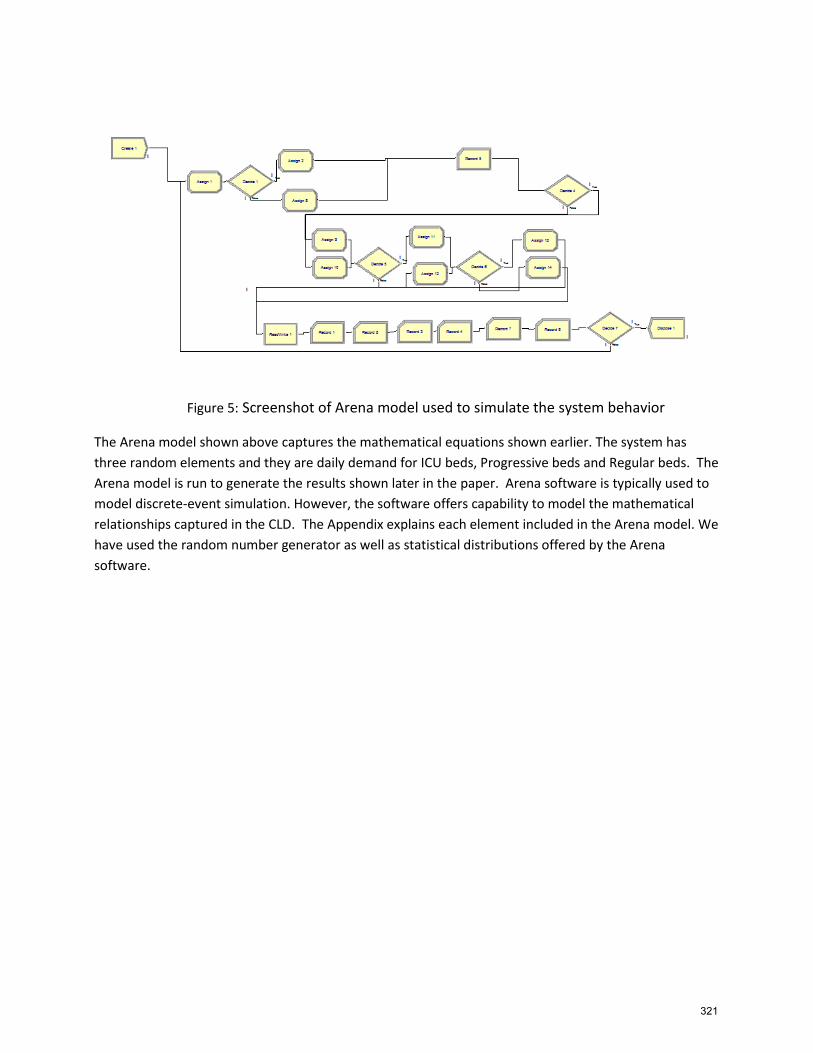
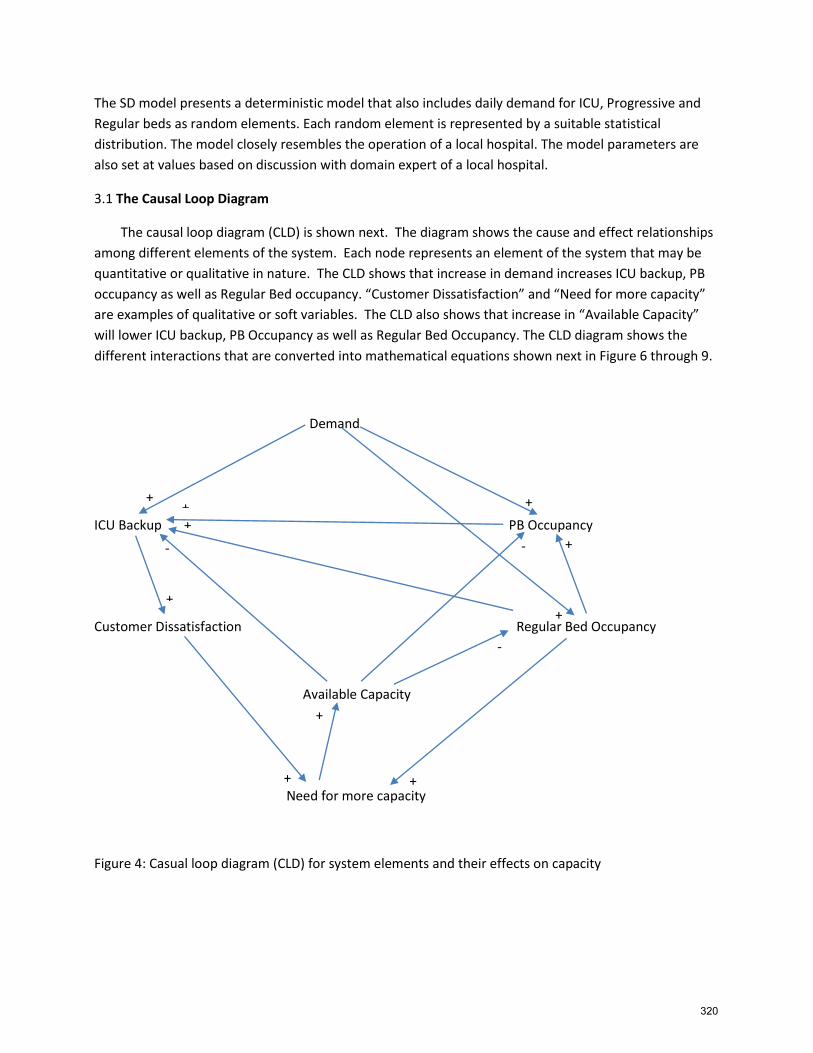
Figure 5: Screenshot of Arena model used to simulate the system behavior
The Arena model shown above captures the mathematical equations shown earlier. The system has
three random elements and they are daily demand for ICU beds, Progressive beds and Regular beds. The
Arena model is run to generate the results shown later in the paper. Arena software is typically used to
model discrete-event simulation. However, the software offers capability to model the mathematical
relationships captured in the CLD. The Appendix explains each element included in the Arena model. We
have used the random number generator as well as statistical distributions offered by the Arena
software.
321
IB(t-1
)
PB
(t-1)
RB
(t-1)
DI(t)
DIP
(t)
ICU
D(t)
DIR
(t)
EIP(t)
DP
(t)
PD
(t) DP
R(t)
RP
I(t)
REG
BC
AP
(t)
EPR
(t)
RR
P(t)
DR
(t)
RR
I(t)
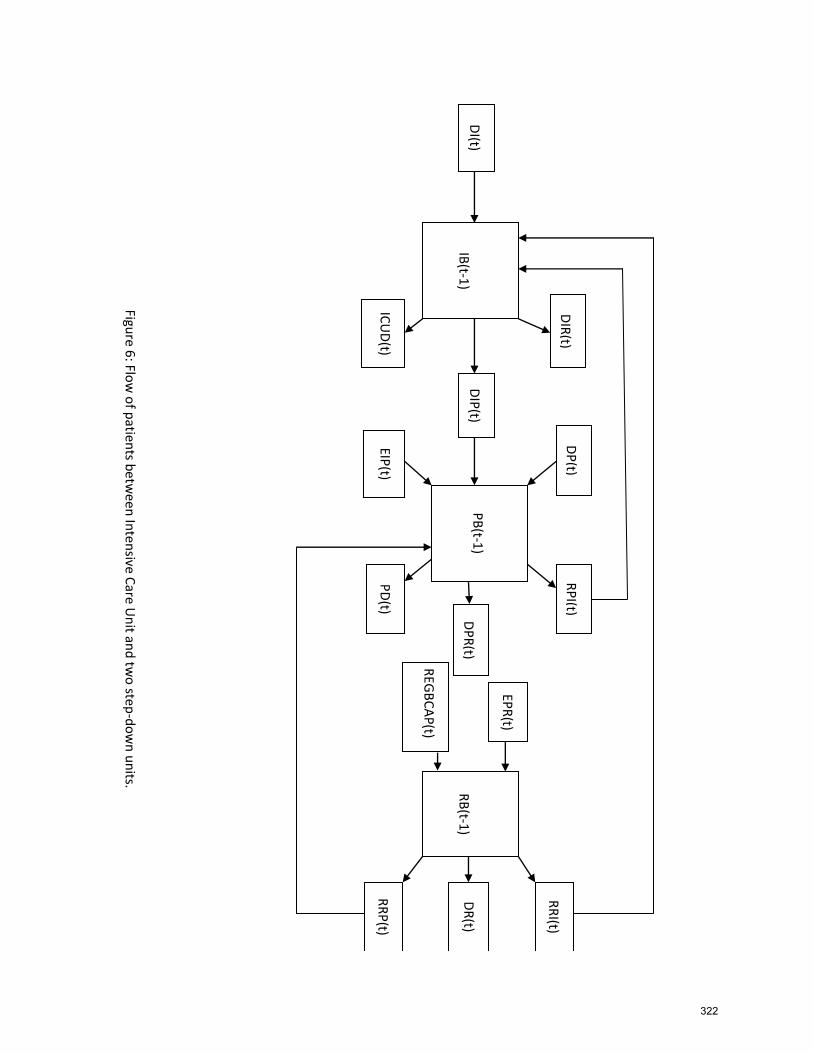
Figure 6
: Flow
of p
atients b
etwee
n In
ten
sive Care U
nit an
d tw
o step
-do
wn
un
its.
322
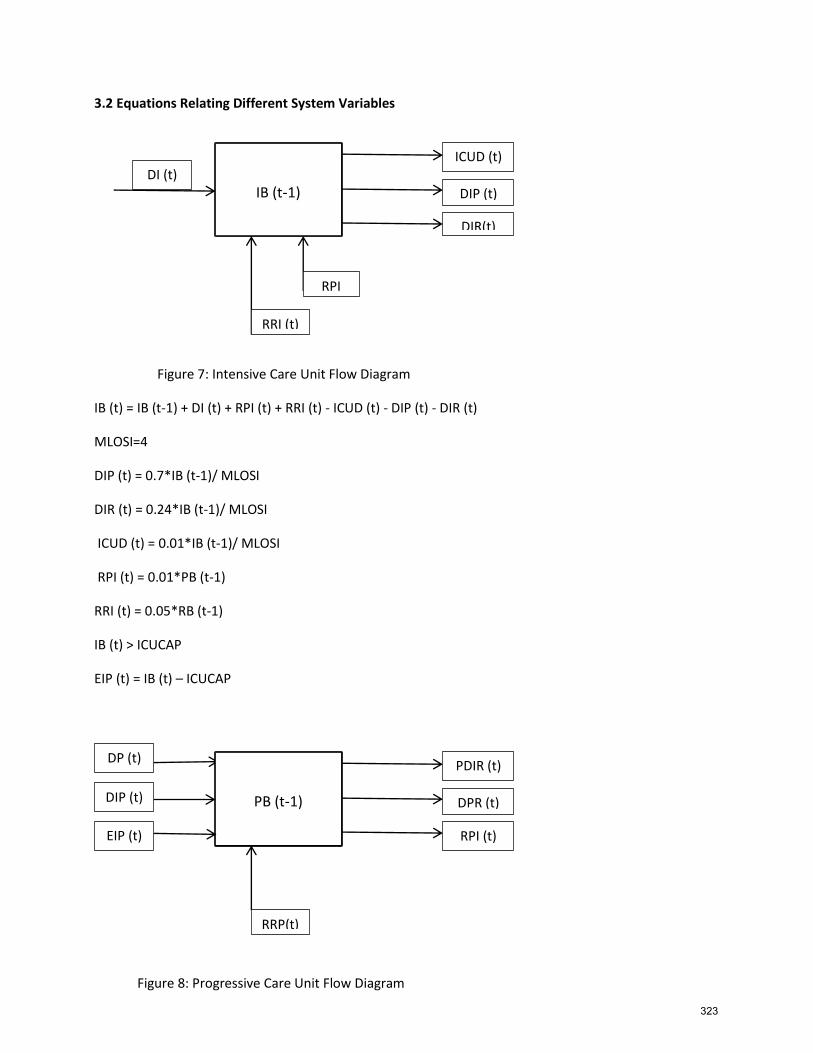
3.2 Equations Relating Different System Variables
Figure 7: Intensive Care Unit Flow Diagram
IB (t) = IB (t-1) + DI (t) + RPI (t) + RRI (t) - ICUD (t) - DIP (t) - DIR (t)
MLOSI=4
DIP (t) = 0.7*IB (t-1)/ MLOSI
DIR (t) = 0.24*IB (t-1)/ MLOSI
ICUD (t) = 0.01*IB (t-1)/ MLOSI
RPI (t) = 0.01*PB (t-1)
RRI (t) = 0.05*RB (t-1)
IB (t) > ICUCAP
EIP (t) = IB (t) – ICUCAP
Figure 8: Progressive Care Unit Flow Diagram
IB (t-1) DI (t)
ICUD (t)
DIP (t)
DIR(t)
RPI
RRI (t)
PB (t-1)
DP (t) PDIR (t)
DPR (t)
RPI (t)
RRP(t)
DIP (t)
EIP (t)
323
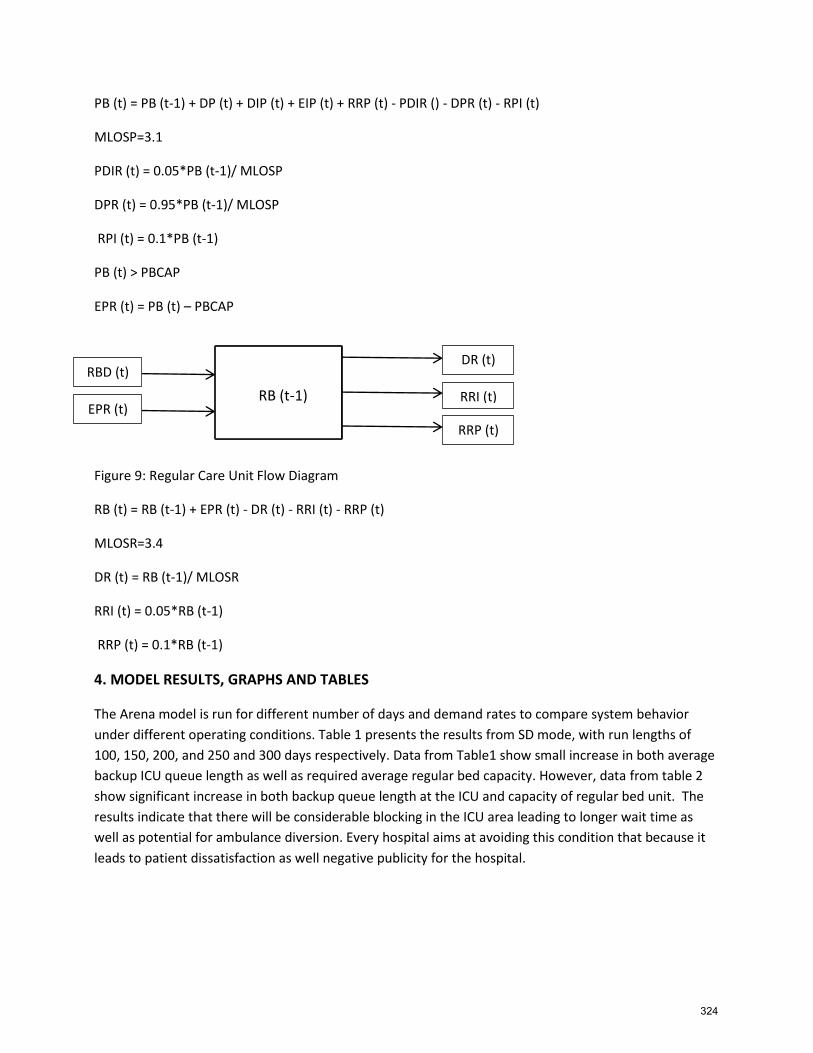
PB (t) = PB (t-1) + DP (t) + DIP (t) + EIP (t) + RRP (t) - PDIR () - DPR (t) - RPI (t)
MLOSP=3.1
PDIR (t) = 0.05*PB (t-1)/ MLOSP
DPR (t) = 0.95*PB (t-1)/ MLOSP
RPI (t) = 0.1*PB (t-1)
PB (t) > PBCAP
EPR (t) = PB (t) – PBCAP
Figure 9: Regular Care Unit Flow Diagram
RB (t) = RB (t-1) + EPR (t) - DR (t) - RRI (t) - RRP (t)
MLOSR=3.4
DR (t) = RB (t-1)/ MLOSR
RRI (t) = 0.05*RB (t-1)
RRP (t) = 0.1*RB (t-1)
4. MODEL RESULTS, GRAPHS AND TABLES
The Arena model is run for different number of days and demand rates to compare system behavior
under different operating conditions. Table 1 presents the results from SD mode, with run lengths of
100, 150, 200, and 250 and 300 days respectively. Data from Table1 show small increase in both average
backup ICU queue length as well as required average regular bed capacity. However, data from table 2
show significant increase in both backup queue length at the ICU and capacity of regular bed unit. The
results indicate that there will be considerable blocking in the ICU area leading to longer wait time as
well as potential for ambulance diversion. Every hospital aims at avoiding this condition that because it
leads to patient dissatisfaction as well negative publicity for the hospital.
RB (t-1)
RBD (t) DR (t)
RRI (t)
RRP (t)
EPR (t)
324
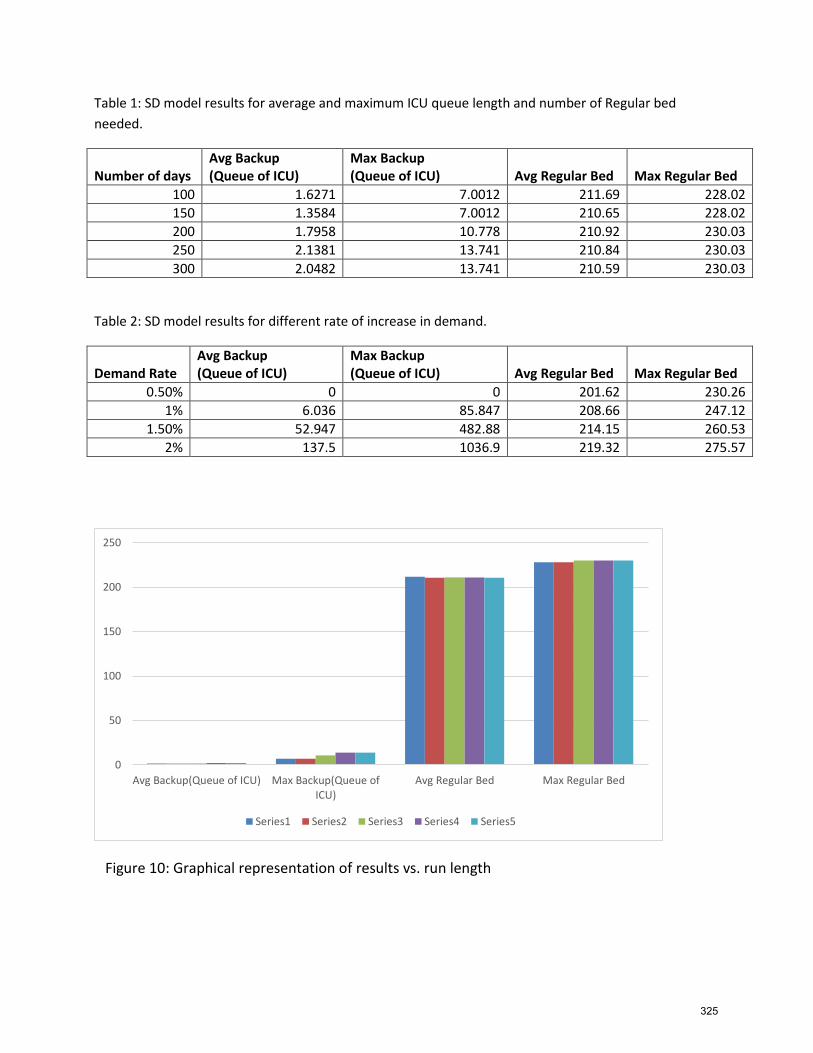
Table 1: SD model results for average and maximum ICU queue length and number of Regular bed
needed.
Number of days Avg Backup (Queue of ICU)
Max Backup (Queue of ICU) Avg Regular Bed Max Regular Bed
100 1.6271 7.0012 211.69 228.02
150 1.3584 7.0012 210.65 228.02
200 1.7958 10.778 210.92 230.03
250 2.1381 13.741 210.84 230.03
300 2.0482 13.741 210.59 230.03
Table 2: SD model results for different rate of increase in demand.
Demand Rate Avg Backup (Queue of ICU)
Max Backup (Queue of ICU) Avg Regular Bed Max Regular Bed
0.50% 0 0 201.62 230.26
1% 6.036 85.847 208.66 247.12
1.50% 52.947 482.88 214.15 260.53
2% 137.5 1036.9 219.32 275.57
Figure 10: Graphical representation of results vs. run length
0
50
100
150
200
250
Avg Backup(Queue of ICU) Max Backup(Queue ofICU)
Avg Regular Bed Max Regular Bed
Series1 Series2 Series3 Series4 Series5
325
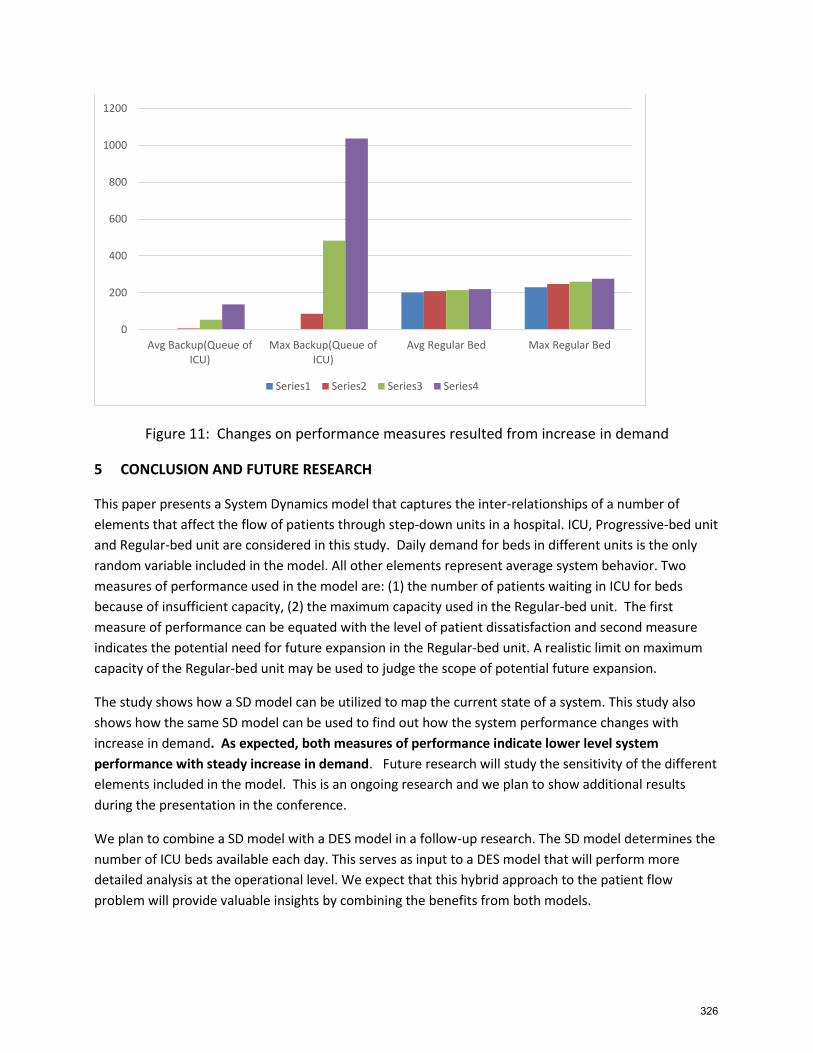
Figure 11: Changes on performance measures resulted from increase in demand
5 CONCLUSION AND FUTURE RESEARCH
This paper presents a System Dynamics model that captures the inter-relationships of a number of
elements that affect the flow of patients through step-down units in a hospital. ICU, Progressive-bed unit
and Regular-bed unit are considered in this study. Daily demand for beds in different units is the only
random variable included in the model. All other elements represent average system behavior. Two
measures of performance used in the model are: (1) the number of patients waiting in ICU for beds
because of insufficient capacity, (2) the maximum capacity used in the Regular-bed unit. The first
measure of performance can be equated with the level of patient dissatisfaction and second measure
indicates the potential need for future expansion in the Regular-bed unit. A realistic limit on maximum
capacity of the Regular-bed unit may be used to judge the scope of potential future expansion.
The study shows how a SD model can be utilized to map the current state of a system. This study also
shows how the same SD model can be used to find out how the system performance changes with
increase in demand. As expected, both measures of performance indicate lower level system
performance with steady increase in demand. Future research will study the sensitivity of the different
elements included in the model. This is an ongoing research and we plan to show additional results
during the presentation in the conference.
We plan to combine a SD model with a DES model in a follow-up research. The SD model determines the
number of ICU beds available each day. This serves as input to a DES model that will perform more
detailed analysis at the operational level. We expect that this hybrid approach to the patient flow
problem will provide valuable insights by combining the benefits from both models.
0
200
400
600
800
1000
1200
Avg Backup(Queue ofICU)
Max Backup(Queue ofICU)
Avg Regular Bed Max Regular Bed
Series1 Series2 Series3 Series4
326
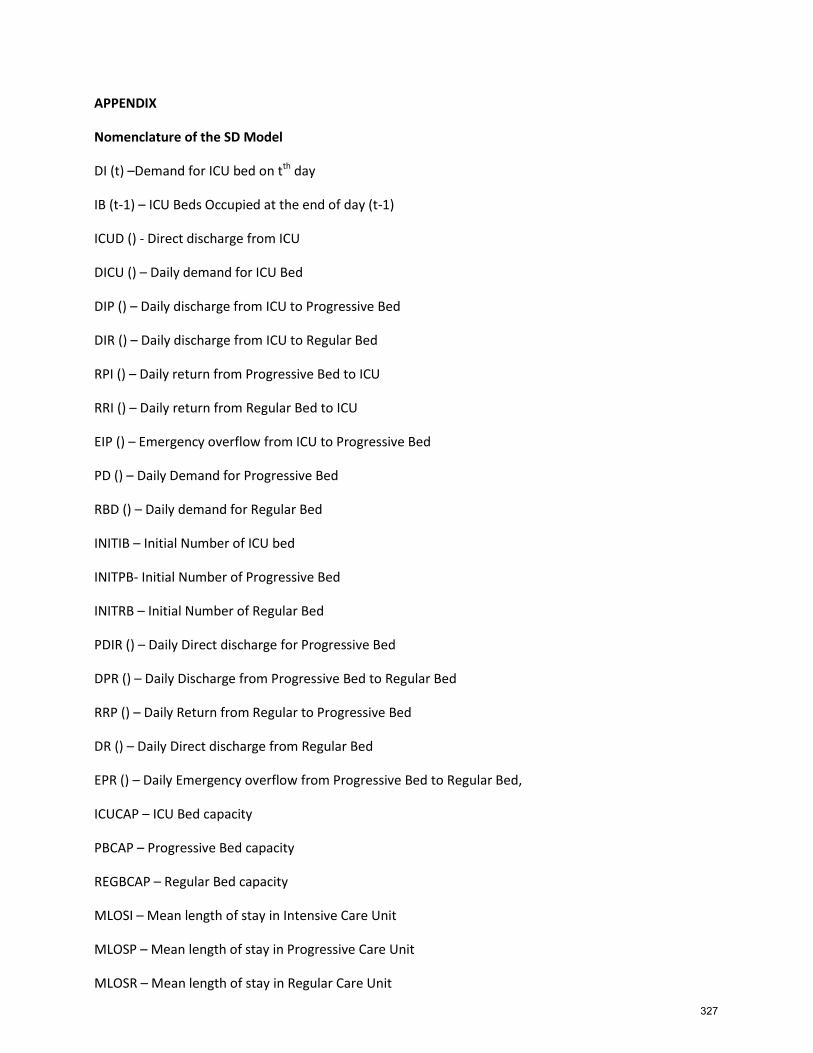
APPENDIX
Nomenclature of the SD Model
DI (t) –Demand for ICU bed on tth day
IB (t-1) – ICU Beds Occupied at the end of day (t-1)
ICUD () - Direct discharge from ICU
DICU () – Daily demand for ICU Bed
DIP () – Daily discharge from ICU to Progressive Bed
DIR () – Daily discharge from ICU to Regular Bed
RPI () – Daily return from Progressive Bed to ICU
RRI () – Daily return from Regular Bed to ICU
EIP () – Emergency overflow from ICU to Progressive Bed
PD () – Daily Demand for Progressive Bed
RBD () – Daily demand for Regular Bed
INITIB – Initial Number of ICU bed
INITPB- Initial Number of Progressive Bed
INITRB – Initial Number of Regular Bed
PDIR () – Daily Direct discharge for Progressive Bed
DPR () – Daily Discharge from Progressive Bed to Regular Bed
RRP () – Daily Return from Regular to Progressive Bed
DR () – Daily Direct discharge from Regular Bed
EPR () – Daily Emergency overflow from Progressive Bed to Regular Bed,
ICUCAP – ICU Bed capacity
PBCAP – Progressive Bed capacity
REGBCAP – Regular Bed capacity
MLOSI – Mean length of stay in Intensive Care Unit
MLOSP – Mean length of stay in Progressive Care Unit
MLOSR – Mean length of stay in Regular Care Unit
327
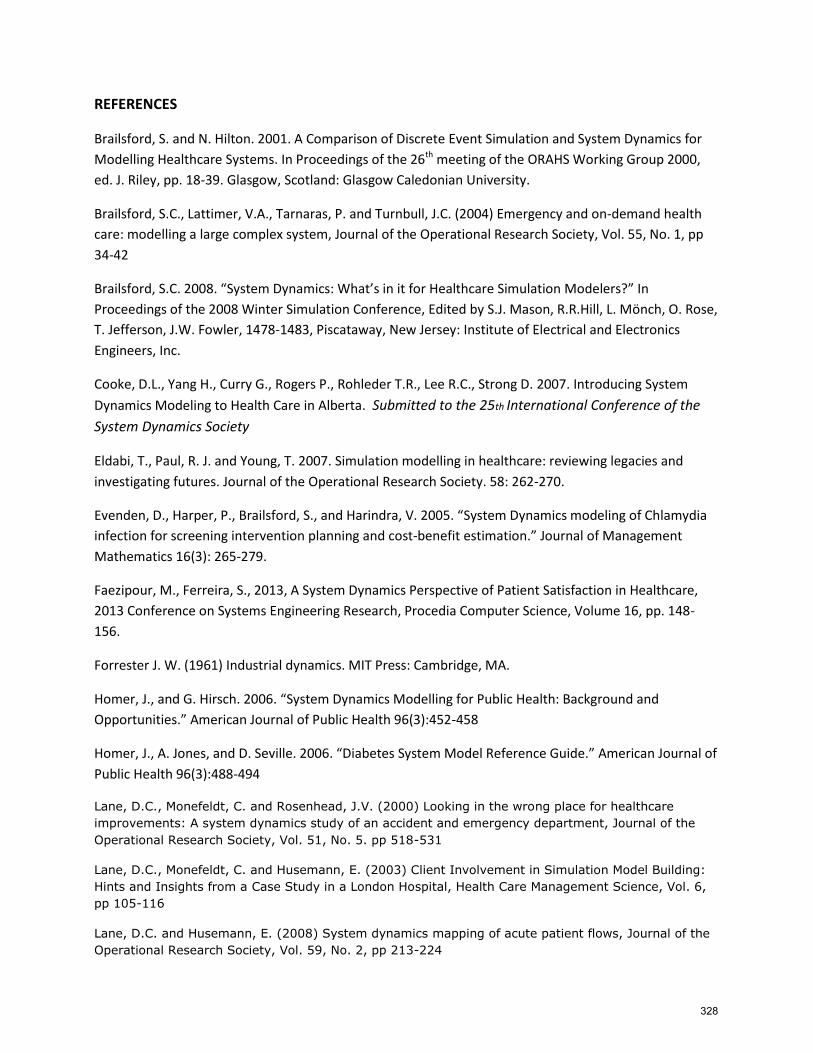
REFERENCES
Brailsford, S. and N. Hilton. 2001. A Comparison of Discrete Event Simulation and System Dynamics for
Modelling Healthcare Systems. In Proceedings of the 26th meeting of the ORAHS Working Group 2000,
ed. J. Riley, pp. 18-39. Glasgow, Scotland: Glasgow Caledonian University.
Brailsford, S.C., Lattimer, V.A., Tarnaras, P. and Turnbull, J.C. (2004) Emergency and on-demand health
care: modelling a large complex system, Journal of the Operational Research Society, Vol. 55, No. 1, pp
34-42
Brailsford, S.C. 2008. “System Dynamics: What’s in it for Healthcare Simulation Modelers?” In
Proceedings of the 2008 Winter Simulation Conference, Edited by S.J. Mason, R.R.Hill, L. Mönch, O. Rose,
T. Jefferson, J.W. Fowler, 1478-1483, Piscataway, New Jersey: Institute of Electrical and Electronics
Engineers, Inc.
Cooke, D.L., Yang H., Curry G., Rogers P., Rohleder T.R., Lee R.C., Strong D. 2007. Introducing System
Dynamics Modeling to Health Care in Alberta. Submitted to the 25th International Conference of the
System Dynamics Society
Eldabi, T., Paul, R. J. and Young, T. 2007. Simulation modelling in healthcare: reviewing legacies and
investigating futures. Journal of the Operational Research Society. 58: 262-270.
Evenden, D., Harper, P., Brailsford, S., and Harindra, V. 2005. “System Dynamics modeling of Chlamydia
infection for screening intervention planning and cost-benefit estimation.” Journal of Management
Mathematics 16(3): 265-279.
Faezipour, M., Ferreira, S., 2013, A System Dynamics Perspective of Patient Satisfaction in Healthcare,
2013 Conference on Systems Engineering Research, Procedia Computer Science, Volume 16, pp. 148-
156.
Forrester J. W. (1961) Industrial dynamics. MIT Press: Cambridge, MA.
Homer, J., and G. Hirsch. 2006. “System Dynamics Modelling for Public Health: Background and
Opportunities.” American Journal of Public Health 96(3):452-458
Homer, J., A. Jones, and D. Seville. 2006. “Diabetes System Model Reference Guide.” American Journal of
Public Health 96(3):488-494
Lane, D.C., Monefeldt, C. and Rosenhead, J.V. (2000) Looking in the wrong place for healthcare
improvements: A system dynamics study of an accident and emergency department, Journal of the
Operational Research Society, Vol. 51, No. 5. pp 518-531
Lane, D.C., Monefeldt, C. and Husemann, E. (2003) Client Involvement in Simulation Model Building:
Hints and Insights from a Case Study in a London Hospital, Health Care Management Science, Vol. 6,
pp 105-116
Lane, D.C. and Husemann, E. (2008) System dynamics mapping of acute patient flows, Journal of the
Operational Research Society, Vol. 59, No. 2, pp 213-224
328
Lattimer, V.A., Brailsford, S.C., Turnbull, J.C., Tarnaras, P., Smith H., George S., Gerard K., and Maslin-
Prothero S. (2004) Reviewing emergency care systems I: insights from system dynamics modelling,
Emergency Medicine Journal, Vol. 21, No. 6, pp 685–691
Marmor, T. and Oberlander, J. 2011. The patchwork: Health reform, American style. Journal of Social
Science and Medicine, 72(2):125-8
Biography
Ozge Civit is currently a graduate student at Oakland University and pursuing a master’s
degree in Industrial and Systems Engineering. Her research deals with healthcare simulation
which served as the underlying foundation for her thesis. Her e-mail address is
Sankar Sengupta. Ph.D. is a professor in the Industrial and Systems Engineering Department at
Oakland University. He has over twenty four years of teaching and research experience and a few
years of Industrial experience. He has published over 50 technical papers in peer reviewed journals
and conference proceedings. He is the author of a textbook in Systems Modeling and Simulation. His
research interests include: Use of quantitative methods in decision making, Modeling and
performance analysis of manufacturing and service systems including health-care systems,
Statistical analyses of data, Operations Research, and Building and analyses of discrete-event
simulation model. He serves regularly as an invited faculty in the Engineering Management Program
in Vienna. He is a member of IIE and ASQ. His e-mail id is [email protected].
329

330