Embed Size (px)
Citation preview
1
SOCIAL PROTECTION AND SOCIAL INCLUSION IN THE WESTERN BALKANS
A SYNTHESIS REPORT
European Commission
Directorate-General for Employment, Social Affairs and Equal Opportunities Unit E2
Manuscript completed in January 2009
European Commission
2
This report was financed by and prepared for the use of the European Commission, Directorate-General for Employment, Social Affairs and Equal Opportunities. It does not necessarily represent the Commission's official position.
http://Ec.europa.eu/employment_social/spsi
The Institute of Economics, Zagreb http://www.eizg.hr
Paul Stubbs
If you are interested in receiving the electronic newsletter "ESmail" from the European Commission's Directorate-General for Employment, Social Affairs and Equal Opportunities, please send an e-mail to [email protected] — The newsletter is published on a regular basis in English, French and German.
© European Communities, 2009 Reproduction is authorised provided the source is acknowledged.
iii
ACRONOYMS CITED IN TEXT ............................................................................................ iv
ABSTRACT.............................................................................................................................. vi
ABSTRAKT.............................................................................................................................vii
SAŽETAK...............................................................................................................................viii
REZIME.................................................................................................................................... ix
РЕЗИМЕ ................................................................................................................................... xi
1: Economic, Demographic, Labour Market and Education Trends.......................................... 1
2: Social Protection Systems .................................................................................................... 36
3: Poverty and Social Exclusion: dimensions, characteristics, trends and strategies............... 52
4: Pension Systems: coverage, sustainability and reform challenges ...................................... 66
6: CONCLUSIONS AND KEY CHALLENGES.................................................................... 88
iv
ACRONOYMS CITED IN TEXT AIC Actual Individual Consumption AP KOS Autonomous Province of Kosovo AP VOJ Autonomous Province of Vojvodina BiH Bosnia-Herzegovina CC Candidate Countries CEE/CIS Central and Eastern Europe and the Commonwealth of Independent
States CRO Croatia CSWs Centres for Social Work DG Directorate-General DGECFIN Directorate-General for Economic and Financial Affairs DEN Denars (former Yugoslav Republic of Macedonia currency) DEP Department for Economic Planning (Bosnia-Herzegovina) DFID Department for International Development (UK Government) DIN Dinars (Serbian currency) EAR European Agency for Reconstruction ECHI European Community Health Indicators EFPs Economic and Fiscal Programmes EIZ Institute of Economics, Zagreb ETF European Training Foundation EU European Union FBiH Federation of Bosnia-Herzegovina FDI Foreign Direct Investment FES Friedrich Ebert stiftung GDP Gross Domestic Product HIV/AIDS Human Immunodeficiency Virus/ Acquired Immunodeficiency
Syndrome HBS Household Budget Survey HRK Croatian Kuna (currency) IDPs Internally Displaced Persons ILO International Labour Organisation IMF International Monetary Fund IOM International Organisation for Migration KM Convertible Mark (Bosnia-Herzegovina currency) LFS Labour Force Survey LSMS Living Standards Measurement Survey MAC former Yugoslav Republic of Macedonia MICS Multi-Indicator Cluster Survey MON Montenegro MONEE Monitoring Eastern Europe MOP materijalno obezbjedjene porodice (Montenegro/Serbia – family
material support) MTDS Medium-term Development Strategy (Bosnia-Herzegovina) MTEF Medium-term Expenditure Framework NE ndihme ekonomike (Albania – economic aid) NGOs Non-Governmental Organisations
v
NMS New Member States OECD Organisation for Economic Co-operation and Development OSI Open Society Institute PASIS Poverty Alleviation and Social Inclusion Strategy (Montenegro) PAYG Pay As You Go PISA Programme for International Student Assessment PPP Purchasing Power Parity RCC Regional Co-operation Council RDPs Refugees and Internally Displaced Persons RS Republika Srpska (entity in Bosnia-Herzegovina) SEEHN South East European Health Network SER Serbia SFRY Social Federal Republic of Yugoslavia SILC Statistics on Income and Living Conditions SIS Social Inclusion Strategy SLO Slovenia SME Small and Medium Enterprises SPSI Social Protection and Social Inclusion U Unemployment UNDP United Nations Development Programme UNHCR United Nations High Commissioner for Refugees UNICEF United Nations Children’s Fund UNSC 1244 United Nations Security Council Resolution 1244 USD United States Dollars WHO World Health Organisation WIIW Vienna Institute for International Economic Studies
vi
ABSTRACT Social Protection and Social Inclusion in the Western Balkans: A Synthesis Report This report explores social protection and social inclusion in the Western Balkans, namely: Albania, Bosnia and Herzegovina, Kosovo under United Nations Security Council resolution 1244, Montenegro, and Serbia, drawing on a series of independent reports completed in August 2008. The report addresses key political, economic and demographic trends, including the functioning of labour markets and education systems; the financing of, eligibility for and access to social protection; general living conditions and groups at risk of poverty and social exclusion; access to pensions and to health and long-term care. The report explores disparities and discrimination based on gender, age, disability, 'ethnicity', and sexual orientation, as well as exploring spatialised inequalities. The report identifies future challenges for the modernisation of social protection systems and for promoting social inclusion, framed in terms of the revised Social Inclusion objectives of the European Union.

vii
ABSTRAKT Mbrojtja Sociale dhe Prfshirja Sociale n Ballkanin Perndimor: Raport Prmbledhs Raporti eksploron mbrojtjen sociale dhe përfshirjen sociale në vendet e Ballkanit Perëndimor, përkatësisht: Shqipëri, Bosnjë dhe Hercegovinë, Kosovë (nën rezolutën 1244 të Këshillit të Sigurimit të Kombeve të Bashkuara), në Malin e Zi dhe Serbi, mbështetur në një seri raportesh të pavarura të përfunduara në gusht 2008. Raporti adreson risitë kryesore politike, ekonomike dhe demografike, përfshirë funksionimin e tregjeve të punës dhe sistemet arsimore; financimin, kualifikimin dhe aksesin për mbrojtjen sociale; kushtet e përgjithshme të jetesës dhe grupet në rrezik varfërie dhe përjashimi social; aksesin në pensione, shëndetësi dhe kujdesin afatgjatë. Raporti eksploron pabarazinë dhe diskriminimin bazuar në gjini, moshë, aftësitë e kufizuara, përkatësi etnike, dhe orientim seksual, si dhe eksplorimin e pabarazive hapsinore. Raporti përcakton sfidat e ardhshme për modernizimin e sistemeve të mbrojtjes sociale dhe për promovimin e përfshirjes sociale, përkufizuar sipas termave të objektivave të rishikuar të Përfshirjes Sociale të Bashkimit Evropian.
viii
SAŽETAK Socijalna zaštita i socijalna uključenost na zapadnom Balkanu: Sveobuhvatni izvještaj Ovaj izvještaj istražuje pitanja socijalne zaštite i socijalne uključenosti na Zapadnom Balkanu, tačnije u Albaniji, Bosni i Hercegovini, Kosovu pod Rezolucijom 1244 Vijeća sigurnosti Ujedninjenih naroda, Crne gore i Srbije, a na osnovu niza pojedinačnih izvještaja koji su finalizirani u avgustu 2008. godine. Izvještaj donosi osnovne političke, ekonomske i demografske trendove, uključujući načine funkcioniranja tržišta rada i obrazovnih sistema; finansiranje i dostupnost sistema socijalne zaštite; opće uslove života i grupe kojima prijete siromaštvo i socijalna isključenost; dostupnost penzionom sistemu, zdravstvu i dugoročnoj zaštiti. Izvještaj istražuje nejednakosti i diskriminaciju koje su zasnovane na rodu, godinama starosti, invaliditetu, “etnicitetu” i seksualnoj orijentaciji, kao i prostornim nejednakostima. Izvještaj identificira buduće izazove u modernizaciji sistema socijalne zaštite i promoviranju socijalne uključenosti, a u okvirima revidiranih ciljeva socijalne uključenosti Evropske unije.
ix
REZIME Socijalna zaštita i socijalna uključenost na zapadnom Balkanu: Sveobuhvatni izvještaj Ovaj izvještaj istražuje sisteme socijalne zaštite i socijalne inkluzije u Zapadnom Balkanu, naime u Abaniji, Bosni i Hercegovini, Kosovu u okviru Rezulucije 1244 Savjeta bezbjednosti Ujedinjenih nacija, Crnoj Gori i Srbiji, na osnovnu serije nezavisnih izvještaja finalizovanih u Avgustu 2008. godine. Ovaj izvještaj opisuje ključne političke, ekonomske i demografske trendove, uključujući funkcionisanje tržišta rada i obrazovnih sistema; finansiranje, prava i dostupnost socijalne zaštite; opšte uslove za život i grupe koje se suočavaju sa rizikom od siromaštva i socijalne isključenosti; dostupnost penzionog sistema, i sistema zdravstvene i dugoročne njege. Izvještaj istražuje disparitet i diskriminaciju po osnovu pola, starosti, invalitnosti, nacionalnosti i seksualne orjentacije, kao i prostorne nejednakosti. Izvještaj identifikuje buduće izazove za modernizaciju sistema socijalne zaštite i promociju socijalne uključenosti, oblikovane po ugledu na revidirane Ciljeve socijalne inkluzije Evropske Unije.
x
REZIME Socijalna zaštita i socijalna uključenost na zapadnom Balkanu: Zbirni izveštaj Ovaj izveštaj istražuje oblasti socijalne zaštite i socijalne uključenosti u zemljama zapadnog Balkana: Albaniji, Bosni i Hercegovini, Kosovu pod protektoratom Saveta bezbednosti UN rezolucije 1244, Crnoj Gori i Srbiji, a zasnovan je na seriji nezavisnih izveštaja koji su završeni avgusta 2008. godine. Izveštaj tretira ključne političke, ekonomske i demografske trendove, kao i funkcionisanje sistema tržišta rada i obrazovanja; socijalnu zaštitu sa aspekta finansiranja, kriterijuma i dostupnosti; opšte uslove života i rizične grupe u oblasti siromaštva i socijalne isključenosti; dostupnost penzija, zdravstvene zaštite i dugoročne zaštite. U izveštaju se analiziraju nejednakosti i diskriminacija koje su zasnovene na polnim razlikama, starosti, invalidnosti, etničkoj pripadnosti i seksualnoj orijentaciji, uz analizu prostorne (geografske) nejednakosti. U izveštaju su takođe, identifikovani budući izazovi u kontekstu modernizacije sistema socijalne zaštite i promocije koncepta socijalne uključenosti, koji su sadržani u revidiranim ciljevima dokumenta, Socijalna uključenost, Evropske unije.
xi
РЕЗИМЕ Социјална заштита и социјална укљученост на западном Балкану – Збирни извештај Овај извештај истражује области социјалне заштите и социјалне укључености у земљама западног Балкана; Албанији, Босни и Херцеговини, Косову под протекторатом Савета безбедности УН, резолуција 1244, Црној Гори и Србији. а заснован је на серији независних извештаја који су завршени августа 2008. године. Извештај третира кључне политичке, економске и демографске трендове као и функционисање система тржишта рада и образовања, социјалну заштиту са аспекта финансирања, доступности, и критеријума; опште животне услове и ризичне групе у области сиромаштва и социјалне искључености; доступност пензија, здравствене заштите и дугорочне заштите. У извештају се анализирају неједнакости и дискриминација које су засноване на полним разликама, старости, инвалидности, етничкој припадности и сексуалној оријентацији. У извештају су такође, идентификовани будући изазови у контексту модернизације система социјалне заштите и промоције концепта социјалне укључености, који су садржани у ревидираним циљевима документа Социјална укљученост, Европеске уније.
1
1: Economic, Demographic, Labour Market and Education Trends 1.1 Scope and Purpose of the Study This is a synthesis report drawing from a number of independent reports on social protection and social inclusion from pre-candidate countries and territories in the Western Balkans: Albania, Bosnia and Herzegovina, Kosovo Under United Nations Security Council Resolution (UNSC 1244)1, Montenegro, and Serbia, completed in August 2008. It also draws on previous studies on Candidate Countries (CC) for Croatia2 and the former Yugoslav Republic of Macedonia3. It follows the broad logic of an earlier synthesis report from a series of studies on the social protection systems in the, then, thirteen candidate countries of the European Union4, with more substantive chapters on pensions and health systems in line with the new set of common objectives on social protection and social inclusion agreed by the European Council in March 20065. Given their close proximity to and, in the case of Slovenia, shared legacy with, some of the countries and territories which are the focus of this report, where appropriate, comparisons are made with Bulgaria, Romania and Slovenia, as well as with the EU 27 as a whole (or EU 25 where full 27 data not available) and with the EU 12 (or sometimes 10 post-communist) New Member States (NMS). The main objectives of this report are to summarise in comparative perspective the key commonalities and differences regarding social protection and social inclusion in the Western Balkans and to identify key future challenges for the modernisation of social protection systems and for the fighting of poverty and social exclusion. In the remainder of Chapter 1, key political, economic, demographic and social trends are addressed, with a particular focus on labour markets, educational systems, gender relations, and the situation of minorities. The last two are cross-cutting themes like disability and spatial disparities which are also addressed, where necessary, in the subsequent chapters. Chapter 2 addresses social protection systems including the financing of, eligibility for and access to social assistance, social insurance and social services as well as addressing unemployment and family benefits. Chapter 3 analyses general living conditions and the risks of poverty and social exclusion as well as identifying the groups which are most vulnerable to poverty and social exclusion. Chapter 4 focuses on old age, survivors’ and disability pensions. Chapter 5 addresses access to health services and long-term care. Both chapters address issues of financing and sustainability as well as equity in the context of current and proposed reform efforts. Chapter 6 draws conclusions and notes the key challenges in terms of modernising responses to social exclusion and reforming social protection systems. Analysis is hindered by the lack of reliable statistics in some cases and, throughout, the lack of strictly comparable statistics. The absence of any reliable census data in Bosnia-Herzegovina and Kosovo clearly limit the reliability of any per capita figures, for example6. In this synthesis report, wherever possible, EU data sources, primarily through EUROSTAT, are utilised together with national official statistical office data, albeit with the proviso that much of this is not yet aligned with best European standards either in terms of data source nor in terms of key indicators. Data sets utilised by key international organisations including 1 Henceforth Kosovo. 2 http://ec.europa.eu/employment_social/social_inclusion/docs/2006/study_croatia_en.pdf 3 http://ec.europa.eu/employment_social/spsi/docs/social_inclusion/2007/fyrom_final_en.pdf. 4 http://ec.europa.eu/employment_social/news/2003/jan/report_05_en.pdf 5 http://ec.europa.eu/employment_social/social_inclusion/objectives_en.htm 6 For other data problems see the respective country reports.
2
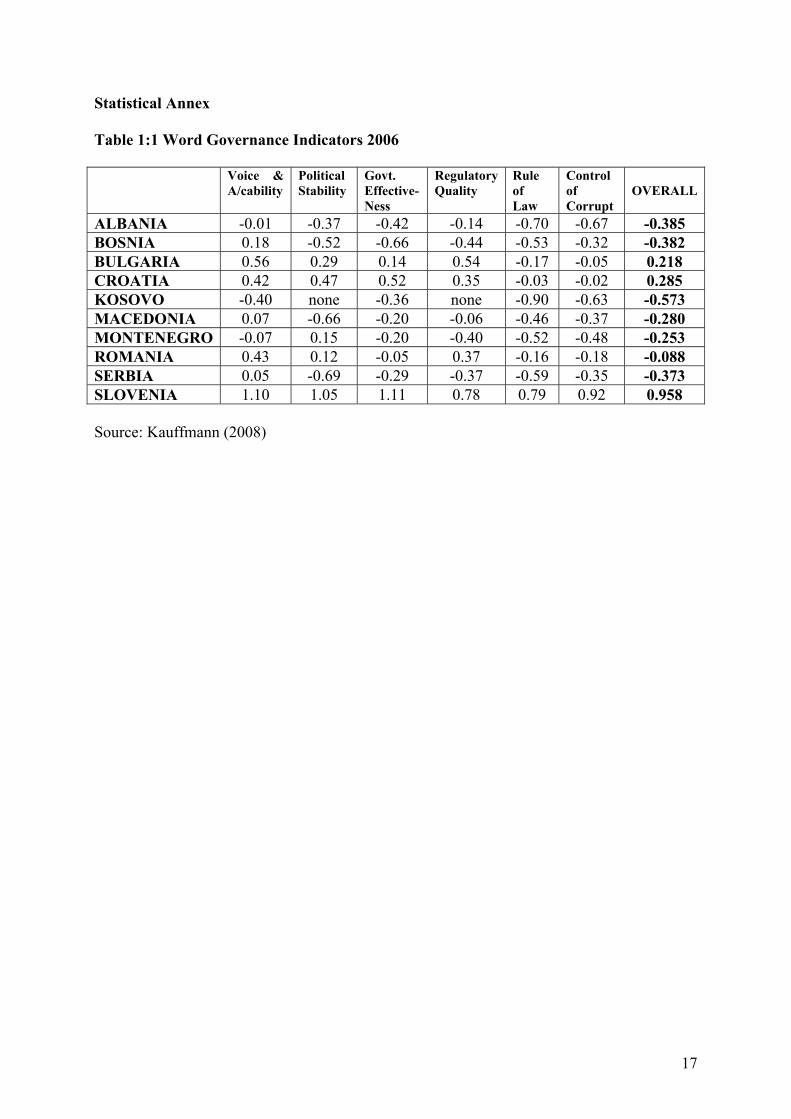
UNICEF’s TransMONEE data base, UNDP’s Human Development Index and related indicators, as well as those of the World Bank, are also utilised together with data from independent research institutes, as necessary. 1.2 Governance in Comparative Perspective The wars and conflicts since 1991, and the re-constitution of various states, mini-states and territories with a rather complex relationship to each other, indicate how political, social, cultural, economic and institutional arrangements have been profoundly destabilised, and how sovereignty is still heavily contested within the region (cf. Deacon and Stubbs, 2007; Clarke, 2008). The wars of the Yugoslav succession, beginning with the short conflict in Slovenia in 1991, spreading to Croatia from 1991 to 1995 and Bosnia-Herzegovina from 1992 to 1995 as well as the conflict in Kosovo and Serbia in 1999, the instability in the former Yugoslav Republic of Macedonia in 2001, and the crisis in Albania in 1997, saw a complex and changing mix of international humanitarian and security interventions. The conflicts and crises directly affected processes of social and political change and had dire economic consequences. Bosnia-Herzegovina, in particular, still has an extraordinary complex governance structure as a legacy of the Dayton Peace Agreement of December 1995, with power dispersed between two entities with only a weak central state. The status of Kosovo, which declared independence on 17 February 2008, but which remains subject to United Nations Security Council (UNSC) Resolution 1244, is also far from clear. Throughout the region, then, a process of state-building remains unfinished, there are simmering territorial disputes and many contiguous minorities living in one state but with an affiliation to another. ‘Normal’ social policy is complex in the context of disrupted governance arrangements and the existence of what have been termed ‘parallel power networks’ (Solioz, 2005; 80) based on the interweaving of formal and informal social practices and a circularity of elites in politics, business, and in some cases, in organised crime, working through patronage. The complexity of governance arrangements is reflected in, and indeed compounded by, the somewhat uneven relationship of different countries to EU membership. The Thessaloniki summit in June 2003 reinforced the European perspective of the Western Balkans, with support for membership in the future, and a clear package of financial assistance (European Commission, 2003). At the current time, Croatia is in the middle of negotiations and has a realistic chance of membership in 2011 or 2012, the former Yugoslav Republic of Macedonia has candidate status but, as yet, no membership negotiations, and Albania, Montenegro and, most recently Bosnia-Herzegovina and Serbia have Stabilisation and Association Agreements in place. In December 2008, Montenegro submitted an application for membership. Kosovo has a special EU partnership in place. The latest Enlargement strategy report from the Commission suggests: „The year ahead will be a crucial one in addressing challenges in the Western Balkans. The progress of the Western Balkan countries towards EU membership can be accelerated, provided they meet the necessary conditions. Croatia is expected to reach the final phase of accession negotiations by the end of 2009 if it has taken the necessary preparatory steps. Further reforms in the former Yugoslav Republic of Macedonia will bring the country closer to the EU. For the potential candidates, progress could result in candidate status when they have demonstrated their readiness.“ (European Commission, 2008; 2-3) The World Governance Indicators project aggregates information from diverse sources into six broad indicators: Voice and Accountability; Political Stability; Government Effectiveness;
3
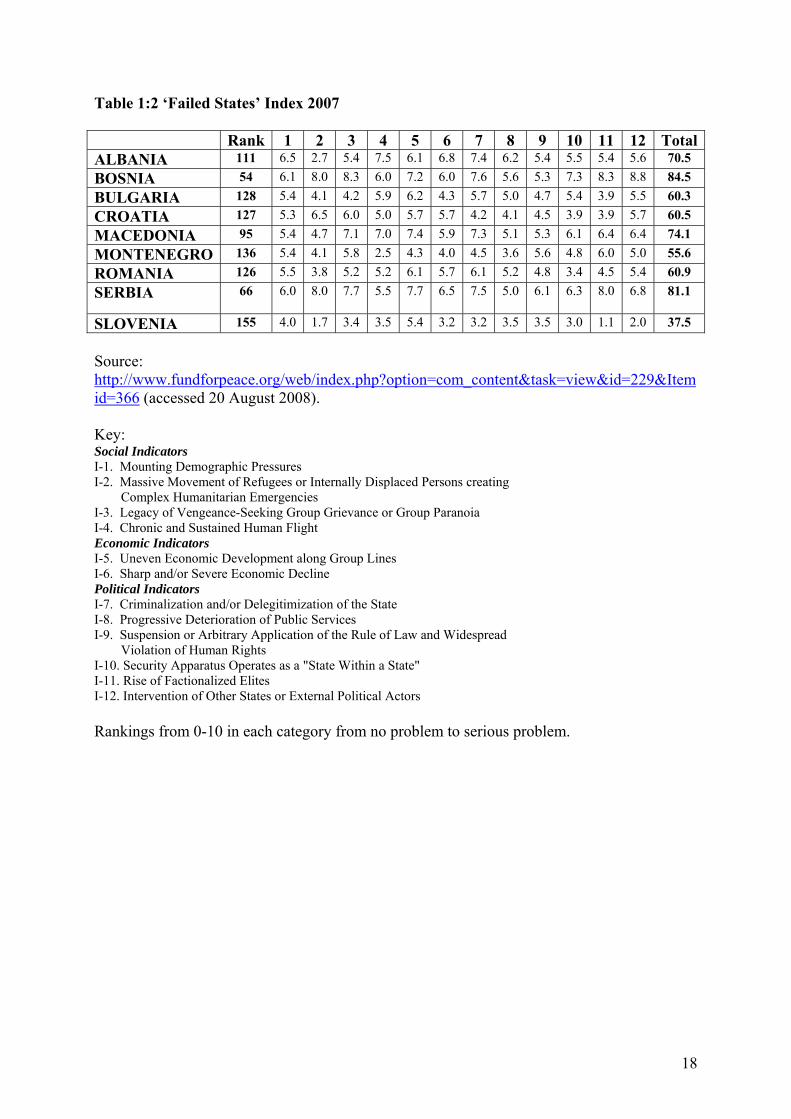
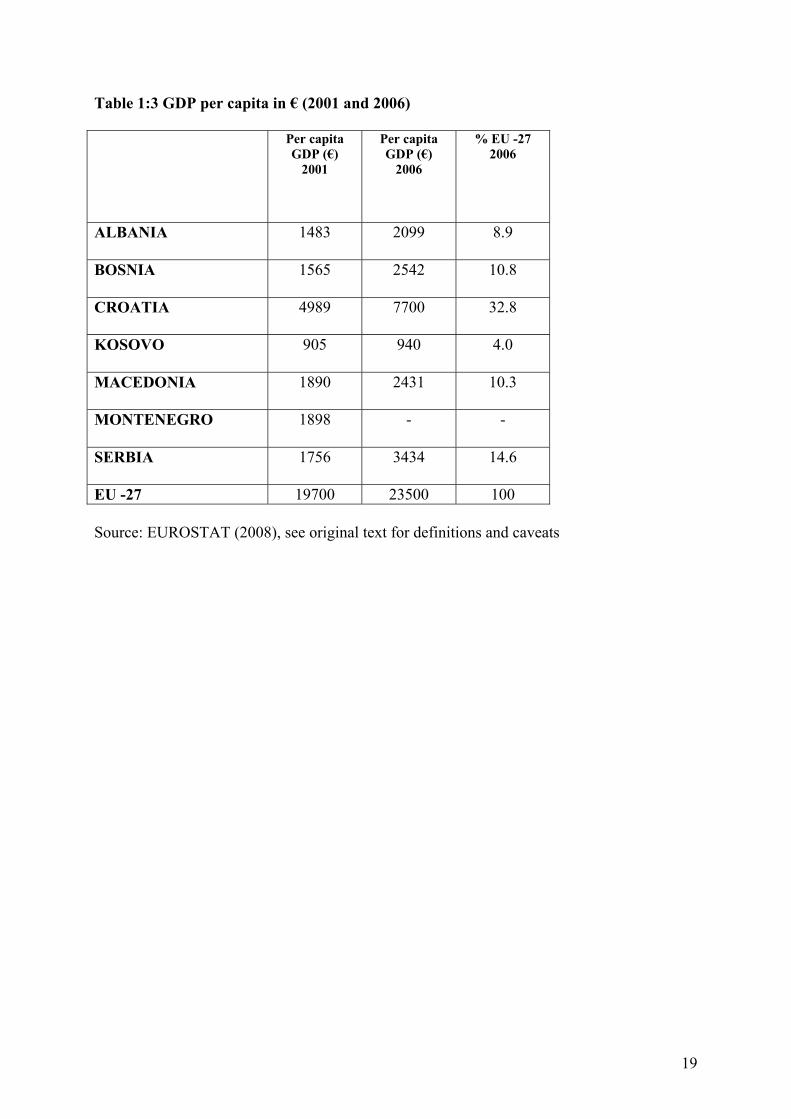
Regulatory Quality; Rule of Law; and Control of Corruption. The scores for the countries and territories of the region, plus Bulgaria, Croatia, the former Yugoslav Republic of Macedonia, and Romania are shown in Table 1:1 in the annex, together with an average overall governance score. Whilst such indices can be questioned methodologically, they show the extent of the gap in terms of governance between, particularly, Albania, Bosnia-Herzegovina, Kosovo and Serbia when compared with Slovenia, Croatia and Bulgaria. Importantly, all have negative indices for Control of Corruption, except for Slovenia. Notwithstanding the important contribution made by international agencies in social policy throughout the region and the, at times, dominant role played by these agencies in Kosovo and Bosnia-Herzegovina, one of the key preconditions for sustainable social policies is the existence of state capacity. The various ways in which state-building remains incomplete in the region is captured by the Fund for Peace’s Failed States Index for 2007 which ranks 177 countries (Kosovo is not included) along a number of social, economic and political indicators. (Table 1:2). Again, Slovenia stands out as a stable state a long way ahead of two groupings: Bulgaria, Croatia, Montenegro and Romania which have elements of state stability; and Albania, Bosnia-Herzegovina, Macedonia and Serbia which have a number of elements associated with ‘failed’ states. In a sense, it is the accumulation of governance problems which is significant, eroding the capacity of central and local state agencies to guarantee security and to secure equal access to social and other fundamental rights. The concept of ‘state-building’ is in danger of technicising the complex social and political engineering which is being attempted in parts of the region. The unfinished nature of this, not least in terms of processes within Bosnia-Herzegovina and the status of Kosovo, are also important factors which need to be addressed within a frame which links social policy with other discourses, notably security, refugee return, and democratisation (Deacon and Stubbs, 2007). Whilst it is true, as the International Commission on the Balkans commented in 2005, that the EU only has the capacity to absorb “reasonably functioning and legitimate states”, it is too harsh to suggest that “there are no more of these left in the region” (ICB, 2005; 8-9). Still, the EU’s relationship to much of the region is dominated by geo-political, reconstruction and capacity building imperatives. This means that the social dimension of association, accession and membership is sometimes not given sufficient attention although since the European Council meeting in Thessaloniki and the EU - Western Balkan summit in June 2003, there has been sustained EU commitment to viewing the region in a European perspective and to “further strengthening the privileged relations between the EU and the Western Balkans” (Council of the European Union, 2003). The lack of attention to social policy questions is mirrored by regional initiatives such as the Stability Pact and the new Regional Co-operation Council (RCC) (Stubbs, 2008; Deacon, Lendvai and Stubbs, 2007). 1.3 Main Macro-Economic and Fiscal Trends There is some limited data available through EUROSTAT on macro-economic trends in the region. Since 2005, Eurostat Unit E4 has collaborated with the National Statistical Institutes in the region to gather a range of data. In 2006, a Pocketbook was produced containing key data and trends up to 2003/4 (EUROSTAT, 2006). Subsequently, the Eurostat web site has some statistics up to and including 2006. In 2008, a new Pocketbook was produced with data up to 2006 (EUROSTAT, 2008). Kosovo Under UNSC 1244 is included separately although, for some data, Serbia and Montenegro are considered together. GDP per capita data for 2001 and 2006 are included in Table 1:3 in the Annex. It shows countries and territories which, with the exception of Croatia, have per capita GDP of only between 4% and 15% of the EU-
4
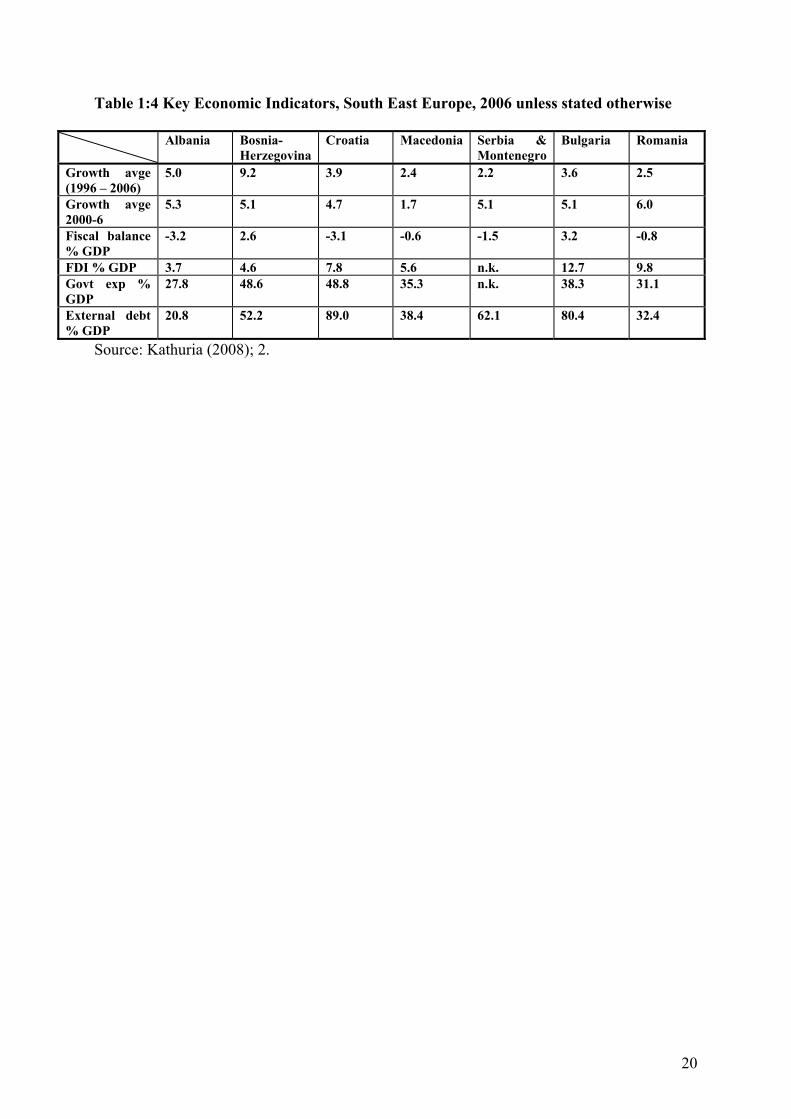
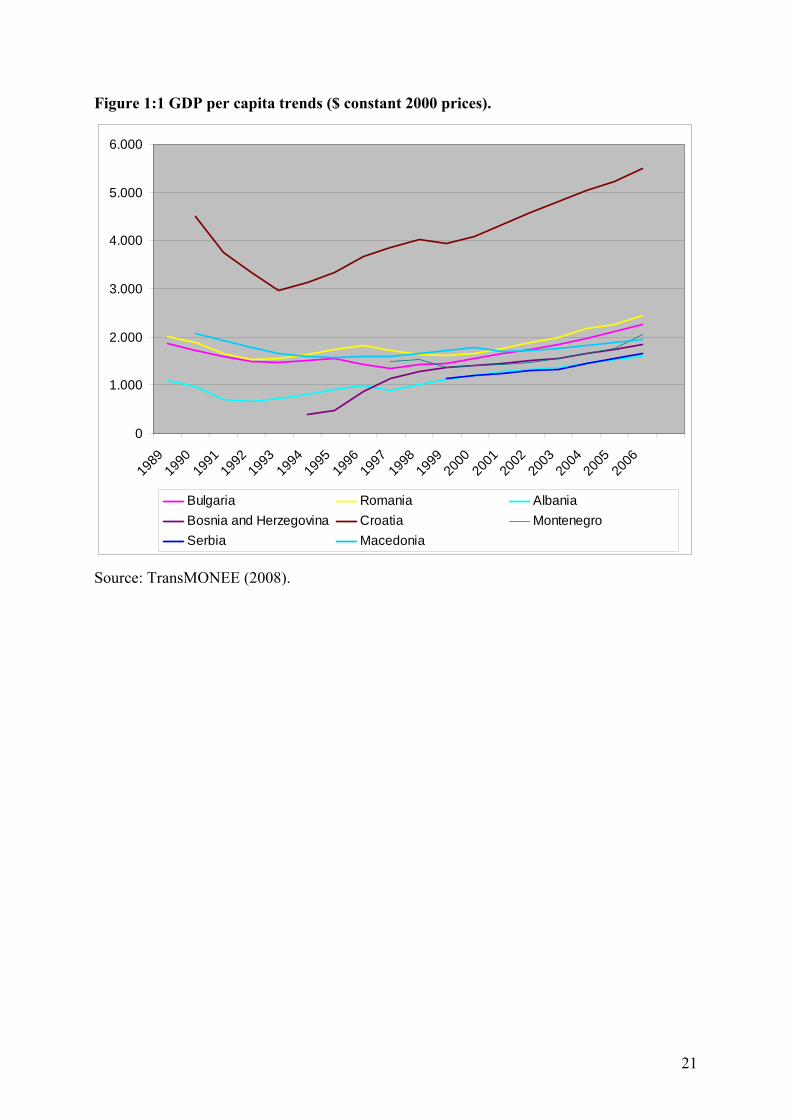
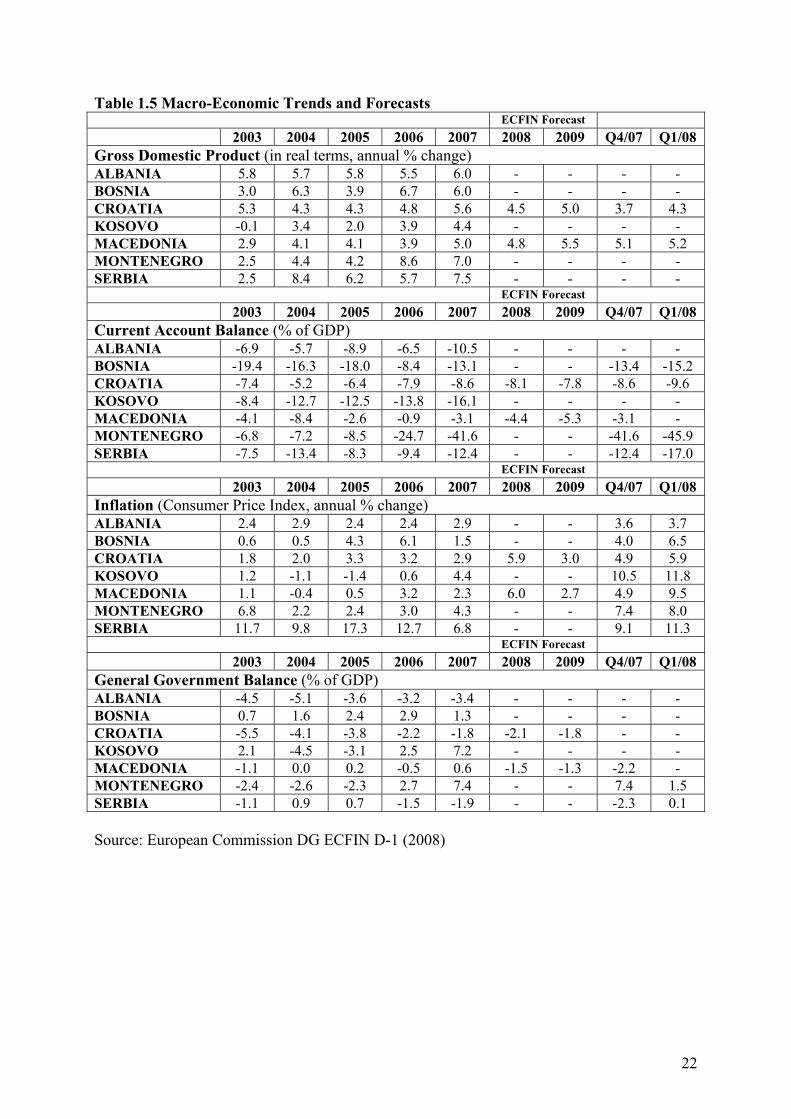
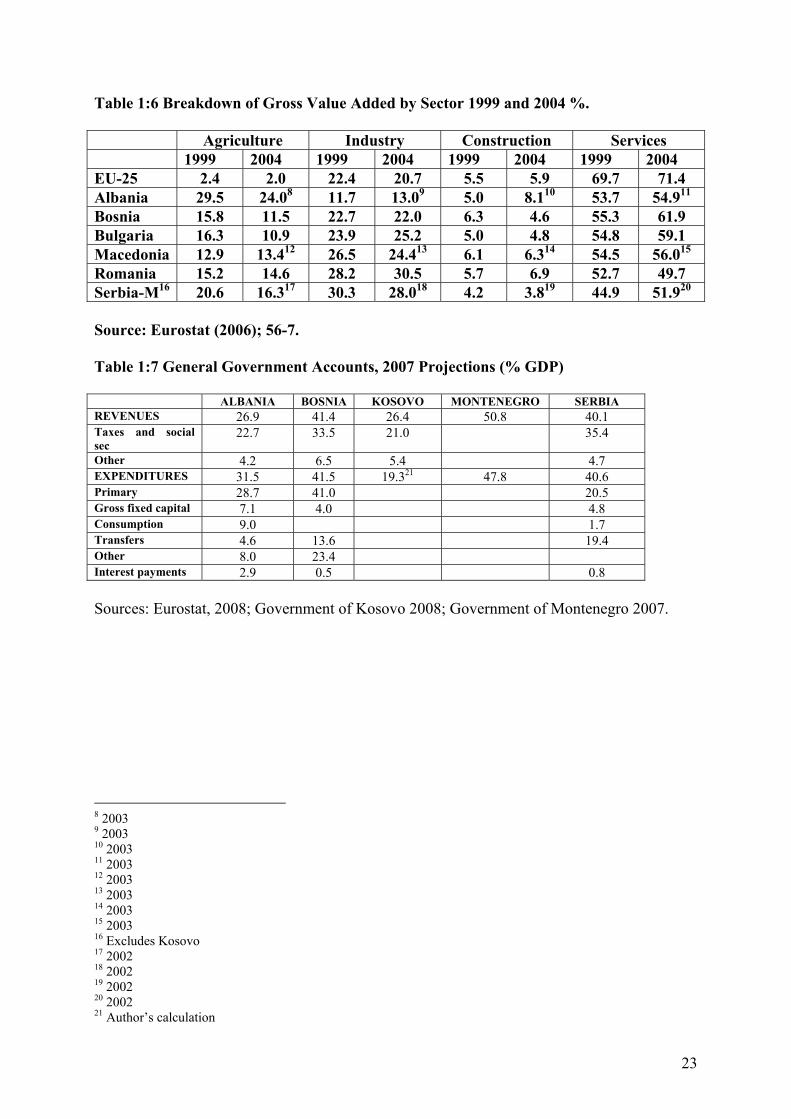
27, although this understates their relative weight if the data were expressed in PPS. In addition, the grey economy is not included in the potential candidate countries’ GDP figures. Table 1:4 uses World Bank data to show that the countries have had significant growth, particularly in the last few years, but also fairly high levels of government expenditure and of external debt. Figure 1:1 using UNICEF TransMONEE data, shows that the economies of most of the countries of the region did not recover to pre-1991 levels until the late 1990s at the earliest, with the former Yugoslav Republic of Macedonia and, perhaps also Serbia and Bosnia and Herzegovina, only now reaching 1991 levels. The Candidate and Pre-Accession Countries’ Economies Quarterly produced by DG ECFIN Unit D-1 is a very useful source of economic data on the region, including updated forecasts for the candidate countries. Data from the 2nd quarter of 2008 report, published in July 2008, give a clear picture of trends in the region on a number of key indicators, compiled together as Table 1:5 in the Annex. They show a pattern of consistent GDP growth in the last five years, uneven current account and general government deficits and, perhaps most worryingly, recent high inflation which, in part, been caused by higher import costs as a result of increased oil prices. Inflation rates for April and May 2008 show double digit inflation in Kosovo, Macedonia and Serbia and significant increases elsewhere. The ability of the Western Balkans economies to limit the effects of the global economic crisis may, already, lead to the need to revise downwards growth projections, a point we return to in the conclusions to this chapter. The 3rd quarter 2008 report hints at this, stating that “the international financial crisis has had only a limited impact on the economy and the financial sector – at least up to the second quarter of 2008. However, the significant widening of the current account deficit experienced by most countries raises the vulnerability to external shocks and is a source of concern as both external credit and FDI inflows are likely to slow as a result of the global financial crisis.“ (European Commission DG ECFIN 2008b; 3) In terms of the structure of the economy, most of the countries in the region still generate a high proportion of value added through agriculture, forestry and fishing although this has declined in recent years with a greater proportion of value added contributed by services and, to a lesser extent, industry and construction (Table 1:6). 2006 figures suggest that the proportion of agriculture and services is as follows: EU-27 2% - 72%; Croatia 7% - 62%; Bosnia and Herzegovina 10% - 46%; Macedonia 12% - 58%; Montenegro (2004 figures) 12% - 55%; Serbia 13% - 40%; and Albania (2005 figures) 21% - 58% (Eurostat 2008a). In terms of structures of revenue and expenditure, commitments regarding 2007 can be found in the Commission’s assessment of the Economic and Fiscal Programmes (EFPs) submitted by prospective candidate countries which were submitted by Albania, Bosnia-Herzegovina, Montenegro and Serbia in December 2007. Kosovo was not asked to submit an EFP but a similar exercise is undertaken in Kosovo’s recent Medium-term Expenditure Framework (Government of Kosovo, 2008). Table 1:7 summarises revenues and expenditure with only limited data for Kosovo and Montenegro. In addition, it is noteworthy that the Western Balkans is attracting significant Foreign Direct Investment (FDI), mainly due to privatisation although a recent paper suggests that the FDI:GDP ratio will drop from 10.5% in 2006 to 8,6% in 2007 covering on average only 60% of current account deficit, being much lower in Albania, Bosnia and Herzegovina, and Kosovo (Koro, 2007; 2). The author notes a deteriorating fiscal situation driven by increasing
5
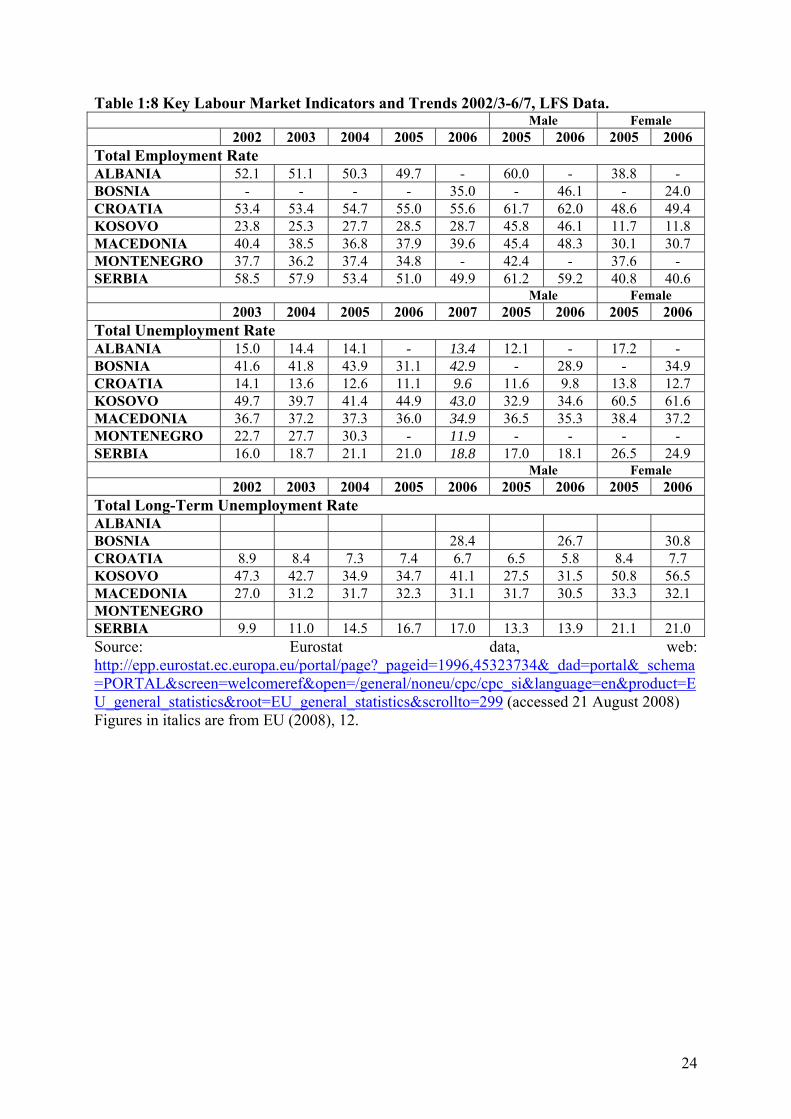
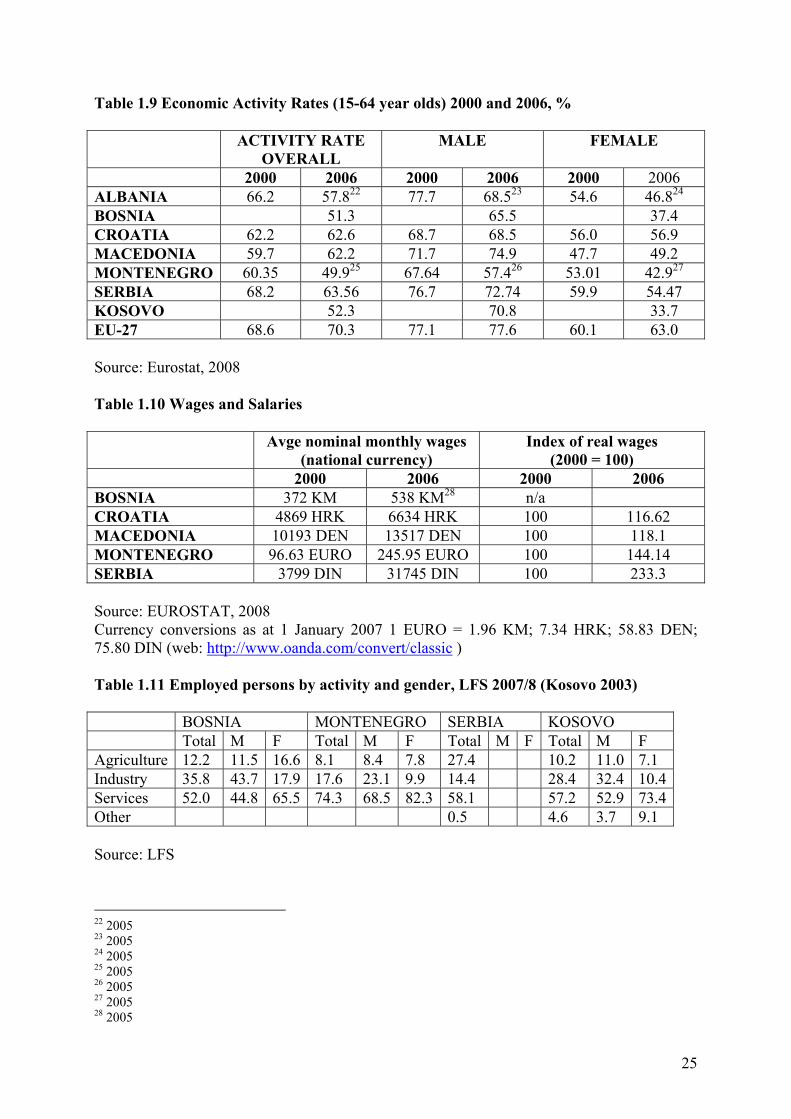
budgetary expenditures, although all countries are within the limits of Maastricht criteria budget deficits and general government indebtedness. 1.4 Labour Market Trends Labour market trends are difficult to capture fully in a region where there are large informal economies and significant migration patterns (ETF, 2007). Employment levels overall appear to be stagnating well below the EU average, with economic growth not translated fully into rising employment ratios, although the latest Labour Force Survey (LFS) data, albeit before the economic crisis, is showing the beginnings of some small increase in employment in the region. Employment ratios are particularly low for young people aged 15-24, and there are considerable gender differences, with employment ratios for women significantly below those for men. Activity rates are lower than those for the EU and, with the exception of Albania, unemployment rates significantly higher. Crucially, the ETF report cautions against reliance on official data, noting that “standard labour market indicators do not seem to be sufficiently informative in describing the functioning and performance of labour markets” (ETF, 2007; 10) because of vastly different quality of jobs, and the rise of informal, unstable and precarious employment such that many people have developed lifestyle and survival strategies which involve switching between “multiple employment statuses” which are not capable of being captured by Labour Force Survey (LFS) data. In the case of much of the Western Balkans, then, high levels of labour market mobility is more a consequence of these factors than an indication of a well functioning labour market, with large flows between formal and informal labour market statuses. The report notes the existence of three unstable labour market statuses: those in informal agricultural employment, often a buffer for those who cannot find formal employment; the unemployed, and ‘others’ consisting mainly of so-called ‘discouraged workers’ who are not classified as unemployed or studying. Overall, then, the suggestion, backed up by some data from Albania and Bosnia and Herzegovina, suggest low levels of labour market attachment, with only a minority of the working age population regularly employed in a non-precarious job. What appears to be happening as a result of uneven restructuring is the multiplication of labour markets and the hardening of disincentives to mobility between them. A process of deindustrialisation is occurring alongside a lack of progress in terms of restructuring of some state owned enterprises, and the expansion of a low-skill, low value added SME sector (ETF, 2007; 8). The report points to a division between high skilled transition in Croatia and, to an extent they argue, Serbia, and a low-skill development path elsewhere. Table 1.8 shows key labour market data from the latest available Eurostat databases complemented by 2007 ECFIN data for total Unemployment rate. Using administrative data, Table 1.9 shows how activity rates remain low throughout the region, particularly for women. Table 1.10 shows nominal monthly wages and changes over time. A recent report for the World Bank has calculated average total labour costs in 4 Western Balkans countries, including, separately, for the two entities in Bosnia and Herzegovina. Total labour costs range from 370 EURO per month in Macedonia to 523 EURO per month in FBiH, with BiH-RS (at 406 EURO); Montenegro (438 EURO) and Serbia (445 EURO) close to the unweighted average of 436 EURO (Arandarenko et al 2008). The report also compiles a table on minimum wage rules with minimum wage legislation in all the countries surveyed (in Macedonia only in the public sector) ranging from 52 EURO in Montenegro, or 20% of average net wage, to 157.95 EURO in BiH-FBiH or 55% of average net wage. Elsewhere in Albania, BiH-RS, Macedonia and Serbia, the minimum wage is around 40% of average net wage (ibid; 41).
6
Table 1.10 shows the distribution of employment between different sectors of the economy based on LFS data. The Albanian LFS uses a slightly different classification, so that it is hard to compare directly, although the 2007 LFS shows that 85% of employment is in the private sector, including 47% in agriculture (Albania SPSI report). Throughout the region, agriculture remains important in terms of employment, although its importance is decreasing. There is evidence that the share of flexible forms of employment is rapidly increasing, in particular temporary employment, especially for young workers, older workers, women with small children, unskilled workers, migrant workers and other vulnerable groups. In Croatia its share grew from 10% to 13% and in the former Yugoslav Republic of Macedonia from 10% to 18%, combined with a shortening of the average duration of fixed-term contracts (Nesporova, 2008). In the Western Balkans self-employment is a declining tendency – in Macedonia from 13% in 1997 to 10.9% in 2006, in Croatia from 21.1% in 1998 to 18.3% in 2006 (ibid). She notes that agency work is on the increase although still very low. In addition, the incidence of part-time employment remains low – below 10% in most of the region - due to its unpopularity among employers and workers, and is about half that of the EU-15. This all points to a deepening of labour market segmentation, with core male workers between 30 and 45 years of age relatively well protected, and others without contracts or with temporary contracts having little or no social security entitlements. Whilst overall job tenure has increased, Nesporova points out that the proportion of tenures under 1 year and over 10 years have both increased. Labour turnover has declined since 2000, indicating a certain stabilisation of national labour markets after a period of extensive enterprise restructuring in the crisis years of the 1990s. The latest Eurostat pocketbook provides updates of labour market statistics with some improvement in overall employment rates (% of 15-64 population in employment) but still with Croatia at 55.6% the only country close to an EU-27 rate of 64.4%. The others are: Serbia 49.9%; Albania (2005 data) 49.7%; Macedonia 39.6%; Bosnia-Herzegovina 35.0%; Montenegro (2005 data) 34.8%; and Kosovo 28.7% (Eurostat, 2008; 31). Some improvements in the overall employment rate of older workers, aged 55-64, can also be noted but again rates are well below the EU-27 for 2006 at 43.5%, with Croatia at 34.3%; Macedonia 27.9%; Bosnia-Herzegovina 30.6%, Serbia 32.6% and Kosovo (2005 data) 25.2% (ibid; 35). In terms of labour market reforms, it is possible to trace a broad reform model of flexibilisation although, even here, the process has been uneven and far from a fundamental shift ’from welfare to workfare’ (Bornarova et al, 2007). There has certainly been reform of legislation, with support from international organisations, in terms of flexibilising labour laws and introducing active labour market programmes ”encouraged time and again by the World Bank across the region” (Arandarenko, 2004; 41). There has also been some alternative advice, notably from the ILO and, crucially, the impacts of policies has been much less than was expected or advertised. Labour market institutions, well established in the region, have proven hard to reform. Increasingly, an agenda on those who are ’hard to reach’ has led to a focus on active labour market programmes although, overall, expenditures on such programmes have been extremely limited and evidence of improving employability sparse. The ETF report emphasises the key challenge in terms of developing inclusive, secure and flexible labour markets, promoting a model of ‘flexicurity’ which has been seen by some as ‘oxymoronic’ (Arandarenko, 2004; 49). Nevertheless, the importance of complementing traditional labour market policies with social protection, supply side policies and the development of human capital is clearly important, albeit hindered by the limited role of social partners, weak administrative capacity and the absence of policy co-ordination.
7
1.4.1 A Note on Informality There is general agreement that the informal economy is quite extensive in the Western Balkans although definitions, methods of calculation and estimates vary considerably. An early paper by Christie and Holzner (2004) using 2001 data provided figures for undeclared household income as a share of GDP which, as they are careful to point out, is not equivalent to so-called ‘missing GDP’. Rates ranged from 18% in Croatia, through 19% in Serbia and 21% in BiH, all below the estimate for the 8 post-communist NMS who joined the EU in 2004, Montenegro 27%, Bulgaria 34%, the former Yugoslav Republic of Macedonia 39%, Kosovo 45%, Romania 46% and Albania 52%, revised to 38% in a more recent paper (Christie and Holzner 2005). A recent study on Kosovo using the same methodology, now estimates Kosovo’s informal economy at between 27% and 35% of GDP (EAR 2007). In a revised version of the methodology, the original authors found Croatia’s concealed consumption to be only 11.1% of GDP, the lowest in Europe (Christie and Holzner, 2006). A recent OECD study on the Black Sea economies shows estimates of the informal economy as a % of GDP rising from 1999/2000 to 2002/3 for both Albania (from 33.4% to 35.3%) and for Serbia and Montenegro (from 36.4% to 39.1%) (OECD Development Centre, 2008; 68). There is general agreement that the informal economy probably accounts for between 25% and 35% of GDP in the Western Balkans (ETF, 2007; 23), above the EU average, around the level of Italy, and below the levels in Bulgaria and Romania. A World Bank report, using LSMS data for 2004, suggests that 76% of all employment in Albania was informal, some 69% of which is agricultural employment and the rest is split somewhat equally between waged informal work and self-employment in non-agriculture (World Bank, 2006; 63). Arandarenko et al (2008) use this figure of 75% and compare it with similar figures derived from the LFS for Bosnia and Herzegovina (42%), the former Yugoslav Republic of Macedonia (32%), Montenegro (27%) and Serbia (43%). As they note: “(F)ormality and informality in the region typically appear not as a binary choice, but rather along a spectrum of statuses, from full informality through semi-formality (agricultural employment; self-employment; double payrolls in many, especially small, private firms), to full formality seen most typically in the public sector.” (Arandarenko et al, 2008; 11). Crucially, little is known about coping strategies at the individual household level and the ways in which these may erode human capital with concomitant results on entry to the labour market in the future. The OECD report on the Black Sea region discusses the erosion of savings and assets which often occurs in non-insured households during an economic downturn, and the resorting to subsistence agriculture (OECD Development Centre, 2008; ch 6). In addition, friendship and social networks as a source of support are stretched at the very time when they are most needed and, as formal credit sources are unavailable, many resort to loan sharks which further increases insecurity. The following statement is, it would seem, no less applicable to the Western Balkans: „The adoption of specific household coping mechanisms has different impacts on different socio-economic groups. They can induce changes in gender roles within households and societies. They also have implications for spatial inequalities, notably widening the rural-urban divide, and on enhancing ethnic division. As different socio-economic groups adopt different coping mechanisms, these actions could affect the opportunities available to vulnerable and marginalised groups, such as the elderly and children.“ (OECD Development Centre, 2008; 108)
8
1.5 Demographic Trends Natural population trends are towards ageing populations throughout the region except for Albania and Kosovo. Key demographic indicators are compiled based on Eurostat data for 2006 in Table 1.12 below. Whilst Kosovo and Albania have higher dependency ratios currently, they also have higher populations under 15 than the other countries of the region. Hence, population projections are more favourable, in some ways, for these countries and territories, although even Albania is beginning to show the first signs of an ageing population and both have high levels of out-migration amongst the active population. Figure 1.2 shows World Bank estimates of the proportion of urban to rural populations in a number of countries in 2005. All the countries and territories of the region have experienced significant urbanisation in recent years, with the population of the major cities rising considerably. Figure 1:3 shows estimates of population density in the region, although the cut off points diverge from the 150 inhabitants per km2. In terms of forecasts, using the 2006 revisions from the United Nations Population Division and the medium variant (Table 1.13), only Albania is expected to have a higher population in 2050 compared to 2010. The figure for Serbia includes Kosovo and is, therefore, somewhat misleading. The population of Bosnia and Herzegovina is expected to fall by almost 20% in this period and that of Croatia by 18.5%. It should be borne in mind that the latest EUROSTAT projections for 2006 see the EU-27 as growing only by 2.1% from 2008, with an old age dependency ratio by 2060 of 53.5% (Eurostat 2008b). 1.5.1 Migration and Remittances
The countries of the Western Balkans, except for Albania, were countries of migration before the 1990s, with guest workers working in many Western European countries and a large diaspora spread throughout the world. There was significant labour migration, also, from the poorer to the wealthier republics of former Yugoslavia. In the period of the wars between 1991 and 1995 and during the crises of 1999 in Serbia and Kosovo, there was large scale forced migration with significant refugee and displaced populations. Subsequently, patterns of return and resettlement further complicated the picture. A true understanding of migration trends, therefore, need to move beyond aggregated data to look at the profile of migrants, the time of their migration, and the underlying cause. The IOM Migration profiles produced in late 2007, give the most complete picture of migration in 2006, using mainly UN, World Bank and official in-country data. All the countries in the region have considerably more emigrants (out-migration) than immigrants (in-migration) in their total population. This reaches as high as 38% of the Bosnian population, 27.5% of the Albanian population, 18% of the Croatian population and 16% of the population of the former Yugoslav republic of Macedonia. The emigration rate of the tertiary educated is also high throughout the region, reaching 28.6% in Bosnia and Herzegovina and around 20% of the population of Albania and the former Yugoslav Republic of Macedonia. Data on remittances are also contested and complex, with the latest World Bank figures still including Serbia, Montenegro and Kosovo together. 2006 figures show net incoming remittances reaching 16.5% of GDP in Bosnia-Herzegovina, 14.6% of GDP in Albania and 13.8% of GDP in Serbia and Montenegro. In terms of 2007 estimates, this makes them the 15th, 16th and 18th highest remittance receiving countries in the world. Figures for the former Yugoslav Republic of Macedonia and Croatia are much lower at 4.0% and 2.3% respectively.
9
It seems that in Montenegro, remittances currently account for some 7% of GDP and in Kosovo 13% of GDP (SPSI Country reports). New figures available for Croatia and Albania for 2007 show higher rates, increasing incoming remittances by, respectively, 45% and 9%. (World Bank, 2008). In all cases, these are under-estimates as they record only remittances sent through official channels. Taking migration as a key theme, it is apparent that younger and more skilled persons are increasingly likely to migrate, in part at least a recognition of the lack of opportunities in the formal labour market. The failure of social protection systems to respond to this phenomenon is particularly marked, in terms of channelling remittances, accumulating insurance-based contributions, allowing for portability of benefits, and in terms of advice regarding return to the domestic labour market. 1.5.2 A Note on Refugees and Displaced Persons
UNHCR estimates as at 1 July 2007 were that there were some 500,183 Refugees and Internally Displaced persons in the Western Balkans, including the former Yugoslav Republic of Macedonia. 382,163 were Internally Displaced Persons of one kind or another, although this is complicated by the independence of Montenegro and the stated independence of Kosovo which means that IDPs have a more contested status there. The breakdown by country and the origin of refugees is shown in Table 1.14 in the Annex. These figures also need to be treated with caution and, in themselves, fail to provide a clear picture of forced migration in the region. Crucially, the figures do not include persons from the region who are refugees or asylum seekers in other countries. Secondly, many displaced persons have been granted citizenship in the country to which they migrated. Thirdly, many people have established permanent residence away from their town or village where they were residing at the time of the conflicts and are, therefore, no longer classified as an IDP. As a UNDP study (2006) points out, thousands of families have faced multiple displacements, adding to vulnerability. In these contexts even ‘return’ can be a process linked with vulnerability and exclusion (UNDP, 2006; 69). 1.6 Educational Systems
Significant gains were made in both educational systems and outcomes in the former Yugoslavia and in Albania, after the Second World War. Under socialism, the educational system was formally free, and involved compulsory schooling from ages 6 to 7 to up to 14 or 15 in primary schools, with the first four years offering general studies and the second four years individually taught subjects and optional secondary education either in academic schools (gymnasia) or in vocational/technical education. Pre-school provision was widely available, although regionally quite varied, with facilities for infants up to 3 years of age linked to workplaces and more offering care to enable women to return to work than having any educational function. Kindergartens existed for children aged from 3 to school age. Higher education expanded also in this period. By 1981, in SFRY, illiteracy rates had fallen to 9.5% of the population, from 25.4% in 1948, albeit with some regional differences, ranging from 0.% in Slovenia and 5.6% in Croatia to 14.5% in Bosnia and Herzegovina and 17.6% in Kosovo. The proportion attending high schools rose in the same period from 0.6% to 5.6%, with much smaller regional variations (SFRY 1985). Critiques of education in Yugoslavia as perpetuating inequalities led to controversial reforms in 1980 which abolished the classical gymnasium but these reforms proved unpopular and were revoked in 1987.
10
By the end of the 1980s, educational systems were in real need of investment and modernisation. Instead war, economic crisis and the social costs of transition resulted in destruction of considerable education infrastructure and a decade of chronic under-investment, leading to lower standards, increased inequalities in terms of access, and some erosion of near universal access. In parts of the region, the curriculum became a site of ideological reform and the education of minorities and of vulnerable groups was not a priority. 1.6.1 Pre-School provision Rates of pre-school enrolment were lower in the former Yugoslavia and in Albania compared to the former Soviet Union and elsewhere in Central and eastern Europe, prior to transition. Based on UNICEF TransMONEE data which does not include Kosovo and which does not separate Serbia and Montenegro, rates of enrolment have improved throughout the region except in Bosnia and Herzegovina were they are reported to be extremely low. Levels fell throughout the region in the context of war and crisis but have risen subsequently. Crucially, aggregate figures, in all cases, mask significant differences by income quintiles and in terms of rates in urban areas being significantly higher than in rural areas. The ‘head start’ in terms of development which pre-school education is widely agreed to provide is enjoyed by only a minority of children in all the countries of the region (Table 1.15). In Albania, the urban-rural difference is high, 48.2% to 34.7%, with a 24 bps difference between rich and poor households (Albania SPSI study). Rates in Kosovo are reported to be as low as 10% of 3-6 year olds (Kosovo SPSI Study). The most recent TransMONEE figures show rates of enrolment of 0-2 year olds for Croatia (14.0%), Montenegro (11.7%); Serbia (10.2%) and Macedonia (5.4%) (UNICEF ICDC 2008). 1.6.2 Primary and Lower Secondary Education After some falls as a result of wars and crises, enrolment in primary and in most of the region lower secondary education is over 90%, with primary enrolment in terms of gross ratios reaching 98.4% in Macedonia, 94.5% in Croatia, 90.8% in Bosnia and Herzegovina, and 90.6% in Albania in 2005 (UNICEF TransMONEE 2007 database). There is a very significant drop-out, however, after compulsory schooling ends with only 15.3% of 15-18 year olds enrolling in upper secondary education in Bosnia and Herzegovina. Figures for Macedonia and Croatia are 29% and 23.4% respectively. Albania leads the way with a gross enrolment rate of 47.3% /ibid). Micro data for Albania show that school attendance, as opposed to enrolment, is highly influenced by income quintile and in terms of urban-rural differences (UNICEF 2006; 52). There is a consistent picture of problems for Roma children and children with disabilities in terms of enrolling and completing primary education. In terms of secondary education, issues of rural-urban differences and of poverty seem more pronounced. All the SPSI reports point to problems in terms of educational infrastructure, low motivation of teachers and high turnover rates, and the need in some urban centres to have two- or three-shift schooling. The Bosnia and Herzegovina report emphasises the problems of divided and segregated schooling for different ethnic groups. There have been many attempts throughout the region at reform of basic education, involving the introduction of 9 years of compulsory education, the right for private schools to exist, and a number of curriculum changes, as well as attempts at decentralisation and the introduction of quality standards. Nevertheless, as noted below and in chapter 6, the issue of consistent
11
investment in educational infrastructure, in reform to meet the needs of a modern economy and, in particular, in improving educational opportunities for vulnerable groups, will be necessary in order to promote social inclusion in the medium- and long-term. 1.6.3 Tertiary and Vocational Education Throughout the region, the numbers attending tertiary education has increased in the last fifteen years. In Albania there has been a four fold increase from 22,705 students in higher education in 1991/2 to 86,902 in 2007, some 60% of whom are women. The major problem in Albania is high drop out at the upper secondary level as young people leave to enter the labour market or migrate. There is also a strong male dominance in vocational education where 66% of the students are male (Albania SPSI Report). In Bosnia and Herzegovina figures are not reliable since there has been no census since 1991, but there seems to be some 6.5% of the working age population in tertiary education in 2007, compared to only 4% in 1991, with males outnumbering females (7.6% compared to 5.4%) but with the gap declining (BiH SPSI Report). In Montenegro according to the 2003 census, 7.5% of the population were university educated compared to only 5% in 1991, with a further 5.1% having some other tertiary education (Montenegro SPSI report).Serbia reports that only 4.4% of 20-24 year olds had completed tertiary education but this figure is low as some were still studying, of course. More worryingly, only 0.3% of the Roma population are reported to have high school or tertiary education experience (Serbia SPSI Report). The Kosovo report states that there has been a 31.2% increase in higher education enrolment from 1999 to 2004 (Kosovo SPSI Report). Using the TransMONEE database, a recent ETF report shows participation rates for 19-24 year olds in higher education (Table 1.16), and finds that all the Western Balkan countries lag some way behind Bulgaria and Romania and are very far behind Slovenia. The Western Balkan countries have expended higher education but at a much slower rate in the last few years, compared to the NMS countries. The report cautions that the definition of higher education varies considerably so that the table is more useful for showing changes over time in individual countries than for strict comparisons, however. An ETF report suggests that there remains a gap between reform intentions, legislative changes and real change on the ground (ETF, 2007; 85). It points to continued lack of attention to adult and continuing education and to careers guidance. Education and training is still slow to respond to the new competences required in the labour market. Vocational education based on traditional skills is over-loaded at the start of secondary education, with too little attention to post-secondary and higher educational vocational training. This reinforces a mismatch between supply and demand and ‘locks in’ too many young people into inappropriate vocational education. There are problems of governance in terms of finding the appropriate scale and level of decentralisation of vocational training and poor co-ordination between Ministries and with social partners. There is still only limited attention to vulnerable groups in terms of equity considerations, made worse by financing initiatives which reinforce regional inequalities and rely on increased marketisation. 1.6.4 Educational Expenditures and Attainment Public expenditures on education as a percentage of GDP tend to be below the EU average, with Eurostat data suggesting a range from 3.2% in Albania, through to 4.6% in Montenegro (Eurostat, 2008). These are similar to data from the World Bank for average expenditures between 1996 and 2002 (World Bank, 2006), such that underinvestment in education in
12
countries with relatively low GDP and recovering from conflicts, appears to be a long-term phenomenon. The current TransMONEE index suggests that in 2006 expenditures in the former Yugoslav Republic of Macedonia were 2.9% of GDP; in Albania 3.0%; in Serbia 3.5% and in Croatia 4.5%. Whilst these are similar to Bulgaria and Romania (4.0% and 3.5% respectively), they fall some way below levels in Slovenia (6.0%) and other NMS countries (UNICEF Innocenti, 2007). Expenditure in the former Yugoslav Republic of Macedonia has fallen more than 30% in real terms since 1991 . In strategic documents, the countries all have ambitious targets raised expenditure to between 5% and 6.5%, mainly on innovative higher education. Part of this appears to be reflected in increases in the share of education as a proportion of public expenditures (ETF, personal communication). In terms of educational attainment, Croatia, Montenegro and Serbia were included in the 2006 PISA (Programme for International Student Assessment) assessment that included 57 countries from the OECD and beyond. Tests on reading, mathematics and science are administered to between 4,500 and 10,000 15-year-olds in schools throughout the participating countries. Table 1.17 shows results on reading and maths and the influence of socio-economic status on science results. These show Croatia performing as well as the OECD average but Serbia and Montenegro doing less well. Significantly, socio-economic status explains less of the variance in science performance than in OECD countries, suggesting that educational inequalities are still working themselves out in the transition. 1.7 The Position of Vulnerable ‘ethnicised’ groups The concepts of ‘ethnicity’ and of ‘minorities’ are heavily contested and controversial terms throughout the countries and territories of South East Europe, reflecting geo-political changes including the break-up of Yugoslavia and the wars which went along with it. It is hard to find an acceptable term to cover the range of cases, but the notion of vulnerability linked to a political construction of ethnicity (as in ‘ethnicisation’) is, perhaps, the least problematic alternative. These contestations are reflected in problems with definition, means of assessment, estimates of numbers and, crucially, juridico-constitutional status of different groups in different countries in the region. Practices sometimes de facto and even de jure distinguish between different groups according to whether they are so-called ‘autochthonous’ or not, their perceived connection to a different ‘homeland’, and in terms of their proportion in a particular sub-national region (cf. Marko (ed), 2008). Even when there have been recent censuses, there remain disputes about the size of particular groups, not least as a result of negative perceptions which may lead to lower levels of self-declaration. The political situation of vulnerable ‘ethnicised’ groups remains problematic in much of the region, as does access to education and to the labour market. Broadly speaking, there are three different kinds of such groups in the regions of the Western Balkans. The first are ‘national minorities’ who find themselves in a minority in particular post-Yugoslav Republics and whose constitutional rights to formal equality are not always realised in practice. In Bosnia-Herzegovina, the situation is complicated by the existence of two entities and 10 cantons in which one of the three ‘constitutive peoples’ (Bosniak Muslims, Serbs and Croats) dominate politically. The second are the Roma population, sometimes referred to as Roma and Sinti or, as in Albania and Kosovo, as Roma, Ashkali and Egyptians. Estimates of the number of Roma in the region vary enormously but, in all cases, as a recent UNDP report suggests (UNDP, 2006; 12), expert estimates exceed the last census figures. The breakdown of Roma in the region is given in Table 1.18 below. The third are what a recent Minority Rights Group report terms ‘smaller minorities’ (Bokulić and Kostadinova, 2008), often linguistic minorities whose needs are sometimes ignored in the context of more populous groups.
13
This report, whilst acknowledging that EU association has been a catalyst for change in some respects, notes the lack of attention to minority rights issues in EU Progress Reports (Bokulić and Kostadinova, 2008). The authors criticise the lack of ethnicised data, the lack of mainstreaming of minority issues into reporting on education and employment, and the lack of a focus on the inter-relationship between ethnicity and gender issues. One could go further and suggest that very few studies focus on the specific needs of those members of vulnerable ethnicised groups who are disabled and/or elderly. Poverty, long-term unemployment, social and spatial segregation, political and social marginalisation affect particularly vulnerable ethnicised groups in the region. Responding to diversity and division pose new dilemmas and challenges to the countries in their quest for political and economic stability. The need to build cohesive societies based on reconciliation, non-discrimination, equal opportunities and cultural diversity is a major challenge in the context of fulfilling the criteria for EU membership. Educational deficits and underachievement, as well as skill gaps among vulnerable ethnic groups in the Western Balkan region emerge as both a cause and effect of unemployment, low incomes and other multiple deprivations and social exclusion. Education and training present a key challenge to sustainable and effective inclusive policies in the ethnically diverse Western Balkan countries and territories. ETF reports have identified a number of common themes in the whole region, including: the lack of pre-school education; divisive curricula in mainstream education; problems in realising rights to first language education; distorted curricula; segregated schooling for some groups; cultural stereotypes in vocational training and preparation for work; and lack of minority teachers and mentors. Overall, there is still a lack of a positive and consistent emphasis on inter-cultural education and training. In many ways, deficits in education and in terms of access to the labour market for minority groups are the key to exclusion, and challenging these is a key to promoting social inclusion. In terms of vocational training, many of the general issues identified above are particularly acute for vulnerable ethnic groups (ETF, 2008). A UNDP report on Roma in South East Europe (UNDP, 2006) shows clearly the inter-relationship between poverty, education, employment, health and education, using sample survey data. It shows, clearly, the additional disadvantages Roma face over other vulnerable groups living nearby. It argues for a concerted effort to break the cycle of dependency, in particular through a long-term investment in education of Roma, desegregation of schooling, additional language support and incentives for families to commit to their children’s schooling. Throughout the SPSI reports, however, there is a consistent picture of action plans and strategies on Roma not being adequately followed through so that there may well be a need to re-think policies and, above all, secure the necessary political and financial commitment to long-term investment. 1.8 Gender Relations
In socialist Yugoslavia, gender equality was an explicit policy goal albeit one which, perhaps, was not pursued as a priority (Ramet, 1998; 5). In much of the region, sexualised violence was a significant practice during the conflicts and transition brought with it what has been termed a ‘repatriarchalisation’ as part of a ‘retraditionalisation’ of society in which many gains in terms of gender equality were lost. A recent OSI report (OSI, 2006) highlights some of the gaps between European standards and current practice in South East Europe in a number of areas. It suggests that even were gender equality legislation is in place, this is not yet fully institutionalised or implemented. Gaps remain in terms of issues such as equal pay;
14
equal treatment in employment, training and working conditions; and rights for pregnant workers and returning mothers. This and other reports point to an increasing ‘feminisation’ of poverty; the rise of female headed households; higher levels of female unemployment; the reduction in reproductive rights,; increased ‘double burden’ of worker and carer in the context of the collapse of formal support structures; and increase gender-based violence. In addition, women’s political representation remains low, both in terms of women as Ministers and women in parliament. Figures from the Gender Task Force of the Stability Pact are reproduced as Table 1.19. UNDP Gender Development Indices rank Bosnia-Herzegovina in 66th place and Albania in 68th, just above the former Yugoslav Republic of Macedonia, suggesting that much progress is still to be made in terms of gender equality in the region (UNDP, 2008). 1.9 Conclusions and key challenges This chapter has highlighted a number of key issues highly relevant to questions of social protection and social inclusion in the Western Balkans. In terms of statistical data there are three inter-related problems. The first is the absence of data, in part the result of the lack of a recent reliable population census which renders all per capita figures problematic and makes trend-based forecasting incredibly difficult. The second is the absence of data collected according to best European Union practice. This is being tackled as part of the process of stabilisation and association but will require much more time to be completed. The third is the fact that statistics gathered from what might be termed ‘normal’ data sets may distort the picture because of levels of informality in the economy, as well as the existence of large-scale migrant remittances. All of these problems apply at the national aggregated level but, to an extent, are even more relevant when the issue of concerning smaller sub-sets of the population who may be at greatest risk of social exclusion. The need for micro-studies complementing large-scale survey data is all the more acute in this context. In addition, of course, raw statistics tell us little or nothing about short- and long-term coping strategies which can only be captured by more qualitative studies. The second key point is that the studies from which this synthesis report derives were completed before the onset of the global economic and financial crisis. At the very least, this crisis threatens continued optimism about economic growth reflected in most of the country studies. The latest monthly reports from the Vienna Institute for International Economic Studies suggest a rather uneven impact of the crisis on the region (WIIW, 2008)7. Albania, in part because of its lack of integration into international markets has forecast GDP growth in 2009 of 4% instead of 6% and, providing the country can maintain its exchange rate, prospects are said to be good for a return to 6% growth in 2010. LFS unemployment rates are still forecast to fall from 13% in 2008, to 12% in 2009 and 11% in 2010. The report also suggests that migrant remittances will fall. The Albania SPSI team notes that increased public investments (especially on infrastructural projects), increased wages and pensions by 15%, and a total budget increase of 4.6% in 2009 as compared with 2008 are measures to boost demand and help alleviate poverty, especially among elderly people. The Government budget allocates spending on unemployment benefits equal to 0.1% of GDP, while economic aid budget spending is 1.2% of GDP. There is a missing plan attached to the government budget as a contingency measure against the possible effects of the economic and financial
7 The fourth quarter 2008 EU Candidate and Prospective Candidate Countries Economies Quartely report from DG-ECFIN were published as this report was completed. The reports can be found at: http://ec.europa.eu/economy_finance/db_indicators/db_indicators9243_en.htm
15
crisis that may appear in increased bankruptcy in business and increased unemployment. There are also no measures as concerning the liquidity level in the economy, no plan of injected money except those planned as spending, all under the assumption of a healthy and well capitalized financial and banking system. For Bosnia-Herzegovina, the prognosis is for modest growth in 2009 (3% in 2009 and 4% in 2010), with the prospect of a credit crunch as significant number of people withdraw savings despite central bank guarantees. LFS unemployment rates are forecast to rise from 23.4% in April 2008 to 26% in 2009 and 27% in 2010. The report notes the possibility of recession in the context of decreased remittances, reduced FDI and continued wage growth. In Montenegro, strong growth is forecast to be cut, mainly as a result of decreased demand for key exports, with 6% growth in 2008 now forecast to be halved to 3% in 2009 and 2010. FDI is also expected to slow. The impact on the labour market is unclear, in part as a result of the Government holding back some 10% of GDP as a possible fiscal stimulus. The WIIW forecast is for LFS unemployment to rise from 18% in 2008 to 19% in 2009 and 20% in 2010. The report is highly pessimistic about Serbia in the context of likely declines in industrial production and in agricultural exports. The Government still forecasts 3% growth in 2009 as in 2008, which WIIW considers “a tall order” and suggests that its own forecasts of 2% growth in 2009 and 2010 may need to be revised downwards in the first quarter of 2009. Lay-offs are occurring in both the private and public sectors, and LFS unemployment is forecast to rise from 21% I October 2008 to 23% in 2009 and 2010. In addition, there are problems in the banking sector with currency instability, a flight from the dinar to the Euro, and decreased deposits. The SPSI notes that the Government’s response has been somewhat declaratory, with social security payments guaranteed for 10 months. There are some measures for boosting exports and some measures to reduce the fiscal burden, relating to health insurance debts. There are no contingency plans in the event of rising unemployment, however. The picture for Kosovo is seen as difficult to assess because of a lack of data and the continued reliance of the economy on remittances and international aid. The biggest potential risk is that foreign investment in recent privatisations, notably the energy sector, may not materialise in the context of the global crisis. Whilst no exact forecasts are made, growth is seen as possible to continue at around 6% per year, but with no appreciable reduction in unemployment. The third point, which relates to the changed context, is that this report shows how educational systems and labour markets are key to the allocation of life chances and, currently, are key drivers of inequalities and of social exclusion in the region, separately and together in terms of the transition from school to work. Investment in education for vulnerable groups, a closer linkage between education and the needs of the labour market, and job creation measures would all, therefore, be policy measures which could have a significant impact on social inclusion. Crucially, however, the issue of labour market restructuring is still incomplete in the region and is further complicated by a significant level of informality and by significant out-migration. A more holistic approach to these questions would, then, also consider how to channel private remittances for public purposes and also how to support potential returning migrants to reintegrate into the labour market. These issues are important for the whole population but issues of educational and employment opportunities are particularly important for women, for young people, for older people, for vulnerable ethnicised groups and for people with disabilities. As noted in this report, this are not separate

16
categories so that it is also important to address the needs of individuals who may face multiple disadvantage.
17
Statistical Annex Table 1:1 Word Governance Indicators 2006 Voice &
A/cability Political Stability
Govt. Effective- Ness
RegulatoryQuality
Rule of Law
Control of Corrupt
OVERALL
ALBANIA -0.01 -0.37 -0.42 -0.14 -0.70 -0.67 -0.385 BOSNIA 0.18 -0.52 -0.66 -0.44 -0.53 -0.32 -0.382 BULGARIA 0.56 0.29 0.14 0.54 -0.17 -0.05 0.218 CROATIA 0.42 0.47 0.52 0.35 -0.03 -0.02 0.285 KOSOVO -0.40 none -0.36 none -0.90 -0.63 -0.573 MACEDONIA 0.07 -0.66 -0.20 -0.06 -0.46 -0.37 -0.280 MONTENEGRO -0.07 0.15 -0.20 -0.40 -0.52 -0.48 -0.253 ROMANIA 0.43 0.12 -0.05 0.37 -0.16 -0.18 -0.088 SERBIA 0.05 -0.69 -0.29 -0.37 -0.59 -0.35 -0.373 SLOVENIA 1.10 1.05 1.11 0.78 0.79 0.92 0.958 Source: Kauffmann (2008)
18
Table 1:2 ‘Failed States’ Index 2007 Rank 1 2 3 4 5 6 7 8 9 10 11 12 TotalALBANIA 111 6.5 2.7 5.4 7.5 6.1 6.8 7.4 6.2 5.4 5.5 5.4 5.6 70.5 BOSNIA 54 6.1 8.0 8.3 6.0 7.2 6.0 7.6 5.6 5.3 7.3 8.3 8.8 84.5 BULGARIA 128 5.4 4.1 4.2 5.9 6.2 4.3 5.7 5.0 4.7 5.4 3.9 5.5 60.3 CROATIA 127 5.3 6.5 6.0 5.0 5.7 5.7 4.2 4.1 4.5 3.9 3.9 5.7 60.5 MACEDONIA 95 5.4 4.7 7.1 7.0 7.4 5.9 7.3 5.1 5.3 6.1 6.4 6.4 74.1 MONTENEGRO 136 5.4 4.1 5.8 2.5 4.3 4.0 4.5 3.6 5.6 4.8 6.0 5.0 55.6 ROMANIA 126 5.5 3.8 5.2 5.2 6.1 5.7 6.1 5.2 4.8 3.4 4.5 5.4 60.9 SERBIA 66 6.0
8.0 7.7 5.5 7.7 6.5 7.5 5.0 6.1 6.3 8.0 6.8 81.1
SLOVENIA 155 4.0 1.7 3.4 3.5 5.4 3.2 3.2 3.5 3.5 3.0 1.1 2.0 37.5 Source: http://www.fundforpeace.org/web/index.php?option=com_content&task=view&id=229&Itemid=366 (accessed 20 August 2008). Key: Social Indicators I-1. Mounting Demographic Pressures I-2. Massive Movement of Refugees or Internally Displaced Persons creating Complex Humanitarian Emergencies I-3. Legacy of Vengeance-Seeking Group Grievance or Group Paranoia I-4. Chronic and Sustained Human Flight Economic Indicators I-5. Uneven Economic Development along Group Lines I-6. Sharp and/or Severe Economic Decline Political Indicators I-7. Criminalization and/or Delegitimization of the State I-8. Progressive Deterioration of Public Services I-9. Suspension or Arbitrary Application of the Rule of Law and Widespread Violation of Human Rights I-10. Security Apparatus Operates as a "State Within a State" I-11. Rise of Factionalized Elites I-12. Intervention of Other States or External Political Actors Rankings from 0-10 in each category from no problem to serious problem.
19
Table 1:3 GDP per capita in € (2001 and 2006) Per capita
GDP (€) 2001
Per capita GDP (€)
2006
% EU -27 2006
ALBANIA 1483 2099
8.9
BOSNIA 1565 2542
10.8
CROATIA 4989 7700
32.8
KOSOVO 905 940
4.0
MACEDONIA 1890 2431
10.3
MONTENEGRO 1898
- -
SERBIA 1756 3434
14.6
EU -27 19700 23500 100 Source: EUROSTAT (2008), see original text for definitions and caveats
20
Table 1:4 Key Economic Indicators, South East Europe, 2006 unless stated otherwise
Albania Bosnia- Herzegovina
Croatia Macedonia Serbia & Montenegro
Bulgaria Romania
Growth avge (1996 – 2006)
5.0 9.2 3.9 2.4 2.2 3.6 2.5
Growth avge 2000-6
5.3 5.1 4.7 1.7 5.1 5.1 6.0
Fiscal balance % GDP
-3.2 2.6 -3.1 -0.6 -1.5 3.2 -0.8
FDI % GDP 3.7 4.6 7.8 5.6 n.k. 12.7 9.8 Govt exp % GDP
27.8 48.6 48.8 35.3 n.k. 38.3 31.1
External debt % GDP
20.8 52.2 89.0 38.4 62.1 80.4 32.4
Source: Kathuria (2008); 2.
21
Figure 1:1 GDP per capita trends ($ constant 2000 prices).
0
1.000
2.000
3.000
4.000
5.000
6.000
1989
1990
1991
1992
1993
1994
1995
1996
1997
1998
1999
2000
2001
2002
2003
2004
2005
2006
Bulgaria Romania AlbaniaBosnia and Herzegovina Croatia MontenegroSerbia Macedonia
Source: TransMONEE (2008).
22
Table 1.5 Macro-Economic Trends and Forecasts ECFIN Forecast
2003 2004 2005 2006 2007 2008 2009 Q4/07 Q1/08 Gross Domestic Product (in real terms, annual % change) ALBANIA 5.8 5.7 5.8 5.5 6.0 - - - - BOSNIA 3.0 6.3 3.9 6.7 6.0 - - - - CROATIA 5.3 4.3 4.3 4.8 5.6 4.5 5.0 3.7 4.3 KOSOVO -0.1 3.4 2.0 3.9 4.4 - - - - MACEDONIA 2.9 4.1 4.1 3.9 5.0 4.8 5.5 5.1 5.2 MONTENEGRO 2.5 4.4 4.2 8.6 7.0 - - - - SERBIA 2.5 8.4 6.2 5.7 7.5 - - - -
ECFIN Forecast 2003 2004 2005 2006 2007 2008 2009 Q4/07 Q1/08 Current Account Balance (% of GDP) ALBANIA -6.9 -5.7 -8.9 -6.5 -10.5 - - - - BOSNIA -19.4 -16.3 -18.0 -8.4 -13.1 - - -13.4 -15.2 CROATIA -7.4 -5.2 -6.4 -7.9 -8.6 -8.1 -7.8 -8.6 -9.6 KOSOVO -8.4 -12.7 -12.5 -13.8 -16.1 - - - - MACEDONIA -4.1 -8.4 -2.6 -0.9 -3.1 -4.4 -5.3 -3.1 - MONTENEGRO -6.8 -7.2 -8.5 -24.7 -41.6 - - -41.6 -45.9 SERBIA -7.5 -13.4 -8.3 -9.4 -12.4 - - -12.4 -17.0
ECFIN Forecast 2003 2004 2005 2006 2007 2008 2009 Q4/07 Q1/08 Inflation (Consumer Price Index, annual % change) ALBANIA 2.4 2.9 2.4 2.4 2.9 - - 3.6 3.7 BOSNIA 0.6 0.5 4.3 6.1 1.5 - - 4.0 6.5 CROATIA 1.8 2.0 3.3 3.2 2.9 5.9 3.0 4.9 5.9 KOSOVO 1.2 -1.1 -1.4 0.6 4.4 - - 10.5 11.8 MACEDONIA 1.1 -0.4 0.5 3.2 2.3 6.0 2.7 4.9 9.5 MONTENEGRO 6.8 2.2 2.4 3.0 4.3 - - 7.4 8.0 SERBIA 11.7 9.8 17.3 12.7 6.8 - - 9.1 11.3
ECFIN Forecast 2003 2004 2005 2006 2007 2008 2009 Q4/07 Q1/08 General Government Balance (% of GDP) ALBANIA -4.5 -5.1 -3.6 -3.2 -3.4 - - - - BOSNIA 0.7 1.6 2.4 2.9 1.3 - - - - CROATIA -5.5 -4.1 -3.8 -2.2 -1.8 -2.1 -1.8 - - KOSOVO 2.1 -4.5 -3.1 2.5 7.2 - - - - MACEDONIA -1.1 0.0 0.2 -0.5 0.6 -1.5 -1.3 -2.2 - MONTENEGRO -2.4 -2.6 -2.3 2.7 7.4 - - 7.4 1.5 SERBIA -1.1 0.9 0.7 -1.5 -1.9 - - -2.3 0.1 Source: European Commission DG ECFIN D-1 (2008)
23
Table 1:6 Breakdown of Gross Value Added by Sector 1999 and 2004 %.
Agriculture Industry Construction Services 1999 2004 1999 2004 1999 2004 1999 2004 EU-25 2.4 2.0 22.4 20.7 5.5 5.9 69.7 71.4 Albania 29.5 24.08 11.7 13.09 5.0 8.110 53.7 54.911 Bosnia 15.8 11.5 22.7 22.0 6.3 4.6 55.3 61.9 Bulgaria 16.3 10.9 23.9 25.2 5.0 4.8 54.8 59.1 Macedonia 12.9 13.412 26.5 24.413 6.1 6.314 54.5 56.015 Romania 15.2 14.6 28.2 30.5 5.7 6.9 52.7 49.7 Serbia-M16 20.6 16.317 30.3 28.018 4.2 3.819 44.9 51.920 Source: Eurostat (2006); 56-7. Table 1:7 General Government Accounts, 2007 Projections (% GDP)
ALBANIA BOSNIA KOSOVO MONTENEGRO SERBIA REVENUES 26.9 41.4 26.4 50.8 40.1 Taxes and social sec
22.7 33.5 21.0 35.4
Other 4.2 6.5 5.4 4.7 EXPENDITURES 31.5 41.5 19.321 47.8 40.6 Primary 28.7 41.0 20.5 Gross fixed capital 7.1 4.0 4.8 Consumption 9.0 1.7 Transfers 4.6 13.6 19.4 Other 8.0 23.4 Interest payments 2.9 0.5 0.8 Sources: Eurostat, 2008; Government of Kosovo 2008; Government of Montenegro 2007.
8 2003 9 2003 10 2003 11 2003 12 2003 13 2003 14 2003 15 2003 16 Excludes Kosovo 17 2002 18 2002 19 2002 20 2002 21 Author’s calculation
24
Table 1:8 Key Labour Market Indicators and Trends 2002/3-6/7, LFS Data. Male Female
2002 2003 2004 2005 2006 2005 2006 2005 2006 Total Employment Rate ALBANIA 52.1 51.1 50.3 49.7 - 60.0 - 38.8 - BOSNIA - - - - 35.0 - 46.1 - 24.0 CROATIA 53.4 53.4 54.7 55.0 55.6 61.7 62.0 48.6 49.4 KOSOVO 23.8 25.3 27.7 28.5 28.7 45.8 46.1 11.7 11.8 MACEDONIA 40.4 38.5 36.8 37.9 39.6 45.4 48.3 30.1 30.7 MONTENEGRO 37.7 36.2 37.4 34.8 - 42.4 - 37.6 - SERBIA 58.5 57.9 53.4 51.0 49.9 61.2 59.2 40.8 40.6
Male Female 2003 2004 2005 2006 2007 2005 2006 2005 2006 Total Unemployment Rate ALBANIA 15.0 14.4 14.1 - 13.4 12.1 - 17.2 - BOSNIA 41.6 41.8 43.9 31.1 42.9 - 28.9 - 34.9 CROATIA 14.1 13.6 12.6 11.1 9.6 11.6 9.8 13.8 12.7 KOSOVO 49.7 39.7 41.4 44.9 43.0 32.9 34.6 60.5 61.6 MACEDONIA 36.7 37.2 37.3 36.0 34.9 36.5 35.3 38.4 37.2 MONTENEGRO 22.7 27.7 30.3 - 11.9 - - - - SERBIA 16.0 18.7 21.1 21.0 18.8 17.0 18.1 26.5 24.9
Male Female 2002 2003 2004 2005 2006 2005 2006 2005 2006 Total Long-Term Unemployment Rate ALBANIA BOSNIA 28.4 26.7 30.8 CROATIA 8.9 8.4 7.3 7.4 6.7 6.5 5.8 8.4 7.7 KOSOVO 47.3 42.7 34.9 34.7 41.1 27.5 31.5 50.8 56.5 MACEDONIA 27.0 31.2 31.7 32.3 31.1 31.7 30.5 33.3 32.1 MONTENEGRO SERBIA 9.9 11.0 14.5 16.7 17.0 13.3 13.9 21.1 21.0 Source: Eurostat data, web: http://epp.eurostat.ec.europa.eu/portal/page?_pageid=1996,45323734&_dad=portal&_schema=PORTAL&screen=welcomeref&open=/general/noneu/cpc/cpc_si&language=en&product=EU_general_statistics&root=EU_general_statistics&scrollto=299 (accessed 21 August 2008) Figures in italics are from EU (2008), 12.
25
Table 1.9 Economic Activity Rates (15-64 year olds) 2000 and 2006, % ACTIVITY RATE
OVERALL MALE FEMALE
2000 2006 2000 2006 2000 2006 ALBANIA 66.2 57.822 77.7 68.523 54.6 46.824 BOSNIA 51.3 65.5 37.4 CROATIA 62.2 62.6 68.7 68.5 56.0 56.9 MACEDONIA 59.7 62.2 71.7 74.9 47.7 49.2 MONTENEGRO 60.35 49.925 67.64 57.426 53.01 42.927 SERBIA 68.2 63.56 76.7 72.74 59.9 54.47 KOSOVO 52.3 70.8 33.7 EU-27 68.6 70.3 77.1 77.6 60.1 63.0 Source: Eurostat, 2008 Table 1.10 Wages and Salaries Avge nominal monthly wages
(national currency) Index of real wages
(2000 = 100) 2000 2006 2000 2006 BOSNIA 372 KM 538 KM28 n/a CROATIA 4869 HRK 6634 HRK 100 116.62 MACEDONIA 10193 DEN 13517 DEN 100 118.1 MONTENEGRO 96.63 EURO 245.95 EURO 100 144.14 SERBIA 3799 DIN 31745 DIN 100 233.3 Source: EUROSTAT, 2008 Currency conversions as at 1 January 2007 1 EURO = 1.96 KM; 7.34 HRK; 58.83 DEN; 75.80 DIN (web: http://www.oanda.com/convert/classic ) Table 1.11 Employed persons by activity and gender, LFS 2007/8 (Kosovo 2003) BOSNIA MONTENEGRO SERBIA KOSOVO Total M F Total M F Total M F Total M F Agriculture 12.2 11.5 16.6 8.1 8.4 7.8 27.4 10.2 11.0 7.1 Industry 35.8 43.7 17.9 17.6 23.1 9.9 14.4 28.4 32.4 10.4Services 52.0 44.8 65.5 74.3 68.5 82.3 58.1 57.2 52.9 73.4Other 0.5 4.6 3.7 9.1 Source: LFS
22 2005 23 2005 24 2005 25 2005 26 2005 27 2005 28 2005
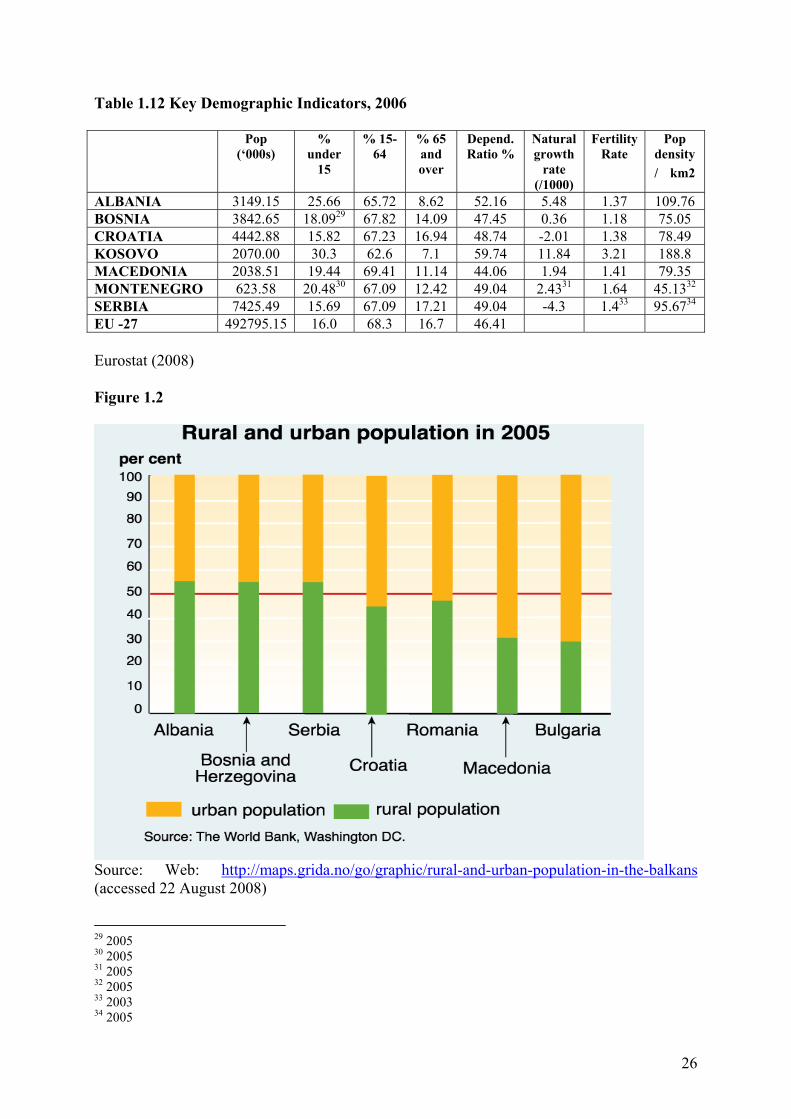
26
Table 1.12 Key Demographic Indicators, 2006 Pop
(‘000s) %
under 15
% 15-64
% 65 and over
Depend. Ratio %
Natural growth
rate (/1000)
Fertility Rate
Pop density / km2
ALBANIA 3149.15 25.66 65.72 8.62 52.16 5.48 1.37 109.76 BOSNIA 3842.65 18.0929 67.82 14.09 47.45 0.36 1.18 75.05 CROATIA 4442.88 15.82 67.23 16.94 48.74 -2.01 1.38 78.49 KOSOVO 2070.00 30.3 62.6 7.1 59.74 11.84 3.21 188.8 MACEDONIA 2038.51 19.44 69.41 11.14 44.06 1.94 1.41 79.35 MONTENEGRO 623.58 20.4830 67.09 12.42 49.04 2.4331 1.64 45.1332 SERBIA 7425.49 15.69 67.09 17.21 49.04 -4.3 1.433 95.6734 EU -27 492795.15 16.0 68.3 16.7 46.41 Eurostat (2008) Figure 1.2
Source: Web: http://maps.grida.no/go/graphic/rural-and-urban-population-in-the-balkans (accessed 22 August 2008)
29 2005 30 2005 31 2005 32 2005 33 2003 34 2005
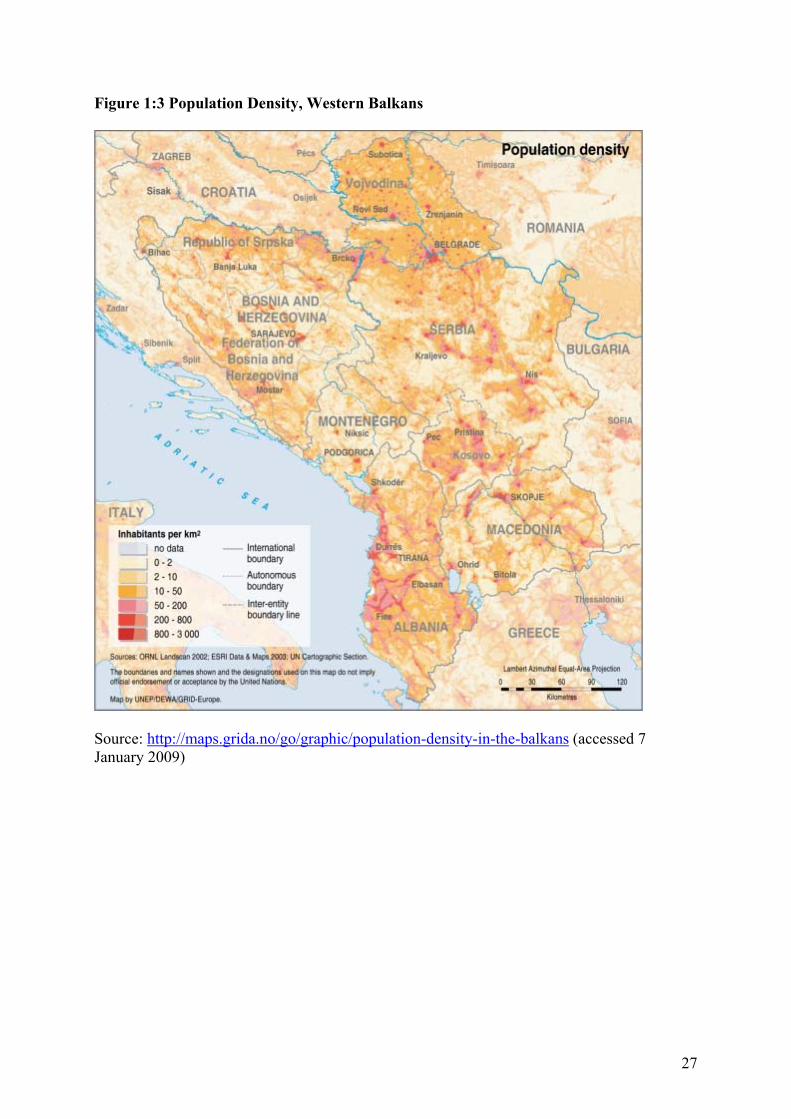
27
Figure 1:3 Population Density, Western Balkans
Source: http://maps.grida.no/go/graphic/population-density-in-the-balkans (accessed 7 January 2009)
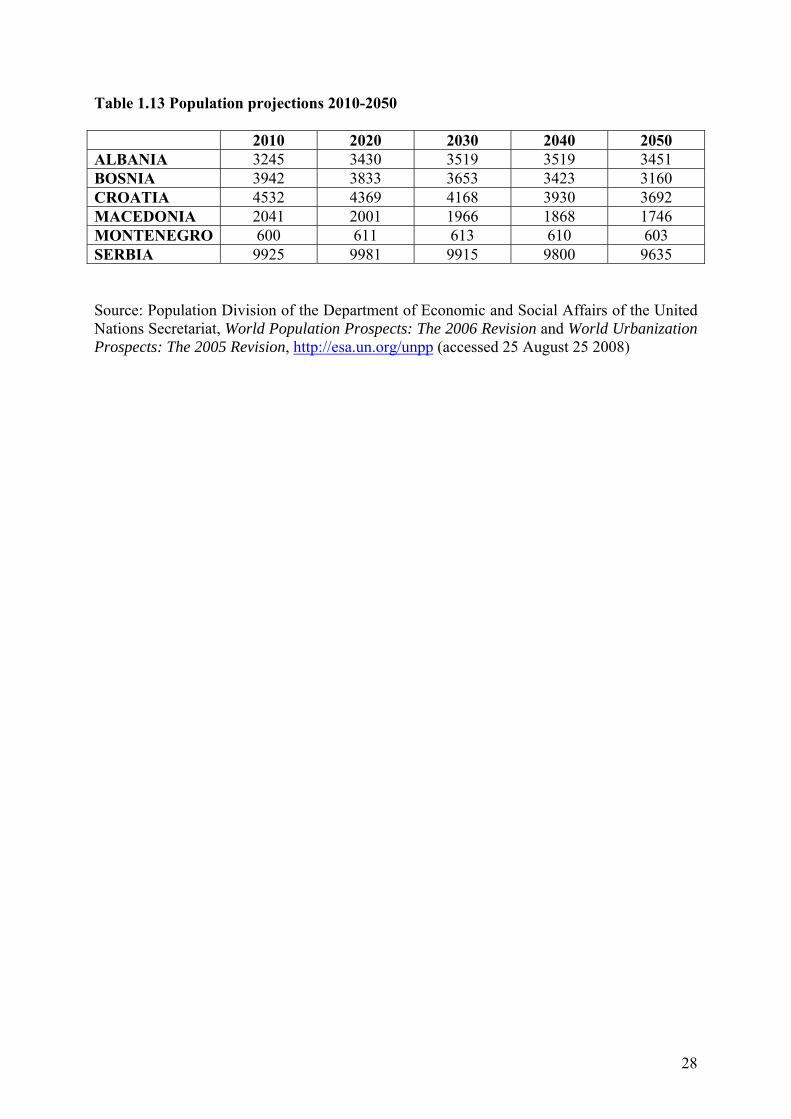
28
Table 1.13 Population projections 2010-2050
2010 2020 2030 2040 2050 ALBANIA 3245 3430 3519 3519 3451 BOSNIA 3942 3833 3653 3423 3160 CROATIA 4532 4369 4168 3930 3692 MACEDONIA 2041 2001 1966 1868 1746 MONTENEGRO 600 611 613 610 603 SERBIA 9925 9981 9915 9800 9635 Source: Population Division of the Department of Economic and Social Affairs of the United Nations Secretariat, World Population Prospects: The 2006 Revision and World Urbanization Prospects: The 2005 Revision, http://esa.un.org/unpp (accessed 25 August 25 2008)
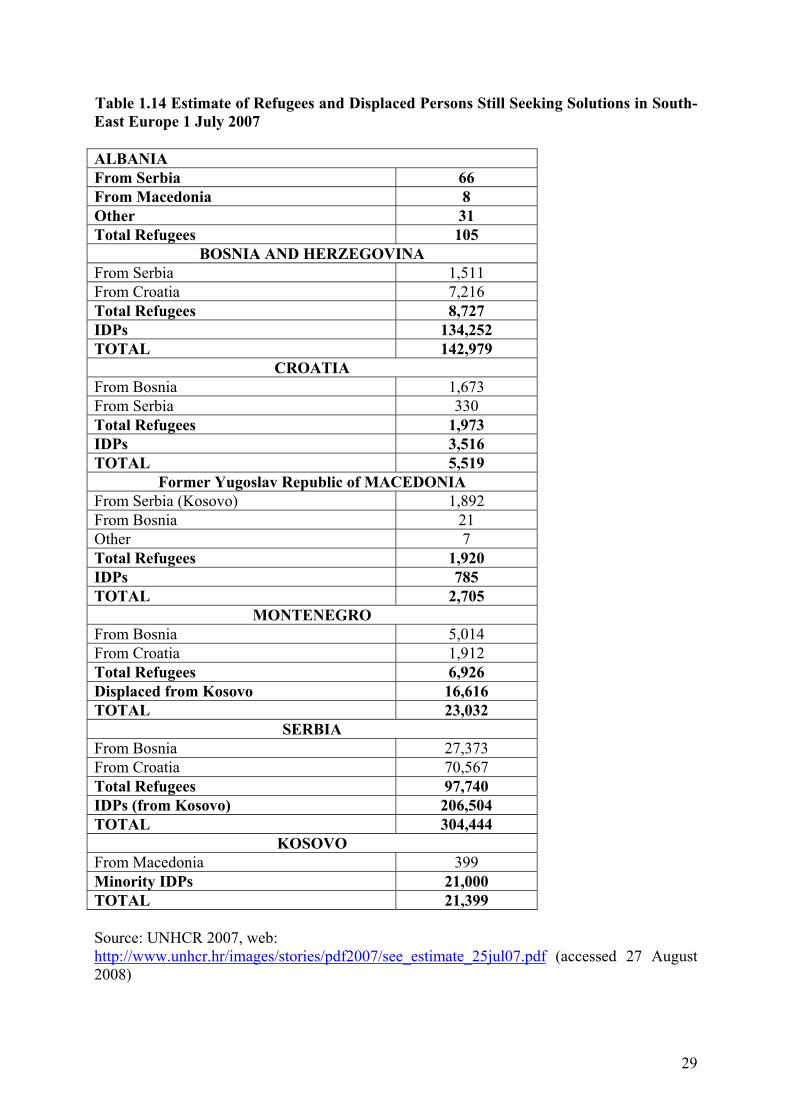
29
Table 1.14 Estimate of Refugees and Displaced Persons Still Seeking Solutions in South-East Europe 1 July 2007 ALBANIA From Serbia 66 From Macedonia 8 Other 31 Total Refugees 105
BOSNIA AND HERZEGOVINA From Serbia 1,511 From Croatia 7,216 Total Refugees 8,727 IDPs 134,252 TOTAL 142,979
CROATIA From Bosnia 1,673 From Serbia 330 Total Refugees 1,973 IDPs 3,516 TOTAL 5,519
Former Yugoslav Republic of MACEDONIA From Serbia (Kosovo) 1,892 From Bosnia 21 Other 7 Total Refugees 1,920 IDPs 785 TOTAL 2,705
MONTENEGRO From Bosnia 5,014 From Croatia 1,912 Total Refugees 6,926 Displaced from Kosovo 16,616 TOTAL 23,032
SERBIA From Bosnia 27,373 From Croatia 70,567 Total Refugees 97,740 IDPs (from Kosovo) 206,504 TOTAL 304,444
KOSOVO From Macedonia 399 Minority IDPs 21,000 TOTAL 21,399 Source: UNHCR 2007, web: http://www.unhcr.hr/images/stories/pdf2007/see_estimate_25jul07.pdf (accessed 27 August 2008)
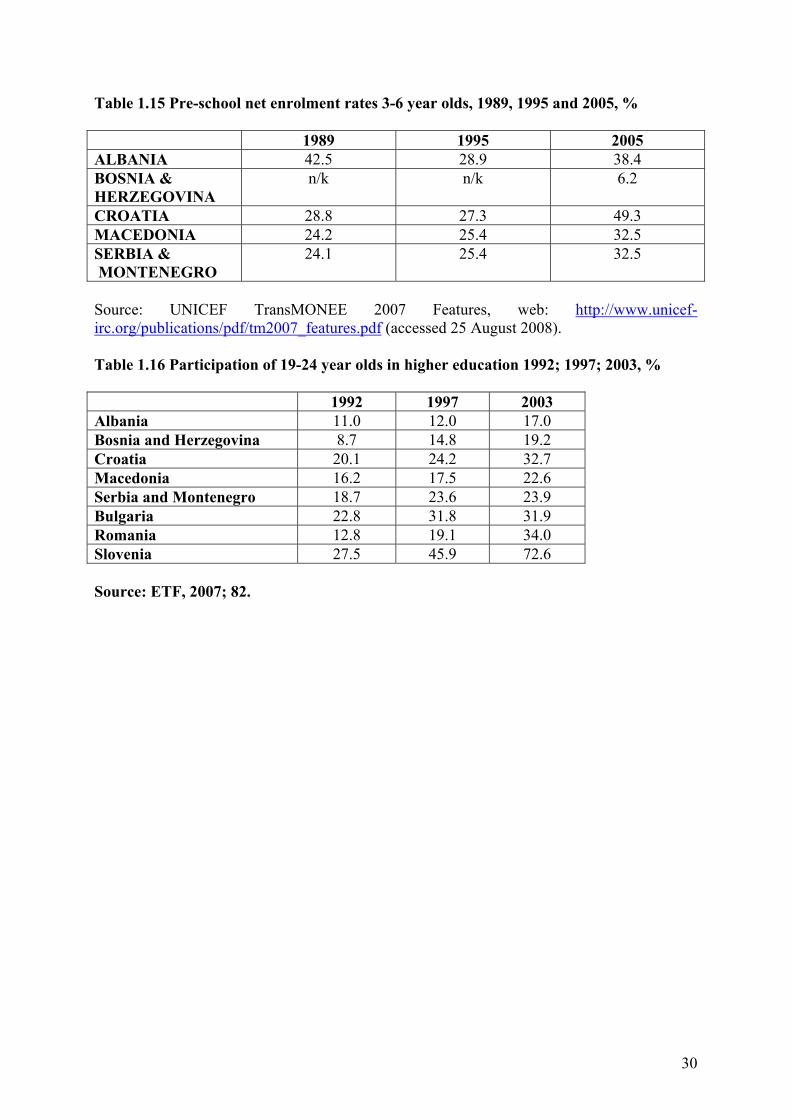
30
Table 1.15 Pre-school net enrolment rates 3-6 year olds, 1989, 1995 and 2005, % 1989 1995 2005 ALBANIA 42.5 28.9 38.4 BOSNIA & HERZEGOVINA
n/k n/k 6.2
CROATIA 28.8 27.3 49.3 MACEDONIA 24.2 25.4 32.5 SERBIA & MONTENEGRO
24.1 25.4 32.5
Source: UNICEF TransMONEE 2007 Features, web: http://www.unicef-irc.org/publications/pdf/tm2007_features.pdf (accessed 25 August 2008). Table 1.16 Participation of 19-24 year olds in higher education 1992; 1997; 2003, % 1992 1997 2003 Albania 11.0 12.0 17.0 Bosnia and Herzegovina 8.7 14.8 19.2 Croatia 20.1 24.2 32.7 Macedonia 16.2 17.5 22.6 Serbia and Montenegro 18.7 23.6 23.9 Bulgaria 22.8 31.8 31.9 Romania 12.8 19.1 34.0 Slovenia 27.5 45.9 72.6 Source: ETF, 2007; 82.
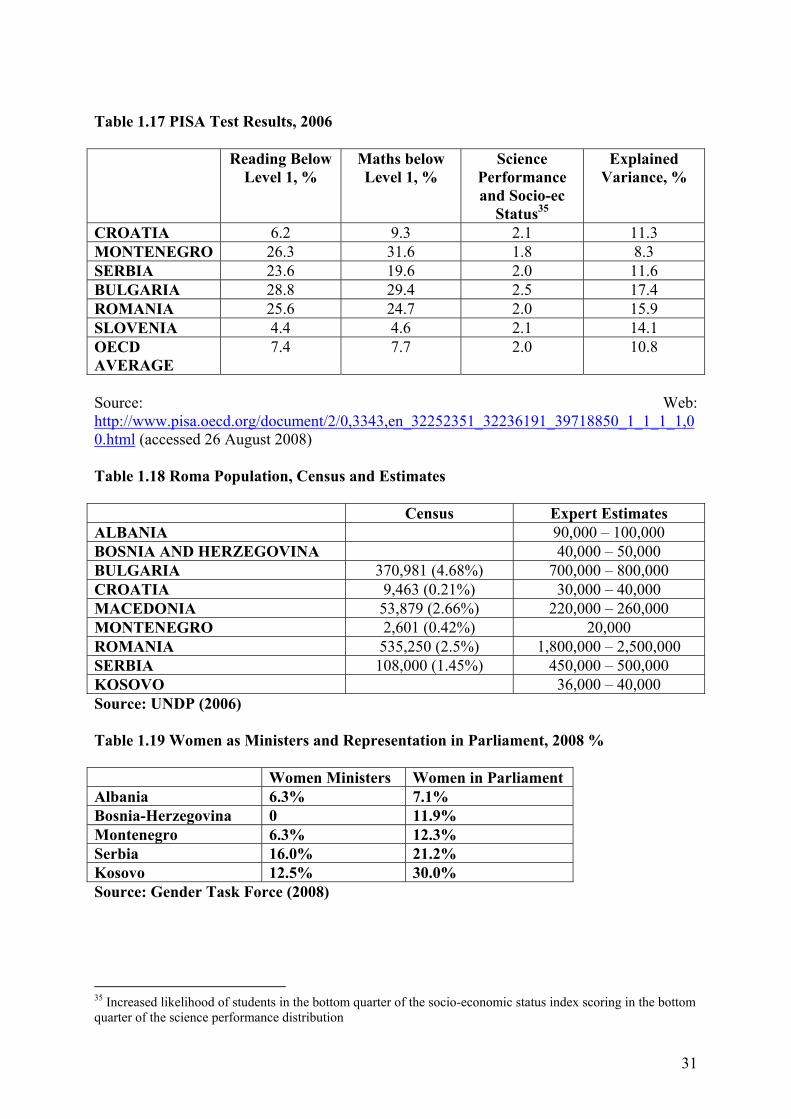
31
Table 1.17 PISA Test Results, 2006 Reading Below
Level 1, % Maths below Level 1, %
Science Performance and Socio-ec
Status35
Explained Variance, %
CROATIA 6.2 9.3 2.1 11.3 MONTENEGRO 26.3 31.6 1.8 8.3 SERBIA 23.6 19.6 2.0 11.6 BULGARIA 28.8 29.4 2.5 17.4 ROMANIA 25.6 24.7 2.0 15.9 SLOVENIA 4.4 4.6 2.1 14.1 OECD AVERAGE
7.4 7.7 2.0 10.8
Source: Web: http://www.pisa.oecd.org/document/2/0,3343,en_32252351_32236191_39718850_1_1_1_1,00.html (accessed 26 August 2008) Table 1.18 Roma Population, Census and Estimates Census Expert Estimates ALBANIA 90,000 – 100,000 BOSNIA AND HERZEGOVINA 40,000 – 50,000 BULGARIA 370,981 (4.68%) 700,000 – 800,000 CROATIA 9,463 (0.21%) 30,000 – 40,000 MACEDONIA 53,879 (2.66%) 220,000 – 260,000 MONTENEGRO 2,601 (0.42%) 20,000 ROMANIA 535,250 (2.5%) 1,800,000 – 2,500,000 SERBIA 108,000 (1.45%) 450,000 – 500,000 KOSOVO 36,000 – 40,000 Source: UNDP (2006) Table 1.19 Women as Ministers and Representation in Parliament, 2008 % Women Ministers Women in Parliament Albania 6.3% 7.1% Bosnia-Herzegovina 0 11.9% Montenegro 6.3% 12.3% Serbia 16.0% 21.2% Kosovo 12.5% 30.0% Source: Gender Task Force (2008)
35 Increased likelihood of students in the bottom quarter of the socio-economic status index scoring in the bottom quarter of the science performance distribution
32
References Arandarenko, M. (2004) International Advice and Labour market Institutions in South-East Europe, in Global Social Policy 4(1); 27-53. Arandarenko, M. et al (2008) Labor Costs and Labor Taxes in the Western Balkans. February. World Bank. web: http://siteresources.worldbank.org/INTECAREGTOPHEANUT/Resources/Betcherman&Arandarenko-labor_taxes_western_balkans.pdf (accessed 26 August 2008). Bokulić, S. and G. Kostadinova (2008) Pushing for Change? South East Europe’s Minorities in the EU Progress Reports. London: Minority Rights Group. Web: http://www.google.hr/url?sa=t&source=web&ct=res&cd=2&url=http%3A%2F%2Fwww.minorityrights.org%2Fdownload.php%3Fid%3D523&ei=SRJnSaaII5id-gbfkMikBw&usg=AFQjCNH6-BjcgBODur2IB5hk3PP0X-ItIA&sig2=wBNl3Pgt-HpoL-CJvAHgJg (accessed 7 January 2009). Bornarova, S. et al (2007) From Welfare to Workfare States on the Western Balkans. Skopje: Ss Cyril and Methodius University, Faculty of Philosophy/Spark. Christie; E. and M. Holzner (2004) Household Tax Compliance in Central, East and Southeast Europe. WIIW Monthly Report, May. Vienna: WIIW. Christie; E. and M. Holzner (2005) Household tax Compliance in Albania. WIIW Research Reports no. 316, April. Vienna: WIIW. Christie; E. and M. Holzner (2006) What Explains Tax Evasion? WIIW Working Paper 40. Vienna: WIIW. Clarke, J. (2008) ‘Governance Puzzles’, in L. Budd and L. Harris (eds.) eGovernance: Managing or Governing? London: Routledge. Council of the European Union (2003) Thessaloniki Summit Conclusions, June, web: http://ue.eu.int/ueDocs/cms_Data/docs/pressdata/en/ec/76279.pdf (accessed 8 December 2008). Deacon, B. and Stubbs, P. (2007) Transnationalism and the Making of Social Policy in South East Europe, in B. Deacon and P. Stubbs (eds.) Social Policy and International Interventions in South East Europe, Cheltenham: Edward Elgar; pp. 1-21. Deacon, B, N. Lendvai and P. Stubbs (2007) Conclusions in B. Deacon and P. Stubbs (eds.) Social Policy and International Interventions in South East Europe, Cheltenham: Edward Elgar; pp. 221 – 242. EAR/B&S Europe (2007) Survey on the Extent and Prevention of the Informal Economy and Money Laundering in Kosovo web: http://www.euptkosovo. eu/training/police/PoliceTraining/ORGANIZED_CRIME/DOCUMENTS/2.pdf (accessed 13 August 2008).
33
ETF (Fetsi, A. (ed)) (2007) Labour Markets in the Western Balkans: challenges for the future. Luxembourg: European Communities. web: http://www.etf.europa.eu/pubmgmt.nsf/(getAttachment)/935A92FFB9628049C12573B5003ACA25/$File/NOTE7AYLRT.pdf (accessed 21 August 2008) ETF (2008) Country Reports: South East Europe. Turin: ETF. Web: http://www.etf.europa.eu European Commission (2008a) Candidate and Pre-Accession Countries’ Economic Quarterly, Second quarter issued 4 July. Web: http://ec.europa.eu/economy_finance/publications/publication12889_en.pdf (accessed 21 August 2008). European Commission DG ECFIN (2008b) Candidate and Pre-Accession Countries’ Economic Quarterly, Third quarter issued 8 October. Web: http://ec.europa.eu/economy_finance/publications/publication13250_en.pdf (accessed 3 January 2009) European Commission (2003) EU-Western Balkans Summit Declaration 21 June 10229/03, web: http://ec.europa.eu/enlargement/enlargement_process/accession_process/how_does_a_country_join_the_eu/sap/thessaloniki_summit_en.htm (accessed 8 December 2008). European Commission (2008) Enlargement Strategy and Main Challenges 2008-9. web: http://ec.europa.eu/enlargement/pdf/press_corner/key-documents/reports_nov_2008/strategy_paper_incl_country_conclu_en.pdf (accessed 8 December 2008). Eurostat (2006) Pocketbook on Candidate and Pre-Candidate Countries. Eurostat. Eurostat (2008) Pocketbook on Candidate and Pre-Candidate Countries. Web: http://min.avrupa.info.tr/docs/poketbook.pdf (accessed 8 December 2008). Eurostat (2008a) Eurostat data navigation tree: Candidate and potential candidate countries. Web: http://epp.eurostat.ec.europa.eu/portal/page?_pageid=1996,45323734&_dad=portal&_schema=PORTAL&screen=welcomeref&open=/data/general/noneu/cpc&language=en&product=EU_MAIN_TREE&root=EU_MAIN_TREE&scrollto=0 (accessed at various times in 2008). Eurostat (2008b) News Release: Population projections 2008-2060, STAT/08/119, 26 August Gender Task Force (2008) Statistics, web: http://www.gtf.hr/index.php?option=com_content&task=view&id=33&Itemid=49 (accessed 5 January 2009). Government of Kosovo (2008) Medium-Term Expenditure Framework 2009-11. Web: http://www.seerecon.org/kdc/MTEF%20%202008-2011%20June%2012.pdf (accessed 30 July 2008).
34
Government of Montenegro (2007) Economic and Fiscal Programme, Ministry of Finance. Web: http://www.vlada.cg.yu/eng/minfin/vijesti.php?akcija=vijesti&id=152561 (accessed 7 January 2009). ICB (International Commission on the Balkans) (2005) The Balkans in Europe’s Future. Web: http://www.balkan-commission.org/ (accessed 20 August 2008). IOM Office in Budapest (2007) Migration Country Profiles web: http://www.iom.hu/regpublications.html (accessed 25 August 2008). Kathuria, S. (ed.) (2008) Western Balkan Integration and the EU: an agenda for trade and growth. Washington: the World Bank. web: http://siteresources.worldbank.org/ECAEXT/Resources/publications/454763-1213051861605/balkan_ch1.pdf (accessed 4 November 2008). Kathuria, S. (ed.) (2007) Western Balkan Integration and the EU: an agenda for trade and growth. Washington: the World Bank. Web: http://siteresources.worldbank.org/ECAEXT/Resources/publications/454763-1213051861605/balkan_ch1.pdf (accessed 4 November 2008). Kauffmann, D. et al World Governance Indicators 2008. Web: http://info.worldbank.org/governance/wgi/sc_country.asp (accessed 7 January 2008). Koro, L. (2007) Economic Performance of the Western Balkan Economies in 2007. UNDP: Europe and CIS. Web: http://europeandcis.undp.org/home/show/41D6901C-F203-1EE9-BF623728E26C6241 (accessed 7 January 2009). Marko, J. (ed.), European Integration and its Effects on Minority Protection in South Eastern Europe. Nomos, Baden-Baden. Nesporova, A. (2007) A Comparative Overview of Labour market Characteristics: South East Europe and the EU. Geneva: ILO, web: http://www.cepor.hr/news/16-svi-2008/Nesporova.pdf (accessed 22 August 2008). OECD Development Centre (2008) Black Sea and Central Asia: promoting work and well-being. Paris: OECD. OECD Development statistics http://www.oecd.org/document/33/0,2340,en_2649_34447_36661793_1_1_1_1,00.html OSI (2006) On the Road to the EU: Monitoring Equal Opportunities for Women and Men in South East Europe. Budapest: OSI. Web: http://www.soros.org/initiatives/women/articles_publications/publications/onroad_20060503/aa_onroad_20060517.pdf (accessed 7 January 2009). Ramet, S. (ed.) (1998) Gender Politics in the Western Balkans. Pennsylvania: Penn State University Press. Solioz, C. (2005) Turning Points in Post-war Bosnia: ownership process and European integration Baden-Baden: Nomos.
35
Stubbs, P. (2008) A Missed Opportunity?: Social and Labour Market Policies in the Western Balkans, in Friedrich Ebert Stiftung (eds.) Ownership for Regional Co-operation, forthcoming. Web: http://paulstubbs.pbwiki.com/f/Social+Region+Stubbs.pdf (accessed 7 January 2009). UNDP (2006) At Risk: Roma and the Displaced in South East Europe. Bratislava: UNDP Regional Bureau for Europe and the CIS. Web: http://europeandcis.undp.org/poverty/show/1F1720E9-F203-1EE9-BC7AE7B9E8FA04E4 (accessed 27 August 2008). UNDP (2008) Human Development Reports Database. New York: UNDO. Web: http://hdrstats.undp.org/indicators/269.html (accessed 7 January 2009). UNDP (2008) Gender-related Development Index. Web: http://hdrstats.undp.org/indicators/268.html (accessed 5 January 2009). UNICEF Innocenti Research Centre (2007) TransMONEE Database. UNICEF: Florence. Web: http://www.unicef-irc.org/publications/pdf/tm2007_features.pdf (accessed 7 January 2009). UNICEF ICDC (2008) TransMONEE Database 2008, web: http://www.unicef-irc.org/databases/transmonee/2008/Tables_TransMONEE.xls (accessed 26 August 2008). WIIW (The Vienna Institute for International Economic Studies (2008) Monthly Report 12/2008. Vienna: WIIW. World Bank (2006) Labor Market Albania web: http://www-wds.worldbank.org/external/default/WDSContentServer/WDSP/IB/2006/06/07/000160016_20060607094308/Rendered/PDF/345970AL.pdf (accessed 27 August 2008) World Bank (2008) Migration and Remittances Factbook web: http://econ.worldbank.org/WBSITE/EXTERNAL/EXTDEC/EXTDECPROSPECTS/0,,contentMDK:21352016~pagePK:64165401~piPK:64165026~theSitePK:476883,00.html (accessed 25 August 2008).
36
2: Social Protection Systems 2.1. An Historical Overview The region inherits historical legacies in social protection which are a complex product of the Austro-Hungarian empire in the latter part of the nineteenth century, influenced by Bismarckian ideas and practices on social insurance, which came to frame modern welfare settlements in Croatia, Slovenia, parts of Bosnia-Herzegovina and Serbia, and the different kinds of communism found within the former Yugoslavia on the one hand and in Albania on the other. In Tito’s Yugoslavia, modernisation linked to industrialisation and rapid urbanisation created a kind of dual social structure, with those employed in the socialist industrial sector having work-based benefits which small farmers did not have. This went alongside mass literacy programmes and extensive efforts in preventive public health. Formal equality between the Republics rested alongside increasing inequalities between the richer Northern Republics, particularly Slovenia and Croatia, and the rest of the Federation, which regional policies appeared powerless to combat. The introduction of socialist self-management also went alongside an increasing recognition of the need to tackle emerging social problems through new Centres for Social Work (CSWs), established in the late 1950s and early 1960s, charged with “analysing social problems in the municipality, suggesting measures to solve them, undertaking professional guardianship work and solving other social problems” (Šućur, 2003; 8). The corresponding institutionalisation of social work education within higher education was, also, unique within the region (cf. Zaviršek, 2008). Albania, under the leadership of Enver Hoxha, steered an isolationist path which meant that progress in health and education in the 1950s were somewhat eroded in the context of political repression and technological underdevelopment. 2.2. The Structure of Social Protection Systems and Benefits Provided Since independence and transition, social protection systems reflect these legacies, with reforms relating to prevailing economic and political conditions and the nature, extent and timing of the crisis. Hence, whilst all of the Yugoslav successor states have retained Centres for Social Work as a kind of statutory form of personal social services, the functions and more importantly their financing differs throughout the region. In Kosovo under UNSC 1244, international organisations supported the redevelopment of CSWs which allows for a range of different professionals, not just qualified social workers, to offer general social work support services. 2.2.1. A Proliferation of Strategies
Throughout the region social protection issues are dealt with by a Ministry which includes either Health or Employment and, in one case, both (see Table 2.1). Albania now has in place a cross-cutting strategy on social inclusion alongside strategies on social protection, social insurance, health and gender equality. Bosnia and Herzegovina has, perhaps, the most complex arrangements regarding institutional responsibility of all the countries in the region, with few strategies on the national level and some difference between the two entities in terms of institutional arrangements. Rather like Kosovo, a number of different international actors have sought to influence reform, often working within ‘pilot projects’. Montenegro developed a Strategy for the Alleviation of Poverty in 2007. In some ways Serbia, in part as a legacy of work undertaken in a newly formed, separate Ministry of Social Affairs which existed from 2000 to 2004, appears to have a rather more coherent strategic approach to tackling social exclusion and, in particular, to deinstitutionalisation. It now has a department in the Ministry
37
of Labour and Social Welfare dealing exclusively with the Social Welfare Reform Strategy. As noted in chapter 3, it lacks an overall social inclusion strategy but has two important documents from 2006: Strategy For Improving the Position of Persons With Disabilities in the Republic of Serbia and the National Strategy on Aging. In 2007 Serbia adopted a Law on Prevention of discrimination against Persons with Disabilities. Kosovo’s social protection system was, essentially, redesigned under international supervision but it, too, lacks a clear strategy on social inclusion and the status of the overall Development Strategy is unclear. Two key additional, and linked, issues and questions arise with regard to the strategic direction regarding social inclusion and social protection, relating to the degree of true national ownership of these strategies and the extent to which the strategies represent a kind of European social protection system path or, whether, paths more reflect the rather residualist social development path preferred by some parts of the World Bank and the IMF. Strategies on social inclusion are discussed in greater depth in Chapter 3 below. 2.2.2. Re-Scaling Social Protection: diverse decentralisations The complexities of determining the appropriate level of government from which to deliver social protection services is a theme in all of the reports. Bosnia-Herzegovina is the most extreme example of an over-decentralised system with virtually no role for the central state and limit regulatory roles vested in the two entity governments. In FBiH, responsibilities are shared between cantons and municipalities and in RS it is the municipalities which are responsible. These arrangements appear both inefficient and inequitable such that, recently, it has been argued that “the services one receives still largely depend on where one lives” (Maglajlić-Holiček and Rašidagić, 2007; 163). Whilst Albania appears to have decided to deliver social care services at the municipal level and to arrange for social assistance to be municipally-based but with block grants from the centre, similar issues of the sustainability and equity of local services remain unresolved. Kosovo is currently in the middle of a process of decentralisation, largely for political reasons. A new Law on Family and Social Services requires municipalities to take responsibility for CSWs and for social services, but considerable effort will need to be invested into capacity building to ensure that local staff can respond to social protection needs. The new strategic direction for social protection in Montenegro divides responsibility between National, Regional and Municipal levels (see Montenegro SPSI report, 86), but, again, questions of equity and of the development of appropriate competences have not been fully resolved. Serbia has a mixed system in which responsibility for social protection is shared between central and local levels. There are plans to introduce more regional planning structures, particularly with regard to residential care. Overall, whist the tendency is towards a more decentralised delivery of social services and, in some cases, social assistance, it appears that the drivers of change are not always from within the social protection sector and, crucially, that financing, efficiency and equity issues have not been adequately addressed and certainly appear far from being resolved. Matković (2006) has pointed to the need for ‘asymmetrical decentralization’ involving the transfer of certain functions to some regions or local governments and not all, which can be appropriate when local governments significantly differ according to economic strength, number of inhabitants, cultural specificities and/or administrative capacity, as seems to typically be the pattern in the Western Balkans. Local and regional social planning, perhaps best defined as an inclusive process, involving all local stakeholders, which maps needs and resources; sets plans for the local solution of local social problems; commissions specific services; and regularly reviews results, is crucial here but is not well developed in the region. There are isolated examples, unusually within internationally funded pilot projects, of the establishment of agreed planning mechanisms to mobilise existing resources, stimulate new
38
initiatives, and ensure a network of services to meet agreed outcomes and targets (cf. Stubbs and Warwick, 2003; 9) but these are rarely scaled up and applied in all local government units. Without this, it is hard to ensure that decentralised services are in line with local needs and attain a level of allocative efficiency. Serbia now has 120 local governments which have social protection plans which foster access to draw down central funds. Decentralisation is not a magical panacea and, indeed, can be disastrous in the absence of safeguards to ensure that local elites do not capture resources for their own purposes and, even more importantly, if adequate long-term predictable systems of transfer payments and equalisation formulae are not in place to counter the rise of geographical inequalities. It may, indeed, be a product of political expediency in terms of shifting responsibility for unpopular structural adjustments to other levels of government, and resolving fiscal crises and decreasing deficits at the central level (Matković, 2006). Above all, there is a need to ensure good governance of services and to improve relationships between the national and sub-national units of government. Unless associated with shifts in policy priorities, decentralisation could, indeed, result in an increase in rates of institutional care, as each sub-unit maintains, or even builds anew, its own residential care facilities (cf. Bošnjak and Stubbs, 2007). 2.2.3 Diversification and a New Welfare Mix One of the legacies of a socialist child protection system is a virtual state or public monopoly regarding the provision of social services, although in the former Yugoslavia church-based charitable organisations and the Red Cross did operate and, in 1990s Kosovo, the Albanian community was served by the Mother Theresa Society. In former Yugoslavia, large scale associations of people with disabilities existed but these did not play a particularly pro-active role. In the context of wars and crises, a large number of international NGOs began working on humanitarian relief operations and, alongside these, a new generation of local NGOs and community-based organisations emerged, responding to social problems and, sometimes offering innovative approaches. Over time, there has been increasing recognition by the state of the important role played by these organisations although public funding remains sporadic, limited and not conducive to these organisations’ long-term sustainability nor to the demands of more coherent needs-based social planning. Whilst some private provision has developed, notably in terms of services for older people, this has also not been properly integrated, not least in terms of regulation and quality standards. Whilst in Albania, NGOs do offer services to vulnerable groups, the Albania SPSI report notes the lack of financing mechanisms, distortions since the majority of NGOs work in the capital, Tirana, and the need for new strategic partnerships between public and private providers. In Bosnia and Herzegovina, half of the residential institutions for children without parental care in FBiH ere established by NGOs. However, the legislative and financial base for NGO work is not completely secure and the report also calls for “larger involvement and stronger role of NGO and private sector in provision and financing of social assistance“ (Bosnia SPSI Report; 160). A similar picture and recommendation can be found in the Montenegro report. Serbia has a Social Innovation Fund introduced in 2003 with the support of international donors which supports tailor made pubic and private projects to meet the needs of vulnerable groups for community-based social services. The Fund supports NGOs to offer sustainable programmes in a situation where the Serbian SPSI report estimates that there are some 2,000 local NGOs, including some 200 offering services to Roma. Serbia also has a Fund for the Organisations of the Persons with Disabilities with funding provided from the republic budget, the lottery and international donors. Together with providing some institutional support to associations of persons with disabilities, it also acts as a project fund. Serbia is also piloting minimum national standards for priority social protection services. In
39
Kosovo, INGOs and local NGOs offer more parallel provision in a situation where there are limited public expenditures on social services. In future, it may be that the Croatian model in which both central and local government earmark funds for local NGOs will be achieved although without a level playing field in terms of standards, NGO sustainability will remain questionable. 2.2.4 Human Resources As noted above, tertiary level training for professional social workers, originally on a two year programme but, later, as part of a four year degree programme, has existed in the former Yugoslavia since the mid-1950s and School of Social Work still exist in Zagreb (Croatia), Skopje (Macedonia), Belgrade (Serbia) and Sarajevo (Bosnia and Herzegovina, FBiH). In addition, with international funding, new programmes have been established at the University of Banja Luka (Bosnia and Herzegovina – RS) and in Pristina in Kosovo. In Albania, there is still no network of trained social workers although this appears to be a priority for the medium-term. Centres for Social Work (see box below) employ other professionals including psychologists, lawyers and pedagogues although there are reform ideas, like in Kosovo, to create a more generic social professional status.
Box: Centres for Social Work in Post-Yugoslav Countries Following the institutionalisation of social work education at tertiary level in several cities in Yugoslavia in the 1950s, the first Centres for Social Work were established in the early 1960s. Both the early teaching and the CSWs themselves were influenced by US traditions of ‘social casework’. (Zaviršek, 2008) Trained social workers were to tackle emerging local social problems including alcoholism and delinquency, closely allied to the discipline of social planning. Work with families and child protection tended to dominate with institutional solutions preferred although foster care was introduced at an early stage. Main task of CSWs was to analyse social problems in the municipality, suggesting measures to solve them, undertaking professional guardianship work, and solving other social problems” (Šućur, 2003; 8). Multi-disciplinary teams responsible for different aspects of a ‘case’: social workers, psychologists, lawyers, pedagogues, with sociologists employed as planners. Rule of thumb of 1 social worker for 10,000 population. Tendency not to work holistically but, rather, to ‘fragment’ cases in terms of different professional responsibilities. In addition, CSWs administer quite a bureaucratic system (including cash benefits) with little pro-active focus on prevention. Work is not needs-based but rather based on fixed legislative categories. Little field work and community work undertaken. Modern case management approaches are being introduced gradually, with some countries further advanced than others. Reform efforts often in the form of ‘pilot programmes’ have achieved some results but modernisation has been slow and too often influenced by external models. CSWs. Infrastructure often damaged with staff demoralised and reluctant to reach out to non-state actors. Some computerisation of databases has occurred. Management of CSWs often still over-politicised.
40
2.2.5 Types of benefits and services
2.2.5.1 Cash Benefits In terms of cash benefits we can distinguish between contributory benefits: unemployment benefits; maternity benefits and sickness benefits and non-contributory benefits including social assistance and child benefits which may or may not be means-tested. Whilst far from exhaustive, here we describe some of the main features of the main schemes under each of these categories in our selected countries. I. Basic Individual and Household Social Assistance Schemes Ii. Albania
• Main scheme ndihme ekonomike NE (economic aid) introduced in 1993 • 2006 reached some 112,000 households • Average benefit €16.82 • Locally administered, (partially) financed through central block grants • Distinguishes between those with severe health and social problems and those
temporarily vulnerable • Rural poor who own land, even if not cultivated, receive lower benefits • NE entitles recipients to electricity subsidies • Plans to completely decentralise the scheme
Iii. Bosnia and Herzegovina
• Complicated eligibility requirements administered by CSWs • Monthly payments, single payments and in-kind support possible • RS entity based scheme – each municipality sets rate at between 50% (for single
person) to 100% (5+ member household) of average monthly wage in municipality • FBiH scheme varies by canton, linked to poverty line • 142,000 beneficiaries in FBiH
Iiii. Montenegro
• Main scheme materijalno obezbjedjene porodice MOP (family material support) • National scheme administered by CSWs with complicated requirements • Eligible families where no-one capable of work or where person capable of work is
either pregnant, single parent or has dependent children or is caring for disabled person whose disability occurred before age 18
• Means-tested: Household income must be less than €50 (1 person) to €95 (5 person +) • Benefits range from €50 (1 person) to €104.50 (5 persons +). Average payment is
€76.74. Increases dependent on budgetary conditions. • 12,741 families receive MOP in 2007, double the number in 2000
Iiv. Serbia
• Main scheme materijalno obezbjedjene porodice MOP (family material support) • National scheme administered by CSWs with complicated requirements • Families where no one capable of work (if capable then can receive only 9 out of 12
months) • Means tested those below from 16% (1 person) to 32% (5 + persons) average income • Rates in October 2007 from €56 (1 person) to €150 (5 + persons) • 2006 48,00 families receive MOP or 122,134 persons
41
• Average €57 per household or €22 per person Iv. Kosovo
• New scheme in 2000 amended by Law in 2003 • General budget financed administered by CSWs • Category I no-one capable of work; Category II looking after child under 5 (10 if
single parent) • No income and less than half a hectare of land • Rates from €35 (1 person) to €75 (7 + persons) unchanged since December 2003 • Currently 37,000 households or 162,00 people receive assistance • Average benefit per household current €52 • Re-application every 6 months
II. Child Benefits Schemes Neither Albania nor Kosovo have any child benefit schemes. IIi. Bosnia and Herzegovina
• RS has entity scheme through Public Fund for Child Protection • FBiH has Cantonal schemes but only in 4 out of 10 Cantons • Means-tested ... in RS families with less than 40% average wage • RS 30,00 children in 2005, average payment around €30 per month • Lower amounts and fewer beneficiaries in FBiH • Reform idea to create similar Public Fund in FBiH not yet implemented
IIii. Montenegro
• National scheme changed in 2001 from universal to means-tested • Children eligible are in MOP receiving households, orphans, and children with disabilities
(divided into those not capable of ‘normal life and work’ and those capable of same) • Benefits range from €16.50 (MOP), through €22 (disabled but capable of normal
life/work) to €27.50 (others) • 2007 received by 9,475 families with 18,524 children, average €17.24 • Not paid for fourth or subsequent children
IIiii. Serbia
• Republic scheme means tested (household income max 30% higher if single parent; parent of child with disabilities or foster parent)
• Paid for first four children 0-19 (7 and over must be in school), paid if looking after person with disabilities until aged 26.
• Rates at December 2007: €20 (€25 for categories as above) • 2004 reached 254,00 families with 471,000 children. • Coverage rates of poor and non-poor very similar (around 14.2%)
III: Unemployment Benefits Schemes Kosovo does not have an unemployment benefits scheme. IIIi. Albania
• Insurance-based scheme, eligible are the registered unemployed if employee and employer contributions paid for a full year prior to unemployment
42
• Receive flat-rate for 1 year, reduced to 8 months if third term of U is within 2 years of receiving second benefit
• Reaches only some 8.5% of registered unemployed IIIii. Bosnia and Herzegovina
• Insurance-based schemes exist in both entities • FBiH rate is set at 40% of average net salary in last 3 months • FBiH time of receipt varies based on insurance record from 3 months (those employed
between 8 months and 5 years) to 24 months (those employed over 35 years). 12 months of benefit requires 15-25 year contribution record.
• RS Rates vary for those with under 10 years of contributions – 35% of average net wage and those with over 10 years – 40% of net wage (limits apply – must be between 20% and 100% of average net wage)
• Low number of beneficiaries in 2007 in FBiH 5,900 out of 370,000 registered U; in RS 2,980 out of 135,000.
IIIiii. Montenegro
• Insurance-based scheme, must have min of 9 months continuous contributions or 12 months in last 18 months
• Set at 65% of minimum wage, €32.50 monthly plus social security contributions (only c. 10% of average wage)
• Length of receipt dependent on contribution record from 3 months to 12 months. For 12 months, must have at least 15 years continuous contributions. Over 30 years of continuous contributions leads to entitlement until new job or retirement.
• Hence higher number of beneficiaries, 8,240 persons, around 21% of registered unemployed, with average duration of current recipients 48 months.
• Young people with disabilities who have completed vocational training, receive benefit until employed.
IIIiv. Serbia
• Insurance-based, min of 12 months continuous contributions or 18 months with interruptions
• Level of benefit 60% of avge income from last six months for first 3 months, then 50% (10% increase if enrolled in vocational training)
• Entitlements vary between 3 months (1-5 years of empl) to 24 months (25 years of empl). 12 months if over 20 years of employment.
• c. 80,000 current recipients IV. Maternity Benefits Kosovo has no maternity benefits scheme IVi. Albania
• Insurance-based, with 2.3% of all contributions diverted to this benefit. • Insured for 1 year min • Benefit for 365 days or 390 days for second or subsequent child, including 35 or 60 days
before due date. • First 6 months at 80% of salary then 50% • Birth grant (one-off) of 50% of wage. • 2007 10,193 beneficiaries out of 39,162 live births.
43
IVii. Bosnia and Herzegovina
• FBiH varies by Canton, insurance-based maternity leave and general maternity allowance for unemployed mothers. Former set between 50% and 80% of average cantonal salary
• RS from Fund for Child protection average payment €29.10. IViii. Montenegro
• Contributory scheme – 6 months of contributions entitles to 1 year at full pay (via employer who reclaims from Govt)
• 1,187 beneficiaries in 2007 • Unemployed and student mothers receive €25 per month for 1 year
IViv. Serbia • Contributory scheme with leave for 13 months • Amount depends on work history: 30% of salary if 3 months of contributions; 60% if 3-6
months; 100% if over 6 months • Possibility of extension to 5 years if caring for child with special needs.
V. Sickness Benefits Vi. Albania
• Insurance-based temporary incapacity to work, paid for 6-9 months after 30 days incapacity
• 70% (less than 10 years contributions) or 80% (10 years or more) of average wage Vii. Bosnia and Herzegovina No information provided Viii. Montenegro
• All employees with contributions entitled to sickness leave • Up to 60 days paid by employer, over 60 days by health insurance fund • After 6 months, medical assessment needed to see if case made for disability pension • 100% of salary
Viv. Serbia No information provided. What is particularly striking about the above is that there is considerable variation in schemes in terms of how far they are means-tested and the link between payment size and period and contributions record for insurance-based benefits. A number of benefits are quite hybrid in nature, mixing elements of insurance-based, categorical and means tested schemes. Particularly striking is that unemployment benefits, with the partial exception of Montenegro where they were used to cushion the effects of the first wave of restructuring, have extremely low beneficiary rates, questioning their effectiveness as a poverty alleviation tool. The relative generosity of some maternity leave arrangements are also notable, suggesting that these have not yet been targeted in terms of reductions in public expenditure. The absence of child benefits in Albania and Kosovo and their rather limited utilisation elsewhere is also notable. Reforms appear rather ad hoc and not particularly evidence based and systematic in this area, unlike pension reform as we shall see in chapter 4 below.
44
2.2.5.2 Social Services for Children at Risk Whilst there is a strong traditional of social services in the region, the inter-linkages between education, health and social services are not always clear. In addition, there is still a relative underdevelopment of community-based social services such as day care, home care, respite care and so on, and an overemphasis on residential provision, often in large, isolated institutions and with little or no social casework to ensure that time spent in residential care for vulnerable groups is minimised. Whilst long-term care will be dealt with in chapter 5 more elaborately, and services for adults and children with disabilities are discussed below, we explore here the broad response in terms of social services for children at risk. Whilst not reaching crisis proportions as in Romania and Bulgaria, the region, with the partial exception of Albania and Kosovo, has high rates of children, including children under 3 years of age, in residential care. Table 2.2 below shows comparative rates of children in institutional care in the region, based on UNICEF MONEE figures36. In fact, it is in Croatia where the largest increase has occurred, with rates for 0-17 year olds in institutional care now above those in Romanian and Bulgaria, but increases have occurred between 2000 and 2006 throughout the region, except for Serbia, despite increasing awareness on the problems of institutional care. There is a scarcity of data on infants in residential care but rates appear to be much lower than in Bulgaria and Romania. Macedonia has shown a significant increase between 2000 and 2006, however. UNICEF data also show the proportion of all children in care who are in foster care or guardianship as opposed to residential care. Ratios vary from Bosnia and Herzegovina (64%) and Macedonia (59%) to Serbia (43%) and Croatia (37%). Ongoing social services reform efforts in the region have, thus far, concentrated on small-scale interventions at the level of institutions and not on a multi-level systemic approach to reduce entries and accelerate exit from institutions. Some institutions have closed and others have improved, but these measures have had little impact on overall service outcomes. Sometimes, alternative services have developed with no systematic assessment of which groups of clients need these services to prevent their reception into care or facilitate family and community reintegration. Incentives for non-institutional care providers are far from systematic throughout the region. 2.3 Financing of Social Protection In the context of economic crises, conflicts, and the low levels of social insurance contributors, public expenditures for social protection have faced immense problems and shortfalls throughout the region. As noted in chapters 1 and 5, expenditures on health and education have fallen or stagnated, with pensions expenditure facing the problems of worsening ratios between the working population and those who have retired. Albania’s consolidated expenditure on social protection was 6.7% of GDP in 2005, compared to 7.1% of GDP in 2000. 76% of all spending was on different insurance-based services, mainly pensions with only 1% going to insurance-based maternity benefits. The proportion of spending on social assistance fell from 2.3% of GDP (or 32% of all social protection spending) to 1.2% (19% of social protection spending) in the same period. In 2005, spending on non-means-tested disability benefits was above spending on means-tested social assistance (10% of total social protection spending compared to a mere 6% or 0.4% of GDP). Spending on labour market programmes is small and falling with unemployment benefit only 2% of all spending and only 0.1% of GDP in 2005 (Albania SPSI; 83). Income from social insurance accounted for 5% of
36 Carter (2005) asserts that some of these rate seriously underestimate the true numbers.
45
GDP in 2005 so that the remainder of social protection expenditure comes from central and local public budgets. In Bosnia and Herzegovina, accurate expenditure figures are hard to obtain given the complexity of institutional arrangements. Whilst, overall, social protection spending is not especially low at 15.1% of GDP in 2006, 8.4% of GDP is spent on pensions and a significant amount on various benefits for war veterans and their families (Bosnia SPSI Report), estimated by the World Bank to be over 3% of GDP in 2004 (Ramlak and Bodewig, 2006; 86). Again, very limited amounts are spent on social assistance, some 0.6% of GDP in 2004 according to the Bosnia SPSI Report. Importantly, given the over-decentralised nature of financing, amounts of expenditure vary between cantons in FBiH and between municipalities in RS. As an example, of the 10 cantons in FBiH, Sarajevo canton accounts for 73% of all expenditures (BiH SPSI Report). Spending per beneficiary of social assistance varies considerably, in FBiH from some 2000 KM (about €1020) in Canton Sarajevo to only 100 KM in Herceg-Neretva Canton. In RS municipal expenditures ranged from only 02% of the municipal budget to 10.8%, in terms of per beneficiary from 20 KM in Stari Grad to 823 KM annually in 2004 (Ramlak and Bodewig, 2006; 84). Significantly RS which has a centralised financing model, spent significantly more on child protection through child benefits than FBiH where the scheme is still decentralised (ibid; 85-6). Excluding public health expenditures, Montenegro public social protection expenditure amounted to 12.7% of GDP in 2007, down from 15.51% in 2000. Again contributory benefits, especially pensions dominates at 9.34% of GDP. Of the 1.23% of GDP on social assistance, only 0.53% of GDP is spent on the basic social assistance benefits, the rest being made up of veterans and disability protection (0.34% of GDP) and child allowances (at 0.16% of GDP). Spending on social care service is also low at 0.52% of GDP, significantly lower than in earlier years (SPSI Montenegro, p 57). A similar pattern can be found in Serbia where some 14% of GDP is spent on social protection, including 11.4% on pensions. All social assistance benefits account for only 0.81% of GDP with only 0.14% spent on the social assistance to families programme, about the same as on veterans and disability and on child benefits (Serbia SPSI Report; 48). Kosovo spent 3.2% of GDP on its social assistance programme but, overall, it is recognised that social protection spending, at between 14 and 17% of all government spending, is low by international comparisons (SPSI Kosovo report). Whilst trends are hard to determine, the nature of ‘locked in’ contributory insurance-based benefits in the context of a crisis in contributions puts great strain on those social programmes funded from the main state budget. At the same time, partly for political reasons, social programmes are oriented not only to the poor and excluded but to some interest groups, notably veterans who have ‘captured’ aspects of social protection policy. To complete the circle, International Financial Institutions, looking for reductions in public expenditure, sometimes advise cuts in the very programmes which are designed to reach the poor and vulnerable, whilst arguing that such programmes should be better tailored to reach the poorest of the poor. In a situation where there is little incentive to develop more responsive programmes, these distortions play out in an erosion of welfare regimes. What is less often noted is the reduction of non-pension contributory schemes, notably unemployment benefit. Hence, the trend has been towards means-tested rather than universal benefits with coverage and rates varying considerably. Social assistance schemes are mainly administered by social workers in CSWs or local officials and do not perform well in terms of poverty alleviation with low coverage, with Sansier (2006; 42) estimating between 5% of the population in Croatia to 15% in Kosovo, low benefit levels and some errors of inclusion. Low levels of benefit relate to the influence, again, of key international organisations and a fear of creating disincentives to take low paid work.
46
2.4 Social protection of the most disadvantaged groups
2.4.1 Persons with disabilities Services for children and adults with disabilities are framed within a legacy of a rather under-funded system combined with an over-medicalised approach leading to over-representation of children and adults with disabilities in residential care or otherwise isolated in unsupported family environments. Social services has not yet been transformed into being an enabler for people with disabilities to access appropriate education services, health care and, above all, to enter the labour market free of discrimination and other barriers to access. A recent report (Chiriacescu, 2006) suggests that movement away from a model of caring for ‘invalids’ has been slow in South East Europe, in the absence of basic community-based services and specialist outreach and support services. Furthermore, people with disabilities still have too little voice in services. The point regarding the lack of appropriate regulatory mechanisms is important. Whilst many countries in the region have developed strategies for people with disabilities there are questions regarding the monitoring and follow-up of commitments made. Barriers exist to the free movement of people with disabilities in terms of interlinked issues of lack of individual support services, absence of accessible housing, limited access to public buildings and spaces, and inadequate accessible public transportation (Disability Monitoring Initiative, 2006). In parts of the region, education for children with disabilities is not well integrated into mainstream education, with educational support offered only in residential type boarding schools. In these, disabilities are classified medically so that, for example, the nearest school for a child with a visual impairment may be some way away from the family home. In the countries affected by recent wars, benefits for disabled soldiers and civilian victims of war are separately administered and, often, more generous than other disability benefits. Overall, benefits are based on medical models of amount and type of disability and tend to be relief oriented rather than supportive of entering the labour market. Whilst in some of the region sheltered workshops do still exist, these are more protective than empowering in nature and, in some countries, even this lifeline has been eroded. UNICEF’s important comparative report on children with disabilities in Eastern Europe shows that in those countries where information is available (Croatia, Macedonia and Serbia and Montenegro), fewer children with disabilities receive any social services compared to an international benchmark but that significantly more now receive tailored cash assistance rather than institutional care (UNICEF, 2005; xiv). In all three countries, the percentage of children with special needs in mainstream education is reported to be less than 1%, amongst the lowest in the region and 10 to15 times below international benchmarks (ibid; 19). 2.4.2 Roma and other minorities Roma in the region have been said to have a somewhat ‘asymmetrical’ relationship to social welfare (UNDP, 2006). Whilst Roma are over-represented in parts of the region as recipients of social assistance, they are also over-represented in terms of more punitive aspects of the system, notably in terms of juvenile offenders’ institutions. Multiple deprivations and discriminations tend to reinforce each other in terms of access to citizenship, education, employment, and health and security, with negative outcomes in terms of high risk of poverty and social exclusion. Poverty rates for Roma are discussed in Chapter 3 and health issues in Chapter 5. Whilst the UNDP survey shows gaps between Roma and other children in terms of school enrolment at all levels, this is lower in terms of completion of elementary education (68 compared to 98%) and widens in terms of primary completion (33% to 86%) and secondary education (8% to 64%), with only 74 out of over 15,000 Roma respondents having completed some tertiary education (UNDP, 2006; 29). Whilst enrolment rates and attainment rates were lower for women, correlation with age was striking, with those over 50 and under 19 worse of than those between 25 and 49 whose schooling
47
was during the 1970s and 1980s, suggesting that, whatever their many faults, pre-transition education systems were better for Roma (ibid; 33). The survey also shows that Roma unemployment rates are between 1.5 and 3 times as high as the general rate (ibid; 42), but that, apart from Montenegro (where the rates are 12% for Roma and 8% for the majority), there are even greater differences in terms of rates of participation in the informal economy (Macedonia 45%-17%; Serbia 58%-13%; Kosovo 66%-33%; Bosnia and Herzegovina 78%-27%; and Albania 79%-22%) (ibid; 44). Also interesting are comparisons of Roma and non-Roma unemployment by level of education, showing that the more educated Roma face particular difficulties in obtaining employment, so that the extent to which higher education improves employment prospects is lower for Roma, and much lower for Roma women. All of the reports note the issues facing other minority communities including linguistic minorities as well as contiguous minorities who may be the focus of interest of a neighbouring state or territory. This is, of course, at its most complex in Bosnia and Herzegovina where the entire administrative arrangements are implicitly if not explicitly ethnicised, with limited rights cross-entity (and even inter-canton in FBiH) allowed. The point that minorities are discriminated against, particularly in the public sector and in terms of access to public services (Bosnia and Herzegovina SPSI; 99) is echoed in other reports. In Kosovo, the existence of parallel institutions for minorities is noted as well as the attempt to further decentralise services in order to accommodate minority issues. Lack of trust between minorities and public institutions is evidenced by the fact that there are few if any agreed systems of ethnic monitoring in employment in place. 2.4.3 Other vulnerable groups Notwithstanding the fact that exclusion is a cross-cutting issue in which people can face exclusion on the basis of multiple achieved or ascribed characteristics, it is worth noting, briefly, here, a far from exhaustive list of other vulnerable groups who have, perhaps, not had sufficient attention paid to them within national debates on poverty and social exclusion. Of the seven broad ‘drivers of exclusion’ noted in a recent report (Groves, 2006)37 and discussed further in chapter 3, HIV/AIDS is, perhaps, seen as less salient given relatively low transmission rates although, in some ways, this compounds discrimination and lack of public awareness of discrimination against people living with HIV/AIDS. Throughout the region, there are real dangers of complacency caused by under-reporting and, given the prevalence rates of transmission through heterosexual sex, the possibilities of significant increases. Fatality rates are high, in part as a result of the problem of obtaining retroviral drugs. Another group not discussed enough in the region are the prison population. There is new work on issues regarding children and young people in conflict with the law, pointing to the ‘twilight zone’ between arrest and conviction and the dangers of deprivation of liberty without sufficient legal safeguards (UNICEF, 2008). Other groups at risk include the homeless, where there is a serious shortage of data, people with dependency problems, still subject to over-medicalised care, and sexual minorities where discriminatory laws and practices are only slowly being challenged.
2.5 Drivers of reform and system sustainability Social protection throughout the region is somewhat marginalised in reform efforts, in part because it is forced to respond to reforms in other systems which are seen as of primary
37 The others are Ability/Disability; Age (in terms of children and youth and older people); Gender; Ethnicity; Post-conflict issues (relating especially to refugees and displaced persons) Spatial/Regional Exclusion; and Unemployment.
48
concern, particularly employment, health, and education systems, as well as justice systems and family and demographic policies (cf. Bošnjak and Stubbs, 2007). In addition as noted above, macroeconomic constraints, combined with the reform agendas of some parts of some International Financial Institutions, have limited the possibilities of change and tended to focus on the costs of benefits and services. External assistance has, also, at times, contributed to a fragmented, inconsistent, badly sequenced, and short-term reform agenda. Reform efforts can be, or can be seen to be, piecemeal and un-coordinated, rather than carefully planned, synchronized, and with a clear and agreed division of labour. What has been termed a ‘passion for pilot projects’ (Stubbs, 2007) has, sometimes, proved to be unsustainable and has created false positives, and new agencies have been created which compete in a crowded arena for the leadership role in reforms. Whilst there have been opportunities for learning from good practice, this has not happened in any concerted way. Elsewhere, the author has suggested that social protection reforms are dependent upon a complex mix of political will; institutional fit (including policy coherence, governance capacity, practice competence, user voice); and fiscal space and commitment (Stubbs, 2008). Whilst progress is being made in terms of institutional fit in some instances, political commitment is often, at best, half hearted. In addition, whilst more resources is not the key problem, there is a danger that ‘locked in’ expenditures on infrastructure and on institutional care blocks the development of better, and cheaper community-based alternatives.
2.6 Conclusions and key challenges In terms of the EU objectives, it is far from the case that there is “access for all to the resources, rights and services needed for participation in society, preventing and addressing exclusion, and fighting all forms of discrimination leading to exclusion” (Commission objective 1). The main obstacles to progress here are economic and political, with the combination of conflicts and difficult transition still being felt. Discrimination remains an unresolved issue in mush of the region, with a range of groups facing direct and indirect discrimination. Legislation either does not yet exist or is poorly implemented. Participatory processes and transparency within social protection services remains quite limited, in part a legacy of the past and a result of the lack of voice of service users. In addition, in many parts of the region, the governance of services has become unnecessarily politicised. In terms of ”the active social inclusion of all, both by promoting participation in the labour market and by fighting poverty and exclusion” (Commission objective 2), there are also continued problems, including those noted in chapter 1 regarding the labour market. The shift from a focus on (absolute) poverty to a wider focus on social exclusion has not yet been made in many countries. In addition, linkages between labour market and social protection institutions are, still, not well developed. Despite some greater attention to strategy development, beyond projects and programmes, the main deficit is still in terms of ensuring that “social inclusion policies are well-coordinated and involve all levels of government and relevant actors … (and) that they are efficient and effective and mainstreamed into all relevant public policies” (Commission objective 3). Thus far, it is rare to see social inclusion as a governmental priority and, when it is, this is still too reliant on external donor support and, therefore, may not e sustainable. Weak governance structures and poor horizontal and vertical co-ordination are a wider problem but this, too, impacts on weak co-ordination of social inclusion policies. In addition, as noted above, different solutions to the question of the appropriate scales for social protection services exist in the region, but none can be said to be optimal.
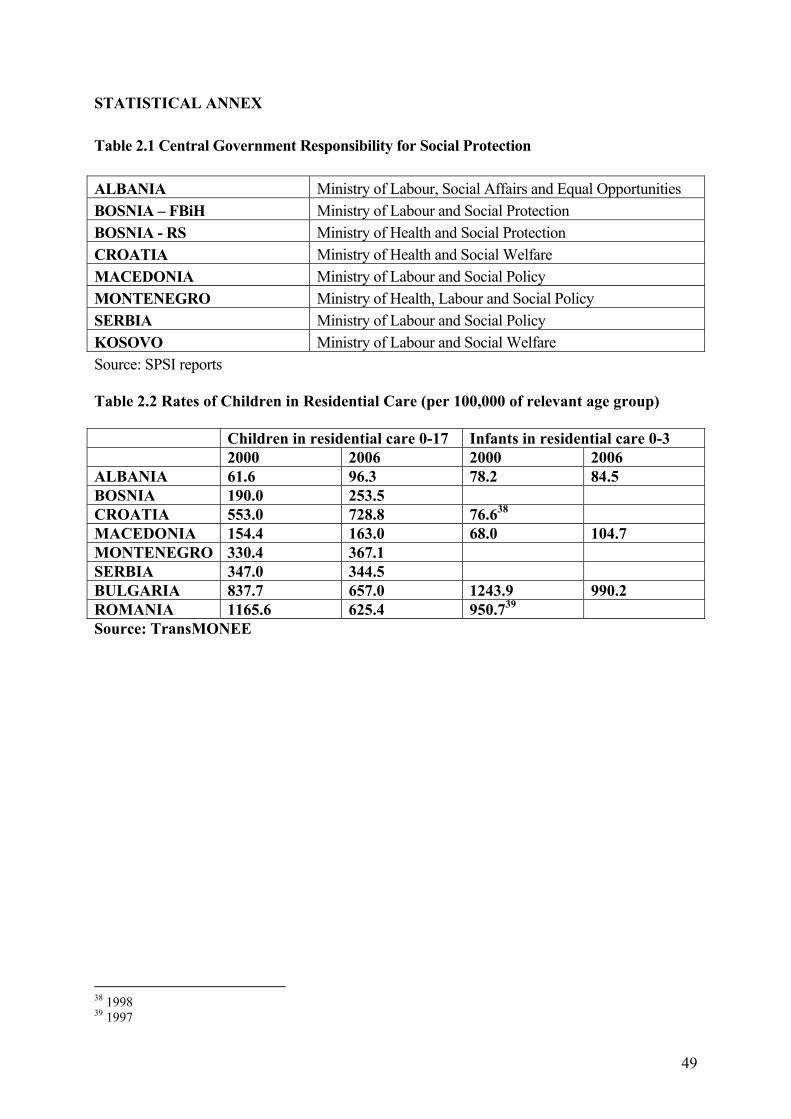
49
STATISTICAL ANNEX Table 2.1 Central Government Responsibility for Social Protection ALBANIA Ministry of Labour, Social Affairs and Equal Opportunities BOSNIA – FBiH Ministry of Labour and Social Protection BOSNIA - RS Ministry of Health and Social Protection CROATIA Ministry of Health and Social Welfare MACEDONIA Ministry of Labour and Social Policy MONTENEGRO Ministry of Health, Labour and Social Policy SERBIA Ministry of Labour and Social Policy KOSOVO Ministry of Labour and Social Welfare Source: SPSI reports Table 2.2 Rates of Children in Residential Care (per 100,000 of relevant age group) Children in residential care 0-17 Infants in residential care 0-3 2000 2006 2000 2006 ALBANIA 61.6 96.3 78.2 84.5 BOSNIA 190.0 253.5 CROATIA 553.0 728.8 76.638 MACEDONIA 154.4 163.0 68.0 104.7 MONTENEGRO 330.4 367.1 SERBIA 347.0 344.5 BULGARIA 837.7 657.0 1243.9 990.2 ROMANIA 1165.6 625.4 950.739 Source: TransMONEE
38 1998 39 1997
50
REFERENCES Bošnjak, V. and P. Stubbs (2007) Towards a New Welfare Mix for the Most Vulnerable: reforming social services in Bosnia-Herzegovina, Croatia and Serbia, in EIZ Social Policy and Region development: Conference Proceedings. FES/EIZ: Zagreb. Web: http://www.fes.hr/E-books/pdf/Social%20Policy%20and%20Regional%20Development/Overview.htm (accessed 9 January 2009). Carter, R. (2005) Family Matters: A study of institutional childcare in Central and Eastern Europe and the former Soviet Union. London: Every child, web: http://www.everychild.org.uk/media/documents/Family_Matters_full.doc (accessed 13 January 2009) Chiriacescu, D. (2006) Ensuring Access of People with Disabilities to Social Services: the need for regulatory mechanisms in South East Europe. Disability Monitor Initiative South East Europe, web: http://www.disabilitymonitor-see.org/documents/Regulatory_mechanisms_HISEE.pdf (accessed 1 September 2008). Disability Monitoring Initiative (2006) Free Movement of People with Disabilities in South East Europe: an inaccessible right. Belgrade: Handicap International, web: http://www.disabilitymonitor-see.org/documents/dmi2_eng/dmrII_webeng.pdf (accessed 9 January 2008). Groves, L. (2006) Desk Review of Social Exclusion in the Western Balkans. London: DFID, web: http://www.dfid.gov.uk/Pubs/files/socialexclusion-deskreview-aug06.pdf (accessed 1 September 2008). Maglajlić-Holiček, R. A. and Rašidagić, E. K. (2007) ‘Bosnia-Herzegovina’, in B. Deacon and P. Stubbs (eds), Social Policy and International Interventions in South East Europe, Cheltenham: Edward Elgar, pp. 149- 166. Matković, G. (2006) ‘Decentralisation of Social Welfare in Serbia’ (2006) Belgrade: Center for Liberal-Democratic Studies. Ramlak, V. and C. Bodewig (2006) Bosnia and Herzegovina Social Welfare Reform Agenda: the challenges, in Social Policy Conference background papers 31 January; 80-87. Sarajevo: IBHI. Sansier, F. (2006) Regional Assessment Report on Social Security Financing Issues. Council of Europe/CARDS Social Institutions Support Programme, July web: http://www.coe.int/T/DG3/SISP%5CSource%5CSISP(2007)ExpRepFinIssFS.doc (accessed 28 May 2008). Stubbs, P. and J. Warwick (2003) Social Services in a reformed Social Welfare System in Croatia (Croatian language text) in Revija za socijalnu politiku (Croatian J. of Social Policy) 10(3); 335 – 356. Web: http://www.rsp.hr/ojs2/index.php/rsp/article/view/109/113 (accessed 8 January 2009).
51
Stubbs, P. (2007) International Organizations and Child Care System Reform in South East Europe. Report for UNICEF CEE/CIS. Web: http://www.unicef.org/ceecis/IO_and_CCR_SEE.pdf (accessed 9 January 2008). Stubbs, P. (2008) A Missed Opportunity?: Social and Labour Market Policies in the Western Balkans, in Friedrich Ebert Stiftung (eds.) Ownership for Regional Co-operation, forthcoming. Web: http://paulstubbs.pbwiki.com/f/Social+Region+Stubbs.pdf (accessed 7 January 2009). Šućur, Z. (2003) The Development of Social Assistance and Social Welfare in Croatia After World War II (Croatian language text), in Revija za socijalnu politiku (Croatian J. of Social Policy) 10(1); 1-22. Web: http://www.rsp.hr/ojs2/index.php/rsp/article/view/137/141 (accessed 9 January 2009). UNDP (2006) At Risk: Roma and the Displaced in South East Europe. Bratislava: UNDP Regional Bureau for Europe and the CIS. Web: http://europeandcis.undp.org/poverty/show/1F1720E9-F203-1EE9-BC7AE7B9E8FA04E4 (accessed 27 August 2008). UNICEF (2005) Children and Disability in Transition in CEE/CIS and the Baltic States. Innnocenti: Florence, web: http://www.unicef.org/ceecis/Disability-eng.pdf (accessed 1 September 2008). UNICEF (2008) Lost in the Justice System: children in conflict with the law in Eastern Europe and Central Asia Geneva: UNICEF CEE/CIS, web: http://www.unicef.org/ceecis/Lost_in_the_Justice.pdf (accessed 9 January 2009). Zaviršek, D. (2008) Engendering Social Work Education Under State Socialism in Yugoslavia. In British Journal of Social Work 38(4); 734 – 750.
52
3: Poverty and Social Exclusion: dimensions, characteristics, trends and strategies 3.1 Researching Poverty and Social Exclusion in Historical Perspective Research on poverty and social exclusion was quite limited throughout former Yugoslavia and even more so in Albania during socialism. The Albania SPSI Report notes that “words such as ‘poverty’ or ‘excluded’ did not even exist in the Albanian socialist society’s lexicon” (Albania SPSI p. 88). In former Yugoslavia, there was virtually no focus on these issues in what has been called the first phase of socialism, marked by a kind of ‘social automatism’ in which it was assumed that “the development of socialist society itself would prevail … and solve the remaining social problems” (Puljiz, 2005; 80). In the more liberal era of socialist self-management there was concern with unemployment, poverty and various kinds of ‘social deviance’ leading, as noted above, to professional and academic studies and responses. Much of the research in this period was concerned rather more with social stratification and with “what level of social difference should be allowed in a socialist society” (Vidmar, 2000; 2). An important paper by World Bank economist Branko Milanović as a background for the 1990 World Development Report (Milanović, 1990) compares poverty in Hungary, Poland and Yugoslavia from 1978 to 1987. He uses data from the 1978 and 1983 Yugoslav Household Budget Surveys combined with smaller annual surveys. Although the lines used had no administrative implication in terms of social assistance means-tests, nor scientific value in terms of consumption basket prices, the comparison shows clearly the nature of the prolonged crisis in Yugoslavia in the 1980s. He compares key indicators using 1978 (the last but one year of prosperity) as a benchmark. Data combines workers and pensioners and distinguishes these from farmers (Table 3.1). Poverty rates show an (unexplained) decline in 1983 but rise subsequently. By the mid-1980s, rates are close to those of Greece (Table 3.2). In line with a degree of marketisation, poverty rates would be affected more by redistribution than growth, with Yugoslavia’s Gini coefficient estimated at between 0.3 and 0.32. Crucially, Milanović asserts that the impact of the crisis on a rapidly industrialising society should not be underestimated and that, despite agricultural poverty rates being higher, the crisis affected the urban employed most severely. He suggests: “While increased urban poverty can be politically accommodated if it is the result of people migrating from villages, looking for better jobs and accepting a temporary decline in their standard of living in anticipation of an early improvement, a descent into poverty of people who are already living in cities is socially much more destabilizing.” (Milanović, 1990; 16-17 italics in original). One issue which Milanović does not address is the extent of, and increase in, differences in living standards and, by implication, poverty rates, between the different republics and territories within former Yugoslavia. Tables 3:3 and 3.4, taken from the Kosovo SPSI study show the amount of resources available for urban and rural households in 1983 and the amount of the population lacking basic necessities by Republic and province. Given significant differences in wealth but not major differences in degree of inequality within the republics, it may be fair to suggest that ‘absolute’ poverty differed considerably within SFRY whilst relative poverty did not. 3.1.1 Poverty Measurement in Transition In the first phase of transition, there was very little systematic work on poverty and social exclusion, although UNICEF’s TransMONEE project began to trace, particularly in its
53
reports of 1994 and 1995, the contours of a severe welfare crisis in Central and Eastern Europe, reflected, inter alia, in an upsurge in mortality, falls in the birth rate, and increases in poverty (UNICEF 1994; 1995). Conflicts in the region meant that, with the exception of Slovenia, there was virtually no data for former Yugoslavia. Later, there were a number of rather ad hoc studies of poverty, many small-scale and/or focused on perceptions of poverty rather than on actual realities. Gradually, particularly in the initial post-conflict period, more comprehensive poverty studies emerged usually with some participation of national public statistical agencies but quite clearly dominated by the methodology of the World Bank which succeeded in promoting particular concepts of absolute poverty. It is not, of course, that the concept itself or the rather sophisticated set of methods used to calculate a consumption-based food basket absolute poverty line are flawed but, rather, that there are other equally plausible and pertinent concepts available which tend to be ignored within the approach. In addition, the World Bank in this initial phase tends to create its own stakeholders through building the capacity of national researchers and policy makers in these approaches. In any case, all of the countries in the region have gone through this second phase in which external agencies tend to experiment with different methodologies for calculating an absolute poverty line using diverse kinds of survey data. Broadly speaking, in this phase both nationally specific and more regionally-specific absolute poverty lines get used, with the former reflecting the cost of a broad basket of goods and the latter some notion of an acceptable cut off point for the region as a whole. Whilst both kinds of World Bank methodology tend to dominate in this phase, work related to the Millennium Development Goals, and other sets of indicators promoted by different international agencies, also provide some useful but not strictly comparable data. In a third phase, more regular and comparable Household Budget Survey data begins to emerge, with national statistical offices beginning to own the process more. In some countries, this goes alongside a greater diversity of studies and re-analysis of data. Studies emerged seeking to explore particular issues in terms of the structural nature of poverty risk and with more attention paid to non-monetary indicators. Crucially, micro-studies also emerged focusing attention on excluded groups who may be relatively invisible in national representative surveys. A fourth phase, only really apparent in Croatia and the former Yugoslav Republic of Macedonia thus far to any extent, involves a much more explicit ‘Europeanisation’ of poverty statistics and measurement, through allying both the methodologies and indicators used with the approach which is found throughout the European Union and which is more focused on relative poverty, on non-monetary indicators, and on harmonisation of data and surveys. Whilst there are some EU compatible poverty indicators which have been calculated, either directly in national poverty surveys or through re-analysis, this is far from systematic in the region and, crucially, panel and trend-based poverty data do not yet exist. The new Eurostat pocketbook on the region contains no data on poverty, for example. Nevertheless, Eurostat has agreements in place with all the countries of the region on statistical capacity building so that, in the future, more comparative poverty data will be available. 3.2 Poverty Profiles Compared 3.2.1 Regional Comparisons In this section, we summarise the main poverty profiles presented in the five SPSI Western Balkans studies. Prior to that, however, we briefly survey work which has looked at trends and comparisons in the region as a whole. One of the most comprehensive studies is the World Bank’s Poverty, Inequality and Growth study (World Bank 2005) which explores trends in the period 1998-2003 in Eastern Europe and the former Soviet Union. The study
54
uses two poverty lines, an ‘absolute poverty’ line of USD 2.15 per day and an ‘economic vulnerability’ line of USD 4.30 a day using 2000 PPP. Compared to other sub-regions, South East Europe (including Croatia, Bulgaria and Romania) has moderate levels of economic vulnerability which would require significant economic growth to reduce. Table 3.5 shows the rates for the countries for which data was available, suggesting that only Albania and Romania had significant absolute poverty rates but that levels of vulnerability were high everywhere, between 24% and 71%. A new comparative study is currently nearing completion. Gordana Matković’s 2005 survey for UNDP, published in 2006 (Matković, 2006) discusses the impact of war, destruction, decline in GDP, economic deprivation and transition on poverty and social exclusion, pointing out that the decline in living standards of the middle class and the gathering of a large proportion of households just above absolute poverty lines present serious political, economic and social challenges. The report also notes the erosion of human security not captured by human development indices which have remained quite high. Using national poverty lines she estimates some 17% of the population of the Western Balkans to be living in poverty, some 4 million people, concentrated in Albania, Kosovo, Bosnia and Herzegovina and Serbia. Extreme poverty is present in significant parts of the population in Albania and Kosovo with some evidence that it also exists in Serbia and Montenegro. Crucially, in the context of standard surveys’ failure to reach some of the poorest groups, Roma, RDPs and others who may be unregistered, she suggests that “Western Balkan countries must be aware that official assessments are likely to be partly misleading and can underestimate the magnitude of the problem” (Matković, 2006; 14). Matković also notes relative poverty rates with 2000 and 2001 rates of consumption at 60% of the median being 13.5% in Albania, 17.2% in Croatia, 20.2% in Serbia and 11% in Montenegro. BiH is calculated at 66% of the median (16.7%) and the former Yugoslav Republic of Macedonia and Kosovo at 70% of the median (22.6% and 25.1% respectively). Overall, she lists the unemployed, households with many children, elderly households and the less educated as especially vulnerable, together with those in rural or underdeveloped regions, Roma, RDPs, and persons with disabilities. She traces an emerging phenomenon of a ‘new poor’ of older workers who become unemployed, pensioners with low pensions and low waged and irregular workers. Matković’s text is important in that it seeks to bridge a gap between absolute and relative poverty studies urging the collection of indicators which are appropriate for the region’s development and which also reflect EU best practice. A desk review of social exclusion in the Western Balkans completed in 2006 for DFID (Groves, 2006), covered all of the countries in this report, except for Montenegro. It notes the complex relationship between poverty, social exclusion and multiple deprivations, and discusses a number of ‘drivers of exclusion’ including disability, age (both children and youth and the elderly), gender, living with HIV/AIDs; ethnicity or RDP status; spatial exclusion (especially those living in remote rural areas); unemployment; low education; and participation in the informal economy. The report mentions the importance of discrimination, including discrimination on the basis of sexual orientation. It also notes the existence of child labour as a “socially accepted coping mechanism” (ibid; 41), in family based agriculture, in construction, and in small crafts. As part of the conclusion, the author suggests: “Further analysis will be needed to provide quantifiable, comparative conclusions which could guide programming as to which combinations lead to the worst forms of social exclusion in any given context.” (ibid; 43). An earlier DFID overview points out that national aggregate statistics do not show significant and increasing regional disparities. Indeed, it suggests that:
55
“Poverty is concentrated in a distinct band encompassing Kosovo and its immediate surroundings: north and northeast Albania, southern Serbia and northern Macedonia (as well as) … Western Serbia and, within Bosnia & Herzegovina, Republika Srpska.” (DFID, 2004; 4). As the report notes, these areas have traditionally lagged behind and, it could be added, benefit least from the fruits of recent economic growth. It is in these regions where traditional rural poverty is now joined by new urban poverty, albeit not unlike the urban poverty of the late 1980s, and by poverty in war affected areas. 3.2.2 Poverty and Exclusion in Albania The LSMS/World Bank absolute poverty line in 2005 was €40 per person per month and extreme poverty line was €25. Surveys show a decline in absolute poverty from 25.4% of the population in 2002 to 18.5% in 2005, and a decline in extreme poverty from around 5% in 2002 to 3.5% in 2005. Reductions are a result of sustainable growth and of remittances. Urban poverty has declined more than rural poverty (19.5% to 11.2% compared to 29.6% to 24.2%). Rates are significantly higher in households without any member who has permanently migrated compared to those with at least one permanent migrant (21.2% compared to 11.8%). Poverty as measured by the EU Laeken indicator in terms of 60% of median consumption has increased in the same period, from 20.4% in 2002 to 21.2% in 2005. The figures show significant gender differences with rates of female poverty increasing considerably (from 18.9% to 23%) while male poverty has decreased slightly (from 20.8% to 19%). In terms of non-material indicators, housing infrastructure appears to be more correlated with the urban/rural divide than with the poor/non-poor divide. One interesting finding from the Albania SPSI report is that property owners have a higher poverty risk than those who rent. One significant issue is the poor housing conditions of some of those who have moved to the major cities particularly Tirana in search of employment, a significant proportion of whom live in unplanned and illegal settlements on the edge of Tirana. Inequality as measured by consumption is moderate but slightly increasing, with the GINI coefficient changing from 0.28 in 2002 to 0.30 in 2005, reflecting a slight increase in urban inequality. Groves in her desk review notes rurality, poverty, gender and age as key drivers of social exclusion whilst noting that more information is needed on issues of disability, quoting figures from the 2005 National Strategy on People with Disabilities suggesting that only 2,275 out of 9,533 (24%) of people with disabilities classified as partially able to work have found employment. Children are a particular at risk group, in terms of poverty but in terms of school drop-out, exploitation, blood feuds, trafficking, and child labour. Albania now has a cross-cutting Social Inclusion Strategy (SIS) approved in January 2008, which is a component of the National Strategy for Development and Integration, and is modelled on EU Social Inclusion National Action Plans (Sulka, 2008). Its three strategic priorities are: 1. to raise the income generation opportunities of individuals through facilitating labour market participation of particular groups, extending and formalizing labour market and promoting lifelong learning, 2. to facilitate access to services (social care, education, health, justice, housing, transport, telecommunications, water and sanitation), and 3. to assist vulnerable groups.
56
In terms of the third priority, a number of other strategies exist within the SIS such as children, Roma, people with disabilities, women, young people at risk and older people. NGOs form a social inclusion Advisory Group and there is evidence of increased inter-Ministerial co-ordination. However, the Albania SPSI report notes the lack of attention to monitoring, the general nature of indicators used, and the lack of clarity in terms of institutional responsibility, co-ordination, and alignment with other strategies (Albania SPSI, p. 55). 3.2.3 Poverty and Exclusion in Bosnia and Herzegovina LSMS/World Bank absolute poverty line in 2004 was €94.72 per month and the extreme or food poverty line was €32.89 per month, slightly higher than when the first LSMS poverty survey was undertaken in 2001. Overall, absolute poverty rates fell from 19.5% to 17.8% with the gap between the entities narrowing with rates in FBiH falling from 16.3% to 15.4% and in RS from 24.8% to 20.8%40. In both survey, so-called mixed municipalities had higher poverty rates (falling from 24% to 23%) than either urban municipalities (with rates declining from 14% to 11%) or rural municipalities (where rates fell from 20% to 18%). Inequality measured by the GINI coefficient was stable at 0.26. The 2004 report calculated relative poverty, using 2/3 of the median as the cut off point rather than 60%, and using income rather than consumption. The poverty line using this calculation was €127.80, with the overall headcount rate 35.7%, significantly higher in RS at 41.9% compared to FBiH at 27.6% and amongst female headed households (61.4%) compared to male headed households (33.5%). After four waves of surveys, BiH has data on persistent poverty, with 17.1% of households in RS and 10.3% in FBiH in poverty in all four surveys, whilst only 32.2% in RS and 46.3% in FBiH were out of poverty across all four waves. The 2007 National Human Development Report for Bosnia and Herzegovina explicitly combines a UNDP focus on human development with a European Union social inclusion focus (UNDP, 2007). It went beyond the traditional Human Development Index to calculate a Human Social Exclusion Index adding participation in society and access to services and using different proxies for living standards, health and education. It suggests that in 2006 some 50.32% of the BiH population was excluded in some way (UNDP, 2007; 31) and 21.85% suffered ‘extreme social exclusion’. The annex to the report, much of it included in the BiH SPSI, calculates Laeken indicators based, primarily, on the 2004 HBS, finding an at-risk-of-poverty rate expressed as 60% of median income of 23.7%, with higher risks for persons over 65 (31.4%), unemployed males (43.6%), and two-member households with one member over 65 and with no support from children (36.1%). The precise equivalence rates used are hard to decipher from the text although it seems to be adult in single-person household €72.60 and spending on children under 14 less than €22. The nature of governance in Bosnia-Herzegovina raises particular challenges from a social inclusion perspective, with Groves emphasising problems of discrimination in the two entities, and the fact that social protection benefits are heavily dependent upon residence, both in terms of type and level and the lack of portability of benefits. Minority returnees are another group at particular risk of social exclusion (Groves, 2006). There have been a number of attempts by international organisations to place the responsibility for strategic responses to social exclusion at the level of the central state, albeit with somewhat limited results. Bosnia’s Poverty Reduction Strategy was integrated into a 40 The BiH SPSI report cautions that a somewhat high estimate of BiH population was used in calculating these rates.
57
Medium-Term Development Strategy for 2004-7. Currently, a Social Inclusion Strategy for 2008 – 2013 is being developed as part of the country Development Strategy for the same period (Marić, 2008). Whilst strong on stakeholder participation, these documents face problems in terms of the disconnect between strategic goals and decisions on financing. The Department for Economic Planning (DEP) linked to the Council of Ministers remains responsible for monitoring the strategy including the social protection aspects but recognises that a national strategy and action plan is still missing. The new strategy, due to be ready by March 2009, but with Action Plans and financial tables only ready by the end of 2009, contains five key goals which seem very vague and wide ranging, improving pensions policy; protection of families with children; health care services; education, and employment and social policy. Whilst, according to the BiH SPSI Report, the MTDS measures offered “a sound framework for the reform of the system” (Bosnia SPSI, p. 79), most have either not been implemented or implemented only partially, with both entities still said to be lacking coherent social inclusion strategies. 3.2.4 Poverty and Exclusion in Montenegro Montenegro has little comparative trend-based poverty data although it is possible to compare results from the 2006 HBS with those in 2005, the latter constructing an adult equivalent poverty line at €144.68 per month and a vulnerability line at 25% above this, namely e180.85 per month. Overall poverty rates remained the same in both years at 11.3%, with vulnerability decreasing slightly from 25.3% in 2005 to 23.6% in 2006. Montenegro’s GINI Coefficient is also estimated to have fallen from 0.26 in 2005 to 0.24 in 2006. Overall, poverty is concentrated in rural areas and in the North of the country, with poverty rates twice as high in rural as opposed to urban areas. Risk factors include large households; households with three or more children; households headed by someone unemployed or inactive; and households headed by those with low educational attainment. In addition, smaller surveys have identified Roma, RDPs and people with disability, alongside older people and children, as particularly at risk (Montenegro SPSI Report). The study reports plans to begin calculating Laeken indicators but no such work has yet been carried out. Montenegro’s Government adopted in 2007 a Poverty Alleviation and Social Inclusion Strategy (PASIS) for 2007 – 2011 which is explicitly conceived as a follow-up learning lessons from the earlier Poverty Reduction Strategy (Mijušković, 2008). It stands alongside and, to an extent, incorporates a number of other strategies, on Child Protection, Inclusion of People with Disabilities, Elderly Protection, on Refugees, and on Roma. Whilst the Montenegro SPSI report does not explicitly assess the strategy, as it is in its infancy, it appears that many similar issues of monitoring and of inter-agency co-operation and coordination will arise as in other parts of the region. 3.2.5 Poverty and Social Exclusion in Serbia Serbia’s headline poverty figures derive from the LSMS and it is possible to compare the results from 2002 when 14% of the population was at risk of poverty with 2007 when the rate was more than halved to 6.6%. There has been very little work done on the Laeken indicators although the 60% median poverty rate is said to be 14.6% in 2007. The GINI coefficient for consumption is 0.297. Poverty is concentrated in rural areas, especially in the South East of Serbia, amongst the less educated, the unemployed and the elderly. There are significantly higher at risk of poverty rates for households with two or more children under 6, for large households with 6 or more members and, unlike in 2002, the at risk rate for children over 14 is now also high. Specific studies also suggest that rates for Roma and for IDPs, as well as for persons with disabilities are also high. In terms of social exclusion, Groves notes women and
58
Roma as at risk groups but also notes increasing evidence of discrimination and, indeed, violence against gay men. She notes the regional distribution of poverty and the combination of ethnic and religious tensions. As noted in Chapter 2, Serbia has well-developed strategies for fighting poverty and social exclusion with a focal point for poverty reduction strategy in the office of the Deputy Prime Minister (Šunderić, 2008). Notably, statistical alignment in further advanced than in some places with preparation for some version of SILC already underway. In general terms, it can still be argued that the anti-poverty focus means that Serbia still lacks an overall strategy on social inclusion, however, and the Serbia SPSI report suggests that “no positive actions” have been taken on this issue (Serbia SPSI, p.184). 3.2.6 Poverty and Social Exclusion in Kosovo Under UNSC 1244 The HBS rate of poverty from the 2005/6 survey using an adult equivalent consumption level of €43 per month is 45.1%, with 16.7% of the Kosovo population extremely poor. Poverty has risen in rural areas and declined in urban areas since a comparable survey in 2003/4. The GINI coefficient is calculated to be 0.30. At risk of poverty rates are higher for larger households, households with dependent, female headed households and low educated heads of households. There is some evidence of a higher risk of poverty for children, too. Many non-material indicators show a considerable gap between rural and urban households, rather more than between the poor and non-poor, in fact. Groves (2006) suggests that in Kosovo, all social exclusion drivers are present, with particular issues facing minority groups, including Roma, and people with disabilities, in the context of widespread poverty. The locus of social inclusion strategies is hard to decipher in the context of the uncertainty regarding development planning and, although a new Medium-term financial framework offers some focus on social protection question, much of this remains rather donor driven. 3.2.7 Comparisons and a Cautionary Note Notwithstanding some discrepancies in figures, it is possible to update Matković’s table using absolute or administrative poverty lines from 2000-2002 with data in the SPSI reports which are from 2004 to 2007 (Table 3.6). They show that poverty rates have declined throughout the region except for Montenegro where they appear to have risen but that declines have only been above single digits in Albania and Serbia. Extreme poverty has increased in Kosovo, decreased somewhat in Albania and significantly in Serbia. Unlike Matković’s study, the table allows for comparison of the adult equivalent poverty lines in each country. However, when we note the very different consumption lines and add to this variations in equivalence scales used, it is hard to draw any hard and fast regional comparisons. Indeed, it is possible to contrast the rather large variations in monthly adult equivalents, in which Montenegro is just over 3.5 times the value of Albania, with Eurostat figures on Comparative Price Level Indices of GDP and of Actual Individual Consumption (AIC) per capita, in which there is very little variation between Albania, Bosnia and Herzegovina, Montenegro and Serbia, at between 42% and 47% of EU-27 in terms of GDP and between 45% and 50% on the EU-27 in terms of AIC (Eurostat, 2008). The impossibility to compare poverty rates in this way suggests the need for more work at regional and sub-regional levels to explore the nature of poverty and social exclusion in the region and, in particular, work on household coping strategies. 3.3 Vulnerable Groups A somewhat clearer picture emerges regarding broad patterns of vulnerability to poverty and social exclusion in the region. Taking each of Matković’s key groups, we go into more detail regarding the different factors which can be shown as correlated with poverty and exclusion.
59
A. Employment status: Throughout the region, being unemployed carries with it a significant risk of poverty and exclusion. In Albania, households whose head was unemployed had a 32% chance of being poor in 2005, compared to only 14% of households whose head was employed. Stated another way, the unemployment rate amongst the poor was twice that of the non-poor, and the rate amongst the extremely poor was 3x the non-poor rate. Nevertheless, it should be noted that some 46% of poor households have a head of household who is classed as self-employed. In Bosnia and Herzegovina, the rate of poverty in 2004 amongst households with one person employed was actually higher than those with no one employed (21% compared to 18%), with 69% of all poor households having someone employed. The BiH SPSI does not focus exclusively on unemployment so that these figures may reflect high social security and pension payments for some groups of the non-employed. In Montenegro, a different picture emerges wit rates highest for households headed by an inactive member (27%), closely followed by where the head is unemployed (26%). Households with an employed head have low risk of poverty at only 7%, although the rate is higher for the self-employed (18%), although, once again, employed and self-employed are a significant proportion of the poor, almost 42%, whilst they constitute some 52% of the population. In Serbia, rates of poverty amongst unemployed headed households are 19.7% compared to the overall average of 6.6%. Inactive headed households have a poverty risk of 8.1%. Serbia is also marked by high rates of unemployment amongst highly educated young people, at over 50%. In Kosovo, whilst poverty rates among the unemployed are higher than among the employed (at around 50% compared to 35%), a significant proportion of the poor are employed and the risk of poverty amongst those employed has increased over time. There is, therefore, a significant working poor in Kosovo, consisting primarily of workers paid on a daily basis, the self-employed, and those in the mining sector appear particularly at risk. Whilst the risk amongst self-employed agricultural workers is close to the overall rate, they make up a significant proportion of Kosovo’s poor (over 10%). More research on the nature of poverty amongst the working poor is clearly needed since, although employment creation is, rightly seen, as a major catalyst for social inclusion, the dangers of perpetuating poverty in the low wages and insecure employment sector remains a risk throughout the region. B. Educational level: There seems to be a strong link between levels of educational achievement and poverty in all the countries and territories of the region, although the precise details or the correlation vary. In Albania, around 75% of all poor families are headed by a person with eight years of education or less. In Bosnia and Herzegovina in 2004, 20% of households with the head with no education were poor, and 25% of those whose head had primary education. The rate drops to 17% with secondary education and 7% with higher education. Again, in BiH, some 57% of all the poor have primary education or less. In Montenegro, of those with only primary education or less, 20% are poor, almost 49% of the entire population in poverty. The risk of poverty for those with vocational education is slightly above average (at 12.5%). In Serbia, rates are similar to those in Montenegro. In addition, there are significant differences in attendance in pre-school between income quintiles. Overall, it does appear that investment in prolonging years in duration would be an important factor to alleviate poverty. Unfortunately, we do not know enough about the age profile of those poorly educated and in poverty to be able to assess what gains can still be made in this area. C. Household Composition: In terms of household composition, a number of different influences are in play. Larger households tend to have a higher risk of poverty throughout the region, although the threshold
60
in terms of size when this begins to be important varies. In addition, whilst throughout the region, having 3 or more dependent children is linked to increased poverty risk, in parts of the region, this is less than that associated with having elderly headed households. In Serbia, poverty risk is extremely high when there are three small children in the household. Importantly, in Albania, Bosnia-Herzegovina, and Montenegro, female headed households have a significantly lower risk of poverty than male headed households, in Albania almost certainly linked to migration and remittances. None of the SPSI studies addresses specifically the issue of lone-parent households although this is likely to become an increasingly important issue in the future. Child poverty is particularly noted as an issue in Albania, Kosovo and Serbia, although there is still confusion methodologically about this issue. Recent UNICEF studies point out that throughout South East Europe, child poverty rates tend to be higher in those countries where the proportion of children is higher. In addition, children in large households have a higher poverty risk. The study also notes that whilst income poverty rates have tended to fall, non-income indicators have been much more mixed (UNICEF, 2006). Roma children are in a particularly disadvantaged position (cf. UNICEF, 2007) although the extent of poverty is difficult to assess in the context of the absence of disaggregated data. 3.4 Key Challenges All of the reports point to the need for improvement in measurement of poverty and, in particular, an alignment between national systems of poverty monitoring and European best practice. Whilst it does appear to be the case that levels of poverty measured by absolute poverty lines have tended to fall throughout the region, this has not occurred evenly and, in any case, has been at a slower pace than economic growth might suggest. In addition, regional disparities and disparities based on household size, ethnicity, and disability have not disappeared and may even have hardened in the region. Non-monetary indicators begin to paint a more complex picture, also, with rural areas and ‘new’ urban peripheries faring particularly badly. Strategies to fight poverty have been developed although implementation has been somewhat haphazard and monitoring and evaluation tools have not been well developed, either. There is gradual movement from poverty alleviation strategies to more complex and holistic strategies against social exclusion but the level of governmental ownership of these strategies is not always high and, in addition, the strategies are sometimes pitched at too high a level of generality. There are significant gaps in terms of monitoring and evaluation, also. A particular issue is the general lack of participation by those facing poverty and exclusion from policy debates on the issue. In part, this is a product of non participatory governance structures but it also reflects the lack of power of such groups not being represented by trades unions nor by emerging advocacy based NGOs. In addition, the effects of energy pricing and availability of heating fuels and the impacts of the current economic crisis are key issues in the current period which merit further investigation. There is a need to focus on ‘the social impacts of other policies’. One example is the social dimension of the work of the Energy Community in South East Europe. Clearly, there has been a recognition of the fact that “the restructuring of energy utilities has a significant social dimension” (Boromisa, 2006; 115), both in terms of job losses and the impact of price increases on vulnerable households. The Governments of the South East European Energy Community signed a Memorandum of Understanding on Social Issues in the Context of the Energy Community on 18 October 2007, signifying a political intent to take account of the social dimension of the Energy Community treaty, and seeking to balance consumer social protection with a commitment to “a sustainable
61
and competitive market”. Instead of employment protection, the MoU focuses on ‘management of change’ and improving the adaptability of workers who lose their jobs in the restructuring process. A key part of the MoU envisages country specific Social Action Plans drawn up in close cooperation with social partners, and an agreement to assess the need for a Social Forum to consider the social impacts of energy market reform. Another issue is that existing policy mechanisms have mixed success in terms of poverty alleviation, in part because they were designed in a different system and with assumptions of near full employment but, also, because there are significant problems in designing targeted systems which succeed in limiting errors of exclusion. Issues of stigma and of administrative blockages are not well researched but clearly exist. Debates about pro-poor policies need to go beyond traditional means-tested programmes to meet new risks and to combine income and non-income related measures. Some aspects of this are returned to in chapter 6 below.
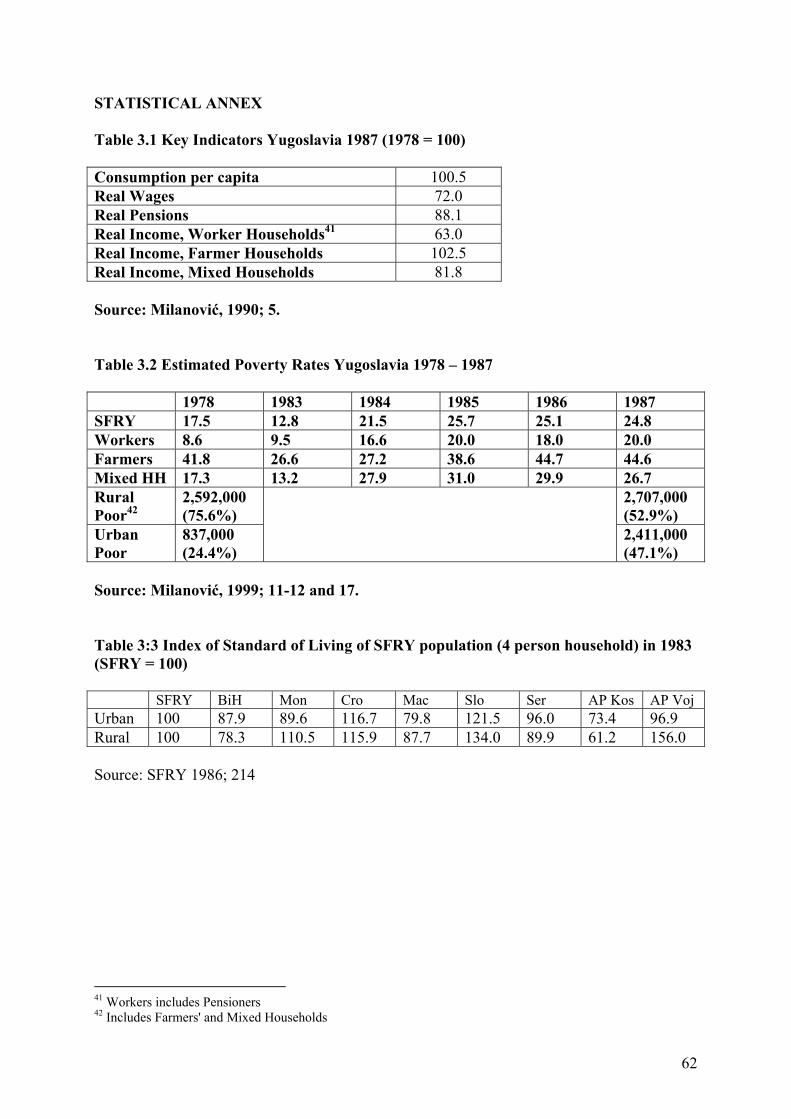
62
STATISTICAL ANNEX Table 3.1 Key Indicators Yugoslavia 1987 (1978 = 100) Consumption per capita 100.5 Real Wages 72.0 Real Pensions 88.1 Real Income, Worker Households41 63.0 Real Income, Farmer Households 102.5 Real Income, Mixed Households 81.8 Source: Milanović, 1990; 5. Table 3.2 Estimated Poverty Rates Yugoslavia 1978 – 1987 1978 1983 1984 1985 1986 1987 SFRY 17.5 12.8 21.5 25.7 25.1 24.8 Workers 8.6 9.5 16.6 20.0 18.0 20.0 Farmers 41.8 26.6 27.2 38.6 44.7 44.6 Mixed HH 17.3 13.2 27.9 31.0 29.9 26.7 Rural Poor42
2,592,000 (75.6%)
2,707,000 (52.9%)
Urban Poor
837,000 (24.4%)
2,411,000 (47.1%)
Source: Milanović, 1999; 11-12 and 17. Table 3:3 Index of Standard of Living of SFRY population (4 person household) in 1983 (SFRY = 100) SFRY BiH Mon Cro Mac Slo Ser AP Kos AP Voj Urban 100 87.9 89.6 116.7 79.8 121.5 96.0 73.4 96.9 Rural 100 78.3 110.5 115.9 87.7 134.0 89.9 61.2 156.0 Source: SFRY 1986; 214
41 Workers includes Pensioners 42 Includes Farmers' and Mixed Households
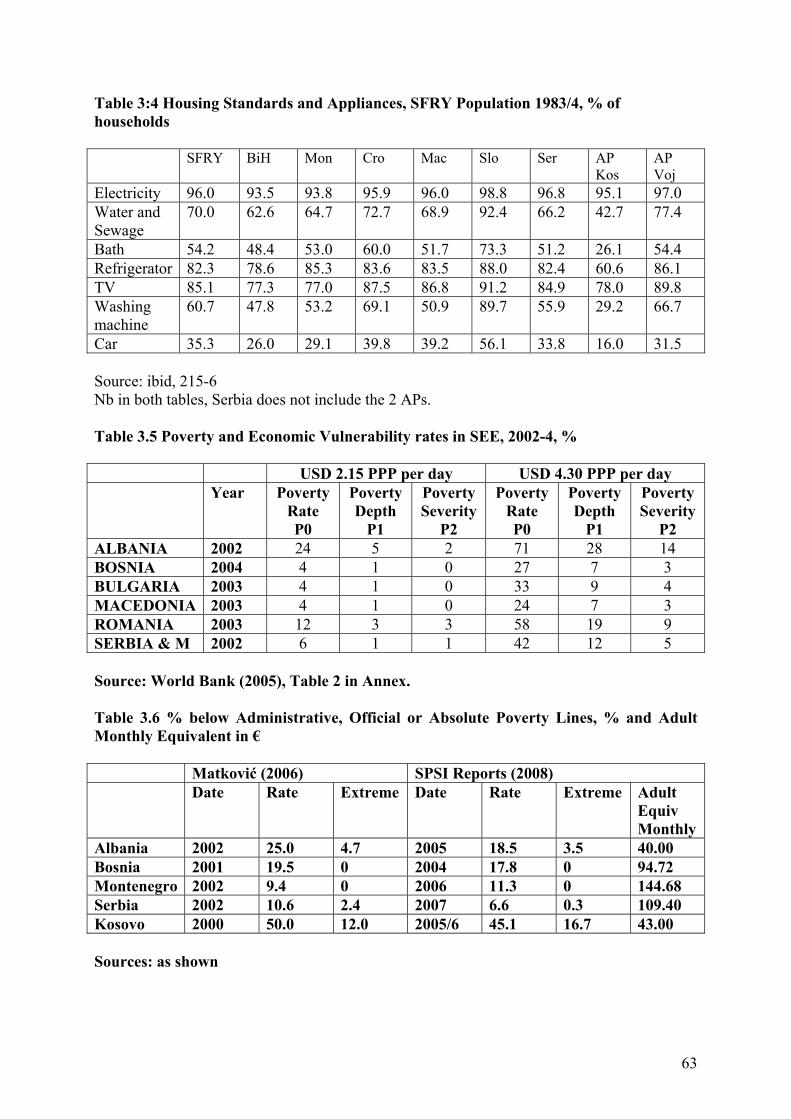
63
Table 3:4 Housing Standards and Appliances, SFRY Population 1983/4, % of households SFRY BiH Mon Cro Mac Slo Ser AP
Kos AP Voj
Electricity 96.0 93.5 93.8 95.9 96.0 98.8 96.8 95.1 97.0 Water and Sewage
70.0 62.6 64.7 72.7 68.9 92.4 66.2 42.7 77.4
Bath 54.2 48.4 53.0 60.0 51.7 73.3 51.2 26.1 54.4 Refrigerator 82.3 78.6 85.3 83.6 83.5 88.0 82.4 60.6 86.1 TV 85.1 77.3 77.0 87.5 86.8 91.2 84.9 78.0 89.8 Washing machine
60.7 47.8 53.2 69.1 50.9 89.7 55.9 29.2 66.7
Car 35.3 26.0 29.1 39.8 39.2 56.1 33.8 16.0 31.5 Source: ibid, 215-6 Nb in both tables, Serbia does not include the 2 APs. Table 3.5 Poverty and Economic Vulnerability rates in SEE, 2002-4, % USD 2.15 PPP per day USD 4.30 PPP per day Year Poverty
Rate P0
Poverty Depth
P1
Poverty Severity
P2
Poverty Rate P0
Poverty Depth
P1
Poverty Severity
P2 ALBANIA 2002 24 5 2 71 28 14 BOSNIA 2004 4 1 0 27 7 3 BULGARIA 2003 4 1 0 33 9 4 MACEDONIA 2003 4 1 0 24 7 3 ROMANIA 2003 12 3 3 58 19 9 SERBIA & M 2002 6 1 1 42 12 5 Source: World Bank (2005), Table 2 in Annex. Table 3.6 % below Administrative, Official or Absolute Poverty Lines, % and Adult Monthly Equivalent in € Matković (2006) SPSI Reports (2008) Date Rate Extreme Date Rate Extreme Adult
Equiv Monthly
Albania 2002 25.0 4.7 2005 18.5 3.5 40.00 Bosnia 2001 19.5 0 2004 17.8 0 94.72 Montenegro 2002 9.4 0 2006 11.3 0 144.68 Serbia 2002 10.6 2.4 2007 6.6 0.3 109.40 Kosovo 2000 50.0 12.0 2005/6 45.1 16.7 43.00 Sources: as shown
64
REFERENCES Boromisa, A-M. (2006) ‘In Quest of Regional Ownership Between National and Donors’ Interests: the Energy Community’, in M. Weichert et al (eds.) Dialogues: From International Intervention to National/Local Ownership? (pp. 103-120). Sarajevo: Friedrich Ebert Stiftung. DFID (2004) Regional Assistance Plan for the Western Balkans 2004/5 – 2008/9. London: DFID, web: www.dfid.gov.uk/Pubs/files/rapwesternbalkans.pdf (accessed 29 May 2008). Groves, L. (2006) A Desk Review of Social Exclusion in the Western Balkans. 28 July. London: DFID, web: http://www.dfid.gov.uk/Pubs/files/socialexclusion-deskreview-aug06.pdf (accessed 23 September 2008). Eurostat (2008) Statistics in Focus: economy and finance – prices. Web: http://epp.eurostat.ec.europa.eu/cache/ITY_OFFPUB/KS-SF-08-003/EN/KS-SF-08-003-EN.PDF (accessed 23 September 2008) Marić, S. (2008) Country Presentation: Bosnia & Herzegovina. Presentation to Forum on Social Inclusion in South-East Europe, Zagreb 26-27 November. Web: http://undp.hr/show.jsp?newscontainer=92068&page=52038&singlenewsid=101798#news101798 (accessed 6 January 2008). Matković, G. (2006) Overview of Poverty and Social Exclusion in the Western Balkans, in Stanovništvo 1; 7-46, web: http://www.komunikacija.org.yu/komunikacija/casopisi/stanov/XLIV_1/01/download_gb (accessed 3 September 2008). Mijušković, S. (2008) Montenegro Presentation. Presentation to Forum on Social Inclusion in South-East Europe, Zagreb 26-27 November. Web: http://www.undp.hr/upload/file/202/101185/FILENAME/Social_Inclusion_Forum_MNE_Nov2008.ppt (accessed 6 January 2009). Milanović, B. (1990) ‘Poverty in Poland, Hungary and Yugoslavia in the Years of Crisis, 1978 – 1987’, World Development Report Background Paper, web: http://www-wds.worldbank.org/external/default/WDSContentServer/IW3P/IB/1990/09/01/000009265_3960929170334/Rendered/PDF/multi0page.pdf (accessed 2 September 2008). Puljiz, V. (2005) ‘Croatia: searching for a new social model’, in S. Kuhnle (ed.) Social Policy Development in South Eastern Europe: outside influences and domestic forces Stein Rokkan Centre for Social Studies, Bergen. Report no. 2; pp 79-92. SFRY Federal Bureau of Statistics (Savezni zavod za statistiku) (1986) Jugoslavia (Yugoslavia) 1945-1985. SZS: Belgrade. Sulka, K. (2008) Social Inclusion Process in Albania. Paper presented to Forum on Social Inclusion in South-East Europe, Zagreb 26-27 November. Web: http://www.undp.hr/upload/file/202/101191/FILENAME/SOCIAL_INCLUSION_PROCESS_IN_ALBANIA.doc (accessed 6 January 2009).
65
Šunderić, D. (2008) From Poverty Reduction to Social Inclusion. Presentation to Forum on Social Inclusion in South-East Europe, Zagreb 26-27 November. Web: http://www.undp.hr/upload/file/202/101189/FILENAME/Zagreb-ZarkoSunderic.ppt (accessed 6 January 2009). UNDP (2007) Social Inclusion in Bosnia and Herzegovinia. National Human Development Report. Web: http://www.undp.ba/download.aspx?id=811 (accessed 12 January 2009). UNICEF (1994), Crisis in Mortality, Health and Nutrition, Regional Monitoring Report 2, Florence: ICDC. UNICEF (1995), Poverty, Children and Policy, Regional Monitoring Report 3, Florence: ICDC. UNICEF Innocenti Research Centre (2006) Understanding Child Poverty in South East Europe and CIS. UNICEF: Florence. Web: http://www.unicef-irc.org/publications/pdf/ism06_eng.pdf (accessed 12 January 2008) UNICEF (2007) Romani Children in South East Europe. UNICEF CEE/CIS Discussion paper 7, UNICEF: Geneva. Web: http://www.unicef.org/ceecis/0703-CEECIS_ROMA_en.pdf (accessed 12 January 2009). Vidmar, A.K. (2000) ‘Poverty and Social Exclusion in Slovenia’, web: http://www.theslovenian.com/articles/2008/vidmar.pdf (accessed 2 September 2008). World Bank (2005) Growth, Poverty and Inequality: Eastern Europe and the former Soviet Union. Washington: World Bank. Web: http://siteresources.worldbank.org/INTECA/Resources/complete-eca-poverty.pdf (accessed 12 January 2009).
66
4: Pension Systems: coverage, sustainability and reform challenges 4.1 Pension systems in historical perspective There was a pension insurance scheme in some of former Yugoslavia under the Austro-Hungarian empire from the late nineteenth century. The Kingdom of Yugoslavia had a pension scheme from the early part of the twentieth century. This was adapted in the post Second World War period in SFRY, maintaining most of the characteristics of a classic ‘Pay As You Go’ (PYG) pension system, with each Republic having its own Pension Insurance Fund governing the system on a day to day basis, harmonised under a common Federal Law. On the whole, the system worked well, providing quite generous benefits but primarily for industrial workers, with a separate scheme for agricultural workers. Even in the more developed Republics, crisis conditions in the 1980s presented the first strains for these funds. In Albania, schemes for the armed forces and for civil servants date back to the 1920s, but a new law introduced in 1947 covered those who worked in the state sector in urban areas, provided they had a minimum of 20 years of employment. Farmers’ pensions were not introduced until 1972, although even then the maximum such pension was set only at the level of the minimum urban pension. In the context of the splitting of SFRY into smaller nation states, war and structural crises, there was severe strain on each of the pension systems in the region in the early 1990s. The system in Bosnia and Herzegovina was further fragmented and after the war ended in 1995, three separate ethnicised pension funds existed. Later the two funds in the FBiH were merged under international pressure. Different reforms were introduced at different times in different parts of the region, although it is fair to say that throughout the region public pensions still play the most important role and continue to face problems in the context of high dependency ratios, low levels of contributory based employment, early retirement, and demographic ageing of the population. 4.2 Overview of Existing Pension Systems 4.2.1 Public old age pension schemes Albania Reform in 1993 sought to equalise urban and rural pension systems. Retirement age is now set at 65 for men and 60 for women and full pension is paid to all those with 35 years of contributions. In addition mothers with 6 or more children over 8 years of age can retire at 50, providing they have 30 years of contributions. In addition, those with less than 35 years contributions and/or those who wish to retire earlier, at aged 62 for men or 57 for women, receive reduced or partial pensions, the latter equivalent to 0.6% of a full pension for each month. Workers can also defer retirement, receiving an increment of 0.34% of the full pension for each month retirement is deferred. The pension formula is a basic pension plus 1% per year of lifetime contributions, subject to a maximum. The pension is indexed to prices although ad hoc decisions continue to be made on this. Pensions account for around 5.5% of GDP. As a result of interventions to support the poorest pensioners, there has been a fall in the ratio between lowest and highest pensions and a weak link between years and value of contributions and pension amounts. Replacement rates are low and falling, except in the case of rural pensions as a result of budget subsidies. Rates are, respectively, 43.4% for urban pensions and 27% for rural pensions. There is a revenue deficit in the system, nominally at 0.8% of GDP. In addition, through contributions and through transfers, the Government itself provides 78% of the revenue for the Social Insurance Institute.
67
Bosnia and Herzegovina The two entities have different pensions systems, functioning separately, and with responsibility for residents in that entity. Both systems were reformed in the late 1990s, so that there are many features in common, notably a common retirement age of 65 for both men and women, with an annual accrual rate of 1.5%, calculated on the entire working life, with no bonuses for continuing to work longer. The schemes face a financial sustainability test so that pensions are paid only at the level which funds allow. As the BiH SPSI notes, “the parameters are as tight as in any comparable country and in fact, very few countries in the world are more restrictive”. There are some differences between the two funds, notably relating to contribution rates (whether based on net or gross wage), although the key difference is the fact that the RS fund receives regular subsidies from the entity budget, unlike FBiH and, in terms of outcomes, the fact that average pensions in FBiH tend to be about 10% higher than in RS. In FBiH there is also a ceiling on maximum pensions paid, limiting the range of pension incomes received. Montenegro Montenegro’s public pension was reformed in 2004 and subsequently on similar, though perhaps less radical, lines to the BiH reform. Retirement ages are to increase gradually to 65 for men and 60 for women by 2012, with the possibility of early retirement limited to men aged 60 and women aged 55. To be eligible, pensioners must have a minimum of 15 years of contributions, raising to 40 years for early retirement. Pensions are now calculated based on all contributory years, not just the best 10 years as previously, and the Swiss formula, tying base pension increases to 50% of wages and 50% of prices was introduced. Employer’s contribution rates were reduced but, in addition, the type of income subject to contribution was widened, leading to an increase in total revenues in 2006 by some 17% from the previous year. In 2007, pension expenditures were some 9.61% of GDP, with a deficit in the fund of 2.5% of GDP. Serbia In some ways, Serbia has the most complex public pension system in the region, with three funds, the Employee Fund, the Self-Employed Fund, and the Farmers’ Fund. Pension reforms were introduced between 2001 and 2003, including a raising of the retirement age by three years, to 63 for men and 58 for women; calculations based on lifetime earnings; and the introduction of the Swiss formula for indexation. The full pension is received after 40 years of service for men and 35 years for women. Some 10.5% of GDP is spent on pensions in Serbia. Both the Employee Fund and the Farmer’s fund have unfavourable dependency ratios. Under pressure from the IMF, and in order to reduce the public pension debt, in 2005 a decision was taken to raise the retirement age by 2011 to 65 for men and 60 for women. Kosovo under UNSC 1244 Kosovo’s pension scheme is rather straightforward and dates back to only December 2001. A basic Pension is paid to all habitually resident in Kosovo and aged 65 or over, at a rate which, since an increase in 2004, has been €40.00 per month. From 1 January 2008 a new ‘favourable pension insurance’ scheme was introduced, which increases the basic pension for those who can prove sufficient insurance contributions (a minimum of 15 years of pensionable insurance contributions) to €75.00. In addition, a mandatory Individual Savings Pension was introduced which is a contributory scheme with employers and employees each required to contribute a minimum of 5% of wages to an individual account. The regulation
68
allows for a maximum contribution by each of a further 10%, hence up to 15%. Pension expenditures are less than 3.5% of GDP in Kosovo. 4.2.2 Private pension schemes Throughout the region, private pension schemes have been introduced or are planned to be introduced, although the scope and impact of these schemes varies and their different impacts cannot really be addressed at such an early stage. In Albania, private pension funds are regulated by law but still minimal, with a bar on entrance to foreign funds and a poor investment climate, with just 2,200 contributors paying an average of €6.50 a month. In Bosnia and Herzegovina, whilst there have been some discussion, no private schemes yet exist. Plans are well advanced to introduce private pensions in Montenegro, both in terms of mandatory private pensions and voluntary private pensions. In Serbia, voluntary private schemes have existed since 2003 but being formally regulated since 2006. At the end of 2007 seven schemes existed, six of which were foreign owned, with some 120,000 members of whom about half actively pay contributions averaging about €36 per month, although the assets of these funds continues to increase considerably and offers a positioning of these funds prior to the likely introduction of mandatory private systems. A number of the SPSI reports note the problems of high transition costs of such funds and the fact that they are not particularly useful in terms of challenging poverty and social exclusion of pensioner households. 4.2.3 Disability pensions Disability pensions are significant throughout the region, usually based on assessment by a medical commission of the extent of disability and incapacity to work. In Albania, full or partial disability pensions are claimed by over 34,000 people who have to have contributed for half of the years between aged 20 and the onset of the disability. Disability pension is paid to a maximum of 80% of the last wage. In Bosnia and Herzegovina, disability pensions are much more extensive, representing some 21% of all pensions. Those disabled whilst soldiers are classified differently from civilian victims of war and both are treated more favourably than other disabled persons. Bosnia has over 110,000 recipients of disability pensions, two thirds of whom are in FBiH. The average age of recipients is 63 and average years worked is 33, likely to increase in view of changed conditionalities. In Montenegro, 25% of pensioners or some 23,000 people receive disability pensions, reflecting a low threshold of conditionality in the 1990s when such pensions were used, alongside early retirement, as a way of reducing pressure in the labour market. Two categories of pensions exist, for those who have been classified as having work ability reduced by 75% and those with 100% disability. In 2007, average payment was €145 per month, about 75% of the average old age pension payment. Serbia had very generous entitlements to disability pension in the 1990s so that there are currently some 340,000 beneficiaries or 27% of all pensioners in the Employee Fund. The average disability pension is €160 and some 45% of recipients are under 60. Although numbers are declining as conditions were tightened in 2003, the scheme requires only between 1 and 5 years of contributions, depending on age. In the case of disability caused at work, no contribution requirements are in place. In Kosovo, a basic disability pension, at the same level as the basic pension, was introduced in January 2004. To be eligible, a beneficiary has to be declared by a Medical Commission as permanently and totally disabled. In May 2005, 17,121 persons received the disability pension, less than 8% of those receiving old age pensions. 4.2.4 Survivor Pensions
69
Survivor pensions also exist throughout the region, referring to pension rights for survivors of deceased insured persons. In Albania in 2005, some 66,000 persons received survivors pensions. Rules are complex with different age minima for widows and widowers, who may receive these pensions at any age if they are disabled or looking after a dependent child under 8. Pensions are 50% of the old age pension or 25% for children or grandchildren dependents up to a maximum of 100%. In Bosnia and Herzegovina survivor’s pensions are payable to widows aged 45 or over and widowers aged 55 or over in RS and 60 or over in FBiH (Obarčanin, no date; 11). The pension is based on number of survivors ranging from 70% to 100% of full pension. Children are eligible until age 15, age 25 if in full time education, or with no age limit if disabled. In Montenegro average survivors’ pensions, at €123.70, were 64.5% of average old age pensions in 2007, again received by widows, widowers and children, on a range from 70 to 100%. In 2007, almost 40,000 people received survivors’ pensions. In Serbia some 20% of all pensions, paid to 350,000 people, are survivors’ pensions paid on a similar basis to those in Montenegro. In Kosovo, when a participant in the new pension insurance scheme dies, the balance in her/his account is passed to beneficiaries. There are no survivors’ pensions in the basic social pension scheme. 4.2.5 Merit Pensions Throughout the region the existence of special categories of older persons who receive higher pensions is an issue, not least in terms of equity and in terms of sustainability of public expenditures. In Albania, there are eight categories of persons who receive special monthly pensions including retired state functionaries, police officers, military personnel, and others, constituting some 4.4% of the total pensioner population. In Bosnia-Herzegovina, war veterans’ families qualify for particular pensions. In Serbia, there are also schemes for war veterans from the second world war and from recent conflicts. In Kosovo, survivors of those killed in the war receive a higher pension. 4.3 Adequacy, Exclusion and Vulnerable Groups Throughout the region, there are concerns about large numbers of older people who do not receive any pension whatsoever. The precise numbers are difficult to calculate but they are substantial throughout the region, except for Albania where, whilst pension receipt is almost universal amongst over 65s, the majority receive the minimum pension. In Bosnia and Herzegovina, based on 2004 LSMS data, whilst 74.7% of males aged 65-69 and 65.8% of males aged 70+ receive a pension, the corresponding ratios for females are only 16.8% and 11.3% respectively. This suggests a massive shortfall involving unpaid domestic labour, rural workers, the self employed and Roma (BiH report). The rough estimate for non-receipt of pensions in Montenegro is some 40,000 people, or 48.2% of the over 65 population. Again, rates of receiving pensions are higher for men, at 83.1% than for women at only 26.8%. In Serbia, the SPSI report authors calculate, using a number of assumptions, that some 385,000 people over 65, or 30% of the age group, do not receive any pensions, including some 250,000 farmers. In Kosovo, where there is a social pension, the coverage rate is near universal, although some persons who cannot prove residence status face difficulties. Two key indicators of pension adequacy are the replacement rate, the ratio of average pension to average wage, and the amount of the minimum pension. In Albania, the replacement rate is 43.85% for urban pensions and only 23.47% for rural pensions, with respective minimum pensions, including energy and other supplements, €85 or urban pensioners and €51 for rural pensioners. In Bosnia and Herzegovina, the replacement rate is 43% with only a slight difference between FBiH and RS where both average pensions and average wages are lower. Average net pension is €143 in FBiH and €136 in RS. In both entities over 35% of pensioners
70
receive the minimum pension benefit. In Montenegro, average old age pensions in 2007 were €191.70 (lower for disability and survivors’ pensions) with minimum pension at €71.60. It is estimated that some 30,000 pensioners receive less than €100. Replacement rates are quite high by regional standards, at 56.7%, but forecast to fall to 50.2% by 2010 and below 40% by 2020. In Serbia replacement rates are high due to a legal requirement until 2009 that pensions be 60% of average net wage. Real replacement rates are around 54.9% but forecast to fall below 40% by 2017. Average pensions are €190 but only just above the minimum of €70 in the farmers’ funds, where 211,000 farmers receive the minimum, comparing unfavourably with a poverty line of €110. In the other funds minimum pensions, not below 25% of net monthly wages, are around €100, received by a further 42,000 pensioners. In Kosovo, replacement rates are low now given the €40 basic ‘social’ pension but are not forecast to rise appreciably without a substantial and sustained differential between rate of return on investments and annual wage growth. The profile of those without pensions or with very low pensions is fairly consistent throughout the region. Crucially, they include agricultural workers of all kinds: those with a poor contribution record, those engaged in subsistence agriculture, and those receiving low wages. In addition, a ‘new’ potentially excluded group are the self-employed who receive incomes and make contributions irregularly. Whilst Serbia has a special scheme for the self-employed, elsewhere it is very difficult to ‘catch up’ on missed contributions. Low and irregular waged industrial workers are a third at risk group. A fourth group appear to be Roma given their poor low levels of contributions over a lifetime. However, there are no rigorous studies on older Roma. There is also little data on the receipt of pensions from abroad which further complicates the situation regarding pension coverage and adequacy. 4.4 Sustainability of Pension Systems A number of factors combine to erode the sustainability of public insurance-based pensions systems throughout the region. Crucially, overall ratios of contributors to pensioners are deteriorating as a result of demographic ageing and growing numbers of older people in relation to those between 16 and 64 (see table 4.1 for some data on this). In addition, the number of active waged workers in the formal labour market is low throughout the region. As noted above, not only is the contributor base in terms of numbers low but, in addition, many workers are paid a relatively low declared wage on which contributions are paid, combined with an informal cash payment, precisely to avoid large contributions. The dilemma then is whether to try to raise revenues through cutting contribution rates in the hope of increasing compliance, or to raise rates to maximise revenues from those already contributing. Both have problems of course. In addition, in some parts of the region, early retirement has been offered as a short-term political solution in the context of raising unemployment and economic restructuring. This has had significant effects on the number of pensioners, however. Albania has a less dramatic demographic ageing, of course, but also has large out migration and a large informal economy so that in 2007 there were 0.85 beneficiaries for every one contributor to the pension insurance system, or as more usually expressed one pensioner covered by 1.18 contributors. In Bosnia and Herzegovina one pensioner is covered by 1.29 contributors. In Montenegro the ratio is said to be close to 1:1. In Serbia for every 1 contributor there are 0.63 beneficiaries, or one pensioner for every 1.59 contributors. The ratio varies enormously between the different funds, however, with one pensioner covered by 1.38 contributors in the employee fund, 1.45 in the farmer’s fund and a healthy 6.9 contributors in the self-employed fund. Since Kosovo is not yet paying out under a pension insurance
71
scheme, there is no accurate comparator, although currently there are some 235,000 contributors and 127,000 pension beneficiaries. Both the Bosnia and Herzegovina and Kosovo schemes have a kind of built in sustainability since in the former there is a legal requirement that payments can only be made when funds allow, and in the latter, increases in the basic rate of benefit are conditional on the fiscal envelope. If sufficient funds are not available in either of the BiH pension funds, then a ‘payment coefficient’ is introduced, reducing payments. This occurred in RS in April 2006 when the coefficient was reduced from 1 to 0.84. As of February 2008, the coefficient was 0.94, meaning that pension beneficiaries receive only 94% of the pension to which they are entitled. Whilst pension increases have fallen behind inflation and wages in Kosovo, other aspects of the pension scheme, notably investment in offshore accounts, adds to the risk. In Serbia, detailed projections suggest that the dependency ratio will not change significantly and that whilst pensions will fall relative to real wages, the debt of the pension fund will decrease over time, reaching a surplus by 2018. Montenegro foresees a significant rise in the old age dependency ratio, with the need to act urgently to reduce debts in the pension insurance fund. Throughout the region, then, a trade off between adequacy and sustainability appears to be resolved in terms of sustainability, with a high political risk as pensioners see the real value of their pensions eroded. 4.5 Public Awareness, Public Acceptance and Transparency Whilst modernisation of pensions systems has been a key theme in all of the reforms in the region, the issues of providing accessible and relevant information to the public appears to have had less attention paid to it. In Albania, the outreach by the Social Insurance Institute is said to be limited to media publications and its governance structures have not adapted well to changing functions. More worryingly, delays in exchanging information between different offices means that some new pensioners do not receive their pension within three months of the claim being approved as is meant to be the case. The Albania SPSI report calls for institutional capacity building to improve both transparency and system efficiency. In Bosnia and Herzegovina, there is a real problem regarding a failure to disseminate data on the number and structure of pension beneficiaries even though there is a Law on Public Information, with the BiH SPSI noting a ‘hostility’ of the funds to information requests. In addition, individual beneficiary data are limited and have to be paid for. In Montenegro, pensioners successfully appealed in court against a failure to increase pensions and a failure to publish wage levels over a certain period, leading to a debt to pensioners now being repaid over a three year time frame. Whilst the Montenegro report suggests that transparency of the system will be improved in future reforms, the issue of public information regarding the nature of the reforms is an important question, and the report calls for public debates on the future of the pension system. In Serbia, the report notes the absence of information to help citizens plan their retirement. In Kosovo, the issue of managing the transition of regulatory and monitoring institutions from international to local ownership is a key challenge. Overall, whilst there are no systematic studies of public acceptance of pension systems, there is a considerable amount of discontent evident in terms of the failure of funds to provide adequate retirement incomes. In the context of economic restructuring, early retirement was often used throughout the region to ease the burden of adjustment, creating effectively a new group of retirees likely to live a significant number of years on low pensions. 4.6 Main Reforms and Drivers of Change
72
As noted above, the trade off between fiscal sustainability and social adequacy of pensions has been a problem throughout the region. Throughout the region there has been an emphasis on implementing pension reforms based on new multi-pillar systems, favoured by a coalition of external advisors linked to the IMF and the World Bank and some local economists. As a number of the SPSI reports point out, such reforms can focus attention away from the real issue of public PAYG schemes and onto new systems whose benefits will not be visible for a number of years and, only then, available to a minority of retirees. Many note the transitional cost associated with the new systems since the state needs to increase funding to the first pillar since the implementation of a private compulsory scheme tends to reduce assets available for the public mandatory scheme. In addition, the region is still financially unstable with undeveloped financial markets so that there is extreme volatility regarding expectations of rates of return on investments. Finally, there is a tension between deregulation of financial markets, diversification of assets and the need for good governance and independent regulatory authorities. Whilst model three-pillar reforms have been resisted, thus far, in Bosnia and Herzegovina and in Serbia, they are about to be launched in Montenegro. Overall, the concern is that analysing and understanding problems in the existing PAYG system are more important, both from a sustainability and adequacy perspective, than adding new systems which drain resources in the short term at least. Overall, it seems that the problems of transition costs, of governance in terms of who runs the private funds and how to generate annuities, and the question of investment restrictions, supervision and guarantees have had less attention paid to them. This would suggest that the drivers of change' in pension reform has been more in terms of the interests of transnational or global policy actors advocating similar reforms throughout a number of middle income countries in Eastern Europe and Latin America (cf. Orenstein, 2005). Trade unions, social policy scholars and pensioners themselves, concerned with poverty and inequality issues appear to have been marginalised in these debates (cf. Stubbs and Zrinščak, 2006). A recent comment on pension reforms in Croatia could apply throughout the Western Balkans, namely: „The reform approach was elitist and imposed: social partners experienced 'dialogue' as 'instructions' and 'external conditionality' as 'dictat' (Guardiancich, 2007; 97). Those reports which elaborate on future reform options suggest that the choices ahead are both complex and contested. The plea in the Albania report is echoed in some other reports: „The main problem for the pension reform is to focus on the solidarity (first pillar) issues first and then to worry about whether a funded system is needed and how it should be designed. The other important step is to fix the design of the current voluntary pension system. There is no need to rush into a second pillar /mandatory funded – our addition/ and Albania may not even need one at all. In Bosnia and Herzegovina, it seems that a wide range of different reform options are being discussed, including a 'social pension', individual accounts and various voluntary schemes for professionals, as well as mandatory schemes. In Montenegro plans for a mandatory pillar are well advanced, with a Law calling for such a scheme although as the Montenegro report notes: „it is still not clear when this type of insurance will be introduced“. Indeed, the report goes on to note „the experiences of countries that have implemented a mandatory funded system did not confirm that a mandatory funded system was the best reform option.“ Exploring the issue from a short- and long-term perspective, the Serbia report concludes that the issue of disadvantaged pensioners in the employee fund is a key problem, suggesting the need for fiscal guarantees of minimum pension above the poverty line, combined with 'social pensions' for farmers excluded from the farmers' scheme. In
73
Kosovo, discussion focuses on the raising of the basic social pension and the need for more differentiation in pensions based on prior salaries.
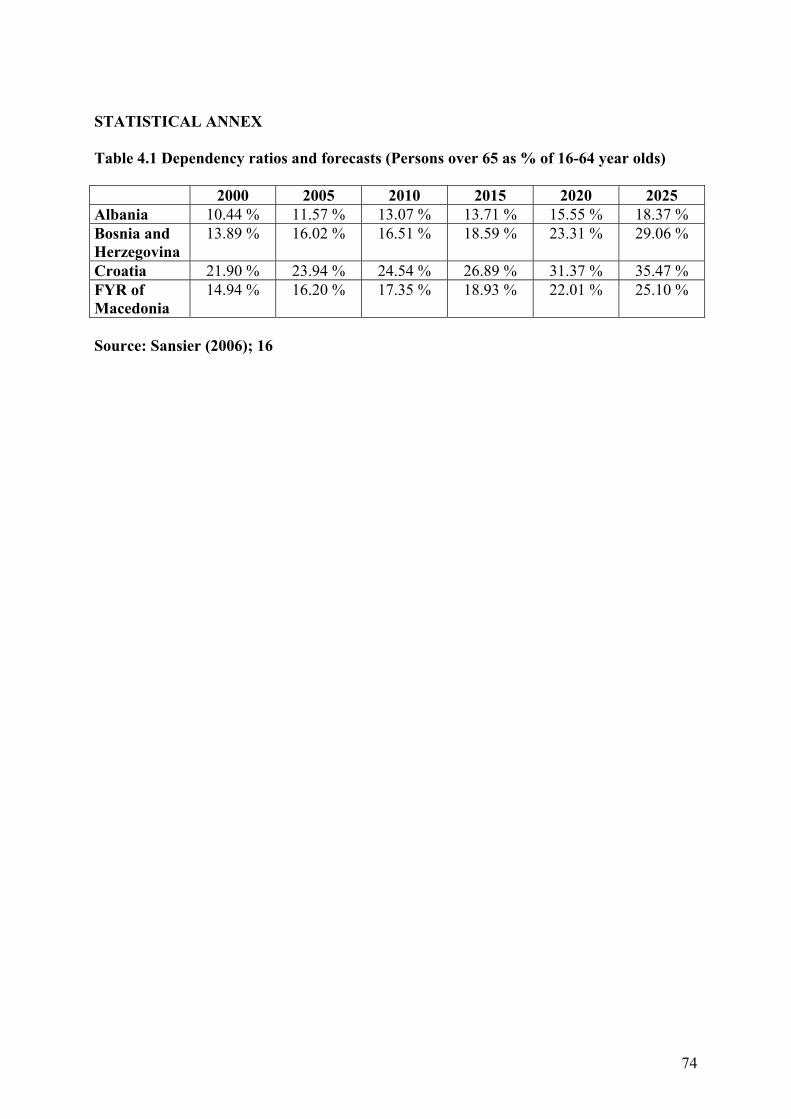
74
STATISTICAL ANNEX Table 4.1 Dependency ratios and forecasts (Persons over 65 as % of 16-64 year olds)
2000 2005 2010 2015 2020 2025 Albania 10.44 % 11.57 % 13.07 % 13.71 % 15.55 % 18.37 % Bosnia and Herzegovina
13.89 % 16.02 % 16.51 % 18.59 % 23.31 % 29.06 %
Croatia 21.90 % 23.94 % 24.54 % 26.89 % 31.37 % 35.47 % FYR of Macedonia
14.94 % 16.20 % 17.35 % 18.93 % 22.01 % 25.10 %
Source: Sansier (2006); 16
75
References Guardiancich, I. (2007) ‘The Political Economy of Pension Reform in Croatia 1991 - 2006’, in Financial Theory and Practice 31(2); 96-151, web: http://hrcak.srce.hr/file/25853 (accessed 29 October 2008). Obarčanin, J. (no date) Report on the Present State and Future of Social Security programmes in Bosnia and Herzegovina. CARDS/SISP, web: http://www.coe.int/t/dg3/sisp%5CSource%5CCRepAnn1BihEN.PDF (accessed 10 October 2008). Orenstein, M. (2005) ‘The New Pension Reform as Global Policy’, in Global Social Policy 5(2); 175-202. Sansier, F. (2006) Regional assessment report on social security financing issues. CARDS/SISP. Stubbs, P. and Zrinščak, S. (2006) ‘International Actors, ‘Drivers of Change’, and the Reform of Social protection in Croatia’, paper presented to International Sociological Conference, Durban, South Africa, June, web: http://paulstubbs.pbwiki.com/f/Stubbs+Zrinscak+Durban+Final.pdf (accessed 29 October 2008).
76
5: Health and Long-Term Care Systems: access, viability and reform challenges 5.1 Comparative Health Outcomes In the 1990s, in part as a result of the combination of war, forced migration, transition, and economic crisis, there was a health and mortality crisis in much of the Western Balkans although only in those areas directly affected by war did it reach the proportions found, for example, in parts of the former Soviet Union. A region which, on the whole, had rapidly improving health indicators throughout the post-Second World War period, found some indicators stalling or progress being reversed, and some illnesses and public health problems thought to be consigned to history reappeared alongside new health problems. Whilst well developed statistical measuring systems were also undermined in crisis conditions, and some of the figures are contested relating to definitional and registration issues, public health statistics are quite well developed throughout the region. Less well developed are studies which point to inequalities in health outcomes and in terms of access to good health care although emerging evidence is discussed in part 5.4 of this chapter. Here we confine ourselves to an exploration of trends in mortality, morbidity and health outcomes in the region and in its constituent parts. Extremely useful comparative data has been produced by the South East European Health Network with the CEB and WHO Europe in the text ‘Health and Economic Development in South Eastern Europe’ (SEEHN, 2006) which suggests that the South East European countries lag behind the EU 15 on many aspects of health status and that the divergences have become more pronounced since 1990. However, part of this is because Romania, Bulgaria and Moldova, included in the text as part of SEE, tend to have lower health status than other parts of the region. There is also a noticeably larger gap in terms of healthy life expectancy than in terms of life expectancy per se. Whilst levels of infant mortality are higher in the Western Balkans, the gap between rates in the region and in the EU has been narrowing rather than growing. Table 5.1 summarises key mortality rates in the region and beyond. The report notes either no significant gaps or even an advantage for some Western Balkan countries in terms of communicable disease mortality, although it also suggests that “such evidence would need to be examined in the context of the quality of communicable disease surveillance systems” (SEEHN, 2006; 18). Tuberculosis rates, often a proxy indicator for failing health and social services, are high in parts of the region although figures for Bosnia-Herzegovina are somewhat dated (Table 5.2). Premature mortality from ischemic heart disease, whilst also highest in Moldova, Romania and Bulgaria, is high throughout the region, with no decrease over time unlike the EU 15. Deaths from cancers are rising, alarmingly so in Serbia and Montenegro. Similar patterns are found in terms of both deaths attributable to smoking and liver diseases. The Albanian report notes that the health care system is not fully prepared to cope with rising rates of non-communicable diseases and the lengthier and costlier health care treatments which are needed, a point with wider regional applicability. The region, with the exception of Albania and Macedonia, is also marked by high suicide rates and suffers from high rates of deaths from accidents, notably road traffic accidents. HIV rates in the region tend to be low although, again, there are question marks regarding reporting standards. In terms of child health outcomes, UNICEF MICS studies in the region found higher levels of infant mortality than official figures in some cases and also some incidence of underweight and stunted children, particularly in Albania, Bosnia-Herzegovina and Kosovo. Whilst immunisation rates tended to be high they were far from universal, notably in Albania, and
77
differed between urban and rural populations. A number of small scale studies on both children and adults have found significant socio-economic differences with poor families reporting themselves to be in poorer health (SEEHN, 2006; 34). Studies of risk behaviour in teenagers also point, for example, to higher rates of smoking than in the EU countries. There is a serious lack of research on the health conditions of minority groups, particularly Roma, throughout the region, with particular gaps in terms of studies of non-communicable diseases and health related behaviour (SEEHN, 2006; 37). The UNDP survey found only a small difference in reported health status among Roma compared to non-Roma, although reported differences in nutrition were much more significant with 53% of Roma respondents compared to 7% of non-Roma reporting that at least once in the last month they did not have enough to eat. Risks were particularly high for Roma children, with 50% reporting at least two such nutritional risks in a month compared to 6% of non-Roma children (UNDP, 2006; 56-7). Roma women, especially during pregnancy, also face increase health risk, compounded by lack of access to quality health care, discussed in paragraphs 5.4 below. 5.2 Governing and Financing Health Care Systems Throughout the region, with the exception of Kosovo and, to an extent, Albania, health care systems are based on compulsory health insurance managed by health insurance funds. In Kosovo, there is no system of health insurance so that the health care system is financed from the central budget and patient participation. In Albania, a system reform in 1995 introduced health insurance but this has to be supplemented by allocations from the central budget and from patient participation. Only 24.8% of public health expenditures comes from social health insurance contributions. For different reasons, insurance coverage is also low in Bosnia-Herzegovina and shortfalls in contributions have to be made up for from budgetary contributions. There is a legacy of an over-emphasis on hospital care to the relative neglect of primary health care although it should be noted that traditions of public health are long-standing in the former Yugoslavia. Health services were, therefore, somewhat slow to change and then were subsequently decimated and chronically under-funded as a result of wars and systematic economic crisis in the early 1990s. Throughout the region, albeit unevenly, processes of decentralisation, the introduction of managerial autonomy over decision making and crucially, the introduction of family medicine as the basis of primary care, are being implemented. Diversification is also developing with a growing private sector existing alongside publicly provided services and, in some case, closer links between the public and private sectors being encouraged. The main problem has been that the reform of primary health care has not always been accompanied by sufficient resources and the over-specialization and over-emphasis on hospitalization has been hard to erode. In many ways, new funding arrangements have heightened both regional disparities and socio-economic disparities. The former is, in part at least, a result of divergent financial assistance for infrastructural development, so that poorer and rural areas are less likely to have sufficient resources. The latter, discussed more below, relates to access inequalities so that vulnerable groups are hit by cost-sharing mechanisms and out-of-pocket payments. Throughout the region, with the exception of Serbia and Montenegro, there has been a reduction of hospital beds per 100,000 population with rates in 2004 in Albania (301) and in Bosnia-Herzegovina (297) extremely low by European Union standards (SEEHN, 2006; 48). Whilst the tradition of public health has remained in place in the former Yugoslavia, and has been introduced in Albania and re-introduced in Kosovo, as the SEEHN notes, “one of the
78
main challenges in the area of public health services in south-eastern Europe is the translation of formal policy commitments into a restructuring of public health services and an increased allocation of resources to health promotion and disease prevention“ (ibid, 50). In terms of human resources, the regulation of supply and demand is still somewhat problematic, not least as a result of high levels of out-migration of some medical professionals in parts of the region. The number of physicians per 100,000 population is chronically low in Bosnia-Herzegovina (140), Kosovo (139) and in Albania (118) (SEEHN, 2006; 51), well below the EU-15 average of 725. The outflow of trained doctors and nurses is probably highest in Albania but is also present elsewhere in the region. Unemployment amongst trained medical personnel is said to be present in both Bosnia-Herzegovina and Macedonia (ibid). The mismatch of supply and demand is also reflected in the lack of specialists in some rural areas and the rather uneven geographical distribution of doctors. As the SEEHN notes, there appears to be “an urgent need for comprehensive systems for the planning of human resources” (ibid, 52) and to improve education and training. Estimates of the proportion of GDP spent on health care services vary considerably. Sansier (2006) referring to public health notes a clustering of low spending countries, Albania and Serbia (at 3%), medium-spenders, Macedonia and Kosovo at around 5.3- 5.6% and high spenders Croatia and Bosnia-Herzegovina at over 11% of GDP. UNICEF’s TransMONEE project quotes somewhat different figures, suggesting that the post-Yugoslav countries have maintained expenditures between about 5% and 7% of GDP, with Albania spending only 1.8% according to 2002/4 figures (UNICEF IRC, 2006; 22). However, with the exception of Croatia (with a rate of $701) per capita spending in PPP$ in the region is low, $153 in Albania; $166 in Bosnia-Herzegovina; $283 in (then) Serbia and Montenegro; and $329 in Macedonia (ibid), with private expenditures accounting for 58% of total health expenditures in Albania and 49% in Bosnia-Herzegovina (ibid; 23). The level and nature of health insurance contributions vary considerably in the region. Albania, inheriting a Soviet type system, has only 1.7% contributions paid by both employers and employees, although this is set to increase in the near future. In FBiH contributions are 4% for employees and 13% for employers, and in RS 15% for employers on net wages. In Montenegro, employees and employers pay 13.5% into the healthcare fund, which is split with the employer paying 6% percent of employee salaries and the employee paying 7.5%. In Serbia, contributions amount to 12.3%, equally divided between employers and employees. The governance of health care is particularly complicated in Bosnia-Herzegovina with each entity having, essentially, its own system, and Brčko district also having its own scheme. In one entity, FBiH, each of the ten cantons has its own health insurance fund and public health institute and manages its own health care institutions making rational planning of services and achievement of economies of scale particularly difficult, with a small solidarity fund not being utilised in most cases. 5.3 The Long-term Care System Throughout the region, there is a lack of systematic policy regarding long-term care and a rather pronounced lack of co-ordination between services which are seen as health services and those which are seen as social protection. Rather than a balance and complementarity between family care, community-based care and residential/institutional care, these three forms of care tend to be seen as alternatives in the region. As noted in chapter 2, there is little
79
care planning and, as a number of reports note, long-term care services for older people, those with chronic health issues and for people with disabilities tend to be both ‘over institutionalised’ and ‘over medicalised’ or ‘over hospitalised’. As the Albanian, Kosovan and Bosnia-Herzegovina report notes, whilst strong family and extended family ties are important, there is a danger that a view that family-based care is optimal may underestimate the needs of family care givers for support. In addition, there is evidence that economic and demographic trends may be eroding the tradition of extended family care and, even more importantly, the ability of the extended family to look after ageing and disabled kin. Whilst home care services are provided throughout the region these are not always well developed nor easily and readily available in all places. An integrated use of day care, community-based, home care and respite care services is lacking throughout the region. In Albania, there are no geriatric wards in hospitals, no day hospitals and no rehabilitative services. A large number of acute hospital beds are occupied by patients with chronic conditions. As with other reports, there is a notable absence of a long-term care strategy and lack of close co-operation between the health and social care sectors. An emerging market for private for profit and NGO services are not well integrated into the system. In addition, more generally there is no real attention to cost effectiveness not to monitoring and evaluation of services. In Bosnia-Herzegovina, the system is fragmented although there is a clear focus in social protection legislation on the primary role of the Centre for Social Work. In FBiH, provision varies between cantons and whilst services are more centralised in RS, municipalities can chose to add services and benefits to the minimum legal requirements. A minimum payment of 41 KM (about €21) for people with disabilities is payable in RS with the intention that the client can then purchase support services. However, this is not paid by some poorer municipalities. There is little liaison between social workers in CSWs and health workers and little scope for rehabilitation support services. In Kosovo, services for older people and people with disabilities are extremely limited, amounting to poor quality institutional settings or very patchy support for home-based care. In addition, the report points to problems in terms of mental health care which is still very drug treatment oriented with very limited or no socio-therapeutic or psycho-therapeutic complementary treatment. Only able to offer limited care to those with chronic conditions, the system finds it extremely hard to deal with acute cases and, in addition, offer little or no follow-up support services. In Montenegro, there is a system of assessment for supplementing the costs of residential care when family members cannot afford to pay the full amount. The report also notes the opening of smaller private residential facilities offering care to some 10 people. Responsibilities for long-term care appear divided between health, education and social welfare. In Serbia, like much of the region, the absence of clear definitions and understandings of long-term care lead to an over-reliance on residential care and a lack of co-ordination between health and social welfare. Whilst hospital care is well developed, the absence of palliative or hospice care for terminally ill patients is noted. The report also notes a high proportion of persons over 70 living with chronic illnesses and survey data that some 25% of older people need some kind of support in order to continue living in their own homes. There is a network of old people’s homes and day care and home care services, financed by user charges and central government support. The report notes the lack of safeguards in care services and the danger of maltreatment of older people in residential care.
80
5.4 Access, Equity and Quality in Health and Long-Term Care 5.4.1 Non-Insured Populations Whilst considerable attention has been focused on the financial sustainability of health care systems, issues of access, equity and quality have, perhaps, not had sufficient attention paid to them. Emerging evidence suggests that there are serious problems of access for some groups in society, constituting a significant form of social exclusion. In some parts of the region, a significant proportion of the population do not have health insurance despite the formal universalistic nature of the system. In Albania, only some 40% of the population has health insurance with workers in the informal sector, the self-employed and those in agricultural work under-insured. This results in an increase in out of pocket payments and rationing within the system. In Bosnia-Herzegovina it has been estimated that only 80% of the population are insurance-holders or family members. There is wide variation in coverage in different cantons in FBiH, ranging from only 63% to 93%. In RS coverage was estimated by UNDP to be around 75%, but some official figures put the figure much lower. The report makes a distinction between the raw numbers insured and those effectively insured since there are, often, interruptions in contributions and health care can only be obtained on production of a stamped health insurance booklet for that particular month. Those working in the grey economy, Roma, those in rural areas, and those in employment were contributions are not always paid on time are among those who may be uninsured. In Montenegro disproportionate numbers of people in lower income quintiles receive health insurance through family members rather than directly from work. In addition, survey data showed that whilst treatment expenses were covered by health insurance for 90% of respondents, 7.6% paid out-of-pocket. Of those whose treatment was not covered by health insurance, 14.1% did not have health insurance. In Serbia, 84% of the population are covered by health insurance with the remainder of the population's health care meant to be covered from the central Government budget, although there are shortfalls in practice. 5.4.2 Access Inequities More generally, all of the reports note unequal access to health care and to health care facilities for different population groups. In Serbia, although special programmes exist for Roma, they still face problems in accessing health care services as do stigmatised groups including persons living with HIV/Aids, sex workers, homosexuals and drug users. The Serbia report also notes that whist refugees and displaced persons are entitled to free health care, services have not been adapted to meet their needs. In Montenegro, survey data shows a strong correlation between estimates of own health status and both standard of living and level of education. For both Roma and displaced persons, the report notes that insecure housing and living conditions, poor awareness of health issues and lack of access caused by incomplete documentation, are all factors in terms of health outcomes and health services. Survey data found refugees and displaced persons spending 15% of their monthly household income on medical costs and Roma 9% compared to 6% for non-Roma living in the same area. The Kosovo report notes problems of access and financial barriers for poor people and for those in rural areas. In addition, for Roma security, transport and financial concerns limit access to health facilities and there are dangers of discrimination and poor treatment. For Serbian minorities the issue is more one of lack of quality control in health care facilities in the Serbian areas. In Bosnia-Herzegovina, somewhat uniquely, the non-portability of health insurance across entities and even, in the case of FBiH, across cantons, causes major access problems not least as a result of the uneven distribution of facilities. Pensioners living in one entity but receiving a pension from the other are particularly vulnerable in this regard. In addition, rural populations face problems accessing some services with a 1999 World Bank
81
report suggesting that basic health care is available to only 28 % of rural people and only 13% have a pharmacy nearby. The report also points to inconsistencies between entities and cantons as to which categories of population are entitled to free health care, notably in relation to the extent of disability. In Albania, regional differences in infrastructure and poverty are key factors in limiting access to health care services. The report suggests those living in the mountainous north and east of the country have fewest health care facilities and have to travel farthest to the nearest facility. A 2000 survey found that 55% of those in rural areas were not registered at a health centre, and 21% of those living in Tirana. There is a consequent leap-frogging in terms of directly going to secondary health services. In addition, in-migration has created slum like conditions in the larger cities, combining high health risks and poor health services. The Albania report notes gender inequities in relation to health care which may also apply elsewhere in the region, which are a product of lack of time, lack of insurance and lack of gender sensitivity in health care services. Throughout the region, it has been noted that the specific health needs of Roma are not well understood or addressed by existing health care services (SEEHN, 2006; 36). 5.4.3 Out of pocket payments Out-of-pocket payments appear to be considerable throughout the region and, whilst, they can be said to support health financing at one level, it is their regressive effects on poorer households which are most worrying. Broadly speaking, such payments can be divided into two broad sub groups: formal, official co-payments required by public health services for some or all treatments and medicines; and informal under the counter payments which medical personnel may require before carrying out certain procedures. The second issue relates to the broader question of corruption in health services. Formal health charges have been introduced throughout the region although the nature of these varies greatly and throughout the region there are exceptions in terms of groups who are exempted, wholly or partly, from such charges. In most of the region there is a requirement of a minimal administration charge for all consultations or for particular services and, increasingly, this is also applied to medicines. In addition, in many instances, public health services maintain a list of free or low cost medicaments and a list of drugs for which the patient has to pay. In Albania such co-payments tend to be kept low and are often not collected as there are few incentives for providers to collect them. In Bosnia-Herzegovina, full costs are paid for a number of medical services regardless of whether the patient is insured or not. These include: non-compulsory vaccinations, papa test, hormonal blood tests, all dental prostheses, and abortions. A recent World Bank study suggests that more than 80% of patients contribute with some out of pocket payment. The impact of health expenditures is twice as high amongst poor households as rich households. As noted above, there are wide disparities in terms of prescription charges and participation fees throughout the country. In Kosovo, co-payments amount to almost 50% of all health financing and up to 80% of drug expenditures. Whilst in absolute monetary terms there does not appear to be much difference between spending by the poorest and richest quintile, the poor spend in some cases up to three times their disposable income on health payments compared to the rich. In Montenegro, there are no studies of the impact of out of pocket payments although they are said to be increasing and to disproportionately impact on the poor. In Serbia out of pocket payments are substantial, together with expenditures on military personnel amounting to over 6% of GDP. Almost half of respondents in a recent survey obtained drugs from private pharmacies, paying out of their own pocket. There is a high burden of health expenditures as a total of all expenditures amongst older households. In Kosovo in 2000, 26.4% of respondents reported not seeking treatment because it was too expensive and in Albania, a third of respondents in a recent study
82
reported that they were unable to obtain health care for household members (SEEHC, 2006; 62). Whilst less is known about informal payments, they appear to be significant and have not reduced over time as formal payments have increased. Crucially, the existence of such payments is both a major cause of inequity in health and a serious barrier to reform. In Albania 22% of respondents are reported to have made informal payments (SEEHN, 2006; 61) although the Albanian report suggests that the practice is probably even more widespread. In Bosnia-Herzegovina the World Bank estimates that informal payments amount to at least two to three times the formal participation rate. No figures are available for Montenegro or for Serbia although the practice is also reported to be widespread and the sums involved significant. In Kosovo, shortages of health care services and the existence of a fund for treatment abroad also increase the risks of corruption. Transparency International’s 2006 ‘Global Corruption Report’ (Transparency International, 2006) focused on corruption in health as a specific theme. Within it, Richard Rose traces corruption in post-communist transition countries to legacies of privileged access for communist party elites, those with connections, and those able and willing to pay (Rose, 2006; 39). Allin et al (2006) point to discrepancies in the perceived nature of informal payments, with providers perceiving payments as gifts and the public viewing fees as payments necessary to receive services. They also point to the key role of medical professionals in tacitly approving such payments which appears to vary from country to country and is not directly related to levels of remuneration. 5.5 Main Reforms and Drivers of Change The pressures on health care system and, indeed, the drivers for change, are rather similar throughout the region and rather easily identifiable. At the same time, health reforms have been rather piecemeal with limited impacts and sometimes unintended consequences. There has been significant, albeit in raw financial terms declining, international assistance efforts to support health care reform in the region although, sometimes, donor interventions have not been well co-ordinated and, in addition, more direct humanitarian assistance and funding of model projects and programmes have sometimes cut across the broader strategic reform agenda. Whilst up to date figures are not available, the SEEHN report suggests that in 2002 external resources for health care represented between 0.3% (in Serbia and Montenegro) and 6.8% (in Albania) of GDP. In general terms, well-developed health care systems throughout the region have been undermined by declining revenues, by deterioration of physical infrastructure, and by demoralisation of human resources. At the same time, public expectations have grown apace and the possibilities of technological advances have also contributed to heightened expectations of improved health care. A considerable amount of health expenditure is ‘locked in’ in terms of hospital infrastructure and technologies so that the room for manoeuvre has been quite limited not least as medical professionals have proven to be a politically influential lobby in much of the region. Overall, there has been a noticeable shift in the burden of health care costs from the public sector to households and individuals, through participation payments, informal payments, and the need to purchase service and medicaments on the open market. This has had serious effects in terms of increasing inequalities of access and of care. The attempted shift to primary health services, public health, and preventive health care has been noted above. In addition, there has been an implicit and, at times, explicit, attempt to
83
diversify health care provision and allow a greater role for the private sector. The SEEHN report cites rather different figures on the size of the public sector in health, including health insurance based on World Bank and WHO estimates. What is clear, however, is that in 2002, in Bosnia-Herzegovina over 50% of all expenditure was private, in Albania over 30% and in Croatia and Macedonia around 15%. The discrepancy is largest in Serbia and Montenegro with World Bank estimates at 40% and who estimates at 20% (SEEHN, 2006; 62). One of the clear goals of reform is to try to balance revenues and expenditures both by increasing revenues and by curbing or capping public expenditures. In Albania, despite policy intentions, recurrent expenditures on hospital care are growing in real terms by over 25%, twice the rate of growth of primary care. In part as a result of this, much of the population, particularly in rural areas, avoids primary care services and moves straight to secondary care services. Albania lacks a clear health care reform strategy although the Albania report indicates the need for improving revenue collection and indicating clearly what basic package of services should be available to all. The report also notes the difficulties in reforming payment systems to introduce clearer purchasing arrangements and a more efficient purchaser-provider split. Importantly, the expansion of the private pharmaceutical sector has outpaced its regulation so that there is a need to, also, improve licensing, monitoring and pricing policies. In Bosnia-Herzegovina, the SPSI report notes an atmosphere of ‘constant crisis’ in the sector periodically erupting in strikes or breakdowns in services. It has proven to be politically difficult to tackle the fragmentation of health services and the need for greater centralisation or, at least, portability of entitlements. The report suggest that there will be a need to introduce supplementary voluntary health insurance providing access to more services, alongside an equalisation of the burden of financing. It notes a series of proposed measures in terms of resource allocation, including a shift from a salary based system for health professionals to a mixed system of capitation and performance-related pay. The BiH report suggest that future priority areas are geriatric care, the prevention and management of chronic diseases and long term care. In Kosovo, reforms seek to match increasing health demands with limited resources, to decentralize the health system and strengthen primary health care. The SPSI report calls for significant investment to improve the quality of basic care, especially in the priority areas such as maternal and children’s health, heart and lung diseases to reduce the number of deaths from treatable causes. The unresolved reform issue is related to health care financing with plans to introduce health insurance on hold as a result of their cost implications. Most recent thinking from the World Bank proposes a planned increase in public spending combined with raising funds through indirect taxation as well as an analysis of the potential for private voluntary health insurance in the future. It also suggests a minimum benefits package to be financed from public spending offset by co-payments, offering some coverage for essential drugs for the entire population. In Montenegro, clear reform priorities have been identified in the Master Plan for Health Care and Development in Montenegro until 2010, and in the Strategy of Health Care Development Plan until 2020. These documents develop planning mechanisms to ensure equal access for all to good quality health care through organisational and managerial reforms and the outlining of priorities. The text prioritise public health and primary health care meant to meet 85% of all the population's health needs. Revenue maximisation is discussed alongside the importance of introducing business principles to public sector health facilities. Montenegro has also
84
introduced private facilities within public health care institutions. 4 key objectives are set for the longer-term: Extending life expectancy; Improving quality of life relating to health; Decreasing differences in the state of health and access to the health care system; and Distributing risk through insurance (Government of Montenegro, 2003) In Serbia, there have been efforts since 2000 aimed at reconstruction of health care institutions, informatisation, decentralisation, the drawing up of a number of strategic documents and an ethical codex, as well as the introduction of symbolic capitation payments for primary health care providers which has been staled, to extent, as most of the population has not yet chosen a GP. The Serbian SPSI report notes the ad hoc and sometimes short-term, uncoordinated nature of these actions, with little attention to a rigorous study of costs and benefits and without stakeholder consultation and consensus building. The report also notes the protection of patients' rights as a key outstanding issue for the future. Overall, there is a noticeable gap between a reform agenda intent on creating a modern and fiscally sustainable health care system and the realities on the ground. Throughout the region, there have been a series of reform projects essentially targeting the same core issues. As noted above, health systems are not easy reform targets, given the adherence by powerful lobbies to over-medicalised approaches. A reform agenda supportive of privatisation has been steered in the interests of doctors who, in much of the region, are able to operate private practices within state hospitals. A conditionality imposed by international financial institutions which, simply, targets reductions in overall public health expenditures, to which many governments in the region have signed up, has proved extraordinarily difficult in practice, leading to a rather inequitable mixture of informal marketisation and a dual track health system. 5.6 Conclusions and Key Challenges (EU Objectives) In terms of the EU objectives, ‘access for all to adequate health and long-term care’ (objective 1) is perhaps the most serious problem in the region, both in terms of the lack of systematic research and, even more importantly, the lack of meaningful attention to this issue among policy makers. There is a clearly emerging correlation between ill-health and socio-economic status throughout the region. In addition, poorer households, minority households, older people and those living in rural or isolated areas face a ‘health tax’ in terms of having to travel greater distances and/or pay more to receive health care. Formal and informal marketisation in terms of out of pocket payments, the introduction of private health care alongside public provision, and increasing discussion on the possibility of additional health insurance allowing for more rights for some, all pose serious threats to access for all. The issue of quality of health care in the context of changing needs and preferences (objective 2), has not been sufficiently addressed either in terms of evidence-based planning nor in terms of the establishment and monitoring of quality standards. Albania seems furthest forward in terms of institutionalising quality control mechanisms although even here these are not yet fully institutionalised. The issues of quality control in long-term care is particularly important, including in mental health services. Here, Montenegro appears to stand somewhat alone in terms of having a strategic approach to improved mental health services. Issues of affordability and sustainability, a rational use of resources, and use of appropriate incentives (objective 3) are in central focus and there are ad hoc reform efforts in place. In the face of demographic pressures and the difficulty politically of rationing health resources, there are major dilemmas and problems ahead for all of the region.
85
What is clear is that there is immense scope for a regional approach to health care within the Western Balkans. The work of the South East European Health Network appears to be continuing linked to the new Regional Co-operation Council, although as yet there appears to be minimal linkage between analytical work, issue based projects and policy change. There is scope for exchanges of best practice in terms of reform in which issues of the economics of health are explicitly linked to issues of access and inclusion within the region and with partners inside the European Union. Linking health and social protection services, improving community-based and preventive services, and ensuring good quality information exchange would also be beneficial throughout the region.
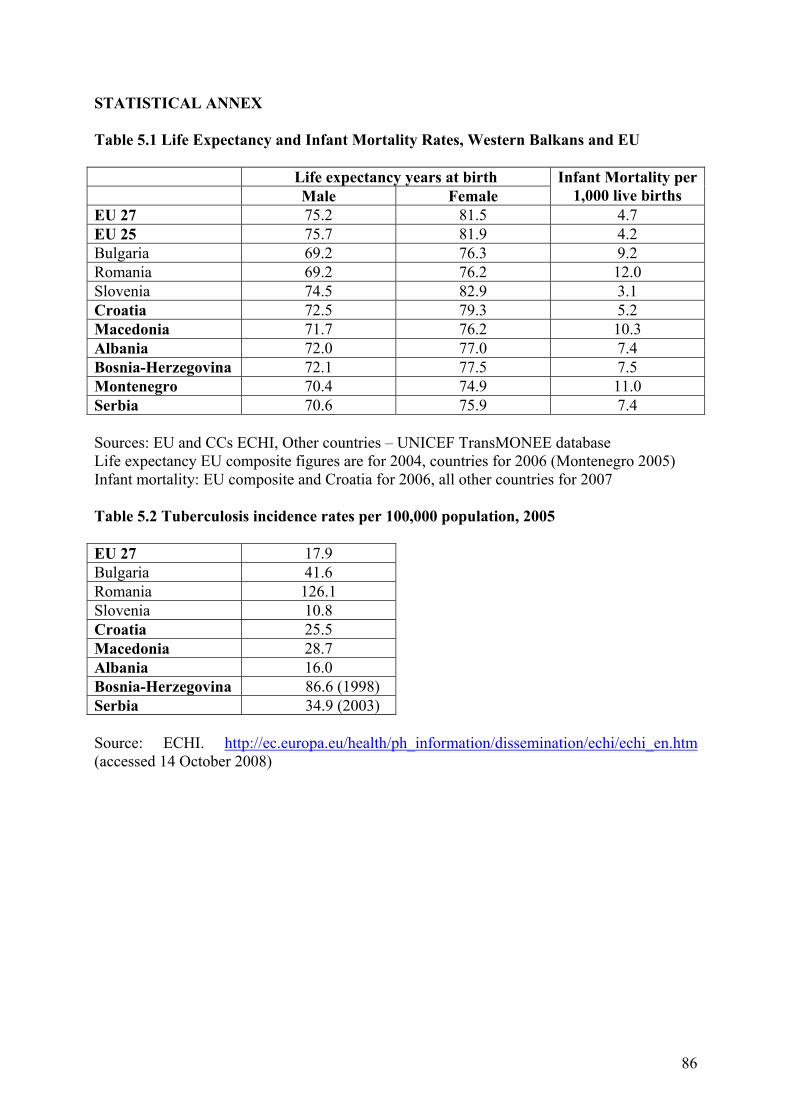
86
STATISTICAL ANNEX Table 5.1 Life Expectancy and Infant Mortality Rates, Western Balkans and EU
Life expectancy years at birth Male Female
Infant Mortality per 1,000 live births
EU 27 75.2 81.5 4.7 EU 25 75.7 81.9 4.2 Bulgaria 69.2 76.3 9.2 Romania 69.2 76.2 12.0 Slovenia 74.5 82.9 3.1 Croatia 72.5 79.3 5.2 Macedonia 71.7 76.2 10.3 Albania 72.0 77.0 7.4 Bosnia-Herzegovina 72.1 77.5 7.5 Montenegro 70.4 74.9 11.0 Serbia 70.6 75.9 7.4 Sources: EU and CCs ECHI, Other countries – UNICEF TransMONEE database Life expectancy EU composite figures are for 2004, countries for 2006 (Montenegro 2005) Infant mortality: EU composite and Croatia for 2006, all other countries for 2007 Table 5.2 Tuberculosis incidence rates per 100,000 population, 2005 EU 27 17.9 Bulgaria 41.6 Romania 126.1 Slovenia 10.8 Croatia 25.5 Macedonia 28.7 Albania 16.0 Bosnia-Herzegovina 86.6 (1998) Serbia 34.9 (2003) Source: ECHI. http://ec.europa.eu/health/ph_information/dissemination/echi/echi_en.htm (accessed 14 October 2008)
87
References Allin, S. et al (2006) Paying for ‘Free’ Health Care: the conundrum of informal payments in post-communist Europe, in Transparency International (2006) Global Corruption Report: Corruption and Health. Web: http://www.transparency.org/publications/gcr/download_gcr/download_gcr_2006 (accessed 29 October 2008) Government of Montenegro (2003) Strategy for Health Care Development in Montenegro, web: http://www.gov.me/files/1077189400.doc (accessed 27 October 2008) Rose, R. (2006) Corruption is Bad for your health: findings from Central and Eastern Europe, in Transparency International (2006) Global Corruption Report: Corruption and Health. Web: http://www.transparency.org/publications/gcr/download_gcr/download_gcr_2006 (accessed 29 October 2008) South East European Health Network (SEEHN) (2006) Health and Economic Development in South East Europe. WHO Europe and CEB, web: http://www.euro.who.int/document/E89184.pdf (accessed 29 October 2008). Transparency International (2006) Global Corruption Report: Corruption and Health. Web: http://www.transparency.org/publications/gcr/download_gcr/download_gcr_2006 (accessed 29 October 2008) UNDP (2006) At Risk: Roma and the Displaced in South East Europe. Bratislava: UNDP Regional Bureau for Europe and the CIS. Web: http://europeandcis.undp.org/poverty/show/1F1720E9-F203-1EE9-BC7AE7B9E8FA04E4 (accessed 27 August 2008). UNICEF IRC (2006) Innocenti Social Monitor 2006: Understanding Child Poverty in South East Europe and the Commonwealth of Independent States. UNICEF IRC, Florence, web: http://www.unicef-irc.org/cgi-bin/unicef/download_insert.sql?PDFName=&ProductID=419&DownloadAddress=/publications/pdf/ (accessed 29 October 2008)
88
6: CONCLUSIONS AND KEY CHALLENGES 6.1 Key Challenges and Policy Options All of the SPSI reports list key challenges and set out a number of policy issues which need to be addressed in the near future. Here we note only those which have a wider applicability across the countries of the Western Balkans as a whole. We take as axiomatic that economic growth, job creation and improved education services, discussed in Chapter 1, are of immense importance in the fight against social exclusion. There is clearly an urgent need for concerted efforts to mitigate the impacts of the current economic and financial crisis on the most vulnerable. In addition, finding ways to channel remittances into social and economic development, ensuring that returning migrants receive support in entering formal employment, and formalising in some ways aspects of informal employment, are key challenges but are beyond the scope of this report. A concerted strategy to minimise the negative impacts of migration, primarily emigration, is clearly needed. This would have to be a multi-dimensional strategy including elements discussed in chapter 1 above: targeted support for migrants wishing to return; better channelling and investment of remittances; improved involvement of migrant associations in policy making; increased targeted development assistance to areas from which migration occurs; incentives to key professionals not to migrate; reciprocal and portable social security entitlements; and so on. As in many of the issues discussed here, harmonisation, in this case of visa and immigration policies within the Western Balkans, and between the Western Balkans and the European Union, would help to create the conditions for more optimal policies. One other issue which is worth restating in the context of a longer-term and more nuanced perspective on social protection is that the region has particular legacies and strengths in terms of social protection. In particular, legacies of extended family support; Bismarkian legacies of insurance based social protection systems; the Yugoslav socialist legacy of Centres for Social Work as a public response to social problems, including the development of professional social work education and training; social planning, social innovation and, in some senses, local community development. Reform options need to respect and build on the positive aspects of these legacies whilst seeking to modernise and adapt them to new conditions. Whilst this is not an easy task, it is immensely preferable to a tabula rasa or ‘shock therapy’ approach which misjudges the legacies as negative or ignores them all together. In a sense, this raises the more complex and perhaps even more important issue of the local ownership of reforms and the importance of expertise being wider than merely that of economics or law. Crucially, there is a need to go beyond an approach to reform which acts “as if economic and social change can be imported within two or three years” (Dümmling, 2004; 274). In terms of the process of reform, beyond the importance of evidence-based approaches to policy, there is a need to involve local expertise and, above all, to develop systems in which all stakeholders, including those at risk of poverty and exclusion, are enabled to participate in meaningful ways. Here, we concentrate on the content of policy, noting the four themes which are emphasised in the EU’s objectives on social inclusion, before addressing broader cross cutting issues. In addition, the needs of vulnerable ethnic groups, especially Roma are considered separately. 6.1.1 Challenges concerning the social protection and social welfare systems 1. Social assistance and social services need to be better co-ordinated, with more emphasis on social services alongside a shift towards more community-based services and a mix of providers, including a greater role for the non-profit sector, within a consolidated public
89
policy framework avoiding humanitarianism and charity approaches. Entitlements to social assistance should be nationally based so that residence does not affect level of benefit except in the case of demonstrable increased costs. Mitigating the effects of fuel price rises on the most vulnerable should be a priority whether through subsidies, rebates or special schemes. 2. Clearer linkages between the social protection and labour market systems should be developed, promoting active inclusion whilst ensuring that the unemployed receive both adequate benefits and assistance in returning to work or receiving appropriate training. 3. Modern social work approaches are needed involving clear assessment, planning and review, especially in order to respond to emerging new risks and new social problems. Case management approaches are needed involving named key workers able to exercise supervised and accountable discretion in multi-disciplinary environments. 4. Services for children and families should be a major priority, including early childhood support and adequate child and family benefits. There may be a case for universal child benefits and there is certainly a strong case for child benefits in Albania and Kosovo where none exist at present. 5. For vulnerable groups including, in particular, people with disabilities, a minimum basket of services provided free and as of right should be developed. Over and above this, services should be clearly costed and available to all who need them based on means. Clear minimum quality standards of services should be devised, piloted, introduced and regularly revised and updated. 6.1.2 Challenges concerning fighting poverty and social exclusion 1. Improve and rationalise social assistance schemes to maximise their poverty alleviation impacts. Whilst ‘targeting’ is, often, a good way to do this, care should be taken to avoid stigma and the possibility of errors of exclusion. Whilst conditional cash transfers may be considered in the region, there is, again, a need to be cautious regarding the possible negative impacts on stigmatised and vulnerable populations. 2. Clear programmes for those at risk of exclusion including the working poor, the unemployed, older people, people with disabilities, large families, single parents, people in rural areas, and institutionalised and homeless populations, with a special emphasis on gender and ethnicity issues. 3. Actions to minimise the generational transmission of poverty and exclusion through enhanced early childhood and educational support for those at risk. 4. Promote active employment and support for (re)-integration into the labour market for young people, women, people with disabilities, minorities, and older people. 5. Work to systematically reduce the number of children and people with disabilities in residential/institutional care and minimise the time spent in care, particularly for young children. An integrated response would include: gate-keeping; improved preventative services; expansion of non-institutionalised alternatives including foster care; moratoria on new buildings; deinstitutionalisation plans; re-training of staff; and so on. 6.1.3 Challenges concerning pensions systems 1. Explore the feasibility of creating minimal social pensions for those older people who do not have sufficient contributions to receive an old age pension. 2. Improve access to pensions for those involved in agricultural work, including those in subsistence agriculture, for Roma, for displaced persons, and for people with disabilities. Assess the possibility of portability of pension systems for migrants and returnees. 3. Take a cautious, step-by-step approach to pension reform concentrating, in the first instance, on stabilising and creating sustainability within the existing public pay as you go pension system.
90
4. Improve contribution collection and seek to minimise evasion and non-compliance. 5. Explore the value of tax and other incentives to support savings in private, voluntary pension systems. 5. Ensure transparency and availability of information on contributions and forecasts of pension levels. 6. Explore measures to promote flexibility in terms of prolonging working life and ensure equity between different pensions (men and women; age cohorts; etc). 6.1.4 Challenges concerning health and long-term care systems 1. Establish priorities for long-term care services based on demographic trends and, in particular, strengthen community-based, day and respite care services. 2. Wherever possible ‘scale up’ proven innovative programmes of support for vulnerable groups, introduction of new technologies, and new services (e.g. mobile units, tele-medicine, etc) 3. Create a clear charter of patients’ rights and code of ethics for health professionals. 4. Create mechanisms for clear evidence regarding use and misuse of resources and introduce quality control mechanism in health care services. 5. Broaden and deepen preventive health education programmes, providing children and parents with basic knowledge of healthy living, nutrition, illness prevention, and so on. 6. Plan to realise economies of scale through merging of specialised centres whilst ensuring grants to enable access for poor and vulnerable groups. 7. Introduce mechanisms to monitor effects of reforms on poor households and seek to promote access for all to appropriate health care services and introduce mechanisms to protect vulnerable households from health expenditure induced poverty, including through meaningful exemptions from formal participation payments. 8. Work to eliminate corruption in health care systems and reduce the need for informal payments. 6.1.5 Social inclusion of vulnerable ethnic groups, especially Roma Not withstanding concerns on the problems of ‘group oriented’ measures to combat social exclusion (UNDP, 2006; 97), it is clear that, over and above the general policies noted above, there is a need for specific policy responses to the vulnerabilities of the Roma communities in South East Europe. Of course, these responses will need to vary from place to place and in the context of the actual situation of diverse Roma groups. Key general priorities, however, include: 1. A long-term focus on Roma education with clear objectives and increased financing, going beyond separate and segregated approaches to promote educational inclusion, if necessary through additional special measures. 2. Streamlining and improving Decade of Roma Action Plans and above all ensuring their adequate monitoring and evaluation, alignment with an area-based approach, and clearer and more transparent mechanisms for Roma participation. 3. A particular focus on empowering Roma women through education, training and support. 4. Innovative approaches to improve formal employment through job coaching, incentive schemes and other measures. 6.2 Cross-cutting issues A number of challenges are identified in the reports which are not specific to one issue but, are, rather, concerned with broader questions of how best to tackle poverty and social exclusion. These relate both to issues of co-ordination and strategy development and to
91
innovative approaches and lesson learning. Some of those which are most often mentioned and/or which appear to have the most to offer are noted in summary form here. 6.2.1 Challenges concerning the governance and co-ordination of social inclusion strategies 1. One strategy for poverty and social exclusion, incorporating all relevant sub-strategies, with one lead agency and one monitoring and evaluation system should be in place. 2. The strategy should be based on involvement of all stakeholders at all stages, including people experiencing poverty and social exclusion. 3. Reforms should be based on a whole system or integrated approach with the impacts of macro-economic and other policies (e.g. utility pricing) on vulnerable groups constantly monitored. 4. Improved horizontal and vertical co-ordination of policy development including the setting of appropriate scales of intervention for tackling social exclusion, with the optimal balance of national regional and local policies and services. 6.2.2 Challenges concerning improving capacities for evidence-based policies 1. Increased capacity of statistical agencies and systems to gather relevant, accurate and timely data for the development of appropriate social inclusion policies, included disaggregated data where relevant, in consultation with users of statistical data and persons experiencing exclusion. 2. Agree indicators and establish monitoring systems in line with best European and EU practice. 3. Establish clear programme of diverse research on the nature, causes and consequences of poverty and social exclusion, involving state bureau of statistics as well as independent research institutes. 6.2.3 Challenges concerning area-based approaches to social inclusion 1. Explore the spatial dimensions of exclusion and ensure prioritisation of disadvantaged regions and locations in terms of health, education, employment, social protection and other services (e.g. transport). 2. Consider introducing clear locally integrated strategies (Inclusion action zones) in areas experiencing high levels of multiple deprivations, with systematic and ongoing evaluation of impacts. 6.2.4 Challenges concerning anti-discriminatory policies and practices 1. Prioritise anti-discriminatory legislation and practice in key aspects of social and employment policy, and engage in public awareness campaigns on the consequences of discrimination and need for anti-discriminatory measures. 2. Social inclusion and social cohesion need to be more closely linked with issues of dealing with the past and national reconciliation. 6.3 Towards a regional approach? Recent thinking on social policy questions has suggested that a regional approach can strengthen learning, through a sharing of best practice and, even, the establishment of regional standards, in 'traditional' social policy spheres such as in employment protection and labour markets, health services, social protection (income maintenance and social services), and the empowerment of vulnerable groups as well as in education, housing, migration and conflict prevention. It can also contribute to processes of regional reconciliation. Regional groupings of countries sharing similar traditions, legacies and developmental paths appear able to
92
develop a degree of co-operation not just in terms of cross-border questions but in terms of wider sets of rights and responsibilities. There are, of course, many historical and contemporary reasons why regional co-operation in the Western Balkans has faced difficulties. Nevertheless, Governments and other national stakeholders are involved in diverse co-operation, through the Regional Co-operation Council (RCC), and through participation in regional networks, and in both the Council of Europe and in EU accession and association processes. The EU framework in terms of the objectives on social inclusion could be a point around which diverse initiatives cohere, and international assistance is channelled. This report is but one small contribution to encouraging that process in South East Europe.
93
References Dümmling, B. (2004) Country Notes: the impact of Western social workers in Romania – a fine line between empowerment and disempowerment, in Social Work and Society, 2 (2); 270 – 278. UNDP (2006) At Risk: Roma and the Displaced in South East Europe. Bratislava: UNDP Regional Bureau for Europe and the CIS. Web: http://europeandcis.undp.org/poverty/show/1F1720E9-F203-1EE9-BC7AE7B9E8FA04E4 (accessed 27 August 2008).


![Publishable Synthesis Report - European Defence Agency · RHP-CERA-0016 Publishable Synthesis Report – V2.1 [31.05.2018] RHP – Technology GmbH, Forschungs- und Technologiezentrum,](https://img.pdfslide.us/doc/110x75/5f045e6c7e708231d40da2d1/publishable-synthesis-report-european-defence-agency-rhp-cera-0016-publishable.jpg)