Embed Size (px)
Citation preview

CLIMATE RESEARCH Clim. Res.
Published July 27 I
A synoptic climatology of stream flow and acidity
Brent Yarnal, John D. Draves '
Department of Geography and Earth System Science Center, The Pennsylvania State University, University Park, Pennsylvania 16802, USA
ABSTRACT: Prevlous investigations have suggested relationships among weather, stream flow and water chemistry. Presumably, acid rain liberates soil sulfates during periods of heavy precipitation. simultaneously raising stream levels and acidity. This paper expands on those works by reporting a synoptic climatology of stream flow and stream-sulfate concentrations. Separate manual analyses of high-discharge and high stream-sulfate events in central Pennsylvania. USA, demonstrate that nearly all are associated with lows forming in the lee of the Rocky Mountains, tracking from southwest to northeast, and passing to the northwest of the study area. These lows develop into 2 distinct circulation types: transient cyclonic storms in winter and spring, and stationary fronts in summer and fall. Objective analyses of composite daily pressure-patterns associated with elevated stream flow and stream-sulfate concentrat~ons show sequences similar to those that transport acid rain and surface ozone into central Pennsylvania. Thus, this research suggests that because of the large-scale clima- tology of North Amenca, acidification of the streams of the northeastern United States and south- western Canada IS likely to continue. It also paves the way for more-reflned directed case studies and modcling efforts linking the atmosphere to water quallty.
INTRODUCTION
One of the most serious water-quality problems in many regions relates to acid rain. Sulfate concentra- tions in many of America's pristine streams increased substantially from the mid-1960s to the early 1980s (Lins 1986). Acidification of streams and lakes can happen when acid rain alters the soil chemistry. Sulfate and nitrate anions in rainfall or snow melt provide an acidic solution to transport hydrogen and aluminum out of the soil and into the stream (Reuss & Johnson 1985). The quantity of sulfate present is key. Small amounts of sulfate allow calcium to govern the solution, keeping the base saturation high. Increases in sulfate decrease the base saturation, allowing alu- minum to dominate and causing an increase in the acidity of soil water (Reuss 1983).
The surface waters of the contiguous northeastern United States and southeastern Canada are especially prone to acidification. Because the soils are naturally acidic, the addition of any further sulfate can easily
'Present address: Code 974, Hydrologic Sciences Branch, NASA/GSFC. Greenbelt. Maryland 20771, USA
lower the base-saturation level to a point where alu- minum will replace calcium as the preferred cation. In those areas where fresh waters are poorly buffered, any increase in the acid delivered to streams can over- whelm the system (Reuss et al. 1987). An increase in acid rain could have a significant impact on the aquatic ecosystems of these regions.
Sulfate concentrations in surface water display con- siderable variation as meteorological conditions change (Lynch & Corbett 1989); generally, sulfate concentra- tions begin to rise after the start of precipitation and decline after its end. Several investigators have also associated increased stream-sulfate concentrations with increases in stream discharge (e.g. Morris &
Thomas 1987, Kerekes & Freedman 1989, Seip et al. 1989). Most of these studies have focused on snow melt or single-storm events (Harvey & Whelpdale 1986, Baird et al. 1987, Morris & Thomas 1987, Abrahams et al. 1989). No study has addressed the climatology of the relationships linking precipitation, stream flow and acidity. These relationships exist because the atmo- sphere transports acids, provides the mechanism for acid deposition, and supplies the medium that leaches the acids from the soil and into the stream.
O Inter-Research 1993

Clim. Res. 2: 193-202, 1993
Despite local influences which can confound the relationships, such as soils, geology, slope angle and vegetation cover, we hypothesize that the atmospheric circulation must have considerable control over stream flow and acidity. Connections among the synoptic- scale atmospheric circulation, pollution sources and acid-rain receptors determine the total acidity delivered to a site (National Research Council 1983). Receptor sites located near the average storm track and downwind of major pollution source regions will be besieged by acid rain. The northeastern United States and southeastern Canada is one such area. However, despite observational studies (e.g. Raynor & Hayes 1981, 1982, Lazrus et al. 1983, Haagenson et al. 1985, Chapman et al. 1987, Moldan et al. 1988) and modeling efforts (Schwartz 1989), the climatology of acid rain is not completely understood (Yarnal 1991).
One way to understand the climatology of these storm systems, and ultimately the climatology of stream acidity, is to apply a synoptic-climatological approach to the problem. The goal of this paper is to suggest connections among synoptic-scale weather systems, stream flow and acidity. We use separate synoptic climatologies of stream flow and stream- sulfate concentrations to demonstrate these linkages in a small watershed in central Pennsylvania, USA.
SYNOPTIC-CLIMATOLOGICAL THEORY AND METHODS
Synoptic climatology is the study of the relationship between the atmospheric circulation and the sur- face environment. To establish this relationship, all synoptic climatologies have 2 stages (Barry & Perry 1973). The first stage is the classification of the atmo- spheric circulation; the second is the determination of the relationship between the circulation categories and the surface environment.
Many approaches to synoptic classification have been developed, but these can be lumped into one of 2 approaches: circulation-to-environment or environ- ment-to-circulation. The distinction between the 2 approaches is in the way the atmospheric classification and the surface environment relate to one another (Yarnal 1993).
In the circulation-to-environment approach, the investigator designs the synoptic classification to relate to a region. The classification is fairly general, typically representing the complete range of the atmospheric circulation over the area and the entire period for which data are available. Although the synoptic data might be chosen because they are believed to have a distinctive effect on a certain environmental vanable, no environment-specific criteria are set for the circula-
tion data's inclusion in the classification scheme. The classification of circulation data is therefore indepen- dent of the environmental response. To Illustrate this approach, say the investigator wishes to study the relationship between acid rain and the atmospheric circulation. If he or she first complles a classification of weather types over the region and then relates the classes to days with high precipitation acidities, the investigator is employing a circulation-to-environment scheme. Yarnal (1993) identified 5 categories of circu- lation-to-environment schemes: manual synoptic typ- ing (e.g. Lamb 1972); correlation-based map-pattern classification (Lund 1963); eigenvector-based map- pattern classification (e.g. Key & Crane 1986); eigen- vector-based synoptic types (e.g. Kalkstein & Corrigan 1986); and circulation indexing (e.g. Yarnal & Leathers 1988).
In contrast, with the environment-to-circulation approdch the investigator identifies the atmospheric circulation associated with particular environmental conditions at the surface. He or she sets environment- specific criteria for inclusion of the atmospheric circu- lation data; thus the synoptic classes are not indepen- dent of the environmental response. For example, in the hypothetical research on acid rain, if the investiga- tor only classifies the circulation when the pH of pre- cipitation is less than 4.0, then the surface environment is dictating the selection of synoptic data. The best- known example of environment-to-circulation classifi- cation are composites; i.e. 'average' maps of specific situations (e.g. Winkler 1988).
Yarnal (1993) developed a methodology to evaluate the most appropriate synoptic-climatological classifi- cation to use with any environmental variable. He applied methods representing the 5 circulation-to- environment classification categories to a range of environmental data, and then used model-compari- son statistics to assess both the absolute and relatlve performances of the various classifications (see the following section for a brief explanation of these statistics). Composites, representing the environment- to-circulation approach to synoptic climatology, were also produced for each environmental scenario. His results showed that no single synoptic-classification method is always superior to another. In some envi- ronmental situations, all methods show a strong asso- ciation between the atmospheric circulation to the surface environment; in others, one classification may outperform the rest, but it is difficult to determine why. He also concluded that some environmental scenarios are obviously strongly influenced by the synoptic climatology, but may not be amenable to circulation-to-environment classifications. In these cases, environment-to-circulation strategies can reap rich rewards.

Yarnal & Draves: Stream flow and acidity
STUDY AREA, DATA, AND METHODS
The precipitation, discharge, and stream-sulfate- concentration data are from the Leading Ridge Experimental Watershed Research Unit in Huntingdon County, central Pennsylvania. Leading Ridge Water- shed One has an area1 extent of 122.6 ha. The stream draining this watershed develops from 2 perennial, first-order channels and several intermittent channels. I t exhibits a rapid response time, with increased hydro- logic activity noted less than 30 min after precipitation starts (Lynch & Corbett 1989).
Leading Ridge lies in the Appalachian Highlands Ridge and Valley Province, and is underlain by strongly folded sedimentary rocks. The upper slope and ridge top are underlain by quartzite, the middle slope by sandstone, and the lower slope by shale. Limestone is located in a narrow belt below the stream-gauging station. The absence of limestone above the gauging station is important, since chemical weathering of limestone could interfere with both the stream flow and water chemistry results. Most of the upland soils on Leading Ridge are residual, forming from the underlying bedrock. The natural vegetation is a second-growth hardwood forest. No known harvest- ing occurred during the study period that could have caused runoff levels to fluctuate for reasons other than meteorological conditions. Lynch & Corbett (1989) give a complete account of the biology, geology, hydrology, and pedology for the study site.
A unique attribute of Leading Ridge is the rural setting in central Pennsylvania. All significant point sources of pollution are more than 40 km from the sampling site. The major pollution sources in the pre- vailing upwind direction are more than 100 km away. Thus, the data are regionally representative. Despite its rural location, the area consistently registers some of the most acidic precipitation in the national network.
The precipitation data are daily values collected at the site, and are continuous for the entire 10 yr study period. The discharge data are daily averages recorded by the stream-gauging station. Only one day is missing from this record.
There is a distinct seasonal cycle of stream discharge at Leading Ridge, with peak runoff in early spring and a low in the late summer-early autumn. Thus, the investigation called for a measure that is not sensitive to seasonal differences in discharge. We utilized the change in percentage from the previous day's dis- charge to capture the day-to-day variability in stream flow associated with various synoptic categories. This value is also indicative of a particular synoptic event's precipitation intensity. Unfortunately, the percentage increase from the previous day can be misleading, since large changes in discharge are more likely
during low-flow periods than high-flow periods. This is an admitted weakness, but, after the circulation-to- environment classifications were eliminated (see below) all of the extreme events selected for the environment-to-circulation applications proved to be significant rain episodes.
The stream-sulfatc! concentration data are deter- mined from weekly grab samples; i.e. the specimen bottle is immersed by hand in the stream. Alt'hough these data cover the same 10 yr period as the dis- charge data, there were some missing sulfate values. Generally, the missing data occur at the end of December and the first part of January in most years. As a result, only 479 data samples out of a possible 520 were available for analysis.
The sulfate concentrations display a strong seasonal cycle. The lowest concentrations occur from late summer to early fall (August and September) and in- crease from October to December. The highest levels are recorded from January to March, and are followed by a steady decrease during the spring and summer months. This is the reverse of sulfate concentrations in precipitation recorded at the site. The decline during the spring and summer appears to result from the decrease in base flow associated with soil-moisture depletion during the growing season. No soil-moisture data were available. Ground-water sources control stream discharge in summer, with relatively small contributions from storm flow. This seasonal pattern suggests the existence of a sulfate reservoir in the watershed's soils (Lynch & Corbett 1989).
We encountered a significant problem in selecting an appropriate technique to remove the seasonal signal from the Leading Ridge stream-sulfate observa- tions. Because the data exhibit a periodic fluctuation, the investigators used a Fourier transformation to perform this task. We filtered any periodic component greater then 3 mo, thus eliminating the seasonal signal present in the data. Besides the seasonal signal, no statistically significant peaks occur in the power spec- trum. Because the data set is not continuous over time, each transformed value was compared to the original sulfate data to ensure that it was not an artifact of the time-series reconstruction.
As detailed below, we constructed composite sequences of pressure patterns associated with high- and low-sulfate events. These composites were weakened because the stream-sulfate samples were taken only once per week. This means that there is a good chance that the day with the most extreme sulfate concentration occurred on another day in that week. Thus, those days farthest in time from the day we used to represent the event day could be almost any pres- sure pattern; days closer to this once-per-week 'event day' will be more variable than in reality. The former

196 Clim. Res. 2: 193-202, 1993
situation will produce a pressure pattern that has a flat field; the latter patterns will be more diffuse than should be expected. The fact that this analysis pro- duced relatively well-developed sequences forming the expected composite patterns (e.g. see Fig. 2) sug- gests that pressure patterns related to high-sulfate events are pronounced and robust.
We related the discharge and concentration data to the 5 circulation-to-environment synoptic-classification types identified by Yarnal (1993). Mean-sea-level data based on the National Meteorological Center grid were used for the correlation-based map-pattern classifica- tion, eigenvector-based map-pattern classification and circulation indexing. We employed TD-1440, $-times- daily synoptic data from the Pittsburgh airport to deter- mine the eigenvector-based synoptic types. Surface weather maps from NOAA were used for manual map- pattern analysis. We lirn~ted the analyses to surface data to facilitate a comparison of the various class~fication models. A more comprehensive investigation would include simultaneous associations with upper-air patterns; however, this research is a 'first cut' at the synoptic climatology of stream flow and acidity.
Using model-comparison statistics (Willmott 1981, 1982, 1984, Willmott et al. 1985) we assessed the over- all ability of these classifications to predict the varia- tions in discharge and stream-sulfate concentration (Tables 1 & 2). RMSE is the root mean square error of each classification model. RMSE, is the model-induced error, while RMSE, is error that cannot be accounted for by the model. Because a good model should explain most of the systematic variation in the observed variables, RMSE, should be small, while RMSE, should
approach RMSE. If RMSE, is relatively large, the model can be tuned to decrease this model-induced error. The percentage of the error that can be elimi- nated by fine tuning is (RMSE,/RMSE12. Willmott's index of agreement ( d ) reflects the relative degree to which predicted values approach observed values. It varies between 0 0 and 1.0, with 1.0 expressing perfect agreement between observed and predicted values, and 0.0 describing complete disagreement. Thus, the index of agreement is a measure of the degree to which a model's predictions are error free. There is no absolute value that the magnitude of d must reach to become 'significant' - the index of agreement is only meaningful in the context of the problem under investigation.
To calculate the model-performance statistics, we computed the mean percentage change in discharge and stream-sdfate concentration associated with each synoptic-type or map-pattern class. These means became the predicted value for each day having that synoptic class; the real data formed the observed time series. The predicted time series was explicitly not intended as a hindcast, but did show which classification scheme provided the best separation and sequencing of the variable values, thereby producing superior model- performance scores. Table 1 shows that, for stream flow, the RMSE-based statistics look normal, but d reveals huge errors in the model predictions. Therefore, none of the circulation-to-environment approaches adequately explained variations in this variable.
Why did stream flow relate so poorly to the synoptic classifications? The answer is partially related to soil moisture. Preconditioning of the soil determines the
Table 1. Model-comparison statistics for stream discharge from Leading Ridge. See text for explanation of the statistics
Manual synoptic Correlation-based Eigenvector-based Eigenvector-based Circulation types map patterns synoptic types map patterns index
RMSE 1.45 1.49 1.68 1.56 1.63 RMSE, 1.14 1.18 1.38 1.24 1.32 RMSE, 0.90 0.91 0.97 0.95 0.96 (RMSEJRMSE)~ 0.62 0.63 0.67 0.63 0.66 bVillmott's d 0.08 0.07 0.02 0.04 0.03
Table 2. Model-comparison statlstlcs for in-stream sulfate concentrations from Leadmg Ridge. See text for explanation of the statlst~cs
Manual synopt~c Correlat~on-based Eigenvector-based Eigenvector-based Circulation types map patterns synoptic types map patterns index
RMSE 1 29 RMSE, 0.91 RMSE, 0.91 (RMSEJRMSE)~ 0.50 Willmott's d 0 16

Yarnal & Draves: Stream flow and acidity
response of a watershed to a rain event. If soil is saturated, the response is strong and reflects the magnitude of the rain event. If soil is moist, but less than field capacity, then the soil must be brought to field capacity before r.unoff can occur With moist soil, runoff responds positively to large rain events, is not necessarily well matched to moderate rain events, and has little correlation with light rainfalls. If the soil is dry, only the largest rain events can bring the soil to field capacity and produce runoff. Even then, the association between runoff and magnitude is poor, depending on the absolute magnitude of the rain event, the storage capacity of the soil, and other factors, such as infiltration rate. Thus, predictions of daily stream flow based on simple daily synoptic classes are often doomed to failure.
There are a few remedies ?.he synoptic climatologist can use to cure this problem. First, the investigator can restrict the analysis to large-magnitude rain events. Second, he or she can test stream-flow response only when the soil is saturated. These 2 prescriptions, therefore, dictate switching from cli-cu- lation-to-environment schemes to environment-to- circulation approaches. A third solution that permits the investigator to utilize circulation-to-environn~ent classifications involves sequencing (Comrie 1992a). Sequencing identifies multi-day progressions of synoptic types most strongly associated with an envi- ronmental condition. In this case, certain sequences of prolonged rainfall might always raise the soil-water content to field capacity and promote heavy runoff. Fourth, to eliminate the effect of soil on fluvial re- sponse, a n investigator can search for watersheds with little soil and vegetation. In contrast, he or she can apply synoptic climatology to a watershed in a per- humid region where the soils are nearly always satu- rated. Both watersheds would give positive responses to inputs.
The other variable, in-stream sulfate concentrations, fared only slightly better than stream flow (Table 2). RMSE values were moderate, and unsystematic error made up a large proportion of the classification error. Moderate tuning is needed to improve model per- formance. Index-of-agreement (d) values for sulfate concentrations, although still relatively low, are much better than those of stream-flow.
Through an understanding of the physical processes involved, however, we still believed that the atmo- spheric circulation must be related to these environ- mental variables. We concluded that a select group of events might demonstrate the association between circulation patterns and the periods of hydrologic activity needed to trigger high stream flow and high stream-sulfate concentrations; thus, we decided to try a n environment-to-circulation approach. This does not
imply that cli-culation-to-envi~onment approaches are inferior to environment-to-circulation schemes; on the contrary, circulation-to-environment classifications are far more powerful than environment-to-circulation techniques (Yarnal 1993). However, when circulation- to-environment approaches fai.1, t.he weaker environ- ment-to-circulation strategy can still provide good results. Thus, we objectively compiled composite weather sequences (using the NMC grids) and storm tracks (using the NOAA daily weather maps) to help clarify the relationships between the atmospheric cir- culation and the discharge and sulfate-concentration data from Leading Ridge.
RESULTS
Stream discharge
To begin an environment-to-circulation classifica- tion, a determination of appropriate criteria for classi- fying circulation data is necessary. As the criterion for inclusion in the high-runoff event group, we set the value as a stream-discharge increase of greater than 300% ( i .e . greater than 1.0 standard deviation) from the previous day. Overall, 119 days meet this criterion (Table 3 ) and were examined in further detail.
Precipitation occurred on 116 of these 119 days. A closer look at the 3 days on which there was no pre- cipitation reveals that a significant amount of precipi- tation fell on the previ.ous day. This suggests a problem in the timing of the precipitation observation and the recording of the synoptic chart. This is a problem inherent to all daily synoptic climatologies. We deleted these 3 days from the record, effectively setting a second criterion for selection of circulation data; i.e.
Table 3. Monthly distribution of high-discharge events at Leading Ridge Watershed One. High-discharge events are defined as days with discharges at least 300% greater than
those of the previous day
Month No. of events
Jan Feb Mar AP= May Jun Jul *ug S ~ P Oct Nov Dec

198 Clim. Res. 2: 193-202, 1993
precipitation must be recorded. The mean precipita- To determine the cyclones' source regions and paths tion total for the 116 days is 29.5 mm, with a standard for high-discharge events, we extracted the low- deviat~on of 13.7 mm. The distribution of the data pressure centers from the weather maps for 6 consecu- shows that 74 events had precipitation totals in excess tive days, stretching from Day t-4 to Day t+l (relative to of 25.4 mm (1.0 inch). the event-day t ) , and plotted them. The results show
We reviewed weather maps for the days before and that the cyclogenetic areas most likely to cause a high after each event to see if any extended over more than stream-flow event are in the lee of the southern Rocky 1 day. As anticipated, many did and, when multi-day Mountains and over the Gulf of Mexico (Fig. 1) . Only storms are considered, the number of events with pre- one event was associated with a coastal low, and just cipitation totals greater than 25.4 mm increases from one case involved a storm from the northern Rockies. 74 to 91, with the mean precipitation total and stan- The path traveled by the vast majority of storms takes dard deviation rising to 34.8 mm and 16.0 mm, respec- the low-pressure center to Pennsylvania's northwest. tively. This suggests that most periods of high stream There are at least 3 important points to note: (1) only one flow are associated with large precipitation totals ac- of North America's principal cyclogenetic areas (e.g. companying organized systems, rather than convec- Zishka & Smith 1980, Whittaker & Horn 1984) is asso- tive events. ciated with high-runoff events at Leading Ridge;
Each high-runoff event was grouped into storm, (2) only one storm track is associated with the majority stationary front. or 'other' categories. Storm events of such events; and (3 ) cyclones forming in the lee of have high stream flow at Leading Ridge and the the southern Rockies or over the Gulf tend to be in their nearby passage of a transient low-pressure system. mature stage when they reach Pennsylvania. These These systems have well-defined warm and cold findings are similar to those of Maddox et al. (1979, fronts. The passage of a low-pressure center to the 1980) for flash-flood events in the western United States. north of Leading Ridge can transport large quantities of warm, moist air from the Gulf of Mexico. In addition to its potential contribution to high precipitation totals, Stream-sulfate concentrations warm-air advection can melt snow. A large melt can cause a significant increase in stream flow even if the In most regards, the relationships between the amount of precipitation from the storm is relatively atmospheric circulation and sulfate concentrations at light. To be classified as a stationary-front event, the Leading Ridge are similar to the situation for stream low-pressure system associated with high discharge flow. This makes sense because sulfate moves into the at Leading Ridge has to be present for 2 to 5 d , show stream channel during hydrologic events. There are little movement, and have ill-defined fronts. This cate- differences, however. Most important, the time of col- gory helps to explain why large increases in discharge lection influences whether or not the meteorological can occur with a relatively low l-day precipitation conditions will satisfactorily explain the observed total. In these instances, the rainfall from the preceding days saturates the soil, and much of the rain from the event day runs directly into the chan- nel via overland flow or interflow. We excluded the 'other' category from analysis because of its relative infrequency; i.e. 7 instances over the 10 yr period.
Approximately 4 3 % of the high-flow events were associated with storms, and 51 % with stationary-fronts. Ap- proximately 90 % of all summer and fall high-flow events corresponded to stationary fronts; roughly 20% of all wintertime high-flow events were stationary fronts, while the remaining 80% were storm events. Most winter- time high flows were associated with rain with little if any Fig. 1. Storm tracks associated with high-discharge episodes. Leadlng Ridge, falling. Pennsylvania. (Reproduced from Yarnal 1993 with perm~ssion of Belhaven Press)

Yarnal & Draves: Stream flow and acidity 199
sulfate concentration. Since the majority of the read- ings come from the morning, sulfate levels often relate better to the previous day's weather. Thus, much of the following analysis will focus on the synoptic conditions of the day preceding the measurement (Day t - l ) .
To begin, we divided the data into groups of high- and low-sulfate concentration events. Data with a standard deviation greater than f 1 . 0 were retained for study. This resulted in 5 2 high-sulfate and 58 low- sulfate events; about 2 3 % of the sample days. We further subdivided the high-sulfate group into storm and stationary-front categories. We assumed that the mixed distribution discovered in the stream-flow investigation would also be present in the sulfate data.
Manual inspection of the weather maps shows that low-sulfate events relate to a variety of weather patterns. Nonetheless, the common thread among these possibilities is that dry conditions pre- vailed for a minimum of 2 to 3 d prior to the day of sulfate measurement. Thus, hydrologic activity and sulfate delivery to the stream were at a mini- mum on that day.
The high-sulfate group, on the other hand, displays a distinct propensity for the occurrence of precipitation just before Day t. On Days t-4 and t-3, dry conditions generally prevailed, but precipitation fell by Days t-2 and t - l . This confirms the results of earlier studies, which concluded that the highest sulfate levels occur during periods of hydrologic activity (e.g. Harvey & Whelpdale 1986). On Days t -4 and t-3, the overall mean precipi- tation was 3 . 6 mm, which resembles the long-term daily mean at Leading Ridge. Above-average rainfall (i.e. a mean of 7.4 mm per day) was evident on Day 1-2. Day t - l was the wettest of the five, with an average rainfall of 10.7 mm. On Day t, precipitation totals declined, with a n average of 8.1 mm.
Continued stratification into station- ary and storm events provides more insight into this phenomenon. Of the
52 high-sulfate events, there were 19 storms and 33 stationary fronts. The storm subset shows a striking composite sequence during a high-sulfate event (Fig. 2). It begins with a n elongated ridge over Pennsylvania that evolves into a back-of-high-pressure configuration. This sequence promotes the build up, transport and deposi- tion of atmospheric acids and acidifying agents. First, air stagnates under the ridge over the Ohio River Valley's polluted, high-emissions areas, then it moves with the back-of-high-pressure's southwesterly flow to the Leading Ridge site. As Day t approaches, southwesterly flow continues a s the high-pressure system migrates eastward and a well-defined low-pressure system from the west becomes influential. This sequence can also bring ample rainfall to Leading Ridge, either through decreased stability in the high's northwest q.uadrant, or with low pressure itself (Table 4 ) . On Day t, the center of
Four days before
Two days before
Event day
Three days before
One day before
Fig. 2. Composite maps of surface pressure (mb) associated with high- sulfate events, Leading Ridge, Penn- sylvania. (Reproduced from Yarnal 1993 with permission of Belhaven
Press)
Table 4. Precipitation characteristics associated with a storm-related high-sulfate event at Leading Ridge Watershed One
Day t-4 Day t-3 Day t-2 Day t - l Day t
Mean of all event days (mm) 3.0 3.0 4.6 12.7 12.2 Mean of days with recorded precipitation (mm) 7.1 9.7 8.6 17.0 23.1 Days with precipitation (%) 42.1 31.6 52.6 73.7 52.6
200 Clim. Res. 2: 193-202, 1993
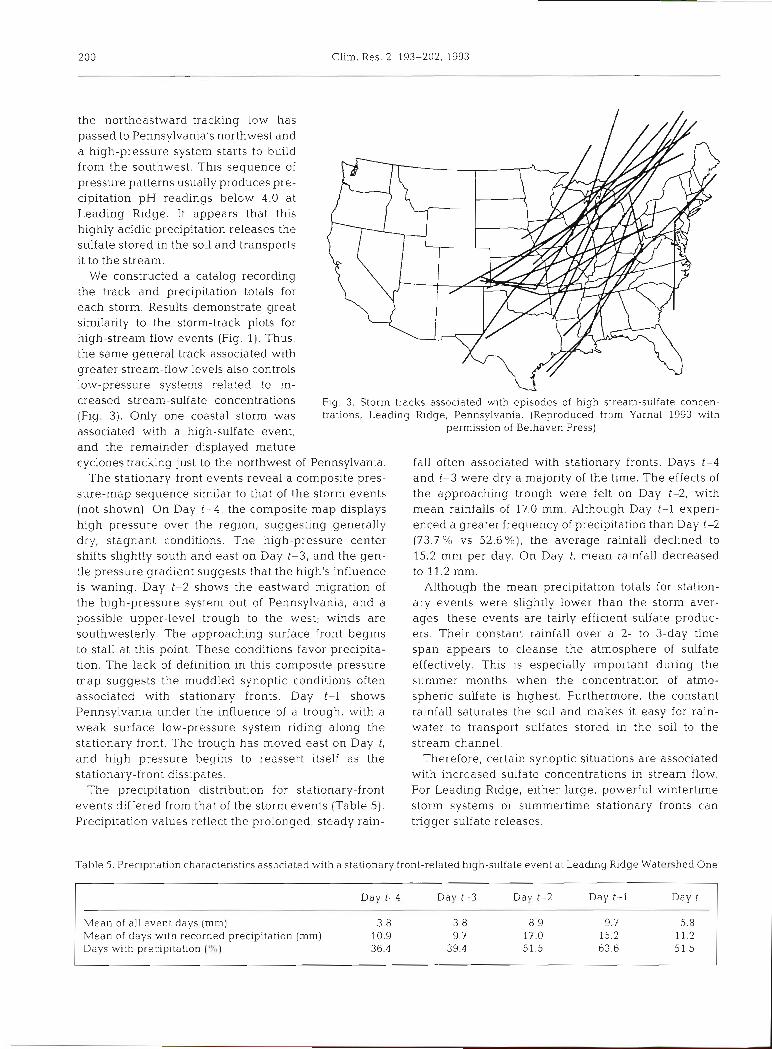
the northeastward-tracking lotv has passed to Pennsylvania's northwest and a high-pressure system starts to build from the sou.thwest. This sequence of pressure patterns usually produces pre- cipitation pH readings below 4.0 at Leading Ridge. It appears that this highly acidic precipitation releases the sulfate stored in the soil and transports it to the stream.
We constructed a catalog recording the track and precipitation totals for each storm. Results demonstrate great similarity to the storm-track plots for high-stream flow events (Fig. 1). Thus, the same general track associated with greater stream-flow levels also controls low-pressure systems related to in- creased stream-sulfate concentrations Fig. 3. Storm, tracks associated with episodes of high stream-sulfate concen- (Flg. 3). Only one coastal storm was trations, Leading Ridge, Pennsylvania. (Reproduced from Yarnal 1993 with
associated with a high-sulfate event, permission of Belhaven Press)
and the remainder displayed mature cyclones traclung lust to the northwest of Pennsylvama. fall often associated with stationary fronts. Days t-4
The stationary-front events reveal a composite pres- and t-3 were dry a majority of the t ~ m e . The effects of sure-map sequence similar to that of the storm events the approaching trough were felt on Day t-2, with (not shown) On Day t -4 , the composite map displays mean rainfalls of 17.0 mm. Although Day t-l experi- high pressure over the region, suggesting generally enced a greater frequency of precipitation than Day t-2 dry, stagnant conditions. The high-pressure center (73.7 % vs 52.6%), the average rainfall declined to shjfts slightly south and east on Day 1-3, and the gen- 15.2 mm per day. On Day t , mean rainfall decreased tle pressure gradient suggests that the high's influence to 11.2 mm. is waning. Day 1-2 shows the eastward migration of Although the mean precipitation totals for station- the high-pressure system out of Pennsylvania, and a ary events were slightly lower than the storm aver- possible upper-level trough to the west; winds are ages, these events are fairly efficient sulfate produc- southwesterly. The approaching surface front begins ers. Their constant rainfall over a 2- to 3-day time to stall at this point These conditions favor precipita- span appears to cleanse the atmosphere of sulfate tion. The lack of definition in this composite pressure effectively. This is especially important during the map suggests the muddled synoptic conditions often summer months when the concentration of atmo- associated with stationary fronts. Day t-l shows spheric sulfate is highest. Furthermore, the constant Pennsylvania under the influence of a trough, with a rainfall saturates the soil and makes it easy for rain- weak surface low-pressure system riding along the water to transport sulfates stored in the soil to the stationary front. The trough has moved east on Day t, stream channel. and high pressure begins to reassert itself as the Therefore, certain synoptic situations are associated stationary-front dissipates. with increased sulfate concentrations in stream flow.
The precipitation distribution for stationary-front For Leading Ridge, either large, powerful wintertime events differed from that of the storm events (Table 5). storm systems or summertime stationary fronts can Precipitation values reflect the prolonged, steady rain- trigger sulfate releases.
Table 5. Precipitation characteristics associated with a stationary front-related high-sulfate event at Leading Ridge Watershed One
Day t-4 Day t-3 Day t-2 Day t - l Day t
Mean of all event days (mm) 3.8 3.8 8.9 9.7 5.8 Mean of days wlth recorded precipitati.on (mm) 10.9 9.7 17.0 15.2 11.2 Days with precipitation ('?41) 36.4 39.4 51.5 63.6 51.5

Yarnal & Draves. Str earn flow and acidity
CONCLUSIONS AND DISCUSSION
This research corroborates previous work on stream- sulfate concentrations that indicated values increase during hydrologically-active periods. I t also demon- strates that high stream-sulfate episodes are intiluately linked to certain atmospheric circulation patterns.
The relationships between the synoptic-scale circu- lation and stream flow and acidity are similar Excess precipitation and snow melt provide a vehicle for transporting sulfate stored in the soil, as well as sulfate from the atmosphere, to the stream channel. During the winter and spring months, large, organized, tran- sient low-pressure systems track to the northwest of Pennsylvania and can lead to elevated discharge and stream-sulfate levels. In summer and fall, the highest discharges and sulfate concentrations are associated with stationary fronts that stall north and west of the study site.
Composite weather maps show a distinct sequence of events leading to high stream-sulfate levels at Leadlng Ridge. These events are preceded by a slug- gish high-pressure system with southwesterly winds, thus providing the physico-chemical environment conducive to sulfate formation and transport (Yarnal 1991). Back-trajectory analysis of surface-ozone trans- port to rural Pennsylvania confirms that stagnant high-pressure over the Ohio River Valley, followed by southwesterly transport associated with the western region of a high, transports heavily-polluted air into central Pennsylvania (Comrie 1992b). In the case of surface ozone, precipitation following the period of southwesterly transport cleanses that pollutant from the air. Similarly, atmospheric sulfate is washed out of the atmosphere by wintertime transient storms and summertime stationary fronts trailing such high- pressure systems. A circulation-to-environment syn- optic climatology verifies that this scenario delivers the most acidic rainfall to central Pennsylvania (Yarnal 1993). Thus, the highest oz,one, precipitation- sulfate, discharge, and stream-sulfate levels are all associated with the same sequence of weather patterns.
The large-scale climatology of North America suggests that the Colorado-low cyclogenetic region and its associated storm track and pressure patterns are common (e.g. Whittaker & Horn 1984). Although there is interannual and interdecadal variation in the position of the long waves controlling these patterns (Yarnal & Leathers 1988), it is likely that the north- eastern United States and southwestern Canada will continue to suffer stream acidification.
This research is important because it suggests the atmospheric mechanisms likely to cause elevated stream-sulfate concentrations. However, as pointed
out by Venkatram et al. (1989), statistical association does not prove the veracity of these hypothesized processes. Such tantalizing findings call for directed case studies and model.ing of the links between the atmosphere and water quality.
Acknowledgements. We thank Andrew Comr~e , Maxx Dil- ley, Bruce Hewitson, and Ken Yelsey for their contributions to this research, and Jim Lynch, School of Forest Resources at Penn State, for the stream-flow and stream-sulfate data. We also acknowledge the contribut~ons made by 2 anony- mous reviewers to improve the manuscript. This work was funded by 2 sources: (1) NASA's Earth Observing System program. 'The Global Water Cycle: Extension Across the Earth Sciences', Eric Barron, Principle Investigator; and (2) the Intercollege Research Program, College of Agricul- ture, Penn State, 'The Climatology of Ozone as it Relates to Forest Health in Pennsylvania', John Skelly, Mike Simini, and Brent Yarnal, CO-Principal Investigators. The composit- ing sequence was produced in the Deasy GeoGraphics Labo- ratory, Department of Geography, Penn State. The figures also appear In Yarnal (1993) and are published with permis- slon of Belhaven Press.
LITERATURE ( ' I I'ED
Ahrahams, P. W., Tranter, M., Davies, T D., Blackwood, I. L. (1989). Geochemical studies in a remote Scottish upland catchment 11. Streamwater chemistry during snow-melt. Water Air Soil Pollut. 43: 231-248
Baird. S. F.. Buso. D. C., Hornbeck, J. W. (1987). Acid pulses from snowmelt at acidic Cone Pond, New Hampshire. Water Xir Soil Pollut. 34: 325-338
Barry, R. G.. Perry. A. H. (1973). Synoptic climatology. Methuen. London
Chapman, E. G., Luecken, D. J., Dana, M. T., Easter, R. C.. IIales. J. M., Laulainen, N. S., Thorp, J. M. (1987). Inter- storm comparisons from the OSCAR high density network experiment. Atmosph. Environ. 21: 533 -549
Comrie, A. C. (1992a). An enhanced synoptic climatology of ozone uslng a sequencing technique. Phys. Geogr. 13: 53-65
Comne, A. C. (1992b). A synoptic climatology of surface ozone in relatlon to the forests of Pennsylvania. Ph.D. dls- sertation, Pennsylvania State University, University Park
Harvey, H. H. , Whelpdale, D. M. (1986). On the prediction of acid precipitat~on events and their effects on fishes. Water Air Soil Pollut. 30: 579-586
Haagenson, P. L., Lazrus, A. L., Kuo, Y.-H., Caldwell G . A (1985). A relationship between acid precipitation and three-d~menslonal transport associated with synoptic- scale cyclones. J. Climate appl. Meteorol. 24: 967-976
Kalkstein, L. S., Corngan, P. (1986). A synoptic climatological approach for geographical analysis: assessment of sulfur dioxide concentrations. Ann. Ass. Am. Geogr. 76: 381-395
Key, J., Crane, R. G. (1986). A comparison of synoptic classification schemes based on 'objective' procedures. J. Climatol. 6: 375-388
Kerekes, J., Freedman, B. (1989). Seasonal variations of water chemistry in oligotrophic streams and rivers in Kejimkujik National Park. Nova Scotia. Wat. Air Soil Pollut. 46: 131-144
Lamb, H. H. (1972). British Isles weather types and a register
202 Clim. Res. 2: 193-202, 1993
of the daily sequence of circulation patterns, 1861-197 1. Geophysical Memoirs 116, London
Lazrus. A. L., Haagenson, P. L., Huebert, B. J., Kok, G. L., Kreitzberg, C. W., Likens, G. E., Mohnen. V. A., Wilson, W. E.. Winchester, J. W. (1983). Acidity in air and water in a case of warm frontal precipitation. Atmosph. Environ. 17: 581-591
Lins, H. F. (1986). Recent patterns of sulfate variability in pristine streams. Atmosph. Environ. 20: 367-375
Lund, I A. (1963). Map-pattern classification by statistical methods. J . appl. Meteorol. 2: 56-65
Lynch, J A., Corbett, E. S. (1989). Hydrologic control of sulfate mobility in a forested watershed. Water Resour. Res 25: 1695-1703
Maddox, R. A., Canova, F., Hoxit, L. R. (1980). Meteorolog~cal characteristics of flash flood events over the western United States. Mont. Weather Rev. 108: 1866-1867
Maddox, R. A., Chappell, C F., Hoxit, L. R. (1979). Synoptic and meso-scale aspects of flash flood events. Bull. Am. Meteorol. Soc. 60: 115-123
Moldan, B., Kopacek, J., Kopacek J. (1988). Chemical com- position oi atmospheric precipiltlliun in Czcciloslovakia, 1978-1984 - 11. Event samples. Atmosph. Environ. 22: 1901-1908
Morris, E. M., Thomas, A. G. (1987). Transient acid surges in a n upland stream. Water Air Soil Pollut. 34: 429-438
National Research Council (1983). Acid deposition: atmo- spheric processes in Eastern North America. National Academy Press, Washington, DC
Raynor, G. S., Hayes, J . V. (1981). Acidity and conductivity of precipitation on central Long Island, New York in relation to meteorological variables. Water Air So11 Pollut. 15: 229-245
Raynor. G. S., Hayes. J. V. (1982). Variation in chemical wet deposition w ~ t h meteorological conditions Atmosph Environ. 16: 1647-1656
Reuss, J . 0. (1983). Implications of the calcium-aluminum exchange system for the effects of acid precipitation on soils. J. Environ. Qual. 12: 591-595
Reuss, J. O., Cosby, B. J. , Wright, R. F. (1987). Chemical processes governing soil and water acidification. Nature 329: 27-32
Reuss, J. O., Johnson, D. W. (1985). Effects of soil processes on the acidification of water by acid deposition. J. Environ. Qual. 14: 26-31
Schwartz, S. E. (1989). Acid deposition: unraveling a regional phenomenon. Science 243: 753-763
Seip, H. M,, Andersen, D. O., Christophersen, N., Sulllvan, T J., Vogt. R. D. (1989). Variations in concentrations of aqueous aluminum and other chemicals species during hydrological episodes at Birkenes, southernmost Norway. J . Hydrol. 108: 387-405
Venkatram, A., McNaughton D., Karamchandani, P. K. (1989). Relationships between atmospheric emissions, acidic deposition, and air concentrations. State-of-Science/ Tc.chnology Report 8. National Acid Precipitation Assess- ment Program, Washington, DC
Whittaker, L. M,, Horn, L. H. (1984). Northern Hemisphere extratropical cyclone activity for four mid-season months. J . Climatol 4: 297-310
Willmott, C. J. (1981). On the validation of models. Phys. Geogr. 2: 184-194
Willmott, C. J. (1982). Some comments on the evaluation of model performance. Bull. Am. Meteorol. Soc. 63: 1309-1313
Willmott, C. J. (1984). On the evaluation of model perfor- mance in physical geography. !a: Gafic, G. L., Wlllmott, C. J . (eds.) Spatial statistics and models. D Reidel Publish- ing Company, Dordrecht, p. 443-460
Willmott, C. J.. Ackleson. S . G., Davis, R. E.. Feddema, J. J., Klink, K. M, , Legates, D. R., O'Donnell, J., Rowe, C. M. (1985). Statistics for the evaluation and comparison of models. J . Geophys. Res. 90: 8995-9005
Winkler, J. A. (1988). Climatological characteristics of summertime extreme rainstorms in Minnesota. Ann. Ass. Am. Geogr. 78: 57-73
Yarnal, B. (1991). The climatology of acid rain. In: Majumdar, S. K., Miller, E. W., Cahir, J. (cds.) Air pollution: envlron- mental issues and health effrrts. Pennsylvania Academy of Science, Hamisburg, p. 1 .)j-lti9
Yarnal, B. (1993). Synoptic climatology in environmental analysis: a primcr. Belhaven Press, London
Yarnal, B., Leathers, D. J. (1988). Relationships between interdecadal and interannual climatic variations and their effect on Pennsylvania climate Ann. Ass. Am. Geogr. 78: 624-641
Zishka, K. M., Smith, P. J. (1980). The climatology of cyclones and anticyclones over North America and surrounding ocean environs for January and July, 1950-1977 Mon. Weather Rev. 108: 387-401
Editor: V Meenterneyer Man~lscript first received: June 20, 1992 Revised version accepted: February 8, 1993