Embed Size (px)
Citation preview

A SYNERGY MODEL OF MATERIAL AND ENERGY FLOW ANALYSIS FOR THE
CALCINATION PROCESS OF GREEN PETROLEUM COKE IN ROTARY KILN
Peng LIa, b
, Baokuan LIa, b *
, Zhongqiu LIUa, Yang YU
a
aSchool of Metallurgy, Northeastern University, Shenyang 110819, China
bKey Laboratory of Data Analytics and Optimization for Smart Industry (Northeastern University),
Ministry of Education, Shenyang 110819, China
* Corresponding author: E-mail: [email protected]
The main objective of this paper is to establish a mathematical framework to
analyze the complex material and energy performance of the calcinations
process based on the fundamental mass and energy conservations. The
synergy degree of vital order parameters was defined and evaluated to
assess the status and order of the calcination process. Furthermore, the
synergy model for resource utilization and energy saving has also been
developed. The results show that the energy efficiencies of the drying kiln,
rotary kiln, incinerator and the cooler are 63.574%, 37.709%, 76.782% and
74.758%, respectively. Meanwhile, the synergy degree of the whole
calcination system is determined as 0.507. Based on the result, several
suggestions were proposed to improve the resource utilization, energy-
saving and synergy performance. Assessing the performance of suggested
improvements, the synergy degree was re-evaluated and recorded a
substantial enhancement up to 0.809. The present work provides valuable
insights and comprehensive analysis tool for assessing the performance and
potential optimization of the calcination process.
Key words: petroleum coke; rotary kiln; calcination process; synergy
degree; resource utilization; energy saving
1. Introduction
In the aluminum electrolytic industry, calcined petroleum coke (CPC) and coal tar pitch are the
raw material to make prebaked carbon anode for the aluminum cell application to produce aluminum
[1]. Meanwhile, as the final solid residue of crude oil distillation refineries [2], green petroleum coke
(GPC) could be used as the unique material to manufacture calcined petroleum coke (CPC) through
calcination process. Furthermore, aiming to improve the density, mechanical strength, conductivity
and chemical stability of raw material, GPC needs to be heated up to remove moisture, volatiles and
ash [3]. Although the traditional vertical shaft kilns are still commonly employed in China [4], the
rotary kiln has become widely adopted for the calcination process, due to its high level of automation
level and superior productivity and operating environment. Nevertheless, with the ever rising energy
cost, large-scale materials and energy consumption have hindered the development of the calcination
industry [5]. To improve the efficiency of this significant procedure, it is crucial to evaluate and
optimize the synergy of the material and energy flow during the production process.

Recently, several research works have been carried out studying the calcination process. Firstly,
some researchers focused on the final CPC quality. Bayram et al. [6] combined the discrete element
method (DEM) with the advanced three-dimensional imaging technique to investigate the influence of
packing behaviour of calcined cokes. Their study concluded that the low average sphericity has a
direct impact on increasing the friction in the system. Heintz [7] performed an experimental
investigation on the effect of calcination rate on the overall petroleum coke properties. It is found that
a slower calcination rate is essential to produce regular or even premium quality calcined petroleum
coke. Secondly, a number of studies focused on the characterization of the flow field, mass and heat
transfer during the calcination process. Mastorakos et al. [8] adopted the Monte Carlo method coupled
with the finite-volume method to model the radiative heat transfer and energy conservation in the
rotary flow. On the other hand, Xiao et al. [9] establish a numerical framework based on the
computational fluid dynamics (CFD) technique to characterize the distribution of residual moisture
and volatiles in the petroleum coke, and the flow features of the gas and solid phases of calcination
process. In addition, Elkanzi [10] also established a model to evaluate the material and energy balance
of the rotary kiln for GPC calcination and verified the result against actual industry operation data.
From the perspective of thermodynamics, the calcination process of GPC in the rotary kiln is
considered as an open, non-equilibrium, irreversible, nonlinear and complex system. Therefore, the
detailed theory of material and energy flow analysis and synergy is crucial to improve the resource
utilization and energy saving in manufacturing process [11, 12]. Usually, researchers applied three
sub-models to analysis the energy utilization of the system, including material and energy flows model
[13, 14], synergy model [15] and exergy analysis model [16]. Filkoski et al. [17] analyzed five
different options of waste heat utilization on exhaust gases from a shaft kiln. Similarly Dolianitis et al.
[18] applied a 3-D computational model to study the energy efficiency of glass furnace. In the past,
research works on material, and energy flow or synergy model has been focused mainly on the
metallurgical process [19, 20], construction industry [21] and cement industry [22]. Limited studies
have been directed towards the calcination process. Therefore, it is urgently needed to understand the
material and energy flow in calcination process to optimize the production yet minimize the energy
consumption.
This paper presents a comprehensive methodology to analyze the material and energy flow in
the calcination process based on our previous research works. Despite the work by Yu et al. [23]
focusing on the smelting process of the steel belt sintering-submerged arc furnace, the subject matter
of the present work has a distinct feature of process flow, method of resource utilization and energy
saving, physical reaction, chemical reaction, etc. Consider the complex process, an advanced
mathematical model for the mass and energy flow in the calcination process has been developed.
Additional model modifications were also implemented considering the mass and energy flow stored
in the control unit and generated within the control unit. New order parameters, together with the new
formulation and evaluation principle, were also proposed to reflect the distinguishing features of the
calcination process. Furthermore, analysis of resource utilization and energy saving in the process has
been performed based on the synergetic theory. A synergy degree has been proposed to evaluate the
coordination degree. Possibly improvements of the calcination process are also discussed.

2. Methodology
Like other metallurgical processes, material flow is mainstream of the system while the energy
flow is the driving forces of the calcination process. Therefore, it is necessary to set up the mass and
energy models to analyze the performance of material and energy flow of the calcination process in
the rotary kiln. Nevertheless, traditional energy analysis methods cannot comprehensively reveal the
interaction between material and energy flow or clearly describe the details of energy transformation
within the system [24]. For better understanding the calcination process, the concept of synergy
between material and energy flow is firstly introduced. The procedure structure considered in this
article is expressed as follows. Firstly, the material balance of the four equipment is evaluated based
on the desired of cooled calcined petroleum coke production capacity. Secondly, the energy balance
can then be calculated by means of adjusting the independent variables of each equipment.
Furthermore, a subsystem (IGm) are extracted and in which various order parameters are defined, so as
to study the synergy of IG1 and IG2. At last, the synergy degree of the calcination process can be
calculated, which is an important parameter for evaluating the order and cooperation degree of the
system.
2.1. Description of the calcination process
The calcination process of green petroleum coke in the rotary kiln has been studied in the past
years. A schematic of the process is shown in Fig. 1. The process consists of four major equipment,
including the drying kiln, the rotary kiln, the incinerator, and the cooler. After removing the moisture
by the drying kiln, dried green petroleum coke is then undergone the calcination process in the rotary
kiln. Afterwards, it is then cooled to a temperature below 80oC by the cooler. Meanwhile, the flue gas
from rotary kiln, consisting of un-burnt particulates and volatile matter, is further processed in the
incinerator for complete combustion. The high heat content in the flue gas is recovered in the waste
heat recovery boiler for energy saving.
Fig. 1. A schematic of the calcination process
2.2. Synergy model of the process
Considering the complexity of the system, one should notice that each of the subsystems is
closely coupled instead of mechanical superposition in some other simple systems. Although each
subsystem has its own functions and characteristics, the subsystems conflict with each other
sometimes, in order to promote the whole calcination process. Thus, the synergetic theory is applied to

analyses the calcination process for fine-tuning the system state from disorder to order. It is
noteworthy that the material flow (Sub1) level and energy flow (Sub2) level are introduced to study the
system. The fluctuations of material and the critical energy point affecting the system state are defined
as the order parameters.
The order parameters exhibit two opposite characteristics in relation to the material and energy
flow of the calcination system [25]. Consequently, the efficacy coefficient is defined to quantify the
influence of order parameters based on the order to the subsystem, which is given by:
, ,
,
, ,
,
, ,
,
, ,
( )
ll
m n m n
m nul ll
m n m n
m m n ul
m n m n
m nul ll
m n m n
For with positive effect
For with negati
V VV
V VEC V
Vve
VV effe
Vct
V
(1)
where ECm(Vm,n), Vm,n, m and n denote the efficacy coefficient, the order parameters, the indices of the
subsystem, and the indices of the order parameters in the corresponding subsystems, respectively.
Furthermore, Vulm,n and Vllm,n are the upper and lower limit of the order parameters when the system is
operating at steady state.
Meanwhile, the stability of the system depends not only on the individual values of the order
parameters, but also on the combined effects of all parameters. Hence, the order degree (i.e.
ODm(IGm)) is defined to describe the subsystem state, which is expressed as follow:
, ,
1
OD (IG )N
m m m n m m n
n
EC V
(2)
where ODm(IGm) and ωm,n means the order degree of the subsystem and the standard weight of
efficacy coefficient, respectively. When ODm(IGm)=1, it represents that the subsystem is at the
perfectly orderstate. In contrast, if ODm(IGm)=0, the subsystem is operating at the most disorderly
state. In addition the entropy method [26] is used to calculate the standard weight, which is defined as:
,
,
,
1
1 en
m n
m n Nen
m n
n
S
N S
(3)
where Sen
m,n is the entropy value of the order parameter, which can be evaluated from the following
formulation:
, , ,
1
1ln
ln
Ken k k
m n m n m n
k
SK
(4)
where K denotes the sample number of order parameter and θkm,n is the standardization value which is
given by:
, ,
,
, ,
,
, ,
,
, ,
min
max min
ma
x
max mi
n
k k
m n m nK
m nk k
m n m nKKk
m n k k
m n m nK
m nk k
m n m nKK
For with positive effect
For with ne
V VV
V V
V VV
Vgative effec
Vt
(5)
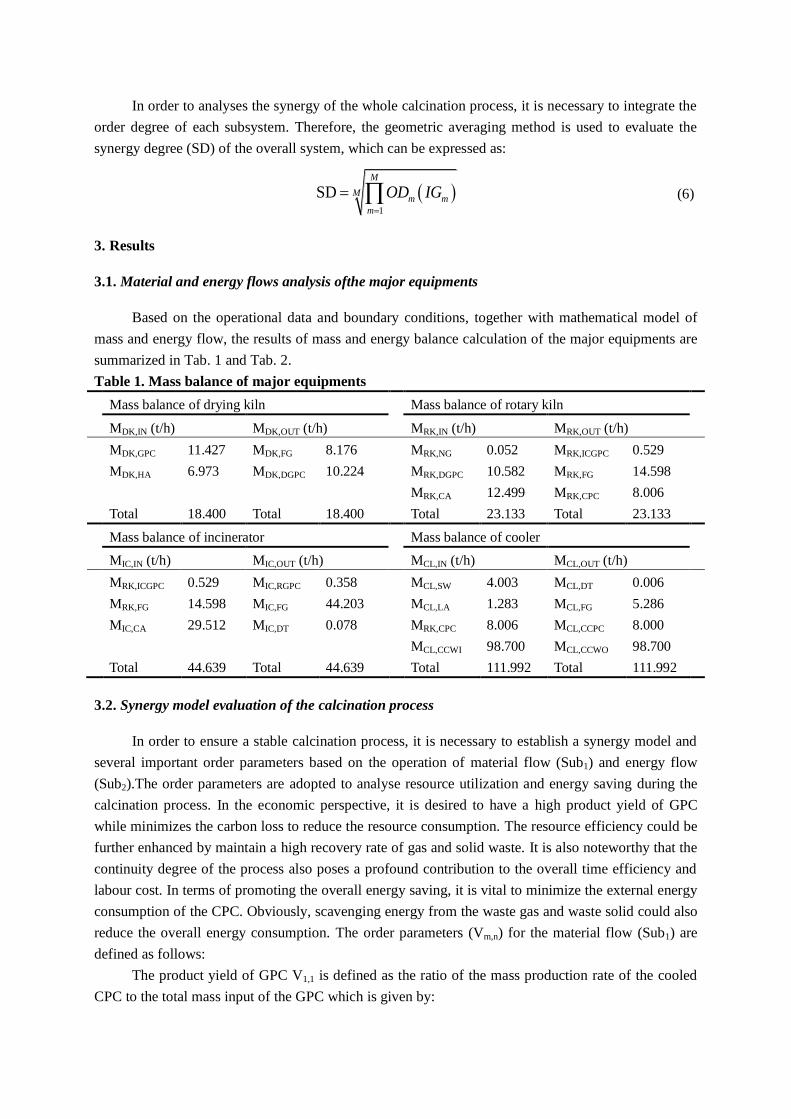
In order to analyses the synergy of the whole calcination process, it is necessary to integrate the
order degree of each subsystem. Therefore, the geometric averaging method is used to evaluate the
synergy degree (SD) of the overall system, which can be expressed as:
1
SDM
Mm m
m
OD IG
(6)
3. Results
3.1. Material and energy flows analysis ofthe major equipments
Based on the operational data and boundary conditions, together with mathematical model of
mass and energy flow, the results of mass and energy balance calculation of the major equipments are
summarized in Tab. 1 and Tab. 2.
Table 1. Mass balance of major equipments
Mass balance of drying kiln Mass balance of rotary kiln
MDK,IN (t/h) MDK,OUT (t/h) MRK,IN (t/h) MRK,OUT (t/h)
MDK,GPC 11.427 MDK,FG 8.176 MRK,NG 0.052 MRK,ICGPC 0.529
MDK,HA 6.973 MDK,DGPC 10.224 MRK,DGPC 10.582 MRK,FG 14.598
MRK,CA 12.499 MRK,CPC 8.006
Total 18.400 Total 18.400 Total 23.133 Total 23.133
Mass balance of incinerator Mass balance of cooler
MIC,IN (t/h) MIC,OUT (t/h) MCL,IN (t/h) MCL,OUT (t/h)
MRK,ICGPC 0.529 MIC,RGPC 0.358 MCL,SW 4.003 MCL,DT 0.006
MRK,FG 14.598 MIC,FG 44.203 MCL,LA 1.283 MCL,FG 5.286
MIC,CA 29.512 MIC,DT 0.078 MRK,CPC 8.006 MCL,CCPC 8.000
MCL,CCWI 98.700 MCL,CCWO 98.700
Total 44.639 Total 44.639 Total 111.992 Total 111.992
3.2. Synergy model evaluation of the calcination process
In order to ensure a stable calcination process, it is necessary to establish a synergy model and
several important order parameters based on the operation of material flow (Sub1) and energy flow
(Sub2).The order parameters are adopted to analyse resource utilization and energy saving during the
calcination process. In the economic perspective, it is desired to have a high product yield of GPC
while minimizes the carbon loss to reduce the resource consumption. The resource efficiency could be
further enhanced by maintain a high recovery rate of gas and solid waste. It is also noteworthy that the
continuity degree of the process also poses a profound contribution to the overall time efficiency and
labour cost. In terms of promoting the overall energy saving, it is vital to minimize the external energy
consumption of the CPC. Obviously, scavenging energy from the waste gas and waste solid could also
reduce the overall energy consumption. The order parameters (Vm,n) for the material flow (Sub1) are
defined as follows:
The product yield of GPC V1,1 is defined as the ratio of the mass production rate of the cooled
CPC to the total mass input of the GPC which is given by:
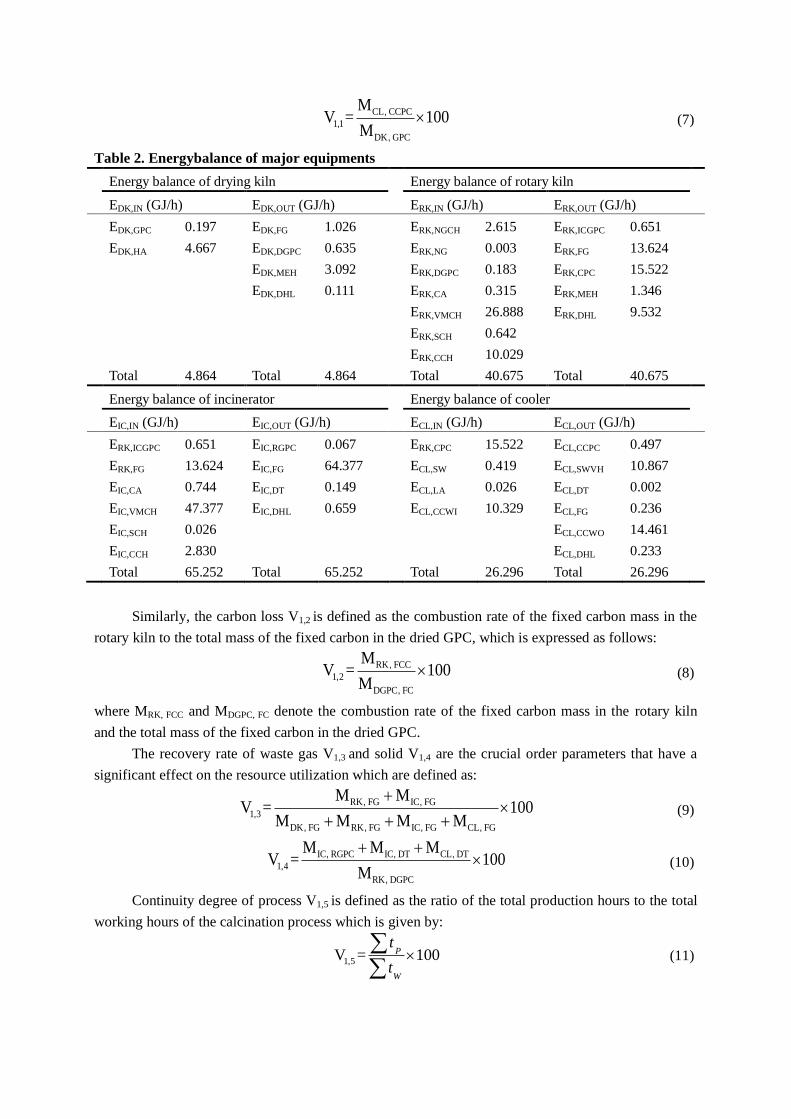
CL CCPC
1 1
DK GPC
MV = 100
M,
,
,
(7)
Table 2. Energybalance of major equipments
Energy balance of drying kiln Energy balance of rotary kiln
EDK,IN (GJ/h) EDK,OUT (GJ/h) ERK,IN (GJ/h) ERK,OUT (GJ/h)
EDK,GPC 0.197 EDK,FG 1.026 ERK,NGCH 2.615 ERK,ICGPC 0.651
EDK,HA 4.667 EDK,DGPC 0.635 ERK,NG 0.003 ERK,FG 13.624
EDK,MEH 3.092 ERK,DGPC 0.183 ERK,CPC 15.522
EDK,DHL 0.111 ERK,CA 0.315 ERK,MEH 1.346
ERK,VMCH 26.888 ERK,DHL 9.532
ERK,SCH 0.642
ERK,CCH 10.029
Total 4.864 Total 4.864 Total 40.675 Total 40.675
Energy balance of incinerator Energy balance of cooler
EIC,IN (GJ/h) EIC,OUT (GJ/h) ECL,IN (GJ/h) ECL,OUT (GJ/h)
ERK,ICGPC 0.651 EIC,RGPC 0.067 ERK,CPC 15.522 ECL,CCPC 0.497
ERK,FG 13.624 EIC,FG 64.377 ECL,SW 0.419 ECL,SWVH 10.867
EIC,CA 0.744 EIC,DT 0.149 ECL,LA 0.026 ECL,DT 0.002
EIC,VMCH 47.377 EIC,DHL 0.659 ECL,CCWI 10.329 ECL,FG 0.236
EIC,SCH 0.026 ECL,CCWO 14.461
EIC,CCH 2.830 ECL,DHL 0.233
Total 65.252 Total 65.252 Total 26.296 Total 26.296
Similarly, the carbon loss V1,2 is defined as the combustion rate of the fixed carbon mass in the
rotary kiln to the total mass of the fixed carbon in the dried GPC, which is expressed as follows:
RK FCC
1 2
DGPC FC
MV = 100
M,
,
,
(8)
where MRK, FCC and MDGPC, FC denote the combustion rate of the fixed carbon mass in the rotary kiln
and the total mass of the fixed carbon in the dried GPC.
The recovery rate of waste gas V1,3 and solid V1,4 are the crucial order parameters that have a
significant effect on the resource utilization which are defined as:
RK FG IC FG
1 3
DK FG RK FG IC FG CL FG
M MV = 100
M M M M
, ,
,
, , , ,
(9)
IC RGPC IC DT CL DT
1 4
RK DGPC
M M MV = 100
M
, , ,
,
,
(10)
Continuity degree of process V1,5 is defined as the ratio of the total production hours to the total
working hours of the calcination process which is given by:
1 5V = 100P
W
t
t
, (11)

where ΣtP and ΣtW denote as the total production hours and the total working hours of the process,
respectively. Thetotal working hours, ΣtW, is expressed as follows:
=W P L M B
t t t t t (12)
where ΣtL, ΣtM and ΣtB are the total latency hours, maintenance hours and breakdown hours of the
process.
On the other hand, the order parameters (Vm,n) for the energy flow (Sub2) are introduced below.
The external energy consumption of cooled CPC V2,1 is defined as the required external thermal
energy consumption per unit ton of cooled CPC needed, which is given by:
RK NGCH DK HA
2 1
CL CCPC
E EV =
M
, ,
,
,
(13)
The recovery rate of waste energy can be divided into two aspects. The recovery rate of waste
gas energy V2,2 and solid energy V2,3, which are the vital order parameters that have significant effect
on energy saving, the equation are defined as follows:
RK FG IC FG
2 2
DK FG RK FG IC FG CL FG
E E 80%V = 100
E E E E
, ,
,
, , , ,
(14)
IC RGPC RGPC DHL DK DGPC DGPC DHL
2 3
IC RGPC DK DGPC
E E E EV = 100
E E
, , , ,
,
, ,
(15)
Owning to its great thermal content, the flue gas from the incinerator is returned to the waste
heat recovery boiler for energy recovery.Following the previous study, the overall heat transfer
efficiency of the waste heat recovery boiler is assumed as 80% [27].
The values of the above order parameters were evaluated using Eq. (7-15). Most of the order
parameters have a positive effect on promoting the orderly development of the calcination system,
except for V1,2 and V2,1. In addition, based on the same cooled CPC production capacity, the
corresponding parameter values at the upper and lower limit operating conditions are denoted as Vulm,n
andV llm,n . The synergy degree and all intermediate data were also evaluated considering all the
operating conditions remain unchanged are shown in Tab. 3.
4. Discussion
4.1. Resource utilization
Fig. 2 (a) shows the Sankey diagram of the material flow in the drying kiln. As depicted, the
percentage of GPC mass going into the drying kiln is of 62.105%, which is then decreased by 6.537%
due to moisture evaporation, leaving the kiln as the flue gas eventually. Similarly, Fig. 2 (b) shows the
Sankey diagram of material flow in the rotary kiln. As depicted, the dried GPCaccounts for 45.744%
of the material flow that later output as CPC. A decrease of the mass of 11.136% is recorded after the
calcination in the rotary kiln. This is attributed to the un-burnt dried GPC to incinerator, consumption
due to combustion of carbon, sulfur, and volatile as well as moisture evaporation. Meanwhile, the
mass percentage of flue gas is of 63.105% of the mass output. The large portion of flue gas is
generated by the various combustion reactions of materials and original air supply to the rotary kiln.
The Sankey diagram of material flow in the incinerator is shown in Fig. 4 (c). One can observe
that the mass portion of un-burnt dried GPC together with the flue gas from the rotary kiln to the

incinerator account for 33.889% of the total mass. After the secondary combustion, the mass
percentage of flue gas raises significantly up to 99.023%, indicating almost all materials have been
completely consumed by combustion. Finally, Fig. 2 (d) shows the Sankey diagram of material flow in
the cooler. In the cooler, the mass portion of the CPC only accounts for 7.149%, while the majority of
mass is accounted for the circulating cooling water (i.e. 88.131%). With a close circulating system,
there is no mass loss for the cooling water passing through the cooler. It is also noteworthy that a small
portion of the mass is accounted for the spray water in the cooler (i.e. only 3.574%). The sprayed
water converted into flue gas; which in turn accounts for 39.768% of the mass flow outputs excluding
the mass of the circulating cooling water.
Table 3. The calculated synergy degree of calcination process
V1.1 V1.2 V1.3 V1.4 V1.5 V2.1 V2.2 V2.3
Vm,n 70.007 5 81.372 4.178 82 0.910 82.409 26.046
Vulm,n 71.329 8 100 4.231 85 1.318 100 100
Vllm,n 66.795 4 20.202 4.126 78 0.442 17.239 26.046
ECm(Vm,n) 0.709 0.750 0.767 0.499 0.57 0.465 0.787 0.000
Senm,n 0.222 0.196 0.185 0.316 0.291 0.324 0.171 0.000
ωm,n 0.205 0.212 0.215 0.181 0.187 0.270 0.331 0.399
ODm(IGm) 0.666 0.386
SD 0.507
(a) Sankey diagram of the (b) Sankey diagram of the
material flow in the drying kiln material flow in the rotary kiln
(c) Sankey diagram of the (d) Sankey diagram of the
material flow in the incinerator material flow in the cooler
Fig. 2. Sankey diagram of material flow in the four different equipment

In terms of resource utilization, two majors aspects are considered in the present study. The first
one focuses on the waste recovery strategy. The other one focuses on the reduction of resource
consumption. Firstly, the waste recovery consists of solid and gas waste energy recovery with several
different recovery principles. Referring to Fig. 2 (c), it can be observed that the mass portion of
returned GPC and dust contribute 0.802% and 0.175% of the total mass, respectively. The returned
GPC can be sent back to the rotary kiln, and dust can be collected by the dust collector. Similarly, in
the cooler (see Fig. 2 (d)), a small portion of dust (i.e. 0.005%) can also be collected by the dust
collector.Thus, the solid waste produced in the calcination process has been fully utilized. Although
flue gas is generated in each equipment (see Fig.4 (a-d)), only flue gas from the rotary kiln and the
incinerator is utilized. As the recovery rate of waste gas is of 81.372%, it is worth to develop some
strategies for fully utilizing the waste gas. Subsequently, aiming to reduce the resource consumption, it
is necessary to develop an effective measure to reduce the carbon loss (i.e. 5%) during the calcination
process using rotary kiln in the current system operation.
4.2. Energy saving
(a) Sankey diagram of the (b) Sankey diagram of the
energy flow in the drying kiln energy flow in the rotary kiln
(c) Sankey diagram of the (d) Sankey diagram of the
energy flow in the incinerator energy flow in the cooler
Fig. 3. Sankey diagram of energy flow in the four different equipment
Fig. 3 (a) shows the Sankey diagram of the energy flow in the drying kiln. As depicted, physical
sensible heatof the hot air is the main heat source of the drying kiln, corresponding to 95.938% of the

energy input. Meanwhile, as the main function of the drying kiln, majority of energy output is
contributed by moisture evaporation heat (i.e. 63.574%). Nonetheless, the energy loss due to the
unavoidable flue gas physical sensible heat accounts up to 21.095%. Although the energy loss caused
by the flue gas is considerably high, due to its relatively low temperature (i.e. 99.5℃) and unstable
generation, it is considered uneconomical to recovery the heat from the flue gas. On the other hand,
the physical sensible heat of the dried GPC accounts for 13.057% of the energy input. This energy
portioncould be fully utilized instead of dissipating to surroundings during the transportation process.
Fig. 3 (b) shows the Sankey diagram of the energy flow in the rotary kiln. As the main heat source
supporting the normal operation of the rotary kiln, the combined heat combustion of the volatile and
the carbon account for 90.760% of the energy input. Furthermore, natural gas combustion heat also
contributes 6.430% of the energy input. Based on the Sankey diagram, one can notice that the
contribution of the natural gas combustion could be reduced replacing by the available heat in the
dried green petroleum coke.
In terms of energy output, physical sensible heat of calcined petroleum coke and flue gas
account for 38.159% and 33.493%, respectively. In addition, the heat dissipation of the rotary kiln
accounts for 23.437% of the energy output. Due to structural restriction of rotary kiln design, it is
impractical to reduce the energy loss by increasing the surface insulation. Therefore, although the
surface temperature of the rotary kiln could reach around 250oC during the calcinations process, there
is limited choice could be applied to reduce the heat loss through the surface.
The Sankey diagram of energy flow in the incinerator is shown in Fig.3 (c). From the figure, it
can be observed that majority of the energy input is contributed by the heat of combustion of volatile,
sulfur and carbon in un-drop down GPC to incinerator; combining a total of 76.984% of the energy
input. Together with the heat of flue gas coming from rotary kiln, it makes up to 98.860% of the heat
source. The heating process occurring in the incinerator fully utilizes the thermal potential of rotary
kiln flue gas, and the heat of incinerator flue gas, accounting for 98.658% of the heat output. Part of
the heat output will be utilized for the downstream heat recovery system. Fig. 3 (d) shows the Sankey
diagram of the energy flow in the cooler. Majority of the energy input is attributed to the calcined
petroleum coke physical sensible heat (i.e. 59.028%) coming from the rotary kiln. To maintain the
calcined petroleum coke temperature to be below 80oC for transportation, the cooling technology
combing internal water spraying and external water circulating is adopted in the cooler. Subsequently,
spray water vaporization heat is the majority heat output of the cooler (i.e. 41.326%). In addition, the
net heat removal of external circulating water accounts for 15.712%.
For energy saving, two main strategies are commonly considered: energy recovery and energy
consumption reduction. Firstly, energy recovery can be achieved with solid waste and gas waste heat
recovery. With distinguished characteristics of solid and gas waster, significantly different recovery
methods were adopted. For the solid waste heat, the energy loss of material between each equipment
with little temperature drop during the transportation is negligible. However, due to the huge
temperature difference between the dried GPC from drying kiln (80℃) to rotary kiln (25℃) shown in
Tab. 2, the dried GPC physical sensible heat accounting for 13.057% of the energy output in Fig. 3 (a)
is necessary to find recycling ways. Similarly, the dissipation heat loss of returned GPC from the
incinerator to the rotary kiln is worthwhile for recycling. For the gas waste heat, excluding the utilized
flue gas heat in the rotary kiln and incinerator, the flue gas heat in the drying kiln and the cooler is
coarsely wasted. As it is uneconomical to recovery the flue gas heat in drying kiln due to its low

temperature and unsteady generation, developing a strategy to recycle the flue gas heat in the cooler is
imperative.
One the other hand, from the aspect of energy consumption reduction, as the highest energy
consumption equipment in the process, it is crucial to optimize the energy utilization in the drying
kiln. As shown in Fig. 3 (b), natural gas combustion heat accounts for 6.430% of the energy input
which could be optimized by improving the process operation system or alternating the equipment
design. Furthermore, the cooling method could also be optimized to improve the heat exchange
efficiency of the external circulating water.
4.3. Possible improvements
The synergy of the material flow (Sub1) and energy flow (Sub2) has a significant impact on the
performance of the calcination process. The random fluctuation of each order parameter overwhelms
the normal manufacturing operation, disturbing the material and energy flow. Therefore, the order
degree of each subsystem indicates the synergy degree of the whole calcination process. According to
the current calcination process, the synergy degree (SD) is 0.507 as summarized in Tab. 3. Similarly,
the order degree of Sub1 and Sub2 are of 0.666 and 0.386, respectively. The order degrees reflect that
essential improvement should be taken to adjust the order parameters. From the standard weight of
efficacy coefficient in Sub1, the recovery rate of waste gas (V1,3) is found significantly higher than the
other four. This is attributed to the inefficacy use of flue gas in the drying kiln and the cooler.
Furthermore, it is also desired to develop some feasible plans to reduce the carbon loss (V1,2)
due to its higher standard weight. In Sub2, the recovery rate of the waste gas energy (V2,2) and the
recovery rate of solid waste energy (V2,2) are the dominant factors affecting the order degree of the
subsystems. Hence, it is essential to develop an effective measure to recovery flue gas heat from the
drying kiln and cooler, and minimizes the heat dissipation of the dried GPC and the returned GPC
during the transportation process.
In order to improve the resource utilization, energy-saving and synergy performance of the
calcination process, several suggestions are proposed in the present study. Firstly, as shown in Fig.1, a
burner set at the head of rotary kiln is used to maintain a higher calcination temperature and ensure the
product quality by adding fuel for supplementary combustion. This operation concept has been
successfully applied in many anode plants in China. Nonetheless, some problems have also been
exposed, includinghigh carbon loss and incomplete combustion of volatile caused by the calcination
location close to the head of rotary kiln. Therefore, it is suggested to install electrical fans at the rotary
kiln shell to enhance the combustion completeness inside the rotary kiln [28]. As a result, the
combustion heat of volatile in the dried GPC could be fully utilized instead of consuming external
fuel. Meanwhile, it can also reduce the temperature at the rotary kiln head,minimizing the carbon loss
during the calcination process.
Secondly, the temperature of dried GPC from drying is 80oC, and the temperature of GPC
returned from incinerator is 200oC. Therefore, it is better ro recovery the heat of the two materials.
Blending bins between drying kiln and rotary kiln should take heat preservation to reduce temperature
drop of dried GPC and returned GPC inside. On the other hand, the transportation path of the returned
GPC from the incinerator to the rotary kiln could be optimized for a more direct delivery to minimize
heat loss.

Thirdly, with the high heat value of the cooler flue gas, it is recommended to utilize the waste
heat by leading it to the incinerator for secondary heating and further utilize in the waste heat recovery
boiler system. Last but not least, as the cooling method of spraying water inside is more efficient
comparing to the circulating water outside, it is suggested to adopt the internal water spraying
completely for cooling in the cooler. The external cooling water circulation can only be employed as a
standby operation measure.
Based on the above discussion, considering all improvement measures are implemented, the
synergy degree of the whole calcination process is then recalculated. Fig. 4 and 5 show the resultant
mass and energy balance of the whole calcination process with suggested improving measures.
Obviously, the synergy degree is raised up to 0.809. This encouraging result is caused by the lower
carbon loss, more effective utilization of waste gas and solid, and less external energy consumption.
With the improvement, a more orderly calcination system between material and energy flow could be
obtained. The corresponding improved indices are summarized in Tab. 4.
Fig. 4. Sankey diagram of the material flow with the suggested improvements
Fig. 5. Sankey diagram of the energy flow with the suggested improvement

Table 4. The recalculation of synergy degree of improved calcination process
V1.1 V1.2 V1.3 V1.4 V1.5 V2.1 V2.2 V2.3
Vm,n 70.763 4 88.188 4.179 82 0.577 82.997 100
Vulm,n 71.329 8 100 4.231 85 1.651 100 100
Vllm,n 69.884 4 20.461 4.127 78 0.404 18.375 26.046
ECm(Vm,n) 0.609 1.000 0.851 0.500 0.571 0.861 0.792 1.000
Senm,n 0.275 0.000 0.125 0.315 0.291 0.117 0.168 0.000
ωm,n 0.182 0.250 0.219 0.171 0.178 0.325 0.307 0.368
ODm(IGm) 0.735 0.891
SD 0.809
5. Conclusions
1. The present paper provides a comprehensive analysis of the calcination process using a synergy
model based on the mass and energy conservations in conjunction with the synergy theory. All
four major equipment involved in the process is discussed in detail.
2. For the material flow analysis, the product yield of GPC is evaluated as 70.007%. For the energy
flow analysis, the overall energy efficiencies of the drying kiln, rotary kiln, incinerator, and the
cooler are 63.574%, 37.709%, 76.782% and 74.758%, respectively.
3. In order to evaluate the system status, order parameters tailored for the calcination system are
defined based on the synergy model. The value of synergy degree is evaluated as 0.507, indicating
a relatively low degree of cooperation between the material flow and energy flow.
4. Several possible improvements are proposed to improve the calcination process on resource
utilization and energy saving. Electrical fans are recommended to be installed at the rotary kiln
shell of the rotary kiln shell and adjust the process of the operating system. Moreover, it is
proposed to fully recover the waste heat of the dried GPC, the returned GPC and flue gas from the
cooler. Furthermore, a direct cooling method using internal water spray is recommended to be
fully implemented in the cooler. With the suggested improvements, the synergy degree is recorded
having a substantial enhancement up to 0.809, indicating a more orderly calcination process within
the system.
5. Based on our previous work, the present study extended the model considerations and advanced
the formulations for the synergy analysis. The synergy analysis also draws new findings and
conclusions on the calcination process. With the advanced mathematical model and considerations
of new order parameters, it provides new sights and a more comprehensive energy-saving route
for other researchers.
Acknowledgment
This work was supported by the National Natural Science Foundation of China (Grant No.
51934002).
References
[1] Azari, K., et al., Mixing Variables for Prebaked Anodes Used in Aluminum Production, Powder
Technology, 235 (2013), pp. 341-8

[2] Zhan, X., et al., Catalytic Effect of Black Liquor on the Gasification Reactivity of Petroleum Coke,
Applied Energy, 87 (2010), 5, pp. 1710-15
[3] Elkanzi, E. M., Kinetic Analysis of the Coke Calcination Processes in Rotary Kilns, Simulation
and Modeling Methodologies, Technologies and Applications, 256 (2014), pp. 45-54
[4] Martins, M.A., et al., Modeling and Simulation of Petroleum Coke Calcination in Rotary Kilns,
Fuel, 80 (2001), 11, pp. 1611-22
[5] Xiao, J., et al., A Real-Time Mathematical Model for the Two-Dimensional Temperature Field of
Petroleum Coke Calcination in Vertical Shaft Calciner, Jom, 68 (2016), 8, pp. 2149-59
[6] Majidi, B., et al., Simulation of Vibrated Bulk Density of Anode-grade Coke Particles Using
Discrete Element Method, Powder Technology, 261 (2014), pp. 154-60
[7] Heintz, E. A., Effect of Calcination Rate on Petroleum Coke Properties, Carbon, 33 (1995), 6, pp.
817-20
[8] Mastorakos, E., et al., CFD Predictions for Cement Kilns Including Flame Modelling, Heat
Transfer and Clinker Chemistry, Applied Mathematical Modelling, 23 (1999), 1, pp. 55-76
[9] Xiao, J., et al., Modeling and Simulation of Petroleum Coke Calcination in Pot Calciner Using
Two-Fluid Model, Jom, 68 (2015), 2, pp. 643-55
[10] Elkanzi, E. M., Simulation of the Coke Calcining Processes in Rotary Kilns, Chemical Product
and Process Modeling, 2 (2007), 3, pp. 1-14
[11] Tong, Y., et al., Water Consumption and Wastewater Discharge in China’s Steel Industry,
Ironmaking & Steelmaking, 45 (2018), 10, pp. 868-77
[12] Zhang, J., Wang, G., Energy Saving Technologies and Productive Efficiency in the Chinese Iron
and Steel Sector, Energy, 33 (2008), 4, pp. 525-37
[13] Goto, N. TT, et al., Creation of a Recycling-based Society Optimised on Regional Material and
Energy Flow, Energy, 30 (2006), 8, pp. 1259-70
[14] Kodama, A., et al., An Energy Flow Analysis of a Solar Desiccant Cooling Equipped with a
Honeycomb Adsorber, Adsorption-journal of the International Adsorption Society, 11 (2005), pp.
597-602
[15] Wang, H., et al., Research on Order Parameter Identification of the Food Quality Chain
Coordination System, Systems Engineering-Theory & Practice, 37 (2017), 7, pp. 1741-51
[16] Rong, W., Li, B., et al., Exergy Assessment of a Rotary Kiln-electric Furnace Smelting of
Ferronickel Alloy, Energy, 138 (2017), pp. 942-53
[17] Filkoski, R., et al., Energy Optimisation of Vertical Shaft kiln Operation in the Process of
Dolomite Calcination, Thermal Science, 22 (2018), 5, pp. 2123-35
[18] Dolianitis, G., et al., Waste Heat Recovery at the Glass Industry with the Intervention of Batch
and Cullet Preheating, Thermal Science, 20 (2016), 4, pp. 1245-58
[19] Wei, Y. M., et al., An Empirical Analysis of Energy Efficiency in China‘s Iron and Steel Sector.
Energy, 32 (2007), 12, pp. 2262-70
[20] Guo, Z. C., Fu, Z. X., Current Situation of Energy Consumption and Measures Taken for Energy
Saving in the Iron and Steel Industry in China, Energy, 35 (2010), 11, pp. 4356-60
[21] Rodriguez, M. T.T., et al., Combining LCT Tools for the Optimization of an Industrial Process:
Material and Energy Flow Analysis and Best Available Techniques, Journal of Hazardous
Materials, 192 (2011), 3, pp. 1705-19
[22] Stefanovic, G., et al., CO2 Reduction Options in Cement Industry: The Novi Popovac Case,
Thermal Science, 14 (2010), 3, pp. 671-9
[23] Yu, Y., Li, B., et al., Evaluation and Synergy of Material and Energy in the Smelting Process of
Ferrochrome Pellets in Steel Belt Sintering-submerged Arc Furnace, Energy, 179 (2019), pp. 792-
804
[24] Madlool, N. A., et al., An Exergy Analysis for Cement Industries: An Overview, Renewable &
Sustainable Energy Reviews, 16 (2012), 1, pp. 921-32
[25] Liu, P., Li, B., et al., Material and Energy Flows in Rotary Kiln-electric Furnace Smelting of
Ferronickel Alloy with Energy Saving, Applied Thermal Engineering, 109 (2016), pp. 542-59
[26] Jincai, Z., et al., Environmental Vulnerability Assessment for Mainland China Based on Entropy
Method, Ecological Indicators, 91 (2018), pp. 410-22

[27] Liu, X., et al., Thermal Performance Analysis of Brayton Cycle with Waste Heat Recovery Boiler
for Diesel Engines of Offshore Oil Production Facilities, Applied Thermal Engineering, 107
(2016), pp. 320-8
[28] Wenzhong, C., et al., Influences of Air Pipe Parameters on Thermal Working Conditions in
Carbon Rotary Kilns, CIESC Journal, 11 (2011), pp. 139-44
Submitted: 31.01.2021. Revised: 06.05.2021 Accepted: 10.05.2021.