Embed Size (px)
Citation preview

research papers
586 doi:10.1107/S1600577514002793 J. Synchrotron Rad. (2014). 21, 586–593
Journal of
SynchrotronRadiation
ISSN 1600-5775
Received 24 October 2013
Accepted 6 February 2014
A synchrotron-based local computed tomographycombined with data-constrained modellingapproach for quantitative analysis of anthracitecoal microstructure
Wen Hao Chen,a,b Sam Y. S. Yang,c* Ti Qiao Xiao,a* Sherry C. Mayo,c
Yu Dan Wanga and Hai Peng Wangd
aShanghai Synchrotron Radiation Facility, Shanghai Institute of Applied Physics, Chinese Academy
of Sciences, Shanghai 201204, People’s Republic of China, bGraduate University of Chinese
Academy of Sciences, Beijing 100049, People’s Republic of China, cCSIRO Materials Science and
Engineering, Private Bag 33, Clayton South, Victoria 3169, Australia, and dInstitute of Theoretical
Physics and Department of Physics, Shanxi University, Taiyuan, Shanxi 030006, People’s Republic
of China. *E-mail: [email protected], [email protected]
Quantifying three-dimensional spatial distributions of pores and material
compositions in samples is a key materials characterization challenge,
particularly in samples where compositions are distributed across a range of
length scales, and where such compositions have similar X-ray absorption
properties, such as in coal. Consequently, obtaining detailed information within
sub-regions of a multi-length-scale sample by conventional approaches may not
provide the resolution and level of detail one might desire. Herein, an approach
for quantitative high-definition determination of material compositions from
X-ray local computed tomography combined with a data-constrained modelling
method is proposed. The approach is capable of dramatically improving the
spatial resolution and enabling finer details within a region of interest of a
sample larger than the field of view to be revealed than by using conventional
techniques. A coal sample containing distributions of porosity and several
mineral compositions is employed to demonstrate the approach. The optimal
experimental parameters are pre-analyzed. The quantitative results demon-
strated that the approach can reveal significantly finer details of compositional
distributions in the sample region of interest. The elevated spatial resolution
is crucial for coal-bed methane reservoir evaluation and understanding the
transformation of the minerals during coal processing. The method is generic
and can be applied for three-dimensional compositional characterization of
other materials.
Keywords: quantitative local CT; data-constrained modelling; coal; multi-spectrum X-ray CT.
1. Introduction
Three-dimensional imaging of material compositions remains
one of the most challenging aspects of materials character-
ization, and doing so quantitatively adds another level of
complexity to this challenge. Quantitative computed tomo-
graphy (CT) is emerging as a viable solution to this challenge;
however, overcoming technical limitations has proven diffi-
cult, especially the ability to discriminate between three-
dimensional distributions of minerals with similar X-ray
absorption properties. Quantitative identification of fine
features is also very difficult when their sizes are smaller than
the X-ray CT resolution, such that a voxel (volumetric pixel,
the minimum unit of the CT slice image) in the reconstructed
CT image contains multiple compositions. The reconstructed
CT value of the voxel represents a composition-weighted
average. This is the so-called partial-volume effect (Ketcham
& Carlson, 2001). Increasing X-ray CT resolution can reduce
this effect, but the sample size will have to be decreased
accordingly, which may either alter its fine structure or may
not be possible at all owing to its fragility.
Another significant challenge encountered in X-ray CT is
overcoming the limited field of view (FOV), which is dictated
by hardware limitations, most notable from the size of the
imaging detector. The consequence is that samples must either
be physically trimmed to fit within the FOV, or the imaging
resolution must be lowered to accommodate the sample, both
of which are undesirable. A new imaging methodology, called

local CT, has recently emerged and can overcome the FOV
limitation of the detector. It can enable high resolution in
X-ray CT imaging of large samples and has been broadly
investigated in recent years (Delaney & Bresler, 1995;
Katsevich & Ramm, 1996; Faridani et al., 1992; Kudo et al.,
2008; Kyrieleis et al., 2011). However, most local-CT algo-
rithms are qualitative algorithms or are difficult to apply
in practice because of restrictions, such as requiring global
projections at certain projection angles and knowledge of the
exact sample boundary. It is well know that CT reconstruction
from an interior data generally leads to artifacts in slice in the
form of a global (i.e. feature-independent) elevation of the
gray values towards the edge of the reconstructed region of
interest (ROI) (Lewitt & Bates, 1978). This kind of artifacts
is due to the loss of low-frequency information which can be
suppressed by projection extension (Lewitt, 1979). Pseudo-
global tomography (Chen et al., 2014) uses an effective
strategy to compensate the lost part of projections in the local
CT, which can effectively reduce DC-shift and low-frequency
artifacts caused by projection truncation. It can efficiently
perform quantitative local reconstruction with a standard
calibration and so we have applied this method to our local-
CT analysis.
Previously, data-constrained modelling (DCM) approaches
have been applied in conjunction with synchrotron-based
X-ray CT to quantitatively characterize material compositions
distributions in samples and hydrocarbon reservoir char-
acterizations (Yang et al., 2007, 2008, 2010a, 2010b, 2013; Mayo
et al., 2012; Trinchi et al., 2012). The DCM software is available
at http://www.ict.csiro.au/downloads.php?swid=24. This
approach utilizes X-ray absorption information obtained from
multi-energy CT data as constraints to effectively distinguish
between materials that have similar X-ray absorption prop-
erties, and allows composition distributions at length scales
smaller than the X-ray CT resolution to be modelled as partial
volumes.
In this study, the DCM approach and pseudo-global
tomography are combined to form a new characterization
approach, which is applied to synchrotron-based multi-energy
X-ray local-CT datasets to investigate the three-dimensional
compositional distributions and physical structure of a coal
sample. Coal was chosen as the model sample owing to its
worldwide significance as an energy source, and quantification
of its volume and spatial disposition of pores, fractures and
minerals, as well as visualizing that the physical structure of
coal is a fundamental requirement for coal-bed methane
reservoir evaluation and understanding the transformation of
the minerals during coal processing. The high quality and
monochromaticity of synchrotron-based X-ray light is optimal
for quantitative CT reconstruction with a high resolution. The
high brightness of synchrotron X-rays effectively reduces the
sample exposure time, which can significantly reduce the
impact of the experimental instabilities associated with time.
In order to evaluate the advantage gained from local-CT-
based DCM, global-CT-based DCM has also been performed.
With the requirement of fitting the whole sample into the FOV
of the detector, the CT resolution is low in global CT. The
result shows that local CT can visualize more details of the
sample, which provide more spatially resolved constraints for
DCM than with global CT. It enables an accurate analysis
of the three-dimensional distribution of coal compositions.
Consequently, the combination of local CT and DCM can
enable the partial volume effect to be characterized at a high
spatial resolution.
2. Sample description and experimental parameters
Coal is a complex polymeric material; its main physical
compositions include: coal matrix (the organic compositions),
void (pores and fractures) and mineral (inorganic constitu-
ents) (Levine et al., 1982). In order to characterize and
visualize the distributions of these compositions, various
techniques have been used (Lawrie et al., 1997; Bruening &
Cohen, 2005; Vassilev & Tascon, 2003; Creelman & Ward,
1996; Galbreath et al., 1996; Saikia & Ninomiya, 2011; Karacan
& Okandan, 2001; Yao et al., 2009). Among all these techni-
ques, X-ray micro-CT has a unique advantage as a sample non-
destructive three-dimensional characterization method.
The coal sample investigated in this study was collected
from an underground mine in Yangquan, originating from
Qinshui basin, which is one of the most gas-rich coal basins in
China. It was carefully sanded by hand into a cylindrical shape
with a diameter of 4 mm and a length of 10 mm. Table 1 shows
a list of composition minerals and their overall volume
percentages (Wang et al., 2013). The total porosity of the coal
sample was estimated as 4.43%.
When X-rays pass through the sample, the X-ray attenua-
tion by each composition depends on both its volume fraction
and its X-ray absorption coefficient. Since the typical noise
level of X-ray CT is 1%, the mineral compositions can be
ignored if their volume fractions are small enough such that
they contribute much less than 1% of X-ray attenuation by the
sample. According to this criteria, pyrite, dolomite, plagioclase
and manganese dioxide can be ignored, and the remaining
compositions of the sample are grouped as follows (Wang et
al., 2013):
(a) Void (group A);
(b) Coal matrix (group B);
(c) Illite, quartz and kaolinite (group C);
(d) Chlorite and titania (group D).
research papers
J. Synchrotron Rad. (2014). 21, 586–593 Wen Hao Chen et al. � Analysis of anthracite coal microstructure 587
Table 1List of minerals and their overall volume percentages in the coal sample(reproduced from Wang et al., 2013).
Mineral name Molecular formula Volume percentage
Kaolinite Al2O3SiO2H2O 4.32Illite KAl2(AlSi3O10)(OH)2 0.23Quartz SiO2 1.21Pyrite FeS2 2.60 � 10�3
Titania TiO2 0.33Chlorite Mg(FeAl)5(SiAl)4O10(OH)8 0.077Dolomite CaCO3MgCO3 0.0664Plagioclase (NaCa)Al(Al3Si)Si3 0.0185Manganese dioxide MnO2 9.26 � 10�5
Coal matrix C101H41O4NS 93.75 (including voidvolume)

The accuracy of quantitative CT is related to X-ray CT
experimental parameters, including CT resolution, the sample-
to-detector distance (SDD) and X-ray beam energies. A pre-
analysis is required to optimize the sample-specific experi-
mental parameters. This pre-analysis is focused on the
evaluation of impacts of SDD and X-ray beam energy in X-ray
CT of a sample containing the compositions described above.
The pre-evaluation was conducted with a numerical phantom
with 680 � 680 � 1 voxels (a voxel has a size of 3.7 mm �
3.7 mm � 3.7 mm) (Fig. 1). As a parallel beam is used, one
phantom slice is sufficient for the simulation. The numerical
phantom is composed of circular sub-regions which comprise
different proportions of coal matrix and one other main
composition (void, group C minerals, or group D minerals)
with volume fraction step of 10%. The background is coal
matrix. The X-ray total linear absorption and phase-shift
coefficients of main compositions (except void) at energies of
12 keV, 18 keV, 24 keV and 30 keV are listed in Table 2.
Projection images of the phantom were simulated with
monochromatic parallel beams at X-ray energies of 12 keV,
18 keV, 24 keV and 30 keV. A series of SDDs were chosen in
the simulation. Nine hundred projections over a total rotation
angle of 180� around the z-axis (normal to the phantom slice)
were obtained with a 0.2� angular step between projections at
each X-ray energy. The projection images correspond math-
ematically to the Radon transforms of the phantom with X-ray
absorption and refraction. The images contain phase-contrast
effects for non-zero SDDs. That is, the projection images
recorded by the detector were intensity images of the sample
after Fresnel propagation at the SDD distance.
A typical noise level for X-ray CT of 1% Gaussian noise was
added to the simulated X-ray projections. After the simulated
projections were obtained, images were subjected to phase-
retrieval processing prior to tomographic reconstruction.
Phase-retrieval processing is required for the phase-contrast
imaging mode used (non-zero SDD) and results in an
apparent improvement in signal-to-noise level. Furthermore,
it eliminates the phase-contrast ‘edge-enhancement’ effect
to transform the data into a form suitable for quantitative
analysis. Slices of X-ray total linear absorption coefficient at a
given X-ray energy for the phantom sample were obtained by
tomographic reconstruction.
The square region indicated in Fig. 1 was chosen to evaluate
the performance of tomographic reconstruction under
different experimental conditions. The normalized cross-
correlation (NCC) between the reconstructed and original
square region was calculated,
C ¼
PNi¼ 1
pðrÞi � �pp ðrÞ
� �pðoÞi � �pp ðoÞ
� �PNi¼ 1
pðrÞi � �pp ðrÞ
� �2 PNi¼ 1
pðoÞi � �pp ðoÞ
� �2� �1=2
; ð1Þ
where pðrÞi and p
ðoÞi are the reconstructed and original total
linear absorption coefficient values at the ith pixel, respec-
tively, while �pp ðrÞ and �pp ðoÞ are their mean values. The NCC
represents a template matching of two datasets, which means
that a higher NCC value corresponds to a closer match
between the predicted image and the real sample.
Table 3 gives the NCC values for different compositions and
energies at a simulated noise level of 1% when SDD = 40 mm.
It shows that different compositions are associated with
different optimal energies. For a multi-composition sample,
the optimal energy is a compromise between the optimal
energies for the main compositions of the sample. For the coal
sample in this paper, the optimal energy is near 18 keV.
Considering that NCC is relatively insensitive to the beam
energy and based on the experience about the X-ray stability
on the BL13W beamline at Shanghai Synchrotron Radiation
Facility (SSRF), the energies of 18 keV and 24 keV were
chosen as the experimental energies.
research papers
588 Wen Hao Chen et al. � Analysis of anthracite coal microstructure J. Synchrotron Rad. (2014). 21, 586–593
Figure 1Schematic of the numerical phantom. The circular sub-regions aremixtures of coal matrix and one other main composition in variousproportions (the volume fraction step is 10%). From left to right and topto bottom, the volume fractions of the other main composition are 10%,20%, . . . , 90%, 100%. The background is the coal matrix. The squareregion indicates the region chosen to analyze the influence of differentexperimental conditions.
Table 2X-ray total linear absorption and phase-shift coefficients (� and ’) of the main coal compositions (except void) at energies of 12 keV, 18 keV, 24 keVand30 keV.
12 keV 18 keV 24 keV 30 keV
Composition Formula Density (g cm�3) ’ (cm�1) � (cm�1) ’ (cm�1) � (cm�1) ’ (cm�1) � (cm�1) ’ (cm�1) � (cm�1)
Kaolinite Al2O3SiO2H2O 2.60 �2293 24.57 �1524 7.565 �1141 3.418 �912.2 1.969Illite KAl2(AlSi3O10)(OH)2 2.75 �2414 36.79 �1604 11.38 �1201 5.081 �959.9 2.835Quartz SiO2 2.65 �2336 28.73 �1552 8.824 �1162 3.955 �928.9 2.250Titania TiO2 4.23 �3567 177.2 �2370 55.81 �1773 24.45 �1416 13.01Coal matrix C101H41O4NS 1.36 �1229 2.808 �818.4 1.034 �613.6 0.5862 �490.8 0.4180
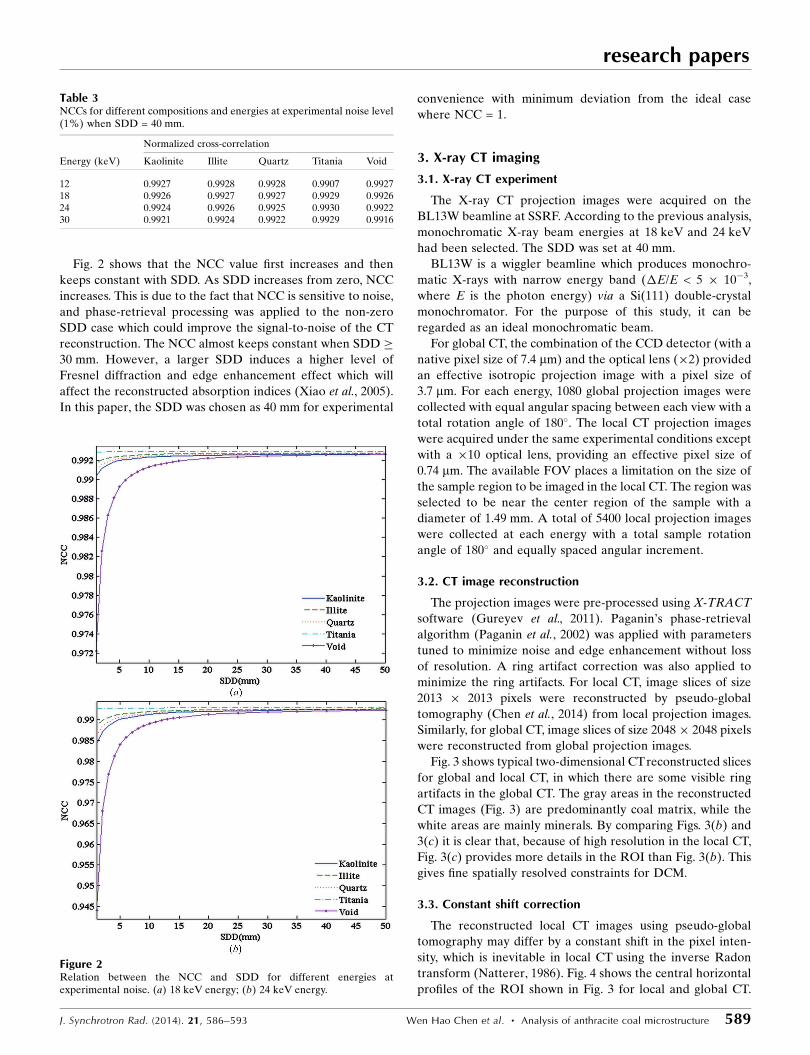
Fig. 2 shows that the NCC value first increases and then
keeps constant with SDD. As SDD increases from zero, NCC
increases. This is due to the fact that NCC is sensitive to noise,
and phase-retrieval processing was applied to the non-zero
SDD case which could improve the signal-to-noise of the CT
reconstruction. The NCC almost keeps constant when SDD �
30 mm. However, a larger SDD induces a higher level of
Fresnel diffraction and edge enhancement effect which will
affect the reconstructed absorption indices (Xiao et al., 2005).
In this paper, the SDD was chosen as 40 mm for experimental
convenience with minimum deviation from the ideal case
where NCC = 1.
3. X-ray CT imaging
3.1. X-ray CT experiment
The X-ray CT projection images were acquired on the
BL13W beamline at SSRF. According to the previous analysis,
monochromatic X-ray beam energies at 18 keV and 24 keV
had been selected. The SDD was set at 40 mm.
BL13W is a wiggler beamline which produces monochro-
matic X-rays with narrow energy band (�E/E < 5 � 10�3,
where E is the photon energy) via a Si(111) double-crystal
monochromator. For the purpose of this study, it can be
regarded as an ideal monochromatic beam.
For global CT, the combination of the CCD detector (with a
native pixel size of 7.4 mm) and the optical lens (�2) provided
an effective isotropic projection image with a pixel size of
3.7 mm. For each energy, 1080 global projection images were
collected with equal angular spacing between each view with a
total rotation angle of 180�. The local CT projection images
were acquired under the same experimental conditions except
with a �10 optical lens, providing an effective pixel size of
0.74 mm. The available FOV places a limitation on the size of
the sample region to be imaged in the local CT. The region was
selected to be near the center region of the sample with a
diameter of 1.49 mm. A total of 5400 local projection images
were collected at each energy with a total sample rotation
angle of 180� and equally spaced angular increment.
3.2. CT image reconstruction
The projection images were pre-processed using X-TRACT
software (Gureyev et al., 2011). Paganin’s phase-retrieval
algorithm (Paganin et al., 2002) was applied with parameters
tuned to minimize noise and edge enhancement without loss
of resolution. A ring artifact correction was also applied to
minimize the ring artifacts. For local CT, image slices of size
2013 � 2013 pixels were reconstructed by pseudo-global
tomography (Chen et al., 2014) from local projection images.
Similarly, for global CT, image slices of size 2048� 2048 pixels
were reconstructed from global projection images.
Fig. 3 shows typical two-dimensional CTreconstructed slices
for global and local CT, in which there are some visible ring
artifacts in the global CT. The gray areas in the reconstructed
CT images (Fig. 3) are predominantly coal matrix, while the
white areas are mainly minerals. By comparing Figs. 3(b) and
3(c) it is clear that, because of high resolution in the local CT,
Fig. 3(c) provides more details in the ROI than Fig. 3(b). This
gives fine spatially resolved constraints for DCM.
3.3. Constant shift correction
The reconstructed local CT images using pseudo-global
tomography may differ by a constant shift in the pixel inten-
sity, which is inevitable in local CT using the inverse Radon
transform (Natterer, 1986). Fig. 4 shows the central horizontal
profiles of the ROI shown in Fig. 3 for local and global CT.
research papers
J. Synchrotron Rad. (2014). 21, 586–593 Wen Hao Chen et al. � Analysis of anthracite coal microstructure 589
Figure 2Relation between the NCC and SDD for different energies atexperimental noise. (a) 18 keV energy; (b) 24 keV energy.
Table 3NCCs for different compositions and energies at experimental noise level(1%) when SDD = 40 mm.
Normalized cross-correlation
Energy (keV) Kaolinite Illite Quartz Titania Void
12 0.9927 0.9928 0.9928 0.9907 0.992718 0.9926 0.9927 0.9927 0.9929 0.992624 0.9924 0.9926 0.9925 0.9930 0.992230 0.9921 0.9924 0.9922 0.9929 0.9916

A constant offset is evident. In order to obtain the correct
quantitative information, this constant shift must be corrected.
This correction was performed as follows. Based on the
histogram of the ROI in each slice, the absorption coefficient
as a function of CT slice position was plotted and then fitted
with a fourth-order polynomial (Fig. 5). By comparing the
fitted curves for global and local CT, the shift between them
was calculated. This calculated shift value was used to correct
the offset. Fig. 6 shows the corrected result. The constant shift
has disappeared.
4. Data-constrained microstructureprediction
The reconstructed local CT images have
a voxel size of 0.74 mm � 0.74 mm �
0.74 mm, while the reconstructed low-
resolution global-CT images have a
voxel size of 3.7 mm � 3.7 mm � 3.7 mm.
Consequently, the features which were
directly observable from CT images,
such as pores, cannot be smaller than
such a voxel size. The DCM approach
can reveal fine features smaller than the
CT image voxel size (Yang, 2012; Yang
et al., 2007, 2008, 2010a,b, 2012, 2013;
Mayo et al., 2012; Trinchi et al., 2012) as
compositional partial volumes in the
same voxel by incorporating multiple
sets of X-ray CT data acquired at
different X-ray energies as constraints.
Obviously, higher-resolution X-ray CT
data provide more spatially resolved
constraints for DCM, which would
enable more accurate DCM character-
ization of microstructures. In other
words, local CT would enable elevated
DCM accuracy for regional micro-
structures. It overcomes the limitation
of the FOV and enables high-resolution
observation of the ROI in a large sample. In the DCM model a
cubic grid of N = 2013 � 2013 � 245 voxels was used to
represent the ROI in local CT, where 245 is the number of
selected slices, while for global CT a cubic grid of N = 403 �
403� 49 voxels was used to represent the same ROI, where 49
is the number of selected slices. The size of a voxel in the DCM
model was equal to the voxel size of reconstructed CT images.
For voxel i (i = 1, 2, . . . , N), where N is the total number of
voxels in the system, the DCM nonlinear optimization
approach was used to solve for the volume fraction values
research papers
590 Wen Hao Chen et al. � Analysis of anthracite coal microstructure J. Synchrotron Rad. (2014). 21, 586–593
Figure 3Typical two-dimensional CT reconstructed slices at X-ray energy 18 keV. (a) The low-resolutionglobal reconstruction. The white circle indicates the ROI for the local CT. (b) Magnified view of theROI in (a). (c) The high-resolution local reconstruction in the ROI on the same slice. The pixelintensity is proportional to the total linear absorption coefficient.
Figure 4Central horizontal profiles of the ROI in Fig. 3 for local and global CT.
Figure 5Typical histogram of one slice and the histogram peak as a function of slice position. (a) Typical histograms of one slice for global and local CT. (b) Thehistogram peak as a function of slice position for global and local CT and their fit curves.

of compositions voxel by voxel. The
approach is to minimize the following
objective function (Yang, 2012),
Ti ¼PLl¼ 1
PMm¼ 1
�ðl;mÞ� ðmÞi � ��� ðlÞi
� �2
þPM
m¼ 0
� ðmÞi S ðmÞ; ð2Þ
where L (= 2) is the number of X-ray
CT data sets acquired from the sample
at X-ray energies 18 and 24 keV; M (= 3)
is the number of non-void compositions;
�ðl;mÞ (l = 1, 2) are the expected X-ray
total linear absorption coefficient values of composition group
m at the two X-ray energies; � ðmÞi are volume fractions for
composition group m on voxel i, and S ðmÞ are the self-energy
(phenomenological chemical potential) of composition group
m; ��� ðlÞi (l = 1, 2) are X-ray CT measured total linear absorption
coefficient values on voxel i at the above X-ray energies. In
equation (2), the first term represents the difference between
the expected and CT-reconstructed X-ray total linear
absorption coefficients, and the second term accounts for the
chemical potential differences among different compositions.
The interactions between compositions had been ignored
considering the absence of further measurement data (Yang,
2012). In this paper, the chemical potentials were treated as
adjustable parameters to reproduce the measured composi-
tional volume fractions of the whole sample.
The minimization of equation (2) is solved using a
constrained search algorithm (Yang,
2012) with the following constraints,(0 � v
ð0Þi ; v
ð1Þi ; v
ð2Þi ; v
ð3Þi � 1;
vð0Þi þ v
ð1Þi þ v
ð2Þi þ v
ð3Þi ¼ 1:
ð3Þ
When the chemical potentials of groups
A, B, C and D were set as 0.0002652,
4.5705 � 10�5, �0.001173 and
�0.0103822, respectively, the computed
overall volume fractions of composi-
tions reproduced the measured value
using helium gas porosimetry and the
ash analysis process.
Fig. 7 shows the DCM results on the
same slice as in Fig. 3. The average
compositional volume fractions are
listed in Table 4. Obviously, there
are some colour mixed regions in
Fig. 7(a), indicating that multiple
compositions coexist in these regions.
For instance, the yellow (red mixed
with green) pixels indicate the coex-
istence of void and coal matrix. Colour
mixing also means that these voxels
contain compositions smaller than the
X-ray CT resolution. It should be noted
that the colour mixing becomes less
obvious when a voxel is dominated by one composition.
Figs. 7(b) and Fig. 7(c) show a high occurrence of void near the
boundary between the minerals group C and the coal matrix.
This observation is consistent with the results of Wang et al.
(2013).
Fig. 8 shows the physical structure of the ROI in the coal
sample. It indicates that the distribution of group C compo-
sition tends to take a clustered form, while group D takes a
dispersed form and regions of this composition are not
connected with each other. The voids are dispersed but
connected with each other in the coal sample. It should be
pointed out that, although there are a significant numbers of
voxels with non-zero void volume fractions, the proportion of
void-dominated voxels is small. The void connectivity as
shown in the figure is predominately due to such partial
void voxels.
research papers
J. Synchrotron Rad. (2014). 21, 586–593 Wen Hao Chen et al. � Analysis of anthracite coal microstructure 591
Figure 6Central horizontal profiles of the ROI in Fig. 3 for local and global CT after constant shiftcorrection.
Figure 7DCM results of the ROI in Fig. 3. In image (a), void is displayed as red, coal matrix is displayed asgreen, minerals of group C are displayed as blue, and minerals of group D are displayed as purple.Image (b) gives the distribution of group C, and image (c) gives the distribution of void. On a pixel,the displayed intensity for each colour is proportional to an appropriate compositional volumefraction. The co-existence of multiple compositions in a voxel is shown as colour mixing in (a).
Table 4DCM computed volume fractions.
Overall volume fractions (%) Overall volume fractions on the sub-region (%)
Group name Fig. 7 Fig. 8 Local tomography Global tomography
Group A 3.37 3.69 3.46 4.47Group B 91.60 91.18 90.70 89.90Group C 4.93 5.05 5.74 5.59Group D 0.10 0.08 0.10 0.08

The global-CT-based DCM had also been performed to
facilitate comparison. In order to minimize the impact of ring
artifacts in the global CT (Fig. 3) and for fine structure display
clarification, a sub-region (100 � 100 � 49 voxels) of the ROI
with minimal artifacts in global CT was selected for DCM
analysis. Consequently, the same sub-
region (500 � 500 � 245 voxels) in local
CT had been selected for comparison.
The DCM computed volume fractions
for groups A, B, C and D on the selected
sub-region are listed in Table 4.
Fig. 9 shows a three-dimensional view
of distributions of void and minerals
groups C and D in the ROI sub-region.
Fig. 10 shows separate three-dimen-
sional views of void, group C and
group D.
The DCM incorporates multiple sets
of X-ray CT data as constraints to
generate material volume fractions at
X-ray CT resolution. The low CT reso-
lution would make it difficult to resolve
fine structures of the sample. It causes
these fine structures to become blurred
or invisible in the DCM results, as can
be seen in Figs. 9 and 10. Some fine
structures are clearly visible in local-CT-
based DCM, but they appear to be
blurred or have disappeared in global-
CT-based DCM. This demonstrates
that, although DCM can incorporate effects of fine structures
smaller than the CT resolution, its display resolution is
restricted by the CT resolution. Higher spatial resolution CT
can provide DCM with more spatially resolved constraints,
which enables it to display finer structures and give more
accurate three-dimensional distributions of compositions in
the sample.
The limited resolution also leads to a broadened distribu-
tion of the CT-reconstructed values (Yang et al., 2013). Such a
distribution would lead to a small numerical overestimation of
void in the coal sample, which is indicated in Table 4. Table 4
shows that the average void volume fraction in global CT is
clearly bigger than the average void volume fractions in
local CT.
research papers
592 Wen Hao Chen et al. � Analysis of anthracite coal microstructure J. Synchrotron Rad. (2014). 21, 586–593
Figure 8Physical structure of the ROI. In image (a), void is displayed as red,minerals of group C are displayed as blue, minerals of group D aredisplayed as green. Images (b), (c) and (d) are the distributions of void,group C and group D in the ROI, respectively. On a pixel, the displayedintensity of each colour is proportional to the appropriate compositionalvolume fraction. Co-existence of multiple compositions in a voxel isshown as colour mixing. The size of the ROI is 1489.6 mm � 1489.6 mm �181.3 mm.
Figure 9Physical structure of a sub-region in the ROI. Images (a) and (b) areDCM results based on global and local CT, respectively. In the image,void is displayed as red, minerals of group C are displayed as blue, andminerals of group D are displayed as green. On a pixel, the displayedintensity of each colour is proportional to the appropriate compositionalvolume fraction. The size of the sub-volume is 370 mm � 370 mm �181.3 mm.
Figure 10Distributions of void, group C and group D in the sub-region of the ROI. Upper images are global-CT-based DCM results, and lower images are local-CT-based DCM results. (a), (d) are thedistribution of void; (b), (e) are the distribution of group C; and (c), ( f ) are the distribution of groupD. The volume fraction is represented by the pixel intensity on the image.

5. Conclusions
A quantitative local-CT-based DCM has been developed. The
method enables quantitative characterization of three-
dimensional distributions of material compositions and void in
a ROI of a sample. It has been demonstrated using a coal
sample collected from Yangquan mine. The optimal experi-
mental parameters for CT scanning of the coal sample were
determined through prior simulations on a numerical
phantom and used as a basis for the experimental local-CT
measurements. The microscopic physical structure of the ROI
in the sample has been determined from this local-CT data
using DCM analysis. The material compositions of the sample
were categorized into four groups in accordance with their
X-ray absorption characteristics. The numerical results of
DCM analysis of the local-CT data have been compared with
low-resolution global-CT-based DCM.
The results demonstrated the following:
(i) The optimal sample-to-detector distance has been
established as 40 mm, and X-ray energies as 18 keV and
24 keV by considering the X-ray energy range and stability on
the beamline, experimental convenience and experimental
noise level (1%).
(ii) The three-dimensional distributions of four composi-
tions groups including coal matrix, minerals and void in the
ROI of the coal sample can be obtained non-destructively with
local-CT-based DCM.
(iii) The accuracy of the DCM result is related to CT
resolution. Higher-resolution CT enables DCM to produce a
more accurate result. Local CTovercomes the limitation of the
FOV of the detector, which enables high-resolution CT
imaging and accurate DCM modelling.
(iv) Some compositions at length scales smaller than the
X-ray CT resolution have been detected and displayed. There
were obvious mixings of compositions at the voxel level.
(v) There were a significant amount of voids which were
smaller than the X-ray CT resolution. Dispersed sub-voxel-
sized voids formed connected clouds. The distribution of
group C components takes a clustered form, while group D
takes a dispersed form with group D regions not connected to
each other.
(vi) Elevated spatial resolution can reduce the over-esti-
mation of void caused by broadened distribution of the CT
reconstructed values which is common in CT.
Compared with global-CT-based DCM, the local-CT-based
DCM approach has an advantage in resolution. It can display
fine structures of compositions in the sample ROI, which is
particularly useful when there is a need to see the fine struc-
tures in a small region of a large sample.
The authors would like to thank Tim Gureyev and Adrian
Trinchi for stimulating discussions and critical reading of the
manuscript. YSY, YDW and HPW would like to acknowledge
partial support by the National Basic Research Program of
China (2014CB239004). WHC would like to thank the China
Scholarship Council (CSC) and CSIRO Computational and
Simulation Science Transformational Capability Platform
(CSS-TCP) for sponsorship, and CSIRO Materials Science
and Engineering Division for hospitality. YSY and HPW
would like to acknowledge support by the Shanxi Province
One Hundred Person Project and grant No. 21206087.
References
Bruening, F. A. & Cohen, A. D. (2005). Int. J. Coal Geol. 63, 195–204.Chen, W., Wang, Y., Liu, H., Deng, B., Yang, Y. & Xiao, T. (2014).
Chin. Opt. Lett. 12, 023401.Creelman, R. A. & Ward, C. R. (1996). Int. J. Coal Geol. 30, 249–269.Delaney, A. H. & Bresler, Y. (1995). IEEE Trans. Image. Process. 4,
799–813.Faridani, A., Ritman, E. L. & Smith, K. T. (1992). SIAM J. Appl.
Math. 52, 459–484.Galbreath, K., Zygarlicke, C., Casuccio, G., Moore, T., Gottlieb, P.,
Agron-Olshina, N., Huffman, G., Shah, A., Yang, N., Vleeskens, J.& Hamburg, G. (1996). Fuel, 75, 424–430.
Gureyev, T., Nesterets, Y., Thompson, D., Wilkins, S., Stevenson, A.,Sakellariou, A. & Taylor, J. (2011). Proc. SPIE, 8141, 81410B.
Karacan, C. O. & Okandan, E. (2001). Fuel, 80, 509–520.Katsevich, A. I. & Ramm, A. G. (1996). SIAM J. Appl. Math. 56, 167–
191.Ketcham, R. A. & Carlson, W. D. (2001). Comput. Geosci. 27, 381–
400.Kudo, H., Courdurier, M., Noo, F. & Defrise, M. (2008). Phys. Med.
Biol. 53, 2207–2231.Kyrieleis, A., Titarenko, V., Ibison, M., Connolley, T. & Withers, P. J.
(2011). J. Microsc. 241, 69–82.Lawrie, G. A., Gentle, I. R., Fong, C. & Glikson, M. (1997). Fuel, 76,
1519–1526.Levine, D. G., Schlosberg, R. H. & Silbernagel, B. G. (1982). Proc.
Natl Acad. Sci. USA, 79, 3365–3370.Lewitt, R. M. (1979). Med. Phys. 6, 412–417.Lewitt, R. M. & Bates, R. H. T. (1978). Optik, 50, 189–204.Mayo, S. C., Tulloh, A. M., Trinchi, A. & Yang, S. Y. (2012). Microsc.
Microanal. 18, 524–530.Natterer, F. (1986). The Mathematics of Computerized Tomography,
1st ed. New York: Wiley.Paganin, D., Mayo, S. C., Gureyev, T. E., Miller, P. R. & Wilkins, S. W.
(2002). J. Microsc. 206, 33–40.Saikia, B. K. & Ninomiya, Y. (2011). Fuel Process. Technol. 92, 1068–
1077.Trinchi, A., Yang, Y. S., Huang, J. Z., Falcaro, P., Buso, D. & Cao, L. Q.
(2012). Modell. Simul. Mater. Sci. Eng. 20, 015013.Vassilev, S. V. & Tascon, J. M. D. (2003). Energ. Fuel. 17, 271–281.Wang, H. P., Yang, Y. S., Wang, Y. D., Yang, J. L., Jia, J. & Nie, Y. H.
(2013). Fuel, 106, 219–225.Xiao, T., Bergamaschi, A., Dreossi, D., Longo, R., Olivo, A., Pani, S.,
Rigon, L., Rokvic, T., Venanzi, C. & Castelli, E. (2005). Nucl.Instrum. Methods Phys. Res. A, 548, 155–162.
Yang, S., Furman, S. & Tulloh, A. (2008). Adv. Mater. Res. 32, 267–270.
Yang, S., Gao, D., Muster, T., Tulloh, A., Furman, S., Mayo, S. &Trinchi, A. (2010b). Mater. Sci. Forum, 654–656, 1686–1689.
Yang, Y. S. (2012). Information Engineering Research Institute,Lecture Notes on Information Technology, Vol. 15, pp. 198–205.
Yang, Y. S., Gureyev, T. E., Tulloh, A., Clennell, M. B. & Pervukhina,M. (2010a). Meas. Sci. Technol. 21, 1–6.
Yang, Y. S., Liu, K. Y., Mayo, S., Tulloh, A., Clennell, M. B. & Xiao,T. Q. (2013). J. Petrol. Sci. Eng. 105, 76–83.
Yang, Y. S., Tulloh, A., Cole, I., Furman, S. & Hughes, A. (2007).J. Aust. Ceram. Soc. 43, 159–164.
Yang, Y. S., Wang, H. P. & Gao, J. R. (2012). J. Shanxi Univ. 35, 248–254.
Yao, Y. B., Liu, D. M., Che, Y., Tang, D. Z., Tang, S. S. & Huang, W. H.(2009). Int. J. Coal Geol. 80, 113–123.
research papers
J. Synchrotron Rad. (2014). 21, 586–593 Wen Hao Chen et al. � Analysis of anthracite coal microstructure 593