Embed Size (px)
Citation preview

1
A Survey Report On Halal Food Consumption
Among Muslim Students And Housewives In Korea
For Institute of Asian Muslim Studies,
Waseda University
By Hee Soo Lee, Ph.D
Professor of Department of Cultural Anthropology
Hanyang University, Korea
February 28. 2017

2
Survey Report on Halal Food Consumption among
Muslim Students and Housewives in Korea
Introduction
Transnational connections between social groups represent a key manifestation of
globalization. Facilitated, but not caused, by improved transportation, technology and
telecommunications, globalization has entailed the increasing extent, intensity, velocity and
impact of global interconnected across a broad range of human domains.1 Enhanced
transnational connections between social groups and hybrid cultural phenomena become a
key issue in researches on trans-migrants. Trans-migrants settle and become incorporated in
the economy and political institutions, localities, and patterns of daily life of the country in
which they reside. At the same time, they are engaged elsewhere in the sense that they
maintain connections, build institutions, conduct transactions, and influence local and
national events in the countries from which they emigrated.2
In an immigrant country, notably, home-based religious communities play an important role
such as seeking comfort and support, exchanging social information, enhancing social status
and fulfilling religious obligations.3 As a consequence, trans-migrants tend to attend home-
based religious communities. In addition to being a part of home-based religious
communities, religious and cultural everyday practices, religious discipline at home and
religious education at school, and participation in formal places of worship shape the
identities and activities of not only trans-migrants but also their second and third
generations.4 Accordingly, the purposes of this survey are to examine how religious
education at school or at home and observance of Islamic rules influence on everyday
practice, especially, consumption of Halal food and identity of Muslim immigrants in Korea.
The respondents participated in the survey are Muslim immigrants living in Korea. The
survey was administered by graduate and undergraduate students from the Anthropology
1 Steven Vertovec, 2009, 『TRANSNATIONALSIM』, LONDON AND NEW YORK: Routledge, p. 2.
2 Nana Glick Schiller, Linda Basch and Cristina Szanton Blance, 1995, 「From Immigrant to Transmigrant:
Theorizing Transnational Migration」, 『Anthropological Quartely』vol. 68, No. 1, p. 48.
3 Peggy Levitt, 2001,『The Transnational Villagers』, California: University of California Press, pp. 169-170.
4 Steven Vertovec, 2009, ibid, p. 139.

3
department of Hanyang University. Following our research plan, the survey was supervised in
order to avoid an overlap between survey regions and survey respondents. Undergraduate
students administered the survey primarily to international students studying in Korea while
graduate students focused on surveying respondents who live within the two representative
Muslim communities in Korea – Ansan and Itaewon. The survey was carried out during a
five-month period from April to August of 2016. Using a one-on-one interview method, the
survey was conducted in order to get precise responses to each question. After the survey was
completed, information on both the respondent and the circumstances of the survey were
recorded.
The questionnaire was administered to a total of 240 respondents; 120 respondents were
Muslim students and 120 respondents were Muslim housewives residing in Korea. In the case
of particular questions being not answered, the reasons were noted. The statistical program
SPSS was used for the analysis and report. During the survey process, the most common
complaint from the respondents was that there were too many questions and some questions
such as family members‟ ages and marriage status were very private. While surveyors were
striving to receive as faithful responses as possible, because of the issue of the length of the
survey, there were cases when no answer was given. In spite of such problems of the survey
research, this survey report might be useful for understanding the relationship between
Muslim identity and consumption of Halal foods of Muslims in Korea.
SURVEY RESULTS OF MOTHERS
I. General Conditions
1. Age of respondents
The survey was performed on 120 Muslim housewives residing in Korea. The study shows
that out of 120 respondents, 4.2% are born in 1960‟s, 16.7% are born in 1970‟s, 63.3% born
in 1980‟s, 15.0% are born 1990‟s and 1.0% are born in 1950‟s. It tells us that the majority of
the respondents were born in 1980‟s and 1970‟s.

4
Figure 1-1. Age of respondents (Q1)
2. Country of origin of respondents and their husbands (partners)
The survey shows that the country of origin of respondents is 19.2% Korea, 75.8% Muslim
countries and the other countries 5.0%, except Korea and Muslim countries. It can be seen
from the study that Pakistan at 30.8% is the highest. Following Pakistan, Korea has a share of
19.2%, Indonesia 8.3%, Bangladesh 6.6%, both Jordan and Malaysia 5.0%, both Turkey and
Uzbekistan 4.2%. Results below 4% include countries such like Palestine, Syria, Iraq, Yemen,
Egypt, Morocco, Kazakhstan, Kyrgyzstan, India, Nigeria, Ghana, and Uganda.
Figure 1-2. Country of origin of respondents (Q2)
50's, 0.8% 60's, 4.2%
70's,
16.7%
80's,
63.3%
90's, 15%
Korea,
19.2%
Muslim
Country,
75.8%
Other,
5%

5
Muslim Country Other Country
Pakistan : 37
Indonesia : 10
Bangladesh : 8
Jordan : 6
Malaysia : 6
Turkey : 5
Uzbekistan : 5
Kazakhstan : 4
Egypt : 1
Iraq : 1
Kyrgyzstan : 1
Morocco : 1
Palestine : 1
Syria : 1
Yemen : 1
India : 2
Nigeria 2
Ghana : 1
Uganda : 1
Table 1-1. Country of origin of respondents
Country of origin of respondents’ husbands (partners)
In regards of country of origin of respondents‟ husbands (partners), 20.0% reported Korea,
75.8% Muslim countries and other countries except both countries reported 4.2%. The
majority is from Pakistan with 46.7%. Pakistan is followed by Korea (20.0%), and with same
results of 6.7% Bangladesh, and 5.8% Indonesia. As countries below 5% are Jordan, Turkey,
Palestine, Syria, Iraq, Yemen, Egypt, Malaysia, India, Nigeria, Ghana and Saudi Arabia.
Figure 1-3. Country of origin of respondents (Q42)
Korea,
20%
Muslim
country,
75.8%
Other,
4.2%

6
Muslim Country Other Country
Bangladesh : 8
Egypt : 2
Indonesia : 7
Iraq : 1
Jordan : 5
Libya : 1
Malaysia : 4
Pakistan : 56
Palestine : 1
Saudi Arabia : 1
Syria : 1
Turkey : 2
Yemen : 1
Ghana : 1
India : 2
Nigeria : 2
Table 1-2. Country of origin of respondents‟ husbands (partners)
3. Family income of respondents
From the survey, it was found that 4.2% of the respondents had far above average income
and 15.8% of them had above average income in comparison with that of a Korean family. In
addition, 55.8% had average income, 20.8% had below average income, and 3.3% had far
below average income in comparison with that of a Korean family. From this result, it can be
said that about half of the respondents had an average income in comparison with that of a
Korean family.
Graphic 1-1. Family income of respondents (Q70)
4.2%
14.2%
55%
21.7%
5%
0.00%
10.00%
20.00%
30.00%
40.00%
50.00%
60.00%
Far above
average
Above average Average Below average Far below average

7
4. Length of stay in Korea
The survey reported that 58.3% of respondents moved to Korea when they were in their 20s‟,
15.8% of respondents moved when they were 30s‟, 3.3% of respondents moved 10s‟. 40‟s
and 50‟s were 0.8% both. 20.8% didn‟t respond because 19.2% of the respondents were born
in Korea, and they didn‟t answer if they didn‟t have clear memories
Figure 1-4. Length of stay in Korea (SQ2)
5. Level of education
According to the study, the majority of respondents had completed at least high school,
university, or graduate study as their highest level of education. Only three respondents, each
0.8% reported having no diploma or having completed elementary or middle school as their
highest level of education. On the other hand, 30% reported to have completed high school,
17.5% reported have completed vocational schools or higher post-secondary schools, and
48.3% reported have completed university or graduate school as their highest level of
education.
Non
response,
20.8% 10's,
3.3%
20's,
58.3%
30's,
15.8%
40's, 0.8% 50's, 0.8%

8
Figure 1-5. Level of education (Q8)
6. Current occupation
The survey stated that 40.0% of respondents were currently employed (including part-time
jobs), while 54.2% of respondents were full-time housewives. Among employed respondents,
9.1% were having part-time job. Accordingly, 31.7% of employed respondents were working
in industry production, 20.7% education and Retail/stores/market, Restaurant/hotel/bar were
both 9.8%. In addition, 7.3% of them working in Other services, each 3.7% of respondents
working in Bank/insurance, Agriculture and fishing, Commercial services, 2.4% of them
working in Construction and Public administration both. 1.2% of them working in (health)
care. Finally, 5.8% of the respondents were self-employed.
No diploma,
0.8%
Special
education, 0.8% Lower
secondary(Vocati
onal), 0.8%
Higher
secondary(vocati
onal), 2.5%
Higher
Secondary(techni
cal, artistic or
apprenticeship),
3.3%
Higher
Secondary(gener
al or academic),
25.8%
Lower
tertiary(non-
university or
vocational) or
higher post-
secondary, 17.5%
Higher
tertiary(Universit
y or higher),
48.3%

9
Figure 1-6. Currency employed (Q18)
Other employment
NGO : 1
Part time : 5
Manufacturing : 2
Nonresponse : 17
Table 1-3. Other employment
employed,
19.2%
self-
employed,
5.8%
other,
20.8%
no,
54.2%

10
Figure 1-6. Current occupation (SQ18-2)
Response
frequency Percent
$SQ18.2a
Bank/insurance 3 3.7%
Construction 2 2.4%
Agriculture and fishing 3 3.7%
Transportation and communication 3 3.7%
Retail, stores, market 8 9.8%
Restaurant, hotel, bar 8 9.8%
Industry/mineral production 26 31.7%
Education 17 20.7%
Public administration 2 2.4%
Commercial services 3 3.7%
(health) care 1 1.2%
Other services 6 7.3%
Sum 82 100.0%
Bank/insuran
ce, 3.7%
Construction,
2.4%
Agriculture
and fishing,
3.7%
Transportatio
n and
communicati
on, 3.7%
Retail,
stores,
market,
9.8%
Restaurant,
hotel, bar,
9.8%
Industry/min
eral
production,
31.7%
Education,
20.7%
Public
administratio
n, 2.4%
Commercial
services, 3.7%
(health) care,
1.2%
Other
services,
7.3%

11
7. Religion
According to the survey results, 100% of the respondents believe in Islam. The shares of
Islam religious orders, according to the study, are 93.3% Sunni with the highest result,
followed by Shi‟ite with 5% and other minor sects of Islam with 1.7%. In the case of religion
of respondents‟ husbands, Sunni is 83.3%, Shi‟ite is 2.5%, and Islam (other) including Quran
& Sunnah is 3.3%. Christianity was reported 1.7% and no religion 8.3%. According to these
results, it can be claimed that the religion of the majority of the respondents and their
husbands is Sunni.
Figure 1-7. Religion of respondents (Q6)
Figure 1-8. Religion of respondents‟ husbands (Q45)
Sunni,
93.3%
Shi'ite, 5% Islam(Other),
1.7%
Islam
(Sunni),
83.3%
Islam
(Shi'ite),
2.5%
Islam
(Other),
3.3%
Christianity
, 1.7%
Judaism,
0.8% No
religion,
8.3%

12
8. Parents
8.1. Respondents‟ fathers
The survey shows that the country of origin of respondents‟ fathers is with 18.3% Korea,
75.8% Muslim countries and 5.8% other countries, except both Korean and Muslim countries.
Among the country of origin, 33.3% is reported as Pakistan, 18.3% as Korea, 8.3% as
Indonesia, 5.8% as Bangladesh, and 4.2% is Uzbekistan and Turkey. As countries below 4%
rates include Turkey, Palestine, Kazakhstan, India, Jordan, Nigeria, Syria, Iraq, Yemen, Egypt,
Morocco, Ghana, Uganda and Japan.
Figure 1-8. Country of origin of respondents‟ fathers (Q23)
Muslim Country Other Country
Bangladesh : 7
Egypt : 1
Ghana : 1
Indonesia : 10
Iraq : 1
Jordan : 3
Kazakhstan : 4
Kyrgyzstan : 1
Malaysia : 6
Morocco : 1
Pakistan : 40
Palestine : 4
Syria : 1
Turkey : 5
Uzbekistan : 5
Yemen : 1
India : 3
Japan : 1
Nigeria : 2
Uganda : 1
Table 1-4. Country of origin of respondents‟ fathers
Korea,
18.3%
Muslim
country,
75.8%
Other,
5.8%

13
The results in religion category are as follows; 75.6% of those who filled in the
questionnaire have fathers who are Sunni (Islam) as the highest rate, followed with Shi‟ite
(Islam) 4.2%, and Quran & Sunnah was 0.8%. Catholicism was reported 0.8%,
Christianity2.5% and Buddhism 3.3%. Results of no religion are 10.9%.
Figure 1-9. Religion of respondents‟ fathers (Q28)
Islam(Other) Other
Quran&Sunnah : 1
Buddhism : 4
Catholic : 1
Table 1-5. Religion of respondents‟ fathers (Q28-Others)
8.2. Respondents‟ mothers
The survey states that country origin of respondents‟ mothers is with 19.2% Korea, 75.0%
Muslim countries and 5.8% other countries, except both Korea and Muslim countries. Among
these countries, 33.3% reported as Pakistan, 19.2% Korea, 8.3% as Indonesia, 5.8% reported
as Bangladesh, 5.0% as Malaysia, and 4.2% as Uzbekistan and Turkey. The countries as
below 4% include Kazakhstan, Jordan, India, Palestine, Nigeria, Syria, Iraq, Yemen, Egypt,
Morocco, Kyrgyzstan, Ghana and Uganda.
Islam(Sunni
), 75.6%
Islam(Shi'it
e), 4.2%
Islam(Other
), 1.7%
Christianity
, 2.5%
No
religion,
10.9%
Other, 5%

14
Figure 1-10. Country of origin of respondents‟ mothers (Q30)
Muslim Country Other
Bangladesh : 7
Egypt : 1
Indonesia : 10
Iraq : 1
Jordan : 3
Kazakhstan : 4
Kyrgyzstan : 1
Malaysia : 6
Morocco : 1
Pakistan : 40
Palestine : 4
Syria : 1
Turkey : 5
Uzbekistan : 5
Yemen : 1
Ghana : 1
India : 3
Nigeria : 2
Uganda : 1
Table 1-6. Country of origin of respondents‟ mothers
The results in religion category are as follows; 77.5% of respondents‟ mothers are Sunni
(Islam), 3.3% Shi‟ite (Islam) and 0.8% Quran & Sunnah. Christianity was reported as 7.5%,
Catholicism and Buddhism 6.7%, and no religion 11.7%. The highest rate in religion category
is Sunni.
Korea,
19.2%
Muslim
Country,
75%
Other,
5.8%

15
Figure 1-11. Religion of respondents‟ mothers (Q35)
Islam(Other) Other
Quran & Sunnah : 1 Buddhism : 4
Catholic : 2
Table 1-7. Religion of respondents‟ mothers (Q35-Others)
8.3 Respondents‟ husbands‟ father (father in-law)
The study reported that country origin of respondents‟ husbands‟ fathers is 16.7% Korea,
79.2% Muslim countries, and 4.2% other countries; except both Korea and Muslim countries.
Among these countries, 50.0% is reported Pakistan, 16.7% Korea, 5.8% Indonesia, 5.8%
Bangladesh and 4.2% both Malaysia and Palestine. The countries as below 3% include
Turkey, Jordan, Egypt, Nigeria, Syria, Iraq, Yemen, Uzbekistan, Ghana and Saudi Arabia.
Islam(Sunni
), 77.5%
Islam(Shi'it
e), 2.5%
Islam(Other
), 0.8%
Christianity
, 4.2%
No
religion,
8.3%
Other,
6.7%

16
1-12. Country of origin of respondents‟ husbands‟ fathers (Q53)
Muslim Country Other Country
Bangladesh : 7
Egypt : 2
Indonesia : 7
Iraq : 1
Jordan : 2
Malaysia : 5
Pakistan : 60
Palestine : 5
Saudi Arabia : 1
Syria : 1
Turkey : 2
Uzbekistan : 1
Yemen : 1
Ghana : 1
India : 2
Nigeria : 2
Table 1-7. Country of origin of respondents‟ husbands‟ fathers
The religion of respondents‟ fathers-in-law reported Sunni (Islam) 78.3%, Shi‟ite 2.5% and
Quran & Sunnah 0.8%. The other religions such as Christianity reported 2.5%, Hinduism 0.8%
and no religion 13.3%
Korea,
16.7%
Muslim
country,
79.2%
Other,
4.2%

17
Figure 1-13. Religion of respondents‟ husbands‟ fathers (Q56)
Islam(Other) Other Country
Quran & Sunnah : 1 Buddhism : 1
Hinduism : 1
Table 1-8. Religion of respondents‟ husbands‟ fathers (Q56-Others)
8.4 Respondents‟ husbands‟ mother (mother in-law)
The results of the survey related to country of origin of respondents‟ husbands‟ mother is
Korea with 16.7%, Muslim countries 79.2%, and other countries 4.2%; except both Korea
and Muslim countries. The percentages according to countries are 49.2% Pakistan, 16.7%
Korea, 6.7% Bangladesh, 5.8% Indonesia, and 4.2% Malaysia. The countries below 4% is
Palestine, Turkey, Jordan, Egypt, India, Nigeria, Syria, Iraq, Yemen, Uzbekistan, Ghana and
Saudi Arabia.
Islam(Sunni
), 78.3%
Islam(Shi'it
e), 2.5%
Islam(Other
), 0.8%
Christianity,
2.5% No religion,
13.3%
Other, 2.5%
18
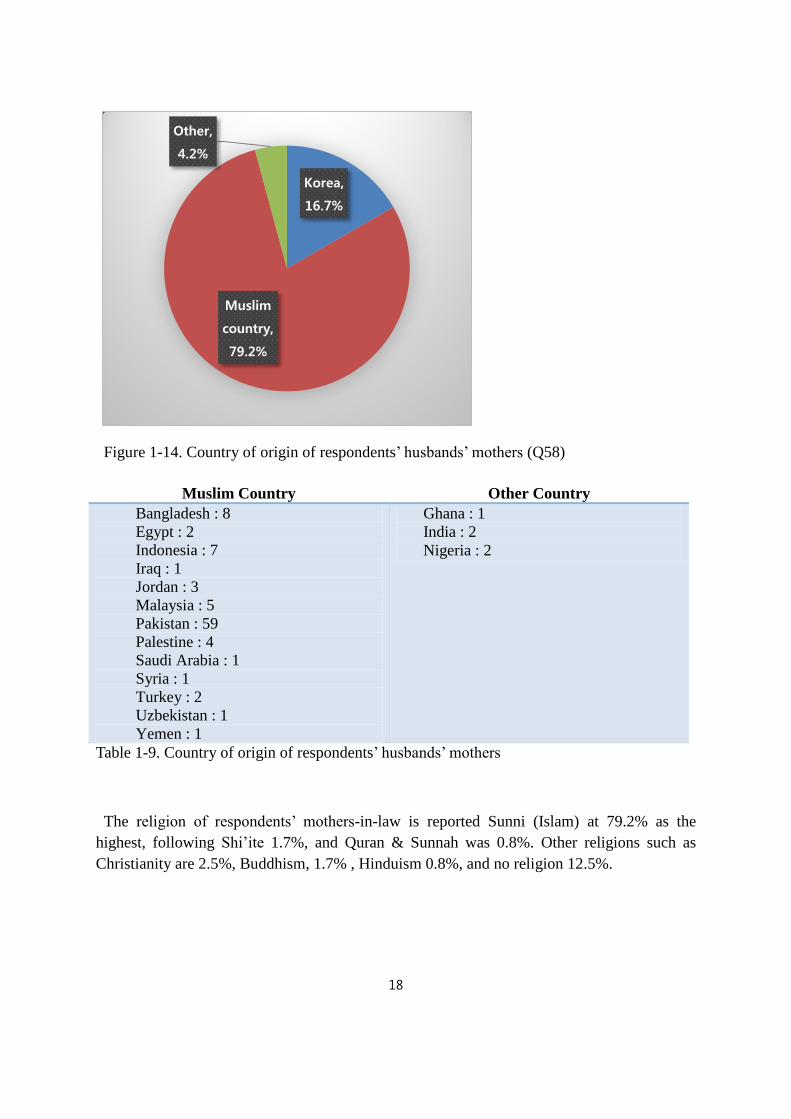
Figure 1-14. Country of origin of respondents‟ husbands‟ mothers (Q58)
Muslim Country Other Country
Bangladesh : 8
Egypt : 2
Indonesia : 7
Iraq : 1
Jordan : 3
Malaysia : 5
Pakistan : 59
Palestine : 4
Saudi Arabia : 1
Syria : 1
Turkey : 2
Uzbekistan : 1
Yemen : 1
Ghana : 1
India : 2
Nigeria : 2
Table 1-9. Country of origin of respondents‟ husbands‟ mothers
The religion of respondents‟ mothers-in-law is reported Sunni (Islam) at 79.2% as the
highest, following Shi‟ite 1.7%, and Quran & Sunnah was 0.8%. Other religions such as
Christianity are 2.5%, Buddhism, 1.7% , Hinduism 0.8%, and no religion 12.5%.
Korea,
16.7%
Muslim
country,
79.2%
Other,
4.2%

19
Figure 1-15. Religion of respondents‟ husbands‟ mothers (Q61)
Other
Buddhism : 2
Hindu : 1
Quran&Sunnah : 1
Table 1-10. Religion of respondents‟ husbands‟ mothers (Q61-Others)
Islam(Sunni
), 79.2%
Islam(Shi'it
e), 1.7%
Islam(Other
), 1.7%
Christianity
, 2.5%
No
religion,
12.5%
Other,
2.5%

20
II. Religious Life and Halal Foods
1. Influence of Islam in secondary schools
The survey shows that 53.3% of respondents questioned had attended classes on Islam in
secondary school, while 38.3% had not attended classes on Islam. As influence of education
on Islam in secondary school, 42.5% had eaten Halal or Muslim-friendly lunch ordered or
provided at secondary school and 58.2% of them had eaten Muslim-friendly snacks brought
from home. As a result, 47.5% and 20% of respondents reported that taking Halal (Muslim-
friendly) foods and drinks were “very important” and “important” when they were in
secondary school.
Figure 1-16. Attendance of classes on Islam in secondary school (Q10)
Other Orientation
Christian : 3
Table 1-11. Attendance of classes on Islam in secondary school (Q10-Others)
Islam,
52.1%
Other,
3.4%
No, 44.5%

21
Figure 1-17. Kind of lunch in secondary school (Q13)
응답
frequency Percent
$Q13a
Halal lunch provided from school 50 21.0%
Halal lunch brought from home 48 20.2%
Halal lunch bought from shops 32 13.4%
Halal lunch at home 30 12.6%
Halal lunch at outside 25 10.5%
The Other kind lunch provided from school 17 7.1%
The Other kind lunch brought from home 15 6.3%
The Other kind lunch bought from outside 2 0.8%
The Other kind lunch at home 5 2.1%
The Other kind lunch at outside 4 1.7%
No lunch 7 2.9%
Other 3 1.3%
Sum 238 100.0%
Halal lunch
provided from
school, 21.0%
Halal lunch
brought from
home, 20.2%
Halal lunch
bought from
shops, 13.4%
Halal lunch at
home, 12.6%
Halal lunch at
outside, 10.5%
The Other kind
lunch provided
from school,
7.1%
The Other kind
lunch brought
from home, 6.3%
The Other kind
lunch bought
from outside,
0.8%
The Other kind
lunch at home,
2.1%
The Other
kind lunch
at outside,
1.7%
No lunch, 2.9%
Other, 1.3%

22
Figure 1-18. Kind of snacks in secondary school (Q14)
응답
frequency Percent
$Q14a
Halal snacks brought from home 61 24.9%
Halal snacks bought at school 49 20.0%
Halal snacks bought from outside 35 14.3%
Halal snacks after going back home 31 12.7%
The other kind snacks brought from home 15 6.1%
The other kind snacks bought at school 19 7.8%
The other kind snacks bought from outside 11 4.5%
The other kind snacks after going back home 14 5.7%
No snacks 10 4.1%
Sum 245 100.0%
Halal snacks
brought from
home, 24.9%
Halal snacks
bought at
school, 20.0%
Halal snacks
bought from
outside, 14.3%
Halal
snacks
after going
back home,
12.7%
The
other
kind
snacks
brought
from
home ,
6.1%
The other
kind snacks
bought at
school,
7.8%
The other kind
snacks bought
from outside,
4.5%
The other kind
snacks after
going back
home, 5.7% No snacks,
4.1%

23
Figure 1-19. Importance of Halal (Muslim-friendly) foods and drinks in secondary school
(Q15)
Very
important,
53.3% Important,
20.8%
Not
important,
5.8%
Not
important at
all, 13.3%
Not
applicable(N
on-Muslim),
5.8%

24
2. Family religion and Halal foods
The study shows that respondents with one child and two children both at 33.3% were the
highest. Following with no child was 15.8%. The number of family members of respondents
was highest at three members with 32.5%, four members with 29.2% and two with 15.8%.
According to these results, the majority of respondents have nuclear family including only
family and children.
Graphic 1-2. Children‟s number (Q66)
frequency percent Valid percent accumulate
percent
Valid
0 19 15.8 15.8 15.8
1 40 33.3 33.3 49.2
2 40 33.3 33.3 82.5
3 15 12.5 12.5 95.0
4 5 4.2 4.2 99.2
5 1 0.8 0.8 100.0
Sum 120 100.0 100.0
15.8%
33.3% 33.3%
12.5%
4.2%
0.8%
0.00%
5.00%
10.00%
15.00%
20.00%
25.00%
30.00%
35.00%
0 1 2 3 4 5

25
Number of family
Frequency
0 : 1
1 : 2
2 : 19
3 : 39
4 : 35
5 : 14
6 : 5
7 : 1
8 : 2
10 : 1
14 : 1
Percent
0.8%
1.7%
15.8%
32.5%
29.2%
11.7%
4.2%
0.8%
1.7%
0.8%
0.8%
Table 1-12. Number of family (Q65)
In addition, the menu for daily meals in their family is decided by respondents themselves
at 53.0% and their husbands (partners) at 34.2%. As mentioned above, the religion of the
majority of the respondents and their husbands is Sunni (Islam). As a result, 97.5% of
respondents had eaten halal foods during 2015; 64.2% of respondents eat halal foods every
day, 12.5% reported to eat two or three times a week, 10.0% reported two or three times a
month, 5.8% reported less often, 2.5% reported once a week and 2.5% reported once a month.
Respondents answered the place for consuming halal foods as 38.0% eating halal foods at
their house, 32.8% reported restaurants (dinner) and 16.4% reported their friend‟s house.

26
Figure 1-20. Decision of daily menu
response
frequency percent
$Q110a
Yourself 116 53.0%
Husband (Partner) 75 34.2%
Daughter(s) 10 4.6%
Son(s) 8 3.7%
Mother-in-law 3 1.4%
Mother 1 0.5%
Sister(s)-in-law 1 0.5%
Brother(s)-in-law 1 0.5%
Other relative(s) 1 0.5%
Non-relative(s) 3 1.4%
Sum 219 100.0%
Yourself, 53.0%
Husband
(Partner), 34.2%
Daughter(s), 4.6%
Son(s), 3.7%
Mother-in-
law, 1.4%
Mother, 0.5% Sister(s)-in-
law, 0.5%
Brother(s)-in-
law, 0.5%
Other
relative(s),
0.5%
Non-
relative(s),
1.4%

27
Graphic 1-3. Frequency eating Halal foods (SQ108-1)
Figure 1-21. Places eating Halal foods (SQ108-2)
The results of preferring and meaning of halal foods for respondents are reported 27.4%
religious tradition, 14.3% homeland tradition, 10.9% daily dishes, 11.6% family tradition, 9.0%
personal identity 8.0% certified food, 4.6% heavy dishes, 4.1% convenient food, 3.6%
reported exotic food and 1.9% reported inconvenient food. The results with below 1% were
light dishes, new food and fashionable food.
64.2%
12.5%
2.5% 10%
2.5% 5.8% 2.5%
0.00%
10.00%
20.00%
30.00%
40.00%
50.00%
60.00%
70.00%
At your
house,
38.0%
At your
parents’ or
family’s
house,
9.5%
At your
friend’s
house,
16.4%
At
restaurants
(diners),
32.8%
At work
place or
school,
3.3%

28
Figure 1-22. Meaning of halal foods in respondents (Q126)
Finally, the reasons eating halal foods reported 38.2% religious reasons; following 17.8%
cultural tradition, 14.9% being good for health, 9.8% being surer from sanitary perspective,
8.4% better taste, 3.3% having no other choice, and 4.0% reported inviting some people who
eat halal foods. The reasons below 3% were cheap price and other.
Religious
tradition, 27.4%
Homeland
tradition, 14.3%
Family tradition,
11.6%
Festive dishes,
1.9%
Daily dishes,
10.9%
Heavy dishes,
4.6%
Light
dishes,
1.0%
New food,
1.0%
Exotic
food, 3.6%
Fashionable
food, 0.7%
Convenient
food, 4.1%
Inconvenient
food, 1.9%
Certified
food,
8.00%

29
Figure 1-23. Reasons eating halal food (SQ108-3)
response
frequency percent
$SQ108.3a
Because it is cheaper 2 0.7%
Because it tastes better 23 8.4%
Because it is surer from sanitary perspective 27 9.8%
Because it is good for health 41 14.9%
For religious reasons 105 38.2%
By cultural tradition 49 17.8%
Because there were no other choices 9 3.3%
Because I invited some people who eat Halal foods 11 4.0%
By chance, that I do not mind 6 2.2%
Other 2 0.7%
Sum 275 100.0%
Because it
is cheaper,
0.70%
Because it
tastes better,
8.4%
Because it is
surer from
sanitary
perspective,
9.8%
Because it is
good for
health, 14.9%
For religious
reasons,
38.2%
By cultural
tradition,
17.8%
Because there
were no other
choices, 3.3%
Because I
invited some
people who
eat Halal
foods, 4.0%
By chance,
that I do not
mind, 2.2%
Other , 0.7%

30
3. Preference of Halal foods
The survey shows that 85.8% of the respondents do never take some foods or drinks respect
to religions or cultural traditions. These foods are 26.8% non-Halal or Haram, 26.8%
Korean/Western (traditional), 12.2% products without Halal certification, 4.9%
Korean/Western (fast food/beverage), and 12.2% Halal (fast food/beverage). The majority of
respondents answered that they do not have or drink products without Halal certification and
Haram.
Figure 1-24. Kinds of Islamic taboo foods or drinks (SQ105)
In regards of dishes in everyday life, 45.0% of those who filled the questionnaire
answered preparing homeland dish in daily life, 23.0% of them prepare mixture dish of
homeland and other(s), 20.1% of them prepare Korean/Western dish, 10.0% of them prepare
new/exotic dish, and 1.9% of them prepare other style dish in daily life.
Korean /
Western
(traditional),
26.8%
Korean /
Western (fast
food
beverage),
4.9%
Homeland
(traditional),
9.8% Homeland
(fast
food/beverage
), 4.9%
Halal (Non-
Homeland
style), 2.4%
Halal (fast
food /
beverage),
12.2%
Non-Halal or
Haram, 26.8%
Products
without Halal
certification,
12.2%

31
Figure 1-25. Kinds of dishes in daily life (Q112)
The questionnaire results show that 21.7% of respondents eat fish „two or three times a
month‟, 19.2% of them eat fish two or three times a week, and 17.5% of them eat once a
week and less often. Moreover, 10.8% reported „never‟, 8.3% reported „once a month‟ and 5%
reported „everyday‟.
Graphic 1-4. Frequency eating fish (Q113)
Homeland,
45.0%
Korean /
Western,
20.1%
New/Exotic
, 10.0%
Mixture of
Homeland
and
other(s),
23.0%
Other,
1.9%
5%
19.2% 17.5%
21.7%
8.3%
17.5%
10.8%
0%
5%
10%
15%
20%
25%
Everyday Two or three
times a week
Once a week Two or three
times a
month
Once a
month
Less often Never

32
In regards to frequency of eating meat, 57.5% of respondents answered „two or three times
a week‟ and 18.3% of them answered „every day‟, other answers are 15.8% „once a week‟,
5.8% „two or three times a month‟, 1.7% „less often‟, and 0.8% „never‟. The preference rate
of meat was reported that 36.1% of respondents like chicken, 32.6% beef or veal, 27.9%
mutton or lamb, 1.9% other poultry and 1.6% other such as duck. In general, it shows that
respondents prefer meat to fish.
Graphic 1-5. Frequency eating meat (Q114)
Figure 1-26. Preference rate of meat (SQ114-1)
18.3%
57.5%
15.8%
5.8% 1.7% 0.8%
0.00%
10.00%
20.00%
30.00%
40.00%
50.00%
60.00%
70.00%
Everyday Two or three
times a week
Once a week Two or three
times a month
Less often Never
Mutton/L
amb,
27.9%
Beef/Veal
, 32.6%
Chicken,
36.1%
Other
Poultry,
1.9%
Other,
1.6%

33
Finally, the study shows that 46.7% of respondents eat snacks „every day‟ and then 27.5%
of them eat snacks „two or three times a week‟. The majority of respondents reported that
they eat snacks „more than two or three times a week‟. The kinds of favorite snacks reported
with 21.5% is fruits and vegetables, 17.4% nuts, grains and beans, 12.4% dairy products, 9.8%
Homeland (traditional) snacks, 8.2% products with Halal certification, 7.8% Halal (Non-
Turkish), 7.6% Halal (Fast food) snacks, 5.4% Korean/Western (fast food), 5.0% Homeland
(fast food), 3.5% Korean/Western (traditional) snacks and 1.5% products without Halal
certification. In addition, the kinds of favorite drinks respondents like to drink in daily life is
reported with 25.6% juice (and related), 22.4% hot drinks, 15.9% both carbonated drinks and
mineral water, 19.1% milk (and related) and 1.2% reported other.
Graphic 1-6. Frequency eating snacks (Q115)
46.7%
27.5%
7.5%
3.3% 2.5%
6.7% 5.8%
0.00%
5.00%
10.00%
15.00%
20.00%
25.00%
30.00%
35.00%
40.00%
45.00%
50.00%
Everyday Two or three
times a
week
Once a weekTwo or three
times a
month
Once a
month
Less often Never

34
Figure 1-27.Kinds of favorite snacks (SQ115-2)
response
frequency percent
$SQ115.2a
Fruits and vegetables 72 29.0%
Nuts, grains and beans 43 17.3%
Dairy products 29 11.7%
Homeland (traditional) 27 10.9%
Homeland (fast food) 5 2.0%
Korean / Western (traditional) 8 3.2%
Korean / Western (fast food) 16 6.5%
Halal (Non-Turkish) 14 5.6%
Halal (fast food) 11 4.4%
Products with Halal certification 19 7.7%
Products without Halal certification 3 1.2%
Other 1 0.4%
Sum 248 100.0%
Fruits and
vegetables,
29.0%
Nuts, grains
and beans,
17.3%
Dairy products,
11.7% Homeland
(traditional),
10.9%
Homeland (fast
food), 2.0%
Korean /
Western,
3.2%
Korean /
Western (fast
food), 6.5%
Halal (Non-
Turkish), 5.6%
Halal (fast
food), 4.4%
Products with
Halal
certification,
7.7%
Products
without Halal
certification,
1.2%
Other, 0.4%

35
4. Use of Halal market and Halal restaurant
4.1 Use of Halal market
The questions asked to respondents about the frequency of shopping to determine use of
halal market is reported 52.5% go grocery shopping once a week, 23.3% go grocery shopping
two or three times a week, 15.0% go two or three times a month, 5.8% go every day, and last
3.3% go once a month or less often.
Graphic 1-7. Frequency shopping grocery (Q117)
It is stated in the survey that one of the products bought from the grocery is halal meat.
According to the results, 68.3% of respondents buy Halal meat „always‟, 8.3% of them buy it
„most of the time‟, 11.7% „depends on the situation‟, 5.8% „occasionally‟, and 5.8% „never‟.
In other words, the majority of respondents answered that they prefer to buy Halal meat
„always‟ or „most of the time‟. Moreover, when respondents bought Halal meat, 54.2% of
respondents „always‟ and 26.7% of them „most of the time‟ checked the Halal sign or logo
inside or outside the store. It means that the majority of respondents tended to check the Halal
sign or logo inside or outside the store when they buy Halal meat.
The places preferred to buy „halal meat‟ or „meat‟ reported at the highest share Halal
grocers; following 31.0% Halal butchers, 31.4% Halal grocers, 10.0% Homeland‟s butchers,
12.4% Homeland‟s grocers, 8.1% Korean grocers, 2.4% Homeland‟s supermarkets, 1.9%
Korean butchers, 2.4% Korean supermarkets and 0.5% other such as vegetarian.
5.8%
23.3%
52.5%
15%
3.3%
0
10
20
30
40
50
60
Everyday Two or three times
a week
Once a week Two or three times
a month
Once a month

36
Graphic 1-8. Frequency buying halal meats (Q119)
Graphic 1-9. Frequency checking the Halal sign or logo for halal meat (SQ121-1)
68.3%
8.3% 11.7%
5.8% 5.8%
0
10
20
30
40
50
60
70
80
Always Most of the time Depends on the
situation
Occasionally Never
54.2%
26.7%
5.8% 6.7% 2.5% 0.8%
0.00%
10.00%
20.00%
30.00%
40.00%
50.00%
60.00%

37
Figure 1-28. Places buying Halal meat (SQ119-1)
The survey shows that 35.8% of respondents, in case of non-meat grocery, buy Halal
grocery „always‟ and 19.2% of them buy it „most of time‟. On the other hand, 27.5% reported
„depends on the situation‟, 10.8% reported „occasionally‟ and 6.7% reported „never‟. About
half of respondents tended to buy Halal grocery „always or most of time‟ when they buy non-
meat grocery.
Moreover, 60.8% of respondents „always‟ and 15.0% of them „most of the time‟ check the
Halal label or logo on the package when they buy processed foods. In other words, the
majority of respondents „always or most of time‟ checked the Halal label or logo on the
package when they bought processed. The places to buy Halal (non-meat) grocery are Halal
grocers at 40.3% with the highest share; following 17.4% Homeland‟s grocers, 15.3% Korean
supermarket, 14.4% Korean grocers, 12.3% Homeland‟s supermarkets and 0.4% other. The
respondents tend to buy mostly Halal (non-meat) grocery and processed food „always‟
checking the Halal label or logo, although they prefer Halal grocers most of the time.
At homeland’s
butchers
10%
At Halal
butchers
31%
At Korean
butchers
2%
At
Homeland’s
grocers
12%
At Halal
grocers
31%
At Korean
grocers
8%
At
Homeland’s
supermarkets
3%
At Korean
supermarkets
2% Other
1%

38
Graphic 1-10. Frequency buying Halal grocery (non-meat) (Q120)
Graphic 1-11. Frequency checking the Halal label or logo on the package (processed food)
(SQ121-2)
35.8%
19.2%
27.5%
10.8%
6.7%
0.00%
5.00%
10.00%
15.00%
20.00%
25.00%
30.00%
35.00%
40.00%
Always Most of the time Depends on the
situation
Occasionally Never
60.8%
15% 9.2% 7.5%
3.3% 0.8%
0
10
20
30
40
50
60
70

39
Figure 1-29. Places buying other Halal grocery (non-meat) (SQ120-1)
4.2 Use of Halal restaurant
The survey shows that 35.8% of respondents tend to use „less often‟ Halal restaurants
(cafeterias) with the Halal sign or logo. Others reported the use of Halal restaurants with 25.8%
„once a month‟, 24.2% „two or three times a month‟, 5.8% „twice or more a week and once a
week‟, and 1.7% „never‟
Graphic 1-12. Frequency eating at Halal restaurants (cafeterias) (Q123)
At
Homeland’s
grocers,
19.1%
At Halal
grocers,
40.9% At Korean
grocers,
14.3%
At
Homeland’s
supermarket
s, 10.0%
At Korean
supermarket
s, 15.2%
Other, 0.4%
5.8% 6.7%
24.2% 25.8%
35.8%
1.7%
0
5
10
15
20
25
30
35
40
Twice or more
a week
Once a week Two or three
times a month
Once a month Less often Never

40
5. Recognition about Halal foods and its consumption
In the study is stated that the recognition about Halal is related to religion, personal choice,
taste and health. According to this, 65.8% and 20.8% of respondents „totally agreed‟ and
„agreed‟ that eating Halal meat is something they do to obey their religion. 43.3% and 20.8%
of respondents „totally agreed and agreed‟ that eating Halal meat is a personal choice. 42.5%
and 14.2% of respondents who answered „totally agreed and agreed‟ think that Halal meat has
better taste than non-Halal meat, where else 30.8% of respondents „neither agreed nor
disagreed‟ and 10.8% „disagreed‟ on it. 55.0% and 17.5% of respondents questioned stated
„totally agreed and agreed‟ that Halal meat is healthier. 60.8% and 20.0% shares of
respondents „totally agreed and agreed‟ that Islamic slaughter is less painful to animals.
Graphic 1-13. Halal meat meals as a religious obligation (Q125a)
Graphic 1-14. Halal meat meals as a personal choice (Q125b)
65.8%
20.8%
9.2%
1.7% 2.5%
0
10
20
30
40
50
60
70
Totally agree Agree Neither agree nor disagree Disagree Totally disagree
43.3%
20.8%
13.3% 12.5% 10%
0
10
20
30
40
50
Totally agree Agree Neither agree nor
disagree
Disagree Totally disagree

41
Graphic 1-15. Taste of Halal meat is better than non-halal meat (Q125c)
Graphic 1-16. Healthy food as a halal meat (Q125d)
42.5%
14.2%
30.8%
10.8%
1.7%
0
5
10
15
20
25
30
35
40
45
Totally agree Agree Neither agree nor
disagree
Disagree Totally disagree
55%
17.5% 20.8%
5% 1.7%
0
10
20
30
40
50
60
Totally agree Agree Neither agree nor
disagree
Disagree Totally disagree

42
Graphic 1-17. Islamic slaughter is less painful to animals (Q125e)
In regards to consumption of Halal products, 27.5% and 23.3% of respondents „totally
agreed and agreed‟ that Halal products are readily available, while 19.2% and 11.7% of
respondents „disagreed and totally disagreed‟ on it. 20.8% and 20.8% of respondents „totally
agreed and agreed‟ that there are a lot of choices in Halal products, while 27.5% and 12.5%
of respondents „disagreed and totally disagreed‟ on it. In relation to prices of Halal products,
33.3% and 27.5% of respondents „totally agreed and agreed‟ that Halal products are more
expensive than other food products, while 11.7% and 2.5% of them „disagreed and totally
disagreed‟. In regards to sufficient information available on Halal products, 22.5% reported
„totally agree‟, 25.8% reported „agree‟, 29.2% reported „neither agree nor disagree‟, 19.2%
reported „disagree‟ and 3.3% reported „totally disagree‟.
Graphic 1-18. Halal products are readily available (Q125f)
60.8%
20% 18.3%
0.8%
0
10
20
30
40
50
60
70
Totally agree Agree Neither agree nor
disagree
Disagree
27.5%
23.3%
18.3% 19.2%
11.7%
0
5
10
15
20
25
30
Totally agree Agree Neither agree nor
disagree
Disagree Totally disagree

43
Graphic 1-19. Various Option of Halal products (Q125g)
Graphic 1-20. Halal food is more expensive than others (Q125h)
20.8% 20.8%
18.3%
27.5%
12.5%
0
5
10
15
20
25
30
Totally agree Agree Neither agree nor
disagree
Disagree Totally disagree
33.3%
27.5%
25%
11.7%
2.5%
0
5
10
15
20
25
30
35
Totally agree Agree Neither agree nor
disagree
Disagree Totally disagree

44
Graphic 1-21. Sufficient information about Halal products in Korea (Q125i)
III. Adaptation to Life in Korea
1. Observance of Islamic duties/rules in Korea
The share of respondents who followed Islamic duties/rules „fairly strictly and very strictly‟
are 28.3% and 41.7%, while 26.7% of them do not practice Islamic duties/rules „strictly‟, 2.5%
do not follow it at all and 0.8% are non-Muslim. On the other hand, 29.2% and 34.2% of
respondents‟ husbands reported „fairly strict and very strict‟ observance of Islamic
duties/rules. 20.8% of them do not fulfill Islamic duties/rules „strictly‟, 7.5% do not follow it
at all and 8.3% are non-Muslim. As a result, the majority of respondents and their husbands
showed „fairly strict or very strict‟ observance of Islamic duties/rules
22.5%
25.8%
29.2%
19.2%
3.3%
0
5
10
15
20
25
30
35
Totally agree Agree Neither agree nor
disagree
Disagree Totally disagree

45
Graphic 1-22. Observance of Islamic rules of respondents (Q98)
Graphic 1-23. Observance of Islamic rules of husbands (Q99)
28.3%
41.7%
26.7%
2.5% 0.8%
0
5
10
15
20
25
30
35
40
45
Very strictly Fairly strictly Not strictly Not at all Not applicable(No
religion)
29.2%
34.2%
20.8%
7.5% 8.3%
0
5
10
15
20
25
30
35
40
Very strictly Fairly strictly Not strictly Not at all Not applicable(No
religion)

46
1.1 Worship at mosque
According to the research, 32.5% of respondents visited a mosque or attended religious
services once a week or more. Next, 24.2% of respondents reported „seldom‟, 18.3% reported
„once or twice a month‟, 15.8% reported „only on religious holidays‟, 4.2% reported being
non-Muslim and 5.0% reported „never‟. 54.2% of respondents‟ husbands also visited a
mosque or attended religious services „once a week or more‟. Next, 15.0% of respondents
reported „once or twice a month‟, 12.5% reported „only on religious holidays‟, 7.5% reported
„seldom‟, 6.7% reported being „non-Muslim‟ and 4.2% reported „never‟. It shows that
married men worshiped at mosque more frequently than married women.
Graphic 1-24. Frequency visiting a mosque by respondents (Q94)
Graphic 1-25. Frequency visiting a mosque by husbands (Q95)
32.5%
18.3% 15.8%
24.2%
5% 4.2%
0
5
10
15
20
25
30
35
Once a week or
more
Once or twice a
month
Only on
religious
holidays
Seldom Never Not
applicable(No
religion)
54.2%
15% 12.5%
7.5% 4.2%
6.7%
0
10
20
30
40
50
60
Once a week or
more
Once or twice a
month
Only on
religious
holidays
Seldom Never Not
applicable(No
religion)
47
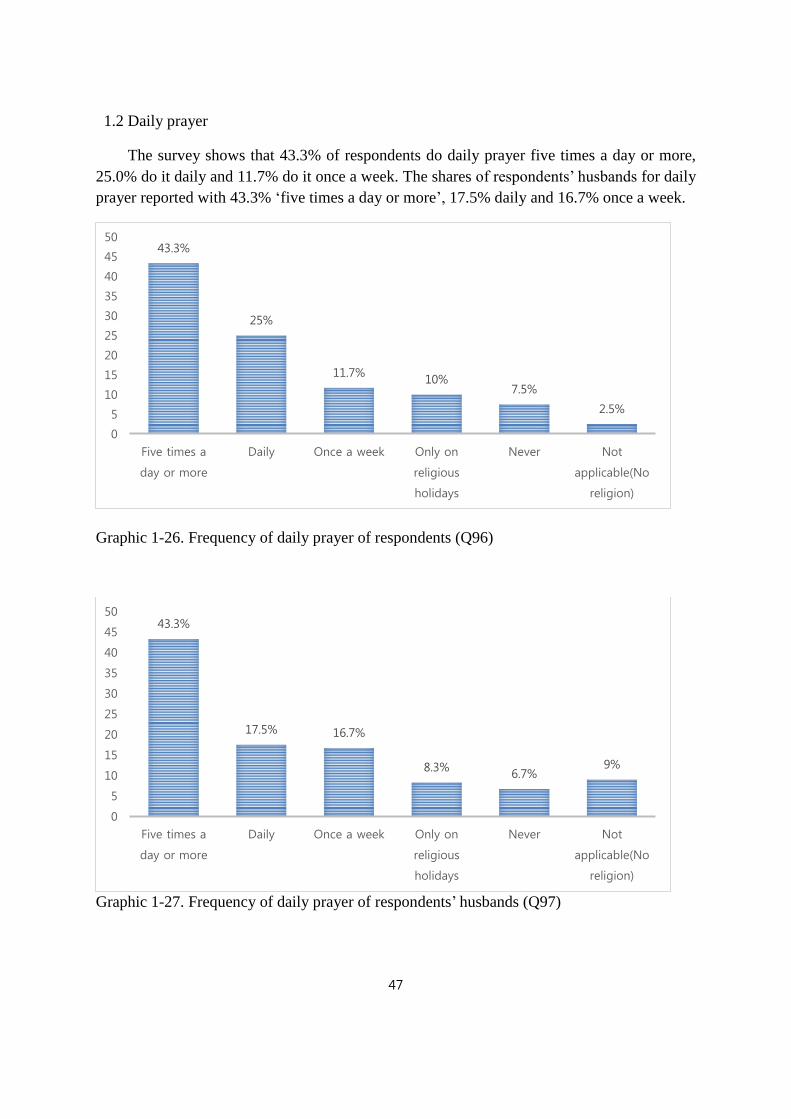
1.2 Daily prayer
The survey shows that 43.3% of respondents do daily prayer five times a day or more,
25.0% do it daily and 11.7% do it once a week. The shares of respondents‟ husbands for daily
prayer reported with 43.3% „five times a day or more‟, 17.5% daily and 16.7% once a week.
Graphic 1-26. Frequency of daily prayer of respondents (Q96)
Graphic 1-27. Frequency of daily prayer of respondents‟ husbands (Q97)
43.3%
25%
11.7% 10%
7.5%
2.5%
0
5
10
15
20
25
30
35
40
45
50
Five times a
day or more
Daily Once a week Only on
religious
holidays
Never Not
applicable(No
religion)
43.3%
17.5% 16.7%
8.3% 6.7%
9%
0
5
10
15
20
25
30
35
40
45
50
Five times a
day or more
Daily Once a week Only on
religious
holidays
Never Not
applicable(No
religion)

48
1.3 Headscarf
The research shows that 66.7% of woman respondents reported that they were wearing a
headscarf outside the house, while 33.3% of them answered that they were not. The answers
for reasons of wearing a headscarf reported as a religious obligation at 38.1% with the highest
rate, following 19.3% „free and personal choice‟, 13.3% „important part of Muslim identity in
Korea‟, 9.4% „homeland‟s tradition‟, 8.8% „convenience‟, 5.5% „avoidance of gossip and
disrespectful behaviors‟, 4.4% reported being fashionable and 1.1% reported reinforcement
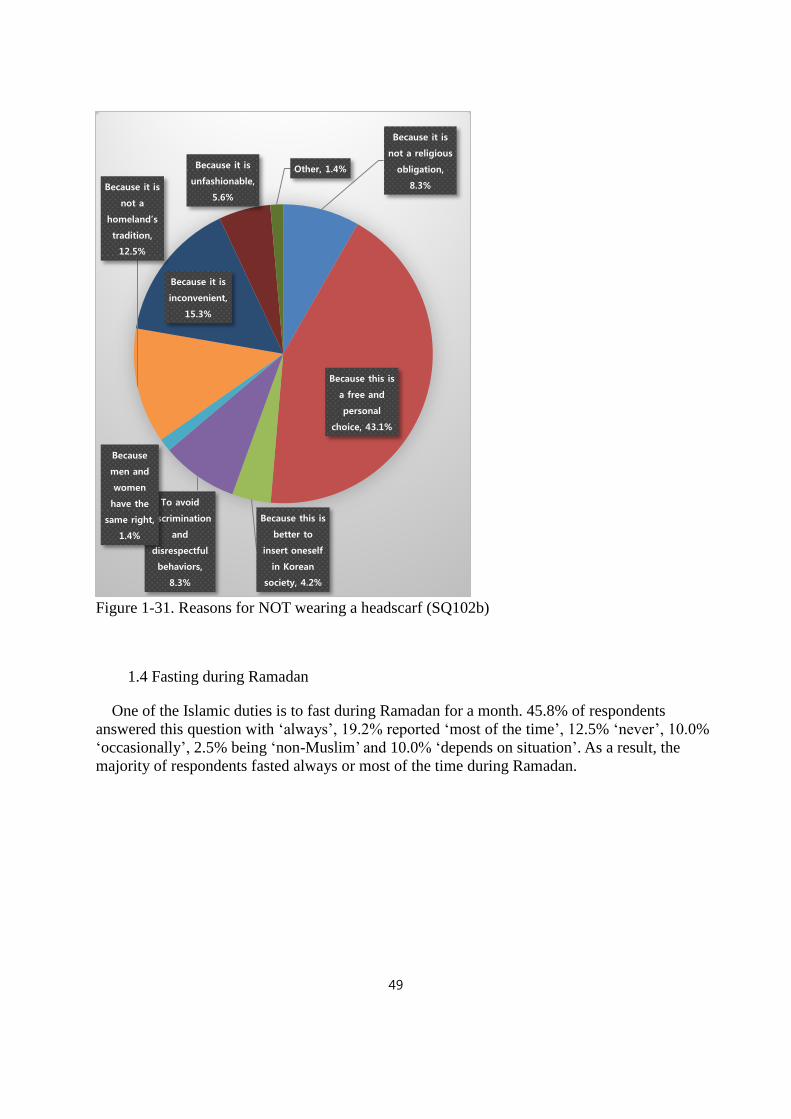
of trust in the family. On the other hand, reasons for NOT wearing a headscarf were highest
„free and personal choice‟ at 43.1%; following 15.3% inconvenience, 8.3% both religious
obligation and avoidance of discrimination and disrespectful behaviors, 12.5% homeland‟s
tradition, 5.6% unfashionable, 4.2% being better to insert oneself in Korean society, and 1.4%
both that men and women have the same right and other.
Figure 1-30. Reasons for wearing a headscarf (SQ102a)
Because it is a
religious
obligation,
38.1%
Because this is
a free and
personal
choice, 19.3%
Because this is
an important
part of Muslim
identity in
Korea, 13.3%
To avoid
gossip and
disrespectful
behaviors,
5.5%
To reinforce
trust in the
family, 1.1%
Because it is a
homeland’s
tradition, 9.4%
Because it is
convenient,
8.8%
Because it is a
fashionable,
4.4%
49
Figure 1-31. Reasons for NOT wearing a headscarf (SQ102b)
1.4 Fasting during Ramadan
One of the Islamic duties is to fast during Ramadan for a month. 45.8% of respondents
answered this question with „always‟, 19.2% reported „most of the time‟, 12.5% „never‟, 10.0%
„occasionally‟, 2.5% being „non-Muslim‟ and 10.0% „depends on situation‟. As a result, the
majority of respondents fasted always or most of the time during Ramadan.
Because it is
not a religious
obligation,
8.3%
Because this is
a free and
personal
choice, 43.1%
Because this is
better to
insert oneself
in Korean
society, 4.2%
To avoid
discrimination
and
disrespectful
behaviors,
8.3%
Because
men and
women
have the
same right,
1.4%
Because it is
not a
homeland’s
tradition,
12.5%
Because it is
inconvenient,
15.3%
Because it is
unfashionable,
5.6%
Other, 1.4%

50
Figure 1-32. Frequency fasting during Ramadan (Q103)
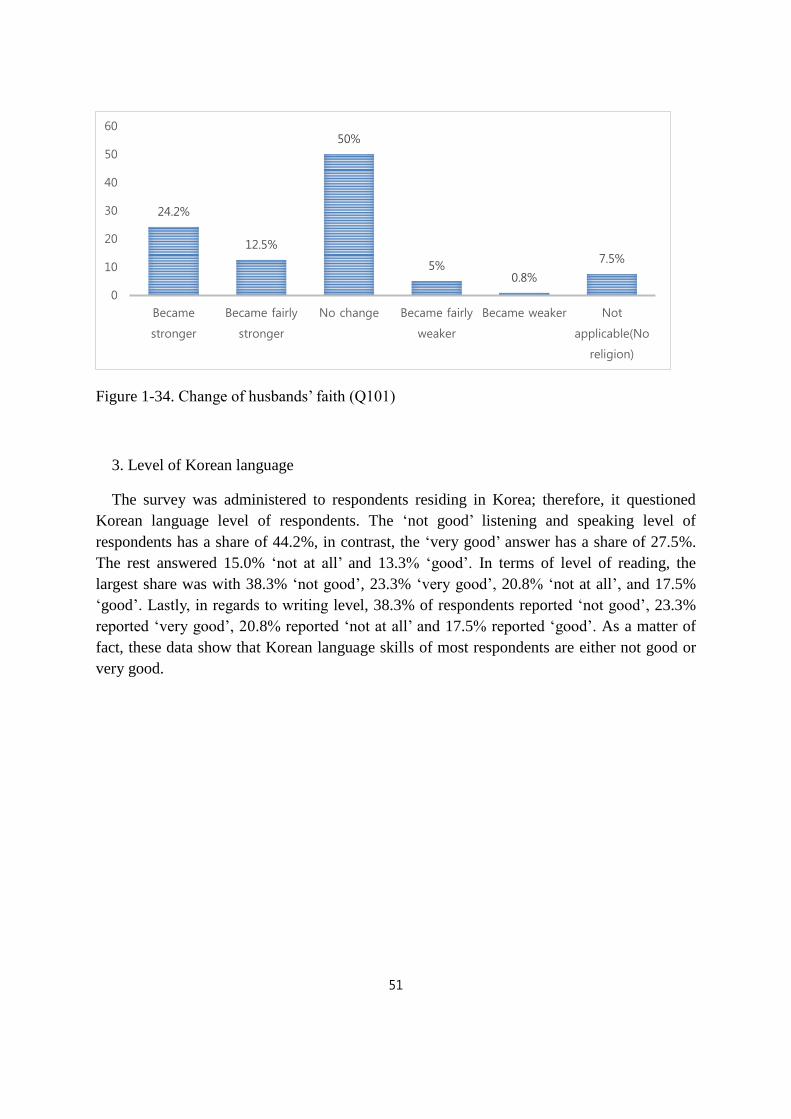
2. Change in religious faith
It was asked to respondents if there was any change in their religious faith after having a
child. 40.0% of respondents reported that their religious faith did not change after having a
child, 29.2% and 18.3% reported that their religious faith became stronger and fairy stronger
after having a child. In the case of respondents‟ husbands, 51.3% reported no change in their
religious faith after having a child, where else 19.3% and 15.1% reported that their religious
faith became stronger and fairy stronger after having a child. In conclusion, respondents and
their husbands showed that their religious faith did not change or become stronger after
having a child.
Figure 1-33. Change of respondents‟ faith (Q100)
45.8%
19.2%
10% 10% 12.5%
2.5%
0
5
10
15
20
25
30
35
40
45
50
29.2%
18.3%
40%
3.3% 5.8% 3.3%
0
10
20
30
40
50
Became
stronger
Became fairly
stronger
No change Became fairly
weaker
Became weaker Not
applicable(No
religion)
51
Figure 1-34. Change of husbands‟ faith (Q101)
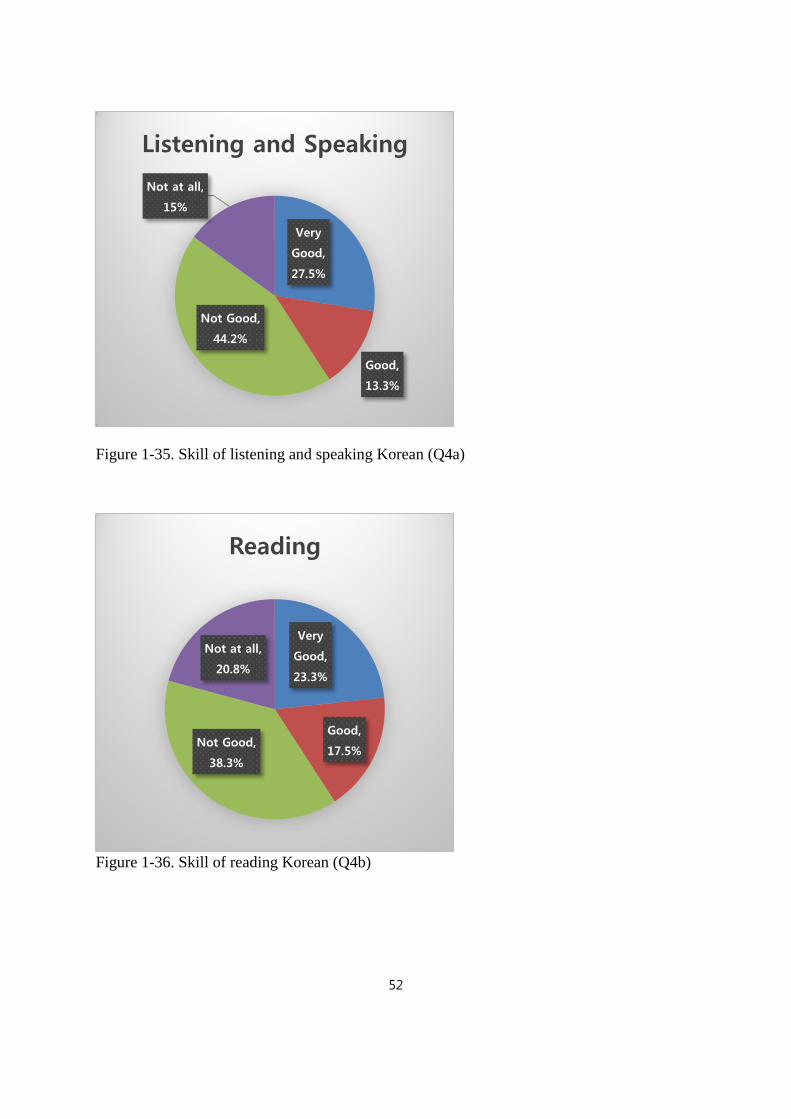
3. Level of Korean language
The survey was administered to respondents residing in Korea; therefore, it questioned
Korean language level of respondents. The „not good‟ listening and speaking level of
respondents has a share of 44.2%, in contrast, the „very good‟ answer has a share of 27.5%.
The rest answered 15.0% „not at all‟ and 13.3% „good‟. In terms of level of reading, the
largest share was with 38.3% „not good‟, 23.3% „very good‟, 20.8% „not at all‟, and 17.5%
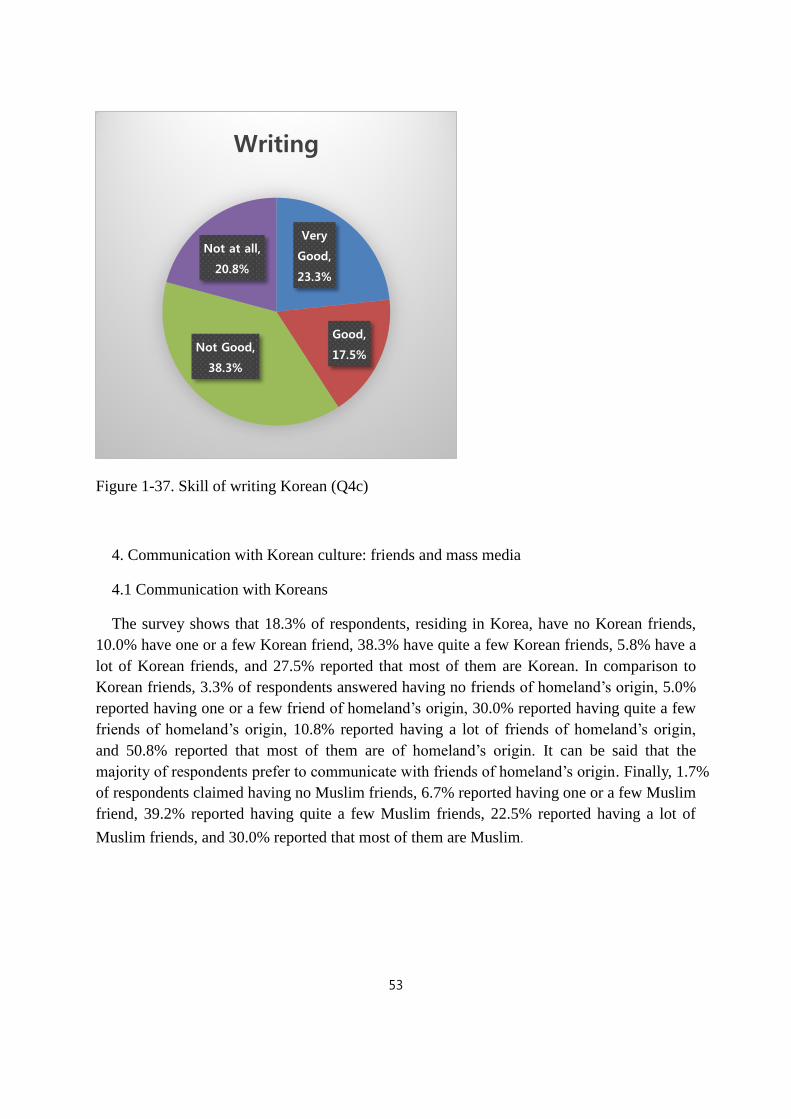
„good‟. Lastly, in regards to writing level, 38.3% of respondents reported „not good‟, 23.3%
reported „very good‟, 20.8% reported „not at all‟ and 17.5% reported „good‟. As a matter of
fact, these data show that Korean language skills of most respondents are either not good or
very good.
24.2%
12.5%
50%
5% 0.8%
7.5%
0
10
20
30
40
50
60
Became
stronger
Became fairly
stronger
No change Became fairly
weaker
Became weaker Not
applicable(No
religion)
52
Figure 1-35. Skill of listening and speaking Korean (Q4a)
Figure 1-36. Skill of reading Korean (Q4b)
Very
Good,
27.5%
Good,
13.3%
Not Good,
44.2%
Not at all,
15%
Listening and Speaking
Very
Good,
23.3%
Good,
17.5% Not Good,
38.3%
Not at all,
20.8%
Reading
53
Figure 1-37. Skill of writing Korean (Q4c)
4. Communication with Korean culture: friends and mass media
4.1 Communication with Koreans
The survey shows that 18.3% of respondents, residing in Korea, have no Korean friends,
10.0% have one or a few Korean friend, 38.3% have quite a few Korean friends, 5.8% have a
lot of Korean friends, and 27.5% reported that most of them are Korean. In comparison to
Korean friends, 3.3% of respondents answered having no friends of homeland‟s origin, 5.0%
reported having one or a few friend of homeland‟s origin, 30.0% reported having quite a few
friends of homeland‟s origin, 10.8% reported having a lot of friends of homeland‟s origin,
and 50.8% reported that most of them are of homeland‟s origin. It can be said that the
majority of respondents prefer to communicate with friends of homeland‟s origin. Finally, 1.7%
of respondents claimed having no Muslim friends, 6.7% reported having one or a few Muslim
friend, 39.2% reported having quite a few Muslim friends, 22.5% reported having a lot of
Muslim friends, and 30.0% reported that most of them are Muslim.
Very
Good,
23.3%
Good,
17.5% Not Good,
38.3%
Not at all,
20.8%
Writing

54
Figure 1-38. Friends of Korean origin (Q80)
Figure 1-39. Friends of homeland‟s origin (Q81)
None,
18.3%
One or
a few,
10%
Quite a
few, 38.3% A large
number of
them, 5.8%
Most of
them,
27.5%
None
3.3%
One or a
few
5%
Quite a few
30%
A large
number of
them
10.8%
Most of
them
50.8%

55
Figure 1-40. Muslim friends (Q83)
4.2 Contact with mass media
The questioners were asked how long they watch Korean TV or Islamic TV programs. 40.8%
of respondents reported „never‟ watched Korean television and 31.7% of them watched it for
„1-9 hours per week‟, 13.3% reported „10-19 hours per week‟, 5.0% reported „20-29 hours
per week‟ and 9.2% reported „30 hours or more per week‟. On the other hands, 35.0% of
respondents answered „never‟ watched Islamic television, and 41.7% of them watched it for
„1-9 hours per week‟. 15.8% reported „10-19 hours per week‟, 5.0% reported „20-29 hours
per week‟ and 2.5% reported „30 hours or more per week‟. It shows that the majority of
respondents watch Korean and Islam television program below 1-9 hours a week. It shows
that the majority of respondents watch Korean and Islam television program below 1-9 hours
a week.
None,
1.7%
One or a
few, 6.7%
Quite a
few, 39.2% A large
number
of them,
22.5%
Most of
them, 30%

56
Graphic 1-28. Hours watching Korean television (Q86)
Graphic 1-29. Hours watching Islamic television program (Q87)
5. Satisfactory level of overall life
The survey shows that 38.3% respondents are „very satisfied‟ with their overall life in Korea
and 50.8% reported being „satisfied‟. A share of 8.3% reported being „not satisfied‟, and only
2.5% reported being „not at all satisfied‟ with their overall life in Korea. We can see that over
89.2% of respondents are either „satisfied or extremely satisfied‟ with their overall life in
Korea.
40.8%
31.7%
13.3%
5%
9.2%
0
5
10
15
20
25
30
35
40
45
0 hour(never) 1-9 hours 10-19 hours 20-29 hours 30 hours or
more
35%
41.7%
15.8%
5% 2.5%
0
5
10
15
20
25
30
35
40
45
0 hour(never) 1-9 hours 10-19 hours 20-29 hours 30 hours or more

57
Graphic 1-30.Satisfactory level of overall life (Q91)
6. Adaptation to Korean culture
The respondents residing in Korea answered to adaptation to Korean culture question with
a share of 44.2% „agreed‟ that outside home they want to adopt the Korean culture and way
of life as much as possible. 18.3% of respondents reported „neither agree nor disagree‟ and
37.5% reported „disagree‟ to adapt Korean culture and way of life outside home. In addition,
35.0% of respondents „agreed‟ that at home they want to adopt Korean culture and way of life
as much as possible. Only 16.7% reported „neither agree nor disagree‟ and 48.3% reported
„disagree‟ to adopt Korean culture and way of life at home.
Graphic 1-31.Adaptation Korean culture outside home (Q92a)
38.3%
50.8%
8.3%
2.5%
0
10
20
30
40
50
60
Very satisfied Satisfied Not satisfied Not satisfied at all
20.8%
23.3%
18.3%
27.5%
10%
0
5
10
15
20
25
30
Totally agree Agree Neither agree nor
disagree
Disagree Totally disagree

58
Graphic 1-32.Adaptation Korean culture at home (Q92b)
On the other hand, 58.3% of respondents „agreed‟ that outside home, they want to maintain
the homeland‟s culture and way of life as much as possible, 30.0% reported „neither agree nor
disagree‟ and 11.7% reported „disagree‟. Moreover, 65.8% of respondents agreed that at
home they want to maintain the homeland‟s culture and way of life as much as possible,
where else 28.3% reported „neither agree nor disagree‟ and 5.8% reported „disagree‟.
Graphic 1-33.Maintenance of homeland culture outside home (Q92c)
15.8%
19.2% 16.7%
33.3%
15%
0
5
10
15
20
25
30
35
Totally agree Agree Neither agree nor
disagree
Disagree Totally disagree
24.2%
34.2%
30%
5% 6.7%
0
5
10
15
20
25
30
35
40
Totally agree Agree Neither agree nor
disagree
Disagree Totally disagree

59
Graphic 1-34.Maintenance of homeland culture at home (Q92d)
Finally, 70.0% of questioned respondents „agreed‟ that outside home, they want to maintain
the Islamic culture and way of life as much as possible, where else 21.7% reported „neither
agree nor disagree‟ and 8.3% reported „disagree‟. In addition, 75.0% of respondents „agreed‟
that at home they want to maintain the Islamic culture and way of life as much as possible,
and 19.2% reported „neither agree nor disagree‟ and 5.8% reported „disagree‟.
Graphic 1-35.Maintenance of Islamic culture outside home (Q92e)
39.2%
26.7% 28.3%
3.3% 3%
0
5
10
15
20
25
30
35
40
45
Totally agree Agree Neither agree nor
disagree
Disagree Totally disagree
35.8% 34.2%
21.7%
5.8%
2.5%
0
5
10
15
20
25
30
35
40
Totally agree Agree Neither agree nor
disagree
Disagree Totally disagree

60
Graphic 1-36.Maintenance of Islamic culture at home (Q92f)
7. Identity of Muslim housewives in Korea
The research shows that Muslim housewives‟ answers to Korean identity is 34.2% of them
feel Korean „strongly‟, 20.0% of them feel Korean „not strongly and not weakly‟ and 45.8%
of them feel Korean „weakly. In comparison, identity as homeland‟s people, 79.2% of
respondents were feeling homeland‟s people „strongly, 10.8% of them were feeling
homeland‟s people „not strongly and not weakly, and 10.0% of them were feeling homeland‟s
people „weakly‟. In regards of identity as Muslim, 71.7% of respondents were feeling Muslim
„strongly‟, 17.5% of them were feeling Muslim „not strongly and not weakly‟, and 10.8% of
them were feeling Muslim „weakly‟. It shows that identity as homeland‟s people is the
strongest feeling among Muslim immigrants in Korea.
45%
30%
19.2%
3.3% 2.5%
0
5
10
15
20
25
30
35
40
45
50
Totally agree Agree Neither agree nor
disagree
Disagree Totally disagree

61
Graphic 1-37. Identity as Korean (Q88)
Graphic 1-38. Identity as homeland‟s people (Q89)
21.7%
12.5%
20%
15%
30.8%
0
5
10
15
20
25
30
35
Very strongly Strongly Not strongly not
weakly
Weakly Very weakly
59.2%
20%
10.8%
6.7% 3.3%
0
10
20
30
40
50
60
70
Very strongly Strongly Not strongly not
weakly
Weakly Very weakly

62
Graphic 1-39. Identity as Muslim (Q90)
51.7%
20% 17.5%
5.8% 5%
0
10
20
30
40
50
60
Very strongly Strongly Not strongly not
weakly
Weakly Very weakly

63
SURVEY RESULTS OF STUDENTS
I. General Conditions
1. Age of respondents
The survey was performed on 120 respondents residing in Korea. The study shows that
58.3% of respondents are in their twenties, 26.7% are in their thirties, 12.5% are teenagers
and 2.5% are in their forties. The majority of the respondents are in their twenties and over
thirties.
Figure 2-1. Age of respondents(Q2)
2. Country of origin
The survey determined that the country of origin of respondents is 5.8% Korea, 87.5%
Muslim countries and the other countries 6.7%, except Korea and Muslim countries. It can be
seen from the study that Pakistan at 30.8% is the highest. Following Pakistan, 20.8% reported
Uzbekistan, 10% reported Oman, 9.2% reported Turkey, and 5.8% reported both Korea and
Indonesia. Countries below 5% share are Bangladesh, Egypt, Kazakhstan, Malaysia, India,
Saudi Arabia, Liberia, Libya, Brunei, Sudan, Afghanistan, Chechen, Singapore and Sri Lanka.

64
Table 2-1. Country of Origin of respondents
Country of origin Frequency Percent
Pakistan 37 30.8
Uzbekistan 25 20.8
Oman 12 10
Turkey 11 9.2
Korea 7 5.8
Indonesia 7 5.8
Malaysia 4 3.3
Brunei 3 2.5
Kazakhstan 2 1.7
Liberia 2 1.7
Bangladesh 1 0.8
Egypt 1 0.8
India 1 0.8
Saudi Arabia 1 0.8
Libya 1 0.8
Sudan 1 0.8
Afghanistan 1 0.8
Chechen 1 0.8
Singapore 1 0.8
Sri Lanka 1 0.8
Total 120 100

65
Graphic 2-1. Origin of respondents‟ country (Q3)
3. Marital status
The survey shows that 77.5% of student respondents‟ marital status is „never married‟, 16.7%
„married (spouse present)‟, 2.5% „married (spouse absent)‟, and 1.7% both „cohabiting
(with a registered partner)‟ and „divorced‟.
4. Length of stay
The answer of respondents to their length of stay in Korea has been as following; 58.4%
reported having lived in Korea for less than two years, 29.7% reported having lived in Korea
between three to five years, 2.0% reported having lived in Korea between six to ten years, 7.9%
reported having lived in Korea between ten to fifteen years, and 2% reported having lived in
Korea for twenty or more years.

66
Figure 2-2. Length of stay in Korea (Q2, SQ3)
5. Level of education
According to the survey, majority of respondents had completed at least high school,
university, or graduate study as their highest level of education. 59.2% of respondents
reported having completed the second level of secondary (general/ASO), 19.2% reported
having completed higher tertiary (university) as their highest level of education, 10.8%
reported having completed elementary, 3.3% reported having completed the second level of
secondary (vocational/BSO), 1.7% reported having completed the second level of secondary
(technical or artistic/TSO or KSO), 2.5% reported having completed lower tertiary (non-
university/high school) or higher post-secondary, 2.5% reported having completed middle
school and 0.8% reported having no diploma.

67
Graphic 2-2. Level of education (Q9)
6. Current occupation
The survey stated that 36.7% of respondents were currently employed (including part-
time jobs), while 63.3% of respondents were full-time housewives. Among employed
respondents, 8.3% were having part-time job and 25.8% were employed. Accordingly, 27.3%
of employed respondents were working in industry production, 18.2% education. A share
below 10% is bank/insurance, construction, agriculture/fishing,
transportation/communication, restaurant/hotel/bar, commercial services and (health) care.
Finally, 2.5% of respondents were self-employed.
Table 2-2.Current occupation
Current occupation Frequency Percent
Industry production 15 27.3
Education 10 18.2
Other services 8 14.5
Retail/stores/market 6 10.9
Agriculture/fishing 4 7.3
Restaurant, hotel and bar 4 7.3
Commercial services 3 5.5
Bank/insurance 2 3.6
Construction 1 1.8
Transportation and communication 1 1.8
(Health) care 1 1.8
Total 120 100

68
Graphic 2-3. Current occupation (SQ29-2)
7. Religion
The religion of respondents had the highest share with 76.7% in Sunni (Islam). Next,
13.3% reported other minor sect of Islam such as Ibadi and localized belief. Shi‟ite reported
8.3% and 0.8% both Alevite and other religion such as Hinduism.
Figure 2-3. Religion of respondents (Q7)

69
8. Parents
8.1. Nationality and religion of respondents‟ fathers
The survey shows that nationality of respondents‟ fathers is with highest share 92.3%
Muslim countries and 3.9% Korean and other countries such as Kazakhstan, Singapore and
Sri Lanka. Among the country of origin, 31.3% is reported as Pakistan, following 20.9%
Uzbekistan, 9.6% both Turkey and Oman, and 5.2% reported both Korea and Indonesia. As
countries below 5% rate includes Bangladesh, Egypt, Kazakhstan, Malaysia, India, Saudi
Arabia, Libya, Brunei, Sudan, Afghanistan, Chechen, Singapore, Liberia and Sri Lanka.
The religion of respondents‟ fathers is Sunni (Islam) with 84.2% the highest share. 8.3% of
respondents reported other minor sect of Islam such as ibadhi and localized belief, 5.8%
reported Shi‟ite, 1.7% reported other religion such as Hinduism and 0.5% reported Alevite
and no religion.
Table 2-3. Nationality of respondents‟ fathers
Nationality Frequency Percent
Pakistan 36 31.3
Uzbekistan 24 20.9
Turkey 11 9.6
Oman 11 9.6
Korea 6 5.2
Indonesia 6 5.2
Malaysia 4 3.5
Brunei 3 2.6
Egypt 2 1.7
Kazakhstan 2 1.7
Bangladesh 1 0.9
India 1 0.9
Saudi Arabia 1 0.9
Libya 1 0.9
Sudan 1 0.9
Afghanistan 1 0.9
Chechen 1 0.9
Singapore 1 0.9
Liberia 1 0.9
Sri Lanka 1 0.9
Total 120 100

70
Graphic 2-4. Nationality of fathers (Q37)
Figure 2-4. Religion of respondents‟ fathers (Q40)
8.2. Nationality and religion of respondents‟ mothers
The nationality of respondents‟ mothers is 90% with highest share from Muslim countries
and 5% Korean and other countries such as Kazakhstan and Singapore. Among the country of

71
origin, 32.1% is reported as Pakistan, following 18.3% Uzbekistan, 11% Oman, and 9.2%
reported Turkey, 5.5% both Korea and Indonesia. As countries below 5% rate includes Jordan,
Bangladesh, Egypt, Kazakhstan, Malaysia, India, Libya, Brunei, Sudan, Afghanistan,
Singapore, Liberia and Sri Lanka.
The religion of respondents‟ mothers is Sunni (Islam) with 78.3% the highest share. 9.2% of
respondents reported other minor sect of Islam such as ibadhi and localized belief, 8.3%
reported Shi‟ite, 2.5% reported other religion such as Hinduism and 0.8% reported
Christianity and no religion.
Table 2-4. Nationality of mothers (Q44)
Nationality Frequency Percent
Pakistan 35 32.1
Uzbekistan, 20 18.3
Oman 12 11
Turkey 10 9.2
Korea 6 5.5
Indonesia 6 5.5
Malaysia 4 3.7
Egypt 3 2.8
Kazakhstan 2 1.8
Brunei 2 1.8
Jordan, 1 0.9
Bangladesh, 1 0.9
India 1 0.9
Libya 1 0.9
Sudan 1 0.9
Afghanistan, 1 0.9
Singapore, 1 0.9
Liberia 1 0.9
Sri Lanka 1 0.9
Total 120 100

72
Graphic2-5. Nationality of mothers (Q44)
Figure 2-5. Religion of mothers (Q47)
II. Religious life and Halal foods
1. Influence of Islam in secondary schools

73
The survey shows that 54.2% of respondents had attended classes on Islam in secondary
school, 3.3% of them had attended classes on other religion in secondary school and 42.5% of
them had not attended classes on Islam.
Figure 2-6. Attendance of classes on Islam in secondary school (Q20)
1.1 Availability of Muslim-friendly facilities and services in secondary school
According to availability of Muslim-friendly facilities in secondary school, it was
asked if there is a daily prayer space. 51.7% of respondents answered „available and
adequate‟, 22.5% reported „available but inadequate‟, 15% reported „not available‟, and 10.8%
reported „don‟t know‟. In terms of meeting room for Friday prayer (cuma namazi), 40.8% of
respondents answered „available and adequate‟, 30% reported „not available‟, 17.5% reported
„available but inadequate‟ and 11.7% reported „don‟t know‟. In regards to Ablution (abdest)
facility, 50.8% of respondents answered „available and adequate‟, 20.8% reported „not
available‟, 17.5% reported „don‟t know‟ and 10.8% reported „available but inadequate‟.

74
Figure 2-7. Availability of daily prayer space in secondary school (Q23a)
Figure 2-8.Availability of meeting room for Friday prayer in secondary school (Q23b)

75
Figure 2-9. Availability of ablution (abdest) facility in secondary school (Q23c)
1.2 Availability of Muslim-friendly facilities and services in post-secondary/tertiary
school
The survey shows that in regards to daily prayer space in post-secondary/tertiary school,
37.5% of respondents answered „available and adequate‟, 35% reported „not available‟, 20%
reported „available but inadequate‟, and 7.5% reported „don‟t know‟. In terms of meeting
room for Friday prayer (cuma namazi), 37.5% of respondents answered „not available‟, 34.2%
reported „available and adequate‟, 19.2% reported „available but inadequate‟ and 9.2%
reported „don‟t know‟. In regards to Ablution (abdest) facility, 41.7% of respondents
answered „not available‟, 36.7% reported „available and adequate‟, 15.8% reported „available
but inadequate‟ and 5.8% reported „don‟t know‟.

76
Figure 2-10.Availability of daily prayer space in post-secondary/tertiary school (Q13a)
Figure 2-11. Availability of meeting room for Friday prayer in post-secondary/tertiary school
(Q13b)

77
Figure 2-12. Availability of ablution (abdest) facility in post-secondary/tertiary school (Q13c)
1.3 Use of Halal foods in secondary school
The survey shows that answers of respondents in terms of Halal or Muslim-Friendly
dishes for lunch reported 71.7% „available and adequate‟, 10.8% „not available‟, 9.2%
„don‟t know‟ and 8.3% „available but inadequate‟. A share of 19.8% reported Halal or
Muslim-friendly lunch has been ordered or provided at school, 17.8% reported Halal or
Muslim-friendly lunch was brought from home to school, 16.4% reported to have Halal or
Muslim-friendly lunch at home, 14.4% reported to have bought Halal or Muslim-friendly
lunch from outside shops at school and 11.9% reported to have had Halal or Muslim-friendly
lunch outside school in cafeterias or shops. It shows that the majority of respondents eat Halal
or Muslim-friendly lunch.

78
Figure 2-13. Availability of halal dishes for lunch(Q23d)
Graphic 2-6. Kind of lunch in secondary school(Q24)
The survey shows that 70% of respondents answered Halal or Muslim-Friendly
snacks are „available and adequate‟, 13.3% reported „not available‟, 10% reported „don‟t
know‟ and 6.7% reported „available but inadequate‟. In addition, 19.8% reported Halal or
Muslim-friendly snacks to have brought from home, 22.6% reported Halal or Muslim-
friendly snacks to have bought at school, 19.2% reported Halal or Muslim-friendly snacks to

79
have bought outside school from shops or cafeteria, and 15.7% reported to have eaten Halal
or Muslim-friendly snacks after going back home. It shows that the majority of respondents
eat Halal or Muslim-friendly snacks.
Figure 2-14. Availability of halal snacks (Q23e)
Graphic 2-7. Kind of snacks in secondary school

80
1.4 Use of Halal foods in post-secondary/tertiary school
The research states that 35% of respondents answered Halal or Muslim-Friendly dishes
for lunch in post-secondary/tertiary school are „not available‟, 32.5% reported „available and
adequate‟, 24.2% reported „available but inadequate‟, and 8.3% reported „don‟t know‟.
Moreover, 12.6% reported Halal or Muslim-friendly lunch have ordered or provided at school,
17% reported Halal or Muslim-friendly lunch brought from home to school, 10.7% reported
to have Halal or Muslim-friendly lunch at home, 21.5% reported Halal or Muslim-friendly
lunch bought from outside school shops and 10% reported to have Halal or Muslim-friendly
lunch outside school in cafeterias or shops.
Figure 2-15. Kind of lunch in post-secondary/tertiary school (Q13d)

81
Graphic 2-8. Kind of lunch in post-secondary/tertiary school (Q14)
In regards to Halal or Muslim-Friendly snacks in post-secondary/tertiary school, 38.3%
of respondents answered „available and adequate‟, 20.8% reported „available but inadequate‟,
38.3% reported „not available‟, and 10% reported „don‟t know‟. In addition, 18.2% reported
Halal or Muslim-friendly snacks brought from home, 15.3% reported Halal or Muslim-
friendly snacks bought at school, 19.7% reported Halal or Muslim-friendly snacks bought
outside schools from shops or cafeteria, and 19% reported to have Halal or Muslim-friendly
snacks after going back home.
Figure 2-16. Availability of halal snacks (Q13e)

82
Graphic 2-9. Kind of snacks in secondary school (Q15)
2. Preference of Halal foods
The survey shows that in daily life, 68.3% of respondents respected food prohibition
„always‟, 11.7% reported „most of time‟, 9.2% reported „depend on the situation‟, 5.8%
reported „occasionally‟, 4.2% reported „never‟ and 0.8% reported „not applicable(no
religion)‟. It shows that the majority of respondents tried to respect food prohibition such as
eating Halal foods.
Figure 2-17. Respect of food prohibition (Q91)

83
In regards of dishes in everyday life, 58.7% of respondents prepared homeland dishes.
Next, 16.8% reported Korean/Western dish, 11.7% reported mixture dish of homeland and
other(s), 7.3% reported new/exotic dish, and 2.8% reported both „other such as Halal Chinese
food‟ and „never‟.
Figure 2-18. Kind of dishes in daily life (Q94)
In regards to frequency of eating fish, 24.2% of respondents eat it „less often‟, 17.5%
reported both „two or three times a week‟ and „once a week‟, 15.8% reported „once a month‟,
13.3% reported „two or three times a month‟, 6.7% reported „never‟, and 5% reported
„everyday‟.

84
Figure 2-19. Frequency eating fish (Q95)
The research shows that frequency of eating meat „two or three times a week‟ is 51.7%,
and 25% „every day‟. Next, 14.2% of respondents reported to eat meat „once a week‟, 5%
reported „less often‟, 1.7% reported both „two or three time a month‟ and „once a month‟, and
0.8% reported „never‟. I can be said that respondents prefer meat to fish. The favorite meats
of respondents are with share of 37.1% chicken, and next, 30.7% mutton or lamb, 28.8%
beef or veal, 2.2% other poultry and 1.1% other such as duck.
Figure 2-20. Frequency eating meat (Q96)

85
Figure 2-21. Preference rate of meat (SQ96-1)
Finally, 37.5% of respondents eat snacks two or three times a week, 34.2% reported
„everyday‟, 10.8% reported „two or three times a month‟, 10% reported „once a week‟, and
2.5% reported „once a month‟, „less often‟ and „never‟. It shows that the majority of
respondents eat snacks more than two or three times a week. The favorite snacks of
respondents are 21.4% fruits and vegetables, 12.9% nuts, grains and beans, 11.2% Halal
(Non-Homeland style), 9.8% products with Halal certification, 9.6% both dairy products
and Halal (fast food), 7.8% Homeland (traditional) snacks, 6.3% homeland (fast food), 5.4%
Korean/Western (fast food), 3.6% Korean/Western (traditional), 1.8% products without
Halal certification and 0.7% other snacks. The kinds of favorite drinks in daily life reported
27.4% juice (and related), 18.9% reported both milk (and related) and hot drinks, 18.6%
reported mineral water, 15.1% reported carbonated drinks and 0.9% reported other.

86
Figure 2-22. Frequency eating snacks (Q97)
Graphic 2-10.Kinds of favorite snacks (SQ97-1)
3. Use of Halal market and Halal restaurant
3.1 Use of Halal market
The survey shows that 20.6% of respondents (their family) reported that they go grocery

87
shopping both once a week and two or three times a week, 6.9% reported „two or three times
a month‟, 3.9% reported „once a month‟, 2.9% reported „never‟, and 2% reported both „every
day‟ and „less often‟.
Figure 2-23. Frequency shopping grocery (Q100)
The results of buying halal meat frequency are as following; 67% of respondents buy Halal
meat „always‟ and 10.4% of them buy it both „most of the time‟ and „depends on the situation‟
when they buy meat, 8.7% reported „occasionally‟, and 3.5% reported „never‟. The majority
of respondents stated that they buy Halal meat „always or most of the time‟ when they buy
meat. Moreover, 59.8% of respondents „always‟ and 16.1% „most of the time‟ check the Halal
sign or logo inside or outside the store when they buy Halal meat. In order words, the
majority of respondents tend to check the Halal sign or logo inside or outside the store when
they buy Halal meat. For places to buy halal meat, Halal butchers had the highest share with
32.4%, followed by Halal grocers with 22.3%, Homeland‟s butchers with 18.5%, Korean
grocers with 8.4%, Homeland supermarkets with 8%, Korean butchers with 5.5%, Korean
supermarkets with 2.5%, Korean grocers with 2.1% and 0.4% others.

88
Figure 2-24. Frequency buying halal meats (Q101)
Figure 2-25. Frequency checking the Halal sign or logo (SQ103-1)

89
Figure 2-26. Places buying Halal foods (SQ101-1)
In addition, 46.5% of respondents buy non-meat Halal grocery „always‟ and 17.5% of them
answered „depends on the situation‟ when they buy non-meat grocery. Other respondents
reported 14.9% „most of time‟, 12.3% „occasionally‟ and 8.8% „never‟. The majority of
respondents tend to buy Halal grocery „always or most of time‟ when they buy non-meat
grocery. Moreover, 54.5% of respondents „always‟ and 22.3% of them „most of the time‟
check the Halal label or logo on the package when they buy processed foods. In other words,
the majority of respondents „always or most of time‟ check the Halal label or logo on the
package when they buy processed foods. Respondents‟ preferences of places for Halal
grocery are Halal grocers at 37.8% with the highest share. Next, 20.1% reported Homeland‟s
grocers, 15.3% reported Korean supermarket, 13.9% reported Homeland‟s supermarkets, 12.4%
reported Korean grocers, and 0.5% reported other.

90
Figure 2-27. Frequency buying Halal grocery (Q102)
Figure 2-28. Frequency checking the Halal label or logo on the package (SQ103-2)

91
Figure 2-29. Places buying other Halal grocery (SQ102-1)
3.2 Use of Halal restaurant
The survey shows that 25% of respondents eat „less often‟ at Halal restaurants (cafeterias)
with the Halal sign or logo. With a small difference, 24.2% reported „once a month‟ and 19.2%
reported „two or three times a month‟, 15% reported „twice or more a week‟, 11.7% reported
„once a week‟ and 0.8% reported „never‟ to eat at Halal restaurants (cafeterias).
Figure 2-30. Frequency eating at Halal restaurants (cafeterias) (Q104)
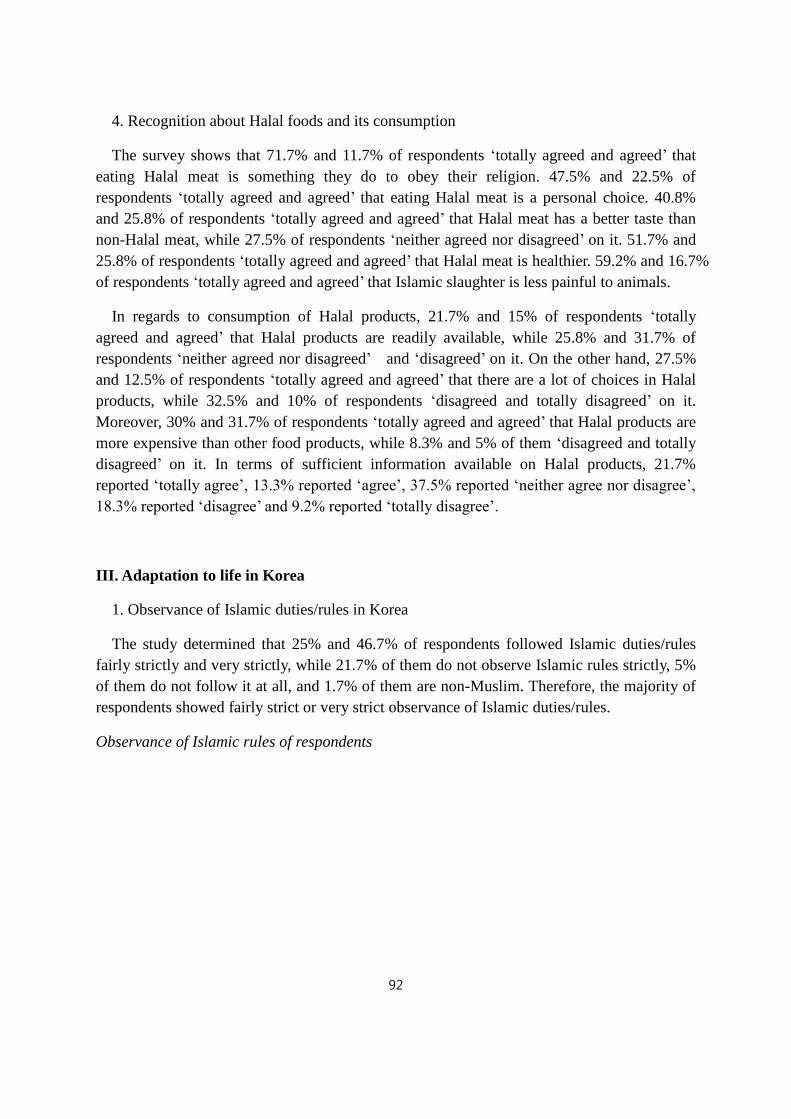
92
4. Recognition about Halal foods and its consumption
The survey shows that 71.7% and 11.7% of respondents „totally agreed and agreed‟ that
eating Halal meat is something they do to obey their religion. 47.5% and 22.5% of
respondents „totally agreed and agreed‟ that eating Halal meat is a personal choice. 40.8%
and 25.8% of respondents „totally agreed and agreed‟ that Halal meat has a better taste than
non-Halal meat, while 27.5% of respondents „neither agreed nor disagreed‟ on it. 51.7% and
25.8% of respondents „totally agreed and agreed‟ that Halal meat is healthier. 59.2% and 16.7%
of respondents „totally agreed and agreed‟ that Islamic slaughter is less painful to animals.
In regards to consumption of Halal products, 21.7% and 15% of respondents „totally
agreed and agreed‟ that Halal products are readily available, while 25.8% and 31.7% of
respondents „neither agreed nor disagreed‟ and „disagreed‟ on it. On the other hand, 27.5%
and 12.5% of respondents „totally agreed and agreed‟ that there are a lot of choices in Halal
products, while 32.5% and 10% of respondents „disagreed and totally disagreed‟ on it.
Moreover, 30% and 31.7% of respondents „totally agreed and agreed‟ that Halal products are
more expensive than other food products, while 8.3% and 5% of them „disagreed and totally
disagreed‟ on it. In terms of sufficient information available on Halal products, 21.7%
reported „totally agree‟, 13.3% reported „agree‟, 37.5% reported „neither agree nor disagree‟,
18.3% reported „disagree‟ and 9.2% reported „totally disagree‟.
III. Adaptation to life in Korea
1. Observance of Islamic duties/rules in Korea
The study determined that 25% and 46.7% of respondents followed Islamic duties/rules
fairly strictly and very strictly, while 21.7% of them do not observe Islamic rules strictly, 5%
of them do not follow it at all, and 1.7% of them are non-Muslim. Therefore, the majority of
respondents showed fairly strict or very strict observance of Islamic duties/rules.
Observance of Islamic rules of respondents
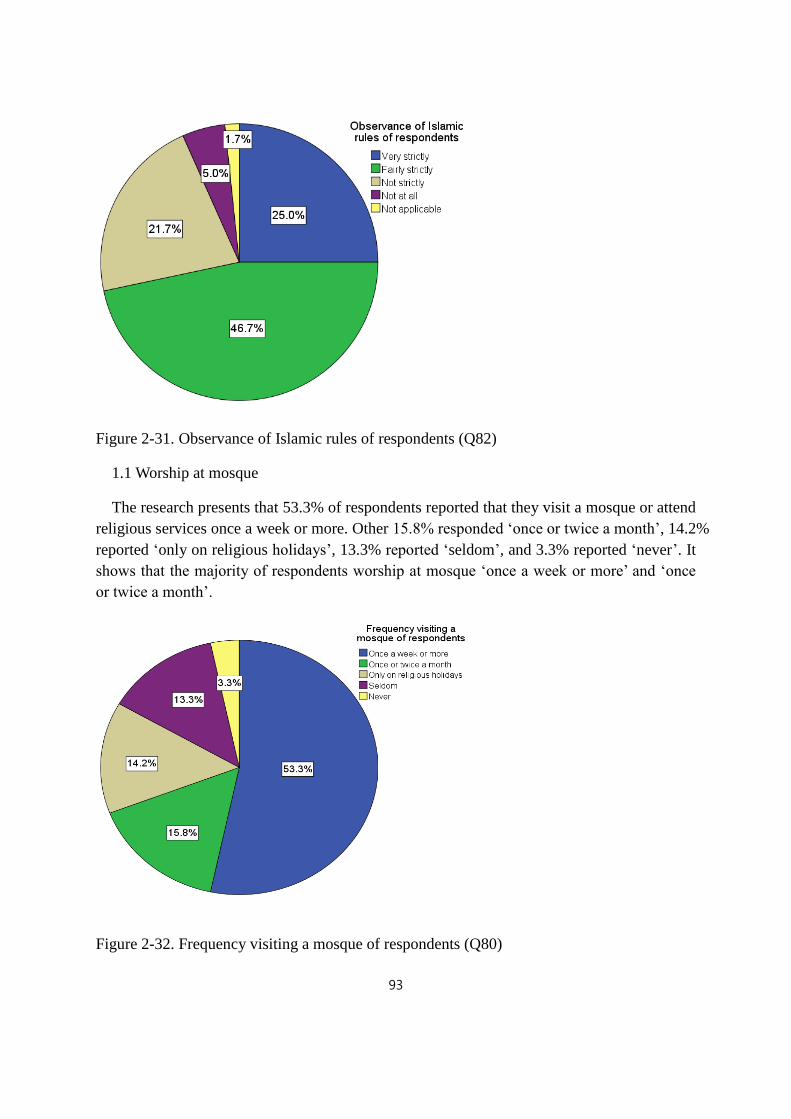
93
Figure 2-31. Observance of Islamic rules of respondents (Q82)
1.1 Worship at mosque
The research presents that 53.3% of respondents reported that they visit a mosque or attend
religious services once a week or more. Other 15.8% responded „once or twice a month‟, 14.2%
reported „only on religious holidays‟, 13.3% reported „seldom‟, and 3.3% reported „never‟. It
shows that the majority of respondents worship at mosque „once a week or more‟ and „once
or twice a month‟.
Figure 2-32. Frequency visiting a mosque of respondents (Q80)

94
1.2 Daily prayer
37.5% of respondents do daily prayer five times a day or more, 35% do it daily, 10.8% do
it once a week and 6.7% do it only on religious holidays. Only 9.2% never do daily prayer
and 0.8% are not applicable (no religion).
Figure 2-33. Frequency of daily prayer of respondents (Q81)
1.3 Headscarf
The study shows that reasons wearing a headscarf outside the house are as following; 41%
with the highest share is religious obligation, 17.4% free and personal choice, 15.2%
important part of Muslim identity in Korea, 10.1% homeland‟s tradition, 6.7% avoidance of
gossip and disrespectful behaviors, 5.1% convenience, 2.2% being fashionable and 1.1%
both reinforcement of trust in the family and other. As the reasons for NOT wearing a
headscarf reported free and personal choice at 51.6% with the highest share. Next, 14.1%
reported religious obligation, and 7.8% reported both that men and women have the same
rights and other. Reasons with a share below 4.7% are inconvenience, homeland‟s tradition,
being better to insert oneself in Korean society and avoidance of discrimination and
disrespectful behaviors.
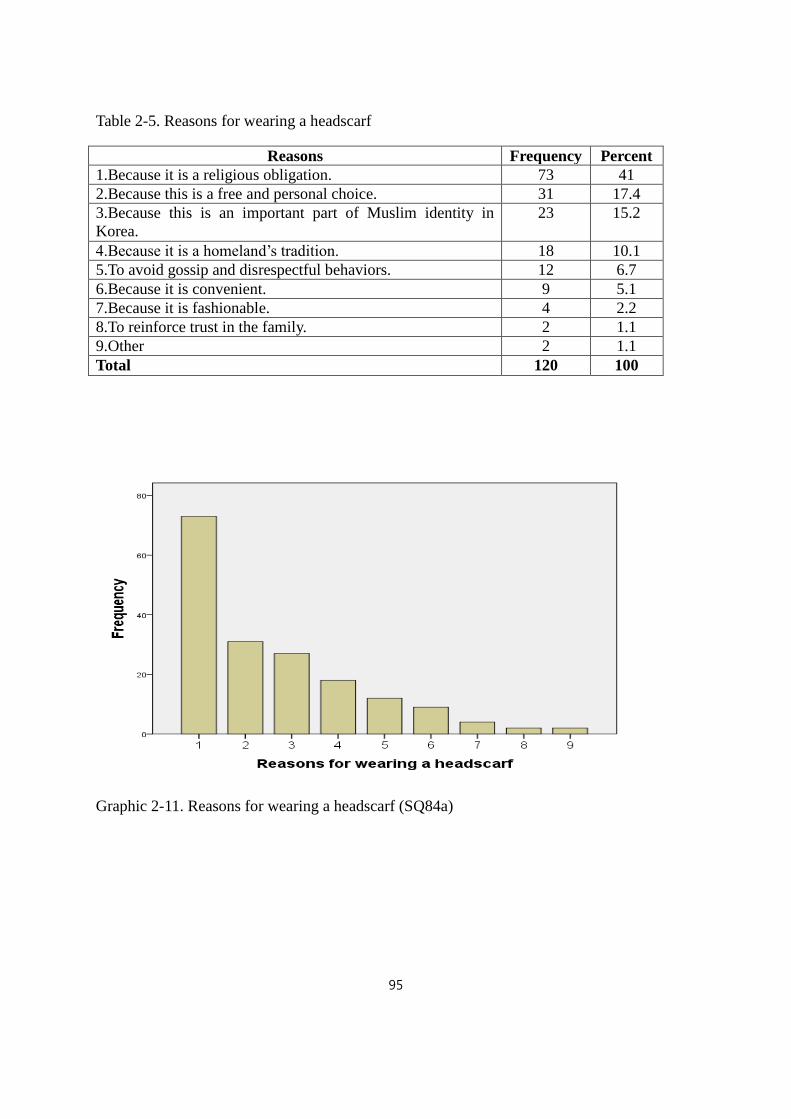
95
Table 2-5. Reasons for wearing a headscarf
Reasons Frequency Percent
1.Because it is a religious obligation. 73 41
2.Because this is a free and personal choice. 31 17.4
3.Because this is an important part of Muslim identity in
Korea.
23 15.2
4.Because it is a homeland‟s tradition. 18 10.1
5.To avoid gossip and disrespectful behaviors. 12 6.7
6.Because it is convenient. 9 5.1
7.Because it is fashionable. 4 2.2
8.To reinforce trust in the family. 2 1.1
9.Other 2 1.1
Total 120 100
Graphic 2-11. Reasons for wearing a headscarf (SQ84a)

96
Table 2-6. Reasons for NOT wearing a headscarf
Reasons Frequency Percent
1.Because this is a free and personal choice. 33 51.6
2.Because it is not a religious obligation. 9 14.1
3.Because men and women have the same right. 5 7.8
4.Other 5 7.8
5.Because it is inconvenient. 14 3 4.7
6.Because it is not a homeland‟s tradition. 3 4.7
7.Because this is better to insert oneself in Korean
society.
3 4.7
8.To avoid discrimination and disrespectful behaviors. 3 4.7
Total 120 100
Graphic 2-12. Reasons for NOT wearing a headscarf (SQ84b)
1.4 Fasting during Ramadan
The survey shows that 51.7% of respondents „always‟, 18.3% „most of the time‟, 10.8%
„never‟, 10% „occasionally‟, 7.5% „depends on situation‟ fast during Ramadan, and 1.7%
are „non-Muslim‟. The majority of respondents „always or most of the time‟ fast during
Ramadan.

97
Figure 2-34.Frequency fasting during the Ramadan (Q85)
2. Change in religious beliefs
The results concerning change in religious beliefs of respondents reported 49.2% that their
faith did not change after entering secondary school. 28.3% and 11.7% reported that their
religious beliefs became stronger and fairy stronger after entering secondary school. The
majority of respondents showed that their religious beliefs did not change or become stronger
after entering secondary school.
Figure 2-35. Change of respondents‟ faith (Q83)

98
3. Level of Korean language
The respondents were asked about their Korean language level. The level of listening and
speaking in Korean of respondents was 32.4% „not good‟. Next, 27.5% of respondents
reported „not at all‟, and 20.8% reported „good‟ and 17.5% reported „very good‟. In regards of
reading level in Korean, the largest number of respondents answered 33.3% „not good‟,
28.3% reported „good‟, 25% reported „not at all‟, and 13.3% reported „very good‟. Lastly, in
regards to writing level in Korean, 36.7% reported „not good‟, 30% reported „not at all‟, 18.3%
reported „good‟, and 15% reported „very good‟. These data show that Korean language skills
of most respondents are „not good or not at all‟.
Figure 2-36. Skill of listening and speaking Korean (Q5)
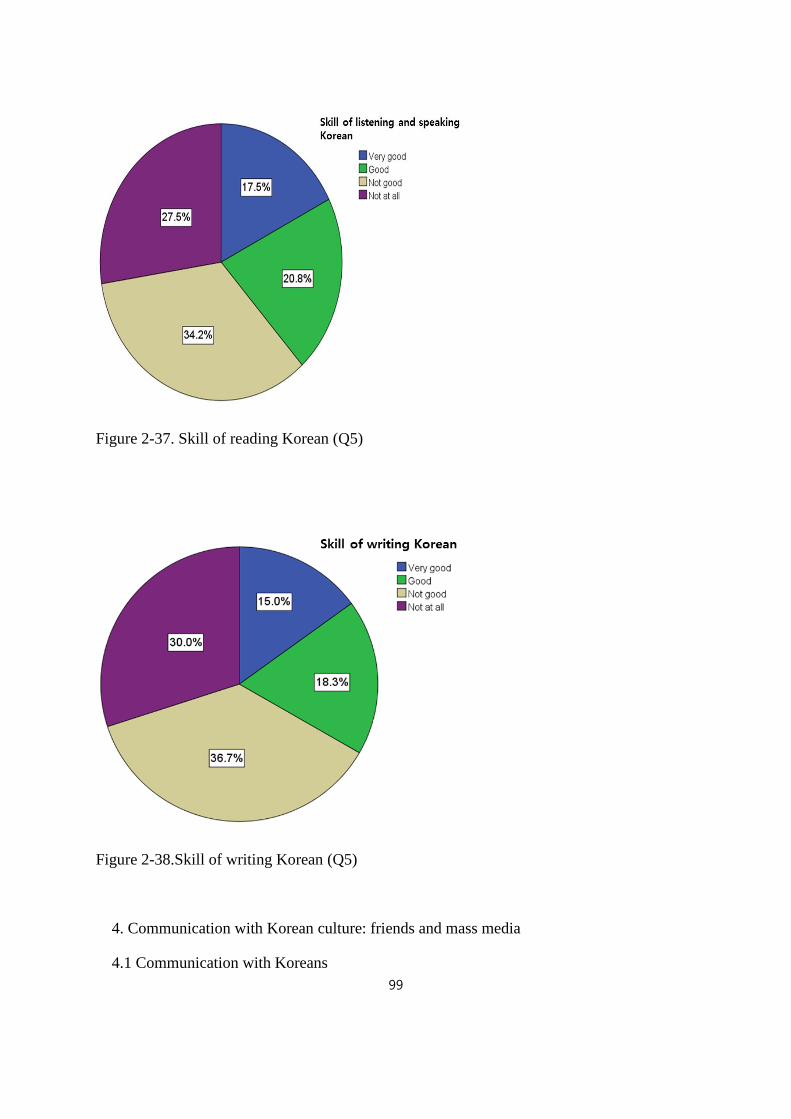
99
Figure 2-37. Skill of reading Korean (Q5)
Figure 2-38.Skill of writing Korean (Q5)
4. Communication with Korean culture: friends and mass media
4.1 Communication with Koreans

100
The survey shows that 40% of respondents answered having quite a few Korean friends,
15% reported having one or a few Korean friend, , 15.7% reported having a lot number of
Korean friends, 19.2% reported that most of them were Korean and 9.2% reported having no
Korean friends. In addition, 34.2% of respondents reported having quite a few friends of
homeland‟s origin, 20.8% reported having a lot number of friends of homeland‟s origin, 34.2%
reported that most of them were of homeland‟s origin, 6.7% reported having no friends of
homeland‟s origin, 4.2% reported having one or a few friend of homeland‟s origin,. Finally,
38.3% responded that most of their friends are Muslim, 35% reported having a lot number of
Muslim friends, 19.2% reported having quite a few Muslim friends, 4.2% of respondents
answered having no Muslim friends, and 3.3% reported having one or a few Muslim friend. It
can be see that 34.9% of respondents have a lot of Korean friends; however, 55% of them
have mostly friends of homeland‟s origin, and 73.3% of them mainly Muslim friends.
Figure 2-39. Friends of Korean origin (Q64)

101
Figure 2-40. Friends of homeland‟s origin (Q65)
Figure 2-41. Muslim friends (Q67)
4.2 Contact with mass media
The survey shows that 56.7% of respondents never watch Korean television programs and

102
23.3% of them watch it for 1-9 hours per week. 11.7% reported to watch 10-19 hours per
week, 2.5% reported 20-29 hours per week and 5.8% reported 30 hours or more per week. On
the other hands, 30% of respondents never watch Islamic television programs, and 39.2% of
them watched it for 1-9 hours per week. 17.5% respondents reported to watch 10-19 hours
per week, 9.2% reported 20-29 hours per week and 4.2% reported 30 hours or more per week.
It shows that the majority of respondents watch Korean and Islam television programs below
1-9 hours per week.
Figure 2-42. Hours watching Korean television (Q70)
Figure 2-43.Hours watching Islamic television (Q71)

103
5. Satisfactory level of overall life
The research shows that satisfactory level of study is 44.2% „very satisfied‟, 50% „fairly
satisfied‟, 2.5% „fairly unsatisfied‟ and 3.3% „very unsatisfied‟.
In regards to satisfactory level of family life, 46.7% of respondents answered „very
satisfied‟, 33.3% reported „fairly satisfied‟, 8.3% reported „fairly unsatisfied‟ and 11.7%
reported „very unsatisfied‟.
39.2% of respondents answered to satisfactory level of religious life „very satisfied‟, 48.3%
reported „fairly satisfied‟, 8.3% reported „fairly unsatisfied‟ and 4.2% reported „very
unsatisfied‟.
In terms of satisfactory level of housing and neighborhood, 34.2% of respondents claimed
„very satisfied‟, 50.8% reported „fairly satisfied‟, 11.7% reported „fairly unsatisfied‟ and 3.3%
reported „very unsatisfied‟.
In relations to being satisfied with foods, 34.2% of respondents reported „very satisfied‟,
40.8% reported „fairly satisfied‟, and 12.5% reported both „fairly unsatisfied‟ and „very
unsatisfied‟.
The satisfactory level of health condition of respondents reported 41.7% „very satisfied‟,
44.2% reported „fairly satisfied‟, 9.2% reported „fairly unsatisfied‟ and 5% reported „very
unsatisfied‟.
In regards to financial condition, 29.2% of respondents answered „very satisfied‟, 54.2%
reported „fairly satisfied‟, 14.2% reported „fairly unsatisfied‟ and 2.5% reported „very
unsatisfied‟.
The satisfactory level of relation with Muslim and respondents reported 51.7% „very
satisfied‟, 44.2% reported „fairly satisfied‟, 2.5% reported „fairly unsatisfied‟ and 1.7%
reported „very unsatisfied‟.
In terms of employment(if applicable), 32.1% of respondents responded „very satisfied‟,
44.6% reported „fairly satisfied‟, 16.1% reported „fairly unsatisfied‟ and 7.1% reported „very
unsatisfied‟.
In general, 45% responded that they were very satisfied with their overall life in Korea,
46.7% reported being satisfied, 7.5% reported being not satisfied, and only 0.8% reported
being not at all satisfied with their overall life in Korea. It can be claimed that the majority
of respondents are either satisfied or extremely satisfied with their overall life in Korea.

104
Figure 2-44.Satisfaction level of overall life (Q76)
6. Adaptation to Korean culture
The research shows that 42.5% of respondents agreed that outside home, they want to
adopt the Korean culture and way of life as much as possible. 37.5% reported „neither agree
nor disagree‟ and 20% reported „disagree‟ to adapting Korean culture. In addition, 25% of
respondents agreed that at home they want to adopt the Korean culture and way of life as
much as possible, while 40% reported „neither agree nor disagree‟ and 42.5% reported
„disagree‟.
On the other hands, 62.5% of respondents agreed that outside home, they want to
maintain the homeland‟s culture and way of life as much as possible, while 29.2% reported
„neither agree nor disagree‟ and 8.4% reported „disagree‟. Moreover, 74.1% of respondents
agreed that at home they want to maintain the homeland‟s culture and way of life as much as
possible, where else 20.8% reported „neither agree nor disagree‟ and 5% reported „disagree‟.
Finally, 73.3% of respondents agreed that outside home, they want to maintain the
Islamic culture and way of life as much as possible, while 14.2% reported „neither agree nor
disagree‟ and 12.5% reported „disagree‟. In addition, 78.4% of respondents agreed that at
home they want to maintain the Islamic culture and way of life as much as possible, 16.7%
reported „neither agree nor disagree‟ and 5% reported „disagree‟ to this question.
7. Identity of Muslims in Korea
The survey shows that 18.3% of respondents are feeling Korean strongly, 23.3% of them
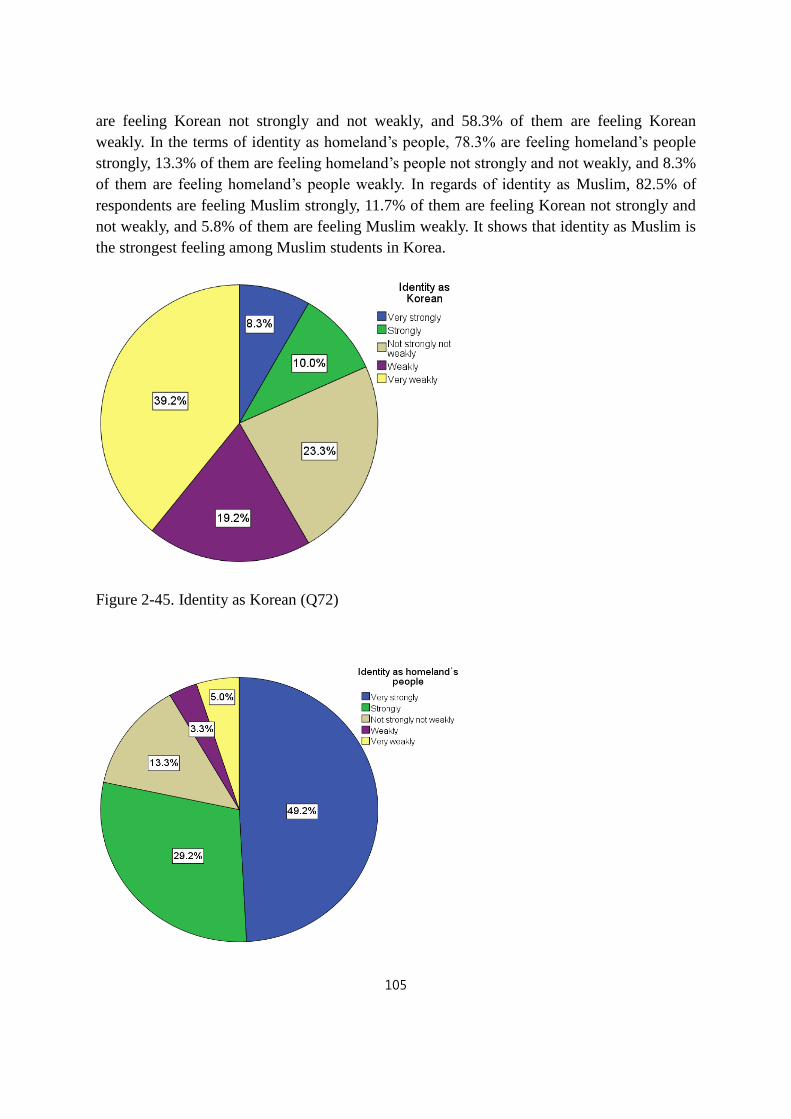
105
are feeling Korean not strongly and not weakly, and 58.3% of them are feeling Korean
weakly. In the terms of identity as homeland‟s people, 78.3% are feeling homeland‟s people
strongly, 13.3% of them are feeling homeland‟s people not strongly and not weakly, and 8.3%
of them are feeling homeland‟s people weakly. In regards of identity as Muslim, 82.5% of
respondents are feeling Muslim strongly, 11.7% of them are feeling Korean not strongly and
not weakly, and 5.8% of them are feeling Muslim weakly. It shows that identity as Muslim is
the strongest feeling among Muslim students in Korea.
Figure 2-45. Identity as Korean (Q72)

106
Figure 2-46. Identity as homeland‟s people (Q73)
Figure 2-47. Identity as Muslim (Q74)

107
Reference
1 Nana Glick Schiller, Linda Basch and Cristina Szanton Blance, 1995, 「From Immigrant to
2 Transmigrant: Theorizing Transnational Migration」, 『Anthropological Quartely』vol. 68,
No. 1, 48-63.
3 Steven Vertovec, 2009, 『TRANSNATIONALSIM』, LONDON AND NEW YORK:
Routledge, p. 2.
4 Nana Glick Schiller, Linda Basch and Cristina Szanton Blance, 1995, 「From Immigrant to
Transmigrant: Theorizing Transnational Migration」, 『Anthropological Quartely』vol. 68, No.
1, p. 48.
5 Peggy Levitt, 2001,『The Transnational Villagers』, California: University of California
Press, pp. 169-170.
6 Steven Vertovec, 2009, 『TRANSNATIONALSIM』, LONDON AND NEW YORK:
Routledge, p. 2.
7 Nana Glick Schiller, Linda Basch and Cristina Szanton Blance, 1995, 「From Immigrant
to Transmigrant: Theorizing Transnational Migration」, 『Anthropological Quartely』vol.
68, No. 1, p. 48.
8 Peggy Levitt, 2001,『The Transnational Villagers』, California: University of California
Press, pp. 169-170.
9 Steven Vertovec, 2009, ibid, p. 139.