Embed Size (px)
Citation preview
A Survey of Current
Neonatal Unit Organisation
and Policy
July 2005
Commissioned by BLISS The Premature Baby Charity
Authors: Maggie Redshaw and Karen Hamilton
National Perinatal Epidemiology Unit, University of Oxford,
Old Road Campus, Oxford OX3 7LF
TABLE OF CONTENTS
Acknowledgements ..............................................................................................1 Section 1. Summary.............................................................................................2 Section 2. Background .........................................................................................4 Section 3. Methods ..............................................................................................5 Section 4. Results ................................................................................................6
4.1 Unit Organisation........................................................................................6 4.1.1 Managed Clinical Networks.................................................................6 4.1.2 Unit size...............................................................................................7 4.1.3 Unit Capacity .......................................................................................8 4.1.4 Admissions ........................................................................................12 4.1.5 Assisted Ventilation ...........................................................................15 4.1.6 Transfer Procedures..........................................................................15
4.2 Staffing and skill mix.................................................................................17 4.2.1 Nurse staffing ....................................................................................17 4.2.2 Nursing Skill Mix................................................................................20 4.2.3 Unit Cover .........................................................................................22 4.2.4 Medical staffing .................................................................................23 4.2.5 Other services ...................................................................................25
4.3 Caring for babies ......................................................................................26 4.3.1 Modifying the environment for babies in neonatal care.....................26 4.3.2 Care during painful procedures .........................................................27 4.3.3 Feeding and contact..........................................................................29 4.3.4 Developmental care skills and training..............................................30
4.4 Supporting parents ...................................................................................31 4.4.1 Information for parents ......................................................................31 4.4.2 Facilities for parents ..........................................................................33 4.4.3 Discharge and follow-up....................................................................34 4.4.4 Support groups..................................................................................34 4.4.5 Facilities and follow-up for bereaved families....................................35
Section 5. Conclusion ........................................................................................36 References.........................................................................................................37

1
Acknowledgements
We would like to thank all the neonatal units that participated in the survey, Alex West who undertook the data entry and colleagues at NPEU who commented on the draft report and findings. The survey was commissioned and funded by BLISS, the premature baby charity. This work was undertaken by the NPEU, which receives funding from the Department of Health. The views expressed in the publication are those of the authors and not necessarily those of the Department of Health.
2
Section 1. Summary
In the context of technological developments in clinical care, increasing numbers of babies being cared for at the edge of viability and changes in the organisation and funding of neonatal care, it was recognised that an up-to-date picture of aspects of current organisation and policy was required. This was with the aim of marking progress made and to provide a point of comparison for the future. A national survey of all the neonatal units in the United Kingdom was undertaken by the National Perinatal Epidemiology Unit (NPEU) during the winter of 2004-05. Information was requested on networks, admissions, cots, transfer arrangements, staffing, practice in relation to developmental care, and facilities and information for parents. A response rate of 70% was achieved, with 153 units returning the questionnaire. Largely descriptive analyses were undertaken. The following findings reflect the current situation in neonatal care: • Neonatal Networks have been introduced. These vary in size, the degree to
which they have become established and the level of agreement with regard to unit designation.
• Many neonatal units routinely care for more babies in special care, high
dependency and intensive care than they have the facilities and staffing to support.
• A total of 4% of all very low birth weight infants in 2003 were admitted to units
which did not have intensive care cots. • A large proportion of units had been closed to admissions in the previous six
months. • A total of 8% of current nursing establishment (whole time equivalents) was
vacant. • The shortfall in recommended nurse staffing levels was marked, with only three
of the 143 units for which data are available, achieving the recommended establishment.
• While the proportion of nurses in neonatal care with a specialist qualification
has increased to 63%, from 53% approximately ten years previously, this is less than the 70% level recommended.
• In 40% of neonatal units there is a designated lead for developmental care. • Many units have modified the environment of neonatal care to better support
infant development and all neonatal units provide some aids that enable sick babies to be cared for more comfortably.
• Pain scales, which can be used to assist with pain management, are used
relatively little: in 23% of units for acute pain and in 19% units for chronic pain.

3
• The information needs of parents are better addressed than previously, though not all units have parent booklets, antenatal visits to the unit and written information about discharge home.
• There is widespread provision of facilities for parents, though some units do not
have a sitting room for parents, a place to make snacks and accommodation for them to stay overnight.
• Appropriate facilities, support and follow-up for bereaved families is in place in
almost all units. The survey provides evidence about changes that have occurred over time in neonatal care, and about the policies and organisation currently in place that may impact on babies, families and staff. Suggestions about future monitoring and evaluation are made.
4
Section 2. Background
Many changes have taken place in policy and organisation in neonatal care over the last decade. (1;2) Numerous technological developments; a changing case-mix with increasing numbers of babies at the edge of viability; the consolidation of the neonatal nurse practitioner role; the reorganisation of medical education; the European Working Time Directive and the introduction of managed clinical networks have all impacted on the current provision of neonatal care. (3-8) The recent ‘National Service Framework for Children, Young People and Maternity Services’, in which the need for high quality individualised care, with appropriate information and choice, provided as locally as possible and supported by an evidence base is emphasised, provides a context for the current work. (9) Baseline data about current organisation and aspects of policy in neonatal care could enable a point of comparison for future studies and benchmarking, while also providing evidence of change or continuities. BLISS approached the NPEU with a view to commissioning an independent research project. Following discussions with unit staff (MR) and an experienced consultant researcher (KH), the content and topic areas were agreed, the funding allocated and a national survey of neonatal units was undertaken in the winter of 2004-05.
5
Section 3. Methods
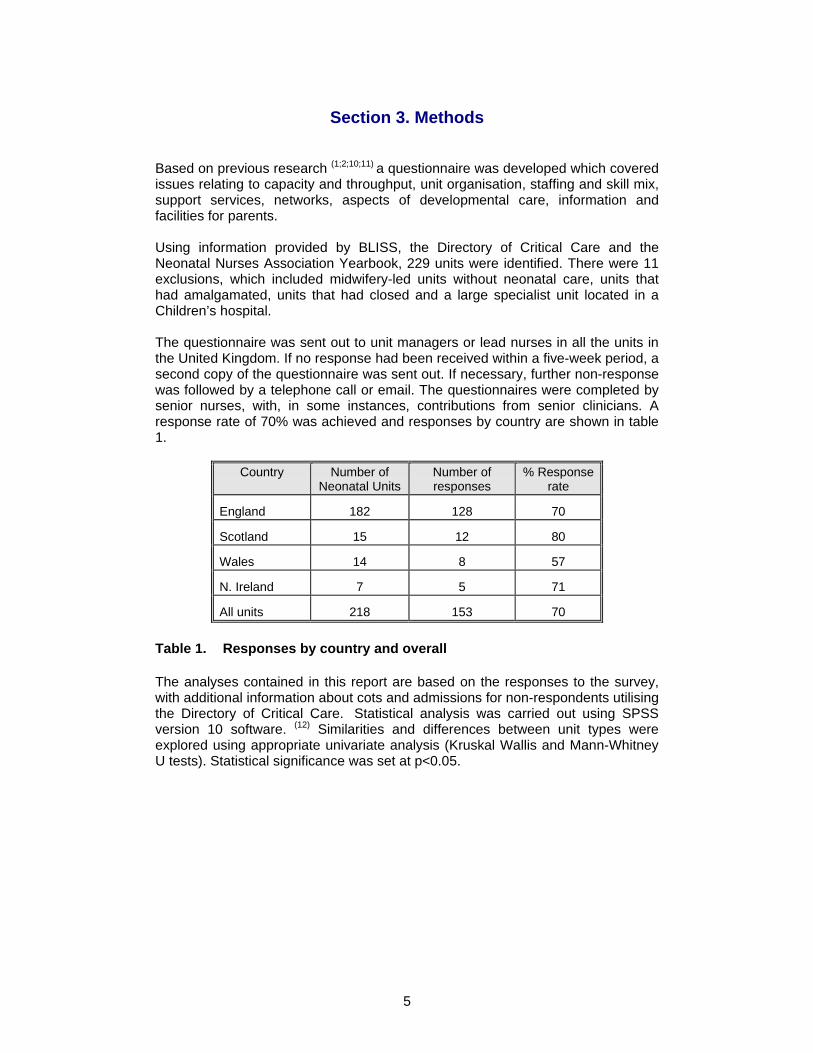
Based on previous research (1;2;10;11) a questionnaire was developed which covered issues relating to capacity and throughput, unit organisation, staffing and skill mix, support services, networks, aspects of developmental care, information and facilities for parents. Using information provided by BLISS, the Directory of Critical Care and the Neonatal Nurses Association Yearbook, 229 units were identified. There were 11 exclusions, which included midwifery-led units without neonatal care, units that had amalgamated, units that had closed and a large specialist unit located in a Children’s hospital. The questionnaire was sent out to unit managers or lead nurses in all the units in the United Kingdom. If no response had been received within a five-week period, a second copy of the questionnaire was sent out. If necessary, further non-response was followed by a telephone call or email. The questionnaires were completed by senior nurses, with, in some instances, contributions from senior clinicians. A response rate of 70% was achieved and responses by country are shown in table 1.
Country Number of Neonatal Units
Number of responses
% Response rate
England 182 128 70
Scotland 15 12 80
Wales 14 8 57
N. Ireland 7 5 71
All units 218 153 70
Table 1. Responses by country and overall
The analyses contained in this report are based on the responses to the survey, with additional information about cots and admissions for non-respondents utilising the Directory of Critical Care. Statistical analysis was carried out using SPSS version 10 software. (12) Similarities and differences between unit types were explored using appropriate univariate analysis (Kruskal Wallis and Mann-Whitney U tests). Statistical significance was set at p<0.05.
6
Section 4. Results
4.1 Unit organisation
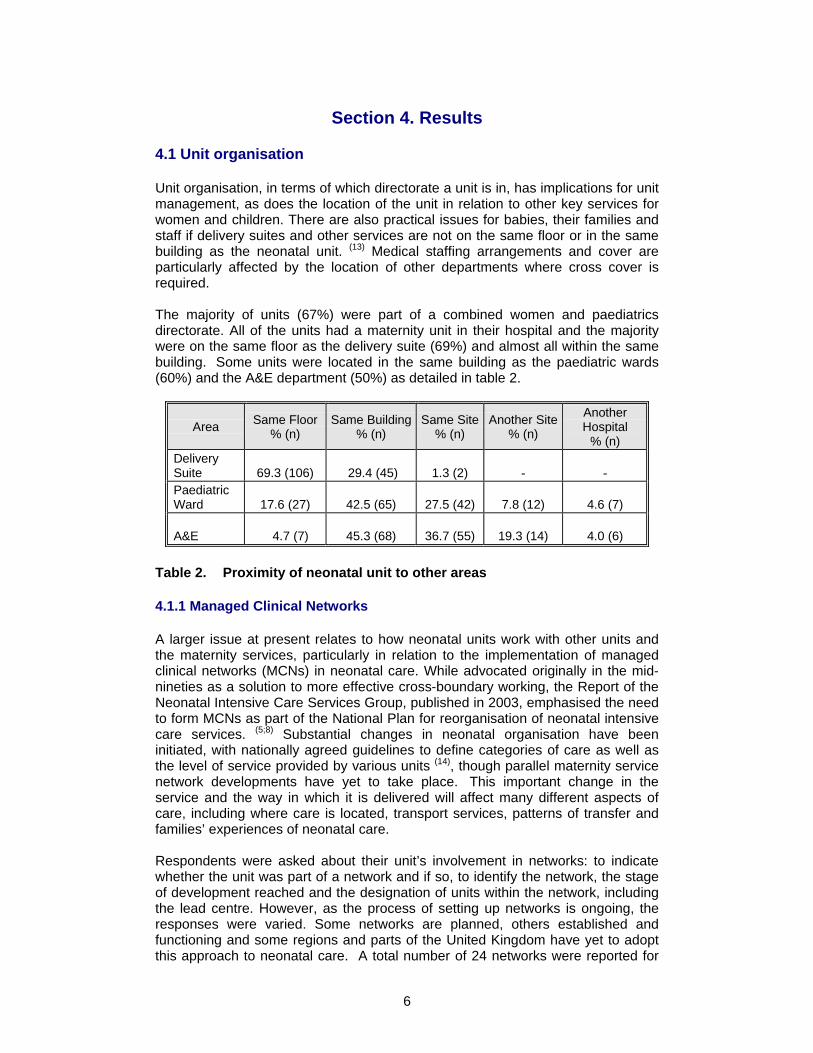
Unit organisation, in terms of which directorate a unit is in, has implications for unit management, as does the location of the unit in relation to other key services for women and children. There are also practical issues for babies, their families and staff if delivery suites and other services are not on the same floor or in the same building as the neonatal unit. (13) Medical staffing arrangements and cover are particularly affected by the location of other departments where cross cover is required. The majority of units (67%) were part of a combined women and paediatrics directorate. All of the units had a maternity unit in their hospital and the majority were on the same floor as the delivery suite (69%) and almost all within the same building. Some units were located in the same building as the paediatric wards (60%) and the A&E department (50%) as detailed in table 2.
Area Same Floor % (n)
Same Building% (n)
Same Site% (n)
Another Site% (n)
Another Hospital
% (n) Delivery Suite 69.3 (106)
29.4 (45) 1.3 (2) - -
Paediatric Ward
17.6 (27)
42.5 (65)
27.5 (42)
7.8 (12)
4.6 (7)
A&E
4.7 (7)
45.3 (68)
36.7 (55)
19.3 (14)
4.0 (6)
Table 2. Proximity of neonatal unit to other areas
4.1.1 Managed Clinical Networks
A larger issue at present relates to how neonatal units work with other units and the maternity services, particularly in relation to the implementation of managed clinical networks (MCNs) in neonatal care. While advocated originally in the mid-nineties as a solution to more effective cross-boundary working, the Report of the Neonatal Intensive Care Services Group, published in 2003, emphasised the need to form MCNs as part of the National Plan for reorganisation of neonatal intensive care services. (5;8) Substantial changes in neonatal organisation have been initiated, with nationally agreed guidelines to define categories of care as well as the level of service provided by various units (14), though parallel maternity service network developments have yet to take place. This important change in the service and the way in which it is delivered will affect many different aspects of care, including where care is located, transport services, patterns of transfer and families’ experiences of neonatal care. Respondents were asked about their unit’s involvement in networks: to indicate whether the unit was part of a network and if so, to identify the network, the stage of development reached and the designation of units within the network, including the lead centre. However, as the process of setting up networks is ongoing, the responses were varied. Some networks are planned, others established and functioning and some regions and parts of the United Kingdom have yet to adopt this approach to neonatal care. A total number of 24 networks were reported for
7
England. Not all respondents were able to provide detailed information about their own network, reflecting uncertainty and the stage of development in their area. Based on data from the 90 respondents about the networks in England network size was reported to range from 4-17 units, with a mean of 7.9 and median of 8 per network. This generally fits with the information provided for the British Association of Perinatal Medicine (BAPM) website by network managers and network leads. On average networks were reported to have 1.9 Level 1 units, 4.0 at Level 2 and 2.6 at Level 3. Views about the numbers of Level 3 units were largely similar (ranging from 1-4 per network), though agreement about the identity of these varied slightly. Additionally, some large Level 3 units were described as ‘Level 4’ or ‘Perinatal Centres’. In some cases there was uncertainty or disagreement about designation or decisions had yet to be made. This was reflected in more varied answers about the configuration of neonatal services within the same network. Option appraisals were still taking place and in some instances public consultations were planned. There was widespread recognition among the respondents of the possible benefits of network organisation (such as improvements in the quality of care, more effective cot management, sharing best practice and protocols, and allowing easier and more appropriate access to neonatal intensive care for the sickest infants). Concerns were also expressed about changes in status and the ability of services to provide care locally. Research studies on networks, including data collection on outcomes will be required if this kind of change is to be evaluated. (15)
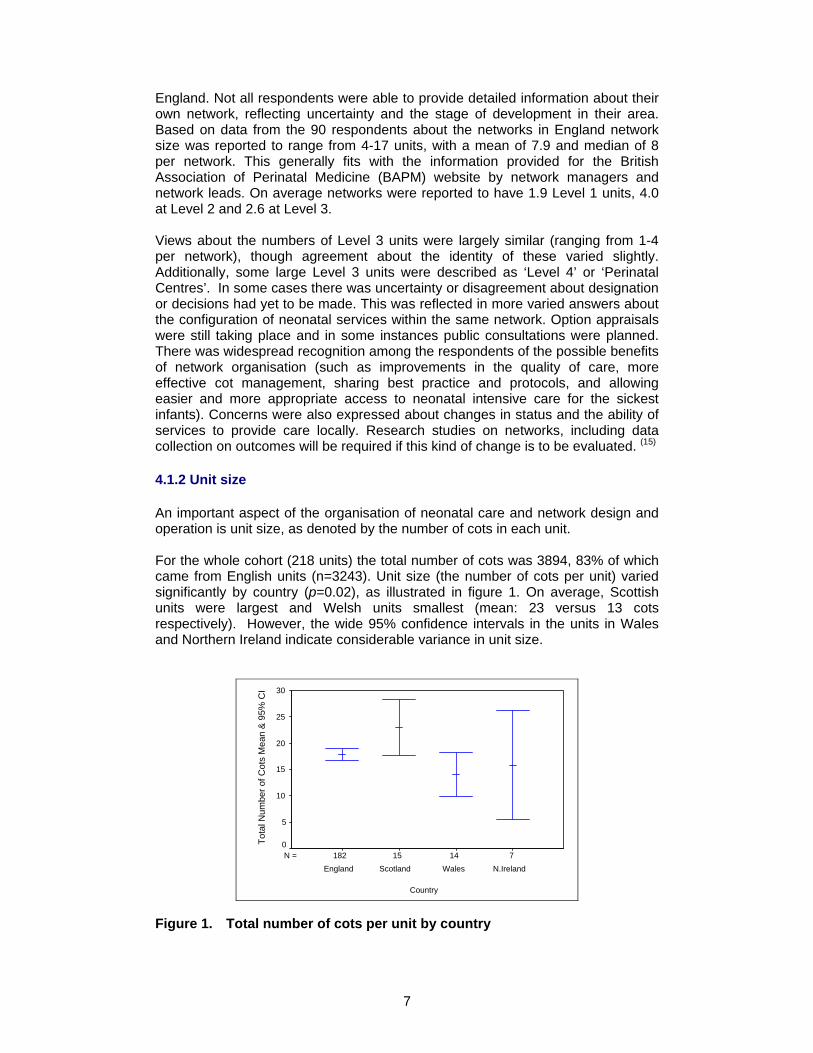
4.1.2 Unit size
An important aspect of the organisation of neonatal care and network design and operation is unit size, as denoted by the number of cots in each unit. For the whole cohort (218 units) the total number of cots was 3894, 83% of which came from English units (n=3243). Unit size (the number of cots per unit) varied significantly by country (p=0.02), as illustrated in figure 1. On average, Scottish units were largest and Welsh units smallest (mean: 23 versus 13 cots respectively). However, the wide 95% confidence intervals in the units in Wales and Northern Ireland indicate considerable variance in unit size.
71415182N =
Country
N.IrelandWalesScotlandEngland
Tota
l Num
ber o
f Cot
s M
ean
& 9
5% C
I 30
25
20
15
10
5
0
Figure 1. Total number of cots per unit by country
8
The overall total number of cots for the 218 UK units equates to an average of 18 cots per unit. In the 153 study units a total of 2736 cots were provided (70% of the total number available in the UK), compared with 1158 in the non-respondent units (30%). The overall respondent unit mean for total number of cots was also 18 (s.d. 8.1) and ranged from 2-48 cots and was not significantly different from the number of cots for the non-respondent units (mean 18, s.d. 7.3). The breakdown for unit size, according to country, is presented in table 3.
Respondent Units Non-respondent Units Country Total
Cots Mean (s.d.) Range Total
Cots Mean (s.d.) Range Difference
p*
England 2278 18 (8) 5-48 965 18 (7) 7-42 0.75
Scotland 263 22 (10) 8-44 81 27 (7) 20-33 0.35
Wales 102 13 (7) 2-26 94 16 (7) 7-27 0.44
Northern Ireland 93 19 (12) 6-39 18 9 (4) 4-6 0.17
* Mann-Whitney U Test
Table 3. Total number of cots by country
4.1.3 Unit capacity
In addition to unit size, integral to neonatal organisation and functioning is the unit capacity or ability to treat and provide care for the range of illness and degree of prematurity characteristically required in neonatal care. This has been traditionally represented by the types of cot available in the neonatal unit: special care, high dependency care and intensive care. In the UK 21% cots are for intensive care, 14% for high dependency care and 65% special care (n=809, 547 and 2515 respectively). Although the proportions of intensive care cots were similar for the respondent and the non-respondent units, the non-respondents had a lower proportion of high dependency care cots with a slightly higher proportion of special care cots outlined in table 4 (15.6% versus 11% for high dependency care and 63.6% versus 68% for special care respectively).
Respondent Units Non-respondent Units Type of Cot Total
Cots Mean (s.d.) Range Total
Cots Mean (s.d.) Range
Difference p*
Intensive Care 568 4 (3.4) 0-15 241 4 (3.3) 0-12 0.9
High Dependency Care 426 3 (2.9) 0-14 121 2 (2.5) 0-17 0.01
Special Care 1738 11 (4.5) 2-25 777 12 (5.2) 3-34 0.6
* Mann-Whitney U Test
Table 4. Numbers of cot types in respondent and non-respondent units
9
A key feature of neonatal functioning and organisation is the category of neonatal unit, indicative of the level of care provided. For the purposes of this study the categorisation of units was derived using the BAPM Standards for Hospitals Providing Neonatal Intensive and High Dependency Care (2nd Edition), referred to in the Report of the Neonatal Intensive Care Services Review Group. (14;16;17) The designation in that review relies on the earlier BAPM document and describes the different levels of care as follows:
Level 1 Units provide Special Care but do not aim to provide any continuing High Dependency or Intensive Care. This term includes units with or without resident medical staff. Level 2 Units provide High Dependency Care and some short-term Intensive Care as agreed within the network. Level 3 Units provide the whole range of medical neonatal care but not necessarily all specialist services such as neonatal surgery.
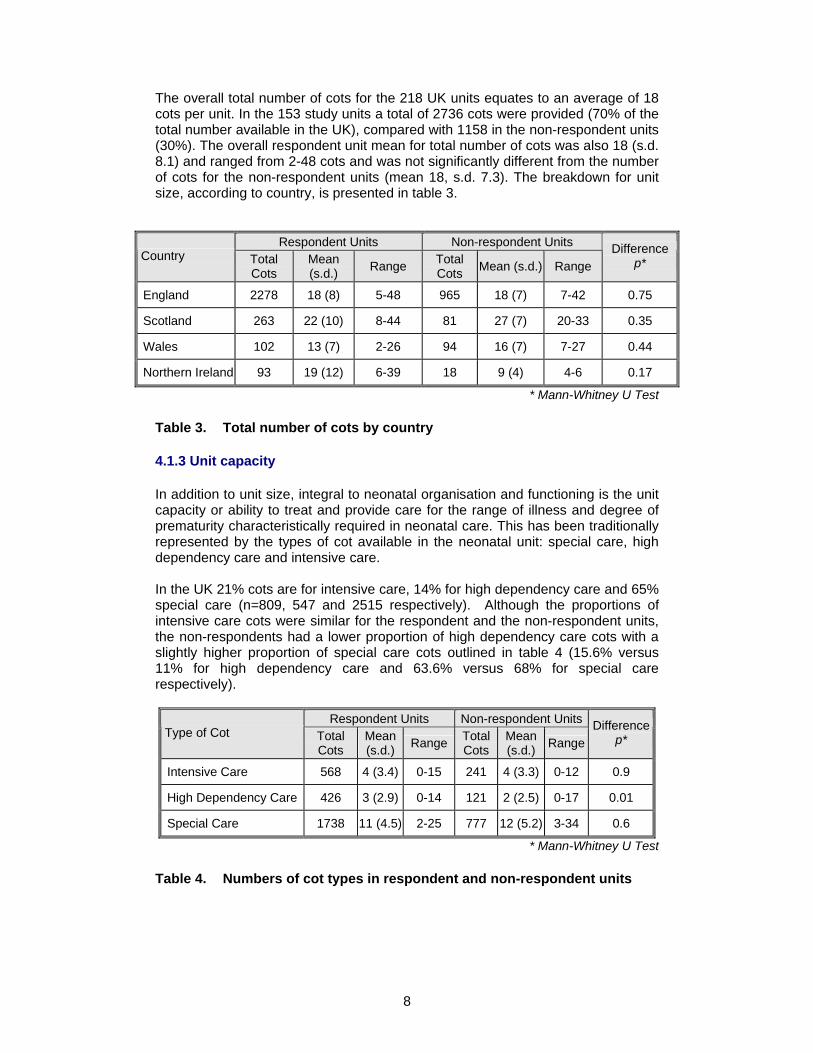
The formal designation of units is taking place in the course of the establishment of MCNs in neonatal care. However, while some units are designated and functioning in the agreed way, not all are currently doing so (see previous section). Thus it was not possible to use the designation within the networks reported in our survey to categorise the study units and to use this categorisation in analysing the data. As a consequence we mapped the above descriptions to the units and cross-checked where possible with network designation (when known) and with designation by a telephone survey carried out by BLISS in February-March 2005. A high level of agreement was found, with one unit falling outside the claimed designation and thus the categories used (Types 1, 2 and 3) map onto Levels 1, 2 and 3 quite effectively. The categories used are shown in table 5, which shows the numbers of cots according to the three unit types and the distribution by country is shown in figure 2.
UK (218 units) Type of Unit % (n)
Type 1: Special Care & < 2 High Dependency Care Cots 20.2 (44)
Type 2: Special Care, High Dependency & <3 Intensive Care Cots 34.9 (76)
Type 3: Special Care, High Dependency & >3 Intensive Care Cots 45.0 (98)
Table 5. Categorisation of UK units
10
0102030405060708090
100
Type 1 Type 2 Type 3
Unit Type
% U
nits
UKEnglandScotlandWalesN. Ireland
Figure 2. % Unit categories by country
The majority of units were Type 3 units with an average of 25 cots per unit, followed by Type 2 units with an average of 14 cots per unit as detailed in table 6. Type 1 units were the smallest with 10 cots per unit. On univariate analysis, these differences were statistically significant (p<0.01).
Respondent Units (n=153) Non-respondent Units (n=65) Total No. Cots Total No. Cots
Unit Type % (n) units in
type Mean (s.d.) Range % (n) units in
type Mean (s.d.) Range
Type 1 19.6 (30) 9.9 (2.6) 2-15 21.5 (14) 12.6 (4.7) 6-21
Type 2 36.6 (56) 14.2 (4.0) 5-22 30.8 (20) 13.2 (4.1) 7-21
Type 3 43.8 (67) 24.5 (7.2) 15-48 47.7 (31) 23.1 (6.1) 14-42
Table 6. Categorisation of unit type
The numbers and type of cots in each kind of unit are shown in table 7 for the respondent units.
No. Special Care Cots No. High Dependency Care Cots
No. Intensive Care CotsUnit Type
Mean (s.d.) Range Mean (s.d.) Range Mean (s.d.) Range
Type 1 9.1 (2.5) 2-14 0.8 (0.9) 0-2 0
Type 2 10.0 (3.9) 2-17 2.1 (1.8) 0-6 2.0 (0.8) 0-3
Type 3 13.4 (4.9) 4-25 4.2 (3.4) 0-14 6.8 (2.8) 4-15
Table 7. Number of cot types by unit type (n=153)
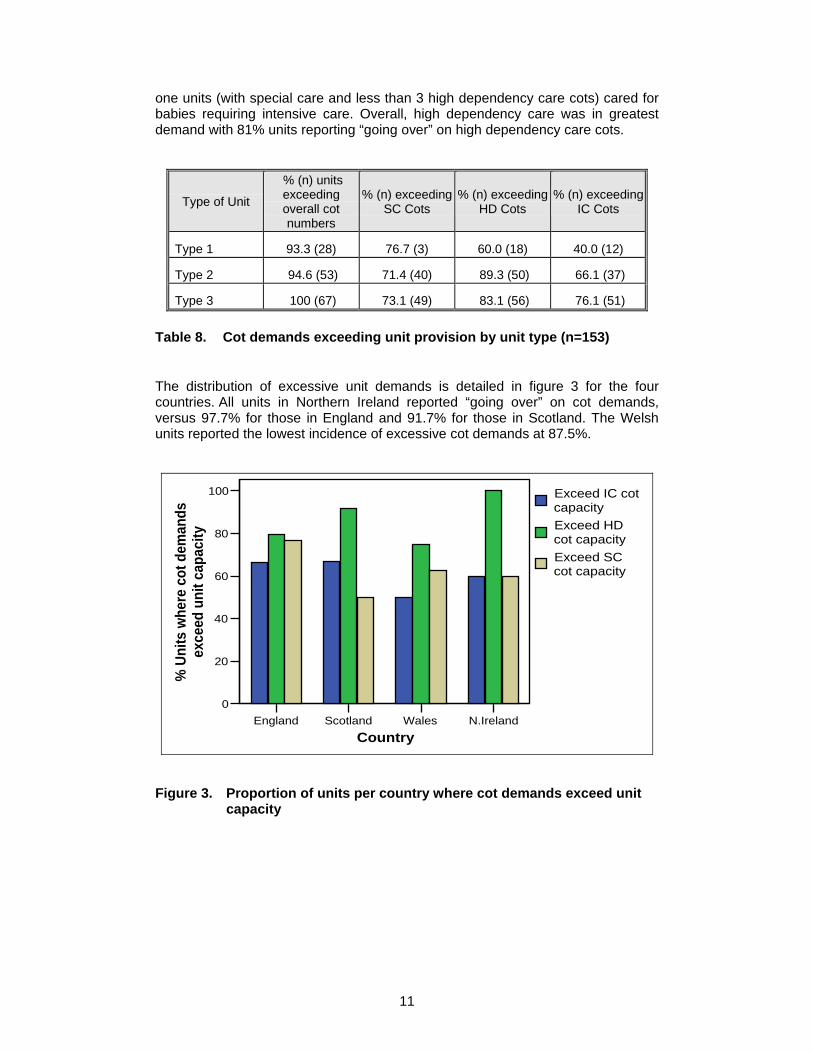
Almost all study units (97%, n=148) reported that they exceeded their unit cot capacity. Table 8 details the cot demands, which exceed the unit provision for each category of cot, grouped according to unit type. Of note, 40% (n=12) of type
11
one units (with special care and less than 3 high dependency care cots) cared for babies requiring intensive care. Overall, high dependency care was in greatest demand with 81% units reporting “going over” on high dependency care cots.
Type of Unit
% (n) units exceeding overall cot numbers
% (n) exceeding SC Cots
% (n) exceeding HD Cots
% (n) exceeding IC Cots
Type 1 93.3 (28) 76.7 (3) 60.0 (18) 40.0 (12)
Type 2 94.6 (53) 71.4 (40) 89.3 (50) 66.1 (37)
Type 3 100 (67) 73.1 (49) 83.1 (56) 76.1 (51)
Table 8. Cot demands exceeding unit provision by unit type (n=153)
The distribution of excessive unit demands is detailed in figure 3 for the four countries. All units in Northern Ireland reported “going over” on cot demands, versus 97.7% for those in England and 91.7% for those in Scotland. The Welsh units reported the lowest incidence of excessive cot demands at 87.5%.
England Scotland Wales N.IrelandCountry
0
20
40
60
80
100
% U
nits
whe
re c
ot d
eman
ds
exce
ed u
nit c
apac
ity
Exceed IC cot capacityExceed HD cot capacityExceed SC cot capacity
Figure 3. Proportion of units per country where cot demands exceed unit
capacity
12
4.1.4 Admissions
In terms of the organisation of neonatal care, the unit admission rate is closely linked with capacity, and cot types. Overall, the total number of admissions to the study units in 2003 was 51,042 infants. The unit average was 333.6 (s.d.172.1) and ranged from 45-971 infants. The number of admissions varied significantly across the three unit types (p<0.01) with Type 3 units reporting the highest average number of admissions as shown in table 9.
Number of Admissions Unit Type Total Mean (s.d.) Range
Type 1 6577 219.2 (67.0) 82-363
Type 2 14531 259.5 (91.6) 45-502
Type 3 29934 453.3 (186.6) 191-971
Table 9. Number of admissions by unit type in 2003 (n=151)
Data on birthweight distribution were reported by 134 of the 153 study units. Respondents unable to provide such a breakdown for 2003 admissions reported this as unavailable, though some were able to provide figures for gestational age groups. Half (n=21,030, 50%) of all infants admitted were low birthweight, a third of which (n=6731, 32%) were very low birthweight and 12% (n=2583) extremely low birthweight (ELBW). This ELBW group constituted 6% of the overall admissions as outlined in table 10.
Number of Admissions Birthweight
Total Mean (s.d.) Range
<1000g 2583 19.3 (19.1) 0-110
1000-1499g 4148 31.0 (18.1) 3-102
1500-2499g 14299 106.7 (50.9) 3-333
>2500g 20916 154.9 (78.5) 26-436
Table 10. Number of admissions by birthweight in 2003 (n=134)
Table 11 presents the distribution of admissions according to birthweight for each of the unit types. Of note, 4% of all very low birthweight infants (n=275) were admitted to Type 1 units which did not have intensive care cots.
13
Number of Admissions Birthweight Category
Type of Unit (134 units)
Total Mean (s.d.) Range
Type 1 159 6 (4) 0-15
Type 2 507 10 (6) 0-27 <1000g
Type 3 1917 34 (21) 1-110
Type 1 116 17 (7) 7-29
Type 2 1186 23 (10) 3-48 1000-1499g
Type 3 2539 45 (18) 9-102
Type 1 1838 74 (25) 35-139
Type 2 4699 90 (48) 3-300 1500-2499g
Type 3 7762 136 (47) 54-333
Type 1 2932 117 (39) 49-217
Type 2 6810 128 (61) 28-312 >2500g
Type 3 11174 196 (87) 26-436
Table 11. Admissions by birthweight and unit type for 2003
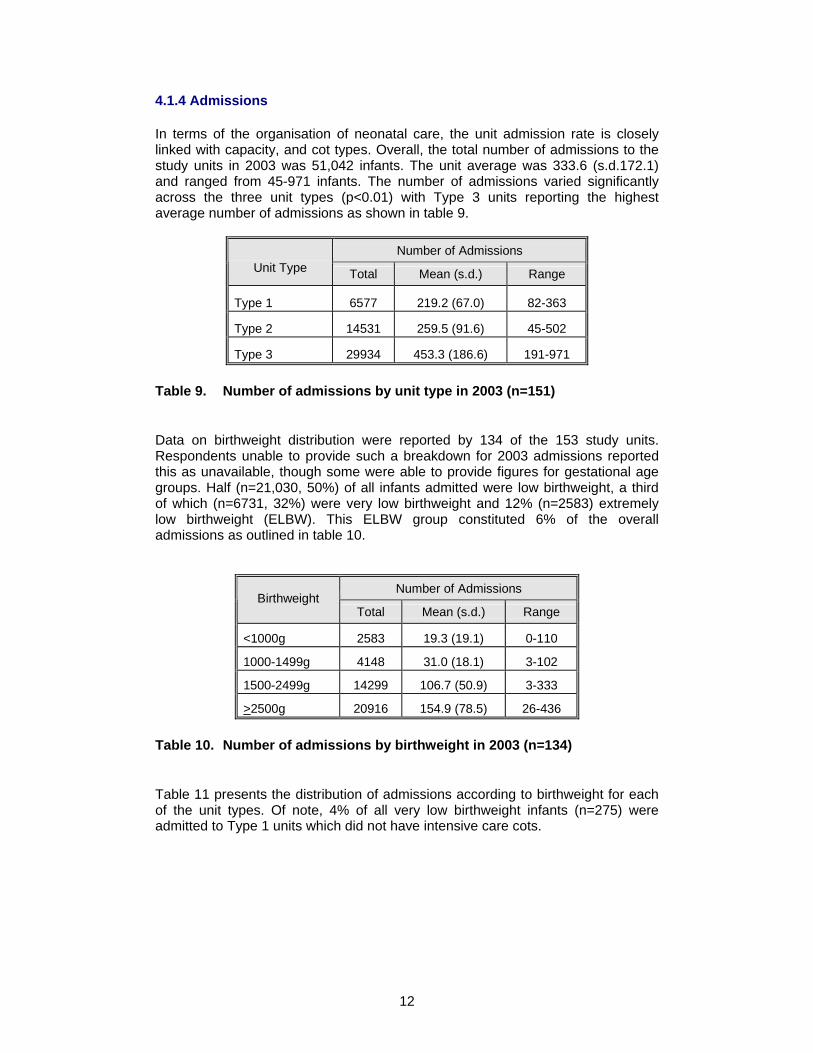
In terms of admissions there are two additional considerations: unit closure and admission policies. A total of 72% (n=110) of units reported that they had been closed to admissions in the previous six months. There was little difference in unit closures across each of the unit types, illustrated in figure 4.
Type 1 Type 2 Type 3Unit Type
0
20
40
60
80
100
% U
nits
clo
sed
in p
revi
ous
6 m
onth
s
Figure 4. Proportion of units closed to admissions in previous 6 months by unit type (n=153)
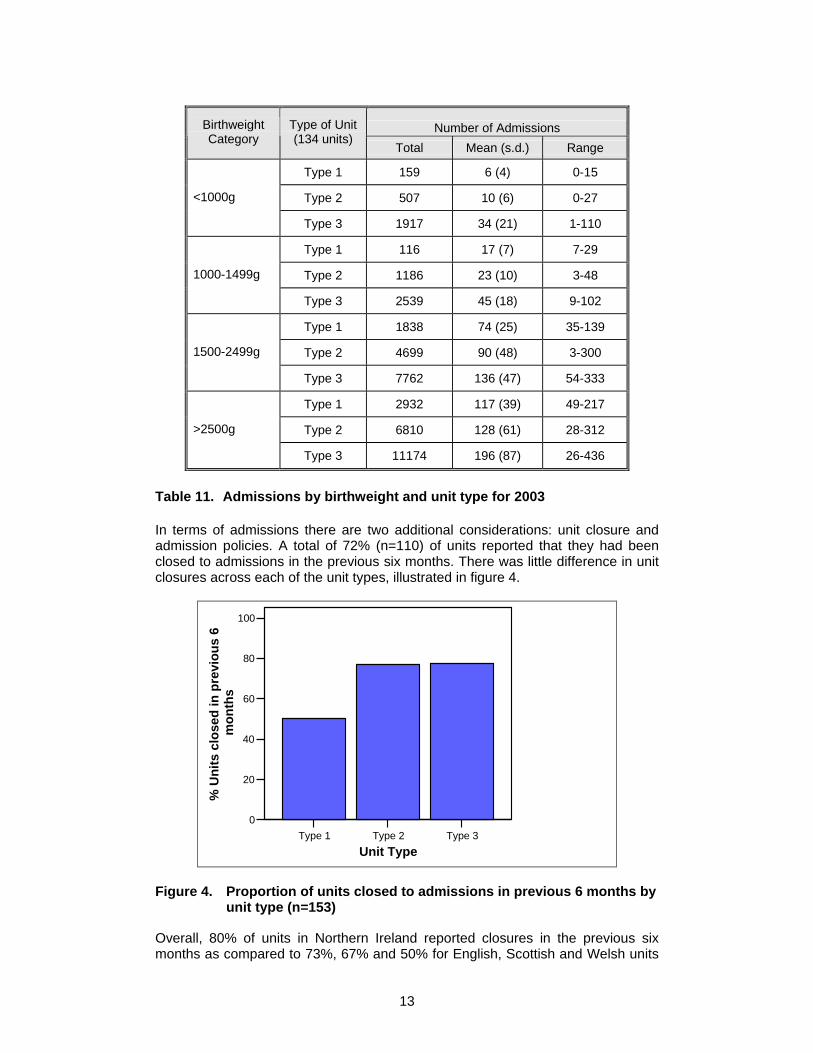
Overall, 80% of units in Northern Ireland reported closures in the previous six months as compared to 73%, 67% and 50% for English, Scottish and Welsh units
14
respectively. The breakdown of closures by unit type for each country is illustrated in figure 5.
Type 1 Type 2 Type 3Unit Type
0
20
40
60
80
100
% U
nits
clo
sed
in p
revi
ous
6 m
onth
s
EnglandScotlandWalesN.Ireland
Figure 5. Proportion of units in each country closed to admissions in the
previous 6 months by unit type (n=153)
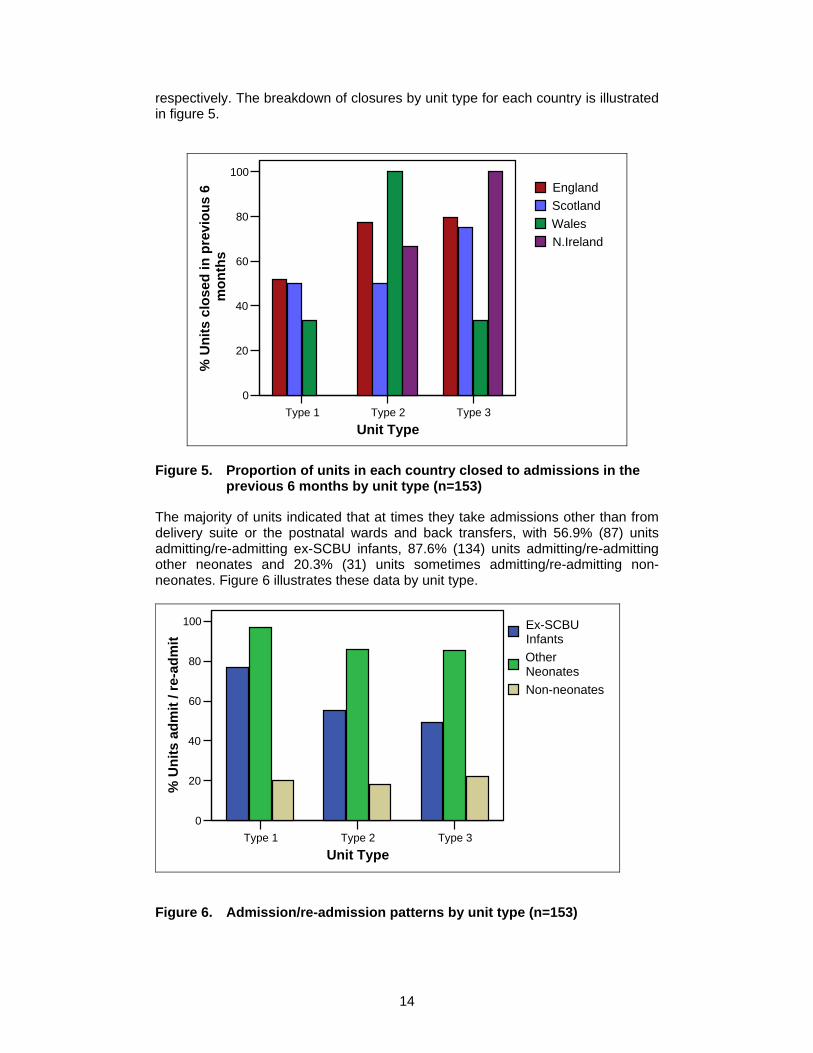
The majority of units indicated that at times they take admissions other than from delivery suite or the postnatal wards and back transfers, with 56.9% (87) units admitting/re-admitting ex-SCBU infants, 87.6% (134) units admitting/re-admitting other neonates and 20.3% (31) units sometimes admitting/re-admitting non-neonates. Figure 6 illustrates these data by unit type.
Type 1 Type 2 Type 3Unit Type
0
20
40
60
80
100
% U
nits
adm
it / r
e-ad
mit
Ex-SCBU InfantsOther NeonatesNon-neonates
Figure 6. Admission/re-admission patterns by unit type (n=153)
15
4.1.5 Assisted ventilation
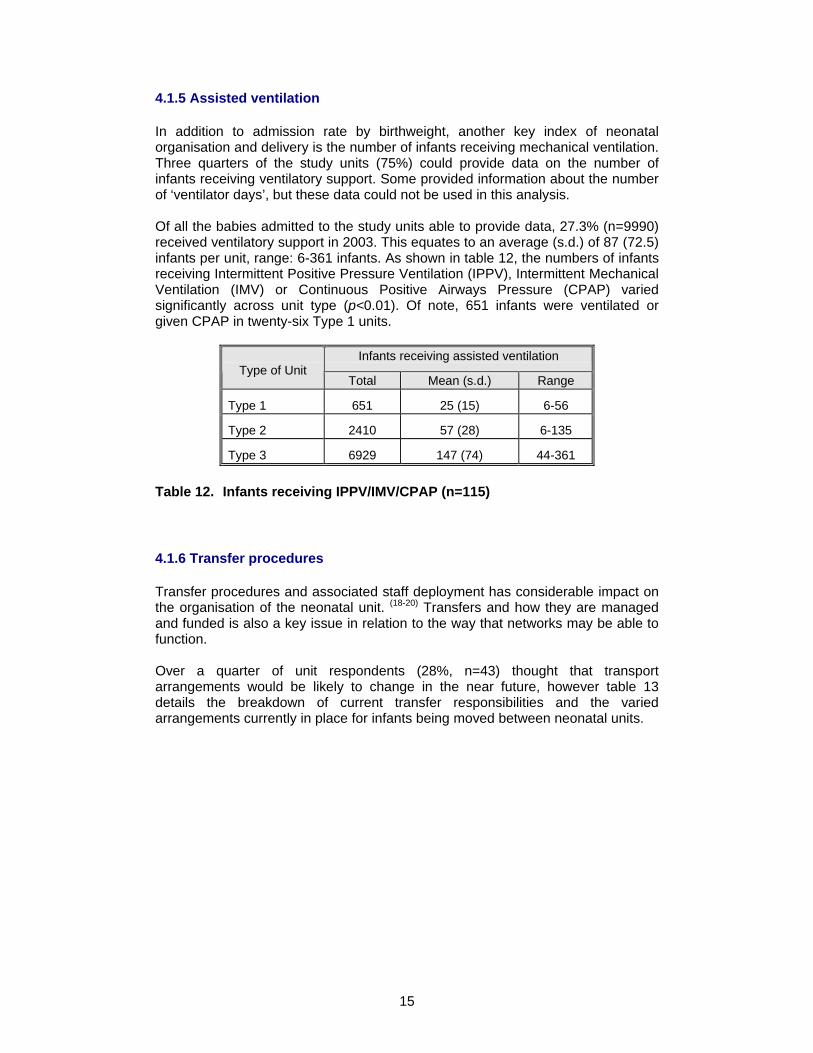
In addition to admission rate by birthweight, another key index of neonatal organisation and delivery is the number of infants receiving mechanical ventilation. Three quarters of the study units (75%) could provide data on the number of infants receiving ventilatory support. Some provided information about the number of ‘ventilator days’, but these data could not be used in this analysis. Of all the babies admitted to the study units able to provide data, 27.3% (n=9990) received ventilatory support in 2003. This equates to an average (s.d.) of 87 (72.5) infants per unit, range: 6-361 infants. As shown in table 12, the numbers of infants receiving Intermittent Positive Pressure Ventilation (IPPV), Intermittent Mechanical Ventilation (IMV) or Continuous Positive Airways Pressure (CPAP) varied significantly across unit type (p<0.01). Of note, 651 infants were ventilated or given CPAP in twenty-six Type 1 units.
Infants receiving assisted ventilation Type of Unit
Total Mean (s.d.) Range
Type 1 651 25 (15) 6-56
Type 2 2410 57 (28) 6-135
Type 3 6929 147 (74) 44-361
Table 12. Infants receiving IPPV/IMV/CPAP (n=115)
4.1.6 Transfer procedures
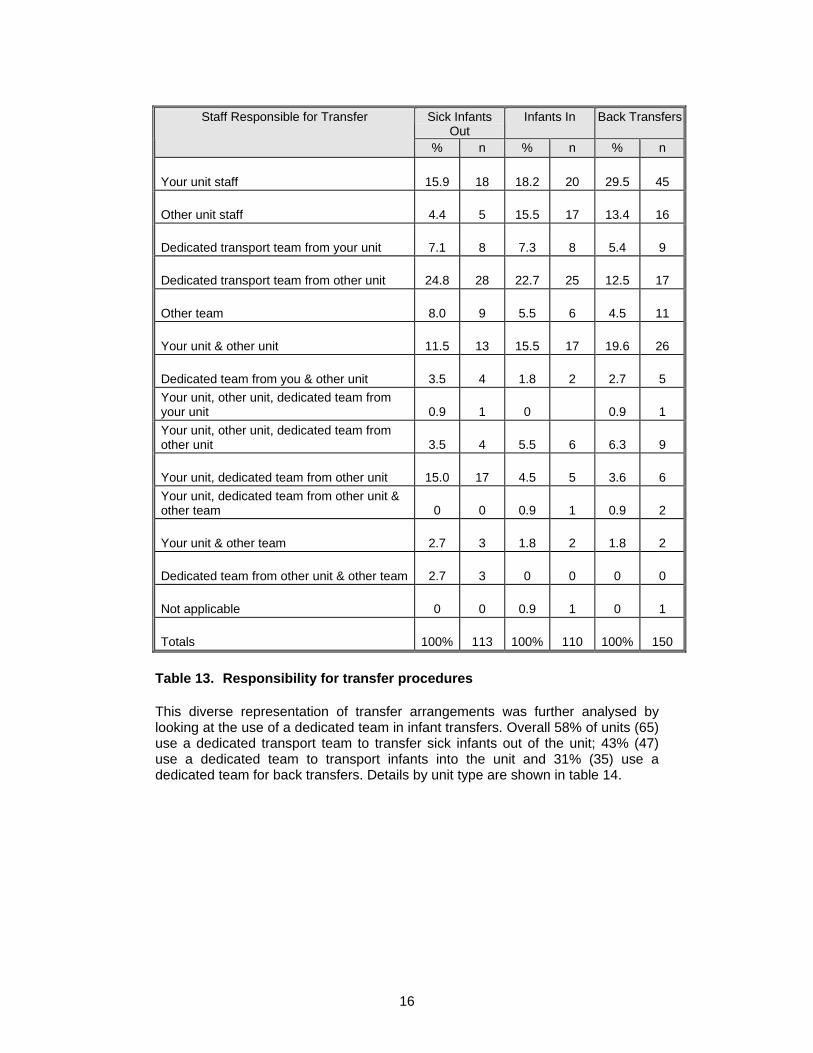
Transfer procedures and associated staff deployment has considerable impact on the organisation of the neonatal unit. (18-20) Transfers and how they are managed and funded is also a key issue in relation to the way that networks may be able to function. Over a quarter of unit respondents (28%, n=43) thought that transport arrangements would be likely to change in the near future, however table 13 details the breakdown of current transfer responsibilities and the varied arrangements currently in place for infants being moved between neonatal units.
16
Sick Infants
OutInfants In Back TransfersStaff Responsible for Transfer
% n % n % n
Your unit staff 15.9 18 18.2 20 29.5 45
Other unit staff 4.4 5 15.5 17 13.4 16
Dedicated transport team from your unit 7.1 8 7.3 8 5.4 9
Dedicated transport team from other unit 24.8 28 22.7 25 12.5 17
Other team 8.0 9 5.5 6 4.5 11
Your unit & other unit 11.5 13 15.5 17 19.6 26
Dedicated team from you & other unit 3.5 4 1.8 2 2.7 5 Your unit, other unit, dedicated team from your unit 0.9 1 0 0.9 1 Your unit, other unit, dedicated team from other unit 3.5 4 5.5 6 6.3 9
Your unit, dedicated team from other unit 15.0 17 4.5 5 3.6 6 Your unit, dedicated team from other unit & other team 0 0 0.9 1 0.9 2
Your unit & other team 2.7 3 1.8 2 1.8 2
Dedicated team from other unit & other team 2.7 3 0 0 0 0
Not applicable 0 0 0.9 1 0 1
Totals 100% 113 100% 110 100% 150
Table 13. Responsibility for transfer procedures
This diverse representation of transfer arrangements was further analysed by looking at the use of a dedicated team in infant transfers. Overall 58% of units (65) use a dedicated transport team to transfer sick infants out of the unit; 43% (47) use a dedicated team to transport infants into the unit and 31% (35) use a dedicated team for back transfers. Details by unit type are shown in table 14.
17
Type of Unit
Dedicated Transport Team for Sick Infants
Out Of The Unit % (n)
Dedicated Transport Team for Infants In To Unit
% (n)
Dedicated Transport Team for
Back Transfers % (n)
Type 1 69.2 (18) 37.5 (9) 36 (9)
Type 2 48.8 (20) 38.5 (15) 31.7 (17)
Type 3 58.7 (27) 50 (23) 28.3 (13)
Table 14. Use of dedicated transport team by unit type
Similar to transfer procedures, the sources of funding reported for transport are varied and include regional and local arrangements. However, the majority are funded from the neonatal units and trusts.
4.2 Staffing and skill mix
As in other areas of care, key components in the delivery of services are the infrastructure, skill-mix and staffing levels or manpower available. The need for adequate provision of appropriate numbers of suitably trained staff has been previously highlighted. (21-24)
4.2.1 Nurse staffing
Nurse staffing and vacancies, measured in whole time equivalents (WTEs), is shown for the study units in table 15. Overall, the total number of WTEs making up the current establishments was 5187.86, with 400.5 WTE (7.72%) vacancies. This equates to a mean nursing establishment for each unit of 36.28 WTE (4-130) with an average vacancy rate of 2.8 per unit responding with both establishment and vacancy data. However, nearly a quarter of units (24%) reported having no vacancies at all. As shown, the proportion of WTE vacancies differed relatively little by unit type. Also, perhaps surprisingly, overall the current vacancy rate of 8% of existing establishment is no different from that reported in a large-scale study of 56 neonatal units ten years previously. (1)
WTEs WTE Vacancies Unit Type Total Mean (s.d.) Range Total Mean (s.d.) Range
% Vacant of Total WTEs
Type 1 402.60 14.91(4.32) 4-24.2 25.93 0.96 (1.28) 0-5.1 6.4
Type 2 1253.08 24.60 (8.1) 10.5-49.0 102.12 1.96 (1.76) 0-7.5 8.2
Type 3 3532.18 54.34 (23.51) 21.5-130.0 272.45 4.26 (4.07) 0-16.8 7.7
Table 15. WTE and WTE vacancies by unit type (n=143)
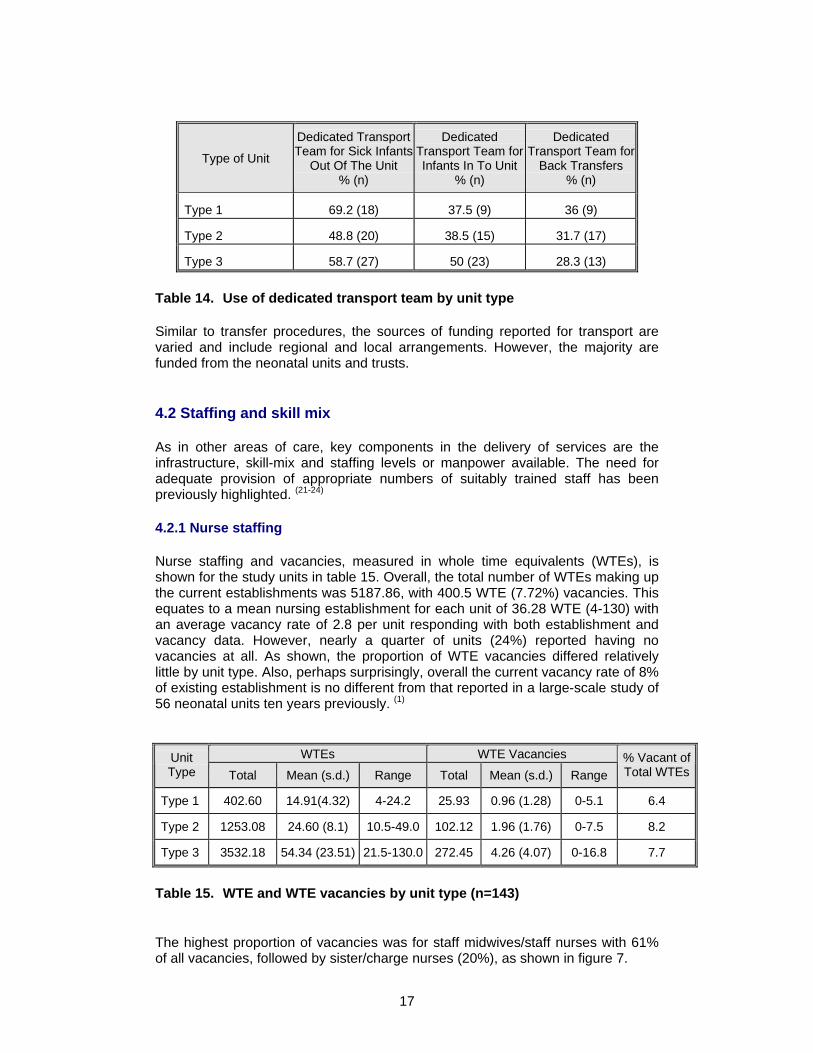
The highest proportion of vacancies was for staff midwives/staff nurses with 61% of all vacancies, followed by sister/charge nurses (20%), as shown in figure 7.
18
1.7%
19.6%
5.6%
4.1%
60.6%
0.5%
5.2%
2.8% Manager
Sister/ Charge Nurse
Clinical NurseSpecialist/TeacherNeonatal Nurse Practitioner
Staff Midw ife / Staff Nurse
State Enrolled Nurse
Health Care Assistant /Nursery NurseNursing Auxiliary
Figure 7. Proportion of vacancies by staff group
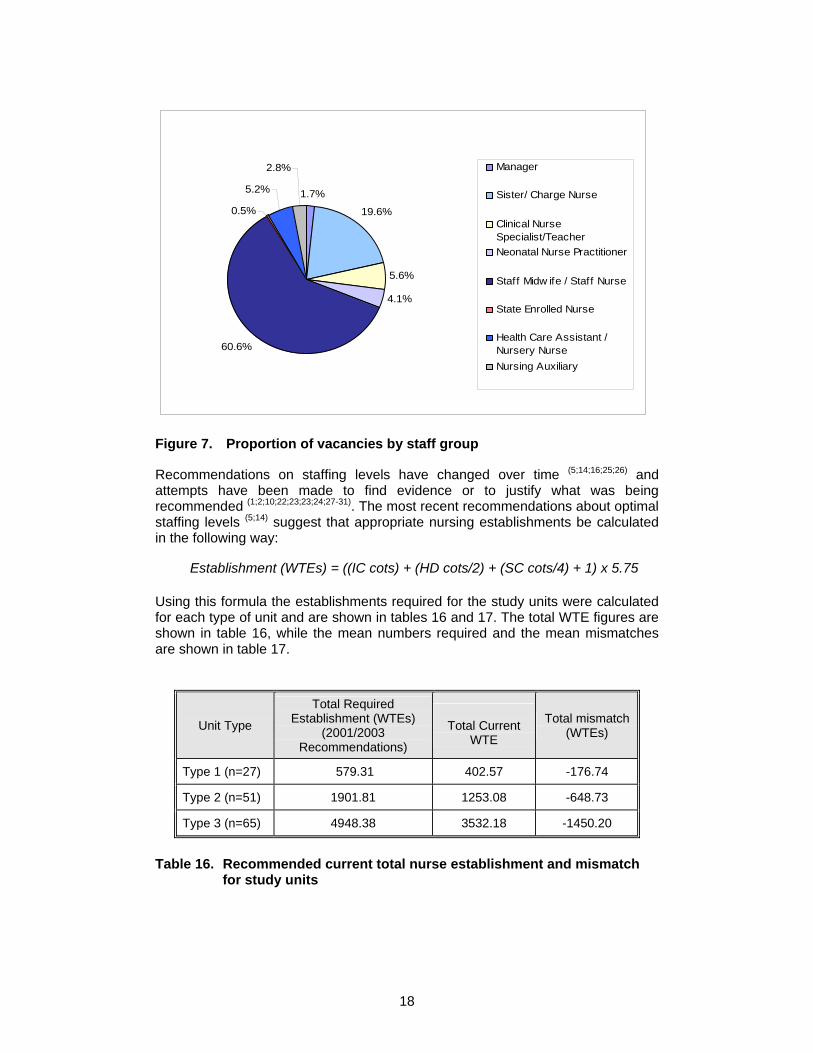
Recommendations on staffing levels have changed over time (5;14;16;25;26) and attempts have been made to find evidence or to justify what was being recommended (1;2;10;22;23;23;24;27-31). The most recent recommendations about optimal staffing levels (5;14) suggest that appropriate nursing establishments be calculated in the following way:
Establishment (WTEs) = ((IC cots) + (HD cots/2) + (SC cots/4) + 1) x 5.75
Using this formula the establishments required for the study units were calculated for each type of unit and are shown in tables 16 and 17. The total WTE figures are shown in table 16, while the mean numbers required and the mean mismatches are shown in table 17.
Unit Type
Total Required Establishment (WTEs)
(2001/2003 Recommendations)
Total Current
WTE
Total mismatch (WTEs)
Type 1 (n=27) 579.31 402.57 -176.74
Type 2 (n=51) 1901.81 1253.08 -648.73
Type 3 (n=65) 4948.38 3532.18 -1450.20
Table 16. Recommended current total nurse establishment and mismatch for study units
19
Mismatch Unit Type
Required WTEs (2001/2003
Recommendations) Mean (s.d.) Mean (s.d.) Range
Type 1 (n=27) 21.46 (3.69) -6.55 (3.19) -0.38 to -13.25
Type 2 (n=51) 37.29 (9.20) -12.72 (6.25) +0.13 to -30.6
Type 3 (n=65) 76.65 (23.41) -22.31 (12.48) +3.31 to -64.31
Table 17. Recommended mean nurse establishment and mean mismatch for study units
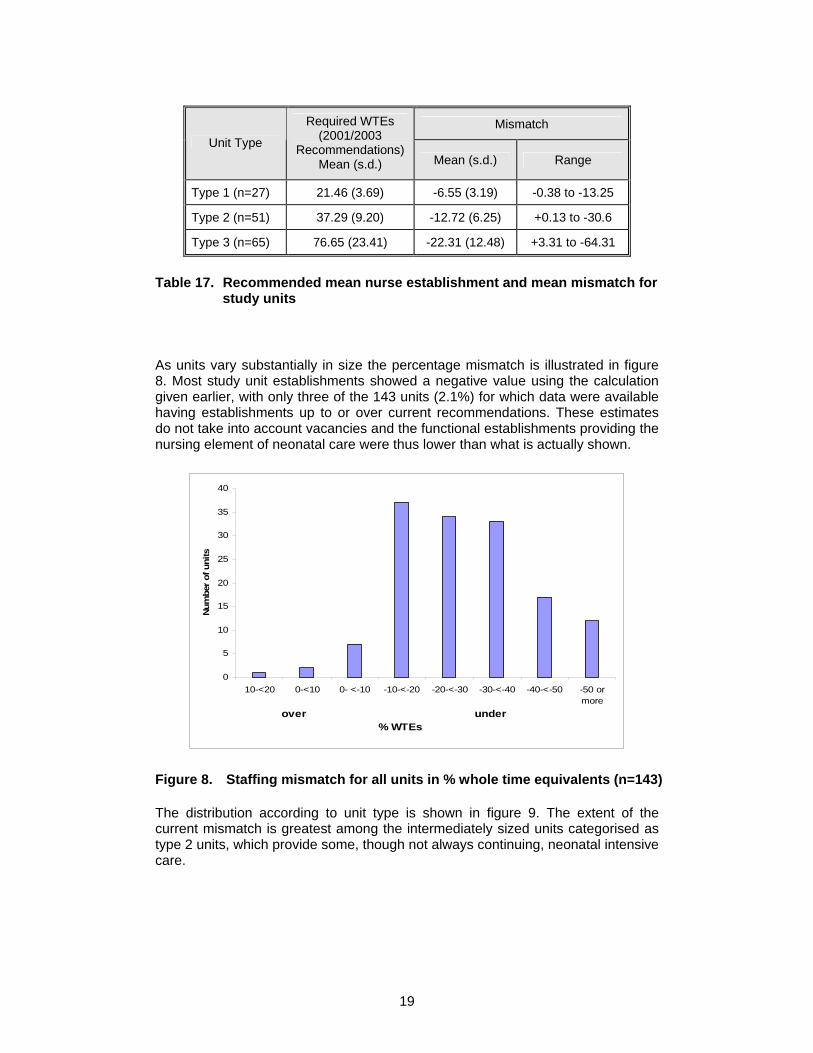
As units vary substantially in size the percentage mismatch is illustrated in figure 8. Most study unit establishments showed a negative value using the calculation given earlier, with only three of the 143 units (2.1%) for which data were available having establishments up to or over current recommendations. These estimates do not take into account vacancies and the functional establishments providing the nursing element of neonatal care were thus lower than what is actually shown.
0
5
10
15
20
25
30
35
40
10-<20 0-<10 0- <-10 -10-<-20 -20-<-30 -30-<-40 -40-<-50 -50 ormore
over under % WTEs
Num
ber
of u
nits
Figure 8. Staffing mismatch for all units in % whole time equivalents (n=143)
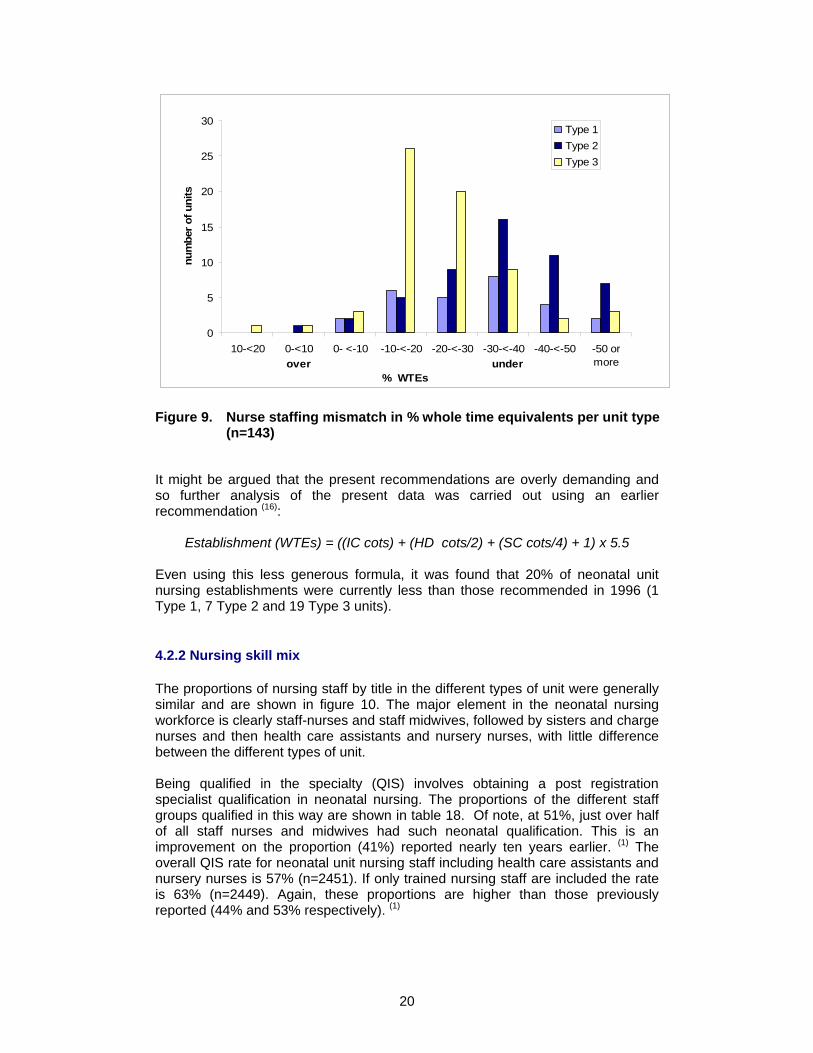
The distribution according to unit type is shown in figure 9. The extent of the current mismatch is greatest among the intermediately sized units categorised as type 2 units, which provide some, though not always continuing, neonatal intensive care.
20
0
5
10
15
20
25
30
10-<20 0-<10 0- <-10 -10-<-20 -20-<-30 -30-<-40 -40-<-50 -50 ormoreover under
% WTEs
num
ber o
f uni
ts
Type 1Type 2Type 3
Figure 9. Nurse staffing mismatch in % whole time equivalents per unit type
(n=143)
It might be argued that the present recommendations are overly demanding and so further analysis of the present data was carried out using an earlier recommendation (16):
Establishment (WTEs) = ((IC cots) + (HD cots/2) + (SC cots/4) + 1) x 5.5 Even using this less generous formula, it was found that 20% of neonatal unit nursing establishments were currently less than those recommended in 1996 (1 Type 1, 7 Type 2 and 19 Type 3 units).
4.2.2 Nursing skill mix
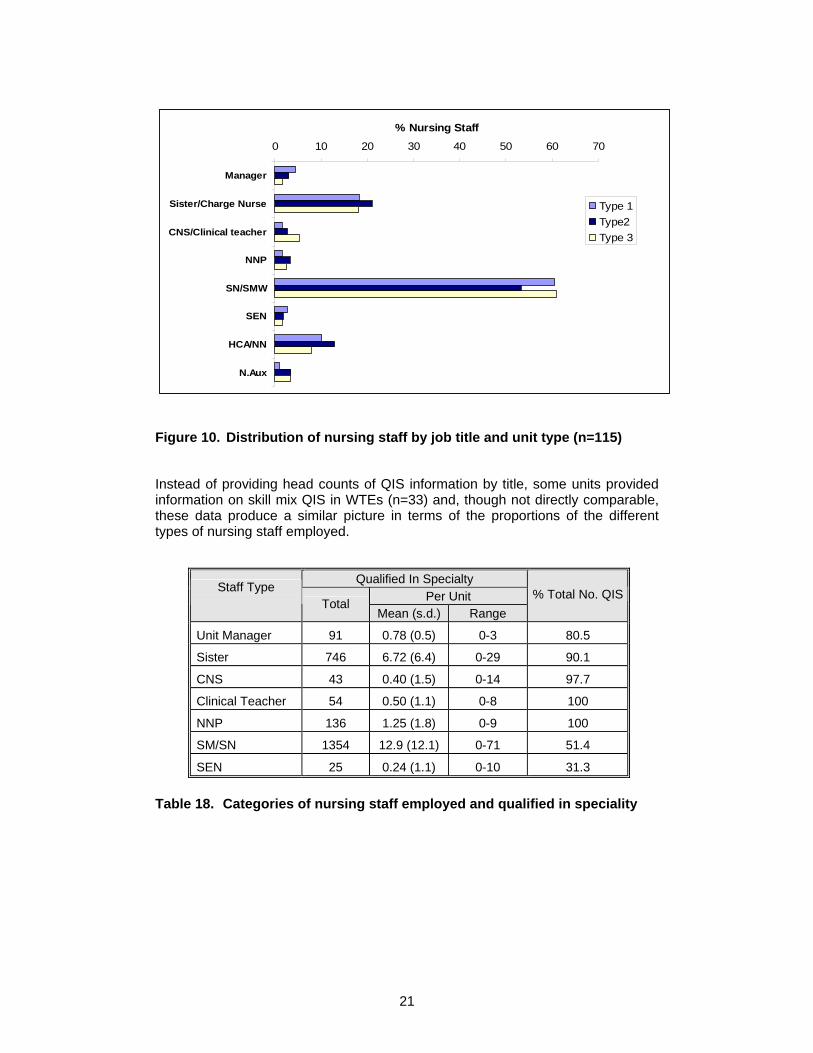
The proportions of nursing staff by title in the different types of unit were generally similar and are shown in figure 10. The major element in the neonatal nursing workforce is clearly staff-nurses and staff midwives, followed by sisters and charge nurses and then health care assistants and nursery nurses, with little difference between the different types of unit. Being qualified in the specialty (QIS) involves obtaining a post registration specialist qualification in neonatal nursing. The proportions of the different staff groups qualified in this way are shown in table 18. Of note, at 51%, just over half of all staff nurses and midwives had such neonatal qualification. This is an improvement on the proportion (41%) reported nearly ten years earlier. (1) The overall QIS rate for neonatal unit nursing staff including health care assistants and nursery nurses is 57% (n=2451). If only trained nursing staff are included the rate is 63% (n=2449). Again, these proportions are higher than those previously reported (44% and 53% respectively). (1)
21
0 10 20 30 40 50 60 70
Manager
Sister/Charge Nurse
CNS/Clinical teacher
NNP
SN/SMW
SEN
HCA/NN
N.Aux
% Nursing Staff
Type 1Type2Type 3
Figure 10. Distribution of nursing staff by job title and unit type (n=115)
Instead of providing head counts of QIS information by title, some units provided information on skill mix QIS in WTEs (n=33) and, though not directly comparable, these data produce a similar picture in terms of the proportions of the different types of nursing staff employed.
Qualified In Specialty Per Unit
Staff Type Total
Mean (s.d.) Range % Total No. QIS
Unit Manager 91 0.78 (0.5) 0-3 80.5
Sister 746 6.72 (6.4) 0-29 90.1
CNS 43 0.40 (1.5) 0-14 97.7
Clinical Teacher 54 0.50 (1.1) 0-8 100
NNP 136 1.25 (1.8) 0-9 100
SM/SN 1354 12.9 (12.1) 0-71 51.4
SEN 25 0.24 (1.1) 0-10 31.3
Table 18. Categories of nursing staff employed and qualified in speciality
22
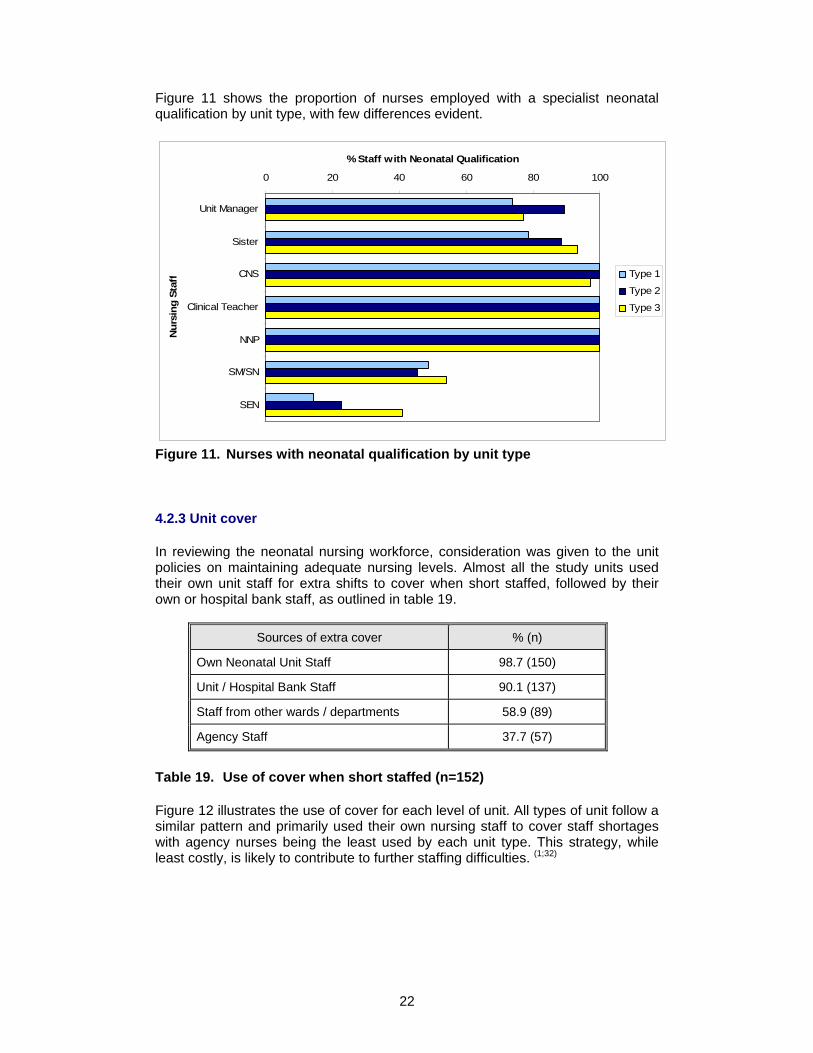
Figure 11 shows the proportion of nurses employed with a specialist neonatal qualification by unit type, with few differences evident.
0 20 40 60 80 100
Unit Manager
Sister
CNS
Clinical Teacher
NNP
SM/SN
SEN
Nur
sing
Sta
ff% Staff with Neonatal Qualification
Type 1
Type 2
Type 3
Figure 11. Nurses with neonatal qualification by unit type
4.2.3 Unit cover
In reviewing the neonatal nursing workforce, consideration was given to the unit policies on maintaining adequate nursing levels. Almost all the study units used their own unit staff for extra shifts to cover when short staffed, followed by their own or hospital bank staff, as outlined in table 19.
Sources of extra cover % (n)
Own Neonatal Unit Staff 98.7 (150)
Unit / Hospital Bank Staff 90.1 (137)
Staff from other wards / departments 58.9 (89)
Agency Staff 37.7 (57)
Table 19. Use of cover when short staffed (n=152)
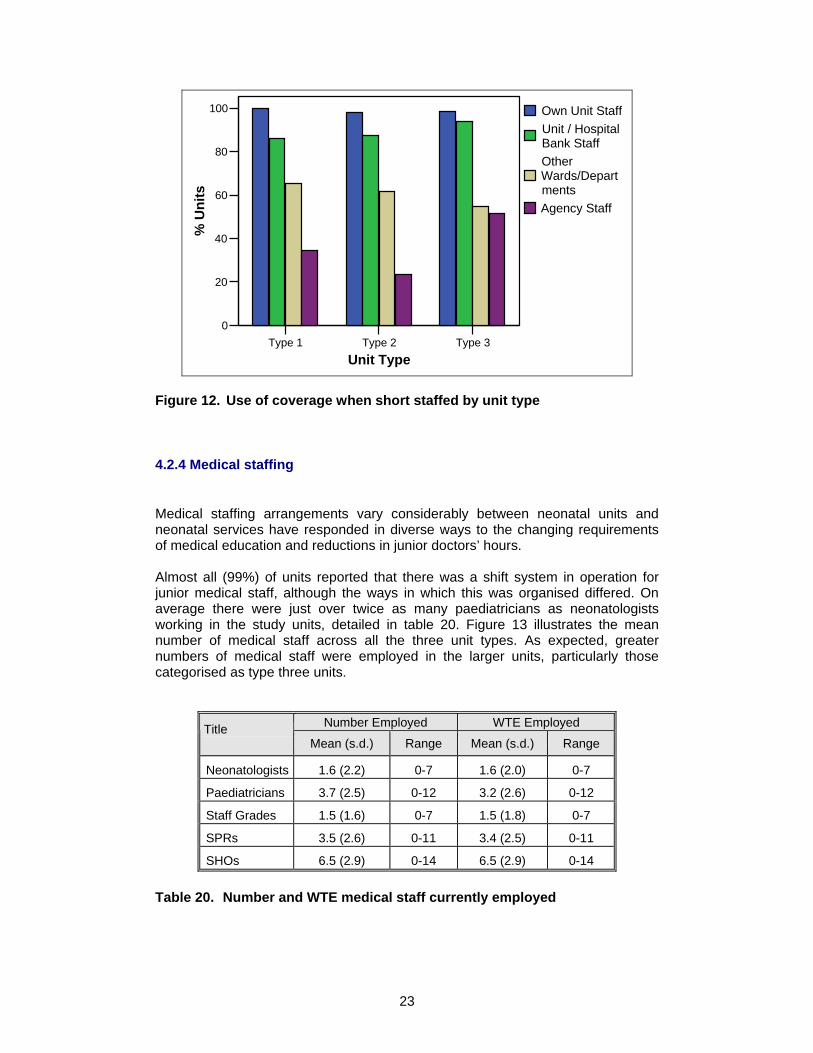
Figure 12 illustrates the use of cover for each level of unit. All types of unit follow a similar pattern and primarily used their own nursing staff to cover staff shortages with agency nurses being the least used by each unit type. This strategy, while least costly, is likely to contribute to further staffing difficulties. (1;32)
23
Type 1 Type 2 Type 3Unit Type
0
20
40
60
80
100
% U
nits
Own Unit StaffUnit / Hospital Bank StaffOther Wards/DepartmentsAgency Staff
Figure 12. Use of coverage when short staffed by unit type
4.2.4 Medical staffing
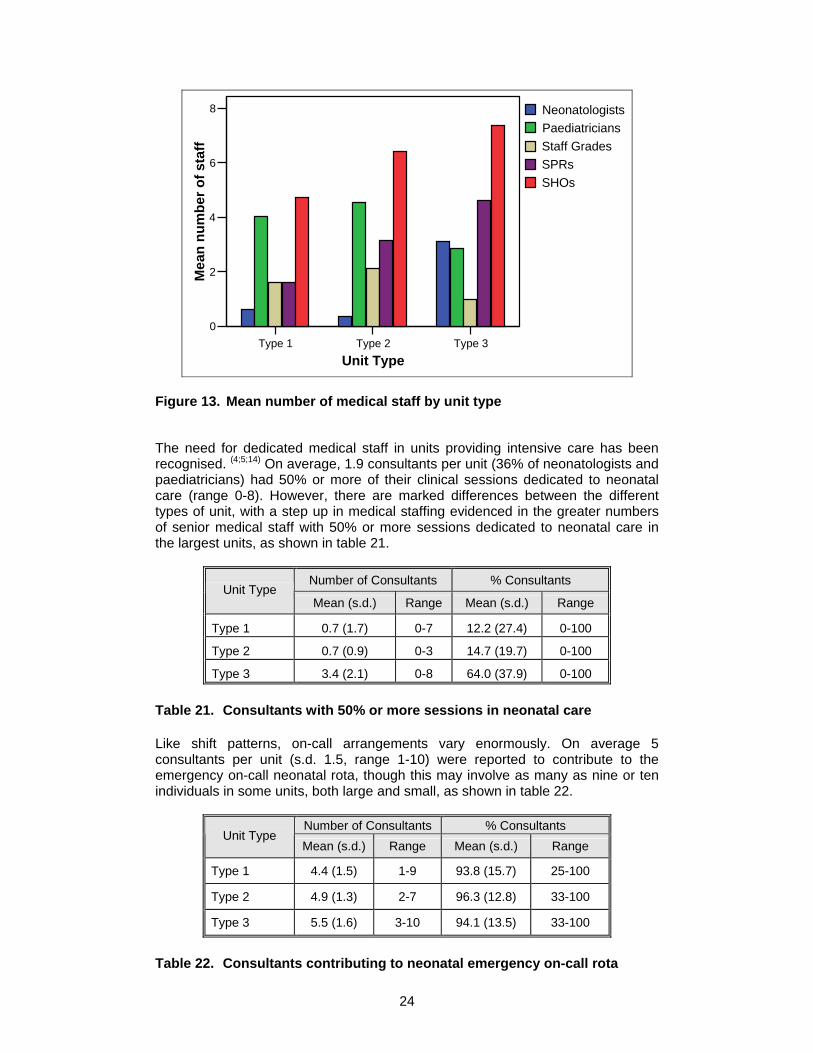
Medical staffing arrangements vary considerably between neonatal units and neonatal services have responded in diverse ways to the changing requirements of medical education and reductions in junior doctors’ hours. Almost all (99%) of units reported that there was a shift system in operation for junior medical staff, although the ways in which this was organised differed. On average there were just over twice as many paediatricians as neonatologists working in the study units, detailed in table 20. Figure 13 illustrates the mean number of medical staff across all the three unit types. As expected, greater numbers of medical staff were employed in the larger units, particularly those categorised as type three units.
Number Employed WTE Employed Title Mean (s.d.) Range Mean (s.d.) Range
Neonatologists 1.6 (2.2) 0-7 1.6 (2.0) 0-7
Paediatricians 3.7 (2.5) 0-12 3.2 (2.6) 0-12
Staff Grades 1.5 (1.6) 0-7 1.5 (1.8) 0-7
SPRs 3.5 (2.6) 0-11 3.4 (2.5) 0-11
SHOs 6.5 (2.9) 0-14 6.5 (2.9) 0-14
Table 20. Number and WTE medical staff currently employed
24
Type 1 Type 2 Type 3Unit Type
0
2
4
6
8
Mea
n nu
mbe
r of s
taff
NeonatologistsPaediatriciansStaff GradesSPRsSHOs
Figure 13. Mean number of medical staff by unit type
The need for dedicated medical staff in units providing intensive care has been recognised. (4;5;14) On average, 1.9 consultants per unit (36% of neonatologists and paediatricians) had 50% or more of their clinical sessions dedicated to neonatal care (range 0-8). However, there are marked differences between the different types of unit, with a step up in medical staffing evidenced in the greater numbers of senior medical staff with 50% or more sessions dedicated to neonatal care in the largest units, as shown in table 21.
Number of Consultants % Consultants Unit Type
Mean (s.d.) Range Mean (s.d.) Range
Type 1 0.7 (1.7) 0-7 12.2 (27.4) 0-100
Type 2 0.7 (0.9) 0-3 14.7 (19.7) 0-100
Type 3 3.4 (2.1) 0-8 64.0 (37.9) 0-100
Table 21. Consultants with 50% or more sessions in neonatal care
Like shift patterns, on-call arrangements vary enormously. On average 5 consultants per unit (s.d. 1.5, range 1-10) were reported to contribute to the emergency on-call neonatal rota, though this may involve as many as nine or ten individuals in some units, both large and small, as shown in table 22.
Number of Consultants % Consultants Unit Type
Mean (s.d.) Range Mean (s.d.) Range
Type 1 4.4 (1.5) 1-9 93.8 (15.7) 25-100
Type 2 4.9 (1.3) 2-7 96.3 (12.8) 33-100
Type 3 5.5 (1.6) 3-10 94.1 (13.5) 33-100
Table 22. Consultants contributing to neonatal emergency on-call rota
25
4.2.5 Other services
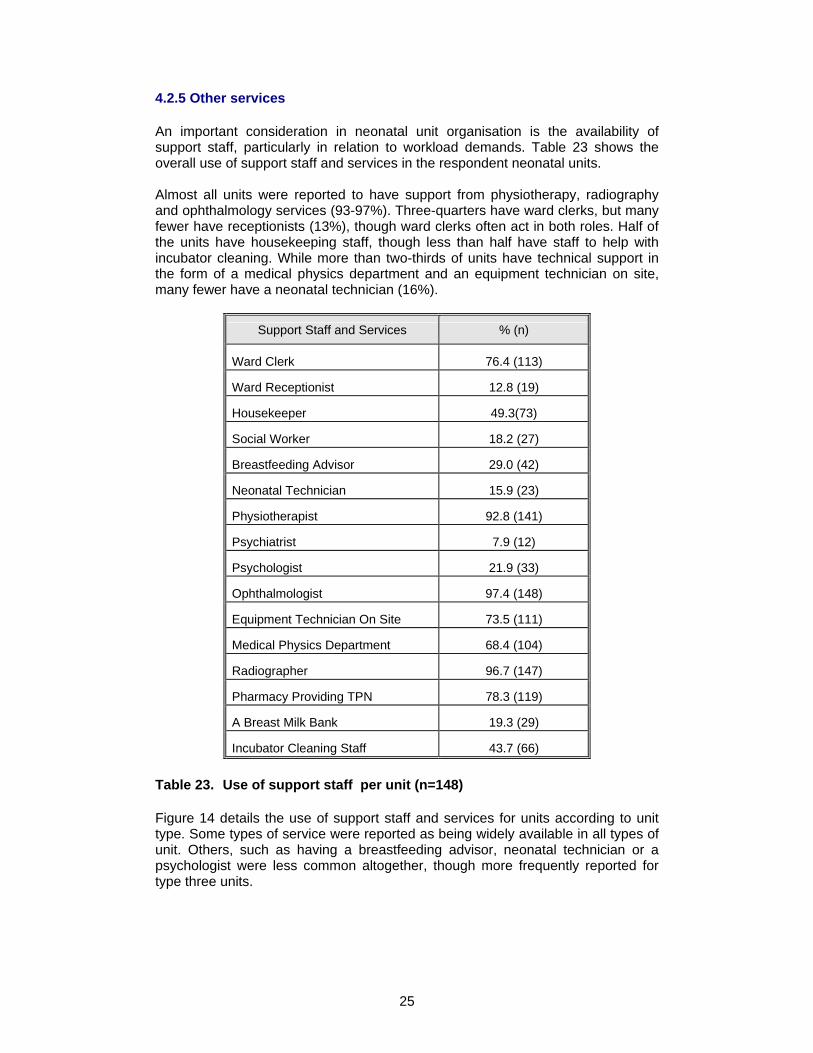
An important consideration in neonatal unit organisation is the availability of support staff, particularly in relation to workload demands. Table 23 shows the overall use of support staff and services in the respondent neonatal units. Almost all units were reported to have support from physiotherapy, radiography and ophthalmology services (93-97%). Three-quarters have ward clerks, but many fewer have receptionists (13%), though ward clerks often act in both roles. Half of the units have housekeeping staff, though less than half have staff to help with incubator cleaning. While more than two-thirds of units have technical support in the form of a medical physics department and an equipment technician on site, many fewer have a neonatal technician (16%).
Support Staff and Services % (n)
Ward Clerk 76.4 (113)
Ward Receptionist 12.8 (19)
Housekeeper 49.3(73)
Social Worker 18.2 (27)
Breastfeeding Advisor 29.0 (42)
Neonatal Technician 15.9 (23)
Physiotherapist 92.8 (141)
Psychiatrist 7.9 (12)
Psychologist 21.9 (33)
Ophthalmologist 97.4 (148)
Equipment Technician On Site 73.5 (111)
Medical Physics Department 68.4 (104)
Radiographer 96.7 (147)
Pharmacy Providing TPN 78.3 (119)
A Breast Milk Bank 19.3 (29)
Incubator Cleaning Staff 43.7 (66)
Table 23. Use of support staff per unit (n=148)
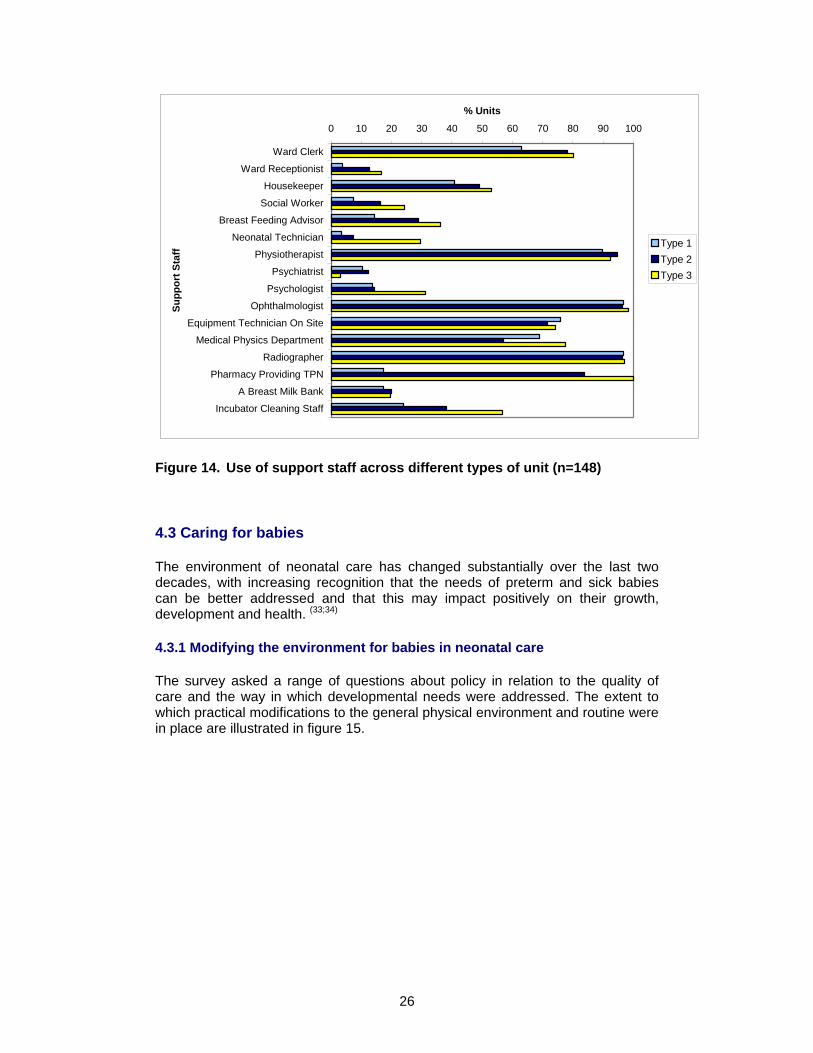
Figure 14 details the use of support staff and services for units according to unit type. Some types of service were reported as being widely available in all types of unit. Others, such as having a breastfeeding advisor, neonatal technician or a psychologist were less common altogether, though more frequently reported for type three units.
26
0 10 20 30 40 50 60 70 80 90 100
Ward Clerk
Ward Receptionist
Housekeeper
Social Worker
Breast Feeding Advisor
Neonatal Technician
Physiotherapist
Psychiatrist
Psychologist
Ophthalmologist
Equipment Technician On Site
Medical Physics Department
Radiographer
Pharmacy Providing TPN
A Breast Milk Bank
Incubator Cleaning Staff
Supp
ort S
taff
% Units
Type 1Type 2Type 3
Figure 14. Use of support staff across different types of unit (n=148)
4.3 Caring for babies
The environment of neonatal care has changed substantially over the last two decades, with increasing recognition that the needs of preterm and sick babies can be better addressed and that this may impact positively on their growth, development and health. (33;34)
4.3.1 Modifying the environment for babies in neonatal care
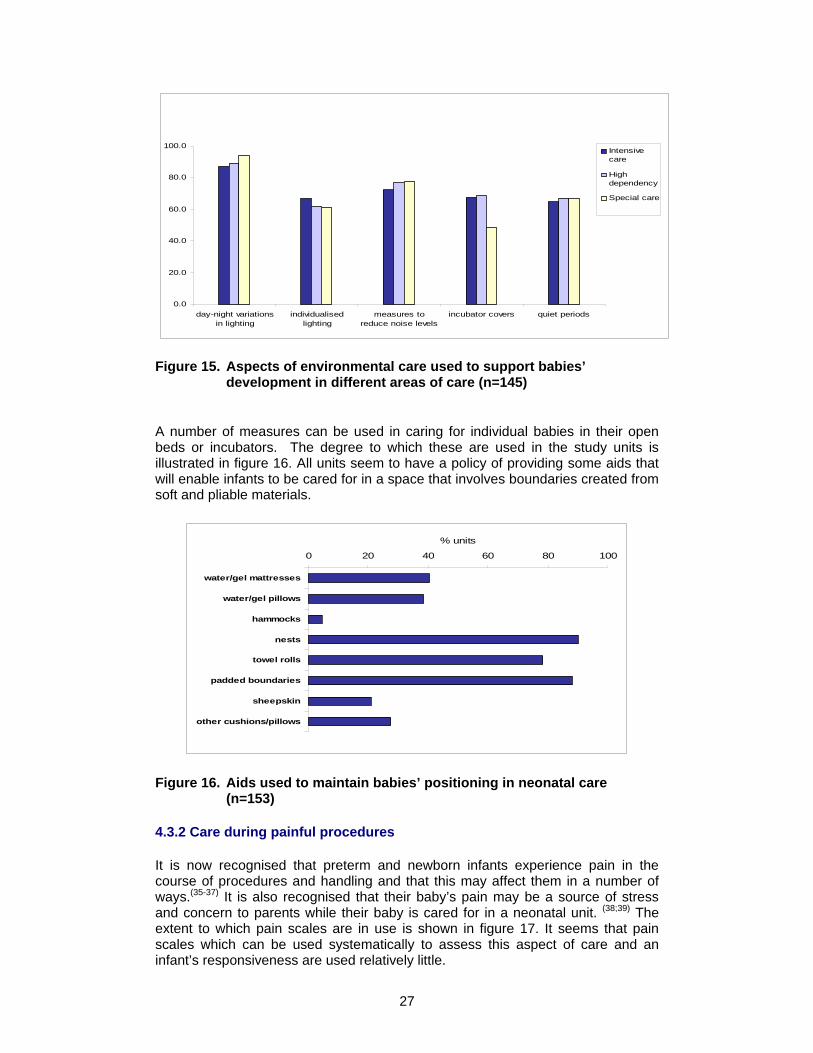
The survey asked a range of questions about policy in relation to the quality of care and the way in which developmental needs were addressed. The extent to which practical modifications to the general physical environment and routine were in place are illustrated in figure 15.
27
0.0
20.0
40.0
60.0
80.0
100.0
day-night variationsin lighting
individualisedlighting
measures toreduce noise levels
incubator covers quiet periods
Intensivecare
Highdependency
Special care
Figure 15. Aspects of environmental care used to support babies’
development in different areas of care (n=145)
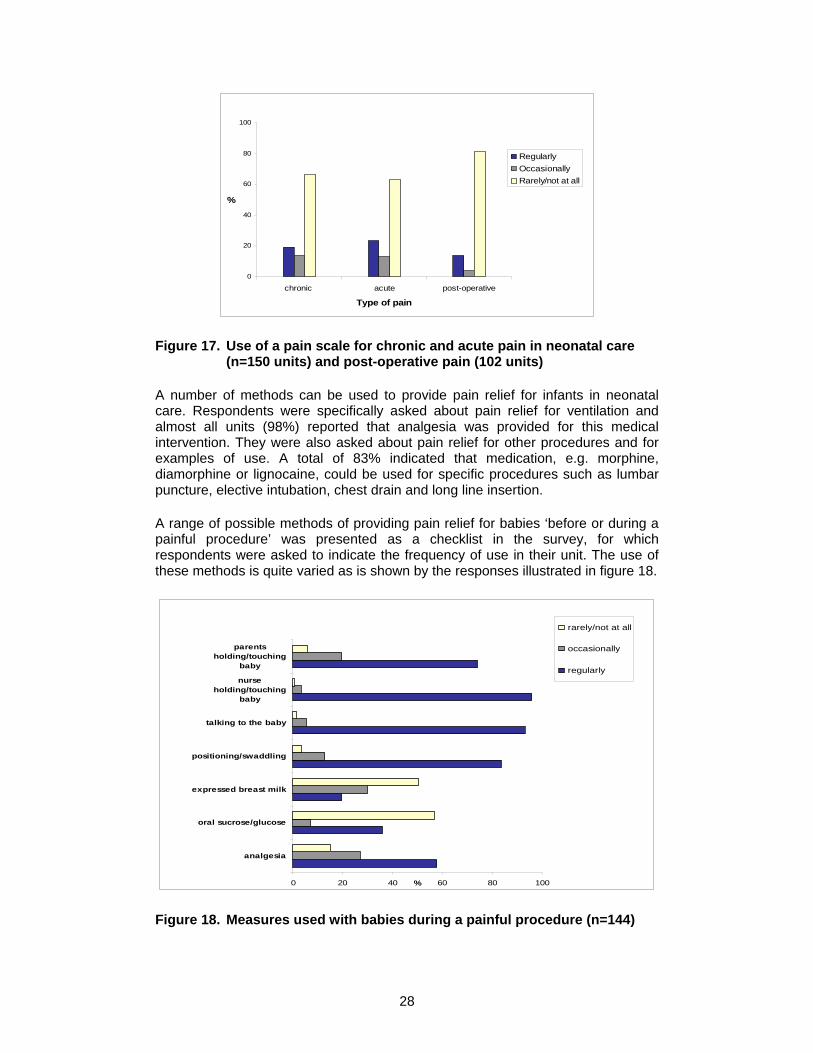
A number of measures can be used in caring for individual babies in their open beds or incubators. The degree to which these are used in the study units is illustrated in figure 16. All units seem to have a policy of providing some aids that will enable infants to be cared for in a space that involves boundaries created from soft and pliable materials.
0 20 40 60 80 100
water/gel mattresses
water/gel pillows
hammocks
nests
towel rolls
padded boundaries
sheepskin
other cushions/pillows
% units
Figure 16. Aids used to maintain babies’ positioning in neonatal care (n=153)
4.3.2 Care during painful procedures
It is now recognised that preterm and newborn infants experience pain in the course of procedures and handling and that this may affect them in a number of ways.(35-37) It is also recognised that their baby’s pain may be a source of stress and concern to parents while their baby is cared for in a neonatal unit. (38;39) The extent to which pain scales are in use is shown in figure 17. It seems that pain scales which can be used systematically to assess this aspect of care and an infant’s responsiveness are used relatively little.
28
0
20
40
60
80
100
chronic acute post-operative
Type of pain
%
RegularlyOccasionallyRarely/not at all
Figure 17. Use of a pain scale for chronic and acute pain in neonatal care (n=150 units) and post-operative pain (102 units)
A number of methods can be used to provide pain relief for infants in neonatal care. Respondents were specifically asked about pain relief for ventilation and almost all units (98%) reported that analgesia was provided for this medical intervention. They were also asked about pain relief for other procedures and for examples of use. A total of 83% indicated that medication, e.g. morphine, diamorphine or lignocaine, could be used for specific procedures such as lumbar puncture, elective intubation, chest drain and long line insertion.
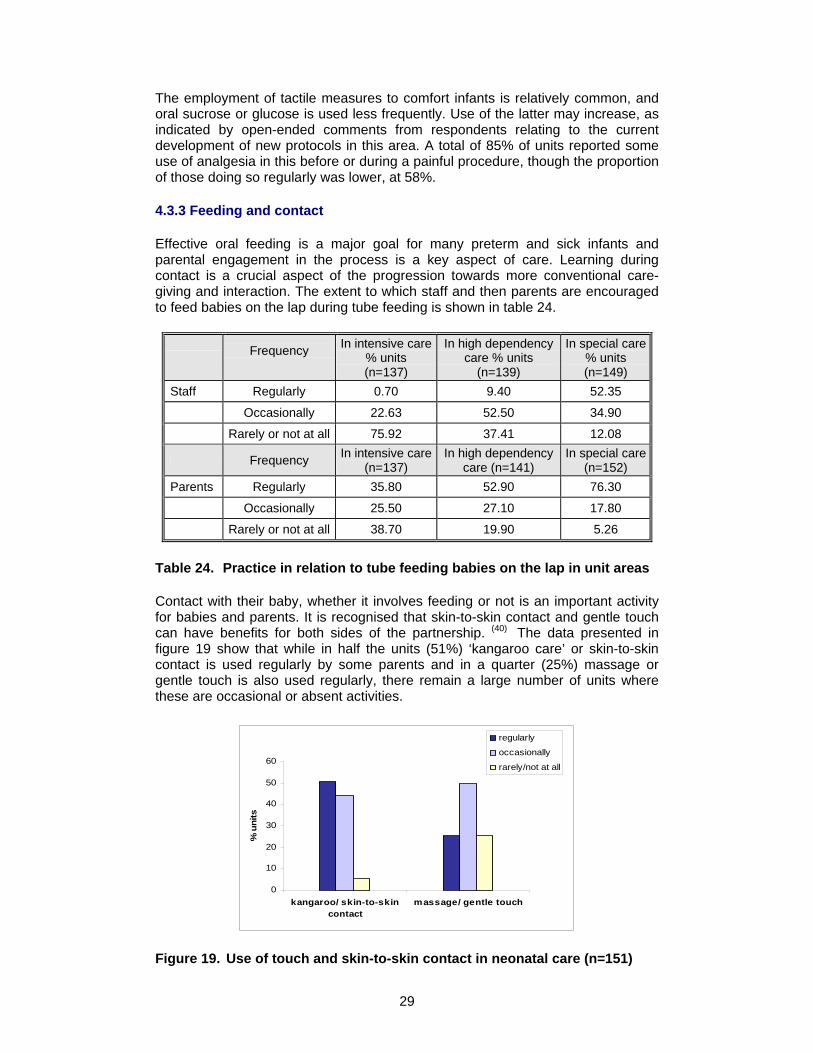
A range of possible methods of providing pain relief for babies ‘before or during a painful procedure’ was presented as a checklist in the survey, for which respondents were asked to indicate the frequency of use in their unit. The use of these methods is quite varied as is shown by the responses illustrated in figure 18.
0 20 40 60 80 100
analgesia
oral sucrose/glucose
expressed breast milk
positioning/swaddling
talking to the baby
nurseholding/touching
baby
parentsholding/touching
baby
%
rarely/not at all
occasionally
regularly
Figure 18. Measures used with babies during a painful procedure (n=144)
29
The employment of tactile measures to comfort infants is relatively common, and oral sucrose or glucose is used less frequently. Use of the latter may increase, as indicated by open-ended comments from respondents relating to the current development of new protocols in this area. A total of 85% of units reported some use of analgesia in this before or during a painful procedure, though the proportion of those doing so regularly was lower, at 58%.
4.3.3 Feeding and contact
Effective oral feeding is a major goal for many preterm and sick infants and parental engagement in the process is a key aspect of care. Learning during contact is a crucial aspect of the progression towards more conventional care-giving and interaction. The extent to which staff and then parents are encouraged to feed babies on the lap during tube feeding is shown in table 24.
Frequency
In intensive care % units (n=137)
In high dependency care % units
(n=139)
In special care % units (n=149)
Staff Regularly 0.70 9.40 52.35
Occasionally 22.63 52.50 34.90
Rarely or not at all 75.92 37.41 12.08
Frequency In intensive care (n=137)
In high dependency care (n=141)
In special care (n=152)
Parents Regularly 35.80 52.90 76.30
Occasionally 25.50 27.10 17.80
Rarely or not at all 38.70 19.90 5.26
Table 24. Practice in relation to tube feeding babies on the lap in unit areas
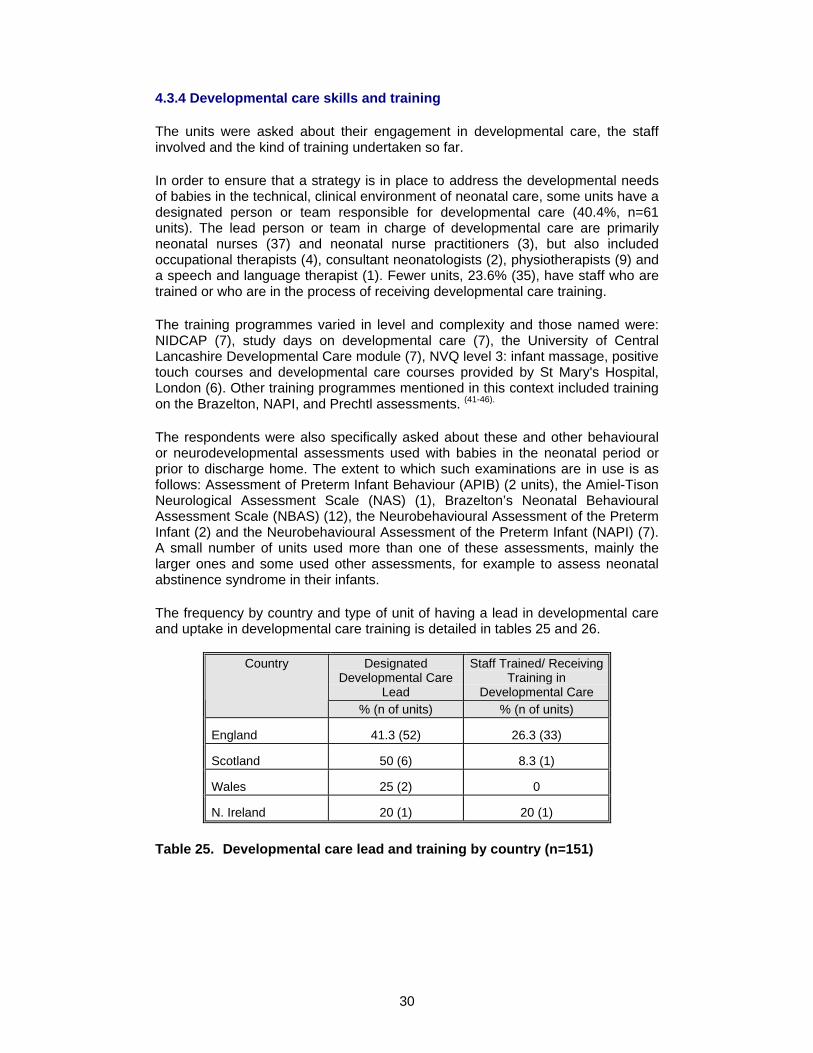
Contact with their baby, whether it involves feeding or not is an important activity for babies and parents. It is recognised that skin-to-skin contact and gentle touch can have benefits for both sides of the partnership. (40) The data presented in figure 19 show that while in half the units (51%) ‘kangaroo care’ or skin-to-skin contact is used regularly by some parents and in a quarter (25%) massage or gentle touch is also used regularly, there remain a large number of units where these are occasional or absent activities.
0
10
20
30
40
50
60
kangaroo/ skin-to-skincontact
massage/ gentle touch
% u
nits
regularly
occasionally
rarely/not at all
Figure 19. Use of touch and skin-to-skin contact in neonatal care (n=151)
30
4.3.4 Developmental care skills and training
The units were asked about their engagement in developmental care, the staff involved and the kind of training undertaken so far.
In order to ensure that a strategy is in place to address the developmental needs of babies in the technical, clinical environment of neonatal care, some units have a designated person or team responsible for developmental care (40.4%, n=61 units). The lead person or team in charge of developmental care are primarily neonatal nurses (37) and neonatal nurse practitioners (3), but also included occupational therapists (4), consultant neonatologists (2), physiotherapists (9) and a speech and language therapist (1). Fewer units, 23.6% (35), have staff who are trained or who are in the process of receiving developmental care training.
The training programmes varied in level and complexity and those named were: NIDCAP (7), study days on developmental care (7), the University of Central Lancashire Developmental Care module (7), NVQ level 3: infant massage, positive touch courses and developmental care courses provided by St Mary's Hospital, London (6). Other training programmes mentioned in this context included training on the Brazelton, NAPI, and Prechtl assessments. (41-46).
The respondents were also specifically asked about these and other behavioural or neurodevelopmental assessments used with babies in the neonatal period or prior to discharge home. The extent to which such examinations are in use is as follows: Assessment of Preterm Infant Behaviour (APIB) (2 units), the Amiel-Tison Neurological Assessment Scale (NAS) (1), Brazelton’s Neonatal Behavioural Assessment Scale (NBAS) (12), the Neurobehavioural Assessment of the Preterm Infant (2) and the Neurobehavioural Assessment of the Preterm Infant (NAPI) (7). A small number of units used more than one of these assessments, mainly the larger ones and some used other assessments, for example to assess neonatal abstinence syndrome in their infants.
The frequency by country and type of unit of having a lead in developmental care and uptake in developmental care training is detailed in tables 25 and 26.
Designated Developmental Care
Lead
Staff Trained/ Receiving Training in
Developmental Care
Country
% (n of units) % (n of units)
England 41.3 (52) 26.3 (33)
Scotland 50 (6) 8.3 (1)
Wales 25 (2) 0
N. Ireland 20 (1) 20 (1)
Table 25. Developmental care lead and training by country (n=151)
31
Designated
Developmental Care Lead
Staff Trained/ Receiving Training in
Developmental Care
Unit Type
% (n of units) % (n of units)
Type 1 27.6 (8) 14.8 (4)
Type 2 28.6 (16) 23.6 (13)
Type 3 56.1 (37) 27.3 (18)
Table 26. Developmental care lead and training by unit type (n=151)
4.4 Supporting parents
Parents with a baby being cared for in a neonatal unit need a great deal of support while their baby is in hospital and after discharge home. (39;47;48) The introduction to the neonatal unit can occur in a variety of ways. Parents who have previously had a baby who was cared for in a neonatal unit, women whose pregnancy may be at risk or who may have experienced an antenatal hospital stay and women and partners who only learn about the need for neonatal care in the course of delivery have different needs for information. The first group can also be divided into those who are using the same maternity and neonatal service as before and those who have moved or chosen to have the current baby in a different hospital, also with differing needs.
4.4.1 Information for parents
The information and communication needs of parents are substantial (1;11) and can be responded to in a variety of ways. One way of addressing some of these may be to have antenatal visits to the neonatal unit, with parents able to see the facilities and to ask questions. The study respondents were thus asked about policy relating to visits to neonatal care, by groups of parents routinely in the context of antenatal care and individual visits. The responses are shown in table 27.
Seeing the unit % (n)
Antenatal visits to the unit 94.8 (145)
By groups of parents 52.9 (81)
By individual parents 91.5 (140)
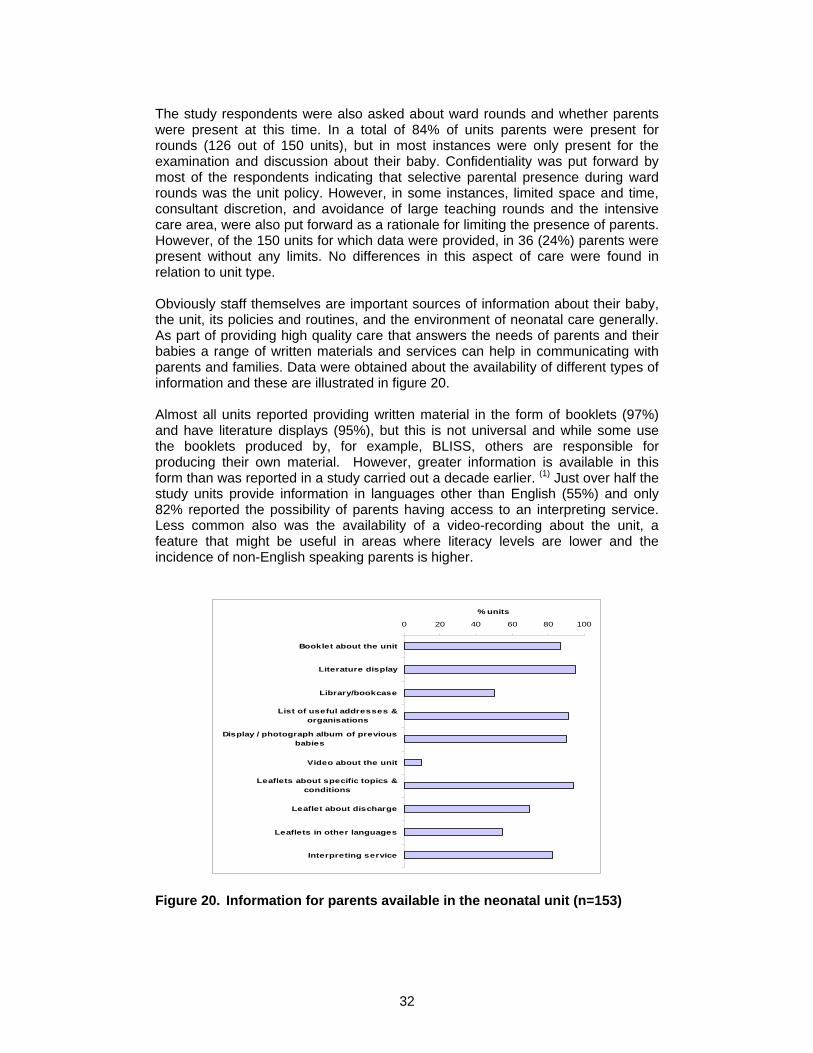
Table 27. Antenatal visits to the neonatal unit by parents (n=153)
Almost all units facilitated some kind of antenatal visit to the neonatal unit, most commonly by individual parents whose baby was likely to be admitted. Approximately half the study units had organised visits for women as part of antenatal education.
32
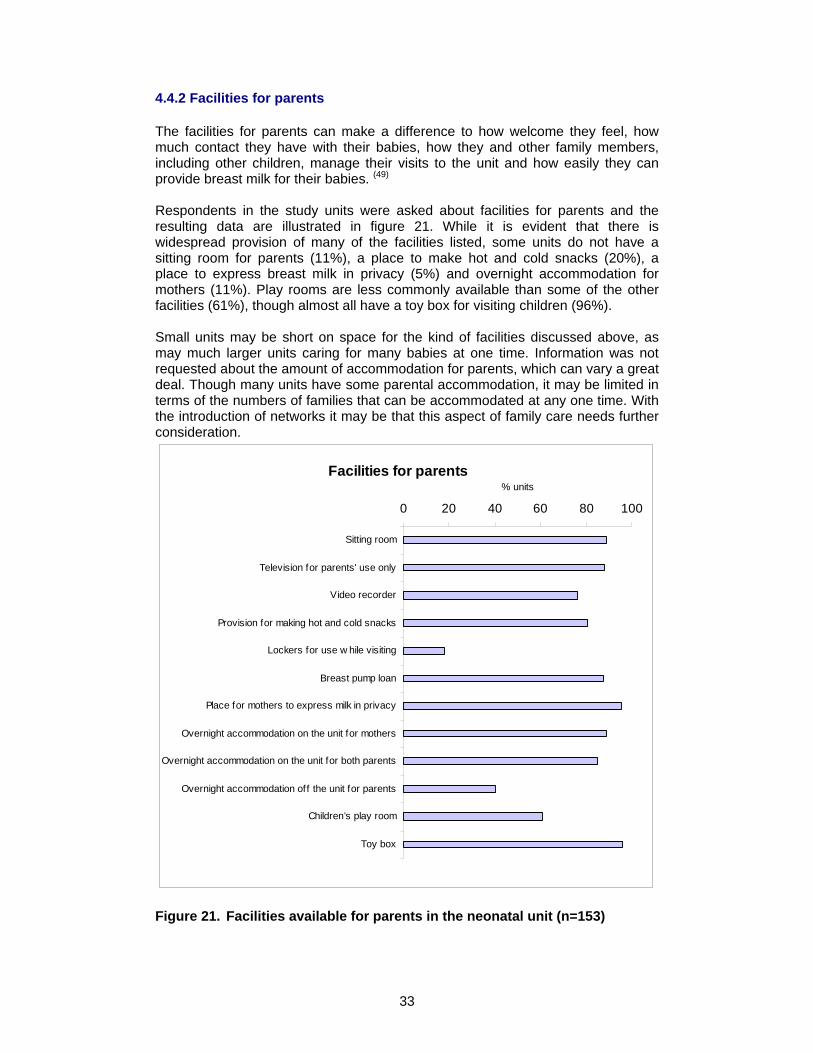
The study respondents were also asked about ward rounds and whether parents were present at this time. In a total of 84% of units parents were present for rounds (126 out of 150 units), but in most instances were only present for the examination and discussion about their baby. Confidentiality was put forward by most of the respondents indicating that selective parental presence during ward rounds was the unit policy. However, in some instances, limited space and time, consultant discretion, and avoidance of large teaching rounds and the intensive care area, were also put forward as a rationale for limiting the presence of parents. However, of the 150 units for which data were provided, in 36 (24%) parents were present without any limits. No differences in this aspect of care were found in relation to unit type. Obviously staff themselves are important sources of information about their baby, the unit, its policies and routines, and the environment of neonatal care generally. As part of providing high quality care that answers the needs of parents and their babies a range of written materials and services can help in communicating with parents and families. Data were obtained about the availability of different types of information and these are illustrated in figure 20. Almost all units reported providing written material in the form of booklets (97%) and have literature displays (95%), but this is not universal and while some use the booklets produced by, for example, BLISS, others are responsible for producing their own material. However, greater information is available in this form than was reported in a study carried out a decade earlier. (1) Just over half the study units provide information in languages other than English (55%) and only 82% reported the possibility of parents having access to an interpreting service. Less common also was the availability of a video-recording about the unit, a feature that might be useful in areas where literacy levels are lower and the incidence of non-English speaking parents is higher.
0 20 40 60 80 100
Booklet about the unit
Literature display
Library/bookcase
List of useful addresses &organisations
Display / photograph album of previousbabies
Video about the unit
Leaflets about specific topics &conditions
Leaflet about discharge
Leaflets in other languages
Interpreting service
% units
Figure 20. Information for parents available in the neonatal unit (n=153)
33
4.4.2 Facilities for parents
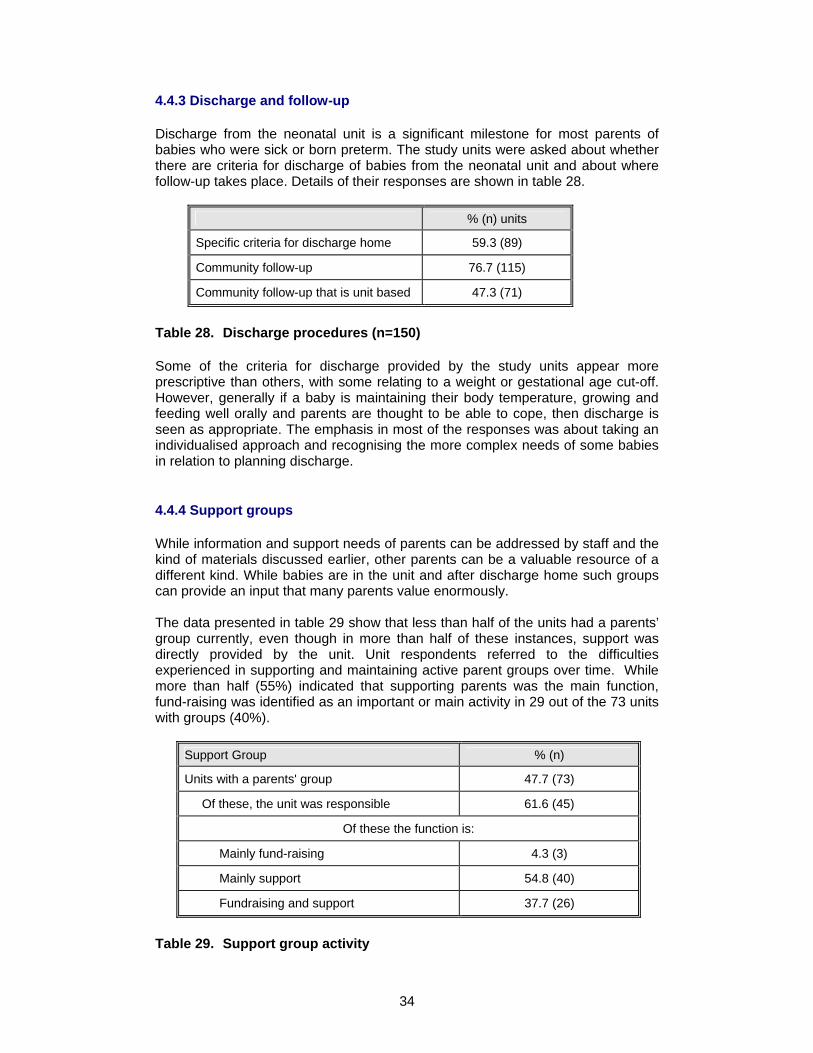
The facilities for parents can make a difference to how welcome they feel, how much contact they have with their babies, how they and other family members, including other children, manage their visits to the unit and how easily they can provide breast milk for their babies. (49) Respondents in the study units were asked about facilities for parents and the resulting data are illustrated in figure 21. While it is evident that there is widespread provision of many of the facilities listed, some units do not have a sitting room for parents (11%), a place to make hot and cold snacks (20%), a place to express breast milk in privacy (5%) and overnight accommodation for mothers (11%). Play rooms are less commonly available than some of the other facilities (61%), though almost all have a toy box for visiting children (96%). Small units may be short on space for the kind of facilities discussed above, as may much larger units caring for many babies at one time. Information was not requested about the amount of accommodation for parents, which can vary a great deal. Though many units have some parental accommodation, it may be limited in terms of the numbers of families that can be accommodated at any one time. With the introduction of networks it may be that this aspect of family care needs further consideration.
Facilities for parents
0 20 40 60 80 100
Sitting room
Television for parents' use only
Video recorder
Provision for making hot and cold snacks
Lockers for use w hile visiting
Breast pump loan
Place for mothers to express milk in privacy
Overnight accommodation on the unit for mothers
Overnight accommodation on the unit for both parents
Overnight accommodation off the unit for parents
Children’s play room
Toy box
% units
Figure 21. Facilities available for parents in the neonatal unit (n=153)
34
4.4.3 Discharge and follow-up
Discharge from the neonatal unit is a significant milestone for most parents of babies who were sick or born preterm. The study units were asked about whether there are criteria for discharge of babies from the neonatal unit and about where follow-up takes place. Details of their responses are shown in table 28.
% (n) units
Specific criteria for discharge home 59.3 (89)
Community follow-up 76.7 (115)
Community follow-up that is unit based 47.3 (71)
Table 28. Discharge procedures (n=150)
Some of the criteria for discharge provided by the study units appear more prescriptive than others, with some relating to a weight or gestational age cut-off. However, generally if a baby is maintaining their body temperature, growing and feeding well orally and parents are thought to be able to cope, then discharge is seen as appropriate. The emphasis in most of the responses was about taking an individualised approach and recognising the more complex needs of some babies in relation to planning discharge.
4.4.4 Support groups
While information and support needs of parents can be addressed by staff and the kind of materials discussed earlier, other parents can be a valuable resource of a different kind. While babies are in the unit and after discharge home such groups can provide an input that many parents value enormously. The data presented in table 29 show that less than half of the units had a parents’ group currently, even though in more than half of these instances, support was directly provided by the unit. Unit respondents referred to the difficulties experienced in supporting and maintaining active parent groups over time. While more than half (55%) indicated that supporting parents was the main function, fund-raising was identified as an important or main activity in 29 out of the 73 units with groups (40%).
Support Group % (n)
Units with a parents' group 47.7 (73)
Of these, the unit was responsible 61.6 (45)
Of these the function is:
Mainly fund-raising 4.3 (3)
Mainly support 54.8 (40)
Fundraising and support 37.7 (26)
Table 29. Support group activity
35
4.4.5 Facilities and follow-up for bereaved families
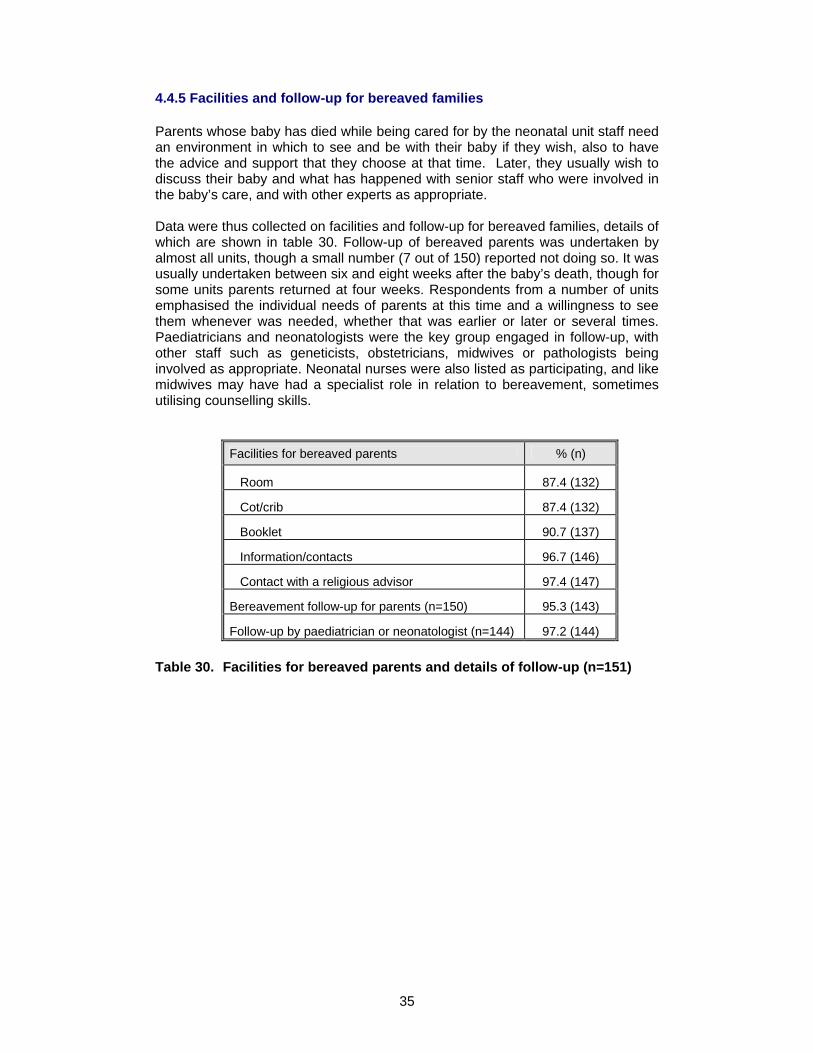
Parents whose baby has died while being cared for by the neonatal unit staff need an environment in which to see and be with their baby if they wish, also to have the advice and support that they choose at that time. Later, they usually wish to discuss their baby and what has happened with senior staff who were involved in the baby’s care, and with other experts as appropriate. Data were thus collected on facilities and follow-up for bereaved families, details of which are shown in table 30. Follow-up of bereaved parents was undertaken by almost all units, though a small number (7 out of 150) reported not doing so. It was usually undertaken between six and eight weeks after the baby’s death, though for some units parents returned at four weeks. Respondents from a number of units emphasised the individual needs of parents at this time and a willingness to see them whenever was needed, whether that was earlier or later or several times. Paediatricians and neonatologists were the key group engaged in follow-up, with other staff such as geneticists, obstetricians, midwives or pathologists being involved as appropriate. Neonatal nurses were also listed as participating, and like midwives may have had a specialist role in relation to bereavement, sometimes utilising counselling skills.
Facilities for bereaved parents % (n)
Room 87.4 (132)
Cot/crib 87.4 (132)
Booklet 90.7 (137)
Information/contacts 96.7 (146)
Contact with a religious advisor 97.4 (147)
Bereavement follow-up for parents (n=150) 95.3 (143)
Follow-up by paediatrician or neonatologist (n=144) 97.2 (144)
Table 30. Facilities for bereaved parents and details of follow-up (n=151)
36
Section 5. Conclusion
This was a broadly based study in which largely quantitative data were collected on many different aspects of neonatal care. The data presented are mainly descriptive and further analyses would be warranted in investigating the relationships between some of the major variables suggested to be significant in other studies. However, in the context of the information required by BLISS and the time frame in which the study was carried out, the data presented are of relevance to practitioners, parents, user groups and those planning services. The data can easily be compared with earlier or more local studies and provide an up-to-date picture of current practice and policy in the many areas for which data were collected. The analyses carried out and the data presented could assist in the development of indicators or markers for monitoring and evaluating neonatal services and the extent to which they relate to previous national recommendations such as the review of neonatal services. (4;5;14;16) These could apply to individual services or neonatal networks as a whole. Examples might focus on: The location of neonatal care: neonatal care provision in the same building as
delivery suite Unit designation: a more sensitive categorisation of units addressing
differences between units of the same category and linkage with provision of intensive and high dependency care
Unit admission policy: information about unit closure to admissions and over-
occupancy Transfers of mothers and babies: a dedicated transport service
Nursing establishment: staffing levels in relation to the levels of care and cots
provided, taking into account the recommendations QIS (qualification in specialty) rate: proximity to the recommendation of 70% of
nursing staff Medical staffing: meeting recommendations for dedicated senior staff numbers
and responsibilities Support staff: appropriate levels of provision for clerical work, incubator
cleaning and other support services (not undertaken by nurses) Developmental care: an identified lead for developmental care and a training
strategy in place Parent information: an information strategy and implementation plan for
introducing/maintaining high quality information for parents Parent facilities: a strategy for determining needs and an associated
implementation strategy
37
References
(1) Redshaw M, Harris A, Ingram J. Delivering Neonatal Care: the neonatal
unit as a working environment: a survey of neonatal nursing. 1996. London, HMSO.
(2) The UK Neonatal Staffing Study Group. Patient volume, staffing, and workload in relation to risk-adjusted outcomes in a random stratified sample of UK neonatal intensive care units: a prospective evaluation. The Lancet 2002; 359(9301):99-107.
(3) De Lange S, Van Aken H, Burchardi H, European Society of Intensive Care Medicine, Multidisciplinary Joint Committee of Intensive Care Medicine of the European Union of Medical Specialists. European Society of Intensive Care Medicine statement: intensive care medicine in Europe-structure, organisation and training guidelines of the Multidisciplinary Joint Committee of Intensive Care Medicine (MJCICM) of the European Union of Medical Specialists (UEMS). Intensive Care Medicine 2002 28(11):1505-1511.
(4) Department of Health Maternity and Neonatal Workforce Group. Report to the Department of Health Children's Taskforce from the Maternity and Neonatal Workforce Group. Available at: http://www.doh.gov.uk/maternitywg/report-jan03.pdf Accessed: 6-5-2003.
(5) Department of Health. Report of Department of Health Working Group on Neonatal Intensive Care Services. 2003. London, Department of Health.
(6) Draper ES, Manktelow BN, McCabe C, Field DJ. The potential impact on costs and staffing of introducing clinical networks and British Association of Perinatal Medicine standards to the delivery of neonatal care. Arch Dis Child Fetal Neonatal Ed 2004; 89(3):F236-F240.
(7) Tucker J, Parry G, Fowlie PW, McGuire W. Organisation and delivery of perinatal services. BMJ 2004; 329(7468):730-732.
(8) Mayor S. Report calls for clinical networks to improve babies' survival. BMJ 2003; 326(7391):680a.
(9) Department of Health. National Service Framework for Children, Young People and Maternity Services. 2004. London, The Stationery Office.
(10) International Neonatal Network, Scottish Neonatal Consultants, Nurses Collaborative Study Group. Risk adjusted and population based studies of the outcome for high risk infants in Scotland and Australia. Arch Dis Child Fetal Neonatal Ed 2000; 82:F118-F123.
(11) Audit Commission. First class delivery: improving maternity services in England and Wales. 1997. Abingdon, Audit Commission Publications.
38
(12) Statistical Package for the Social Sciences. Chicago: SPSS Inc, 1998.
(13) Aly H, Massaro AN, Patel K, El Mohandes AAE. Is It Safer to Intubate Premature Infants in the Delivery Room? Pediatrics 2005; 115(6):1660-1665.
(14) British Association of Perinatal Medicine. Standards for Hospitals Providing Neonatal Intensive and High Dependency Care (Second edition - December 2001). 2001. London, British Association of Perinatal Medicine.
(15) Goodwin N, Perri 6, Peck E, Freeman T, Posaner R. Managing across diverse networks: lessons from other sectors. Research and Policy Report. 2004. University of Birmingham, Health Services Management Centre.
(16) British Association of Perinatal Medicine. Standards for hospitals providing neonatal intensive care. 1996. London, British Association of Perinatal Medicine.
(17) Committee on Fetus and Newborn. Levels of Neonatal Care. Pediatrics 2004; 114(5):1341-1347.
(18) Fenton AC, Leslie A, Skeoch CH. Optimising neonatal transfer. Archives of Disease in Childhood Fetal & Neonatal Edition 2004; 89(3):F215-F219.
(19) McNamara PJ, Mak W, Whyte HE. Dedicated Neonatal Retrieval Teams Improve Delivery Room Resuscitation of Outborn Premature Infants. 2005; 25(5):309-314.
(20) Cornette L. Contemporary neonatal transport: problems and solutions. Arch Dis Child Fetal Neonatal Ed 2004; 89(3):F212-F214.
(21) Bowker RP. Infant to staff ratios and risk of mortality in very low birth weight infants. Arch Dis Child Fetal Neonatal Ed. 2004. Available at: http://fn.bmjjournals.com/cgi/eletters/88/2/F94#310 Accessed: 24-10-2005.
(22) Dorling JS, Ahluwalia JS. Infant to staff ratios and risk of mortality in very low birth weight infants. Arch Dis Child 2003; 88(12):1138-a.
(23) Parmanum J, Field D, Rennie J, Steer P. National census of availability of neonatal intensive care. BMJ 2000; 321(7263):727-729.
(24) Sochalski J. Quality of Care, Nurse Staffing, and Patient Outcomes. Policy Politics Nursing Practice 2001; 2(1):9-18.
(25) British Association of Perinatal Medicine and Neonatal Nurses Association. Report of working group of the British Association of Perinatal Medicine and Neonatal Nurses Association on categories of babies requiring neonatal care. Arch Dis Child 1992; 67(868):869.
39
(26) Clinical Standards Advisory Group. Neonatal intensive care. Access to and availability of specialist services. 1993. London, HMSO.
(27) Callaghan LA, Cartwright DW, O'Rourke P, Davies MW. Infant to staff ratios and risk of mortality in very low birthweight infants. Arch Dis Child Fetal Neonatal Ed 2003; 88(2):F94-F97.
(28) Hamilton K, Tarnow-Mordi W et al. Hospital mortality in relation to staffing levels in the first three days of neonatal care. Proceedings of the 4th Annual Congress of the Perinatal Society of Australia and New Zealand 2000. Brisbane, Australia. Sydney: PSANZ, 2000:109.
(29) Milligan DWA. Neonatal intensive care provision in the United Kingdom 1992-3. Arch Dis Child Fetal Neonatal Ed 1997; 76(3):F197-F200.
(30) Northern Neonatal Network. Requirements for neonatal cots. Arch Dis Child 1993; 68(5):544-549.
(31) Northern Neonatal Network. Measuring neonatal nursing workload. Arch Dis Child 1993; 68(5):539-543.
(32) Redshaw ME, Harris A, Ingram JC. Nursing and medical staffing in neonatal units. 1993 Journal of Nursing Management;1: 221-228.
(33) Wolke D. Psychological development of prematurely born children. Arch Dis Child 1998; 78(6):567-570.
(34) Symington A, Pinelli J. Developmental care for promoting development and preventing morbidity in preterm infants. The Cochrane Database of Systematic Reviews 2003; 4(CD001814).
(35) Sharek PJ, Powers R, Koehn A, Anand KJS. Evaluation and development of potentially better practices to improve pain management of neonates. Pediatrics 2005; In press.
(36) Simons S, van Dijk M, Anand K, Roofthooft D, van Lingen R, Tibboel D. Do We Still Hurt Newborn Babies? A Prospective Study of Procedural Pain and Analgesia in Neonates. Archives of Pediatrics & Adolescent Medicine 2003; 157(11):1058-1064.
(37) Anand KJS, Hickey P. Pain and its effects in the human neonate and fetus. 1987, New England Journal of Medicine, 317, (21):1321-1329.
(38) Franck L, Cox S, Allen A, Winter I. Measuring neonatal intensive care unit-related parental stress. Journal of Advanced Nursing 2005; 49(6):608-615.
(39) Franck LS, Cox S, Allen A, Winter I. Parental concern and distress about infant pain. Arch Dis Child Fetal Neonatal Ed 2004; 89(1):F71-F75.
40
(40) Charpak N, Ruiz J, Zupan J, Cattaneo A, Figueroa Z, Tessier R et al. Kangaroo Mother Care: 25 years after. Acta Paediatrica 2005; 94(514):522.
(41) Als H, McAnulty GB. Behavioral differences between preterm and full-term newborns as measured with the APIB system scores: I. Infant Behav Dev 1988; 11:305-318.
(42) Als H. Programme guide: newborn individualised developmental care and assessment program (NIDCAP); an education and training program for health care professionals. Boston (MA): Children's Medical Centre Corporation, 1986.
(43) Amiel-Tison C. Update of the Amiel-Tison neurological assessment for the term neonate or at 40 weeks corrected age. Pediatric Neurology 2002; 27:196-212.
(44) Brazelton TB, Nugent JK. The Neonatal Behavioral Assessment Scale. Cambridge: MacKeith Press, 1995.
(45) Korner A, Thom V. Neurobehavioural Assessment of the Preterm Infant (NAPI). San Antonio, USA: Psychological Corporation, 1990.
(46) Prechtl H. The Neurological Examination of the Full-Term Newborn Infant: A Manual for Clinical Use from the Department of Developmental Neurology. 2nd Edition ed. Cambridge: MacKeith Press, 1997.
(47) Singer LT, Salvator A, Guo S, Collin M, Lilien L, Baley J. Maternal Psychological Distress and Parenting Stress After the Birth of a Very Low-Birth-Weight Infant. JAMA 1999; 281(9):799-805.
(48) Spear ML, Leef K, Epps S, Locke R. Family reactions during infants' hospitalization in the neonatal intensive care unit. Am J Perinatol 2002; 19(4):205-214.
(49) Garcia J, Redshaw M, Fitzsimons B, Keene J. First class delivery: a national survey of women's views of maternity care. 1998. London, Audit Commission.