Embed Size (px)
Citation preview

Julie A. McClafferty Human Dimensions Division Conservation Management Institute College of Natural Resources Virginia Polytechnic Institute and State University 203 W Roanoke Street Blacksburg, VA 24061-0534 (540) 231-7348 http://fwie.fw.vt.edu
Prepared by:
Final Report for
A SURVEY OF CHESAPEAKE BAY WATERSHED RESIDENTS
KNOWLEDGE, ATTITUDES AND BEHAVIORS TOWARDS CHESAPEAKE BAY WATERSHED WATER QUALITY ISSUES
CMI-HDD-02-01 Submitted: September 11, 2002
Prepared for the
Chesapeake Bay Program

Chesapeake Bay Program - 2002 Resident Survey
I
EXECUTIVE SUMMARY The protection and restoration of the natural resources of Chesapeake Bay watershed is perhaps one of the greatest and most complex large-scale conservation efforts of all time. This large geographic area embraces both a wide range of natural resources and a large and growing population of diverse people with varied interests, goals and backgrounds. Because the residents of the watershed are intricately involved in the processes and events that occur within the watershed, working with these people to achieve the goals of the Chesapeake Bay Program is inevitable and essential. To do this, information about residents’ knowledge, attitudes and behaviors must be collected, analyzed and integrated into conservation planning efforts. To address this need, the Conservation Management Institute of Virginia Tech conducted a telephone survey of 1,988 residents of the Chesapeake Bay watershed (including those residing in parts of New York, Pennsylvania, Maryland, Delaware, West Virginia, Virginia, and Washington, D.C.) in March and April of 2002. The objectives of this survey were to assess residents’ level of knowledge about, perceptions of, attitudes towards and behaviors in relation to pollution and environmental quality of the Chesapeake Bay region. A secondary goal of the survey was to track changes in public perception regarding water quality issues since the Chesapeake Bay Program’s most recent public perception survey conducted in 1993-1994. Several questions from the current survey produced results analogous to this earlier survey. To assist in analyzing and implementing these data, the counties of the watershed were divided among 10 geographical regions according to such demographic factors as rates of population change, population density, land use patterns and household income. These regions are referenced here as Washington, D.C., Baltimore, Baltimore/Washington Metro, Tidewater, Delmarva, North-central Virginia, Shenandoah and Western Potomac, South-central Pennsylvania, North-central Pennsylvania, and New York. A minimum of 150 interviews was conducted in each region, with a goal of 200. For further analysis, these 10 regions were collapsed into four distance bands representing their relative distance from the Bay. The overall (watershed-wide) margin of error for these data is +/-2.2% with a 95% confidence level, the margins of error within each region ranges from +/-6.9% to +/-7.3%, and the margins of error for the distance bands ranges from +/-3.1% to +/-6.9%. Summary of Key Findings:
1. It is clear that residents of the Chesapeake Bay watershed are concerned with pollution in the waterways and believe that restoration of and protection for the water resources is an important venture. However, this concern is often not matched by comparable levels of individual stewardship activity. In order to meet the restoration goals of the Chesapeake Bay Program, it is critical to take specific actions to narrow this stewardship gap by raising the level of resident involvement.
2. People generally believe that one person can make a difference, yet they lack the confidence or vision to understand that they can (or should) be that one
Chesapeake Bay Program - 2002 Resident Survey
II
person. It seems that the information most needed by residents in order to encourage more active stewardship is information that personalizes and internalizes the pollution problem and its solution. These include information about how pollution affects them personally, information about how their personal actions contribute to the pollution problem, information about what they can do, and information about how their actions can make a difference in improving water quality.
3. The potential for stewardship action in any given region clearly is considerably higher than currently realized. Washington, D.C. and Baltimore exhibit an interesting collection of characteristics; residents of these two highly populated regions represent the least knowledgeable and least active in the watershed, but also are among the most concerned and most interested in becoming more involved. This juxtaposition delineates a clear regional need for outreach programs and represents a critical, but largely untapped “reserve” of potential activists.
Knowledge: Respondent knowledge levels were measured implicitly in this study with one question asking respondents to identify the correct definition of ‘watershed’ in a multiple-choice context offering four options.
Ø Overall, 48% of respondents correctly identified the definition of ‘watershed’ from a list of four options. This is comparable to the 1997 National Environmental Education Training Foundation’s (NEETF) survey in which 2 in 5 Americans correctly identified the appropriate definition from a similar multiple-choice question with four options.
Ø As educational attainment increases and as income increases, respondent ability to define a watershed increases (ranging from 41% for respondents with less than a high school diploma to 77% for respondents with a graduate degree and from 40% for respondents earning <$15,000 to 76% for respondents earning >$100,000). Also, White respondents scored better (65% correct) than Black respondents (36% correct), with other races scoring in between.
Ø The lowest knowledge scores were obtained in Baltimore (35% correct), North-central Pennsylvania (44%) and Washington, D.C. (45% correct). The highest knowledge scores were obtained in the North-central Virginia (54% correct), Delmarva (53% correct), Baltimore/Washington Metro (53% correct), New York (52%) and Tidewater (51% correct) regions. In general, regions with a more agricultural environment and regions with a lower population density scored higher on this knowledge index.
Perceptions: Respondent perceptions about water and environmental quality both in their local area and in the watershed as a whole were measured through four questions. First, respondents were asked how concerned they are with pollution and environmental quality locally and then in the Chesapeake Bay as a whole. Next, they were asked to indicate

Chesapeake Bay Program - 2002 Resident Survey
III
how pollution level in their local streams and waterways and the Chesapeake Bay as a whole compares to 10 years ago. Level of Concern
Ø 89% of Chesapeake Bay watershed residents are either Very or Somewhat Concerned about pollution in the Bay as a whole (52% Very Concerned), and 85% of residents are concerned about pollution in their local streams and waterways (52% Very Concerned).
Ø Concern with both local waterways and the Bay as a whole decreases with distance from the Bay. Residents living further from the Bay are the least concerned with both their local waterways and the Bay as a whole. Reflecting this trend, regions with a higher population density tend to be more concerned about pollution in the waterways.
Ø Interestingly, the regions indicating the highest level of concern (Washington, D.C. and Baltimore) are also among the regions that scored the lowest on the knowledge index.
Ø Respondents to this current survey expressed levels of concern similar to respondents to the 1993-1994 Chesapeake Bay Attitudes Survey, in which 86% of respondents were concerned about pollution in the Bay (50% Very Concerned). Also, a slight decrease in levels of concern among residents living farther from the Bay was demonstrated in both surveys.
Ø These findings also are comparable to the 2001 National Geographic Society survey, in which 90% of Americans expressed concern with environmental quality in our nation’s rivers.
Perceived Trends Ø 36% of watershed residents believe that the Bay as a whole is More Polluted now than it was 10 years ago, with 15% indicating that it is Less Polluted. Similarly, 42% believe that their local streams and waterways are More Polluted than 10 years ago, and 20% believe they are Less Polluted.
Ø In general, residents who are most concerned with pollution in the Bay most often believe that pollution has increased in the past 10 years.
Ø As distance from the Bay increases, fewer residents believe that their local waterways are More Polluted. However, the perceived trend of pollution in the Bay as a whole remains constant across the watershed.
Ø Compared to the survey conducted in 1993-1994, more respondents chose the neutral option in this survey, indicating that pollution has stayed the same in the past 10 years, or indicated that they “Don’t Know” with a decreased percentage of respondents indicating that the Bay is either more or less polluted.

Chesapeake Bay Program - 2002 Resident Survey
IV
Sources of Information
Ø Overall, Personal Observation was the most important factor affecting residents’ views on pollution, with 31% of respondents indicating this as their primary source of information. Other important factors were Environmental Group Reports (21%) and Media Reports (20%). This statistic was consistent across regions, distance bands and demographic factors.
Attitudes: Respondent attitudes towards water pollution was measured through a series of questions asking them to rate potential sources of pollution, indicate agreement levels with certain personal belief statements about pollution, indicate the level of responsibility that a list of public and private entities should assume for restoration, and analyze the importance of the Chesapeake Bay restoration in relation to other issues.
Causes of Pollution
Ø Business and Industry was the source identified by respondents as having the greatest impact on pollution, with over 50% indicating that it has a Great Impact. Other sources receiving high ranks include Population Growth (42% saying Great Impact), and General Littering (40% saying Great Impact).
Ø Sources that respondents indicated had the least impact on pollution are Lawn Maintenance (18% saying Great Impact), Commercial Spills (32% saying Great Impact) and Septic Systems (22% saying Great Impact).
Ø On a regional level, respondents in Washington, D.C., Baltimore and New York identified Business and Industry as the greatest source of pollution. The Baltimore/Washington Metro and North-central Virginia regions (both rapidly growing areas) indicated that Population Growth is the greatest source of pollution, and General Littering was identified as the greatest pollution source in the Shenandoah and Western Potomac region. The remaining regions had “ties” with Business and Industry and General Littering ranking highest in North-central Pennsylvania and Business and Industry and Population Growth ranking highest in the South-central Pennsylvania, Tidewater and Delmarva regions.
Ø In general, regions closest to the Bay indicated that all items listed are more serious threats to pollution than did areas farther from the Bay, with the values decreasing accordingly. For instance, on a scale of 1 to 4, the mean score for Business and Industry (the highest ranking item) ranged regionally from 1.5 to 2.0, whereas the mean score for Lawn Maintenance (the lowest ranking item) ranged regionally from 2.2-2.6.
Ø The 1993-1994 Chesapeake Bay Attitudes Survey also revealed that residents rank Business and Industry as the most serious threat to pollution. However, in 1993-1994, this was followed by commercial shipping and sewage treatment rather than by population growth and general littering, as in the current study. In fact, sewage treatment (wastewater treatment facilities) and commercial shipping ranked 6th and 11th respectively out of the 12 potential pollution sources listed in
Chesapeake Bay Program - 2002 Resident Survey
V
the current study. This represents a significant drop in the perceived relative importance of these sources and a significant increase in the perceived relative importance of population growth and general littering. (Note, general littering was not specifically asked about in 1993-1994, but “individuals” ranked second-to-last.)
Values about Pollution
Ø Overall, 88% of watershed residents Agree that pollution in the water is affecting fish and wildlife populations, and 81% Agree that there is a pollution problem that needs to be fixed. Similarly, 71% Disagree that their local waterways are unspoiled by pollution.
Ø Only 53% of watershed residents Agree that their everyday actions adversely affect water quality. On the other hand, 87% indicated agreement that one person’s actions can make a difference in improving water quality. This indicates that even though about half of the people do not see themselves as the cause of the problem, most believe that one person (not necessarily themselves) can make a difference in improving it. Interestingly, a cross tabulation of these two questions yielded no relationship. However only 51% of watershed residents Agree that they know how to get involved in improving water quality.
Ø On a regional level, residents living closer to the Bay (in Washington, D.C. and Baltimore) are most likely to Disagree that their local streams and waterways are unspoiled by pollution. This further supports the regional trend discussed above in the level of concern for pollution in local waterways.
Attitudes towards Restoration
Ø Overall, 94% of watershed residents believe that restoring the waterways in the Chesapeake Bay region is Important (60% Very Important) compared to other social, economic and environmental problems.
Ø Compared to the 1993-1994 Chesapeake Bay Attitudes Survey, respondents generally place a higher importance on Bay restoration with 88% believing it was Important in 1993-1994 (49% Very Important) compared to 94% in 2002 (60% Very Important). In the 2001 National Geographic Society survey, 94% of Americans believe that environmental issues in general are important (64% Very Important), and 98% believe that river protection specifically is an important environmental priority (75% Very Important). This is comparable to the figures obtained in this survey.
Ø 49% of watershed residents believe that current restoration efforts are Too Little, with only 2% believing current efforts are Too Much. These figures are almost identical to those presented in the 1993-1994 Attitudes Survey
Ø Business and Industry was ranked by respondents as the one entity that should be the most responsible for restoration of the Bay, with 97% of respondents believing it should be at least somewhat responsible (68% said Very Responsible).

Chesapeake Bay Program - 2002 Resident Survey
VI
Ø Among governmental agencies, State Government and Local Government were ranked as the agencies that should be most responsible for Bay restoration with 97% of respondents believing that each one should be responsible (61% and 66% Very Responsible respectively). Federal government ranked the lowest in perceived responsibility, with 88% indicating the Federal government should be responsible (41% Very Responsible).
Ø Regionally, Washington, D.C. and Baltimore placed the greatest responsibility on the Federal government, with the South-central Pennsylvania, Shenandoah and Western Potomac, North-central Pennsylvania, and New York regions placing the least responsibility on the Federal government. The perceived responsibility of other agencies was more uniform across regions.
Behaviors: Respondent behaviors were assessed through a series of questions asking participants to describe their involvement with a host of pollution reduction and prevention activities, and to indicate possible catalysts for even more involvement. Current Level of Involvement
Ø Overall, 69% of watershed residents indicate that they recycle household trash Often. However, 51% never use public transportation, 68% never carpool and 71% never ride a bike for transportation.
Ø Respondents in New York, North-central Pennsylvania, South-central Pennsylvania and the Baltimore/Washington Metro indicated that they recycle household trash more often than respondents in other regions. Baltimore and Shenandoah and Western Potomac residents indicated the least frequent recycling patterns of all the regions examined. This trend likely is affected by the presence/absence of local mandatory recycling regulations.
Ø Most respondents rarely or never use public transportation; however, respondents in Washington, D.C., Baltimore, and the Baltimore/Washington Metro regions use it most frequently, as would be expected, with 52%, 25%, and 14% respectively indicating that they use public transportation Often.
Ø Among 11 other actions listed, 97% of respondents had participated in at least one in the last 5 years, and the average respondent participated in an average of 4.9 actions. The most frequently cited actions include reducing water usage (85%), buying at least one environmentally safe product (76%), and planting a tree (71%). Moderately cited actions include altering fertilizer usage (47%), donating to an environmental group (40%) and altering product usage (39%). Actions performed less often include altering pesticide use (29%), helping to clean up a stream (28%), joining an environmental group (16%), using the environmental tax check-off (21%), and buying an environmental license plate (10%).
Ø Residents aged 35-65 years are most likely to have participated in each of the listed actions in the past 5 years, and have participated in more total actions than either younger or older age groups. Number of actions was positively correlated

Chesapeake Bay Program - 2002 Resident Survey
VII
with educational attainment and household income. Black and Hispanic respondents participated in fewer total actions (4.2 and 4.3 respectively) than other races (range 4.9-5.5), and residents of rural and suburban communities participate in more activities than residents of cities and small towns.
Ø Regionally, residents of Washington, D.C. and Baltimore participate in the fewest number of activities of anyone in the watershed. Beyond these boundaries, however, people residing closest to the Bay participate in the most actions, with participation decreasing with increasing distance from the Bay.
Ø Residents with more knowledge tend to participate in more actions. In this study, respondents correctly defining ‘watershed’ participated in an average of 5.4 actions, whereas respondents who could not define it participated in only 4.4 actions. This trend was also illustrated in the 2001 NEETF Survey.
Catalysts for Action
Ø Respondents indicated that they would be most likely to become more involved with improving water quality if they knew they could save money in the long run (37% Very Likely), if they knew they were being directly affected by pollution (57% Very Likely), if they felt as if they could really make a difference (43% Very Likely), and if they knew that time commitments would be minimal (37% Very Likely).
Ø Interestingly, as stated above, even though 88% of respondents believe that one person’s actions can make a difference in improving water quality, most do not believe that they, personally, can make a difference. This is evident by the 86% of respondents indicating that they would be Very or Somewhat Likely to get more involved if they felt they could make a difference.
Ø Of all the regions, residents of Washington, D.C., Baltimore, and Delmarva regions indicated the most willingness to become more involved in pollution reduction activities with an average of 82%, 82%, and 81% respectively either Very or Somewhat Likely to become more involved. Interestingly, two of these regions (Washington, D.C. and Baltimore) are also the regions scoring lowest on the knowledge index, expressing the most concern for local water quality, and currently participating in the fewest number of pollution reduction actions.
Ø To encourage stewardship actions in urban areas, it is important to identify and promote stewardship actions that urban residents can participate in without incurring extensive travel costs, since many of the traditional stewardship behaviors are not feasible for urban residents.
Ø At the watershed level, level of concern for water quality is positively related to the level of interest in getting involved, and this level of interest is positively related to levels of stewardship action. This is an important connection to make when planning outreach efforts to encourage stewardship activity.

Chesapeake Bay Program - 2002 Resident Survey
VIII
TABLE OF CONTENTS EXECUTIVE SUMMARY ......................................................................................................I TABLE OF CONTENTS .................................................................................................. VIII LIST OF TABLES ............................................................................................................. IX LIST OF FIGURES ...........................................................................................................XII LIST OF MAPS ............................................................................................................. XIV I. INTRODUCTION ............................................................................................................ 1 II. KNOWLEDGE LEVELS AMONG WATERSHED RESIDENTS.............................................. 10 III. PERCEPTIONS OF WATER QUALITY ........................................................................... 14
Level of Concern....................................................................................................... 14 Perceived Trends....................................................................................................... 18 Source of Information ............................................................................................... 19
IV. ATTITUDES .............................................................................................................. 23
Causes of Pollution ................................................................................................... 23 Values about Pollution .............................................................................................. 27 Attitudes towards Restoration.................................................................................... 31
V. BEHAVIOR ................................................................................................................ 34
Current Level of Involvement.................................................................................... 34 Catalysts for Action................................................................................................... 45
VI. IMPLICATIONS.......................................................................................................... 48 APPENDIX A: SURVEY INSTRUMENT ....................................................................... A1-A9 APPENDIX B: FREQUENCY DISTRIBUTIONS FOR ALL CLOSE-ENDED ITEMS, WATERSHED-WIDE...............................................................B1-B27 APPENDIX C: FREQUENCY DISTRIBUTIONS FOR ALL CLOSE-ENDED QUESTIONS, BY REGION ..................................................................C1-C40 APPENDIX D: FREQUENCY DISTRIBUTIONS FOR ALL CLOSE-ENDED QUESTIONS, BY DISTANCE BAND .................................................... D1-D36 APPENDIX E: FREQUENCY DISTRIBUTIONS FOR ALL CLOSE-ENDED QUESTIONS, BY STATE..................................................................... E1-E38
Chesapeake Bay Program - 2002 Resident Survey
IX
LIST OF TABLES Table 1: Response rates and margins of error for entire watershed, regions, and
distance bands. Language barrier indicates the number of interviews that could not be completed because the respondents did not speak English adequately. .......... 6
Table 2: Frequencies for knowledge index. ................................................................... 10
Table 3: Demographic trends in the knowledge index. This relationship is strongest when examining race, education and income. Weaker relationships exist for gender, age and community type............................................................................ 11
Table 4: Regional differences in knowledge levels. Option 2 is the correct response. ............................................................................................................... 12
Table 5: Levels of concern for local streams and waterways and the Chesapeake Bay as a whole among respondents to the 2002 survey. Mean scores were calculated based on coded responses with “Don’t Know” responses ignored: 1 = Very Concerned, 2 = Somewhat Concerned, 3 = Not Very Concerned, 4 = Not at All Concerned. ............................................................................................ 14
Table 6: Demographic trends in the levels of concern for local streams and waterways and for the Chesapeake Bay as a whole. None of the demographic factors demonstrated a significant relationship....................................................... 15
Table 7: Regional trends in level of concern for local streams and waterways and the Chesapeake Bay as a whole among respondents to the 2002 survey. Means are calculated based on coded responses with “Don’t Know” responses ignored: 1 = Very Concerned, 2 = Somewhat Concerned, 3 = Not Very Concerned, 4 = Not at all Concerned. .................................................................... 16
Table 8: Perceived trends in pollution levels for local streams and waterways and the Chesapeake Bay as a whole among respondents to the 2002 survey. Mean responses were calculated based on coded responses with “Don’t Know” responses ignored: 1 = More Polluted, 2 = About the Same, 3 = Less Polluted....... 18
Table 9: Demographic relationships for the perceived trends in pollution levels for local streams and waterways and for the Chesapeake Bay as a whole. Males tend to believe that pollution has improved in the past 10 years more than females. No other demographic factors demonstrated a significant relationship............................................................................................................ 20
Table 10: Regional frequencies for perceived trends in pollution levels. ........................ 21
Table 11: Perceived impact of various sources of pollution on waterways in the respondent’s region. Mean scores calculated based on coded responses with “Don’t Know” responses ignored: 1 = Great Impact, 2 = Some Impact, 3 = Very Little Impact, 4 = No Impact......................................................................... 23
Table 12: Regional trends in perceived impact of 12 potential pollution sources on water quality in the respondent’s region. Mean scores for each region and for each source are reported based on coded responses and with “Don’t Know”

Chesapeake Bay Program - 2002 Resident Survey
X
responses ignored: 1 = Great Impact, 2 = Some Impact, 3 = Very Little Impact, 4 = No Impact........................................................................................................ 24
Table 13: Levels of agreement with value statements among respondents to the 2002 Survey. Mean scores are reported based on coded responses, with “Don’t Know” responses ignored: 1 = Strongly Agree, 2 = Somewhat Agree, 3 = Somewhat Disagree, 4 = Strongly Disagree. .......................................................... 28
Table 14: Regional trends in levels of agreement with a series of value statements posed to respondents of the 2002 survey. Mean scores are calculated based on coded responses with “Don’t Know” responses ignored: 1 = Strongly Agree, 2 = Somewhat Agree, 3 = Somewhat Disagree, 4 = Strongly Disagree...................... 30
Table 15: Attitudes towards watershed restoration as a priority and the appropriateness of the current level of effort in watershed restoration held by respondents to the 2002 survey. ............................................................................. 31
Table 16: Degrees of responsibility for restoration of regional waterways placed on various agencies by respondents to the 2002 survey. Mean scores are calculated based on coded responses, with “Don’t Know” responses ignored: 1 = Very Responsible, 2 = Somewhat Responsible, 3 = Not Very Responsible, 4 = Not at all Responsible......................................................................................... 32
Table 17: Regional differences in the perceived level of responsibility of various agencies for watershed restoration as expressed by respondents to the 2002 Survey. Mean scores are reported based on coded responses with “Don’t Know” responses ignored: 1 = Very Responsible, 2 = Somewhat Responsible, 3 = Not Very Responsible, 4 = Not at all Responsible............................................ 33
Table 18: Frequency of participation in recreational activities by respondents to the 2002 survey. Mean scores are based on coded responses and ignore “Don’t Know” responses: 1 = Often, 2 = Sometimes, 3 = Rarely, 4 = Never...................... 34
Table 19: Frequency of participation in various activities by respondents to the 2002 survey. Mean scores are based on coded responses and ignore “Don’t Know” responses: 1 = Often, 2 = Sometimes, 3 = Rarely, 4 = Never...................... 35
Table 20: Proportion of respondents participating in each stewardship behavior listed in the past 5 years. The average respondent indicated participation in 4.9 of these actions. ..................................................................................................... 35
Table 21: Participation in water quality stewardship actions by respondents to the 2002 Survey by demographic factor. Percentages represent the proportion of respondents within a particular demographic classification indicating they had participated in an activity at least once in the past 5 years. ..................................... 36
Table 22: Relationship between selected attitude measures and respondent level of participation in water quality stewardship activities. Mean number of actions out of 11 listed performed in the last 5 years is listed for each level of agreement with value statements............................................................................ 41
Table 23: Frequency of participation in various recreational and water quality stewardship activities by respondents to the 2002 survey by region of
Chesapeake Bay Program - 2002 Resident Survey
XI
residence. Mean scores are reported based on coded responses with “Don’t Know” responses ignored: 1 = Often, 2 = Sometimes, 3 = Rarely, 4 = Never......... 42
Table 24: Participation in various water quality stewardship activities by respondents to the 2002 survey by region of residence. Proportion of respondents participating in each action presented along with the mean number of total actions per respondent in each region......................................................... 43
Table 25: Likeliness of various scenarios to encourage increased involvement in water quality stewardship activities by respondents to the 2002 survey. Mean scores are reported based on coded responses with “Don’t Know” responses ignored: 1 = Very Likely, 2 = Somewhat Likely, 3 = Somewhat Unlikely, 4 = Not at all Likely..................................................................................................... 46
Table 26: Regional trends in respondent willingness to become more involved in water quality stewardship activities. Percentages represent the proportion of respondents in each region indicating that each scenario would be either Very Likely or Somewhat Likely to influence them to become more involved. .............. 47

Chesapeake Bay Program - 2002 Resident Survey
XII
LIST OF FIGURES Figure 1: Educational attainment of 2002 survey respondents compared to the
general public. Survey respondents tended to be more educated than the general public. ......................................................................................................... 7
Figure 2: Household income of 2002 survey respondents compared to the general public. Survey respondents tended to be wealthier than the general public. ............. 7
Figure 3: Relationship between knowledge and regional land use. Residents of areas with more farmland tend to be better able to define a watershed than residents of less agricultural areas. Less agricultural areas include urban areas as well as remote, mountainous areas............................................................ 13
Figure 4: Relationship between level of concern with local streams and waterways and population density (logarithmic scale). ............................................................ 18
Figure 5: Relationship between respondents' levels of concern for the Chesapeake Bay as a whole and their perception of the change in the pollution level. There is a slight tendency for people who are more concerned to beleive that pollution has incresed more then less concerned individuals. ................................. 21
Figure 6: Relationship between population density (logarithmic scale) and the perceived impact of business and industry on regional water quality among respondents to the 2002 survey. Relationships for other potential pollution sources mentioned are similar. ............................................................................... 27
Figure 7: Relationship between level of concern for the Chesapeake Bay as a whole and respondent level of interest in helping to improve water quality. More concerned respondents were more interested in getting involved. A similar relationship exists with the level of concern for local streams and waterways. ............................................................................................................ 29
Figure 8: Relationship between frequency of boating and the perceived trend in pollution levels in the Chesapeake Bay as a whole among respondents to the 2002 survey. A similar relationship exists for the perceived trend in local streams and waterways. ......................................................................................... 34
Figure 9: Relationship between respondent age and level of participation in water quality stewardship actions. Mean number of actions out of 11 listed performed in the last 5 years is graphed for each age group. .................................. 38
Figure 10: Relationship between respondent educational attainment and level of participation in water quality stewardship actions. Mean number of actions out of 11 listed performed in the last 5 years is graphed for each education attainment level. .................................................................................................... 39
Figure 11: Relationship between respondent household income and level of participation in water quality stewardship actions. Mean number of actions out of 11 listed performed in the last 5 years is graphed for each income level. ..................................................................................................................... 39

Chesapeake Bay Program - 2002 Resident Survey
XIII
Figure 12: Relationship between respondent knowledge level and the level of participation in water quality stewardship actions. Mean number of actions out of 11 listed performed in the last 5 years is graphed for respondents responding either correctly of incorrectly to the knowledge index.......................... 40
Figure 13: Relationship between respondent level of concern with local streams and waterways and the Chesapeake Bay as a whole and level of participation in water quality stewardship actions. Mean number of actions out of 11 listed performed in the last 5 years is graphed for each level of concern................. 40
Figure 14: Relationship between population density and resident involvement in stewardship activities. Residents of less population dense regions tend to participate in more stewardship actions than do resident of densely populated regions................................................................................................................... 44
Figure 15: Relationship between percent of land area in farmland and resident involvement in stewardship activities. Residents of more agricultural areas tend to participate in more stewardship actions than do residents of less agricultural areas. .................................................................................................. 45

Chesapeake Bay Program - 2002 Resident Survey
XIV
LIST OF MAPS Map 1: Regions used to stratify the survey sample and analyze results. A
minimum of 150 interviews was conducted in each of the 10 regions....................... 3
Map 2: Distance bands. The 10 regions were combined into 4 distance bands representing their relative distance to the Chesapeake Bay. This also was useful for data analysis purposes.............................................................................. 3
Map 3: Regional differences in respondents’ ability to define a watershed according to the 2002 survey. ................................................................................ 13
Map 4: Regional differences in level of concern for local streams and waterways. Mean scores are mapped: 1 = Very Concerned, 2 = Somewhat Concerned, 3 = Not Very Concerned, 4 = Not at all Concerned. .................................................. 17
Map 5:Regional differences in level of concern for the Chesapeake Bay as a whole. Mean scores are mapped: 1 = Very Concerned, 2 = Somewhat Concerned, 3 = Not Very Concerned, 4 = Not at all Concerned. ............................ 17
Map 6: Perceived trends in pollution levels in local streams and waterways among respondents to the 2002 survey by distance band. Mean scores are mapped according to coded responses: 1 = More Polluted, 2 = About the Same, 3 = Less Polluted. ........................................................................................................ 22
Map 7: Regional trends in the pollution source perceived to have the greatest impact on regional waters by respondents to the 2002 survey. ............................... 25
Map 8: Regional trends in the perceived impact of potential pollution sources among respondents to the 2002 survey. Mean ratings are mapped, with “Don’t Know” responses ignored: 1 = Great Impact, 2 = Some Impact, 3 = Very Little Impact, 4 = No Impact......................................................................... 26
Map 9: Regional trends in levels of stewardship behavior. Mean number of actions out of 11 listed performed in the last 5 years is mapped for each region of the Chesapeake Bay watershed. .............................................................. 44

Chesapeake Bay Program - 2002 Resident Survey
1
I. INTRODUCTION The protection and restoration of the natural resources in and around the Chesapeake Bay watershed is perhaps one of the greatest and most complex large-scale conservation efforts of all time. The watershed comprises both a large geographic area embracing a wide range of natural resources and a large and growing population of diverse people with varied interests, goals and backgrounds. Because the residents of the watershed are intricately involved in the processes and events that occur in watershed, working with these people to achieve the goals of the Chesapeake Bay Program is inevitable and essential. To do this, information about their knowledge, attitudes and behaviors must be collected, analyzed and integrated into conservation planning efforts. The Conservation Management Institute at Virginia Tech was granted funds to address this need through a telephone survey and subsequent temporal and spatial analyses of both the survey data and ancillary socioeconomic information. We also were tasked to integrate this analysis into a spatial and temporally illustrative Geographic Information System (GIS) for data and map retrieval. Project Scope
This project consisted of four major objectives.
1. To conduct a telephone survey assessing the attitudes and beliefs of the residents of the Chesapeake Bay watershed concerning the condition of the watershed, primary concerns about the watershed, and involvement in watershed conservation/restoration activities.
2. To compare these finding to the results obtained from the Attitudes Survey1 conducted in 1993-1994 by the University of Maryland.
3. To relate these findings to socioeconomic and demographic characteristics of watershed residents.
4. To compile all findings and relationships into an interactive computer-based GIS.
This report summarizes the methods we employed to meet these objectives, and discusses the results obtained. Appendices appearing at the end of this document contain data tables. A CD accompanies this report and contains the ArcView GIS platform and querying capabilities as well as electronic versions of this report, all data tables, metadata and a user guide for these materials.
1 Blair, J., G. Slater and A. McLaughlin. 1994. The Chesapeake Bay Attitudes Survey. Final Report to the Chesapeake Bay Program, EPA. Survey Research Center, University of Maryland. 42 pp +.

Chesapeake Bay Program - 2002 Resident Survey
2
Methods
Objective 1 – The Survey To assess the attitudes, opinions and behaviors of residents of the watershed, we conducted a large-scale telephone survey of watershed residents in the first half of 2002. After meeting and coordinating with the Chesapeake Bay Program’s Communication and Education Subcommittee, we designed the telephone survey to meet the objectives specified. We worked with the Virginia Tech Center for Survey Research (CSR) to format and execute this survey. The final survey instrument contained 31 Questions, including 6 general demographic questions. Other questions addressed 4 major topics: 1) level of knowledge, 2) perceptions of water quality, 3) attitudes about the sources of pollution, the impact of pollution, and restoration alternatives, and 4) behavior towards and involvement in restoration and pollution prevention activities. The final survey instrument is included here as Appendix A. The Survey was directed towards the general public residing within the states and counties that make up the watershed (including parts of Virginia, Maryland, Pennsylvania, West Virginia, New York, Delaware and Washington, D.C.). Our goal was to conduct a total of 2,000 (+/- 50) interviews, stratified among 10 county groupings (regions) with 200 (minimum of 150) interviews in each group. We identified the county strata by examining 7 socioeconomic factors. The data for these factors were obtained from the U.S. Census Bureau’s USA Counties 1998 CD, and the most recent data available was used. The variables used for the stratification included:
1. Population Density 2. Percent Population Change (1992-1997) 3. Percent of Land as Farmland 4. Household Income 5. Average Mortgage 6. Average Number of Cars/Household 7. Percent of Owner Occupied Homes
These variables were selected based on the clear spatial stratification schemes they provided, and because it was believed that they would be related to environmental values and behaviors and would therefore be useful for delineating spatial trends in survey data. For each variable, 10 county groups were delineated so that adjacent counties with similar demographic attributes were grouped together into regions. Then, the 7 variable maps were combined into a single stratification scheme by comparing across variables. The regions created in this process (Map 1) are referred to in this report as New York, North-central Pennsylvania, South-central Pennsylvania, Shenandoah and Western Potomac, North-central Virginia, Tidewater, Delmarva, the Baltimore/Washington Metro, Baltimore, and Washington, D.C. The random sample was drawn with the stratification scheme as a guideline. Distance-to-Bay bands were also created by combining regions into larger county groups based on their proximity to the Bay. This resulted in the delineation of 4 distance bands

Chesapeake Bay Program - 2002 Resident Survey
3
Map 1: Regions used to stratify the survey sample and analyze results. A minimum of 150 interviews was conducted in each of the 10 regions.
Map 2: Distance bands. The 10 regions were combined into 4 distance bands representing their relative distance to the Chesapeake Bay. This also was useful for data analysis purposes.

Chesapeake Bay Program - 2002 Resident Survey
4
(Map 2), referred to in this report as the Coastal band, the Lower Reaches, the Middle Reaches, and the Upper Reaches. The stratified sample was obtained by the CSR from the national sampling firm, Survey Sampling Incorporated, and included the telephone number, FIPS code and geographic region identifier for each of the 8,000 sample members. The sample was designed to provide a randomly selected group of residents from each of the 10 regions delineated here. After the initial survey draft was developed, an instrument pretest was conducted by the CSR in order to test the position of each new survey item within the instrument, the wording of each new survey item, and the length of the interview. The survey pretest was conducted with a small sample of randomly selected residents of the Chesapeake Bay watershed area. The final draft of the survey resulted in an interview lasting approximately 13 minutes. Telephone interviews began on February 23, 2002 and continued through May 2, 2002. An average of 7.9 attempts on various day of the week and at different times of day were made for each “nonrespondent” sample member. Only adults, age 18 or older, were interviewed for this study. All data were retrieved directly into an electronic file through the CSR’s Computer Assisted Telephone Interviewing (CATI) system. Survey data were compiled in the Statistical Package for Social Sciences (SPSS 10.1, SPSS Inc., Chicago, Illinois) for statistical analysis, and a probability value (P) of 0.05 was used to indicate statistically significant relationships. Summary statistics and cross-tabulations were calculated to understand the attitudes of each group identified during the survey. Most tabulations used the chi-square (χ2) statistic to test for the presence of relationships. Where contingency tables had =20% of cells with expected values <5, similar categories were collapsed (i.e., “Strongly Agree” and “Agree” collapsed to “Agree”) to raise the expected values and increase the validity of the test2. When significant relationships were obtained, they were further subjected to a measure-of-association test to examine the strength and direction of those relationships3,4. For nominal variables, Cramer’s V statistic is used to measure association, and Goodman and Kruskal’s gamma (?) is used for ordinal variables. Cramer’s V ranges from 0.0 (no real relationship) to 1.0 (perfect relationship) and gamma ranges from –1.0 (perfect negative relationship) to +1.0 (perfect positive relationship) with zero representing no relationship. In this report, V > 0.2 and ? = -0.2, ? = 0.2 are considered to be significant measures of association. A non-significant measure-of association indicates that the factor under examination is not a reliable explanation for the observed variability in response. When used, both the chi-square test and the measure of association must be significant in order to conclude that a meaningful relationship exists. Finally, the 2002 Survey data were incorporated into ArcView for visual display of spatial trends.
2 SPSS, Inc. 1996. SPSS Base 7.0 for Windows User’s Guide. SPSS Inc., USA. 3 Bohrnstedt, G.W. and D. Knoke. 1994. Statistics for Social Data Analysis. 3rd edition. F.E. Peacock Publishers, Itasca, Illinois. 4 SPSS, Inc. 1996. SPSS Base 7.0 Applications Guide. SPSS Inc., USA.

Chesapeake Bay Program - 2002 Resident Survey
5
Objective 2 – The Survey Comparison We qualitatively compared the results of specific questions from this survey to the results obtained from several other surveys, including the 1993-1994 Attitudes Survey conducted for the Chesapeake Bay Program (referred to here as the Attitudes Survey), the National Geographic Society’s River Poll5 conducted in 2001 (referred to here as the NGS Survey), and the National Environmental Education Training Foundation’s Annual Report Card6 for 2001 (referred to here as the NEETF Survey). Because we used a different stratification scheme than was used in the previous Attitudes Survey, the comparisons we were able to make were limited to watershed-wide with some inference to distance-to-bay trends. For these comparisons, respondents from West Virginia, Delaware and New York were removed from the 2002 sample since they were not included in the 1993-1994 sample. Objective 3 – Socioeconomic Analysis The third major part of this project is the inclusion of past and present socioeconomic data in the analysis. We obtained this data from the U.S. Census Bureau on the USA Counties CD series. These data are essentially electronic versions of the County and City Data Books7, with later versions including recent as well as previous years’ data. All of this information is both spatially explicit (e.g., state, county, city specific) and temporally specific (e.g., year or time period). These analyses were done in Microsoft Excel using PivotTables to summarize key demographic features by region. These regional characteristics (i.e., population density, % of land as farmland) were then graphed against various regional statistics from the 2002 survey (e.g., level of knowledge, level of action). This information was integral in forming recommendations about where specific needs are located, and served as the foundation for the GIS system discussed under Objective 4. Objective 4 – The GIS Platform We assembled the outcomes of the first 3 Objectives into a single GIS application using ArcView 3.2. The data were first obtained in tabular form from the USA Counties CD and converted to .dbf format, and the records for watershed counties were imported into ArcView. Fields were then renamed for rapid visual scanning. A reference file with each field’s new and old names was created to facilitate incorporation of new census data as it becomes available. The tables with variables that are potentially predictive (or resulting from) the environmental factors evaluated in the survey were used. Next, the 2002 survey data were summarized into .dbf files by region, distance to the bay, and state. Each table contained the appropriate means and/or percentages for the applicable
5 Summary of Findings: National Geographic Society’s River Poll. 2001. Penn, Schoen, & Berland Associates, Inc. 6 NEETF. 2001. Lessons from the Environment: The Ninth Annual National Report Card on Environmental Attitudes, Knowledge, and Behavior. The National Environmental Education & Training Foundation and Roper Starch Worldwide.. 7 U.S. Census Bureau. 1973, 1978, 1983, 1988, 1994. County and City Data Book. U.S. Government Printing Office, Washington, DC.

Chesapeake Bay Program - 2002 Resident Survey
6
survey questions. These tables were then imported in the ArcView project and joined to an appropriate spatial map. In this way, both the census data and the survey data can be viewed and analyzed spatially. Along with this GIS, we provide metadata and user instructions in HTML format in compliance with the “Chesapeake Bay Program Guidance for Data Management.”
Respondent Profile
The original sample consisted of 8,000 telephone numbers. Of these, 3,222 numbers were eliminated due to various problems unrelated to the survey (e.g., disconnected numbers, fax/computer tones, non-residential telephone number). Of the remaining 4,781 households, 4,148 were contacted, and 1,988 interviews were completed for an overall response rate of 42%. The remaining 2,160 households contacted refused to respond, and 633 households could not be reached after an average of 7.9 attempts. Assuming there are no significant differences between completed and uncompleted interviews, this response rate yields a watershed-wide margin of error of +/- 2.2% with a 95% level of confidence. The overall, regional, and distance-band response rates and margins of error are listed in Table 1. The goal of =150 interviews in each of the 10 regions was reached. In fact, only 2 regions yielded <200 interviews: Baltimore with 197 and Washington, D.C. with 179.
Table 1: Response rates and margins of error for entire watershed, regions, and distance bands. Language barrier indicates the number of interviews that could not be completed because the respondents did not speak English adequately.
Area Sample Size
No Contact Refusals Completed
Interviews Response
Rate Confidence
Interval Language
Barrier
Overall 4781 633 2160 1988 42% +/- 2.2% 70
Region
New York 511 37 270 204 40% +/- 6.9% 2
North-central Pennsylvania 564 54 310 200 35% +/- 6.9% 3
South-central Pennsylvania 481 74 206 201 42% +/- 6.9% 1
Shenandoah & Western Potomac 467 55 207 205 44% +/- 6.8% 2
North-central Virginia 440 71 167 202 46% +/- 6.9% 7
Baltimore/Washington Metro 481 77 204 200 42% +/- 6.9% 14
Tidewater 385 62 123 200 52% +/- 6.9% 5
Delmarva 486 89 197 200 41% +/- 6.9% 4
Baltimore 501 51 253 197 39% +/- 7.0% 4
Washington D.C. 465 63 223 179 38% +/- 7.3% 28
Distance Band
Coastal 2318 342 1000 976 42% +/- 3.1% 55
Lower Reaches 921 145 373 403 44% +/- 4.9% 8
Middle Reaches 1031 109 517 405 39% +/- 4.9% 5
Upper Reaches 511 37 270 204 40% +/- 6.9% 2

Chesapeake Bay Program - 2002 Resident Survey
7
Survey respondents were compared to the general population by sex, age, race, education and income. Respondents consisted of fewer males (42.9% versus 48.7% in the general population), and tended to be more educated and wealthier than the general public. In terms of education (Figure 1), 7.8% of respondents did not complete high school (compared to 23.1 % of general population) and 38.9% completed at least a 4-year college degree (compared to 23.5% of the general population). Survey respondents also tended to be wealthier than the general public (Figure 2), with 9.8% of respondents reporting income of >$100,000, compared to only 4.6% of the general public.
0%
5%
10%
15%
20%
25%
30%
35%
40%
45%
< High school High school only Some college 4 yr degree orhigher
Educational Attainment
Per
cen
t
Respondents
General Public
Figure 1: Educational attainment of 2002 survey respondents compared to the general public. Survey respondents tended to be more educated than the general public.
0%
5%
10%
15%
20%
25%
<$15,000 $15,000-$29,999
$30,000-$49,999
$50,000-$64,000
$75,000-$99,000
$100,000and up
Household Income
Per
cen
t o
f H
ou
seh
old
s RespondentsGeneral Public
Figure 2: Household income of 2002 survey respondents compared to the general public. Survey respondents tended to be wealthier than the general public.

Chesapeake Bay Program - 2002 Resident Survey
8
A Note About Response Rates The response rate obtained in this survey (42%) is comparable to other general public, topic-focused telephone surveys recently conducted. Declining willingness among the general public to complete surveys (mail or telephone) has made an impact on the ability to obtain high response rates, and thus has increased concerns about bias among those who rely on the resulting data. In all surveys, there is an unknown level of bias. In this survey, 3 types of bias in particular may play a role: nonresponse bias, avidity bias and prestige bias. Nonresponse bias occurs when the respondents differ from the nonrespondents in key characteristics. In this survey, respondents tend to be more educated and wealthier than the general population. Therefore, when relationships between variables exist that involve these characteristics, the means and frequencies may be skewed by the responses from more educated or wealthier individuals. Avidity bias is a special kind of nonresponse bias in that it occurs when respondents have a higher interest level or involvement in the topic than do nonrespondents. This is often closely related to standard nonresponse bias (i.e., more educated or wealthier individuals may be more likely to respond due to greater interest levels). Each of these types of bias are difficult to measure, and no reliable method for doing so in a telephone survey has been developed8. Furthermore, many methods that have been tested (such as data weighting) actually increase variance and uncertainty in the data (usually by an unknown amount) more than they alter the dataset. Even when the resources are available to convert nonrespondents into respondents (a difficult thing to do), the changes to the overall statistics are still almost exclusively within the stated margin of error for the original data set, and that these changes generally are not worth the added cost of respondent conversion. Finally, since the results obtained in this survey correlate closely with those of other national surveys, it is likely that these types of bias are minimal in this dataset. Prestige bias occurs when respondents deliberately lie, exaggerate or otherwise alter their true answers in response to a perceived social pressure (i.e., to avoid embarrassment in admitting the truth). This type of bias, which also is impossible to quantify, is most likely to occur in controversial situations or with questions related to illegal behavior9. Since the topic of this survey is neither of these, this type of bias is likely to have a minimal effect on the quality of the data presented here. About This Report
The four informational objectives stated for this survey (knowledge, perceptions, attitudes, and behavior) provide the organizational structure for this report. Each topic is addressed in a separate section, with a final section to pull them all together and discuss possible implications and recommendations. For each topic, survey results were analyzed first at a watershed-wide geographic scale, then at a smaller scale with regional and distance-to-bay results presented where appropriate. Each of these analyses, as well 8 Smith, T. W. 1983. The Hidden 25 Percent: An Analysis of Nonresponse on the 1980 General Social Survey. Public Opinion Quarterly, 47(3):386-404. 9 Knuth, B. A. and S. L. McMullin. 1996. Measuring the human dimensions of recreational fisheries. Pages 651-678 in: B.R. Murphy and D.W. Willis (ed.) Fisheries Techniques, second edition. American Fisheries Society, Bethesda, MD.

Chesapeake Bay Program - 2002 Resident Survey
9
as a qualitative comparison to other surveys and a discussion of socioeconomic relationships, are included in the appropriate sections. Data tables, figures and maps specifically referenced in the report appear within the main text sections. Frequency distributions for all questions appear at the end of the report as Appendix B (watershed-wide), C (regional), D (distance-to-bay) and E (state-level). The CD that accompanies the final report includes the ArcView GIS project and electronic versions of all the survey data. This report and other information contained on the CD can be downloaded by interested individuals from the Chesapeake Bay Program website, located at http://www.chesapeakebay.net. Care should be taken in analyzing and reporting the results of this survey beyond what is discussed in this report. This is especially critical when looking at the data at a state level. Because the sample was drawn using the regional stratification, and because the regions were delineated without regard to state boundaries, the state-level samples may not be representative of the general population in a particular state. For this reason, any reports of data at this level should be stated in terms such as “respondents to the 2002 survey who also lived in (insert state name) believe,” rather than “residents of (insert state name) believe…” While the Conservation Management Institute encourages the use and further analysis of these results as appropriate and appreciates acknowledgement of its role in projects, we cannot be held responsible for the validity of any analyses other than what is specifically discussed in this report.

Chesapeake Bay Program - 2002 Resident Survey
10
II. KNOWLEDGE LEVELS AMONG WATERSHED RESIDENTS Respondent knowledge levels were measured implicitly in this study with one question (Q5). We measured respondents’ familiarity with the term “watershed,” using a multiple choice question containing four options: “Of the following, which best fits your definition of what a watershed is: an area that retains water like a swamp or a marsh, the land area that drains into a specific waterbody, a water intake area that feeds a water treatment plant, a small building where water is stored, or none of these?” Watershed-wide Analysis
Only 48% of respondents selected the correct definition, “The land area that drains into a specific water body” out of the four options presented (Table 2). Compared to other surveys, this is about average, or perhaps slightly above average. In the NGS Survey, 66% of Americans indicated that “Yes,” they know what a watershed is (but were not actually asked to define it). In the same survey, 65% of Americans indicated that a watershed and a wetland are the same thing, which leads one to believe that the majority of Americans are unsure of what exactly a watershed or a wetland is. In another survey conducted by NEETF10, respondents were asked to select the appropriate definition of ‘watershed’ in a multiple choice option; only 2 in 5 respondents were able to do so, and only a “very small percent” could define a watershed when asked point blank.
Table 2: Frequencies for knowledge index.
Of the following, which best fits your definition of what a watershed is?
# of
Respondents Percent Area that retains water 271 13.6%
Area that drains into a specific waterbody 958 48.2% Water intake area that feeds a water treatment plant 221 11.1% Small building where water is stored 149 7.5% None of the options mentioned 61 3.1% Don't Know/Refused 328 16.5% Total 1988 100.0%
Demographic analysis of this knowledge index revealed several important trends (Table 3). First, race had a major impact on knowledge levels, with 65% of White respondents and only 37% of Black respondents selecting the correct response. Other races scored in between these two extremes. Education also had a significant impact, with scores ranging from 41% correct for respondents with less than a high school education to 76% correct for respondents with a graduate degree. Finally, income was positively correlated
10 NEETF. 1999. Visual Tools for Watershed Education: National Leadership Forum Report. November 17, 1999. Washington, D.C.

Chesapeake Bay Program - 2002 Resident Survey
11
Table 3: Demographic trends in the knowledge index. This relationship is strongest when examining race, education and income. Weaker relationships exist for gender, age and community type.
Correct Identification of 'Watershed' Definition
Demographic Characteristic % Correct N Chi-Square df P-Value PRE*
Overall 48.2% 1988 Age 1555 20.96 5 0.001 -0.140 (G)
<25 49.5% 25-34 55.1% 35-44 55.0% 45-54 65.8% 55-65 65.6%
>65 63.4% Gender 1599 12.02 1 0.001 0.087 (V)
Male 64.6% Female 56.0%
Education 1585 88.00 4 <0.001 -0.344 (G)** Less than High School 41.3%
High School Diploma 47.4% Some College, no 4 yr degree 58.0%
4 Yr College Degree 68.6% Graduate Degree 76.5%
Income 1305 50.93 5 <0.001 -0.247 (G)** < $15,000 39.6%
$15,000 to < $30,000 51.4% $30,000 to < $50,000 55.6% $50,000 to < $75,000 62.5%
$75,000 to < $100,000 69.1% $100,000 or more 75.9%
Race 1599 80.60 5 <0.001 0.225 (V) ** White 65.2% Black 35.8%
Chinese 52.9% Hispanic 58.8%
Other/Mixed Race 35.3% Type of community 1585 30.32 3.000 <0.001 0.161 (G)
Rural area 67.0% Small town 56.0% City suburb 65.3%
City 20.7%
* PRE (Proportional reduction in error) measures used include Cramer's V for nominal variables and Goodman and Kruskal's Gamma (G) for ordinal variables ** Statistically significant relationship
with knowledge level, with 40% of respondents earning <$15,000 responding correctly compared to 76% of respondents earning at least $100,000. Weaker relationships (with non-significant measures-of-association) also existed for gender, age and community type with females, younger, and urban respondents more likely to respond incorrectly than

Chesapeake Bay Program - 2002 Resident Survey
12
other demographic groups. The 2001 NEETF Survey, which employed a more extensive 12-question knowledge index, found similar differences in knowledge among different education levels (the most significant factor), gender, age (middle-aged most knowledgeable) and community type. Geographical Analysis
Regional knowledge levels varied significantly (Table 4, Map 3) and ranged from 35% of respondents selecting the correct response in Baltimore to 54% selecting the correct response in North-central Virginia. The regions scoring the lowest were Baltimore (35%), North-central Pennsylvania (44%) and Washington, D.C. (45%). Interestingly, even though Baltimore and Washington, D.C. were among the least knowledgeable regions, the regions immediately adjacent to them – Baltimore/Washington Metro, Tidewater, North-central Virginia, and Delmarva – were among the most knowledgeable with 53%, 51%, 54%, and 53% responding correctly respectively. One possible explanation for this marked regional trend may be that people living within the highly urbanized cities of Baltimore and Washington, D.C. have little opportunity to visualize the concept of a watershed.
Table 4: Regional differences in knowledge levels. Option 2 is the correct response.
Of the following, which best fits your definition of what a watershed is: Option 1* Option 2 Option 3 Option 4 None DK/RF Overall 13.6% 48.2% 11.1% 7.5% 3.1% 16.5% Region
New York 11.8% 51.5% 15.2% 3.9% 4.4% 13.2% North-central Pennsylvania 20.0% 43.5% 10.0% 7.0% 4.5% 15.0% South-central Pennsylvania 16.9% 46.8% 10.9% 7.0% 2.5% 15.9%
Shenandoah & Western Potomac 9.3% 49.8% 13.2% 8.3% 4.4% 15.1% North-central Virginia 10.9% 53.5% 5.4% 7.9% 4.0% 18.3%
Baltimore/Washington Metro 11.5% 52.5% 13.0% 4.5% 3.5% 15.0% Tidewater 11.5% 50.5% 10.0% 7.5% 2.5% 18.0% Delmarva 16.0% 53.0% 4.5% 5.0% 1.0% 20.5% Baltimore 12.7% 35.0% 17.8% 13.7% 2.0% 18.8%
Washington, D.C. 16.2% 45.3% 11.2% 10.6% 1.7% 15.1% * Option 1: Area that retains water; Option 2: Area that drains into a specific waterbody; Option 3: Water intake area for a water treatment plant; Option 4: Small building where water is stored.
Upon examining the sociodemographic characteristics of these regions, it becomes clear that respondents living in areas with a large percentage of area in farmland (Figure 3) tend to be more knowledgeable than residents of less agricultural regions. This corresponds the trend discussed in the NEETF report where individuals living in less urban environments scored higher on the knowledge index.

Chesapeake Bay Program - 2002 Resident Survey
13
Map 3: Regional differences in respondents’ ability to define a watershed according to the 2002 survey.
R2 = 0.598
30.0
35.0
40.0
45.0
50.0
55.0
0.0% 10.0% 20.0% 30.0% 40.0% 50.0%
% Farmland
% D
efin
ing
'wat
ersh
ed' C
orr
ectly
Figure 3: Relationship between knowledge and regional land use. Residents of areas with more farmland tend to be better able to define a watershed than residents of less agricultural areas. Less agricultural areas include urban areas as well as remote, mountainous areas.

Chesapeake Bay Program - 2002 Resident Survey
14
III. PERCEPTIONS OF WATER QUALITY Respondent perceptions about water and environmental quality both in their local area and in the watershed as a whole were measured through 4 questions. First, respondents were asked how concerned they are (Very Concerned, Somewhat Concerned, Not Very Concerned, Not at all Concerned) with pollution and environmental quality in their local streams and waterways (Q1) and then in the Chesapeake Bay as a whole (Q2). Next, they were asked to indicate whether they think their local streams and waterways (Q3) and then the Chesapeake Bay as a whole (Q4) is More Polluted, Less Polluted, or About the Same compared to 10 years ago. Level of Concern
Watershed-wide Analysis Overall, respondents expressed a high level of concern for water quality (Table 5), both in local streams and waterways (89% Very or Somewhat Concerned) and in the Chesapeake Bay as a whole (85% Very or Somewhat Concerned), with the majority of respondents (52%) indicating they are Very Concerned at both levels. Overall, respondents are equally concerned with their local waterways and with the Bay as a whole, and these levels of concern did not vary significantly with any of the demographic factors analyzed (Table 6). In addition, knowledge level had no bearing on respondent level of concern.
Table 5: Levels of concern for local streams and waterways and the Chesapeake Bay as a whole among respondents to the 2002 survey. Mean scores were calculated based on coded responses with “Don’t Know” responses ignored: 1 = Very Concerned, 2 = Somewhat Concerned, 3 = Not Very Concerned, 4 = Not at All Concerned.
How concerned are you with the water quality in...?
Local streams &
waterways Chesapeake Bay
as a Whole Very concerned 52.0% 51.6% Somewhat concerned 36.6% 33.8% Not very concerned 6.7% 5.0% Not at all concerned 3.9% 2.6% DK/RF 0.9% 7.0% Mean 1.6 1.6
These findings are consistent with other surveys. The 2001 NGS Survey reported that 90% of Americans expressed concern with environmental quality in our nation’s rivers (46% were Very Concerned). In 1993-1994 CBP Attitudes Survey, 87% of respondents indicated that they were concerned with pollution in the Bay (50% Very Concerned). Compared with this survey, in which 88% of respondents were concerned with the Bay (not including respondents from New York, Delaware, or West Virginia) and 54% indicated that they are Very Concerned, levels of concern appear to have remained constant over the past 9 years.

Chesapeake Bay Program - 2002 Resident Survey
15
Table 6: Demographic trends in the levels of concern for local streams and waterways and for the Chesapeake Bay as a whole. None of the demographic factors demonstrated a significant relationship.
Concern with local streams/waterways Concern with Bay as a whole
Demographic Characteristic Mean* N Chi-Square df P-Value PRE** Mean* N Chi-
Square df P-Value PRE**
Overall 1.6 1971 1.6 1848
Age 1915 57.60 15 <0.001 -0.120 (G) 1796 50.06 15 <0.001 -0.125 (G)
<25 2.0 1.8
25-34 1.7 1.6
35-44 1.6 1.6
45-54 1.5 1.5
55-65 1.6 1.5
>65 1.6 1.6
Gender 1971 5.78 3 0.123 N/A 1848 19.12 3 <0.001 0.102 (V)
Male 1.7 1.6
Female 1.6 1.5
Education 1950 30.06 12 0.003 0.015 (G) 1827 25.49 12 0.013 0.004 (G)
Less than High School 1.7 1.6
High School Diploma 1.6 1.6
Some College, no 4 yr degree 1.6 1.5
4 Yr College Degree 1.6 1.5
Graduate Degree 1.6 1.5
Income 1595 22.40 15 0.098 N/A 1308 8.58 12 0.738 N/A
< $15,000 1.7 1.5
between $15,000 and < $30,000 1.6 1.5
between $30,000 and < $50,000 1.6 1.5
between $50,000 and < $75,000 1.6 1.6
between $75,000 and < $100,000 1.6 1.6
$100,000 or more 1.7
Race 1920 35.76 12 <0.001 0.0136 (V) 1798 12.98 12 0.067 0.105 (V)
White 1.7 1.6
Black 1.4 1.4
Chinese 1.6 1.5
Hispanic 1.7 1.7
Other/Mixed Race 1.6 1.4
Type of community 1953 35.76 9 <0.001 0.131 (G) 1833 36.70 9 <0.001 -0.091 (G)
Rural area 1.7 1.6
Small town 1.7 1.6
City suburb 1.6 1.6
City 1.5 1.4
* Means ignore “Don’t Know” responses: 1= Very Concerned, 2 = Somewhat Concerned, 3 = Not Very Concerned, 4 = Not at all Concerned
** PRE measures: G = Gamma for ordinal variables, V = Cramer's V for nominal variables

Chesapeake Bay Program - 2002 Resident Survey
16
Geographic Analysis In general, all regions expressed concern for both local waterways and the Bay as a whole, as illustrated by the mean scores for each region (Table 7), ranging from 1.4 to 1.8 for local streams and waterways and 1.3 to 1.7 for the Bay as a whole. However, in general, people residing in regions closer to the Bay tend to be slightly more concerned with their local waterways than those in regions farther away (Map 4). This trend is also seen regarding concern for the Bay as a whole where highest concern was expressed in Baltimore and lowest concern was expressed in North-central Pennsylvania and New York (Map 5). In each case, Baltimore and Washington, D.C. are among the most concerned regions. These observations are consistent with the conclusion that residents of areas with a higher population density tend to be more concerned (Figure 4).
Table 7: Regional trends in level of concern for local streams and waterways and the Chesapeake Bay as a whole among respondents to the 2002 survey. Means are calculated based on coded responses with “Don’t Know” responses ignored: 1 = Very Concerned, 2 = Somewhat Concerned, 3 = Not Very Concerned, 4 = Not at all Concerned.
Local streams &
waterways Chesapeake Bay
as a Whole Overall 1.6 1.6 Regions New York 1.8 1.7 North-central Pennsylvania 1.7 1.7 South-central Pennsylvania 1.6 1.6 Shenandoah & Western Potomac 1.7 1.5 North-central Virginia 1.7 1.6 Baltimore/Washington Metro 1.6 1.6 Tidewater 1.6 1.5 Delmarva 1.6 1.5 Baltimore 1.4 1.3 Washington, D.C. 1.5 1.5
This slight, but definite Distance-to-Bay trend in levels of concern also was demonstrated by the 1993-1994 Attitudes Survey, with 90% of respondents within 50 miles of the Bay and 80% of those residing >100 miles from the Bay expressing concern. In this survey, 92% of respondents in the Coastal distance band and 79% of respondents from the Upper Reaches were either Very or Somewhat Concerned. Therefore, not only are overall levels of concern remaining relatively constant, but regional trends in this level of concern also are remaining constant.

Chesapeake Bay Program - 2002 Resident Survey
17
Map 4: Regional differences in level of concern for local streams and waterways. Mean scores are mapped: 1 = Very Concerned, 2 = Somewhat Concerned, 3 = Not Very Concerned, 4 = Not at all Concerned.
Map 5:Regional differences in level of concern for the Chesapeake Bay as a whole. Mean scores are mapped: 1 = Very Concerned, 2 = Somewhat Concerned, 3 = Not Very Concerned, 4 = Not at all Concerned.

Chesapeake Bay Program - 2002 Resident Survey
18
R2 = 0.5194
1.3
1.4
1.5
1.6
1.7
1.8
1.9
1 10 100 1000 10000 100000
2000 Population Density (people/sq mi)
Mea
n L
evel
of C
on
cern
Figure 4: Relationship between level of concern with local streams and waterways and population density (logarithmic scale).
Perceived Trends
Note: all means and analysis in this section were calculated using re-coded survey responses to allow for directional analysis: 1 = More Polluted, 2 = About the Same, 3 = Less polluted. Watershed-wide Analysis Compared to 10 years ago, many respondents believe that water quality in general has declined, with 42% of respondents indicating that local streams and waterways are More Polluted than 10 years ago and 36% indicating that the Chesapeake Bay as a whole is More Polluted than 10 years ago (Table 8). Only 20% of respondents indicated that they believe local streams and waterways are Less Polluted than 10 years ago, and 15% indicated the same about the Chesapeake Bay as a whole. The general trends in perceived changes in pollution level for the Bay as a whole are similar to the results obtained in the
Table 8: Perceived trends in pollution levels for local streams and waterways and the Chesapeake Bay as a whole among respondents to the 2002 survey. Mean responses were calculated based on coded responses with “Don’t Know” responses ignored: 1 = More Polluted, 2 = About the Same, 3 = Less Polluted.
Local streams & waterways
Chesapeake Bay as a Whole
More polluted 41.8% 35.8% About the same 26.8% 22.7% Less polluted 20.0% 14.6% DK/RF 11.4% 26.8% Mean 1.7 1.7
Mor
e C
once
rned
Le
ss
Con
cern
ed

Chesapeake Bay Program - 2002 Resident Survey
19
1993-1994 Attitudes Survey, in which 46% of respondents said that the Chesapeake Bay was more polluted than 10 years ago and 20% said it was less polluted (compared to 37% and 15% respectively in this survey without NY, WV, and DE respondents). However, there was a slight tendency for respondents to the 2002 survey to select the neutral option, “About the Same” (23%) more often than 1993-1994 respondents (18%) as well as to respond “Don’t Know” (27% versus 16%). When comparing perceived trends to the various demographic factors surveyed, gender was the only characteristic with a significant impact. In general, males had a more optimistic view of pollution trends, and more often indicated that pollution levels have decreased than did females (Table 9). Weak relationships were also observed for income (wealthier respondents having a slight tendency to be more optimistic) and race (Black and “Other” respondents having a slight tendency to be more pessimistic), but the measures-of-association for these relationships were not significant. To further understand these data, knowledge levels and levels of concern among watershed residents were cross-tabulated against perceived trends. No relationship was seen between knowledge level and perceived trend. However, there was a weak tendency for respondents expressing a higher degree of concern for the Bay as a whole to more often indicate that it is more polluted than 10 years ago (Figure 5). Geographic Analysis Clear geographic trends were found among the perceived trend in pollution in local streams and waterways (Table 10, Map 6). As distance from the Bay increases, residents tend to be more optimistic about their local waterways, with fewer respondents indicating that their local streams and waterways have become more polluted (means ranged from 1.5 to 2.0). For instance, 58%, 48%, and 44% of Baltimore, Delmarva, and Baltimore/Washington Metro respondents, respectively, indicated that their local waterways are more polluted than 10 years ago, with 45% of respondents from the Coastal distance band in general reporting a higher level of pollution. In contrast, only 30% and 33% of New York and North-central Pennsylvania residents reported higher levels of pollution. However, when respondents were asked about the Chesapeake Bay as a whole, the regional trends were less pronounced (means ranged from 1.6 to 1.8), and the distance-to-bay trend disappeared (means of 1.7 in all 4 distance bands). Source of Information
Overall, personal observation was the most important factor affecting residents’ views on pollution, with 31% of respondents indicating this as their primary source of information (Q6). Other important factors were environmental group reports (21%) and media reports (20%). Less important sources of information were Government Reports (7%) and Friends and Family (4%). This statistic was consistent across regions, distance bands and demographic factors, and had no bearing on the perceived trend of pollution levels in either local waterways or in the Chesapeake Bay as a whole.

Chesapeake Bay Program - 2002 Resident Survey
20
Table 9: Demographic relationships for the perceived trends in pollution levels for local streams and waterways and for the Chesapeake Bay as a whole. Males tend to believe that pollution has improved in the past 10 years more than females. No other demographic factors demonstrated a significant relationship.
Perceived Trend in Local Quality Perceived Trend in Bay Quality
Demographic Characteristic Mean* N Chi-Square df P-Value PRE** Mean* N Chi-
Square df P-Value PRE**
Overall 1.83 1762 1.82 1455
Age 1713 33.49 10 <0.001 0.099 (G) 1418 22.23 10 0.014 0.051 (G)
<25 1.8 2.0
25-34 1.8 1.8
35-44 1.9 1.8
45-54 1.8 1.8
55-65 1.9 1.9
>65 1.9 1.8
Gender 1762 100.80 2 <0.001 0.239 (V)*** 1455 72.10 2 <0.001 0.223 (V)***
Male 2.0 2.0
Female 1.7 1.7
Education 1743 33.41 8 <0.001 0.118 (G) 1440 19.03 8 0.015 0.076 (G)
Less than High School 1.8 1.9
High School Diploma 1.8 1.8
Some College, no 4 yr degree 1.8 1.8
4 Yr College Degree 1.8 1.8
Graduate Degree 2.0 1.9
Income 1431 42.91 10 <0.001 0.195 (G) 1194 32.30 10 <0.001 0.147 (G)
< $15,000 1.7 1.9
between $15,000 and < $30,000 1.7 1.8
between $30,000 and < $50,000 1.8 1.8
between $50,000 and < $75,000 1.9 1.8
between $75,000 and < $100,000 1.9 1.9
$100,000 or more 2.0 1.9
Race 1714 46.15 8 <0.001 0.164 (V) 1421 22.89 12 0.029 0.127 (V)
White 1.9 1.9
Black 1.6 1.7
Chinese 2.0 1.6
Hispanic 2.0 2.2
Other/Mixed Race 1.5 1.7
Type of community 1748 7.97 6.000 0.239 N/A 1443 4.69 6 0.584 N/A
Rural area 1.9 1.8
Small town 1.9 1.8
City suburb 1.8 1.8
City 1.7 1.8
*Means ignore "Don't Know" responses: 1= More Polluted, 2= About the Same, 3= Less Polluted ** PRE Measures = G - Gamma for ordinal variables, V = Cramer's V for nominal variables *** Statistically significant relationship
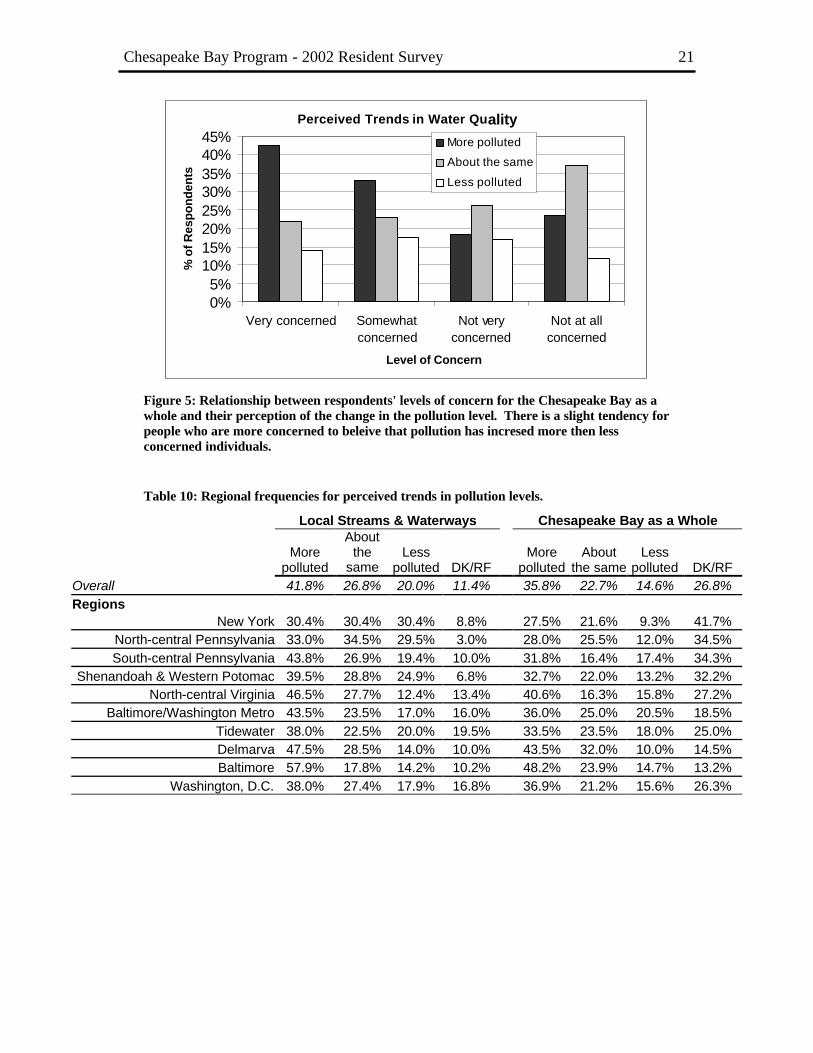
Chesapeake Bay Program - 2002 Resident Survey
21
Perceived Trends in Water Quality
0%5%
10%15%20%25%30%35%40%45%
Very concerned Somewhatconcerned
Not veryconcerned
Not at allconcerned
Level of Concern
% o
f Res
po
nd
ents
More polluted
About the same
Less polluted
Figure 5: Relationship between respondents' levels of concern for the Chesapeake Bay as a whole and their perception of the change in the pollution level. There is a slight tendency for people who are more concerned to beleive that pollution has incresed more then less concerned individuals.
Table 10: Regional frequencies for perceived trends in pollution levels.
Local Streams & Waterways Chesapeake Bay as a Whole
More
polluted
About the
same Less
polluted DK/RF More
polluted About
the same Less
polluted DK/RF Overall 41.8% 26.8% 20.0% 11.4% 35.8% 22.7% 14.6% 26.8% Regions
New York 30.4% 30.4% 30.4% 8.8% 27.5% 21.6% 9.3% 41.7% North-central Pennsylvania 33.0% 34.5% 29.5% 3.0% 28.0% 25.5% 12.0% 34.5% South-central Pennsylvania 43.8% 26.9% 19.4% 10.0% 31.8% 16.4% 17.4% 34.3%
Shenandoah & Western Potomac 39.5% 28.8% 24.9% 6.8% 32.7% 22.0% 13.2% 32.2% North-central Virginia 46.5% 27.7% 12.4% 13.4% 40.6% 16.3% 15.8% 27.2%
Baltimore/Washington Metro 43.5% 23.5% 17.0% 16.0% 36.0% 25.0% 20.5% 18.5% Tidewater 38.0% 22.5% 20.0% 19.5% 33.5% 23.5% 18.0% 25.0% Delmarva 47.5% 28.5% 14.0% 10.0% 43.5% 32.0% 10.0% 14.5% Baltimore 57.9% 17.8% 14.2% 10.2% 48.2% 23.9% 14.7% 13.2%
Washington, D.C. 38.0% 27.4% 17.9% 16.8% 36.9% 21.2% 15.6% 26.3%
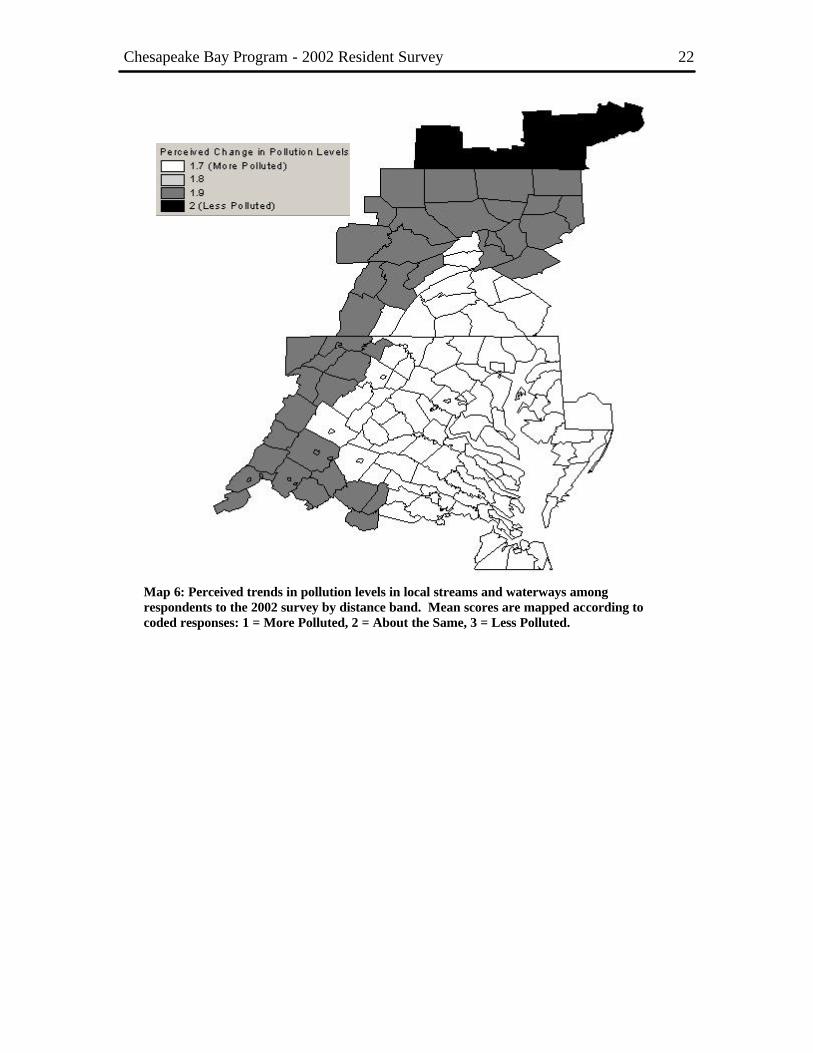
Chesapeake Bay Program - 2002 Resident Survey
22
Map 6: Perceived trends in pollution levels in local streams and waterways among respondents to the 2002 survey by distance band. Mean scores are mapped according to coded responses: 1 = More Polluted, 2 = About the Same, 3 = Less Polluted.

Chesapeake Bay Program - 2002 Resident Survey
23
IV. ATTITUDES Respondent attitudes towards water pollution was measured through a series of questions asking them to rate potential sources of pollution (Q8), indicate agreement levels with personal belief statements about pollution (Q9), indicate the level of responsibility that a list of public and private entities should assume for restoration (Q13), and analyze the importance of (Q15) and current action levels (Q14) towards watershed restoration in relation to other problems. Causes of Pollution
Watershed-wide Analysis When specific potential pollution sources were listed in random order, business and industry, population growth, and general littering, were stated by respondents as having the greatest impact on streams and waterways in their region (Table 11), with 82%, 80%, and 78% indicating either great or some impact, respectively (51%, 42%, 40% great impact, respectively). Sources ranking the lowest were lawn maintenance, accidental spills from commercial shipping, residential septic systems, and waste from boats/boating with 56%, 59%, 62%, and 63% of respondents indicating great or some impact, respectively (18%, 32%, 22%, and 29% great impact, respectively). Note, however, that respondents generally indicated that all potential pollution sources listed had some impact, since the overall mean of 2.4 for Lawn Maintenance is still relatively high (1 = Great Impact, 2 = Some Impact, 3 = Very Little Impact, 4 = No Impact; mid-point = 2.5).
Table 11: Perceived impact of various sources of pollution on waterways in the respondent’s region. Mean scores calculated based on coded responses with “Don’t Know” responses ignored: 1 = Great Impact, 2 = Some Impact, 3 = Very Little Impact, 4 = No Impact.
Mean Great
Impact Some Impact
Very Little
Impact No
Impact Business & Industry 1.8 50.7% 31.1% 11.0% 7.2% Population Growth 1.9 41.9% 38.2% 11.6% 8.2% General Littering 1.9 39.5% 38.5% 16.8% 5.2% Vehicles 2.0 33.4% 39.5% 19.0% 8.1% General Construction 2.1 31.8% 36.8% 20.3% 11.1% Landfills 2.1 33.2% 36.3% 17.5% 13.0% Wastewater Treatment Facilities 2.2 27.2% 37.2% 21.7% 14.0% Farming 2.2 32.0% 34.4% 19.6% 14.0% Boats/Boating 2.2 28.3% 34.4% 23.8% 13.5% Septic Systems 2.3 22.3% 39.8% 24.8% 13.2% Commercial Spills 2.3 31.9% 27.5% 22.4% 18.1% Lawn Maintenance 2.4 17.8% 38.8% 29.5% 13.9%
Business and Industry also ranked as being the most serious cause of pollution in the 1993-1994 Attitudes Survey. However, in 1993-1994, this was followed by commercial shipping and sewage treatment rather than by population growth and general littering, as in the current study. In fact, sewage treatment (wastewater treatment facilities) and

Chesapeake Bay Program - 2002 Resident Survey
24
commercial shipping ranked 6th and 11th respectively out of the 12 potential pollution sources listed in the current study. This represents a significant drop in the perceived relative importance of these sources and a significant increase in the perceived relative importance of population growth and general littering. Although general littering was not specifically asked about in 1993-1994, “individuals” did rank second-to-last (tied with recreational boating) in that study among potential causes of pollution. Another notable difference between the findings is that farming ranked the lowest among causes of pollution in 1993-1994, but ranked 8th (out of 12) in the current study. Though the questions were phrased differently in the 1993-1994 Attitudes Survey than in this survey, the qualitative distinctions discussed here are likely to be an accurate reflection of actual changes in attitude among the general public. Geographic Analysis Analyzing these statistics at a regional level reveals some interesting trends (Table 12, Map 7). First, Business and Industry ranked as the most important source of pollution in Washington, D.C., Baltimore and, interestingly, New York. In the Baltimore/Washington Metro and North-central Virginia regions (2 of the most rapidly growing population centers in the watershed), Population Growth ranked as the most important source of pollution, and General Littering was identified as the most important pollution source in the Shenandoah and Western Potomac region. The remaining regions had ties among 2 sources; Business and Industry and General Littering ranked highest in North-central Pennsylvania, and Business and Industry and Population growth ranked highest in South-central Pennsylvania, Tidewater, and Delmarva.
Table 12: Regional trends in perceived impact of 12 potential pollution sources on water quality in the respondent’s region. Mean scores for each region and for each source are reported based on coded responses and with “Don’t Know” responses ignored: 1 = Great Impact, 2 = Some Impact, 3 = Very Little Impact, 4 = No Impact.
Bus
ines
s &
In
dust
ry
Pop
ulat
ion
Gro
wth
Gen
eral
Li
tterin
g
Veh
icle
s
Gen
eral
C
onst
ruct
ion
Land
fills
Was
tew
ater
T
reat
men
t F
acili
ties
Far
min
g
Boa
ts/B
oatin
g
Sep
tic S
yste
ms
Com
mer
cial
S
pills
Law
n M
aint
enan
ce
Overall 1.8 1.9 1.9 2.0 2.1 2.1 2.2 2.2 2.2 2.3 2.3 2.4 Regions
New York 1.8 2.3 2.4 2.2 2.3 2.2 2.6 2.2 2.3 2.5 2.4 2.1 North-central Pennsylvania 2.0 2.4 2.2 2.1 2.5 2.4 2.6 2.2 2.2 2.6 2.6 2.0 South-central Pennsylvania 1.7 2.4 2.0 2.1 2.3 2.0 2.4 1.9 1.7 2.4 2.4 1.9
Shenandoah and Western Potomac 2.0 2.5 2.4 2.3 2.4 2.2 2.7 2.2 2.2 2.6 2.6 1.9 North-central Virginia 1.9 2.3 2.1 2.2 2.3 2.1 2.6 2.2 1.8 2.5 2.6 2.0
Baltimore/Washington Metro 1.6 2.2 1.8 2.1 2.2 2.0 2.0 1.9 1.5 2.2 2.0 1.9 Tidewater 1.6 2.2 2.0 2.0 2.1 2.3 1.9 2.0 1.6 2.2 1.9 1.8 Delmarva 1.8 2.2 2.2 2.1 2.2 1.9 2.1 2.1 1.8 2.5 1.9 2.0 Baltimore 1.5 2.1 2.0 2.0 2.0 2.3 1.7 1.7 1.8 2.2 1.8 1.6
Washington, D.C. 1.5 2.1 1.8 1.9 1.9 2.2 1.9 1.8 1.7 2.2 2.0 1.7
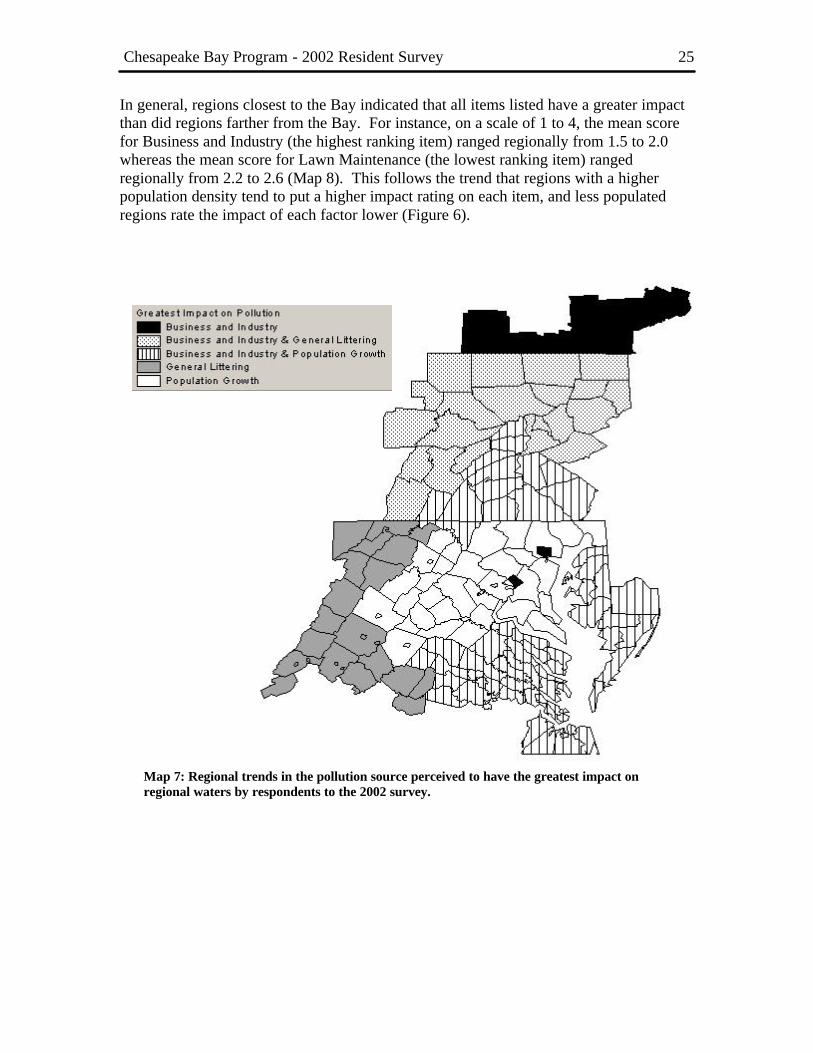
Chesapeake Bay Program - 2002 Resident Survey
25
In general, regions closest to the Bay indicated that all items listed have a greater impact than did regions farther from the Bay. For instance, on a scale of 1 to 4, the mean score for Business and Industry (the highest ranking item) ranged regionally from 1.5 to 2.0 whereas the mean score for Lawn Maintenance (the lowest ranking item) ranged regionally from 2.2 to 2.6 (Map 8). This follows the trend that regions with a higher population density tend to put a higher impact rating on each item, and less populated regions rate the impact of each factor lower (Figure 6).
Map 7: Regional trends in the pollution source perceived to have the greatest impact on regional waters by respondents to the 2002 survey.

Chesapeake Bay Program - 2002 Resident Survey
26
Map 8: Regional trends in the perceived impact of potential pollution sources among respondents to the 2002 survey. Mean ratings are mapped, with “Don’t Know” responses ignored: 1 = Great Impact, 2 = Some Impact, 3 = Very Little Impact, 4 = No Impact.
Business & Industry Lawn Maintenance

Chesapeake Bay Program - 2002 Resident Survey
27
R2 = 0.5718
1.4
1.5
1.6
1.7
1.8
1.9
2.0
2.11 10 100 1000 10000 100000
2000 Population Density (people/sq mi)
Mea
n Im
pac
t of B
usi
nes
s &
Ind
ust
ry
Figure 6: Relationship between population density (logarithmic scale) and the perceived impact of business and industry on regional water quality among respondents to the 2002 survey. Relationships for other potential pollution sources mentioned are similar.
Values about Pollution
Watershed-wide Analysis To further elucidate respondent views of pollution, we asked them to indicate their level of agreement with a series of value statements (Table 13). First they were asked about their attitudes towards having a green, manicured lawn. Most respondents (72%) agreed that having a green manicured lawn is a thing of pride and beauty (26% Strongly Agree). Further, most respondents (60%) disagreed that having a green, manicured lawn is a waste of time and money (26% Strongly Disagree). These statistics indicate that most respondents place a high value on the appearance of their lawn. We further analyzed this characteristic by asking those respondents who have lawns to care for (84% of respondents) about their lawn maintenance activities. Of those who have a lawn, 62% indicate that they do not fertilize it at all. An additional 29% fertilize it themselves (an average of 1.7 times per year) and 8% hire a service to fertilize it. Among those who hire a service, we asked about factors that may affect their selection of a particular service. Cost was an important factor to 83% of respondents hiring a service (41% Very Important), the results the service is able to provide was an important factor to 91% of these respondents (62% Very Important), and the service’s environmental practices was an important factor to 87% of respondents (59% Very Important). Respondents were next asked about value statements specifically addressing water pollution (Table 13). In general, respondents gave responses consistent with the idea that pollution is affecting the watershed and needs to be addressed. For instance, 88% of respondents agreed (60% Strongly Agree) that pollution in the water is adversely impacting fish and wildlife, 71% disagreed (39% Strongly Disagree) that their local streams and waterways are unspoiled by pollution, and 89% agreed (58% Strongly
Less
Impa
ct
Gre
at Im
pact

Chesapeake Bay Program - 2002 Resident Survey
28
Agree) that there is a pollution problem needing to be solved. These statistics correspond to those presented earlier regarding the high level of concern for water quality both in local streams and waterways and the tendency for individuals to believe that pollution has increased in the past 10 years.
Table 13: Levels of agreement with value statements among respondents to the 2002 Survey. Mean scores are reported based on coded responses, with “Don’t Know” responses ignored: 1 = Strongly Agree, 2 = Somewhat Agree, 3 = Somewhat Disagree, 4 = Strongly Disagree.
Mean Strongly Agree
Somewhat Agree
Somewhat Disagree
Strongly Disagree
Having a green, manicured lawn is a thing of pride and beauty 2.2 25.6% 46.3% 16.2% 12.0% Having a green, manicured lawn is a waste of time and money 2.7 15.8% 24.3% 34.0% 25.9% Pollution in the water is affecting fish and wildlife in your local waterways 1.6 60.1% 27.9% 7.5% 4.5% Your local streams and waterways are unspoiled by pollution 3.2 6.0% 13.5% 31.3% 39.2% You think there is a pollution problem that needs to be solved 1.6 58.0% 30.8% 6.7% 4.5% Your everyday actions adversely affect water quality 2.5 21.2% 31.5% 24.1% 23.2% One person's actions can make a difference in improving water quality 1.7 49.3% 38.1% 7.3% 5.3% You are interested in helping to improve water quality 1.6 47.7% 46.7% 3.9% 1.7% You don't know how to get involved in improving water quality 2.5 21.7% 29.6% 28.1% 20.7% Other value statements we posed to respondents examined their opinions about personal responsibility for the causes and mitigation of pollution. There was a wide spread in respondents’ beliefs about their personal level of responsibility for pollution problems; approximately half (53%) of respondents agreed that their everyday actions adversely affect water quality (21% Strongly Agree), while the other half (47%) believe their everyday actions do not adversely affect water quality (23% Strongly Disagree). However, 87% of respondents agree (49% Strongly Agree) that one person’s actions (though not necessarily their own personal actions) can make a difference in improving water quality. A cross-tabulation of these 2 questions yielded no relationship. Finally, 94% of respondents agreed (48% Strongly Agree) that they are interested in helping to improve water quality, yet 51% agreed (22% Strongly Agree) that they don’t know how to get involved. Clearly, there is a large potential for resident involvement in restoration activities, but there is an information obstacle that must be overcome in order to achieve that level of participation. Upon further analysis of this issue, residents who expressed a high level of concern for local streams and waterways as well as the Chesapeake Bay as a whole were significantly more interested in helping to improve

Chesapeake Bay Program - 2002 Resident Survey
29
water quality (Figure 7). Thus, if levels of concern increase among residents, interest levels in stewardship activities are likely to increase accordingly
"You are interested in helping to improve water quality..."
0%
10%
20%
30%
40%
50%
60%
70%
Very concerned Somewhatconcerned
Not veryconcerned
Not at allconcerned
How concerned are you with water quality in the Chesapeake Bay?
% o
f Res
po
den
tsStrongly agreeSomewhat agreeSomewhat disagreeStrongly disagree
Figure 7: Relationship between level of concern for the Chesapeake Bay as a whole and respondent level of interest in helping to improve water quality. More concerned respondents were more interested in getting involved. A similar relationship exists with the level of concern for local streams and waterways.
Geographic Analysis Regional trends in values towards water quality issues are displayed in Table 14. Only the most notable trends are discussed here. Regarding resident attitudes about the affects of pollution, regions closest to the Bay (Baltimore, Washington, D.C., Baltimore/Washington Metro, Tidewater, and Delmarva) tend to agree most often that pollution in the water is affecting fish and wildlife populations with 82%, 72%, 59%, 65% and 60% Strongly Agreeing, respectively. Regions farthest from the Bay (New York and Shenandoah and Western Potomac) agree with this statement least often with 41% and 48% Strongly Agreeing, respectively. A similar trend is seen in attitudes about whether local streams and waterways are unspoiled by pollution; residents of regions closer to the Bay tend to disagree that their local streams and waterways are unspoiled more than residents of regions farther from the Bay. Finally, residents of regions closer to the Bay more often agree that there is a pollution problem that needs to be solved, with the most agreement occurring in Baltimore and Washington, D.C., and the least agreement in New York, North-central Pennsylvania, and Shenandoah and Western Potomac. It should be noted, however, that on all 3 of these statements, the general tendency is for respondents to believe that pollution is having an adverse effect and needs to be addressed. Based on a scale of 1-4 (1 = Strongly Agree, 2 = Somewhat Agree, 3 = Somewhat Disagree, 4 = Strongly Disagree), the means for each of these statements (pollution is affecting fish and wildlife, waterways are unspoiled by pollution, and there is a pollution problem needing to be solved) ranged

Chesapeake Bay Program - 2002 Resident Survey
30
Table 14: Regional trends in levels of agreement with a series of value statements posed to respondents of the 2002 survey. Mean scores are calculated based on coded responses with “Don’t Know” responses ignored: 1 = Strongly Agree, 2 = Somewhat Agree, 3 = Somewhat Disagree, 4 = Strongly Disagree.
Hav
ing
a gr
een,
man
icur
ed la
wn
is a
th
ing
of p
ride
and
beau
ty
Hav
ing
a gr
een,
man
icur
ed la
wn
is a
w
aste
of t
ime
and
mon
ey
Pol
lutio
n in
the
wat
er is
affe
ctin
g fis
h an
d w
ildlif
e in
you
r lo
cal w
ater
way
s
You
r lo
cal s
tream
s an
d w
ater
way
s ar
e un
spoi
led
by p
ollu
tion
You
thin
k th
ere
is a
pol
lutio
n pr
oble
m
that
nee
ds to
be
solv
ed
You
r ev
eryd
ay a
ctio
ns a
dver
sely
af
fect
wat
er q
ualit
y
One
per
son'
s ac
tions
can
mak
e a
diffe
renc
e in
impr
ovin
g w
ater
qua
lity
You
are
inte
rest
ed in
hel
ping
to
impr
ove
wat
er q
ualit
y
You
don
't kn
ow h
ow to
get
invo
lved
in
impr
ovin
g w
ater
qua
lity
Overall 2.2 2.7 1.6 3.2 1.6 2.5 1.7 1.6 2.5 Regions
New York 2.2 2.6 1.9 3.0 1.8 2.6 1.7 1.7 2.3 North-central Pennsylvania 2.2 2.6 1.7 3.1 1.8 2.5 1.6 1.6 2.4 South-central Pennsylvania 2.3 2.5 1.6 3.2 1.6 2.3 1.6 1.7 2.4
Shenandoah and Western Potomac 2.1 2.8 1.8 3.0 1.8 2.6 1.7 1.6 2.6 North-central Virginia 2.2 2.6 1.6 3.3 1.6 2.5 1.6 1.6 2.6
Baltimore/Washington Metro 2.2 2.7 1.5 3.2 1.6 2.5 1.8 1.7 2.6 Tidewater 2.2 2.9 1.4 3.3 1.5 2.5 1.7 1.6 2.6 Delmarva 2.1 2.7 1.5 3.3 1.5 2.6 1.7 1.5 2.6 Baltimore 1.9 2.9 1.2 3.5 1.3 2.4 1.7 1.5 2.2
Washington, D.C. 2.1 2.7 1.3 3.5 1.3 2.4 1.7 1.5 2.4 from 1.2 (in Baltimore) to 1.9 (in New York), 3.0 (in New York) to 3.5 (in Baltimore and Washington, D.C.), and 1.3 (in Baltimore and Washington, D.C.) to 1.8 (in New York, North-central Pennsylvania, and Shenandoah and Western Potomac), respectively. One other notable regional trend in these data occurs in whether respondents feel they know how to get involved. Although a high level of uncertainty among respondents over how get involved exists in all regions, the respondents who are most uncertain about how to get involved reside in Baltimore, Washington, D.C., North-central Pennsylvania, South-central Pennsylvania, and New York. Slightly more than half of the respondents in these regions (63%, 50%, 54%, 53%, and 55%, respectively) agreed that they do not know how to get involved (30%, 27%, 21%, 21%, 24% Strongly Agree, respectively). The other regions ranged from 43% to 49% of respondents agreeing that they don’t know how to get involved (16% to 21% Strongly Agreeing).

Chesapeake Bay Program - 2002 Resident Survey
31
Attitudes towards Restoration
Watershed-wide Analysis Respondents generally believed that restoration of the waterways in the Chesapeake Bay watershed is a priority and needs more attention (Table 15). In fact, compared to other social, economic and environmental problems, 94% of watershed residents indicated that restoration of waterways in their region is important (60% Very Important). Further, 49% of respondents indicated that current efforts to restore local water quality are Too Little. Only 36% indicated that current efforts are About Right, and 2% believe that current efforts are Too Much.
Table 15: Attitudes towards watershed restoration as a priority and the appropriateness of the current level of effort in watershed restoration held by respondents to the 2002 survey.
How important do you personally think the restoration of the
waterways in your region is?
Do you think the current efforts to restore water quality in your region
are too much, about right or too little?
Very important 59.8% Too much 2.3% Somewhat important 34.1% About right 36.4%
Somewhat unimportant 3.8% Too little 49.0% Not at all important 1.3% DK/RF 12.3%
DK/RF 1.1% In the 1993-1994 Attitudes Survey, 88% of respondents indicated that Bay restoration was either the most important or one of the most important problems, and 49% indicated that it was the most important problem. Although the question wording was different, respondents to the current survey appear to place at least as high a priority on Bay restoration today as they did in 1993-1994 (the statistics presented above for the current study remain the same even after removing respondents from New York, West Virginia, and Delaware). In another comparison, 49% of respondents in 1993-1994 said that current efforts to clean up the Bay were too little, and 4% said the efforts were too much (29% said they were just right, with 19% responding “Don’t Know”). When respondents from New York, West Virginia, and Delaware were removed from the current study, 50% of respondents indicated that current efforts are Too Little and 2% indicated that they are Too Much (36% said they were About Right, and 12% indicated “Don’t Know”). The figures from the 2 surveys are nearly identical. Results obtained here also are comparable to those obtained in the 2001 NGS Survey, which reported that 94% of Americans believe that environmental issues in general are important (64% Very Important) and 98% believe that river protection specifically is an important environmental priority (75% Very Important). The current study also contained a set of questions asking respondents to state how responsible they believe various agencies should be for watershed restoration activities (Table 16). Respondents indicated that, in general, all parties listed should be responsible for restoration activities, with means ranging only from 1.4 to 1.8 (1 = Very Responsible,

Chesapeake Bay Program - 2002 Resident Survey
32
2 = Somewhat Responsible, 3 = Not Very Responsible, 4 = Not at all Responsible). However, the highest levels of responsibility were placed on Business and Industry, Local Government, and State Government with 97% of respondents believing that each one should be either Very or Somewhat Responsible (68%, 66%, and 61% Very Responsible, respectively). The least responsibility was placed on the Federal Government with 88% of respondents indicating it should be Very or Somewhat Responsible (41% Very Responsible).
Table 16: Degrees of responsibility for restoration of regional waterways placed on various agencies by respondents to the 2002 survey. Mean scores are calculated based on coded responses, with “Don’t Know” responses ignored: 1 = Very Responsible, 2 = Somewhat Responsible, 3 = Not Very Responsible, 4 = Not at all Responsible.
Mean Very
Responsible Somewhat
Responsible Not Very
Responsible Not at All
Responsible Business & Industry 1.4 67.9% 29.5% 1.2% 1.5% Local Government 1.4 65.6% 31.2% 2.2% 1.1% State Government 1.4 61.4% 35.4% 1.3% 1.9% Private Citizens 1.6 52.4% 42.5% 3.3% 1.9% Agricultural Producers 1.6 53.4% 40.0% 3.2% 3.4% Environmental Organizations 1.6 51.9% 39.7% 4.2% 4.1% Federal Government 1.8 40.6% 47.6% 5.4% 6.4%
Geographic Analysis No significant regional differences were noted in either the perceived importance of restoration activities (means ranging from 1.4 to 1.6) or attitudes towards the current level of restoration activities (means ranging from 2.4 to 2.7). However, regarding the perceived levels of responsibility of various agencies for restoration activities, respondents from Baltimore and Washington, D.C. place a higher responsibility on the Federal Government than other regions, and respondents from New York, North-central Pennsylvania, South-central Pennsylvania, and Shenandoah and Western Potomac placed lower responsibility on the Federal government. Perceived responsibility of other agencies were more consistent across regions (Table 17).

Chesapeake Bay Program - 2002 Resident Survey
33
Table 17: Regional differences in the perceived level of responsibility of various agencies for watershed restoration as expressed by respondents to the 2002 Survey. Mean scores are reported based on coded responses with “Don’t Know” responses ignored: 1 = Very Responsible, 2 = Somewhat Responsible, 3 = Not Very Responsible, 4 = Not at all Responsible.
Fed
eral
G
over
nmen
t
Sta
te
Gov
ernm
ent
Loca
l G
over
nmen
t
Agr
icul
tura
l P
rodu
cers
Bus
ines
s &
In
dust
ry
Env
ironm
enta
l O
rgan
izat
ions
Indi
vidu
als
Overall 1.4 1.4 1.4 1.6 1.6 1.6 1.8 Region
New York 1.9 1.5 1.4 1.7 1.3 1.7 1.5 North-central Pennsylvania 1.9 1.5 1.5 1.7 1.4 1.6 1.5 South-central Pennsylvania 2.0 1.6 1.4 1.6 1.4 1.6 1.6
Shenandoah and Western Potomac 1.9 1.5 1.4 1.6 1.3 1.7 1.5 North-central Virginia 1.8 1.5 1.4 1.5 1.3 1.6 1.6
Baltimore/Washington Metro 1.7 1.3 1.4 1.5 1.3 1.6 1.5 Tidewater 1.8 1.5 1.4 1.6 1.4 1.6 1.6 Delmarva 1.8 1.4 1.5 1.5 1.4 1.6 1.5 Baltimore 1.6 1.3 1.3 1.6 1.4 1.5 1.5
Washington, D.C. 1.4 1.3 1.3 1.4 1.3 1.5 1.6

Chesapeake Bay Program - 2002 Resident Survey
34
V. BEHAVIOR Watershed resident behaviors towards pollution reduction/prevention activities were assessed in two ways. First, respondents were asked to describe their current level of involvement in a host of specific pollution reduction and prevention activities (Q10, Q11) and about their frequency of participation in recreational activities (Q10). Next, they were asked to indicate whether there might be specific conditions that would serve as possible catalysts for even more involvement (Q12). Current Level of Involvement
Watershed-wide Analysis Respondents were first asked about their involvement boating and fishing, crabbing, or clamming (Table 18). Overall, participation was similar for each of these activities; 8.5% of respondents indicate that they go boating Often (54% Never go boating) and 11% of respondents indicating that they fish, crab, or clam Often (53% Never fish, crab, or clam). Frequency of participation in these recreational activities was not related to the level of concern for the Bay. However, residents who Never go boating are slightly more likely to perceive both their local streams and waterways and the Chesapeake Bay as a whole to be More Polluted than 10 years ago (Figure 8).
Table 18: Frequency of participation in recreational activities by respondents to the 2002 survey. Mean scores are based on coded responses and ignore “Don’t Know” responses: 1 = Often, 2 = Sometimes, 3 = Rarely, 4 = Never.
Mean Often Sometimes Rarely Never DK/RF Recreational Activities
Boating 3.3 8.5% 10.7% 27.0% 53.7% 0.1% Fishing, Crabbing, Clamming 3.1 11.2% 15.6% 20.6% 52.6% 0.0%
Perceived Trend in Pollution Level
0.0%
10.0%
20.0%
30.0%
40.0%
50.0%
60.0%
Often Sometimes Rarely Never
Frequency of Boating
% o
f R
espo
nden
ts
More pollutedAbout the sameLess polluted
Figure 8: Relationship between frequency of boating and the perceived trend in pollution levels in the Chesapeake Bay as a whole among respondents to the 2002 survey. A similar relationship exists for the perceived trend in local streams and waterways.

Chesapeake Bay Program - 2002 Resident Survey
35
Next, respondents were asked to indicate their frequency of participation in 4 stewardship activities (Table 19). Recycling of household trash was the most frequently performed action, with 69% of respondents indicating that they recycle Often, and only 12% indicating that they Never recycle household trash. Other items were performed much less frequently; 13% of respondents carpool Often (68% Never carpool), 12% use public transportation Often (51% Never use public transportation), and 6% ride a bike for transportation purposes Often (71% Never ride a bike for transportation).
Table 19: Frequency of participation in various activities by respondents to the 2002 survey. Mean scores are based on coded responses and ignore “Don’t Know” responses: 1 = Often, 2 = Sometimes, 3 = Rarely, 4 = Never.
Mean Often Sometimes Rarely Never DK/RF Stewardship Activities
Recycle 1.6 68.7% 10.4% 6.3% 11.9% 0.2% Carpool 3.3 12.5% 9.3% 10.1% 67.5% 0.7%
Use Public Transportation 3.2 11.8% 10.8% 13.6% 50.6% 0.1% Ride a Bike for Transportation 3.5 6.1% 13.2% 9.9% 70.7% 0.1%
In a different question format, 11 specific stewardship activities were listed, and respondents were asked to indicate if they had participated in each one in the last 5 years (Table 20). On average, respondents indicated participating in 4.9 actions, and 97% of respondents had participated in at least one listed action in the past 5 years. The most frequently cited actions included making an effort to reduce water usage (85%), buying at least one product specifically because it was environmentally safe (76%), and planting a tree (71%). The least frequently performed activities were buying an environmental license plate (10%), joining an environmental group (16%), and utilizing the environmental tax return check-off (21%).
Table 20: Proportion of respondents participating in each stewardship behavior listed in the past 5 years. The average respondent indicated participation in 4.9 of these actions.
Have you in the past 5 years… % Yes Altered product use out of concern for the waterways 38.8% Planted a tree 71.2% Reduced/eliminated pesticide use 28.8% Reduced/eliminated fertilizer use 46.9% Help clean up a stream 27.6% Bought products because they are environmentally safe 75.8% Bought environmental license plate 9.7% Utilized environmental tax check-off 21.4% Made efforts to reduce water usage 84.9% Donated to an environmental group 39.6% Joined an environmental group 15.6% At Least 1 of These Actions 97.0%

Chesapeake Bay Program - 2002 Resident Survey
36
Table 21: Participation in water quality stewardship actions by respondents to the 2002 Survey by demographic factor. Percentages represent the proportion of respondents within a particular demographic classification indicating they had participated in an activity at least once in the past 5 years.
Demographic Characteristic Mean # of Activities
Altered Product
Use Planted a Tree
Altered Pesticide
Use
Altered Fertilizer
Use
Help Clean a Stream
Bought Envir. Safe
Products
Bought Envir.
License Plate
Envir. Check-
Off
Reduced Water Usage
Donated to Envir. Group
Joined Envir. Group
Overall 4.9 38.8% 71.2% 28.8% 46.9% 27.6% 75.8% 9.7% 21.4% 84.9% 39.6% 15.6% Age
<25 4.6 31.9% 63.1% 47.5% 33.3% 32.6% 63.8% 9.9% 14.2% 70.2% 36.2% 19.1% 25-34 4.6 31.7% 67.4% 45.1% 34.8% 24.1% 76.2% 7.5% 19.4% 82.4% 35.7% 19.4% 35-44 5.3 43.3% 76.6% 58.9% 50.6% 30.5% 77.5% 10.9% 24.3% 87.0% 39.5% 15.4% 45-54 5.7 49.8% 77.4% 71.3% 57.9% 32.1% 83.3% 10.6% 26.0% 86.0% 44.6% 18.8% 55-65 5.2 37.8% 73.5% 63.7% 52.0% 27.1% 80.0% 10.5% 23.7% 89.5% 43.7% 13.2%
>65 4.3 28.0% 59.9% 51.8% 39.4% 17.7% 61.7% 7.4% 14.5% 84.8% 33.0% 8.2% Gender
Male 5.0 39.0% 76.1% 57.3% 47.7% 30.4% 74.7% 10.8% 22.7% 82.3% 39.6% 17.0% Female 4.8 38.6% 67.5% 58.8% 46.3% 25.6% 76.7% 8.9% 20.4% 86.9% 39.6% 14.6%
Education Less than High School 4.0 26.3% 50.6% 36.5% 34.6% 25.0% 61.5% 8.3% 15.4% 79.5% 20.5% 5.1%
High School Diploma 4.7 30.2% 69.2% 57.7% 43.9% 27.5% 71.6% 7.7% 16.7% 83.8% 29.5% 10.4% Some College, no 4 yr degree 5.0 39.3% 71.3% 59.5% 47.8% 25.4% 76.1% 10.6% 22.5% 84.2% 39.5% 12.7% 4 Yr College Degree or Higher 5.3 46.5% 76.4% 60.5% 47.6% 29.3% 81.9% 10.7% 25.5% 87.6% 48.5% 19.9%
Graduate Degree 5.6 48.4% 76.9% 64.6% 55.4% 29.4% 81.3% 10.8% 25.9% 88.0% 54.1% 28.8% Income
< $15,000 3.9 24.8% 51.7% 39.3% 24.8% 29.0% 61.4% 6.2% 12.4% 78.6% 22.1% 9.7% between $15,000 and < $30,000 4.5 31.0% 62.8% 53.1% 42.6% 23.8% 75.1% 8.7% 17.3% 83.0% 30.7% 10.5% between $30,000 and < $50,000 5.0 37.5% 69.1% 56.7% 47.3% 27.6% 77.0% 7.0% 22.7% 87.1% 38.4% 17.1% between $50,000 and < $75,000 5.5 44.5% 76.8% 66.8% 53.7% 28.7% 76.8% 11.3% 27.1% 85.3% 43.9% 18.9%
between $75,000 and < $100,000 5.6 45.1% 80.8% 64.8% 54.4% 29.7% 79.1% 11.5% 27.5% 84.1% 46.7% 14.8% $100,000 or more 5.9 50.3% 83.1% 64.6% 55.9% 33.8% 83.6% 14.4% 29.7% 86.2% 59.0% 23.6%

Chesapeake Bay Program - 2002 Resident Survey
37
Table 21, continued.
Demographic Characteristic Mean # of Activities
Altered Product
Use Planted a Tree
Altered Pesticide Use
Altered Fertilizer
Use
Help Clean a Stream
Bought Envir. Safe
Products
Bought Envir.
License Plate
Envir. Check-
Off
Reduced Water Usage
Donated to Envir. Group
Joined Envir. Group
Race White 5.2 39.4% 79.2% 60.3% 48.5% 28.4% 77.3% 10.0% 21.8% 85.7% 41.7% 15.8% Black 4.2 31.6% 33.7% 48.6% 39.5% 20.1% 66.7% 8.5% 20.4% 79.9% 27.2% 13.9% Asian 4.9 50.0% 59.1% 50.0% 40.9% 13.6% 72.7% 13.6% 9.1% 95.5% 40.9% 22.7%
Hispanic 4.3 28.0% 40.0% 40.0% 36.0% 28.0% 56.0% 16.0% 16.0% 88.0% 48.0% 12.0% Other/Mixed Race 5.5 51.5% 63.6% 63.6% 48.5% 42.4% 84.8% 4.5% 19.7% 87.9% 37.9% 18.2%
Type of community Rural area 5.3 40.2% 83.5% 63.8% 51.4% 30.8% 78.3% 11.4% 18.9% 83.5% 39.5% 16.0% Small town 5.0 36.8% 74.2% 55.1% 44.7% 29.5% 75.6% 8.9% 21.3% 86.4% 35.2% 15.4% City suburb 5.2 41.9% 69.9% 60.5% 49.9% 26.3% 73.7% 11.2% 22.4% 87.6% 43.7% 14.7%
City 4.8 37.6% 53.8% 53.4% 42.1% 21.9% 74.4% 7.6% 24.3% 84.3% 41.9% 16.2%

Chesapeake Bay Program - 2002 Resident Survey
38
Several key demographic differences in the level of action were found (Table 21). For instance, respondents aged 35-65 were more likely than respondents from younger or older age groups to participate in each of the actions listed (except for joining an environmental group, which was most common in the younger age groups), and participated in more total actions on average than either younger or older age groups (Figure 9). The mean number of actions ranged from 4.3 among the 65+ age group to 5.7 among the 45-54 age group.
Mean Number of Actions
4.6 4.6
5.35.7
5.2
4.3
2
3
4
5
6
7
<25 25-34 35-44 45-54 55-65 >65
Age
# of
Act
ions
in L
ast
5 Y
ears
Figure 9: Relationship between respondent age and level of participation in water quality stewardship actions. Mean number of actions out of 11 listed performed in the last 5 years is graphed for each age group.
Education (Figure 10) and income (Figure 11) also demonstrated distinct trends, with more educated and wealthier individuals indicating a higher level of participation in each of the actions listed as well participating in more total actions. For education, the mean number of actions per respondent ranged from 4.0 for individuals with less than a high school education to 5.6 for respondents with a graduate degree. Likewise, the mean number of actions per respondent increased from 3.9 for individuals with a household income <$15,000 to 5.9 for individuals with a household income of >$100,000.
Weaker relationships existed for race and community type. Black and Hispanic respondents tended to participate in fewer total actions (4.2, 4.3 respectively) than other races (ranging from 4.9-5.5). Among different community types, respondents describing their community as either rural or suburban participated in slightly more actions (5.3 and 5.2 respectively) than respondents from cities or small towns (4.8 and 5.0 respectively). This difference is particularly pronounced for actions requiring access to natural or permeable areas such as planting a tree, altering fertilizer or pesticide use and helping to clean up a stream.

Chesapeake Bay Program - 2002 Resident Survey
39
Mean Number of Actions
3.6
4.54.9
5.35.6
2
3
4
5
6
7
Less thanHigh School
High SchoolDiploma
Some College 4 Year Degree GraduateDegree
Educational Attainment
# o
f Act
ion
s in
Las
t 5 Y
ears
Figure 10: Relationship between respondent educational attainment and level of participation in water quality stewardship actions. Mean number of actions out of 11 listed performed in the last 5 years is graphed for each education attainment level.
Mean Number of Actions
3.9
5.05.5 5.6
5.9
4.5
2
3
4
5
6
7
<15K 15K-30K 30K-50K 50K-75K 75K-100K <100K
Income
# o
f Act
ion
s in
Las
t 5 Y
ears
Figure 11: Relationship between respondent household income and level of participation in water quality stewardship actions. Mean number of actions out of 11 listed performed in the last 5 years is graphed for each income level.
In general, more knowledgeable respondents participated in more actions (5.4) than less knowledgeable respondents (4.4) (Figure 12). This relationship was also illustrated in the 2001 NEETF survey, with more knowledgeable Americans participating in a higher number of stewardship actions. The one action that this relationship does not hold for is for the use of public transportation, which likely is more a reflection of the availability and convenience of public transportation than it is of stewardship values.

Chesapeake Bay Program - 2002 Resident Survey
40
5.4
4.4
0 1 2 3 4 5 6
Correct
IncorrectId
entif
ied
Def
initi
on o
f W
ater
shed
Mean # of Actions
Figure 12: Relationship between respondent knowledge level and the level of participation in water quality stewardship actions. Mean number of actions out of 11 listed performed in the last 5 years is graphed for respondents responding either correctly of incorrectly to the knowledge index.
Level of concern also had a significant impact on respondent behaviors (Figure 13). Respondents who are more concerned with both their local streams and waterways and the Chesapeake Bay as a whole participated in more total actions than did less concerned
Mean Number of Actions
5.44.7
3.3 3.4
5.5
4.6
3.0 3.2
0
1
2
3
4
5
6
7
Very concerned Somewhatconcerned
Not veryconcerned
Not at allconcerned
Level of Concern
Mea
n #
of A
ctio
ns
Local streams and waterways
Chesapeake Bay as a Whole
Figure 13: Relationship between respondent level of concern with local streams and waterways and the Chesapeake Bay as a whole and level of participation in water quality stewardship actions. Mean number of actions out of 11 listed performed in the last 5 years is graphed for each level of concern.

Chesapeake Bay Program - 2002 Resident Survey
41
individuals. This corresponds to the trend discussed in the previous section for more concerned respondents to also be more interested in helping to improve water quality. However, no relationship was evident between the mean number of actions taken by respondents and their perception of the trend in pollution levels over the past 10 years. When cross-tabulating levels of action among respondents with the various attitude statements discussed in the previous section, several interesting trends were revealed (Table 22). For instance, respondents who agreed that one person’s actions could make a difference were more likely to participate in more actions (range of 4.2 to 5.2 actions, on average). In addition, respondents who strongly agreed that they don’t know how to get involved participated in significantly fewer activities (4.0 actions on average) than did respondents who disagreed with this statement (6.0 actions on average). Finally, individuals indicating a high level of interest in helping to improve water quality participated in more than twice as many activities (5.4 actions on average) than respondents indicating a low level of interest (2.5 actions on average). Knowing that the level of concern for water quality is positively related to the level of interest in getting involved (as discussed previously), and that this, in turn, is positively related to levels of stewardship action is an important connection to make when planning outreach programs.
Table 22: Relationship between selected attitude measures and respondent level of participation in water quality stewardship activities. Mean number of actions out of 11 listed performed in the last 5 years is listed for each level of agreement with value statements.
Mean Number of Actions
Statement: Strongly Agree
Somewhat Agree
Somewhat Disagree
Strongly Disagree
You are interested in helping to improve water quality.
5.4 4.7 2.8 2.5
One person's actions can make a difference in improving water quality.
5.2 4.8 4.1 4.2
You don't know how to get involved in improving water quality.
4.0 4.5 5.3 6.0
Geographical Analysis Regional trends in participation rates for recreational activities and several stewardship activities are presented in Table 23. The most notable trends are for recycling rates and the use of public transportation. Residents of New York, North-central Pennsylvania, South-central Pennsylvania and Washington, D.C. recycle more frequently than residents of other regions, with 91%, 74%, 77% and 80% of respondents indicating that they recycle often in each region, respectively. The regions with the least frequent rates of household recycling are Shenandoah and Western Potomac (50% Often), North-central Virginia (58% Often), Baltimore (55% Often), and Delmarva (57% Often). Further, not surprisingly, residents of Washington, D.C., Baltimore, and the Baltimore/Washington
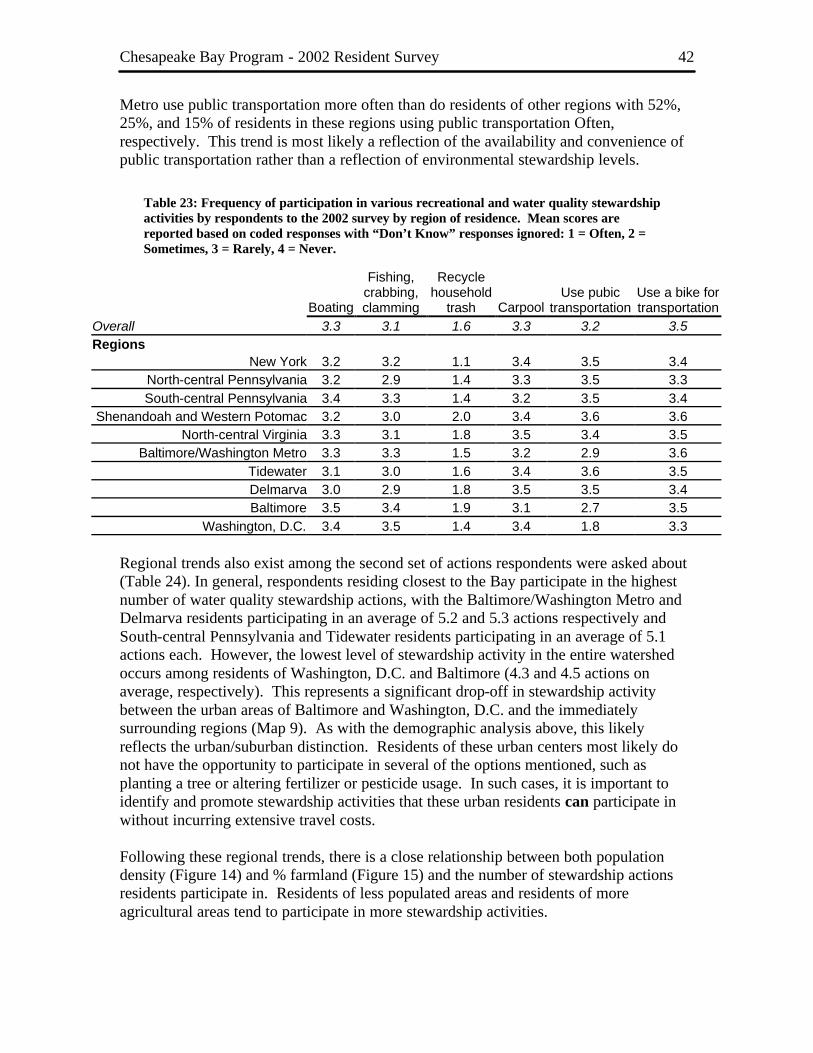
Chesapeake Bay Program - 2002 Resident Survey
42
Metro use public transportation more often than do residents of other regions with 52%, 25%, and 15% of residents in these regions using public transportation Often, respectively. This trend is most likely a reflection of the availability and convenience of public transportation rather than a reflection of environmental stewardship levels.
Table 23: Frequency of participation in various recreational and water quality stewardship activities by respondents to the 2002 survey by region of residence. Mean scores are reported based on coded responses with “Don’t Know” responses ignored: 1 = Often, 2 = Sometimes, 3 = Rarely, 4 = Never.
Boating
Fishing, crabbing, clamming
Recycle household
trash Carpool Use pubic
transportation Use a bike for transportation
Overall 3.3 3.1 1.6 3.3 3.2 3.5 Regions
New York 3.2 3.2 1.1 3.4 3.5 3.4 North-central Pennsylvania 3.2 2.9 1.4 3.3 3.5 3.3 South-central Pennsylvania 3.4 3.3 1.4 3.2 3.5 3.4
Shenandoah and Western Potomac 3.2 3.0 2.0 3.4 3.6 3.6 North-central Virginia 3.3 3.1 1.8 3.5 3.4 3.5
Baltimore/Washington Metro 3.3 3.3 1.5 3.2 2.9 3.6 Tidewater 3.1 3.0 1.6 3.4 3.6 3.5 Delmarva 3.0 2.9 1.8 3.5 3.5 3.4 Baltimore 3.5 3.4 1.9 3.1 2.7 3.5
Washington, D.C. 3.4 3.5 1.4 3.4 1.8 3.3 Regional trends also exist among the second set of actions respondents were asked about (Table 24). In general, respondents residing closest to the Bay participate in the highest number of water quality stewardship actions, with the Baltimore/Washington Metro and Delmarva residents participating in an average of 5.2 and 5.3 actions respectively and South-central Pennsylvania and Tidewater residents participating in an average of 5.1 actions each. However, the lowest level of stewardship activity in the entire watershed occurs among residents of Washington, D.C. and Baltimore (4.3 and 4.5 actions on average, respectively). This represents a significant drop-off in stewardship activity between the urban areas of Baltimore and Washington, D.C. and the immediately surrounding regions (Map 9). As with the demographic analysis above, this likely reflects the urban/suburban distinction. Residents of these urban centers most likely do not have the opportunity to participate in several of the options mentioned, such as planting a tree or altering fertilizer or pesticide usage. In such cases, it is important to identify and promote stewardship activities that these urban residents can participate in without incurring extensive travel costs. Following these regional trends, there is a close relationship between both population density (Figure 14) and % farmland (Figure 15) and the number of stewardship actions residents participate in. Residents of less populated areas and residents of more agricultural areas tend to participate in more stewardship activities.
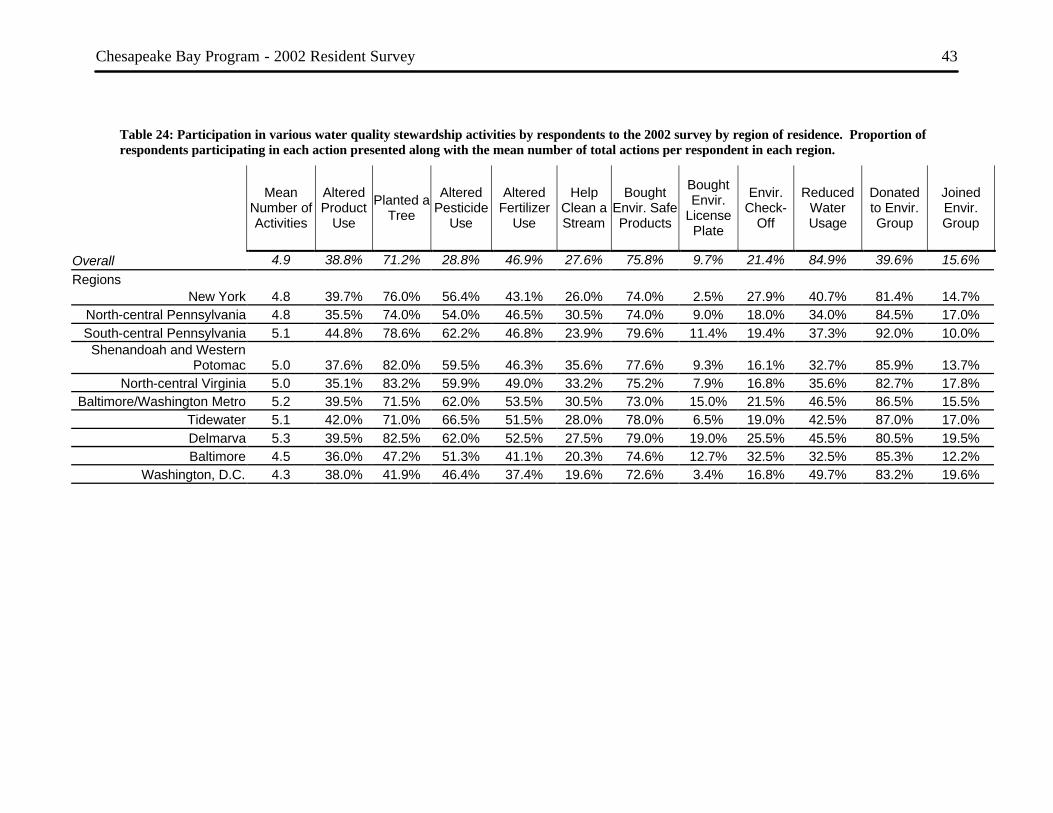
Chesapeake Bay Program - 2002 Resident Survey
43
Table 24: Participation in various water quality stewardship activities by respondents to the 2002 survey by region of residence. Proportion of respondents participating in each action presented along with the mean number of total actions per respondent in each region.
Mean Number of Activities
Altered Product
Use
Planted a Tree
Altered Pesticide
Use
Altered Fertilizer
Use
Help Clean a Stream
Bought Envir. Safe Products
Bought Envir.
License Plate
Envir. Check-
Off
Reduced Water Usage
Donated to Envir. Group
Joined Envir. Group
Overall 4.9 38.8% 71.2% 28.8% 46.9% 27.6% 75.8% 9.7% 21.4% 84.9% 39.6% 15.6% Regions
New York 4.8 39.7% 76.0% 56.4% 43.1% 26.0% 74.0% 2.5% 27.9% 40.7% 81.4% 14.7% North-central Pennsylvania 4.8 35.5% 74.0% 54.0% 46.5% 30.5% 74.0% 9.0% 18.0% 34.0% 84.5% 17.0% South-central Pennsylvania 5.1 44.8% 78.6% 62.2% 46.8% 23.9% 79.6% 11.4% 19.4% 37.3% 92.0% 10.0% Shenandoah and Western
Potomac 5.0 37.6% 82.0% 59.5% 46.3% 35.6% 77.6% 9.3% 16.1% 32.7% 85.9% 13.7% North-central Virginia 5.0 35.1% 83.2% 59.9% 49.0% 33.2% 75.2% 7.9% 16.8% 35.6% 82.7% 17.8%
Baltimore/Washington Metro 5.2 39.5% 71.5% 62.0% 53.5% 30.5% 73.0% 15.0% 21.5% 46.5% 86.5% 15.5% Tidewater 5.1 42.0% 71.0% 66.5% 51.5% 28.0% 78.0% 6.5% 19.0% 42.5% 87.0% 17.0% Delmarva 5.3 39.5% 82.5% 62.0% 52.5% 27.5% 79.0% 19.0% 25.5% 45.5% 80.5% 19.5% Baltimore 4.5 36.0% 47.2% 51.3% 41.1% 20.3% 74.6% 12.7% 32.5% 32.5% 85.3% 12.2%
Washington, D.C. 4.3 38.0% 41.9% 46.4% 37.4% 19.6% 72.6% 3.4% 16.8% 49.7% 83.2% 19.6%
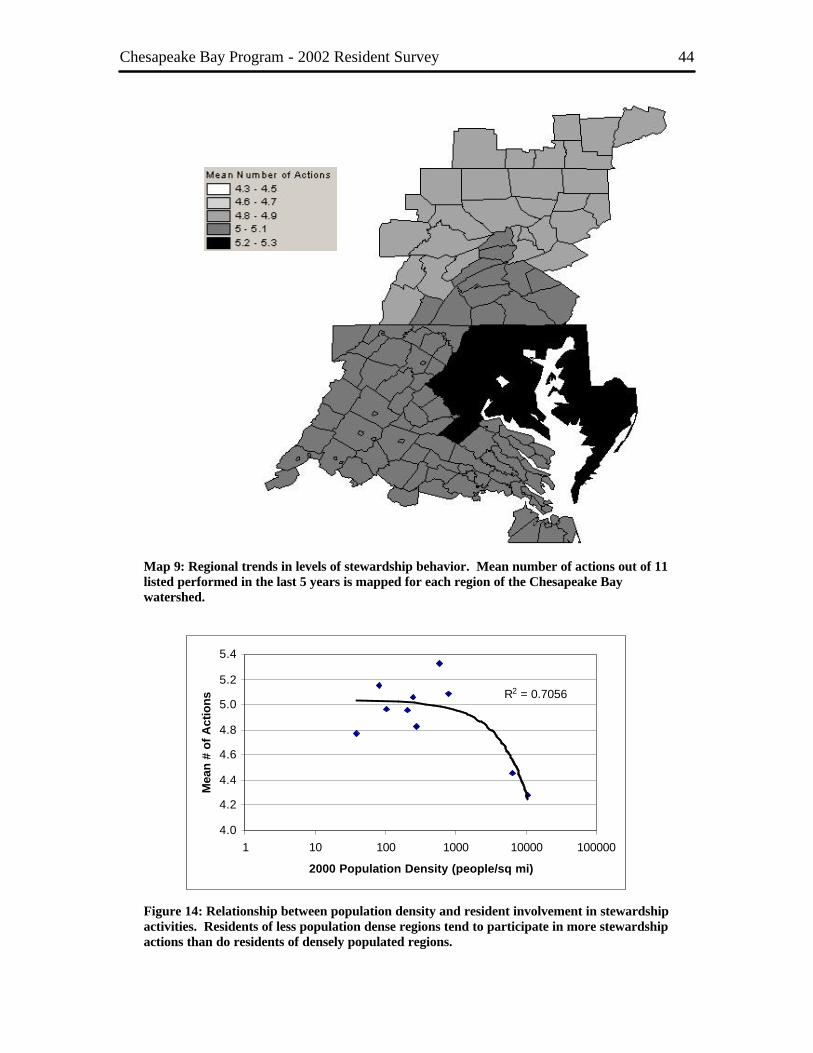
Chesapeake Bay Program - 2002 Resident Survey
44
Map 9: Regional trends in levels of stewardship behavior. Mean number of actions out of 11 listed performed in the last 5 years is mapped for each region of the Chesapeake Bay watershed.
R2 = 0.7056
4.0
4.2
4.4
4.6
4.8
5.0
5.2
5.4
1 10 100 1000 10000 100000
2000 Population Density (people/sq mi)
Mea
n #
of A
ctio
ns
Figure 14: Relationship between population density and resident involvement in stewardship activities. Residents of less population dense regions tend to participate in more stewardship actions than do residents of densely populated regions.

Chesapeake Bay Program - 2002 Resident Survey
45
y = 1.7137x + 4.4224R2 = 0.7794
4.0
4.2
4.4
4.6
4.8
5.0
5.2
5.4
0.0% 10.0% 20.0% 30.0% 40.0% 50.0%
% Farmland
Mea
n #
of A
ctio
ns
Figure 15: Relationship between percent of land area in farmland and resident involvement in stewardship activities. Residents of more agricultural areas tend to participate in more stewardship actions than do residents of less agricultural areas.
Catalysts for Action
Watershed-wide Analysis Respondents were presented with 8 scenarios and asked how likely it is that each one would influence them to become more involved with improving water quality (Table 25). Overall, the respondents indicated that the scenarios most likely to increase resident involvement were 1) if they knew they could save money in the long run (37% Very Likely, 43% Somewhat Likely), 2) if they saw they were being directly affected by pollution (57% Very Likely, 33% Somewhat Likely), 3) if they felt they could really make a difference (43% Very Likely, 43% Somewhat Likely), and 4) if they knew that time commitments would be minimal (37% Very Likely, 46% Somewhat Likely). As presented earlier, 94% of respondents are interested in helping to improve water quality. One must conclude then, that the catalysts to turn that interest into action are not fully developed. Compare the figures obtained here (86% of respondents are Very or Somewhat Likely to get more involved if they felt they could make a difference) with those presented earlier (88% of respondents indicated that one person’s actions can make a difference). In response to the 2001 NGS Survey, a lack of time was cited as the first or second most important reason for lack of involvement in stewardship activities by 53% of Americans. In addition, 35% stated that they were not more involved simply because they do not know how they can help, and 18% cited lack of awareness about the severity of the problem as the first or second most important reason for lack of involvement.
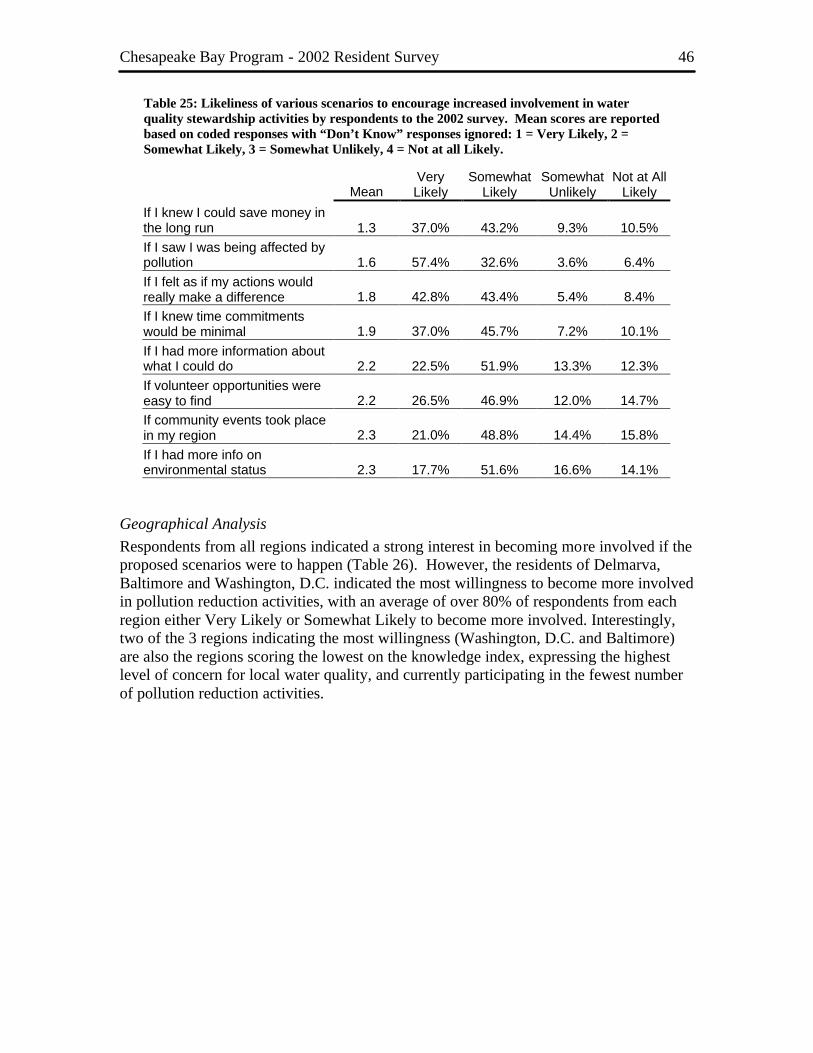
Chesapeake Bay Program - 2002 Resident Survey
46
Table 25: Likeliness of various scenarios to encourage increased involvement in water quality stewardship activities by respondents to the 2002 survey. Mean scores are reported based on coded responses with “Don’t Know” responses ignored: 1 = Very Likely, 2 = Somewhat Likely, 3 = Somewhat Unlikely, 4 = Not at all Likely.
Mean Very Likely
Somewhat Likely
Somewhat Unlikely
Not at All Likely
If I knew I could save money in the long run 1.3 37.0% 43.2% 9.3% 10.5% If I saw I was being affected by pollution 1.6 57.4% 32.6% 3.6% 6.4% If I felt as if my actions would really make a difference 1.8 42.8% 43.4% 5.4% 8.4% If I knew time commitments would be minimal 1.9 37.0% 45.7% 7.2% 10.1% If I had more information about what I could do 2.2 22.5% 51.9% 13.3% 12.3% If volunteer opportunities were easy to find 2.2 26.5% 46.9% 12.0% 14.7% If community events took place in my region 2.3 21.0% 48.8% 14.4% 15.8% If I had more info on environmental status 2.3 17.7% 51.6% 16.6% 14.1%
Geographical Analysis Respondents from all regions indicated a strong interest in becoming more involved if the proposed scenarios were to happen (Table 26). However, the residents of Delmarva, Baltimore and Washington, D.C. indicated the most willingness to become more involved in pollution reduction activities, with an average of over 80% of respondents from each region either Very Likely or Somewhat Likely to become more involved. Interestingly, two of the 3 regions indicating the most willingness (Washington, D.C. and Baltimore) are also the regions scoring the lowest on the knowledge index, expressing the highest level of concern for local water quality, and currently participating in the fewest number of pollution reduction activities.

Chesapeake Bay Program - 2002 Resident Survey
47
Table 26: Regional trends in respondent willingness to become more involved in water quality stewardship activities. Percentages represent the proportion of respondents in each region indicating that each scenario would be either Very Likely or Somewhat Likely to influence them to become more involved.
If I k
new
I co
uld
save
m
oney
in th
e lo
ng r
un
If I s
aw I
was
bei
ng a
ffect
ed
by p
ollu
tion
If I f
elt a
s if
my
actio
ns
wou
ld r
eally
mak
e a
diffe
renc
e
If I k
new
tim
e co
mm
itmen
ts
wou
ld b
e m
inim
al
If I h
ad m
ore
info
rmat
ion
abou
t wha
t I c
ould
do
If vo
lunt
eer
oppo
rtuni
ties
wer
e ea
sy to
find
If co
mm
unity
eve
nts
took
pl
ace
in m
y re
gion
If I h
ad m
ore
info
on
envi
ronm
enta
l sta
tus
Ave
rage
of a
ll
Overall 80.2% 90.0% 86.2% 82.7% 74.4% 73.4% 69.8% 69.3% 78.3% Regions
New York 75.0% 89.7% 78.4% 74.5% 67.6% 63.7% 67.6% 60.8% 72.2% North-central Pennsylvania 72.0% 88.0% 81.5% 79.0% 69.0% 69.5% 66.5% 69.0% 74.3%
South-central Pennsylvania 74.1% 84.5% 81.6% 77.6% 63.2% 67.7% 62.6% 60.7% 71.5% Shenandoah and Western
Potomac 76.7% 84.5% 85.8% 82.0% 75.1% 71.3% 69.3% 67.8% 76.6%
North-central Virginia 76.7% 89.3% 82.7% 82.7% 72.8% 68.4% 66.8% 67.8% 75.9% Baltimore/Washington
Metro 76.0% 87.1% 85.5% 78.0% 68.0% 66.5% 62.5% 65.0% 73.6%
Tidewater 78.5% 90.0% 86.0% 80.0% 73.5% 71.0% 66.0% 69.5% 76.8% Delmarva 80.0% 92.5% 88.5% 84.0% 79.5% 77.5% 73.0% 72.5% 80.9% Baltimore 85.2% 89.4% 86.8% 84.8% 79.2% 79.1% 73.6% 76.1% 81.8%
Washington, D.C. 82.1% 91.1% 88.8% 85.4% 78.2% 77.6% 73.7% 76.0% 81.6%
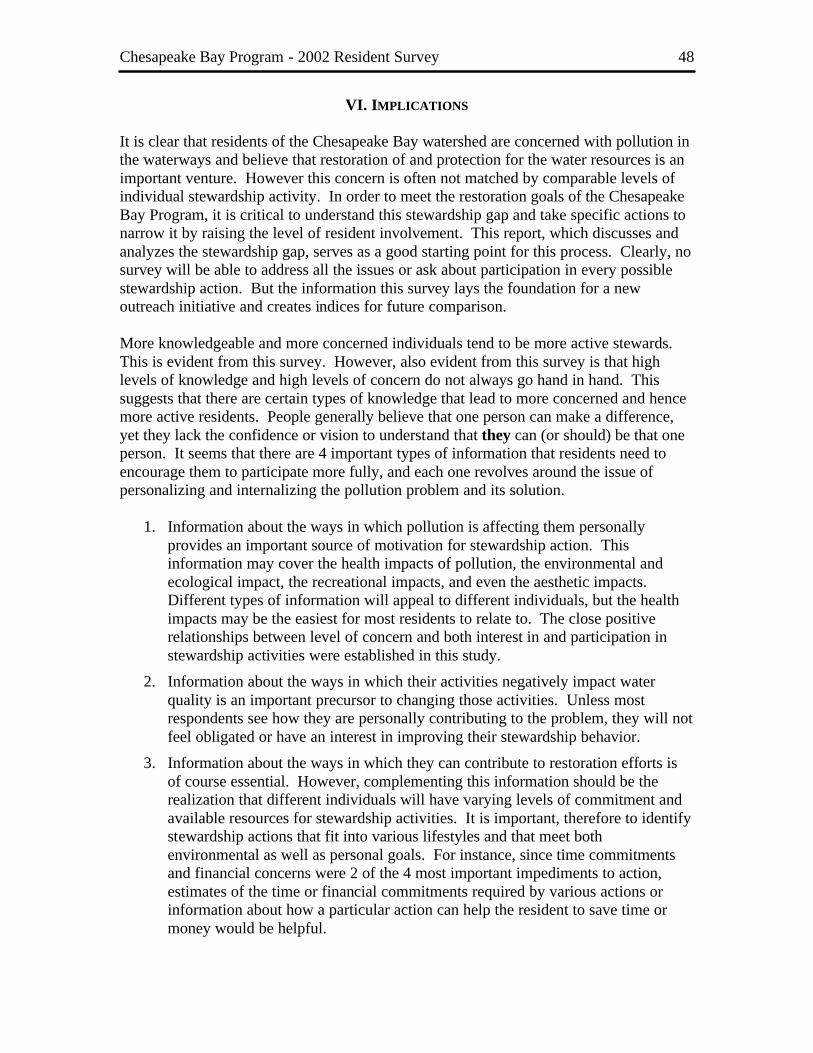
Chesapeake Bay Program - 2002 Resident Survey
48
VI. IMPLICATIONS It is clear that residents of the Chesapeake Bay watershed are concerned with pollution in the waterways and believe that restoration of and protection for the water resources is an important venture. However this concern is often not matched by comparable levels of individual stewardship activity. In order to meet the restoration goals of the Chesapeake Bay Program, it is critical to understand this stewardship gap and take specific actions to narrow it by raising the level of resident involvement. This report, which discusses and analyzes the stewardship gap, serves as a good starting point for this process. Clearly, no survey will be able to address all the issues or ask about participation in every possible stewardship action. But the information this survey lays the foundation for a new outreach initiative and creates indices for future comparison. More knowledgeable and more concerned individuals tend to be more active stewards. This is evident from this survey. However, also evident from this survey is that high levels of knowledge and high levels of concern do not always go hand in hand. This suggests that there are certain types of knowledge that lead to more concerned and hence more active residents. People generally believe that one person can make a difference, yet they lack the confidence or vision to understand that they can (or should) be that one person. It seems that there are 4 important types of information that residents need to encourage them to participate more fully, and each one revolves around the issue of personalizing and internalizing the pollution problem and its solution.
1. Information about the ways in which pollution is affecting them personally provides an important source of motivation for stewardship action. This information may cover the health impacts of pollution, the environmental and ecological impact, the recreational impacts, and even the aesthetic impacts. Different types of information will appeal to different individuals, but the health impacts may be the easiest for most residents to relate to. The close positive relationships between level of concern and both interest in and participation in stewardship activities were established in this study.
2. Information about the ways in which their activities negatively impact water quality is an important precursor to changing those activities. Unless most respondents see how they are personally contributing to the problem, they will not feel obligated or have an interest in improving their stewardship behavior.
3. Information about the ways in which they can contribute to restoration efforts is of course essential. However, complementing this information should be the realization that different individuals will have varying levels of commitment and available resources for stewardship activities. It is important, therefore to identify stewardship actions that fit into various lifestyles and that meet both environmental as well as personal goals. For instance, since time commitments and financial concerns were 2 of the 4 most important impediments to action, estimates of the time or financial commitments required by various actions or information about how a particular action can help the resident to save time or money would be helpful.
Chesapeake Bay Program - 2002 Resident Survey
49
4. Finally, specific information about how each action benefits the water resource is critical. Unless residents can visualize a positive effect on the resource as they perform an action, they are unlikely to continue participating. Establishing this personal sense of efficacy among residents as stewards of the resource will probably be the most difficult step to accomplish and maintain, but it is absolutely critical.
Other general types of information would also be useful to reinforce the stewardship ethic and maintain interest and concern levels among stewards. This information might target topics where incorrect perceptions are common (e.g., regarding the primary pollution sources) or focus on general knowledge and understanding of environmental principles (e.g., the definition and operation of a watershed, the types and sources of pollutants that are causing the most damage). Often these messages can be piggybacked onto the more directed messages described above. Most residents get their information from 3 sources: personal observation, media reports and governmental reports. Since personal observation was identified here as the most important source of information, it is important to provide the needed information in ways and in places where it is likely to coincide with personal experiences. Media reports are also important, and newspaper, radio and television reports should be an important part of an outreach campaign. Throughout the regions of the watershed, levels of concern remain high, as do the needs for information of the type described above. The potential for stewardship action in any given region clearly is considerably higher than currently realized. However, the interesting collection of characteristics held by the urban centers of the watershed (Washington, D.C. and Baltimore) deserves mentioning again. Residents of these two highly populated regions represent the least knowledgeable and least active in the watershed, but also are among the most concerned and most interested in becoming more involved. This creates an interesting juxtaposition, and highlights the conclusion that concern and knowledge do not always occur in tandem. More importantly, it also delineates a clear regional need for outreach programs and represents a critical, but largely untapped “reserve” of potential activists.

Chesapeake Bay Program - 2002 Resident Survey
APPENDIX A:
SURVEY INSTRUMENT

Chesapeake Bay Program - 2002 Resident Survey
APPENDIX B:
FREQUENCY DISTRIBUTIONS FOR ALL CLOSE-ENDED ITEMS, WATERSHED-WIDE

Chesapeake Bay Program - 2002 Resident Survey
APPENDIX C:
FREQUENCY DISTRIBUTIONS FOR ALL CLOSE-ENDED QUESTIONS, BY REGION

Chesapeake Bay Program - 2002 Resident Survey
APPENDIX D:
FREQUENCY DISTRIBUTIONS FOR ALL CLOSE-ENDED QUESTIONS, BY DISTANCE BAND

Chesapeake Bay Program - 2002 Resident Survey
APPENDIX E:
FREQUENCY DISTRIBUTIONS FOR ALL CLOSE-ENDED QUESTIONS, BY STATE