Embed Size (px)
Citation preview


A SUMMER PROJECT
ON
SUBMITTED BY:
MEGHA JAIN
PROJECT GUIDE:
Mr. HIREN RAO
SUBMITTED TO:
ARVIND LIMITED
CERTIFICATE
THE ARVIND LIMITED
Naroda Road, Ahmedabad-380 025 India.
Phone :( 079) 22203030
A MEMBER OF LALBHAI GROUP
TO WHOMSOEVER IT MAY CONCERN
This is to certify that MEGHA JAIN ,a student of K.S.
SCHOOL OF BUSINESS MANAGEMENT ,has successfully
completed her training at the Finance & Accounting Department
of THE ARVIND limited, under the guidance of MR.HIREN
RAO.
The project duration was from 10th
may to 10th
july, 2010.
We wish her all the best for future career pursuits.
THE ARVIND limited
Mr. Shobit Tyagi
Head – Corporate Human Resources

PREFACE
For a long time, there is a wind of recession blowing
all over the business world and wealth liberalization policy
in the Indian Economy. So, nowadays market is
becoming more and more competitive.Company demands
more and more professional and accomplished employees.
Students have to get practical training along with
the theoretical knowledge of the business condition. There
are many advantage of making these kinds of reports.
Reading gives only the theoretical knowledge but training
gives an apportunity to learn and apply the concepts in the
real corporate world.
It is true that technical studies can not be perfect
without practical training and perfection is basic necessity
of management student.

ACKNOWLEDGEMENT
Feelings of gratefulness to anyone‘s help directly arise from
bottom of the heart. The small but an important act can prove to be a
milestone in one‘s life. We have achieved an important milestone in our
life by the completion of this project.
The project is dedicated to all the people whom we met and took
guidance from.I take this opportunity to thank the individuals who made
this report a success.
First of all,I am very fortunate that I got training in ARVIND
limited.I sincerely thank MISS MILLI DAS (Head –HR Department).
It is through her continuous guidance and support that the project has
become reality.
I would like to thank Mr. HIREN RAO (Head –Finance
Department) our Project guide, not only for giving me the opportunity
to work on this project, but also for providing me with sound guidance
and the necessary facilities to carry out the project. He constantly insisted
and helped me in learning new things. He provided me a lot of learning
opportunities.
Sincere appreciation is extended to Mr.VINEET SHAH for his
immense help during the course of this work. I would like to thank Mr.
DHARMESH PANDYA, for enabling me to learn and work on SAP for
fixed assets module.
Iwould like to thank MS. INGITA JAIN,our Project faculty
guide, who continuously monitored my work and provided guidance as
and when I needed.
MEGHA JAIN
K.S.SCHOOL OF BUSINESS MANAGEMENT

.

No. Name of content Pg no 1. Introduction to textile industries 1
1.1 Evolution & evaluation of the textile industries 3 1.2 Indian textile Industries 4 1.3 Gujrat textile Industries 5 1.4 Textile Industries Key Facts 6 1.5 Major Players in the textile Ind. In India 7
2. Introduction to Arvind Mills Limited 9 2.1 Company Profile 10 2.2 Fabric Production 11 2.3 Organization Structure 12 2.4 Subsidiaries 13 2.5 Board Of Directors 14 2.6 Group Overview 15 2.7 Company’s Vision 16 2.8 Company’s Mission 17 2.9 Company’s Philosophy 18 2.10 Functioning of the Organization 19 2.11 Denim Manufacturing Process 21 2.12 Market Network of Arvind 24 2.13 Portfolio of Arvind limited 29 2.14 Milestone Achieved 30 2.15 Financial Scenario 32

2.16 Shareholding Pattern of Arvind Limited 33 3. Working Capital Management 36 3.1 Concept of Working Capital 37 3.2 Form of Working Capital 38 3.3 Sources of Working Capital 42 3.4 Objective of Working Capital 45 3.5 Determinates of Working Capital 46 3.6 Significance of adequate Working Capital 48 3.7 Effects of excessive Working Capital 49 3.8 Balance sheet of Arvind Limited 50 3.9 Profit & Loss Account of Arvind Limited 51 3.10 Working Capital on Arvind Limited 52 3.11 Operating and Cash Conversion Cycle 63 3.12 Period of Operating Cycle 69 3.13 Working Capital policy 70 3.14 S W O T Analysis 72 3.15 Future Requirements 73 3.16 Interpretation of Working Capital 74
4. Recommendations 76 5. Conclusion 77 6. Bibliography 78

INTRODUCTION
The Indian textile industry has a significant presence in
the economy as well as in the international textile economy. Its contribution to the
Indian economy is manifested in terms of its contribution to the industrial production,
employment generation and foreign exchange earnings. It contributes 20 % of
industrial production, 9 % of excise collections, 18 % of employment in the industrial
sector, nearly 20 % to the country‘s total export earning and 4 % to the GDP.
CONTRIBUTIONS OF TEXTILE INDUSTRY IN ECONOMY
In human history, past and present can never ignore the importance of textile in a
civilization decisively affecting its destinies, effectively changing its social scenario.
Segments in textile industry:
Readymade Garments- denims, made-ups, shirts, etc.
Cotton Textiles including Handlooms (Mill made / Power loom/ Handloom)
Man-made Textiles
Silk Textiles
Woolen Textiles
Handicrafts including Carpets
Series1, Industrial
Production, 20%, 28%
Series1, Excise Collections, 9%,
13%
Series1, Employment in the Industrial Sector, 18%,
25%
Series1, Country’s total Export Earning,
20%, 28%
Series1, GDP, 4%, 6%
Chart Title

Coir
Jute
Evolution of Textile Industry
The ‗RAG TRADE‘, as it is referred to in the UK and
Australia is the manufacture, trade and distribution of textiles.There were various
stages – from a historical perspective – where the textile industry evolved from being
a domestic small-scale industry, to the status of supremacy it currently holds.
The ‗cottage stage‘ was the first stage in its history where
textiles were produced on a domestic basis. During this period cloth was made from
materials including wool, flax and cotton. The material depended on the area where
the cloth was being produced, and the time they were being made.
In the later half of the medieval period in the northern parts of Europe, cotton came to
be regarded as an imported fiber. During the later phases of the 16th century cotton
was grown in the warmer climates of America and Asia.
A number of new innovations led to the industrialization of the
textile industry. In the initial phases, textile mills were located in and around the
rivers since they were powered by water wheels. After the steam engine was invented,
the dependence on the rivers ceased to a great extent. In the later phases of the 20th
century, shuttles that were used in the textile industry were developed and became
faster and thus more efficient.
Today, modern techniques, electronics and innovation have led
to a competitive, low-priced textile industry offering almost any type of cloth or
design a person could desire. With its low cost labor base, China has come to
dominate the global textile industry.
Indian Textile Industry
Until the economic liberalization of Indian economy, the India
Textile Industry was predominantly unorganized industry. The opening up of Indian
economy post 1990s led to a stupendous growth of this industry.
Textile industry in India is the second largest employment
generator after agriculture. It holds significant status in India as it provides one of the
most fundamental necessities of the people. Textile industry was one of the earliest
industries to come into existence in India and it accounts for more than 30% of the
total exports. In fact Indian textile industry is the second largest in the world, second
only to china.
Till the year 1985, development of textile sector in India took place
in terms of general policies. In 1985, for the first time the importance of textile sector
was recognized and a separate policy statement was announced with regard to
development of textile sector. In the year 2000, national textile policy was announced.
its main objective was: to provide cloth of acceptable quality at reasonable prices for
the vast majority of the population of the country, to increasingly contribute to the
provision of sustainable employment and the economic growth of the nation; and to
compete with confidence for an increasing share of the global market. The policy also
aimed at achieving the target of textile and apparel exports of us $ 50 billion by 2010
of which the share of garments will be us $ 25 billion.
TEXTILE INDUSTRY KEY FACTS
Indian Textile Industry is one of the largest and oldest industries in India.
Indian Textile Industry is highly fragmented industry; at the same time it is an
independent and self-reliant industry that has shown sustainable growth over
the years.
Indian Textile Industry is second largest industry in terms of providing vast
employment opportunities and employs around 35 million people in country
after agriculture sector...
The Indian Textile Industry plays vital role in economic development and
contributes 14% to industrial production in the country.
Textile Industry contributes around 4% of GDP, 9% of excise collections,
18% of employment in industrial sector, and has 16 % share in country‘s
export
Industry has direct and strong linkage with rural and agriculture sector,
therefore it is estimated that, one of every six households in country is directly
or indirectly dependent on this industry.
Industry contributes around 25% share in the world trade of cotton yarn.
India is evolved as a major contributor in world‘s cotton sector. Indian is the
world‘s third-largest producer of cotton and second-largest producer of cotton
yarns and textiles.
India is the largest exporter of yarn in the international market and has a share
of 25% in world cotton yarn export market.
India contributes for 12% of the world‘s production of textile fibers and yarn.
Indian textile industry is second largest after China, in terms of spindle age,
and has share of 23% of the world‘s spindle capacity.
India has around 6% of global rotor capacity.
The country has the highest loom capacity, including handlooms, and has
share of 61% in world loom age.
Including textiles and garments, 30% of India's export comes from this sector.
Indian Textile Industry is one of the largest industries that provide high
exports and foreign revenue.
Large and potential domestic & international market, large pool of skilled and
cheap labor, well-established industry, promising export potential etc. are few
strengths of Indian Textile Industry.
Highly Fragmented, High dependence on cotton sector, Lower productivity,
Unfavorable Labor Laws is few drawbacks of the industry from which it has
to overcome.
After the elimination of quota restrictions and implementation of National
Textile Policy 2000, it is estimated that the industry will grow with rapid rate
and help to strengthen the Indian economy
STRENGHTS OF TEXTILE INDUSTRY
India has rich resources of raw materials of textile industry. It is one of the
largest producers of cotton in the world and is also rich in resources of fibers
like polyester, silk, viscose etc.
India is rich in highly trained manpower. The country has a huge advantage
due to lower wage rates. Because of low labor rates the manufacturing cost in
textile automatically comes down to very reasonable rates.
India is highly competitive in spinning sector and has presence in almost all
processes of the value chain.

Indian garment industry is very diverse in size, manufacturing facility, type of
apparel produced, quantity and quality of output, cost, requirement for fabric
etc. It comprises suppliers of ready-made garments for both, domestic or
export markets.
WEAKNESS OF TEXTILE INDUSTRY
Indian textile industry is highly fragmented in industry structure, and is led by
small scale companies. The reservation of production for very small
companies that was imposed with the intention to help out small scale
companies across the country, led substantial fragmentation that distorted the
competitiveness of industry. Smaller companies do not have the fiscal
resources to enhance technology or invest in the high-end engineering of
processes. Hence they lose in productivity.
Indian labor laws are relatively unfavorable to the trades and there is an urgent
need for labor reforms in India.
India seriously lacks in trade pact memberships, which leads to restricted
access to the other major markets.
INDIAS MAJOR COMPETITIORS IN THE
WORLD
Gujarat Textile Industry
Gujarat is one the leading industrial states in India and textile
industry in India in particular had contributed in big way to the industrialization of the
state. In fact, development of the many industries like dyestuff, chemicals
Engineering/foundry and cotton farming is solely dependent on these sectors. The

state is well known for development of hybrid cotton, ginning, power looms,
composites mills, spinning units and independent processing houses.
In Gujarat, textile manufacturers use cotton based fabrics in
mill sector, major reason being the availability of the basic raw materials in the state,
i.e. cotton. Similarly many spinning units producing more conservative yarns were
established in the state. The state happened to be more conservative with cotton textile
products mainly in the organized sector, weaving and synthetic textile in decentralized
sector. Surat art silk manufacturers are only exception. Similarly, independent
processing units process synthetic blended and cotton fabrics. Clusters of processing
units are located in Surat, Ahmedabad and Jetpur, though these production units have
good capacity of processing wide range of fabric.
Ready-made Garment manufacturing and hosiery knitwear
unit also exists in SSI categories. In early 1990‘s Gujarat saw dramatic change in its
textile industry scenario where quite a few textile mills started manufacturing Denim.
The Arvind mills, Ashima Textiles, Soma Textiles, Modern Denim, and Arvee denim
started manufacturing denim. So many mills at a time fetched a new name for
Ahmedabad ―Denim city of India‖ whereas city of Surat became ―Silk city of India‖.
MAJOR PLAYERS IN THE TEXTILE INDUSTRY IN INDIA
Arvind limited.
Arvind Mills is one of the major and fully vertically integrated composite
mills players in India. It has large production in denim, shirting and knitted
garments. It is now adding value by manufacturing denim apparel. Its sales are
around US$ 300 million.
Raymond‟s
Raymond‘s has the large, diversified integrated business model, which is
spread across the value chain from yarn to retail. It is specialized in
Diversified woolen textiles. It already supplies to some US retailers.

Reliance Textiles:
Reliance Textiles is one of the major Textile Company that is in business of
fully integrated manmade fiber. It has capacity of more than 6 million tones
per year. It has joint venture partners like, DuPont, Stone & Webster, Since
(Italy) etc.
Vardhaman Spinning vardhman deals in spinning, weaving and processing
segment of the industry. It is planning to double its fabric processing capacity
to 50 million meters. It is an approved supplier to global retailers like Gap,
Target and Tommy Hilfiger. Its sales are little over US$ 120 millions
Welspun India (Manufactures terry towels)
Century Textiles (Composite mill, cotton & Man-made)
Morarjee Mills (Fully integrated Composite Mill)
Indo Rama (Cotton and Man-made)
GTN Textiles (Cotton Yarn and Knit Fabrics)
Ginni Filamentslimited. (Yarn and Fabric)
LNJ Bhilwara Group (Diversified and vertically integrated denim producer
with spinning and weaving capacity)
Mafatlal Textiles (Fully integrated Composite Mill)
Modern Group (Diversified, producer of denim, syntax and thread)
Ashima Syntax (Man-made Fiber)
KG Denim (Fabrics)
Sanghi Polyesterslimited. (Manmade Fiber)
Nova Petrochemicals (Man-made Fiber)
S. Kumar Synfabslimited. (Home furnishing and Suit Fabrics)
Bombay Dyeinglimited. (Composite and fully integrated)
Rajasthan Petro synthetics (Diversified)
BSLlimited. (Textiles)
Garware Polyester (Diversified)
Banswara Syntex (Composite)
National Rayon Corp. (Man-made fiber)
GSL Indialimited. (Threads)
Indian Rayon (Man-Made Fiber)

Alok Textiles (Cotton and Man-made Fiber Textiles)
Sharda Textile Mills (Man-made Fiber)
Birla Group Dormeuil Birla VXLlimited. (Fully integrated woolen textiles)
Gokuldas Images (Diversified)
Hanil Era Textiles (Yarn, Cotton & Man-made Fiber)
Oswal Knit India (Woolen Wear)
Niryat Sam Apparels (Apparel)
MAP SHOWING LOCATION OF TEXTILES CENTRES
IN INDIA

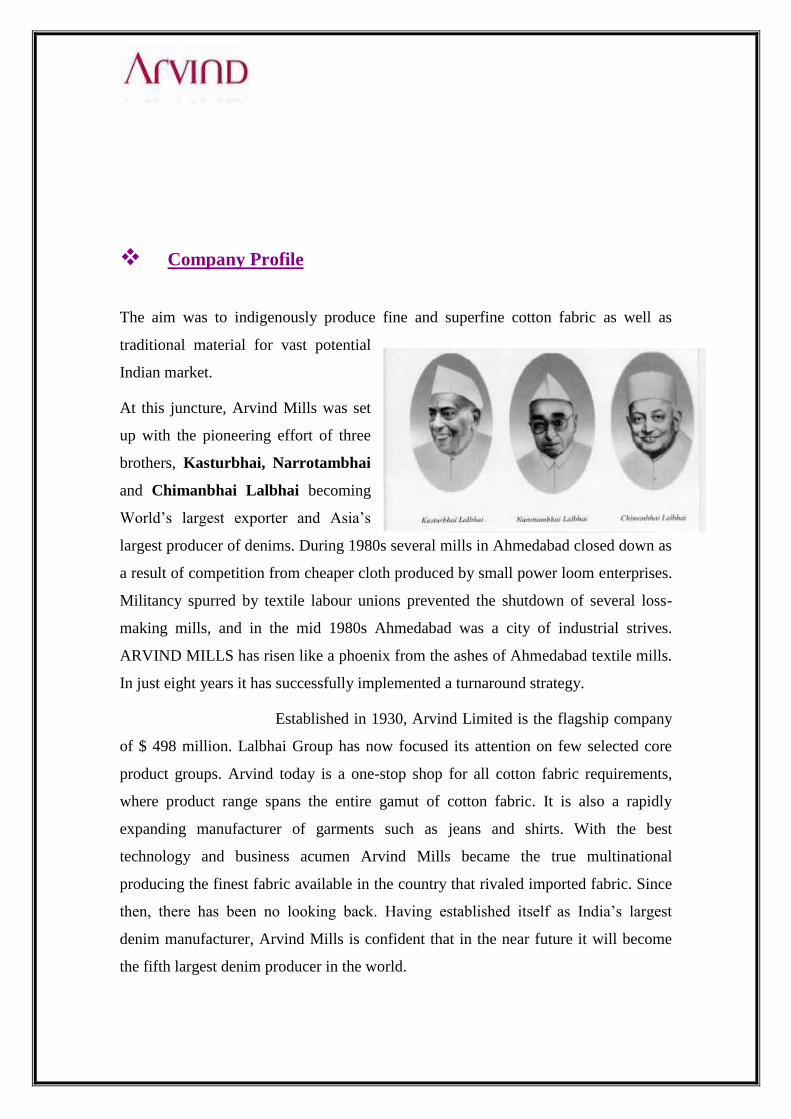
Company Profile
The aim was to indigenously produce fine and superfine cotton fabric as well as
traditional material for vast potential
Indian market.
At this juncture, Arvind Mills was set
up with the pioneering effort of three
brothers, Kasturbhai, Narrotambhai
and Chimanbhai Lalbhai becoming
World‘s largest exporter and Asia‘s
largest producer of denims. During 1980s several mills in Ahmedabad closed down as
a result of competition from cheaper cloth produced by small power loom enterprises.
Militancy spurred by textile labour unions prevented the shutdown of several loss-
making mills, and in the mid 1980s Ahmedabad was a city of industrial strives.
ARVIND MILLS has risen like a phoenix from the ashes of Ahmedabad textile mills.
In just eight years it has successfully implemented a turnaround strategy.
Established in 1930, Arvind Limited is the flagship company
of $ 498 million. Lalbhai Group has now focused its attention on few selected core
product groups. Arvind today is a one-stop shop for all cotton fabric requirements,
where product range spans the entire gamut of cotton fabric. It is also a rapidly
expanding manufacturer of garments such as jeans and shirts. With the best
technology and business acumen Arvind Mills became the true multinational
producing the finest fabric available in the country that rivaled imported fabric. Since
then, there has been no looking back. Having established itself as India‘s largest
denim manufacturer, Arvind Mills is confident that in the near future it will become
the fifth largest denim producer in the world.

FABRIC PRODUCTION
In the 1980s the growing threat from small
power loom operators forced Ahmedabad‘s
composite mills to shift their focus to product
areas in which they could compete. In order to
better address newer and wider business
opportunities, the company shifted perspective
from domestic to international markets. At a
time when the local textile industry was
declining, Arvind‘s management devised a
turnaround strategy called ―Reno vision‖. It
represented an open-minded approach that
would seek out new opportunities.
In 1987 Arvind Mills made a conscious strategic
decision to change its production emphasis from
a portfolio of traditional domestic textiles to
high quality cotton fabrics. This required a level
of technological expertise, which small power
loom operators could not compete with. Arvind
identified denim as a key fabric. International
consultants McKinsey & Co. helped to frame company‘s business strategy, formulate
its organizational restructuring and establishing international alliances.
Today the company is engaged primarily in the manufacturing of indigo-dyed denim
fabrics, fine and superfine cotton shirting and bottom weights, and conventional

domestic fabrics such as sarees and voiles. In 1995 Arvind Mills held an 80% share of
India's domestic market for denim.
Organizational structure
Arvind defines its operations in terms of Strategic Business Units
(SBUs). Each product line – such as denim, shirting, knits, voiles, etc – is designated
as an SBU. Each unit is headed by a president who is able to make independent
decisions on finance and marketing. The president is assisted by vice-presidents who
look after functional divisions.
SUBSIDIARIES
Arvind Mills has 11 subsidiaries, of
which seven are in textile and related
businesses. They are:
Arvind Clothinglimited.

Arvind Fashionlimited.
Arvind Worldwide Inc, USA
Arvind Clothinglimited (ACL), situated in Bangalore, began commercial
production in April 1994. ACL is the exclusive licensee in India of CluettPeabody &
Co of the USA, which owns the Arrow brand name. It has the capacity for making 1
million shirts per annum, and has received ISO 9002 certification.
Arvind Fashionlimited (AFL) is a licensed user of the brand names belonging
to the US Company VF Corporation, which owns the well-known international trade
mark ―Lee‖. The company has a letter of intent from the Indian government (pending
the issue of a license) permitting it to manufacture up to 960,000 garments per annum,
provided it exports 50% of the garments produced.
AFL has invested Rs.160 million in establishing a jeans manufacturing unit at
Bangalore. The state-of-the-art factory, which has a production capacity, of 500,000
pairs of jeans per annum, is equipped with machines made in the USA, Japan and
Europe.
Spring 1995 saw a launch of a wide range of products-including jeans, jackets, denim
shirts, twill shirts, T-shirts and accessories such as belts and bags –under the ―Lee‖
trade mark. These are sold through exclusive showrooms located in major cities
throughout India.
Although its current turnover is small, AFL is in good position to capture a significant
share of the growing domestic market.
Board of Directors
The top management of the company consists of following members:

Company‟s Vision
Name Designation
Mr. Sanjay S. Lalbhai
S/O Mr. Shrenikbhai Lalbhai
Executive Chairman & Managing Director (Promoter)
Mr. Jayesh k. Shah
S/O Mr. Kantilal Shah
Executive Director & Chief Financial Officer
Mr. G.M. Yadwadkar
S/O Mr. M.A Yadwadkar
Non-Executive, Independent – Nominee Director IDBI
Banklimited.
Mr. S.R. Rao
S/O Raghunatha Rao
Non-Executive, Independent – Nominee Director
EXIM Bank of India
Mr. K.M. Jayarao Non-Executive, Independent – Nominee Director
ICICI Banklimited.
Mr. Sudhir Mehta
S/O Uttamlal Nathalal Mehta
Non-Executive, Independent – Director
Mr. Tarun Sheth
S/O Natwarlal Gordhandas Sheth
Non-Executive, Independent – Director
Mr. Munesh Khanna
S/O Narindra Khanna
Non-Executive, Independent – Director
"To achieve global dominance over various businesses built around our core
competencies, through continuous product and technical innovation, customer
orientation and a focus on cost effectiveness".
All along Lalbhai Group has maintained a responsive yet levelheaded attitude towards
the society and its training individuals to create a corporate culture that fosters
excellence. Working in this direction the company has created a learning environment
that nurtures individual talent and intellect. It provides a platform that challenges the
individual capabilities urging them to constantly strive forward towards greater
heights using development as the fundamental tool.
It infuses in individuals a spirit of entrepreneurship which gives courage and
conviction to pursue set goals towards logical achievement and a global mindset that
transcends geographical and cultural boundaries evolving as a world leader. All this is
manifest in an environment fostering innovation and leadership.
Drawing from the Team based structure to encourage individuals to mesh up into
cross-cultural teams in all operational processes. This process provides opportunities
for individuals to match their capabilities with organizational expectations creating a
mechanism for updating the system. A strong sense of ownership and commitment
towards the organization and the business as a whole is the basic premise of all the
company actions.
Company‟s Mission

Arvindlimited. has laid down certain aims and objectives to be achieved while
pursuing its corporate activities. These are:
To provide a favorable work environment to the employees to direct their working
towards achievement of corporate goals.
To provide opportunities creating a mechanism for updating the system
To manage the institution as a trust, as empowered leaders and do all that needs to
be done ethically for the purpose of the institution.
To create a vibrant institution for the future of this nation and the world at large
To be a world leader in an environment fostering innovation and leadership.
To reinforce connections, and catalyze the chemistry that allows connections to be
translated into action which is beneficial for both the organization and the
individual.
Company‟s Philosophy

"It is my responsibility as a leader to create an environment where excellent
people would like to come and give their best, to create a vision, to give freedom
for excellence."
- Sanjay Lalbhai (Managing Dir.)
―We believe in potential of every human being. Our Human Resource Development
policy reflects this belief.
We recruit the best talent wherever we do business, offer competitive compensation,
provide a dynamic work environment, make people accountable for results, and chart
their growth through systematic career planning. Our structures are well defined
which allows us to be more flexible and respond to the customers promptly.
We encourage innovation and entrepreneurship and motivate our people to take on
leadership roles through job re-assignments. This helps us create a learning
organization with a workforce that has multi-dimensional experiences and skills.
Our campus recruitment program and on-going involvement with educational
institution ensures access to highly trained managers, engineers and workers to
support our aggressive global plans. And our training centers – FOUNTAINHEAD
(the hub of all training activities at Arvind), INDRADHANUSH (for operatives),
ORCHID (for behavioral training), and CALCULUS (for computer training) –
ensures they continue to learn and grow.
Functioning of the Organization

Each ‗Strategic Business Unit‘ is headed by a Business Head. There are also small
garment units at Asoka and Retail outlets at Naroda. The organization has adopted a
Hybrid Structure to be more responsive to the changing markets in which the
Functional and the Divisional structures are combined together. As the organization
grew larger with several products and markets, it typically organized into self-
contained divisions. Functions like marketing, which is important to each product or
market are decentralized to the self-contained units. However, some functions like
Finance, MIS, Legal and Secretarial, Taxation and Services that are stable and require
economies of scale and in-depth specialization are centralized at Naroda Corporate
headquarters. Each of these departments provides services for the entire
organization.
The main product divisions are Denim, Shirting, Knits and Central Utility that are
created to serve a different market. Individually, they all require a different strategy
and management style. Each product Line Head is in charge of all functions of that
product such as marketing, planning, supply and distribution, and manufacturing.
There is no Matrix reporting, which means that they follow one-to-one reporting. The
Supervisors will report to the Functional Heads or Managers and the managers in turn
will report to the Managing Director who is the apex of the organization.
EMPLOYEES

The company in all is operating on strength of nearly 3000 managerial cadder
employees and approximately 15000 first line managers. Employees are all qualified
and technically efficient to serve its clients. Employees are given training of all the
products and services so that they can serve its clients better. Company has a healthy
incentive structure for its employees.
TURNOVER
The approximate turnover of the company was Rs. 2344.99 crores (as per current
financial year 2008-2009).
GEOGRAPHICAL SPREAD
Arvind‘s worldwide network facilitates Global account management for the leading
brands and local customers. With offices in New York, London, Bangladesh, Delhi,
Ahmedabad, Mumbai, and Bangalore, Arvind has made itself ready to attend to its
customers anywhere on the Globe. Besides their global offices, they have independent
and devoted sales force for all locations and dedicated resources for key accounts.

Denim Manufacturing Process
The term "Denim" has originated from the city of Nimes in France where "serge de
Nimes" was manufactured. Denim is made from a vat dye, the Indigo dye, which is
applied to cotton fabric in loosely held form in layers. As far as manufacturing
process of denim is concerned, it is similar to that of Grey fabric up to the process of
weaving with the only difference that in case of Denim Fabric, it is dyed at the stage
of sizing where as in case of Grey Fabric, the decision regarding dyeing stage depends
upon the finished product.
SPINNING
The initial processes of denim manufacturing consist of the regular activities of
opening and blending of cotton fibers. Carding is done to
remove any foreign matter and the short fibers so that cotton
takes the form of a web which is then converted into a rope-
like form, the sliver. Then drawing process produces a
single, uniform sliver from a number of carded slivers. Yarn
is then spun through Open-End Spinning or Ring Spinning.
Roving is also carried on, if the spinning has to be done through Ring Spinning.
Generally, denim fabric are 3/1 warp-faced twill fabric made from a yarn dyed warp
and an un-dyed weft yarn. Normally dyed and Grey ring or open- end yarns are used
in warp and weft respectively. The warp yarn is indigo dyed.
WARP preparation – Dyeing and Sizing process
Warp yarns are indigo dyed and sized with the help of two
methods:
(i) Threads from several back beams are combined to form a
warp sheet and dyed and sized on the same machine.
(ii) Threads, about 350-400 in number are formed into ropes.
12-14 ropes run adjacent to each other through the continuous
dyeing unit. After dyeing, the ropes are dried on drying cylinders and then collected in
a can.
After that, a worker's beam is prepared. Sizing is then done in the conventional
manner.
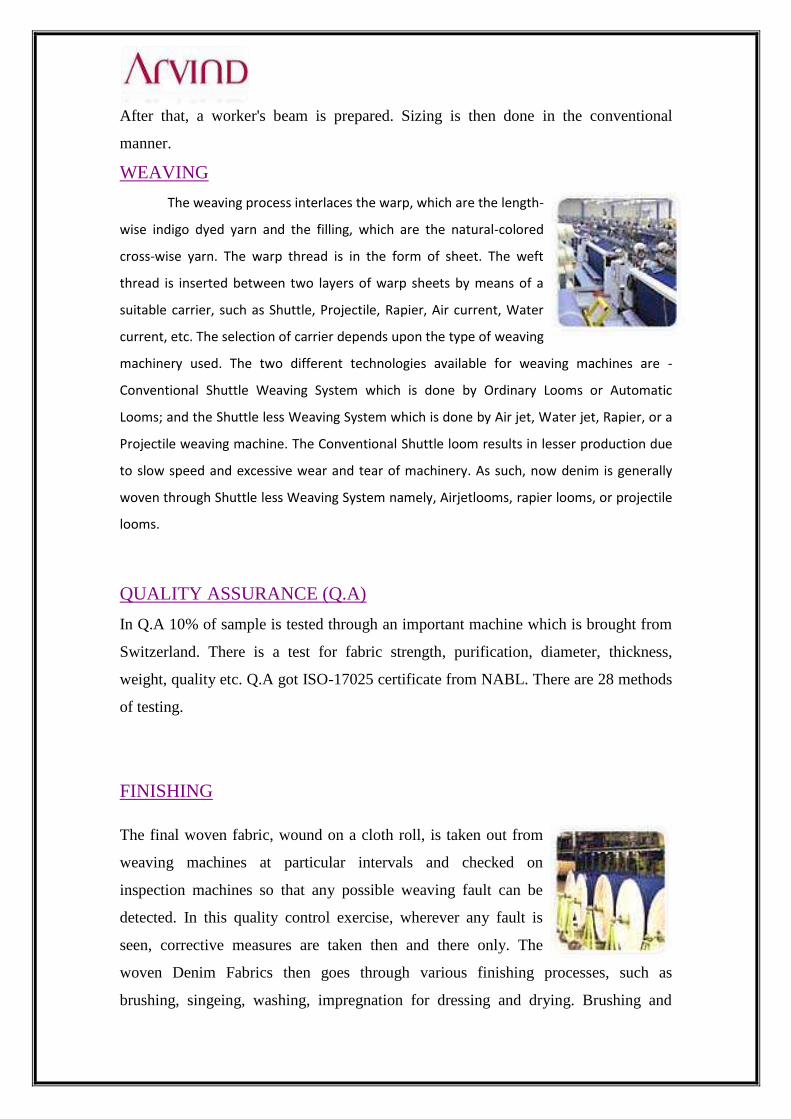
WEAVING
The weaving process interlaces the warp, which are the length-
wise indigo dyed yarn and the filling, which are the natural-colored
cross-wise yarn. The warp thread is in the form of sheet. The weft
thread is inserted between two layers of warp sheets by means of a
suitable carrier, such as Shuttle, Projectile, Rapier, Air current, Water
current, etc. The selection of carrier depends upon the type of weaving
machinery used. The two different technologies available for weaving machines are -
Conventional Shuttle Weaving System which is done by Ordinary Looms or Automatic
Looms; and the Shuttle less Weaving System which is done by Air jet, Water jet, Rapier, or a
Projectile weaving machine. The Conventional Shuttle loom results in lesser production due
to slow speed and excessive wear and tear of machinery. As such, now denim is generally
woven through Shuttle less Weaving System namely, Airjetlooms, rapier looms, or projectile
looms.
QUALITY ASSURANCE (Q.A)
In Q.A 10% of sample is tested through an important machine which is brought from
Switzerland. There is a test for fabric strength, purification, diameter, thickness,
weight, quality etc. Q.A got ISO-17025 certificate from NABL. There are 28 methods
of testing.
FINISHING
The final woven fabric, wound on a cloth roll, is taken out from
weaving machines at particular intervals and checked on
inspection machines so that any possible weaving fault can be
detected. In this quality control exercise, wherever any fault is
seen, corrective measures are taken then and there only. The
woven Denim Fabrics then goes through various finishing processes, such as
brushing, singeing, washing, impregnation for dressing and drying. Brushing and

singeing eliminate impurities and help to even the surface of denim fabric. Dressing
regulates the hand and rigidity of the fabric while compressive shrinking manages
its dimensional stability. The standard width denim fabrics are then sent for making
up. In this process, the fabric is cut into the desired width according to the size
required. The made- up denim fabric is then thoroughly checked for defects such as
weaving defects, uneven dyeing, bleaching and dyeing defects, oil stains, or patches.
After inspection, the final product is categorized quality-wise. The faultless fabrics
are sent to the packaging department while the defective ones are sent for further
correction.
INSPECTION
There are four rating system. It inspects physical parameter like width, square & linkej.
Complete material inspection is done as per the quality requirement of the customer & from
their product is delivered in the market. There are 13 inspection machines and each machine
has two operators.

Market Network of Arvind
Only two ingredients go into the making of Arvind denim – world-class quality and
complete customer orientation. A strong team of industry‘s best-qualified talents
forms the founding dimensions.
Arvind Limited today is reinforcing its marketing efforts by focusing on brand
development. They expect to strengthen its existing relationship with global brands
such as Marks & Spencer, V.F. Corporation, Calvin Klein, GAP, Benetton, Polo,
Espirit, Tommy Hilfiger, Hugo Boss and Liz Clairborne to list a few by developing
value added products and providing superior level of service. The complexity has
enhanced Arvind's product range and made it more responsive to the changing
requirements of some of the leading garment brands.
Arvind has single handily developed a multi-billion denim market in India. The
BRANDS fostered by Arvind include:
Lee & Arrow for the super premium segment
Flying Machine & Excalibur for the premium segment
Newport for the economy and
Innovative „Ruf & Tuf‟ for the mass market

The company has recently made a foray into children segment by introducing Lee
Youth, Ruggers Kids & Newport Kids. Similarly in tie-up with Cluett Peabody, USA,
to manufacture and market their world famous Arrow shirts, it launched what is
today‘s India‘s most inspirational brand of dress shirts.
In a world without boundaries, Arvind FABRICS are equally universal in their appeal.
Arvind aims to enrich lifestyles globally, inspiring diverse customers with the beauty
of their fabric.
Arvind was already making shirting for the Indian market. In 1990,
it decided to focus on high value shirting, so as to expand their
markets beyond India's borders. As a part of their commitment to
being a value-adding partner to each of the customers, Arvind
Shirting‘s have invested US $ 100 million in Santej. This plant has an annual capacity
of 34 million meters of 100% cotton woven. Arvind's philosophy in manufacturing is
'Excellence in Quality and Flexibility in Production'. In the entire process of
operations, eco-friendliness is critically monitored and ensured. The plant is also
configured to handle small order sizes as well as very long order lengths with
consistent quality.
Arvind has recently set up a dedicated bottom weights plant as part
of Arvind Polycot Limited. This new addition to the Arvind Textile
Complex brings the total investment in the complex up to Rs.12000
million. The plant is an integrated facility that sources yarn from
Arvind at Ahmedabad. It has both weaving and processing infrastructure, captive
power supply, steam generation and a wastewater treatment plant. The latter makes it
a zero discharge complex i.e. one that recycles all its wastewater.

In 1986, we looked for textiles that had global demand, high
margins, and high entry level barriers (either of technology,
expertise or set-up costs), and very importantly, low "fashion
volatility". We wanted to focus on fabric that would never go out of
style. Our analysis of potential products threw up denim as the answer. With a
production capacity of 120 million meter per annum, Arvind is currently India‘s
largest and world‘s third largest denim manufacturer.
It sells under the brand names ―ARVIND DENIM‖ and ―BIG MILL DENIM‖ (in
Europe). In India Arvind commands a market share of approximately 64% which is
five times that of the next largest player. Our denim is used to make India‘s leading
jeans brands – Flying Machine, Killer, Levi‘s, Numero Uno, Pepe, Texas jeans, UFO
and Wrangler. All the leading local denim manufacturers use ―Made from original
Arvind denim‖ as an indicator of high quality and consistency.
Arvind also exports denim to over sixty-six countries worldwide. Denim exports
constitute of approximately 50% of the turnover.
Today Arvind is making yet another foray in the manufacture of the
finest quality Cotton Knits in the world. This new venture features a
technical collaboration with Alamac Knits Inc, USA to manufacture
high value and high-fashion knits. With an investment of US $50
million, the plant will produce fabric in both tubular and open widths. The product
range aims to offer widest choice in both tubular and open widths in single (Jersey,
Pique, Textures, Pointless, Fleece, French Terry, Jacquards in solids, feeds and
automatics) and double (Interlocks, Needle-outs, ottomans, Pointless, Textures,
Reversible, jacquards, Ribs in solids, feeds and automatics, Collars: Plains and
Jacquards) knits. It will manufacture a knits range from casuals to formal, active wear
to sleepwear, for diverse use in men's, women's and children's clothing. Arvind‘s large
color and fabric library, stocking samples and a well equipped fabric resource centre
facilitates customers to access fabric that will enhance their lifestyles.
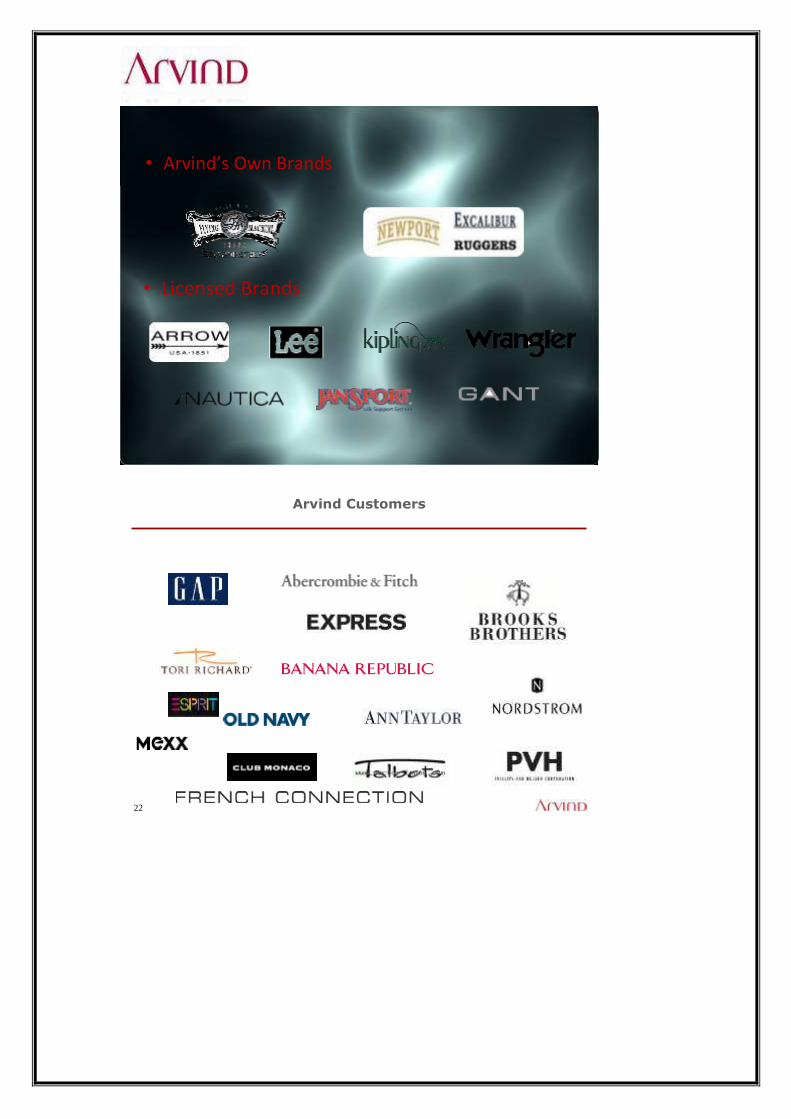
• Arvind’s Own Brands
• Licensed Brands
22
Arvind Customers


Portfolio of Arvindlimited.
Portfolio Percentage%
Denim 26%
Shirting 11%
Garment 16%
Brand/Retail 21%
Others 26%
Percentage% Denim
26% 26%
Percentage% Shirting
11% 11%
Percentage% Garment
16% 16%
Percentage% Brand/Retail
21% 21%
Percentage% Others
26% 26%
Arvind Portfolio

Milestones Achieved
1931
Arvind Limited was set up by Lalbhai Brothers in the “Manchester of East”.
1934
With sales reaching Rs. 45.76 lakhs and a profit of almost Rs. 3 lakhs, Arvind
establishes itself amongst the foremost textile units in the country.
1985
First Meter of Denim churned out.
1986
An uninterrupted record of not missing out on paying dividend to its
shareholders.
An established leader in fine & superfine cotton fabrics for Indian market.
Renovation: First company to bring globally accepted fabrics Denim, yarn dyed
shirting fabrics & wrinkle free gabardines to India.
1987
The largest zero discharge green effluent treatment plant in India.
Commitment to greener world.
First company to bring International shirt brand ―Arrow‖ to India
First company to start dedicated ―retail‖ outlets for Arrow brand
Awarded various awards for Highest exports and ISO.
1989
Largest denim & shirting in South Asia.
3rd Largest denim capacity in the world.
1990
Introduction of Premium Shirting‘s Division.
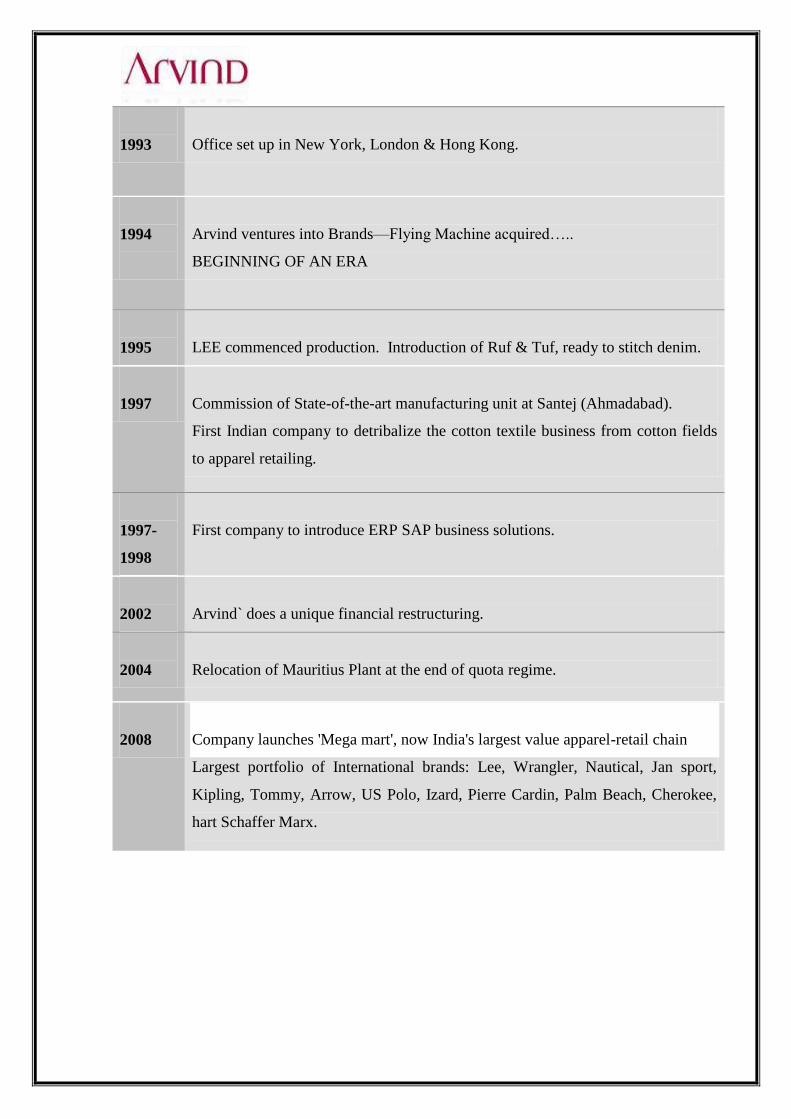
1993
Office set up in New York, London & Hong Kong.
1994
Arvind ventures into Brands—Flying Machine acquired…..
BEGINNING OF AN ERA
1995
LEE commenced production. Introduction of Ruf & Tuf, ready to stitch denim.
1997
Commission of State-of-the-art manufacturing unit at Santej (Ahmadabad).
First Indian company to detribalize the cotton textile business from cotton fields
to apparel retailing.
1997-
1998
First company to introduce ERP SAP business solutions.
2002
Arvind` does a unique financial restructuring.
2004
Relocation of Mauritius Plant at the end of quota regime.
2008
Company launches 'Mega mart', now India's largest value apparel-retail chain
Largest portfolio of International brands: Lee, Wrangler, Nautical, Jan sport,
Kipling, Tommy, Arrow, US Polo, Izard, Pierre Cardin, Palm Beach, Cherokee,
hart Schaffer Marx.

Financial Scenario
Arvindlimited is acclaimed in the Indian corporate field for its financial skills. Being
the phase of rapid growth or downturn the company has demonstrated swift, sharp and
robust financial acumen to navigate the company through different phases of
economic cycles. Arvind Mills was the first Textile Company from India to issue
GDRS in the year 1992-93. Highly complex financial restructuring exercise involving
more than 80 domestic and international tenders, who the company implemented
following the major downturn in the business cycle during year 2000-2002, is
considered to be the benchmark for the Indian corporate. Arvindlimited has been
making judicious choice of fund leasing avenues in the domestic as well as
international markets so as to utilis very efficient capital structure, which is in the tune
with operating risks and enhances the shareholder‘s value.
The company has laid down the risk management policy to manage the financial risks
emerging out of currency and interest rate. It runs an active treasury desk so as to
make use of modern hedging tools available to manage financial risks.
Arvind Mills was the first Textile Company in India to implement ERP, SAP as back
as in the year 1997-98. The company follows best accounting practices to prepare its
financial statements as envisaged in the Indian and international accounting standards.

SHAREHODING PATTERN OF ARVINDlimited.
Particulars NO.OF SHARES % OF TOTAL
Promoters 76908767 35.24%
Institution 42340700 19.40%
General public 98980382 45.36%
Grand total 218229849 100%
Graph

From old to New
Arvindlimited is the flagship company of the Lalbhai Group and one of India‘s largest
integrated textile manufacturers and branded apparel retailers. The re-branding
exercise comes in the wake of Arvindlimited transforming itself from a pure fabric
company to a diversified business group focusing on branded apparel and retail.
Initially, when the company was set up as Arvind Millslimited, it was simply about
fabric. But gradually, it has spread its tentacles into retail and branded apparel, which
today contributes the maximum to the company‘s growth. Seven years ago, with
everything else constant, the logo was changed. In all, since Arvind Mills was set up
in 1931, this is the first extensive re-branding exercise it has taken up.
Sharp, but well rounded, the forms of the logotype
represent an organization that is integrated and works
across the value chain from stylish fabrics to iconic brands.
With an element of classicism, the logo symbolizes an
organization that has a rich heritage, while remaining
contemporary through changing times. The burgundy red
denotes maturity, its rich tones carrying a sense of depth
and more than a hint of passion.
No particular font has been used for the logo – it is hand drawn and, therefore, an
exclusively crafted logo.
Highlighting the significance of the change in identity, Sanjay Lalbhai, chairman and
managing director, Arvindlimited, says, ―Over eight decades, we have changed the
face of fashion by evolving constantly. As we get ready to address wider opportunities
to create wealth for our stakeholders, we have evolved new ways of thinking and a
new direction. The new identity reflects the shift in the corporate identity from a large
integrated textile player to a lifestyle solutions company and the name of the company
reflects the same trust but new opportunities.‖
Arvind Mills - old logo
Arvindlimited - new logo

Arvindlimited has licensing relationships with international brands such as Arrow,
Gant, Cherokee, USPA, Hart Schaffner Marx, Sansabelt, Pierre Cardin and a joint
venture with VF Corporation, which covers Lee, Wrangler, Jansport, Nautica, Kipling
and Tommy Hilfiger. In addition, Arvind owns a number of successful Indian brands
such as Flying Machine, Newport, Excalibur and Ruf and Tuf. It also owns the retail
chain, Mega mart, which has 83 outlets in 30 towns. Recently, Arvindlimited opened
a 40,000 square foot Mega mart outlet in Chennai.
Arvind Mills changes name, focus, strategy
Textile major Arvind Mills which has been recently going through a bad patch owing
to rising rupee, reducing exports and falling margins is undertaking a business
transformation in a bid to become a billion dollar company.
The company has firstly changed its name from ‗Arvind Millslimited‘ to
‗Arvindlimited‘ with a new logo and identity to reflect a company which is diversified
with focus on branded apparel and retail. The promoters will increase their stake from
34% to 47% and infuse Rs.188 crore capital into the company.
Also, half of the Rs.1400 crore debts which Arvindlimited has would be repaid by
selling off land at Ahmedabad and Bangalore thus positively affecting the company‘s
profitability.
Arvind is now giving more focus to brands and retail which until now contributes
19% of total revenue. It will also move to become an integrated textile player by
producing fabric as well as retailing it. With a combination of its own as well as
licensed brands, Arvind aims to become the largest apparel brand in India with focus
on Tier II and III cities.
Major emphasis would be on the value store format ‗Megamart‘ which is targeted to
achieve Rs.1000 crore sales in 3 years. Other than that Arvind plans to setup 250
small format and 30 large format stores by 2012.The strategy may work out to be
rewarding for the company as it has a good portfolio of domestic and international,
and has been an established national player. The move would also help it to ward off
any risk it faces from the recession in export markets.


Concept of Working Capital
A company invests its funds for long term purposes and short term operations. That
portion of a company‘s capital, which is required for minimum stock of raw material
to maintain continuity in production, minimum stock of finished goods to fulfill future
demand, payment of wages and salaries of labourers and employees is called Working
Capital. In other words, working capital is that part of the firm‘s capital which is
required for financing short term or current assets such as debtors, inventories,
marketable securities and cash.
The word working capital comprises of two words ‗working‘ and ‗capital‘. In trade
and industry, the word ‗working‘ with reference to capital means circulation of
capital from one form to another during day-to-day operations of the business whereas
the word ‗capital‘ refers to the monetary values of all the assets (tangible and
intangible) of the business.
There are numerous concepts of working capital as given by various accountants,
financial experts, entrepreneurs and economists. Important among them are –
Balance Sheet or Traditional Concept
Operating Cycle Concept

Forms of Working Capital
Working capital is the amount of funds required to cover the cost of operating the
enterprise. In other words, working capital may be defined as excess of current assets
over current liabilities. It may be classified in two ways i.e. (i) on the basis of balance
sheet concept and (ii) on the basis of time. These are illustrated by the following chart.
Types of working capital
On the basis of B/S concept
Gross Working Capital
Net Working Capital
On the basis of time
Permanent or Regular
Working Capital
Variable or Temporary
Working Capital
Seasonal Working Capital
Specific Working Capital

On the basis of B/S concept
According to this concept, working capital is calculated on the basis of the balance
sheet prepared at a specific date. It is further classified it two forms- gross and net
working capital.
o Gross Working Capital – The gross working capital refers to the firm‘s investment
in current assets. The sum of current assets is a quantitative aspect of working
capital which emphasizes more on quantity than its qualities.
o Net Working Capital - Net working capital is the difference between the current
assets and the current liabilities or the excess of total current assets over total
current liabilities.
Net working capital may also be defined as, that part of a firm’s current assets
which is financed with long term funds. The net working capital may either be
positive or negative. When current assets exceed current liabilities, working capital
is positive and negative when current liabilities exceed current assets.
On the basis of Time
Working capital is the amount required in different forms at successive stages of
operation during the net operating cycle period of an enterprise. The duration or time
required to complete the sequence of events right from purchase of raw materials/goods
for cash to the realization of sales in cash is called the operating cycle or working
capital cycle. On the basis of time working capital may be classified as (i) Permanent or
regular working capital; and (ii) Variable or temporary working capital.

o Permanent or regular working capital – It represents the irreducible minimum
amount that is permanently blocked in the business and cannot be converted into
cash in the normal course of business. It has following characteristics :
a. It keeps on changing its form from one current asset to another
b. The size of working capital grows with the growth of the business
c. As long as the firm is a going concern, this part of working capital
cannot substantially be reduced.
o Variable or temporary working capital – Any amount over and above the
permanent working capital is variable or temporary working capital. It fluctuates
as per the change in the production and sale activities. It can further be classified
in following two forms:
a. Seasonal working capital – The capital required to meet the seasonal
demands of the enterprise is called seasonal working capital. It is of
short-term nature and thus has to be financed from short-term sources
like bank loan etc.
b.Specific working capital – Specific working capital is that part of the
working capital which is required to meet unforeseen contingencies like
slump, strike, flood, war etc.

Components of Working Capital
Working capital refers to the metric valuation of the current assets and the current
liabilities. These two are the basic components of working capital.
CURRENT ASSETS ARE:
(1) Inventories
(2) Sundry Debtors
(3) Bills Receivables
(4) Cash & Bank Balances
(5) Short term investment
(6) Advances such as advances for purchase of raw materials,
component and consumable stores, prepaid expenses etc.
CURRENT LIABILITIES ARE:
(1) Sundry Creditors
(2) Bills Payable
(3) Creditors for outstanding expenses
(4) Provision for tax
(5) Other provision against the liabilities payable within a period
of 12 months

Sources of Working Capital
Funds available for a period of one year or less are called short-term finance. In India
short-term funds are used to finance working capital. Two most significant forms of
working capital are: trade credit, bank borrowing.
The use of trade credit has been increasing over the years in India. Trade credit as a
ratio of current assets is about 40 percent. It is indicated by the Reserve Bank of India
that trade credit has grown faster than the growth in sales.
Bank borrowing is the next important source of working capital finance. Before
seventies, bank credit was liberally available to firms. It became a resource after
eighties because of the change in the government policy.
Another form of short-term working capital finance which has recently developed in
India is Commercial Paper.
Trade credit
Trade credit refers to the credit that a customer gets from supplier of goods in the
normal course of business. In practice, the buying firms do not have to pay cash
immediately for the purchase made. It is a major source of financing for firms. In
India, it contributes to about one-third of the short-term financing.
Trade credit is mostly an informal arrangement, and is granted on an open account
basis. Once the trade links have been established between the buyer and seller, they
have each other‘s mutual confidence and trade credit becomes a routine activity. Open
account trade credit appears as sundry creditors on the buyer‘s balance sheet. Trade
credit may also take the form of bills payable. A bill is formal acknowledgement of an
obligation to repay the outstanding amount.
It also involves some credit terms. These credit terms refer t the conditions under
which the supplier sells on credit to the buyer, and the buyer is required to repay the
credit. These conditions include the due date and the cash discount (if any) given for
prompt payment.

Bank Finance
Banks are the main institutional sources of working capital finance in India. A bank
considers a firm‘s sales and production plans and the desirable levels of current assets
in determining its working capital requirements. The amount approved by the bank for
the firm‘s working capital is called credit limit. Credit limit is the maximum funds
which a firm can obtain from the banking system. In the case of firms with seasonal
businesses, banks may fix separate limits for the peak level credit requirement and
normal non-peak level credit requirement indicating the periods during which the
separate limits will be utilized by the borrower.
A firm can draw funds from its bank within the maximum credit limit sanctioned. It can
draw funds in the following forms: (a) overdraft, (b) cash credit, (c) bills discounting,
and (d) working capital loan.
Overdraft Under the overdraft facility the borrower is allowed to withdraw funds in
excess of the balance in his current account upto a certain specified limit during a
stipulated period. Interest is charged on daily balances on the amount actually
withdrawn subject to some minimum charges.
Cash Credit Under the cash credit facility, a borrower is allowed to withdraw funds
from the bank upto the sanctioned credit limit against the security of current assets. He
is not required to borrow the entire sanctioned credit at once, rather, he can draw
periodically to the extent of his requirements and repay by depositing surplus funds in
his cash credit account. Interest is payable on the amount actually utilized. It is more
flexible from borrower‘s point of view.
Bills Discounting Under the purchase or discounting of bills, a borrower can obtain
credit from the bank against its bills. The bank purchases or discounts the bill and
provides the amount within the overdraft limit. Before purchasing or discounting, bank
satisfies itself as to the creditworthiness of the borrower. When a bill is discounted, the
borrower is paid the discounted amount of bill viz. full amount of bill minus discount
charged by the bank. The bank collects the full amount on maturity.

Letter of Credit Suppliers, particularly foreign suppliers, insist that the buyer should
ensure that his bank will make the payment if he fails to meet its obligation. This is
ensured through a letter of credit (L/C) arrangement. A bank opens an L/C in favour of
a customer to facilitate his purchase of goods. This arrangement passes the risk of the
supplier to the bank. Bank will make payment to the supplier on behalf of the customer
only when he fails to meet the obligation.
Working Capital Loan a borrower may sometimes require ad hoc or temporary
accommodation in excess of sanctioned credit limit to meet unforeseen contingencies.
Banks provide such accommodation through a demand loan account or a separate non-
operable cash credit account. The borrower is required to pay a higher rate of interest on
such additional credit.
Commercial paper
Commercial paper (CP) is an important money market instrument in advanced countries
like USA to raise short-term funds. In India, the Reserve Bank of India (RBI)
introduced the commercial paper scheme in the Indian money market in 1989.
Commercial paper is a form of unsecured promissory note issued by firms to raise
short-term funds. The buyers of commercial paper include banks, insurance companies,
unit trusts and firms with surplus funds to invest or a short period with minimum of
risk. Given this investment objective of the investors in the commercial paper market,
there would exist demand for commercial papers of highly creditworthy companies.
In India, the issue of commercial paper is being regulated by RBI. Those companies are
allowed to issue commercial papers which have a net worth of Rs.10 crore, maximum
permissible bank finance of not less than Rs.25 crore, and are listed on the stock
exchange. A company can issue CPs amounting to 75percent of the permitted bank
credit.In addition to the above mentioned sources, accrued expenses and deferred
income are other spontaneous sources of short-term financing. Accrued Expenses
represent a liability that a firm has to pay for the services which it has already received.

Deferred Income represents funds received by the firm for goods and services which it
has agreed to supply in future.
Objective of Working Capital Management
a. To minimize the amount of capital employed in financing the current assets.
This will also lead to improvement in the ―Return on Capital Employed‖.
b. To manage the current assets in such a way that the marginal return on
investment in these assets is not less then the cost of capital acquired to finance
them. This will ensures the maximization of the value of the business units.
c. To maintain the proper balance between the amount current assets and liabilities
in such a way that the firm is always able to meet its financial obligation
whenever due.
d. To ensure the smooth working of the units without any production held-ups due
to paucity of funds.
e. To ensure easy and cheapest availability of resources at the time of growth and
expansion activities.

Determinants of Working Capital
The following factors should be considered carefully while determining the amount of
working capital required:
1. Nature of business – The amount of working capital is basically related to the nature
and the volume of the business. Firms engaged in public utility services require
moderate amount of working capital whereas firms producing luxury goods require
large amount of working capital.
2. Size of business – Size is also a determining factor in estimating working capital
requirements. The size may be measured either in terms of scale of operations or in terms
of assets or sales.
3. Changes in technology – Changes in technology may lead to improvement in
processing of raw material, saving in wastage, higher productivity and more speedy
production. All these improvements enable the firm to reduce the working capital
requirements.
4. Length of operating cycle – The amount of working capital depends upon the length
or duration of operating cycle. The speed with which the operating cycle is completed,
determines the amount of working capital. The larger is the period, the more is the
investment in inventories and wage bills.

5. Terms of purchase and sale – A firm buying raw materials and other services on
credit and selling on cash basis will require less investment in current assets as compared
to a firm which purchases on cash basis and sells on credit. The period of credit and the
efficiency in collection of debts also influence the amount of working capital required.
The terms and conditions of purchase and sale are generally governed by the prevailing
trade practices and by changing economic condition.
6. Inventory - Some concerns are force to hold large inventories in terms of raw
materials or finished goods due to the reason of seasonal nature of availability,
long distances, scarcity etc, in such case the working capital requires is more.
7. Business cycles – Business cycle refers to the alternate expansion and contraction
in general business activities. In a period of boom when the business is
prosperous, there is need for larger amount of working capital due to increase in
sales and rise in prices of raw materials. The contrary happens in the period of
depression.
8. Profit margin – A high rate of profit margin due to quality products or good
marketing management or monopoly power in the market, reduces the working
capital requirements of the firm, as profit earned in cash is a source of working
capital. On the contrary, firms earning low margin of profits due to competition or
mismanagement need larger amount of working capital.
9. Credit policy – A firm following liberal credit policy and thus granting credit
facilities to all customers without evaluating the credit worthiness will require
more working capital to carry book debts. On the contrary, a firm that adopts strict
credit policy and grants facilities to customers with high credit standing will
require less amount of working capital as funds tied-up in receivables will be
released promptly for further uses.

Significance of adequate Working Capital
Adequate working capital is a source of energy to any business organization. It provides
the following advantages to a business enterprise:
1. Adequate working capital enables a firm to make prompt payments to the suppliers
and thus it can also avail the advantage of cash discount by paying cash for the
purchase of raw material.
2. If a firm has adequate working capital, it can declare and distribute enough dividends
when there are sufficient profits. This creates satisfaction among the shareholders.
3. In business, promptness to third parties creates goodwill and increases the debt
capacity of the concerned firm. This in turn ensures uninterrupted flow of production.
4. A firm having adequate working capital and liquid assets can arrange loans from the
banks on easy and favourable terms, as it provides a good security for the unsecured
loans.
5. Adequate working capital has psychological effect on the directors and executives of
the firm as it motivates them to work vigorously. It creates an environment of
security, confidence, high morale and increases overall efficiency in the business.

6. Adequate working capital increases the productivity or efficiency of fixed assets in the
business.
Effects of excessive Working Capital
Excess or redundant working capital refers to the idle funds which do not earn any profits
for the firm. ―Inadequate working capital is disastrous; whereas redundant working
capital is a criminal waste‖. A firm may suffer following disadvantages from excess
working capital:
1. It may lead to unnecessary purchasing and accumulation of inventories causing more
chances of mishandling of inventories, theft, waste, losses, etc.
2.Excessive working capital implies excessive debtors and defective credit policies
causing higher incidence of bad debts that ultimately affects profits of the firm.
3.It indicates inefficient management of the firm. It shows that the management is not
interested in effectively utilizing the resources and encouraging economy.
4.Excessive working capital remains idle and earns no profits for the firm, even though
interest has to be paid on it. This reduces the amount of profits.
5.It is an indicator of inefficient management. Hence, shareholders believe that they are
not getting proper return on their investments. This results in lowering the value of
shares causing discontentment among shareholders.

6.It promotes profits of speculative nature by stock-piling. It results in liberal dividend
policy, but the management has to face difficulties in future when there are no
speculative profits.
( Rs. in Crore )
Particulers As at
31.03.09
As at
31.03.08
As at
31.03.07
As at
31.03.06
SOURCES OF FUND
Share holder fund
Share capital 260.10 273.30 255.58 265.48
Reserves & surplus 940.47 1197.05 1113.45 1266.47
Total 1200.57 1470.35 1369.03 1531.95
Secured Loans 1920.90 1774.94 1772.74 1688.38
Unsecured Loans 103.04 97.52 161.57 152.99
Deferred Tax Liability 12.82 12.82 12.82 12.82
TOTAL 3237.33 3355.63 3334.16 3386.14
APPLICATION OF FUND
Fixed Assets
Gross Block 3056.80 2942.99 2817.21 2192.24
Less- Depreciation (1014.51) (906.78) (772.32) (882.64)
Net Block 2042.29 2036.21 2044.89 1309.60
Capital Work in Progress 81.58 116.14 71.45 79.59
Investment 100.06 104.99 48.05 348.10 FOREIGN CURRENCY MONETARY ITEM
TRANSLATION
DIFFERENCE ACCOUNT
6.77 0.00 0.00
0.00
Current assets, Loan & Advance
Inventories 581.47 575.34 645.01 479.26
Sundry Debtors 350.84 261.77 204.85 368.28
Cash & Bank Balance 26.83 16.32 22.31 9.59
Other Current Assets 54.90 73.26 54.95 38.68
Loan & Advance 578.47 544.45 663.79 1041.44
Total 1592.51 1471.14 1590.91 1937.25
Less-Current Liability & Provision

Liabilities 463.29 360.54 408.99 243.31
Provisions 132.66 21.81 12.15 45.09
Total 595.95 382.35 421.14 288.40
Net Working Capital 996.56 1088.80
1169.77 1648.85
Miscellaneous Expenditure (to the
extent not written off)
10.07 9.50 0.0 0.00
TOTAL 3237.33 3355.63 3334.16 3386.14
( Rs. in Crore )
Particular 2008-09 2007-08 2006-07 2005-06 2004-05
INCOME
Sales & Operating Income 2344.99 2290.33 1847.99 1592.00 1654.91
Other Income 51.91 15.91 13.17 22.52 4.99
Total 2396.90 2306.24 1861.16 1614.52 1659.90
EXPENSES
Raw Materials Consumed 695.83 611.26 571.93 500.24 612.24
Purchase of Finished Goods 257.90 305.54 36.97 4.45 7.63
Employee Emoluments 244.80 230.39 204.33 135.74 123.09
Others 924.47 861.04 780.24 534.14 542.92
Interest & finance cost 222.13 131.40 150.26 138.64 108.92
Depreciation 122.05 136.64 143.36 155.10 149.07
Exceptional items (net) 11.53 9.31 0.00 0.00 0.00
Decrease/(Increase) in Stocks (34.86) (9.49) (53.64) 9.82 (12.76)
Total 2443.86 2276.09 1833.45 1478.14 1530.60
Profit before tax for the year (46.96) 30.15 27.71 136.38 129.30
Less- Current tax 0.00 3.10 0.00 11.40 1.95
Less-Deferred Tax 0.00 0.00 0.00 8.27 0.00
Less –Fringe benefit tax 1.86 2.25 11.62 0.95 0.00
Add: MAT Credit Entitlement 0.00 (3.10) (11.61) (11.40) 0.00
Profit For the year (48.82) 27.90 0.00 127.16 127.35
Less- Prior Period Income/(Expense) 0.95 (0.54) 0.00 0.00 0.00
Profit before (47.87) 27.36 25.27 0.00 0.00
Extra ordinary items (net) 0.00 0.00 94.29 0.00 0.00
Profit after Extra ordinary items (47.87) 27.36 119.56 0.00 0.00
Balance as per last year‟s balance sheet 434.92 425.00 321.17 232.74 127.77
Interim Dividend on Preference Shares (1.68) (2.48) (3.14) (3.80) (4.09)
Tax on Interim Dividend (0.29) (0.42) (0.44) (0.53) (0.53)
Proposed dividend on Equity Shares 0.00 0.00 0.00 (20.94) (19.54)

Tax proposed dividend 0.00 0.00 0.00 (2.94) (2.74)
Additional dividend on equity share 0.00 0.00 0.00 (1.40) 0.00
Tax on additional dividend (80.10) 0.00 0.00 (0.20) 0.00
Provision for leave encashment (9.58) (1.34) 0.00 0.00 0.00
Transferred to capital redemption reserves (13.20) (13.20) (9.90) (9.92) (3.48)
Transferred to debenture redemption
reserve
0.15 0.00 (2.25) 1.00 8.00
Balance Carried to Balance Sheet 282.34 434.92 425.00 321.17 232.74
( Rs. in Crore ) (Actual working capital)
CURRENT ASSETS
PARTICULAR 2009 2008 2007 2006 2005
Raw Materials 930.17 139.77 264.27 257.12 282.05
Work in progress 202.19 147.36 140.34 112.91 87.73
Finished goods 136.51 243.23 198.42 71.91 103.54
Sundry Debtors 350.84 261.77 204.85 368.28 319.11
Cash &Bank
Balance
26.83 89.58 77.26 48.27 51.10
Total 1646.54 881.71 885.14 858.49 843.53
CURRENT LIABILITIES
PARTICULAR 2009 2008 2007 2006 2005
Sundry Creditors 344.46 360.54 408.99 243.31 238.76
Wages 212.64 207.12 174.50 112.54 101.83
Overheads 925.15 877.19 780.24 534.14 542.92
Total 1482.25
1444.85
1363.73 898.99 883.51
Net WC 164.29 (563.14) (478.59) (40.50) (39.98)
Time period of working capital

Raw Materials = 100%
Work in process = 1 month
Finish goods =1 month
Debtors = 2 month
Creditors = 1.5 month
Wages = 1 month
Overheads = 1 month
NET WORKING CAPITAL:-
Net Working Capital =Total Current Assets – Total Current
Liabilities
2009
= 1646.54-1482.25
= 164.29
2008
= 881.71-1444.85
= (563.14)
2007
= 885.14 - 1363.73
= (478.59)
2006
= 858.49 – 898.99

= (40.50)
2005
= 843.53 – 883.51
= (39.98)
WORKING CAPITAL OF THE ARVIND LTD.
(Actual working capital) (Rs.in crore)
WORKING
CAPITAL
2008-09 20007-08 2006-07 2005-06 2004-05
CURRENT
ASSETS
1. Raw
Materials
930.17 139.77 264.27 257.12 282.05
2. Work in
process
16.84 12.28 11.695 9.409167 7.310833
3. Finished
goods 11.38 20.26916 16.535 5.9325 8.628333
4. Debtors 58.47 43.62833 34.141167 61.38 53.185
5. Cash & Bank
Balance 26.83 89.58 77.26 48.27 51.19
TOTAL - (A) 1043.69 305.5275 403.9017 382.1117 4023642
CURRENT
LIABILITIES
1. Time – lag
for Creditors
43.05 45.0675 51.12375 30.41375 29.845
2. Time – lag
for Wages
17.72 17.26 14.54167 9.378333 8.485833
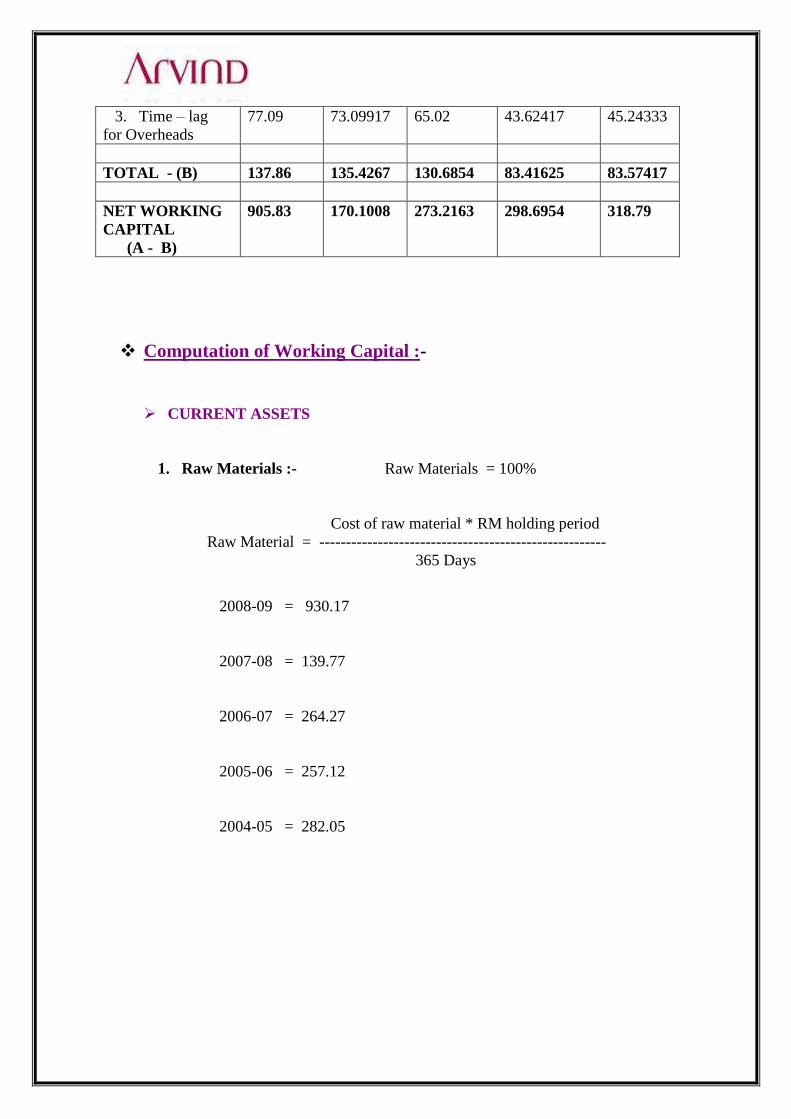
3. Time – lag
for Overheads
77.09 73.09917 65.02 43.62417 45.24333
TOTAL - (B) 137.86 135.4267 130.6854 83.41625 83.57417
NET WORKING
CAPITAL
(A - B)
905.83 170.1008 273.2163 298.6954 318.79
Computation of Working Capital :-
CURRENT ASSETS
1. Raw Materials :- Raw Materials = 100%
Cost of raw material * RM holding period
Raw Material = ------------------------------------------------------
365 Days
2008-09 = 930.17
2007-08 = 139.77
2006-07 = 264.27
2005-06 = 257.12
2004-05 = 282.05

2. Work in process :- (Work in process = 1 month )
WIP cost * WIP holding period
WIP = --------------------------------------------
365 days/ 12 months
202.19 * 1 months
2008-09 = -----------------------------
12 months
2008-09 = 16.84
147.36 * 1 months
2007-08 = -----------------------------
12 months
007-08 = 12.28
140.34 * 1 months
2006-07 = -----------------------------
12 months
2006-07 = 11.69
112.91 * 1 months
2005-06 = -----------------------------
12 months
2005-06 = 9.41
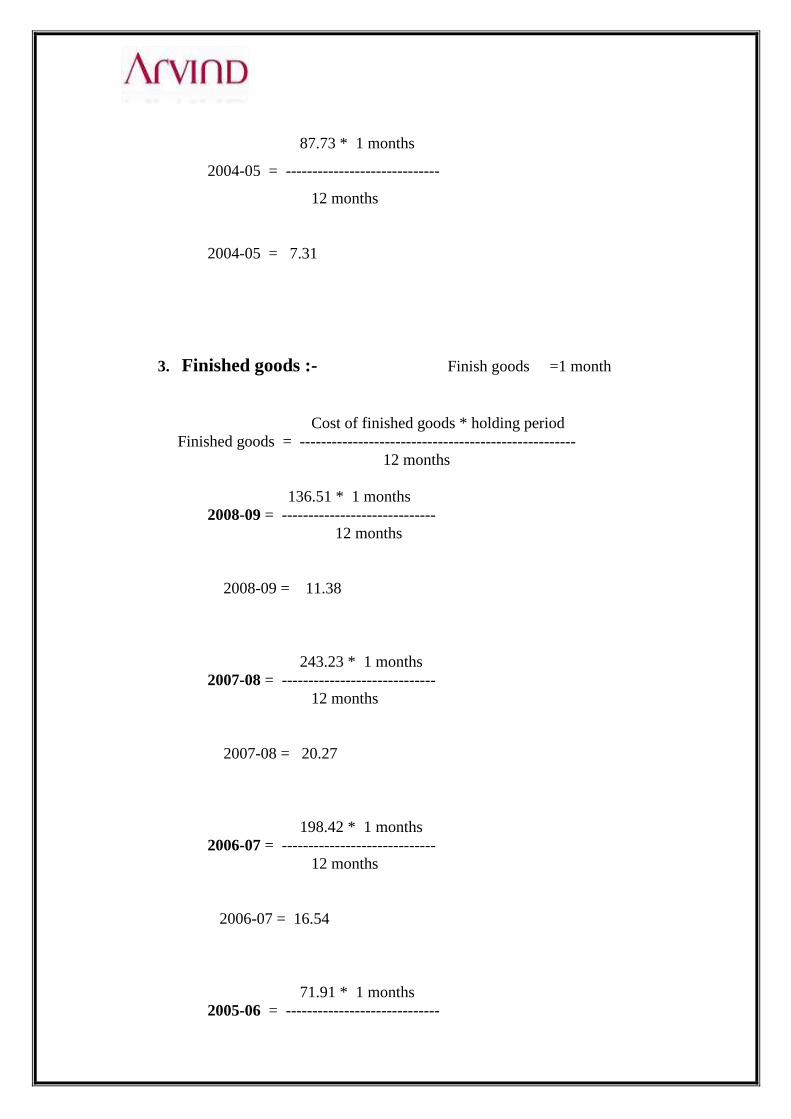
87.73 * 1 months
2004-05 = -----------------------------
12 months
2004-05 = 7.31
3. Finished goods :- Finish goods =1 month
Cost of finished goods * holding period
Finished goods = ----------------------------------------------------
12 months
136.51 * 1 months
2008-09 = -----------------------------
12 months
2008-09 = 11.38
243.23 * 1 months
2007-08 = -----------------------------
12 months
2007-08 = 20.27
198.42 * 1 months
2006-07 = -----------------------------
12 months
2006-07 = 16.54
71.91 * 1 months
2005-06 = -----------------------------

12 months
2005-06 = 5.93
103.54 * 1 months
2004-05 = -----------------------------
12 months
2004-05 = 8.63
4. Sundry Debtors :- Debtors = 2 month
Credit sales * debtors collection period
Sundry Debtors = -----------------------------------------------------
12 months
350.84 * 2 months
2008-09 = -----------------------------
12 months
2008-09 = 58.47
261.77 * 2 months
2007-08 = -----------------------------
12 months
2007-08 = 43.63
204.85 * 2 months
2006-07 = -----------------------------
12 months
2006-07 = 34.14
368.28 * 2 months
2005-06 = -----------------------------

12 months
2005-06 = 61.38
319.11 * 2 months
2004-05 = -----------------------------
12 months
2004-05 = 53.19
Current Liability :-
1. Sundry Creditors :- (Creditors = 1.5 month)
Credit purchase * credit period allowed by creditors
Sundry Creditors = ------------------------------------------------------------------
12 Months
344.46 * 1.5 months
2008-09 = -----------------------------
12 months
2008-09 = 43.05
360.54 * 1.5 months
2007-08 = -----------------------------
12 months
2007-08 = 45.07
408.99 * 1.5 months
2006-07 = -----------------------------
12 months
2006-07 = 51.12
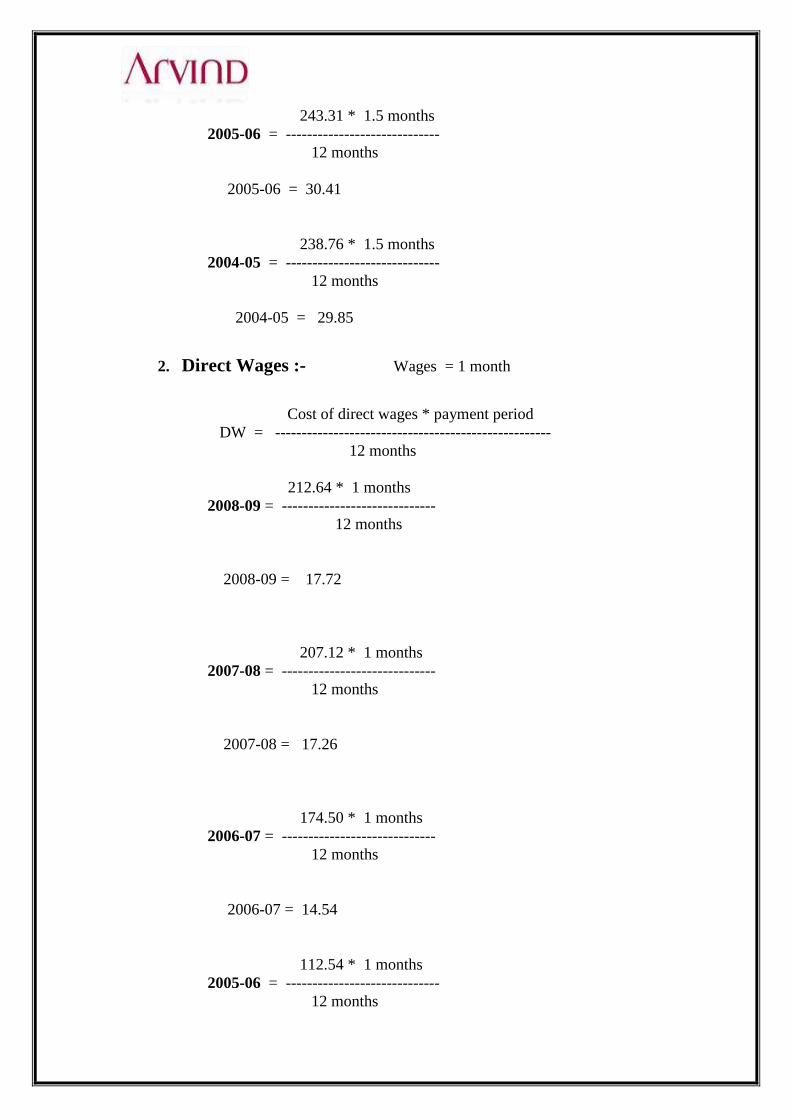
243.31 * 1.5 months
2005-06 = -----------------------------
12 months
2005-06 = 30.41
238.76 * 1.5 months
2004-05 = -----------------------------
12 months
2004-05 = 29.85
2. Direct Wages :- Wages = 1 month
Cost of direct wages * payment period
DW = ----------------------------------------------------
12 months
212.64 * 1 months
2008-09 = -----------------------------
12 months
2008-09 = 17.72
207.12 * 1 months
2007-08 = -----------------------------
12 months
2007-08 = 17.26
174.50 * 1 months
2006-07 = -----------------------------
12 months
2006-07 = 14.54
112.54 * 1 months
2005-06 = -----------------------------
12 months

2005-06 = 9.38
101.83 * 1 months
2004-05 = -----------------------------
12 months
2004-05 = 8.49
3. Overheads :- Overheads = 1 month
Total cost of overheads * avg. time-lag in
payment of overheads
Overheads = ---------------------------------------------------------------
12 Months
925.15 * 1 months
2008-09 = -----------------------------
12 months
2008-09 = 77.09
877.19 * 1 months
2007-08 = -----------------------------
12 months
2007-08 = 73.10
780.24 * 1 months
2006-07 = -----------------------------
12 months
2006-07 = 65.02
534.14 * 1 months
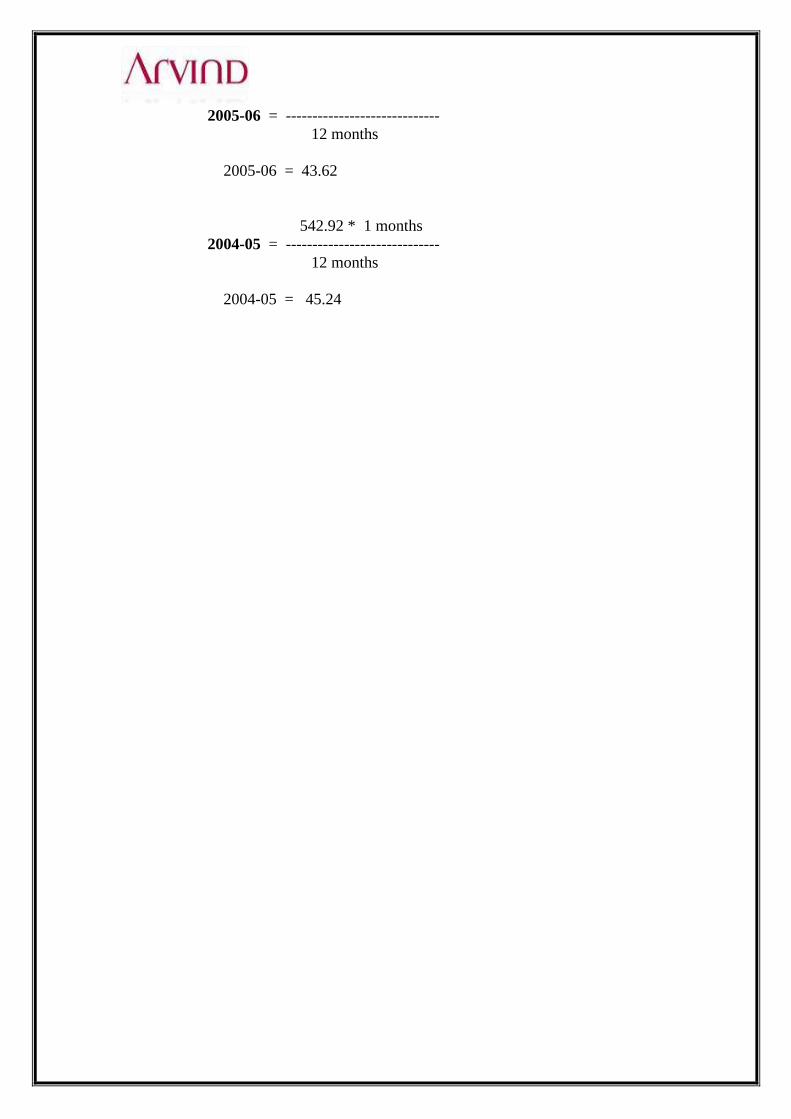
2005-06 = -----------------------------
12 months
2005-06 = 43.62
542.92 * 1 months
2004-05 = -----------------------------
12 months
2004-05 = 45.24

FORMULAS:-
Stock of raw material
1. Inventory period = ---------------------------------------- * 365 days-
Cost of raw material consumed
Stock of WIP
2. WIP holding period = ------------------------------------- * 365 days
Cost goods manufacturing
Stock of finished goods
3. Finished goods = ------------------------------------ * 365 days
Cost of goods sold
debtors
4. Debtors collection period = ------------------------- * 365 days
Credit sale
Creditors
5. Accounts payable period = ------------------- * 365 days
Purchases
6. Operating Cycle = Inventory Period + Debtors collection period +
WIP holding period + Finished goods -
Accounts payable period
7. Cash Cycle = Operating cycle - Accounts Payable Period
Operating and cash Conversion Cycle
Operating cycle method is the best technique for estimating future cash working
capital of a firm. Under this method, total operating expenses for a period are divided by
the number of operating cycles in the relevant period to find out the cash cost of working
capital. Thus, the computation of total operating expenses, operating cycle and number of
operating cycles in the year is essential for estimating the amount of working capital, as
discussed below:
Operating expenses include purchase of raw material, direct labour cost, fuel and power,
administrative and selling and distribution expenses for a specific period for which
estimates can be obtained from cost records.
Operating cycle period means the total number of days involved in the different stages
of operation commencing from the purchase of raw materials and ending with collection
of sale proceeds from debtors after adjusting the number of day‘s credit allowed by
suppliers. It is calculated by using the following formula:
I. PERIOD OF OPERATING CYCLE =
Material storage period (M)+ Work-in-progress period (W) +
Finished goods period (F)+ Debtors collection period (D) -
Creditors payment period (C)
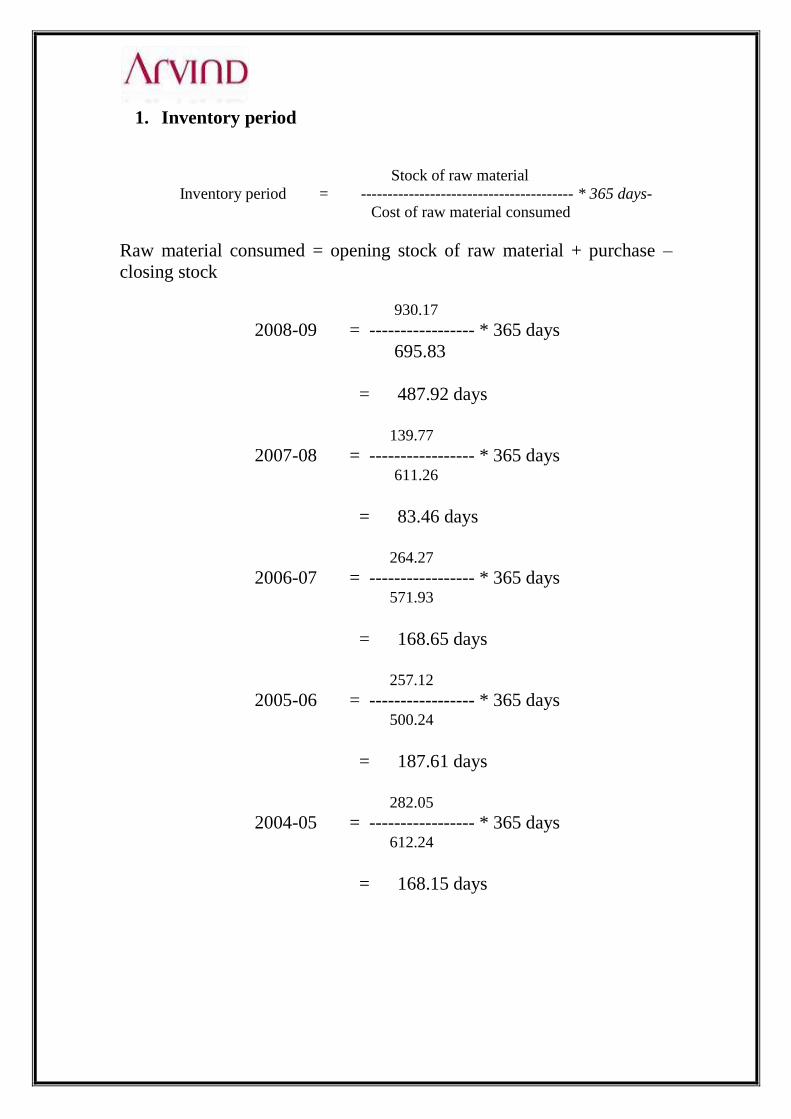
1. Inventory period
Stock of raw material
Inventory period = ---------------------------------------- * 365 days-
Cost of raw material consumed
Raw material consumed = opening stock of raw material + purchase –
closing stock
930.17 2008-09 = ----------------- * 365 days
695.83
= 487.92 days
139.77 2007-08 = ----------------- * 365 days 611.26
= 83.46 days
264.27 2006-07 = ----------------- * 365 days 571.93
= 168.65 days
257.12 2005-06 = ----------------- * 365 days 500.24
= 187.61 days
282.05 2004-05 = ----------------- * 365 days 612.24
= 168.15 days

2. WIP holding period :-
Stock of WIP
WIP holding period = ------------------------------------- * 365 days
Cost goods manufacturing
202.19
2008-09 = ----------------- * 365 days
1515.94
= 48.68 days
147.36
2007-08 = ----------------- * 365 days
1468.11
= 36.63 days

3. Finished goods :-
Stock of finished goods
Finished goods = ------------------------------------ * 365 days
Cost of goods sold
136.51
2008-09 = ----------------- * 365 days
2443.86
= 20.38 days
243.23
2007-08 = ----------------- * 365 days
2276.09
= 39.00 days
198.42
2006-07 = ----------------- * 365 days
1833.45
= 39.50 days
71.91
2005-06 = ----------------- * 365 days
1478.14
= 17.76 days
103.54
2004-05 = ----------------- * 365 days
1530.60
= 24.69 days

4. Debtors collection period :-
debtors
Debtors collection period = ------------------------- * 365 days
Credit sale
Here no specification for cash or credit sales . so, all the sales taken a credit sales.
350.84
2008-09 = ----------------- * 365 days
2344.99
= 54.61 days
261.77
2007-08 = ----------------- * 365 days
2290.33
= 41.71 days
204.85
2006-07 = ----------------- * 365 days
1847.99
= 40.46 days
368.28
2005-06 = ----------------- * 365 days
1592.00
= 84.43 days
3190.11
2004-05 = ----------------- * 365 days
1654.91
= 70.38 Days

5. Accounts payable period :-
Creditors
Accounts payable period = ------------------------ * 365 days
Credit Purchases
Particular 2009 2008
Raw Materials
Purchase
649.23 487.03
Purchase of Finished
Goods
257.90 305.54
Total 907.13 792.57
Sundry Creditors 344.46 360.54
344.46
2008-09 = ----------------- * 365 days
907.13
= 138.60 days
360.54
2007-08 = ----------------- * 365 days
792.57
= 166.03 days

PERIOD OF OPERATING CYCLE :-
Operating Cycle = Inventory Period + Debtors collection period +
WIP holding period + Finished goods - Accounts
payable period
OPERATING CYCLE 2009 2008
1. Inventory Period 487.92 83.46
2. WIP holding period 48.68 36.63
3. Finished goods 20.38 39.00
4. Debtors collection
period
54.61 41.71
Less – 5. Accounts
payable period
138.60 166.03
Duration of operating
cycle
472.99 34.77
II. NUMBER OF OPERATING CYCLES IN A YEAR =
365 days
OPERATING CYCLES = -------------------------
Operating cycle period
365 days
2009 =------------------------
472.99
= 0.77 times
365 days
2008 = --------------------
34.77
= 10.50 times

WORKING CAPITAL POLICY :-
The basic objective of working capital management is that there should be an
optimum investment in working capital. There should not be either excessive working
capital or shortage of working capital. In order to decide the optimum investment
working capital, there is a need to consider different policies of working capital. The
different policies are discussed.
(A) Ratio of current assets to sales:-
The current assets change as a result of changes in the sales. A firm has to
decide about the proportion of current assets to be maintained in relation to sales.
There can be aggressive, moderate or conservative current assets policies.
AN AGGRESSIVE CURRENT assets policy is followed, a firms will maintain
a very low level of current assets in relation to sales.
A CONSERVATIVE POLICY implies carrying of a very high level of current
assets in relation to sales.
A MODERATE POLICY is a via media between the two extreme policies
mentioned above and results into a moderate proportion of current assets to
sales.
A MODERATE CURRENT assets policy tries to balances risk and
profitability by keeping moderate level of current assets in relation to sales
Conservative
Moderate
Current
Aggressive
Assets
0 Sales

(B) Financing of current assets:-
In conservative current asset financing policy, a firm relies more on long term
financing such as shares, debentures, preference shares, long term debt and retained
earnings. In this method, as the emphasis is on long term financing, the firm has less
risk of facing problems of shortage of funds.
An aggressive policy is said to be followed by a firm, when it relies heavily on
short-term bank financing and other short-term sources. Even some part of fixed
assets is financed by short-term funds. The policy exposes the firms to a higher degree
of but reduces the average cost of financing.
Problems with Excessive Working Capital: -
It‘s Results in unnecessary accumulation of inventories. Thus, chances of
inventory mishandling, waste, theft and losses increase.
It‘s an indication of defective credit policy and slack collection period.
Consequently, higher incidence of bad debts results, which adversely affects
profits.
Excessive working capital makes management complacent which degenerates
into managerial inefficiency.
Tendencies of accumulating inventories tend to make speculative profit grows.
This may tend to dividend policy liberal and difficult to cope with in future
when the firms are unable to make speculative profits.
Inadequate Working Capital is bad and has the following
Problems: Its Stagnates growth. It becomes Difficult for the firms to undertaken
profitable for non-availability of working capital funds.
It becomes difficult to implement operating plans and achieve the firm‘s profit
target. Operating inefficiencies creep in when it becomes difficult even to
meet day –to-day commitments.
Fixed assets are not efficiently utilized for the lack o f working capital funds.
Thus then firms‘ profitability would deteriorate.
Paucity of working capital funds renders the firms unable to avail attractive
credit opportunities etc.
The firms, loses its reputation when it is not in a position to cover its short-
term obligations. As a result, the firm faces tight credit terms.

S.W.O.T Analysis
Strength:
A company from prestigious Lalbhai group
One of the oldest played in Indian fabric
market
Can supply both fabric as well as garment
Production capacity of 7million tons
monthly wise
Provide quality with consistence
Weakness:
Situated very fat from city
Low advertisement budget
Unable to handle small orders
Higher cost of production due to
heavy investment
Opportunities:
Able to handle more franchisee of
international brands
Retails are going to be a major sector in
India. Therefore demand for fabric is also
increasing.
Having potential to increase their capacity,
so that they can satisfy more and more
customer needs.
By providing ―consistency in quality‖ they
can attract more customers.
Threats:
Competition from various domestic
players, especially from Raymond‘s
and LNJ.
Fluctuation in price of yarn.
Regularly innovation in technology
Existing players coming up with
more variety and innovation esp.
catering small order.
Change in government policy

FUTURE REQUIRMENT OF WORKING CAPITAL“ARVIND
LTD”.
Profit of the Arvind Limited was increased during last three year, shows that their
requirements of working capital will also increasing in future.
As the sales grow, the working capital needs also grow up. Actually it is very
difficult to find out an exact proportion of increase in current assets, as a result of
increase in sales. Advance planning of working capital becomes essential because
current assets will have to be employed even before growth in sales takes place.
Ones sales start increasing, they must be sustained. For this Arvind Limited will
have to expand its production facilities which will require more investments in
fixed assets. This will in turn result in more requirements of turn results of current
assets which will increase working capital needs.
The working capital needs of the Arvind Limited increase as it grows in terms of
sales or fixed assets. A growing Arvind Limited may need to invest funds in fixed
assets in order to sustain its growth in production and sales. This will lead to
increase investment in current assets which will result in increase in working
capital needs.
The operating efficiency of the Arvind Limited relates to the Optimum utilization
of resources at minimum cost. Arvind Limited will contribute to its working
capital, if it is efficient in operating costs. The working capital is better utilized
and cash cycle is reduced which reduces working capital needs.
The working capital requirement of a firm depends to a great extend on the credit
policy followed by a firm for its debtors. A liberal credit policy followed by a
firm will result in huge funds blocked in debtors which will enhance the need for
working capital.
The need for working capital is also affected by the credit policy allowed by the
Arvind Limited‟s creditors. If the creditors are ready to supply material and
goods on liberal credit, working capital requirement are substantially reduced.
If purchases are mainly for cash, working capital needs go up. While planning
the working capital due attention should be given toward the credit policies
followed by the firm and its creditors.

INTERPRETATION OF WORKING CAPITAL :-
STOCK OF RAW MATERIAL:-
Stock of raw material has increased at a rate of 665.50 % during the year
2008 to 2009.
In the year 2006-07 stock of raw material was Rs 264.27 crore. It was
decreased by 47.11 % in the year 2007-08. During the year 2005-06 to 2007-08 stock
of material decreased by about staggering 45.64%.
CASH AND BANK:-
Cash and bank of Arvind Ltd have been progressively increasing since
2005-06 financial year.
In year ended 2006 it was 48.27 crore and since then it had started to increase, and at
the end of financial year 2008 it has increased by 85.58% and as a result of this in
Cash &Bank Balance
0
20
40
60
80
100
2009 2008 2007 2006 2005
Cash &Bank
Balance
Raw Materials
0
200
400
600
800
1000
2009 2008 2007 2006 2005
Raw Materials

2007-08 cash and bank is 89.58 crore. But 2009 cash & bank balance 26.83 decrease
by 70 % compare to 2008 cash & bank balance 89.58.
Arvind Ltd. Has to reduce cash and bank level in next financial year. Around 40 crore.
High level of cash and bank will affect the cost and financial burden of the company.
DEBTORS:-
In year 2005 debtors were319.11 crore, but in 2006 it increased by 15.41%,
In year 2007 debtor was 204.85 crore but it has increased by 27.79%. in 2008.
In year 2008 debtor was 261.77 crore but it has increased by 34.02%. in 2009.
There is no significant fluctuation seemed therefore nothing is bother about
debtors. In addition to this debtor policy is constant that is 60 days.
STOCK OF FINISHED GOODS:-
Particular 2008-09 20007-08 2006-07 2005-06 2004-05
Finished goods 136.51 243.23 198.42 71.91 103.54
Stock of finished goods was decreased by 43.87 % in year 2008-09 from
2007-08. Stock of finished goods was increased by 178.72% in year 2006-07 from
2005-06. But in 2007-08 it was increased by 22.58% from previous year, it shows
significant fluctuation in ―stock of finished Goods‖.
Company should dilute this fluctuation as higher inventory cost is attributed to
stock of goods.
Accurate demand forecast could help reduction in stock of finished Goods.
Finished goods
0
100
200
300
Finished goods
Finished goods 136.51 243.23 198.42 71.91 103.54
2009 2008 2007 2006 2005

RECOMMENDATION
Having done a detailed study of the financial performance and financial
standing of Arvind Limited, under this project work I would like to make the
following suggestion for the improvement in the financial management of the
company, with special reference to its Working Capital Management.
Arvind Limited is facing increased competition in the market so it will
have to adopt more aggressive working capital management policy in
order to increase its share and sales turnover.
It is observed that the credit period for Debtors is ranging for 30 days
to 120 days. I would like to suggest that the maximum credit period
should not exceed 90 days.
Many debtors had not made the payment even after one year period.
Due to this there is reduction in the collection from the debtors year to
year.
Company has to maintain sales turnover for that purpose company has
to maintain and increase their working capital.
Gross profit has increasing but net profit has decreasing so that
purpose effectively utilizes and maintain working capital.

CONCLUSION
Working capital is simply current assets minus current liabilities. It's the best
way to judge how much a company has in liquid assets to build its business, fund its
growth, and produce shareholder value.
As Arvind is a cloth manufacturing company the procedure of goods to be ready
for sale takes too much time. Thus, working capital is blocked in high amount.
But with the comparison to other mills Arvind is leader of the Cloth
manufacturing. And its Working Capital is blocked for lesser time then another
mills as its inventory ‗Cotton‘ plays a major role and it‘s available cheaply in the
season. Also Arvind buys it in higher volumes, so it takes more time to stuff up
and the complete readymade stock takes appx 1.25 month for wholesaling.
Arvind makes payment to his creditors within a month and collect from debtors
takes appx 1.25 month. So, its overall short-term liquidity position is very good.
The mean percentage of current assets to total assets for the last four years is 40%
which shows decrease in investment of current assets.
Overheads have increased as compare to the last two years thereby reducing the
profit.
If a company has ample positive working capital, it's is in good shape, with plenty of
cash on hand to pay for everything it might need to buy. But negative working capital
means that the company's current liabilities exceed its current assets, removing its
ability to spend as aggressively as a working-capital-positive peer. All other things
being equal, a company with positive working capital will always outperform a
company without it.

BIBLIOGRAPHY
1. Financial Management - I. M. PANDEY
2. Financial Management - PRASANNA
CHANDRA
3. Financial Management - KHAN & JAIN
4. Annual Report of Arvind Limited
WEB-LINKS:
www.arvindmills.com
www.google.com
www.wikipedia.org
OTHER BOOKS:
Agrawal M.R, Financial Mnagement, Garima Publications
Pandey I.M, Financial Management, Mc-Graw Hill Publications
Annual reports of the company for the year 2007-08, 2006-07.