Embed Size (px)
Citation preview
A Summary of South East Asian Infrastructure Spending: Outlook to 2025
www.pwc.com/sg
2 PwC
Introduction
Infrastructure spending is a key driver of the global economy and was impacted by the global financial crisis. However, we expect spending on capital projects and infrastructure to grow significantly over the next decade.
We have undertaken in-depth analysis of the infrastructure market in 49 countries that account for 90% of global economic output.
This analysis has led to the following conclusions:
• The Asian market, driven by China’s growth, is slated to represent nearly 60% of global infrastructure spending by 2025.
• To realise the expected surge in infrastructure spending, emerging markets will need to provide the proper mix of economic, social, and environment factors, sometimes referred to as the enabling environment. Some also will have to create a more conducive business environment for investors as well as engineering and construction firms by overcoming obstacles such as unpredictable regulations, bureaucratic delays, and struggles to secure land rights.
• Growing urbanisation in emerging markets such as Philippines and Indonesia should boost spending for vital infrastructure sectors such as water, power, and transportation.
• Increasing prosperity in emerging markets is expected to drive infrastructure financing toward consumer sectors, including transportation and manufacturing sectors that provide and distribute raw materials for consumer goods.
This publication provides a preview snapshot of our analysis in selected South East Asian economies in advance of our full report on the global infrastructure market. To read more about our global report, Capital Project and Infrastructure Spending: Outlook to 2025, visit our global website, www.pwc.com/gx/en/capital-projects-infrastructure, following its launch on 16 June 2014.
3South East Asian Outlook to 2025
Introduction 2
Country snapshots • Indonesia 4• Malaysia 5• Philippines 6• Singapore 7• Thailand 8• Vietnam 9 Contacts 11
Contents
4 PwC
Indonesia
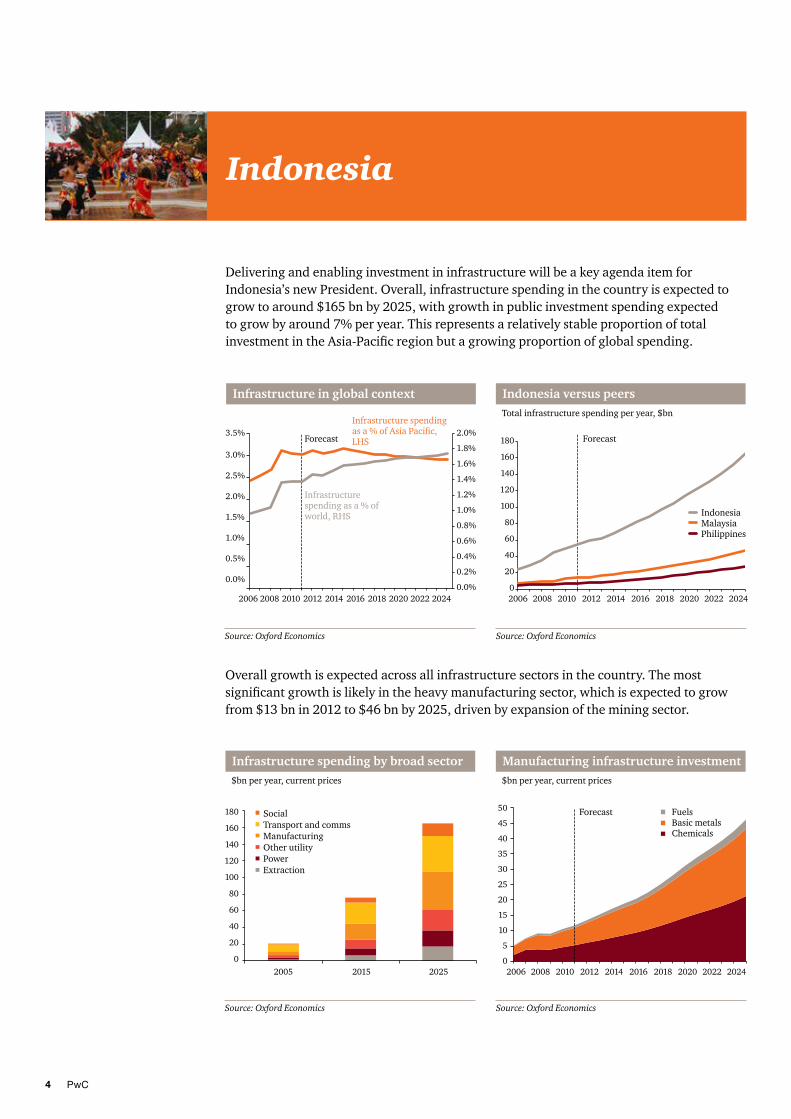
Delivering and enabling investment in infrastructure will be a key agenda item for Indonesia’s new President. Overall, infrastructure spending in the country is expected to grow to around $165 bn by 2025, with growth in public investment spending expected to grow by around 7% per year. This represents a relatively stable proportion of total investment in the Asia-Pacific region but a growing proportion of global spending.
Infrastructure in global context
Infrastructure spending as a % of Asia Pacific, LHS
Infrastructure spending as a % of world, RHS
Forecast3.5%
3.0%
2.5%
2.0%
1.5%
1.0%
0.5%
0.0%
2.0%
1.8%
1.6%
1.4%
1.2%
1.0%
0.8%
0.6%
0.4%
0.2%
0.0%2006 2008 2010 2012 2014 2016 2018 2020 2022 2024
Indonesia versus peers
Forecast180
160
140
120
100
80
60
40
20
02006 2008 2010 2012 2014 2016 2018 2020 2022 2024
Total infrastructure spending per year, $bn
IndonesiaMalaysiaPhilippines
Overall growth is expected across all infrastructure sectors in the country. The most significant growth is likely in the heavy manufacturing sector, which is expected to grow from $13 bn in 2012 to $46 bn by 2025, driven by expansion of the mining sector.
Manufacturing infrastructure investment
Forecast50
45
40
35
30
25
20
15
10
5
02006 2008 2010 2012 2014 2016 2018 2020 2022 2024
$bn per year, current prices
FuelsBasic metalsChemicals
Infrastructure spending by broad sector$bn per year, current prices
180
160
140
120
100
80
60
40
20
02005 2015 2025
SocialTransport and commsManufacturingOther utilityPowerExtraction
Source: Oxford Economics Source: Oxford Economics
Source: Oxford Economics Source: Oxford Economics

5South East Asian Outlook to 2025
Malaysia
Infrastructure in global context
Infrastructure spending as a % of Asia Pacific, LHS
Infrastructure spending as a % of world, RHS
Forecast0.6%
0.5%
0.4%
0.3%
0.2%
0.1%
0.0%
0.9%
0.8%
0.7%
0.6%
0.5%
0.4%
0.3%
0.2%
0.1%
0.0%2006 2008 2010 2012 2014 2016 2018 2020 2022 2024
Malaysia versus peers
Forecast180
160
140
120
100
80
60
40
20
02006 2008 2010 2012 2014 2016 2018 2020 2022 2024
Total infrastructure spending per year, $bn
Utility infrastructure investment
Forecast
2005 2007 2009 2011 2013 2015 2017 2019 2021 2025
$bn per year current prices
Electricity generationGas distributionWater supply and sanitationElectricity T&D
Infrastructure spending by broad sector$bn per year, current prices
20
18
16
14
12
10
8
6
4
2
02005 2015 2025
SocialTransport and commsManufacturingOther utilityPowerExtraction
Infrastructure investment rose from $6 bn to $16 bn between 2005 and 2013 in Malaysia. Infrastructure spending is expected to grow by around 9% a year between 2013 and 2025 which is consistent with other countries in the region but substantially faster than the global infrastructure market.
Overall growth is likely in infrastructure investment across all sectors. Investment growth in the utilities segment is expected to be the most significant, owing to the comparatively higher need to improve its electricity infrastructure in the region.
MalaysiaPhilippinesNew ZealandIndonesia
50
45
40
35
30
25
20
15
10
5
0
Source: Oxford Economics Source: Oxford Economics
Source: Oxford Economics Source: Oxford Economics

6 PwC
Philippines
The Philippines’ economy has grown very strongly in recent years and infrastructure spending needs to respond to the growth in the economy to support further growth. Spending in infrastructure is expected to grow at around 10% a year in the next decade, reaching a total of $27 bn a year by 2025.
Infrastructure in global context
Infrastructure spending as a % of Asia Pacific, LHS
Infrastructure spending as a % of world, RHS
Forecast0.6%
0.5%
0.4%
0.3%
0.2%
0.1%
0.0%
0.35%
0.30%
0.25%
0.20%
0.15%
0.10%
0.05%
0.00%2006 2008 2010 2012 2014 2016 2018 2020 2022 2024
Philippines versus peers
Forecast180
160
140
120
100
80
60
40
20
02006 2008 2010 2012 2014 2016 2018 2020 2022 2024
Total infrastructure spending per year, $bn
Growth is expected to be focused on manufacturing, transportation and communications, and social infrastructure. The expansion in the chemicals and basic metals sectors is likely to lead to significant growth in the manufacturing sector throughout 2025.
Manufacturing infrastructure investment
Forecast14
12
10
8
6
4
2
02006 2008 2010 2012 2014 2016 2018 2020 2022 2024
$bn per year, current prices
FuelsBasic metalsChemicals
Infrastructure spending by broad sector$bn per year, current prices
30
25
20
15
10
5
02005 2015 2025
SocialTransport and commsManufacturingOther utilityPowerExtraction
Philippines MalaysiaThailandIndonesia
Source: Oxford Economics Source: Oxford Economics
Source: Oxford Economics Source: Oxford Economics

7South East Asian Outlook to 2025
Singapore
Singapore has high quality infrastructure which means that its infrastructure needs will be lower than other countries in the region. Hence, its share of regional and global infrastructure spending is likely to fall. Singapore’s overall infrastructure spending is expected to approach $18 bn a year by 2025.
Infrastructure in global context
Infrastructure spending as a % of Asia Pacific, LHS
a % of world, RHSInfrastructure spending as
0.8%
0.7%
0.6%
0.5%
0.4%
0.3%
0.2%
0.1%
0.0%
0.30%
0.25%
0.20%
0.15%
0.10%
0.05%
0.00%
2006 2008 2010 2012 2014 2016 2018 2020 2022 2024
Singapore versus peers
Forecast
70
60
50
40
30
20
1002006 2008 2010 2012 2014 2016 2018 2020 2022 2024
Total infrastructure spending per year, $bn
Rail projects are a key driver of investment growth in Singapore with a doubling of the metro system by 2030, contributing to an estimated $16 bn to be spent over the coming decades. Manufacturing and social infrastructure are also expected to see growth in investment.
Transportation infrastructure investment
Forecast7
6
5
4
3
2
1
02006 2008 2010 2012 2014 2016 2018 2020 2022 2024
$bn per year, current prices
PortsAirportsRailRoads
Infrastructure spending by broad sector$bn per year, current prices
20
18
16
14
12
10
8
6
4
2
02005 2015 2025
SocialTransport and commsManufacturingOther utilityPowerExtraction
Singapore MalaysiaNew ZealandThailand
Source: Oxford Economics Source: Oxford Economics
Source: Oxford Economics Source: Oxford Economics
Forecast Forecast

8 PwC
Thailand
There is positive outlook for increase in infrastructure investment in Thailand which is expected to reach $58.5 bn by 2025. Thailand’s share of total global spending will rise in the near term due to the expected high speed rail project but will be broadly stable over the longer term.
Infrastructure in global context
Infrastructure spending as a % of Asia Pacific, LHS
Infrastructure spending as a % of world, RHS
1.6%
1.4%
1.2%
1.0%
0.8%
0.6%
0.4%
0.2%
0.0%
0.8%
0.7%
0.6%
0.5%
0.4%
0.3%
0.2%
0.1%
0.0%2006 2008 2010 2012 2014 2016 2018 2020 2022 2024
Thailand versus peers
Forecast300
250
200
150
100
50
02006 2008 2010 2012 2014 2016 2018 2020 2022 2024
Total infrastructure spending per year, $bn
Investment is expected to grow across all sectors in Thailand. An ambitious high-speed rail project under construction, which is expected to cost $32 bn over 7 years, shall project significant spending in the transportation sector.
Transportation infrastructure investment
Forecast12
10
8
6
4
2
02006 2008 2010 2012 2014 2016 2018 2020 2022 2024
$bn per year, current prices
Infrastructure spending by broad sector$bn per year, current prices
70
60
50
40
30
20
10
02005 2015 2025
SocialTransport and commsManufacturingOther utilityPowerExtraction
Thailand MalaysiaSingaporeSouth Korea
PortsAirportsRailRoads
Source: Oxford Economics Source: Oxford Economics
Source: Oxford Economics Source: Oxford Economics

9South East Asian Outlook to 2025
Vietnam
Vietnam has strong prospects for economic growth but bears significant infrastructure challenges. Its infrastructure spending is expected to top $56 bn by 2025 with growth rate of around 9% a year which is in line with the regional growth.
Infrastructure in global context
Infrastucture spending as a % of Asia Pacific, LHS
Infrastructure spending as a % of world, RHS
Forecast1.2%
1.0%
0.8%
0.6%
0.4%
0.2%
0.0%
0.7%
0.6%
0.5%
0.4%
0.3%
0.2%
0.1%
0.0%2006 2008 2010 2012 2014 2016 2018 2020 2022 2024
Vietnam versus peers
Forecast60
50
40
30
20
10
02006 2008 2010 2012 2014 2016 2018 2020 2022 2024
Total infrastructure spending per year, $bn
Growth is expected across all infrastructure sectors in the economy of Vietnam. Significant investment is expected in the transportation and manufacturing sectors.
Transportation infrastructure investment
Forecast18
16
14
12
10
8
6
4
2
02006 2008 2010 2012 2014 2016 2018 2020 2022 2024
$bn per year, current prices
PortsAirportsRailRoads
Infrastructure spending by broad sector$bn per year, current prices
60
50
40
30
20
10
02005 2015 2025
SocialTransport and commsManufacturingOther utilityPowerExtraction
VietnamMalaysiaNew ZealandPhilippines
Source: Oxford Economics Source: Oxford Economics
Source: Oxford Economics Source: Oxford Economics

10 PwC

11South East Asian Outlook to 2025
SingaporeMark Rathbone Asia Pacific Leader Capital Projects and Infrastructure +65 6236 4190 [email protected]
IndonesiaRizal Satar Partner +62 21 528 90350 [email protected]
MalaysiaDatuk Mohd Anwar Yahya Senior Executive Director +603 2173 1811 [email protected]
PhilippinesRose Javier Partner +63 (2) 459 3016 [email protected]
ThailandCharles Ostick Partner +66 (0)2 344 1167 [email protected]
VietnamJohnathan Ooi Partner +84 8 3824 0126 [email protected]
Contacts

© 2014 PwC LLP. All rights reserved. In this document, “PwC” refers to PricewaterhouseCoopers LLP which is a member firm of PricewaterhouseCoopers International Limited, each member firm of which is a separate legal entity.