Embed Size (px)
Citation preview

THIS REPORT WAS PREPARED BY CATARINA FERNANDES, A MASTERS IN FINANCE STUDENT OF THE NOVA SCHOOL OF BUSINESS AND
ECONOMICS, EXCLUSIVELY FOR ACADEMIC PURPOSES. THIS REPORT WAS SUPERVISED BY ROSÁRIO ANDRÉ WHO REVIEWED THE
VALUATION METHODOLOGY AND THE FINANCIAL MODEL. (SEE DISCLOSURES AND DISCLAIMERS AT END OF DOCUMENT)
See more information at WWW.NOVASBE.PT Page 1/54
MASTERS IN FINANCE
EQUITY RESEARCH
0
50
100
150
200
250
Vodacom vs JALSH
Vodacom Group JALSH Index
We recommend selling Vodacom Group given our price
target of R121.21 per share, which corresponds to a downside
potential of 8% comparing with the current market price.
Vodacom has shown consistent good performance.
Special emphasis goes to solid execution demonstrated in the
results from 1H14, as well as proved ability for cost control.
Positive economic prospects make the International
segment an attractive opportunity to seek a larger customer base
and higher data penetration. Current International data revenue is
4x higher than two years ago.
Challenges remain mostly in South Africa, which accounts
for 82% of Group’s revenue. Macroeconomic environment is not
appealing, given estimate of 2% for real GDP growth in 2013. The
relatively mature sector, characterized by four resilient players, is
passing through a business focus and pricing transformation
towards more accessible data and equipment to customers.
Enforcement of important regulatory measures is to
happen until March 2014. The impact on Vodacom’s revenues is
significant, should ICASA officially approve the draft MTR path.
Contingent on this regulatory outcome is Vodacom’s intentions to
increase capex which come in the sequence of Vodafone’s Project
Spring investment plan.
Regulatory approval is also on hold for the Neotel
acquisition by Vodacom.
Company Description
Vodacom operates in five African countries as a mobile operator: South Africa, Tanzania, Mozambique, DRC and Lesotho. In terms of market share, it occupies the first or second places in every market it operates. Its main shareholder is Vodafone Group.
VODACOM GROUP COMPANY REPORT
TELECOMMUNICATIONS 6 JANUARY 2014
STUDENT: CATARINA FERNANDES [email protected]
A success story turns expensive
Too many challenges in South Africa
Recommendation: SELL
Vs Previous Recommendation HOLD
Price Target FY15: R121.21
Vs Previous Price Target R123.16
Price (as of 6-Jan-14) R131.30
Bloomberg: VOD:SJ
52-week range (ZAR) 100.66-134.33
Market Cap (mZAR) 196,409.93
Outstanding Shares (m) 1,487.954
Dividend indicated Gross Yield 6.25%
Source: Bloomberg
Source: Bloomberg
(Values in ZAR millions) 2013 2014E 2015F
Revenues 69,917 74,014 78,247
EBITDA 25,253 27,267 28,478
EBITDA growth 11% 8% 4%
EBITDA margin 36% 37% 36%
EBIT 18,897 20,018 20,287
Net profit 13,224 13,468 13,424
EPS (cents) 887 904 901
DPS 805 819 812
P/E 11.6 12.6 16.2
EV/EBITDA 6.7 6.9 7.6
EV/Sales 2.4 2.5 3.1
Net Debt to EBITDA 0.3 0.5 0.6
Net Debt to Equity 37.3% 54.4% 66.2%
Dividend Yield 7.4% 6.6% 6.5%
ROE 69.9% 63.5% 59.3%
ROIC 52,4% 51.4% 43.3%
Source: Company’s reports, Analyst’s estimates
VODACOM GROUP COMPANY REPORT
PAGE 2/54
Page 3
Page 4
Page 7
Page 9
Page 11
Page 13
Page 32
Page 37
Page 39
Page 41
Page 43
Page 45
Page 50
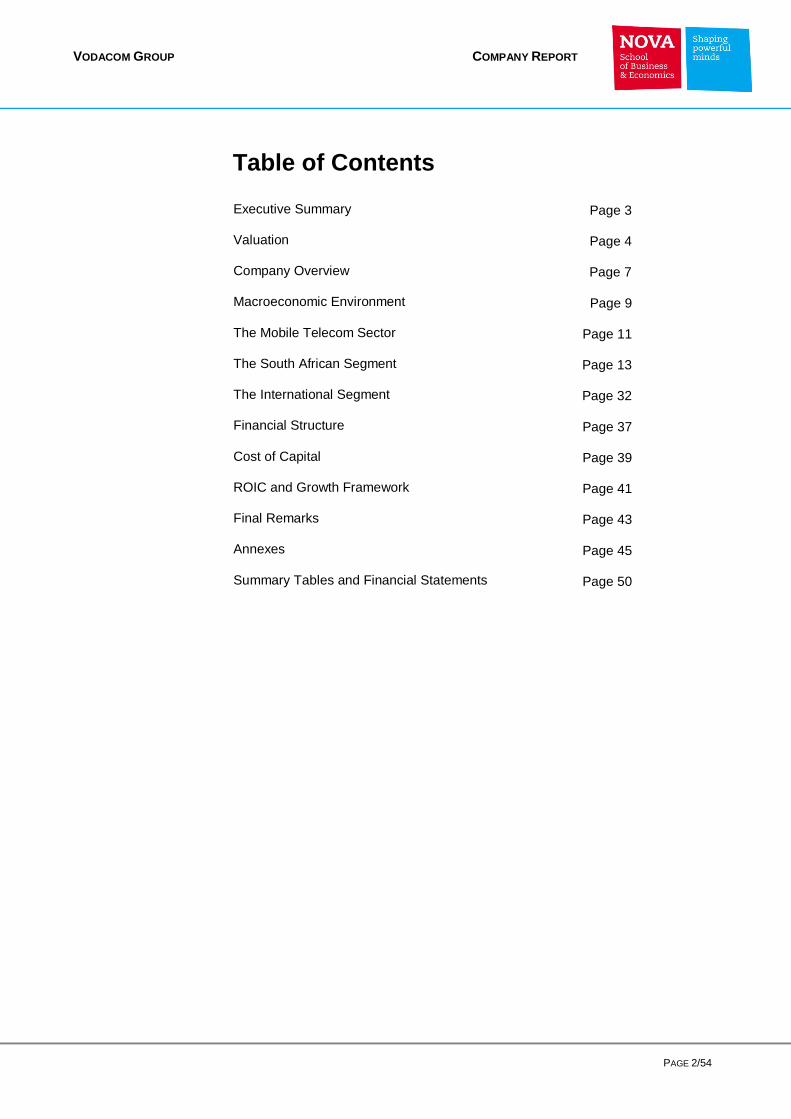
Table of Contents
Executive Summary
Valuation
Company Overview
Macroeconomic Environment
The Mobile Telecom Sector
The South African Segment
The International Segment
Financial Structure
Cost of Capital
ROIC and Growth Framework
Final Remarks
Annexes
Summary Tables and Financial Statements

VODACOM GROUP COMPANY REPORT
PAGE 3/54
Executive Summary
Vodacom is a leading mobile operator with current operations in South Africa and
other four African countries. The most relevant market is South Africa, being
responsible for 89% of the Group’s EBITDA. As of 2013, the total revenue of the
company was R70 billion.
The macroeconomic environment in South Africa is concerning, especially taking
into account the company’s exposure. According to international estimates, real
GDP growth will not go beyond 3.5% in the medium-term, while the inflation rate
will maintain approximately around 5%.
The mobile telecom market is characterized by high penetration rates (over
140%) in a 50 million universe of South Africans. It is also defined by fierce
competition with currently 4 players. Prices have been showing declining trends,
resulting in voice revenue deterioration, which constitutes the bulk of service
revenue. Recent results on data and equipment revenue are encouraging (joy
21% and 41% growth rates for the semester ending in September 2013) but poor
economic outlook, hurdles posed by competition and regulatory risk on the MTR
outcome limit their upside potential.
The International markets are exciting, both due to macroeconomic growth
prospects, as well as because they are in the beginning of the process of data
penetration. We expect two-digit growth in the foreseeable future.
The change in business focus from traditional revenue streams such as voice
and messaging to data and equipment revenue imply new challenges in terms of
capital expenditures and net working capital. The provision of qualified data
services is directly related to long-term success. We believe capex intensity will
increase in line with the 14%-17% medium-term guidance of management, and
together with more investment in working capital, will put pressure on cash flows
and ROIC.
In this context, we believe debt will increase accordingly. This should not be
worrying given Vodacom’s strong financial position with a current market debt-to-
equity ratio of 8%. The cost of capital is around 10% for the Group.
Good performance until now is making the company expensive, while
undervaluing some of the risks inherent to the business. Therefore we deliver a
recommendation to SELL and a target price of R121.61.

VODACOM GROUP COMPANY REPORT
PAGE 4/54
Exhibit 2: Terminal as percentage
of total value for each part
Valuation
This valuation was performed based on nominal values and is denominated in
rands for all business segments, thus implicitly considering South Africa’s
inflation rate. The explicit period is until 2020.
Vodacom Group was evaluated through the sum of the parts (SOTP) of each
geographical operation. The constituents are South Africa (SA), Tanzania,
Democratic Republic of Congo (DRC), Mozambique, Lesotho, Gateway,
Corporate and Eliminations1 and Vodacom Business Africa. Each segment
except the latter was valued through the Free Cash Flow to the Firm - Discounted
Cash Flow model. Vodacom Business Africa was evaluated through EV/EBITDA
multiple2. Tanzania, DRC, Mozambique, Lesotho and Gateway comprise the
International segment for forecasting purposes.
The Free Cash Flows (FCF) were discounted to March 2014 and then their future
values were computed so that the price target referred to the date one year from
now (this is December 2014). The same principle applies to terminal values.
While the sum of the Group’s discounted free cash flows (DFCF) represent
about 30% of total enterprise value (R201.6 bn), Group’s terminal value
represents approximately 70% (Exhibit 1). Terminal value representation in each
segment’s total value is depicted in Exhibit 2. The South African terminal value is
not so representative when compared to the ones in the International. The latter’s
representation is over 100% in the majority of countries because the sum of
DFCF is actually negative3.
South Africa’s terminal value is naturally the largest contributor to the Group’s
long-term value (85%), while Lesotho, Corporate and non-operational value
represent minor sources. Gateway is assumed to have no terminal value4. Its
decomposition by segment can be seen in Exhibit 3.
For every part related to the operations of a specific country5 we discounted the
cash flows and terminal values at its respective WACC6. For Group-related cash
flows such as the tax adjustment or non-operational net assets, we discounted at
1 Corporate comprises of the holding companies of the Group which do not relate to specific segments. 2 The company considers Vodacom Business Africa within the International segment but no revenue segmentation is performed. Because of that, we do not include this business in our forecast and we rather perform a separate multiple valuation. 3 This is mainly due to high capital expenditures (capex) needs. 4 Gateway Telecommunications was bought in 2008 and sold in 2012. Its DFCF corresponds to residual figures thus not impacting the long-term forecast dimension of our valuation. 5 For Gateway, given its diversified presence, we chose to discount its cash flows at South Africa’s WACC. 6 Weighted Average Cost of Capital
South Africa 66%
Tanzania 104%
DRC 114%
Mozambique 105%
Lesotho 94%
Gateway 0%
Corporate 50%
Tax Adjustment 56%
Non-Operational Value
50%
61.386 31%
133.748 69%
DFCF Terminal value
Exhibit 1: Sum of Group's (DFCF) and respective Teminal value - value (mZAR) and proportion (%)

VODACOM GROUP COMPANY REPORT
PAGE 5/54
155
160
165
170
175
180
185
190
195
200
205
Exhibit 4: Each part contribution to enterprise value (bnZAR)
a Group’s WACC7. Value contribution to total enterprise value can be seen in
Exhibit 4.
The debt considered to compute the equity value is the book value of debt,
including interest bearing debt and provisions8. The company has 1,487,954,000
shares which imply a price target for the next 12 months of R121.219,
representing a downside potential of 8%.
7 This WACC is an average weighted by the value from operations of each part. 8 The company does not have publicly traded debt. Hence we considered book value of debt as a proxy for its market value. We believe this a fair approximation given the floating nature of the majority of Vodacom’s debt, and assuming default risk will remain stable in the future. 9 If we include dividend remuneration for the financial year 2014 it is 128.27, still corresponding to a “sell” recommendation.
85%
4% 3%
4%
1% 0% 0% 2%
1%
South Africa
Tanzania
DRC
Mozambique
Lesotho
Gateway
Corporate
Tax Adjustment
Non-Operational Value
Exhibit 3: Each part's terminal value percentual contribution to Group's terminal value

VODACOM GROUP COMPANY REPORT
PAGE 6/54
In Exhibit 5 we summarize the financial data regarding the valuation.
Exhibit 5: Valuation SOTP for December 2014
mZAR DFCF Terminal value Total
Operational Value South Africa 57 889 114 351 172 240
Tanzania (205) 5 819 5 614
DRC (419) 3 347 2 928
Mozambique (236) 5 136 4 900
Lesotho 51 778 829
Gateway 688 0 688
Corporate 278 275 553
Total 58 046 129 706 187 752
Tax Adjustment 2 518 3 228 5 747
Non-Operational Value 821 814 1 635
Value from operations 61 386 133 748 195 134
Vodacom Busines Africa
6 480
TOTAL ENTERPRISE VALUE 201 614
Interest Bearing Debt
21 258
Equity Value
180 356
PRICE PER SHARE
121,21
Price @ 6-Jan-2014
132
Return potential
-8,2%

VODACOM GROUP COMPANY REPORT
PAGE 7/54
Company overview
Description
Vodacom Group Ltd is the leading mobile operator in South Africa. Although the
big bulk of revenue comes from this country, the company has tried to diversify
its operations, with a current presence in other African markets such as
Tanzania, the Democratic Republic of Congo, Mozambique and Lesotho. Exhibit
6 shows the service revenue decomposition by country, where South Africa has a
clear representation accounting for 81% of revenues, followed by Tanzania with
only 7%.
The company’s core services are voice, messaging and data, which are all
available on either contract, prepaid or top up10
. Together with Interconnect11
,
these services represent 78% of the Group’s total revenue. Vodacom also offers
financial services such as M-Pesa, allowing customers to transfer money. Other
service revenue is constituted mainly by enterprise converged services12
(in
South Africa, Vodacom Business provides them). An important (non-service)
revenue stream is the sale of equipment such as mobile cell phones, dongles or
tablets which have been gaining increased importance due to smartphone
diffusion. Other non-service revenue includes for example the sale of prepaid
starter packs and contract SIM cards. Exhibit 9 quantifies this information as
percentage of total revenue.
It is important to refer that in financial year 2010, Gateway was restructured and
divided into Business and non-Business services. Vodacom Business Africa was
then formed as a spin-off from the Gateway acquisition by incorporating Gateway
Business. In August 2012, the carrier services were sold but Vodacom Business
Africa was a kept as a strategic bridge to countries where Vodacom’s core
business is not present. Business Africa is the International counterpart of
Vodacom Business in SA and is currently present in 8 countries, including high-
growth potential countries such as Nigeria and Zambia.
Shareholder structure
Vodafone Group Plc controls Vodacom Group and owns 65% of the issued
shares through Vodafone Holdings SA (Pty) Limited and Vodafone Investments
10 Top up is a hybrid between contract and prepaid options which allows a contract customer to buy additional airtime when the one included in the package for which she assigned for runs out. Topping up is done through any Vodacom Prepaid recharge voucher. 11 Revenue that comes from the tariff paid by other operators when a call is terminated in Vodacom’s network. 12 Converged services is the trend for different technologies to evolve towards performing similar tasks, where mobile and fixed voice, messaging, data and video are aggregated to share resources and functions. Examples of converged services are VoIP, IPTV, Mobile TV, Smart TV, etc.
81%
7% 4%
3% 1% 3% South Africa
Tanzania
DRC
Mozambique
Lesotho
Other
Exhibit 6: Service revenue decomposition by country (FY2013)
50,6%
8,6%
4,9%
14,3%
6,4% 14,1%
1,1% Voice
Interconnect
Messaging
Data
Other servicerevenueEquipment
Non-servicerevenue
Exhibit 7: Revenue decomposition by service/product (FY2013)

VODACOM GROUP COMPANY REPORT
PAGE 8/54
SA (Pty) Limited. Vodafone Group Plc is incorporated and domiciled in the United
Kingdom. The government of South Africa owns 13.9% of Vodacom Group’s
while the Public Investment Corporation (PIC)13
, owns 3,16% of shares. The
remaining shares (18%) are on free float.
The last divestment occurred in late-2008 when Vodafone Group agreed to
increase its stake from 50% to 65% upon Telkom’s14
decision to sell its
investment in Vodacom Group (with the remain of the shares becoming listed on
the Johannesburg Stock Exchange). It is our belief that the current shareholder
structure suggests no further modification for the foreseeable future.
Government’s direct and indirect position in Vodacom may represent a strategic
standpoint to achieve the goals included in the National Broadband Policy
(NBP)15
, but not as direct as in Telkom. Nevertheless, we believe its minor stake
does not have the power to overlap Vodafone’s influence, in case there is conflict
of shareholders’ interest.
Vodacom Group has different shareholdings due to its international presence. It
owns 93.75% of Vodacom South Africa Pty Ltd, 82.2% of Vodacom Tanzania
Ltd16
, 51% of Vodacom Congo, 85% of Vodacom Mozambique and 88% of
Vodacom Lesotho Pty Ltd17
.
In regards to Vodacom SA, the remaining 6.25% shareholding comes from a
Broad-Based Black Economic Empowerment (BBBEE) transaction performed in
2008, in order to comply with the Codes of Good Practice on BBBEE. The broad-
based BEE exists to empower the historically disadvantaged black South
Africans at all levels of the South African economy, including companies’
ownership. A company named YeboYethu was created for this purpose to allow
black people, black controlled groups and Vodacom’s black business partners
(collectively known as “Black Public”), as well as all Vodacom SA’s staff (through
YeboYethu Employees’ Stock Option Plan) to have a participation in Vodacom
SA. YeboYethu owns 3.44% of Vodacom SA’s shares and together with Thebe18
and Royal Bafokeng19
they own 6.25%. The whole structure is summarized in
Annex 1.
13 PIC is wholly owned by the South African government and invests funds on the behalf of public sector identities 14 Main fixed-line services provider in South Africa. It was the first national operator. 15 Main objective is to provide universal broadband access by 2020. It is a top Department of Communications’ priority with expected implementation next year and temporal horizon for 2020. 16 On past November 26, Vodacom Group agreed to increase its stake in Vodacom Tanzania from 65% to 82.2%. The shares were bought from Cavalry Holdings, a private investment company and indirect shareholder of Tanzania, for ZAR 2.46 billion in cash. It remains with a 17.8% stake through Mirambo Ltd. 17 Minor shareholders are described as follows: Cavalry (17.8%) in Tanzania; Congolese Wireless Networks (49%) in DRC; Emotel (2%), Intelec Holdings (6.5%) and Whatana Investments (6.5%) in Mozambique; and Sekha-Metsi Consortium (12%) in Lesotho. 18 Thebe Investment Corporation which is a black-owned company 19 An investment company that manages the assets of a 150,000 community of black South Africans
VODACOM GROUP COMPANY REPORT
PAGE 9/54
18%
20%
22%
24%
26%
12,0
12,5
13,0
13,5
14,0
14,5
People employed (M)
Unemployment rate
Exhibit 11: Employment and unemployment rate
Source: Government of South Africa
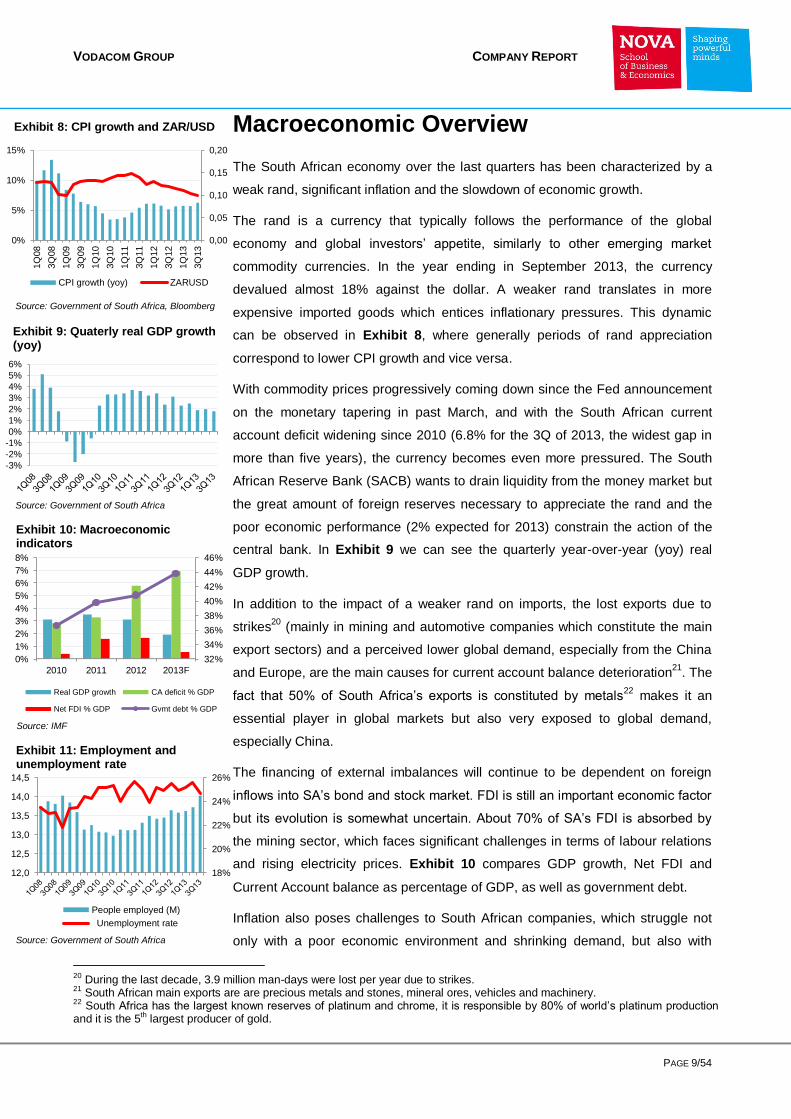
Macroeconomic Overview
The South African economy over the last quarters has been characterized by a
weak rand, significant inflation and the slowdown of economic growth.
The rand is a currency that typically follows the performance of the global
economy and global investors’ appetite, similarly to other emerging market
commodity currencies. In the year ending in September 2013, the currency
devalued almost 18% against the dollar. A weaker rand translates in more
expensive imported goods which entices inflationary pressures. This dynamic
can be observed in Exhibit 8, where generally periods of rand appreciation
correspond to lower CPI growth and vice versa.
With commodity prices progressively coming down since the Fed announcement
on the monetary tapering in past March, and with the South African current
account deficit widening since 2010 (6.8% for the 3Q of 2013, the widest gap in
more than five years), the currency becomes even more pressured. The South
African Reserve Bank (SACB) wants to drain liquidity from the money market but
the great amount of foreign reserves necessary to appreciate the rand and the
poor economic performance (2% expected for 2013) constrain the action of the
central bank. In Exhibit 9 we can see the quarterly year-over-year (yoy) real
GDP growth.
In addition to the impact of a weaker rand on imports, the lost exports due to
strikes20
(mainly in mining and automotive companies which constitute the main
export sectors) and a perceived lower global demand, especially from the China
and Europe, are the main causes for current account balance deterioration21
. The
fact that 50% of South Africa’s exports is constituted by metals22
makes it an
essential player in global markets but also very exposed to global demand,
especially China.
The financing of external imbalances will continue to be dependent on foreign
inflows into SA’s bond and stock market. FDI is still an important economic factor
but its evolution is somewhat uncertain. About 70% of SA’s FDI is absorbed by
the mining sector, which faces significant challenges in terms of labour relations
and rising electricity prices. Exhibit 10 compares GDP growth, Net FDI and
Current Account balance as percentage of GDP, as well as government debt.
Inflation also poses challenges to South African companies, which struggle not
only with a poor economic environment and shrinking demand, but also with
20 During the last decade, 3.9 million man-days were lost per year due to strikes. 21 South African main exports are are precious metals and stones, mineral ores, vehicles and machinery. 22 South Africa has the largest known reserves of platinum and chrome, it is responsible by 80% of world’s platinum production and it is the 5th largest producer of gold.
32%
34%
36%
38%
40%
42%
44%
46%
0%
1%
2%
3%
4%
5%
6%
7%
8%
2010 2011 2012 2013F
Real GDP growth CA deficit % GDP
Net FDI % GDP Gvmt debt % GDP
Exhibit 10: Macroeconomic indicators
0,00
0,05
0,10
0,15
0,20
0%
5%
10%
15%
1Q
08
3Q
08
1Q
09
3Q
09
1Q
10
3Q
10
1Q
11
3Q
11
1Q
12
3Q
12
1Q
13
3Q
13
Chart Title
CPI growth (yoy) ZARUSD
Exhibit 8: CPI growth and ZAR/USD
-3%
-2%
-1%
0%
1%
2%
3%
4%
5%
6%
Exhibit 9: Quaterly real GDP growth (yoy)
Source: Government of South Africa
Source: Government of South Africa, Bloomberg
Source: IMF

VODACOM GROUP COMPANY REPORT
PAGE 10/54
-2,8% -3,4%
-6,3% -6,1% -6,1% -5,9% -5,8% -5,8% -5,7% -7%
-6%
-5%
-4%
-3%
-2%
-1%
0%
Exhibit 13: Current account balance as percentage of GDP forecast
rising labour costs, inflexible labour legislation and a government that is criticized
to be over protector when it comes to employees’ interests. During last years, the
unemployment rate has maintained its very high levels (24.7% in 3Q13 versus
23.1% in 3Q08 as shown in Exhibit 11). People employed in social services
currently represent 22.4% of the total people employed in Community and Social
Services, only closely followed by Trade with 22.1%23
.
On the social sphere, there are significant improvements but still some
challenges. Positive facts are the enlargement of the black middle class, which
has grown from 1.7M in 2004 to 4.2M people in 2012, and the decline in the
share of population with no education from 19.1% in 1996 to 8.6% in 2011.
Negative facts include social inequality, which is one of the highest in the world24
and corruption25
.
Notwithstanding, South Africa still remains the African country that is
institutionally most developed compared with the majority of African countries. It
has advanced financial and banking institutions and the most liquid stock
exchange26
. In fact South Africa ranks 3rd
among 148 countries on the financial
market development metric27
. These conditions appeal to common foreign
investors. Economic forecasts show a slight improvement of the situation as
economic growth is expected to increase (Exhibit 12), thus improving the
Current Account balance as percentage of GDP (Exhibit 13), and as inflation is
expected to slow down (Exhibit 14).
23 Data referring to the third quarter of 2013. Source: Government of South Africa 24 The Gini Coefficient (last available value) for South Africa is 63.1 (2009), higher than Tanzania (37.6, 2007), DRC (44.4, 2006), Mozambique (45.7, 2008), Lesotho (52.5, 2003), UK (30, 1999) or United States (40.8, 2000). Source: World Bank 25 South Africa’s perceived corruption continues to increase. The Corruption Perceptions Index by Transparency International classified South Africa as 72nd in a ranking of 177 countries, versus 69th in 2012. The value of the index is 42 in a range of 0-100 (where 0 means the public sector is totally corrupt). 26 South African GDP structure is leaned towards services, where banking activity is included. It represents 67.9% of GDP, while industry represents 29.7% and Agriculture 2.4%. 27 World Economic Forum’s Global Competitive Index 2013-2014.
2,5%
2,0%
2,9% 3,3% 3,4% 3,5% 3,5% 3,5% 3,5%
0%
1%
2%
3%
4%
5%
Exhibit 12: Real GDP growth forecast
5,7% 5,9% 5,5%
5,1% 5,0% 5,0% 5,0% 4,8% 4,8%
0%
1%
2%
3%
4%
5%
6%
7%
8%
Exhibit 14: Average CPI forecast
Source: IMF
Source: IMF
Source: IMF

VODACOM GROUP COMPANY REPORT
PAGE 11/54
The Telecom Mobile Sector
The South African telecom market is composed by four major players: Vodacom,
MTN, Cell C and Telkom Mobile28
. In Exhibit 15 we can see how they are
positioned in terms of subscriber market share, with Vodacom occupying the
leading position (44%), followed by MTN with 37%, then Cell C which has 17%
and Telkom Mobile with a very small position. Vodacom and MTN are listed
companies, as well as Telkom.
The mobile communications began in 1993 when the government granted MTN
and Vodacom spectrum licenses. By the time, Vodacom was a partnership
between Vodafone, the British mobile operator, and Telkom, the main fixed
operator in South Africa. In 2009 Telkom sold its investment in Vodacom to start
investing in its own 3G network. In mid-2010 it launched 8ta, the brand
associated with Telkom Mobile services and with a current market share of 2%.
Cell C is the third player which came into telecom business in late 2001. Cell C
had a 50% stake in Virgin Mobile South Africa, which is a mobile virtual network
operator (MVNO). MVNO are characterized by not owning a wireless network
infrastructure and usually they enter into agreements with mobile network
operators (MNO). In 2011 Cell C sold its stake in Virgin Mobile to the UK parent
Virgin Group but remained Virgin Mobile’s network partner. Taking advantage of
no regulation in the MVNO market, Cell C announced in June 2013 its plans to
set up an MVNE (Mobile Virtual Network Enabler) to help companies that are
interested in launching MVNO services in SA. In August, the French telecom
Orange has also announced its plans to enter the SA mobile market as an
MVNO.
The other MVNO in SA is Red Bull Mobile, which also uses Cell C’s network. At
end of June 2013, Red Bull Mobile and Virgin Mobile South Africa reported
120,000 and 4000,000 customers respectively.
The market is regarded as very mature with a mobile penetration rate of 135%
and a total mobile subscriber base of 69 million as of 2013. Exhibit 16 shows
penetration rates of various countries as of 2008 and 2012, which demonstrates
South Africa placed amongst the countries with the highest values, being directly
comparable to developed markets such as the UK (131%), Germany (131%) or
Singapore (153%). The telecom sector is considered to be one of the most
innovative and rapidly growing. This perception is mainly due to the operators’
ability to target audiences, as well as marketing power next to masses. This
28 Cell C’s shareholders are Oger Telecom SA (60%), Lanun Securities SA (15%) and CellSAF Ltd (25%). Major MTN shareholders are Nedcor Bank (21%), Standard Bank (33%), First National (16%) and Absa (9%).
54% 49% 45% 47% 44%
33% 36% 36% 36% 37%
13% 15% 16% 15% 17%
3% 2% 2%
0%
20%
40%
60%
80%
100%
2009 2010 2011 2012 2013
Vodacom MTN Cell C Telkom Mobile
Exhibit 15: South African telecom mobile market
-5%
0%
5%
10%
15%
20%
25%
-50
0
50
100
150
200
An
go
la
DR
C
Le
so
tho
Mo
za
mb
iqu
e
So
uth
Afr
ica
Ta
nzan
ia
Bra
zil
Unite
d S
tate
s
Chin
a
Sin
ga
po
re
Tu
rke
y
Russia
Ind
on
esia
Ge
rman
y
Po
rtu
ga
l
UK
2007 2012 CAGR
Exhibit 16: Mobile-cellular subscriptions per 100 inhabitants
Source: ITU World Telecommunications/ICT Indicators Database
VODACOM GROUP COMPANY REPORT
PAGE 12/54
contrasts with high churn levels within the sector, mainly because of the prepaid
nature of the market. Vodacom has a churn rate of 50%, Cell C of 66% and MTN
around 60%. Reducing these high figures are key in order to lock up revenue and
decrease the cost and disruption of churn.
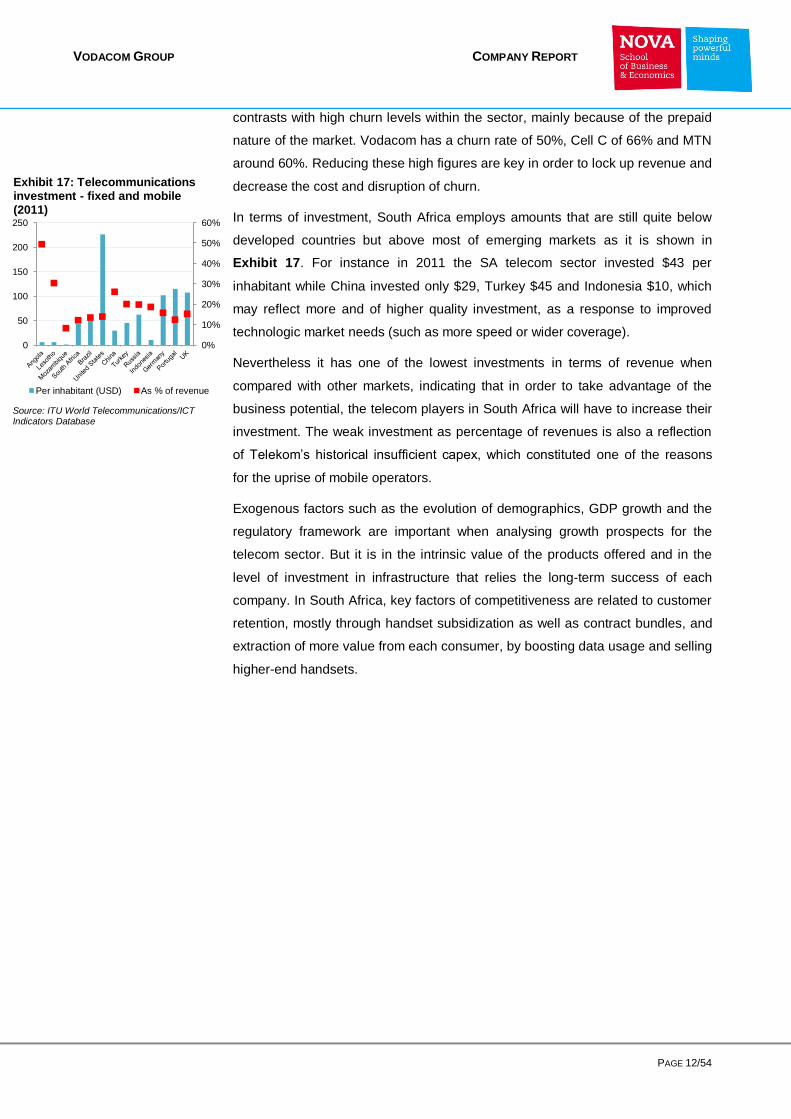
In terms of investment, South Africa employs amounts that are still quite below
developed countries but above most of emerging markets as it is shown in
Exhibit 17. For instance in 2011 the SA telecom sector invested $43 per
inhabitant while China invested only $29, Turkey $45 and Indonesia $10, which
may reflect more and of higher quality investment, as a response to improved
technologic market needs (such as more speed or wider coverage).
Nevertheless it has one of the lowest investments in terms of revenue when
compared with other markets, indicating that in order to take advantage of the
business potential, the telecom players in South Africa will have to increase their
investment. The weak investment as percentage of revenues is also a reflection
of Telekom’s historical insufficient capex, which constituted one of the reasons
for the uprise of mobile operators.
Exogenous factors such as the evolution of demographics, GDP growth and the
regulatory framework are important when analysing growth prospects for the
telecom sector. But it is in the intrinsic value of the products offered and in the
level of investment in infrastructure that relies the long-term success of each
company. In South Africa, key factors of competitiveness are related to customer
retention, mostly through handset subsidization as well as contract bundles, and
extraction of more value from each consumer, by boosting data usage and selling
higher-end handsets.
0%
10%
20%
30%
40%
50%
60%
0
50
100
150
200
250
Per inhabitant (USD) As % of revenue
Exhibit 17: Telecommunications investment - fixed and mobile (2011)
Source: ITU World Telecommunications/ICT Indicators Database

VODACOM GROUP COMPANY REPORT
PAGE 13/54
The South African Segment
The mobile services have been developing a relevant role in South Africa for
contextual factors. The insufficient service quality provided by the main fixed line
operator, Telkom29
, led to a relatively fast emancipation of mobile operators.
In line with a maturing process felt in the mobile market, Vodacom’s average
revenue per user (ARPU) has a tendency to become flat or even decrease as
depicted in Exhibits 18 and 19, while usage has a tendency to increase. In a
context of intensifying competition, the current challenge for mobile telecoms in
terms of ARPU is to compensate the decreasing proportion of Voice in the
overall ARPU composition while trying to extract more value through data
penetration in current voice-only customers.
However, deducting pricing conclusions from the ARPU is not straightforward
because it ignores different product trends – the revenue streams coming from
Voice, SMS, Data or Equipment present different behaviors and different
prospective evolutions. ARPU can actually increase even with price decreases, if
for example there are more SIM card disconnections, if there is a higher usage
across all products or even if the company decides to clean up active customer
registrations, as it happened in FY11.
Voice
First we take a look at the generation of voice revenues. Although accounting for
approximately 60% of service revenues, voice revenues have suffered lower
growth rates over last years (Exhibit 20). In order to understand this trend we
look at the main KPIs of this revenue stream. The main drivers are the average
price per minute (APPM) and the outgoing minutes which can be decomposed in
Minutes of Usage (MoU30
) and the number of active susbcribers.
For a cumulative annual decline in the growth rate for FY09-13 of 10.1% in
Vodacom’s APPM, there was a corresponding 14.3% increase in outgoing
minutes (Exhibit 21). This means that although usage growth more than offset
price declines, it was not sufficient to create consistent growth for overall voice
revenues (CAGR for the period is 2.8%).
The more aggressive APPM declines (2-digit negative growth rate) were from
FY11 onwards, which coincided with the entrance of Telkom Mobile in the mobile
market as the fourth operator in October 2010, and with the MTR cuts which
29 While the number of fixed (wired)-broadband subscriptions per 100 inhabitants is 25.6 in Europe, 15.7 in the Americas and 7.0 in Asia and Pacific, in South Africa is 2.7. This is evidence of weak coverage, high prices or both. Source: ITU 30 MoU designates total traffic (incoming and outgoing minutes) divided by the average monthly active customers.
133 132
182 156
136 139 155
137 124
111
0
50
100
150
200
2009 2010 2011 2012 2013
Vodacom ARPU MTN ARPU
Exhibit 18: Vodacom vs MTN ARPU (ZAR)
174 164 162 156
140 126 127 133 127 125 127
101 95 92 96 82 73 74 80 76 74 74
0
50
100
150
200
Total ARPU Prepaid
Exhibit 19: ARPU (ZAR)
8% 13%
18%
19% 8% 2%
-7% -12%
-13% -8%
-0,50
0,00
0,50
1,00
1,50
2,00
0
5
10
15
20
25
30
2009 2010 2011 2012 2013
Average Outgoing Minutes (bn)
APPM (ZAR)
yoy growth (%)
Exhibit 21: Outgoing minutes, APPM and respective yoy growth rates
5% 4% 3% -1%
-10%
0%
10%
20%
30%
40%
50%
60%
70%
24
25
26
27
28
29
30
2009 2010 2011 2012 2013
Voice revenues yoy growth
as % of SR
Exhibit 20: Voice revenue (bnZAR), yoy growth rate and its represetation in service revenue
VODACOM GROUP COMPANY REPORT
PAGE 14/54
54% 49%
45% 47% 44%
40% 38%
46%
37%
50%
0%
10%
20%
30%
40%
50%
60%
0
5
10
15
20
25
30
35
2009 2010 2011 2012 2013
Average Monthly Active CustomersSubscriber Market ShareChurn (%)
Exhibit 22: Customer base (M), churn and market share
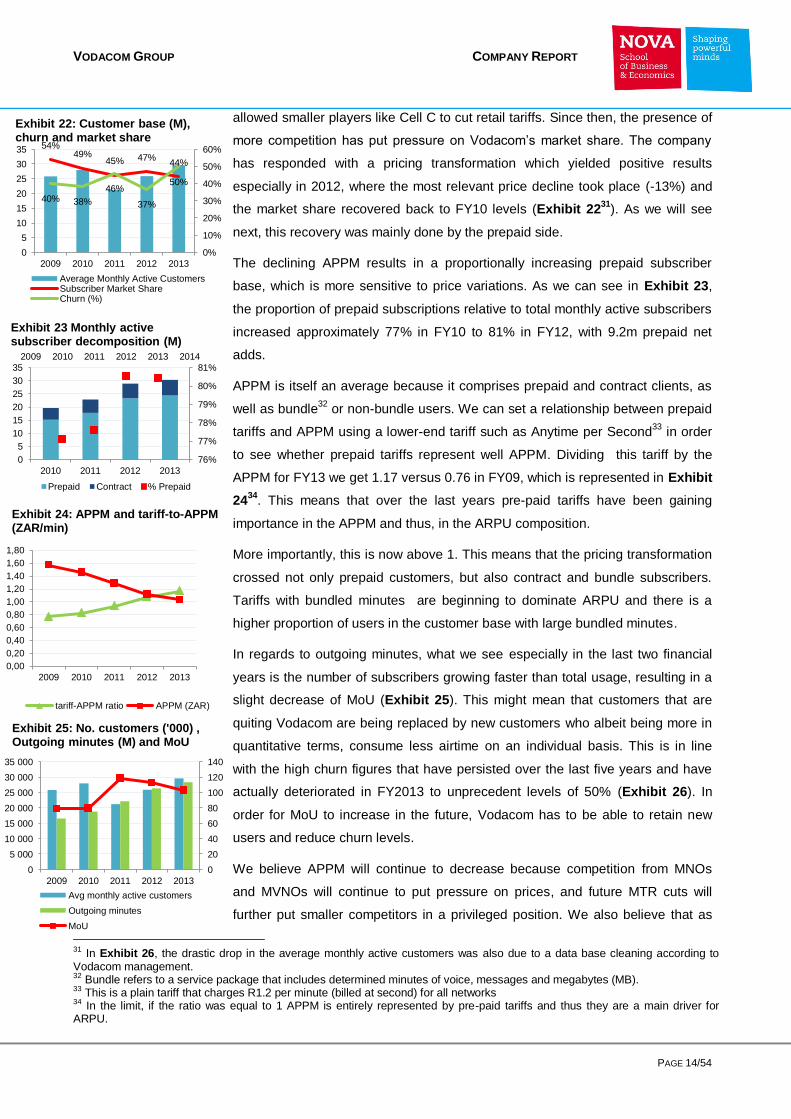
allowed smaller players like Cell C to cut retail tariffs. Since then, the presence of
more competition has put pressure on Vodacom’s market share. The company
has responded with a pricing transformation which yielded positive results
especially in 2012, where the most relevant price decline took place (-13%) and
the market share recovered back to FY10 levels (Exhibit 2231
). As we will see
next, this recovery was mainly done by the prepaid side.
The declining APPM results in a proportionally increasing prepaid subscriber
base, which is more sensitive to price variations. As we can see in Exhibit 23,
the proportion of prepaid subscriptions relative to total monthly active subscribers
increased approximately 77% in FY10 to 81% in FY12, with 9.2m prepaid net
adds.
APPM is itself an average because it comprises prepaid and contract clients, as
well as bundle32
or non-bundle users. We can set a relationship between prepaid
tariffs and APPM using a lower-end tariff such as Anytime per Second33
in order
to see whether prepaid tariffs represent well APPM. Dividing this tariff by the
APPM for FY13 we get 1.17 versus 0.76 in FY09, which is represented in Exhibit
2434
. This means that over the last years pre-paid tariffs have been gaining
importance in the APPM and thus, in the ARPU composition.
More importantly, this is now above 1. This means that the pricing transformation
crossed not only prepaid customers, but also contract and bundle subscribers.
Tariffs with bundled minutes are beginning to dominate ARPU and there is a
higher proportion of users in the customer base with large bundled minutes.
In regards to outgoing minutes, what we see especially in the last two financial
years is the number of subscribers growing faster than total usage, resulting in a
slight decrease of MoU (Exhibit 25). This might mean that customers that are
quiting Vodacom are being replaced by new customers who albeit being more in
quantitative terms, consume less airtime on an individual basis. This is in line
with the high churn figures that have persisted over the last five years and have
actually deteriorated in FY2013 to unprecedent levels of 50% (Exhibit 26). In
order for MoU to increase in the future, Vodacom has to be able to retain new
users and reduce churn levels.
We believe APPM will continue to decrease because competition from MNOs
and MVNOs will continue to put pressure on prices, and future MTR cuts will
further put smaller competitors in a privileged position. We also believe that as
31 In Exhibit 26, the drastic drop in the average monthly active customers was also due to a data base cleaning according to Vodacom management. 32 Bundle refers to a service package that includes determined minutes of voice, messages and megabytes (MB). 33 This is a plain tariff that charges R1.2 per minute (billed at second) for all networks 34 In the limit, if the ratio was equal to 1 APPM is entirely represented by pre-paid tariffs and thus they are a main driver for ARPU.
2009 2010 2011 2012 2013 2014
76%
77%
78%
79%
80%
81%
0
5
10
15
20
25
30
35
2010 2011 2012 2013
Prepaid Contract % Prepaid
Exhibit 23 Monthly active subscriber decomposition (M)
0,00
0,20
0,40
0,60
0,80
1,00
1,20
1,40
1,60
1,80
2009 2010 2011 2012 2013
tariff-APPM ratio APPM (ZAR)
Exhibit 24: APPM and tariff-to-APPM (ZAR/min)
0
20
40
60
80
100
120
140
0
5 000
10 000
15 000
20 000
25 000
30 000
35 000
2009 2010 2011 2012 2013
Avg monthly active customers
Outgoing minutes
MoU
Exhibit 25: No. customers ('000) , Outgoing minutes (M) and MoU

VODACOM GROUP COMPANY REPORT
PAGE 15/54
79%
80%
81%
82%
83%
84%
85%
40%
45%
50%
55%
60% % p
rep
aid
su
bscrib
ers
Mark
et
sh
are
in
pre
paid
Vodacom Prepaid MS
MTN Contract MS
Vodacom % prepaid
Exhibit 27: Subscriber market share
0
20
40
60
80
100
120
0
20
40
60
80
100
120
MTN Vodacom MOU Vodacom
Exhibit 28 Prepaid ARPU and MoU (M)
business focus leans towards data and as voice becomes a more saturated
market, price wars are likely to concentrate in the data segment.
We consider that in the medium term Minutes of Usage (MoU) will be comparable
to the parent Vodafone’s figure, as South African prospective IT penetration and
social preferences converge to the figures of more developed countries in the
forthcoming years. Customer base growth will be in line with population growth,
the stabilization of SA’s penetration rates and a progressive compression of
Vodacom’s market share.
We identify two main downside risks in this trend: the extent to which prices will
continue to decrease presentes unlimited potential due to the competitive
environment felt in SA, while the airtime usage demanded by each customer may
become more elastic, especially in the prepaid segment. Also, more exposure to
prepaid customers may pose more challenges. While camouflaging short-term
market share problems by taking advantage of price sensitivity, customer
retention may be compromised, in what concernc both the number of subscribers
(which so far is not a concern since it has been actually increasing) and the
usage per customer (MoU), which may see trouble to improve if customers keep
being constantly renewed.
Prepaid:
In this section we analyse the prepaid and contract segments in a more detailed
temporal perspective. Vodacom has been gaining market share in the prepaid
segment, as well as changing its customer base mix for the last quarters as a
result of the aforementioned pricing transformation.
In Exhibit 2735
, we can see a growing prepaid market share reaching 55% in the
third quarter of 2013 and a growing prepaid proportion within Vodacom’s
customer base, reaching 82% in the same quarter. This means that Vodacom
has not been able to make the contract segment accompany the prepaid
movement being directly reflected in the increase of the contract market share for
MTN, Vodacom’s main competitor.
In the last quarters we deduce that Vodacom’s APPM for the prepaid segment
has considerably declined. We do not have access to the prepaid APPM because
prepaid outgoing minutes are not disclosed (only MoU) but if we look at prepaid
ARPU and prepaid MoU for the last six quarters (Exhibit 28), we observe a
stabilization of the first figure and an increase of the last one, meaning that the
increased usage has been able to compensate for the price declines. In fact, the
results presentation for the semester ending in September 30 disclosed an
35 This graphic is not totally accurate given the lack information disclosed in regards to Cell C and Telkom Mobile customers. It uses the sum of Vodacom and MTN subscribers. Still it is useful to get a sense of the trends Vodacom is facing.
40% 38%
46%
37%
50%
0
5
10
15
20
25
30
35
0%
10%
20%
30%
40%
50%
60%
2009 2010 2011 2012 2013
Average monthly active customers
Churn (%)
Exhibit 26: Churn rates and number of customers (M)
VODACOM GROUP COMPANY REPORT
PAGE 16/54
1 151
2 013
1 477
1 972
( 253) ( 319) ( 308)
84
843
(1 000)
( 500)
0
500
1 000
1 500
2 000
2 500
MTN Vodacom
Exhibit 29: Prepaid Net Adds
-20%
-10%
0%
10%
20%-20%
-10%
0%
10%
20%
Prepaid APPM change
Prepaid MOU change
Exhibit 30: Sequential growth in APPM and MoU
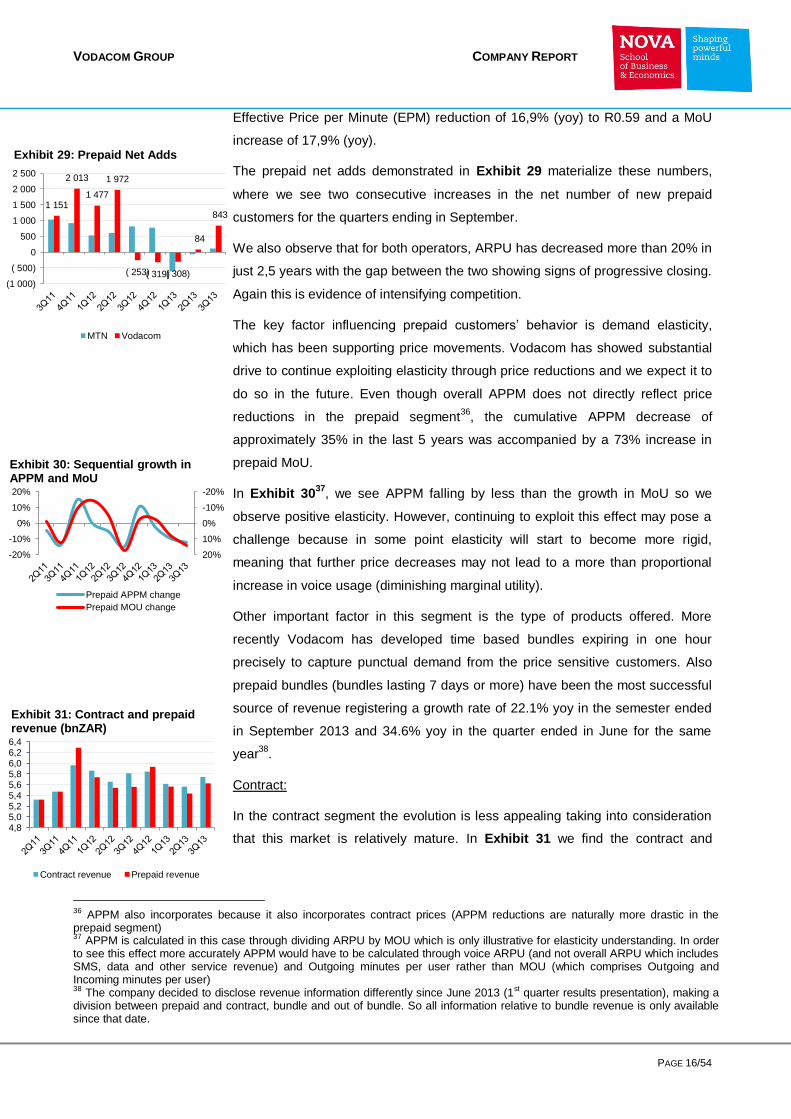
Effective Price per Minute (EPM) reduction of 16,9% (yoy) to R0.59 and a MoU
increase of 17,9% (yoy).
The prepaid net adds demonstrated in Exhibit 29 materialize these numbers,
where we see two consecutive increases in the net number of new prepaid
customers for the quarters ending in September.
We also observe that for both operators, ARPU has decreased more than 20% in
just 2,5 years with the gap between the two showing signs of progressive closing.
Again this is evidence of intensifying competition.
The key factor influencing prepaid customers’ behavior is demand elasticity,
which has been supporting price movements. Vodacom has showed substantial
drive to continue exploiting elasticity through price reductions and we expect it to
do so in the future. Even though overall APPM does not directly reflect price
reductions in the prepaid segment36
, the cumulative APPM decrease of
approximately 35% in the last 5 years was accompanied by a 73% increase in
prepaid MoU.
In Exhibit 3037
, we see APPM falling by less than the growth in MoU so we
observe positive elasticity. However, continuing to exploit this effect may pose a
challenge because in some point elasticity will start to become more rigid,
meaning that further price decreases may not lead to a more than proportional
increase in voice usage (diminishing marginal utility).
Other important factor in this segment is the type of products offered. More
recently Vodacom has developed time based bundles expiring in one hour
precisely to capture punctual demand from the price sensitive customers. Also
prepaid bundles (bundles lasting 7 days or more) have been the most successful
source of revenue registering a growth rate of 22.1% yoy in the semester ended
in September 2013 and 34.6% yoy in the quarter ended in June for the same
year38
.
Contract:
In the contract segment the evolution is less appealing taking into consideration
that this market is relatively mature. In Exhibit 31 we find the contract and
36 APPM also incorporates because it also incorporates contract prices (APPM reductions are naturally more drastic in the prepaid segment) 37 APPM is calculated in this case through dividing ARPU by MOU which is only illustrative for elasticity understanding. In order to see this effect more accurately APPM would have to be calculated through voice ARPU (and not overall ARPU which includes SMS, data and other service revenue) and Outgoing minutes per user rather than MOU (which comprises Outgoing and Incoming minutes per user) 38 The company decided to disclose revenue information differently since June 2013 (1st quarter results presentation), making a division between prepaid and contract, bundle and out of bundle. So all information relative to bundle revenue is only available since that date.
4,85,05,25,45,65,86,06,26,4
Contract revenue Prepaid revenue
Exhibit 31: Contract and prepaid revenue (bnZAR)

VODACOM GROUP COMPANY REPORT
PAGE 17/54
0
50
100
150
200
250
0
100
200
300
400
500
1Q
11
2Q
11
3Q
11
4Q
11
1Q
12
2Q
12
3Q
12
4Q
12
1Q
13
2Q
13
3Q
13
MTN Vodacom
MOU Vodacom
Exhibit 32: Contract ARPU (ZAR) and MoU
prepaid revenue39
both showing evidence of some cyclicality, with the second
half of the year being stronger than the firt halfs.
In Exhibit 32, a slight negative trend in MOU and ARPU over the last quarters
was verified, coinciding with an increasing market share by MTN in this segment.
Despite the existing opportunity of exploring data penetration in contract plans,
the high saturation presents a challenge for an uptake in this segment.
In terms of new customers, we see in Exhibit 33 that net contract additions for
Vodacom have been shy in the last quarters, especially comparing with MTN,
which according to the analysis performed ahead actually practices higher prices.
This may be a source of concern because, although contract customers
represent only 16% of Vodacom’s customer base, it represents roughly half of
total service revenues40
.
In terms of existing customers, there are currently 64% of Vodacom’s contract
revenue that comes from bundles41
which demonstrates upside for migration
from non-integrated to integrated plans. This is important to prompt data usage
amongst contract users. In fact, Vodacom’s last results presentation announced
a 41.8% of contracts changing to Red or Smart, which are the most popular
contract bundles.
In Exhibit 34, we see the monthly tariff for the Red plan with roughly the same
characteristics42
across different countries where Vodafone is present. The table
shows that Vodacom has the highest monthly fee from this universe (rouhly
73eur per month). Although ignoring inflation and purchasing power parity among
these countries, the illustration of this comparison leads one to believe there is
also room for price decreases in South Africa, especially considering that Red
Advantage is the most accessible plan within the Red plans.
39 These figures are proxies as they are the product of given KPIs such as ARPU and number of customers (the company did not
disclose this kind of information until June 2013, when it changed the disclosure framework). 40 Based on numbers disclosed in September 2013. 41 Contract revenue is a figure that was only revealed from June 2013 onwards, in line with the new disclosure by the company. 42 We prioritized the subplans within Red that included 1G of data and a device included, generally iPhone 4S; for those with no device included it is because that option is not available
( 707)
925
( 841)
( 10)
16 59 24 8 14
-1000-800-600-400-200
0200400600800
1000
MTN Vodacom
Exhibit 33: Contract Net Adds
VODACOM GROUP COMPANY REPORT
PAGE 18/54
Exhibit 34: Vodafone Red Tariff
Vodafone UK
Vodafone Australia
Vodafone Portugal
Vodafone Egypt
Vodafone Turkey
Vodacom SA
Red $65 Red Red + Red Basic Red Classic Red Advantage
∞ min ∞ SMS 1G data With device
∞ min ∞ SMS 3G data With device
∞ min ∞ SMS 1G data Without device
2000 min to Vodafone + 300 to any number 1000 SMS 1G Without device
1000 min 1000 SMS 1G data With device
700 min ∞ SMS 1G data With device
EUR 39 EUR 65 EUR 40 EUR 16 EUR 64 EUR 73
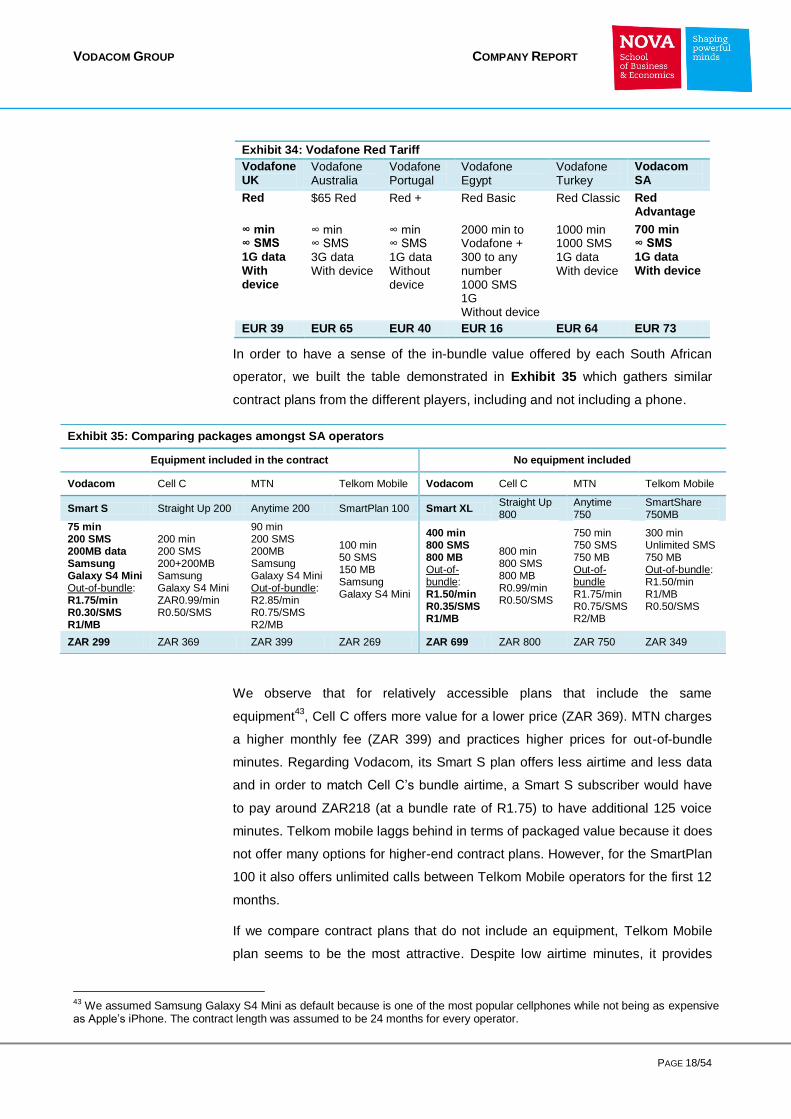
In order to have a sense of the in-bundle value offered by each South African
operator, we built the table demonstrated in Exhibit 35 which gathers similar
contract plans from the different players, including and not including a phone.
We observe that for relatively accessible plans that include the same
equipment43
, Cell C offers more value for a lower price (ZAR 369). MTN charges
a higher monthly fee (ZAR 399) and practices higher prices for out-of-bundle
minutes. Regarding Vodacom, its Smart S plan offers less airtime and less data
and in order to match Cell C’s bundle airtime, a Smart S subscriber would have
to pay around ZAR218 (at a bundle rate of R1.75) to have additional 125 voice
minutes. Telkom mobile laggs behind in terms of packaged value because it does
not offer many options for higher-end contract plans. However, for the SmartPlan
100 it also offers unlimited calls between Telkom Mobile operators for the first 12
months.
If we compare contract plans that do not include an equipment, Telkom Mobile
plan seems to be the most attractive. Despite low airtime minutes, it provides
43 We assumed Samsung Galaxy S4 Mini as default because is one of the most popular cellphones while not being as expensive as Apple’s iPhone. The contract length was assumed to be 24 months for every operator.
Exhibit 35: Comparing packages amongst SA operators
Equipment included in the contract No equipment included
Vodacom Cell C MTN Telkom Mobile Vodacom Cell C MTN Telkom Mobile
Smart S Straight Up 200 Anytime 200 SmartPlan 100 Smart XL Straight Up 800
Anytime 750
SmartShare 750MB
75 min 200 SMS 200MB data Samsung Galaxy S4 Mini Out-of-bundle: R1.75/min R0.30/SMS R1/MB
200 min 200 SMS 200+200MB Samsung Galaxy S4 Mini ZAR0.99/min R0.50/SMS
90 min 200 SMS 200MB Samsung Galaxy S4 Mini Out-of-bundle: R2.85/min R0.75/SMS R2/MB
100 min 50 SMS 150 MB Samsung Galaxy S4 Mini
400 min 800 SMS 800 MB Out-of-bundle: R1.50/min R0.35/SMS R1/MB
800 min 800 SMS 800 MB R0.99/min R0.50/SMS
750 min 750 SMS 750 MB Out-of-bundle R1.75/min R0.75/SMS R2/MB
300 min Unlimited SMS 750 MB Out-of-bundle: R1.50/min R1/MB R0.50/SMS
ZAR 299 ZAR 369 ZAR 399 ZAR 269 ZAR 699 ZAR 800 ZAR 750 ZAR 349
VODACOM GROUP COMPANY REPORT
PAGE 19/54
30%
40%
50%
60%
70%
80%
90%
100%
0,00
0,20
0,40
0,60
0,80
1,00
1,20
1,40
MTR peak MTR off-peak
Premium to MTR
Exhibit 36: MTR (ZAR/min) in SA
Exhibit 37: MTR path
increased value in data usage while maintaining a very low price. Even paying an
extra ZAR333 at a out-of-bundle rate of R1.50 to match Cell C’s bundle it still is
the most attractive offer. In this type of bundle Vodacom does not offer much
airtime minutes as the other operators and it does not have a low out-of-bundle
rate, making this plan relatively less attractive.
Vodacom has more variety in the products offered with a lot of TopUp
possibilities, but it holds back when compared to Cell C, which practices lower
prices with more straightforward and better terms, such as the 99c per minute per
second billing for any network, at any time, in or out of bundle.
Integrated bundles with a contract are a way to address sensitivity to economic
pressure, and the consequent negative impact on ARPU. Including a device in
the contract that is cheaper comparing with an equivalent option on prepaid is a
way not only to give incentive to data consumption but also to raise loyalty next to
operators. Albeit saturated, we believe the contract market is key to make
revenue more solid, especially at the current moment where smartphone
penetration is gaining momentum.
We believe there is still potential to be further explored in terms of price declines,
variety of products offered and contract terms. The present risk for Vodacom is to
let the existent opportunities in the contract segment be overshadowed by the
increasing exposure to the prepaid market.
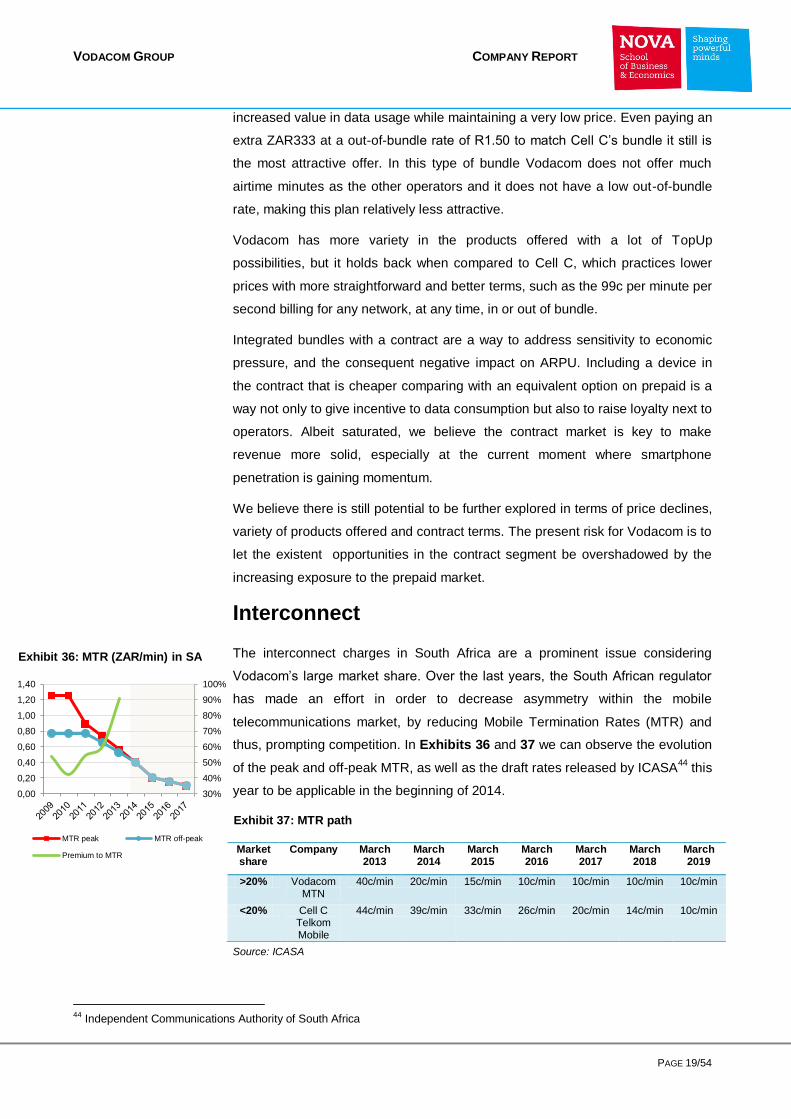
Interconnect
The interconnect charges in South Africa are a prominent issue considering
Vodacom’s large market share. Over the last years, the South African regulator
has made an effort in order to decrease asymmetry within the mobile
telecommunications market, by reducing Mobile Termination Rates (MTR) and
thus, prompting competition. In Exhibits 36 and 37 we can observe the evolution
of the peak and off-peak MTR, as well as the draft rates released by ICASA44
this
year to be applicable in the beginning of 2014.
Source: ICASA
44 Independent Communications Authority of South Africa
Market share
Company March 2013
March 2014
March 2015
March 2016
March 2017
March 2018
March 2019
>20% Vodacom MTN
40c/min 20c/min 15c/min 10c/min 10c/min 10c/min 10c/min
<20% Cell C Telkom Mobile
44c/min 39c/min 33c/min 26c/min 20c/min 14c/min 10c/min

VODACOM GROUP COMPANY REPORT
PAGE 20/54
0,0%
0,0%
-3,1%
-5,5%
-8,4% -9%
-8%
-7%
-6%
-5%
-4%
-3%
-2%
-1%
0%
1%
-5,0
-4,5
-4,0
-3,5
-3,0
-2,5
-2,0
-1,5
-1,0
-0,5
0,0
0,5
2009 2010 2011 2012 2013
Lost Interconnect at 2009 constant MTR
% Decrease in service revenue due to MTRcuts
Exhibit 39: MTR lost revenue (bnZAR) and impact on SR (%)
10,7
4,1
3
2,4
1,9
1,9
1,5
1,5
1,4
1,3
0,8
0 5 10 15
Brazil
Southa Africa
Switzerland
Russia
Spain
Germany
UK
Turkey
Morocco
Portugal
France
Exhibit 41: MTR in Euros by country
So far, interconnect revenue has suffered considerably: it has been decreasing
since 2010 (when MTR cuts start taking place) and annual negative growth rates
are above -10% in the last three financial years (Exhibit 38). A direct result was
the declining representativeness of Interconnect in overall service revenues from
19% in FY2009 to 10% in FY2013. Actually the company has been able to
compensate for lost revenue through the enhancement of other revenue streams
such as data while delivering service revenue growth.
Exhibit 39 provides a sense of the lost revenue in Interconnect for a 2009
constant termination rate. We can observe that the cumulative lost revenue
amounts to over R8 billion and that the service revenue (SR) percentage
decrease due to lost interconnect revenue reaches 8.4% in 2013.
Exhibit 36 also reveals the Premium to MTR, represented by the percentage of
how much the APPM is above the weighted average MTR (weighted by a 50/50
peak and off-peak proportion) over the last five years. Despite the decrease in
APPM, this premium is becoming increasingly more evident, which is manifested
by a current 90% level versus only 54% in 2009.
Other aspect to take into account is the regulator’s proposal for the level of
asymmetry45
between large operators, such as Vodacom or MTN, and small
operators as Cell C or Telkom, which will start from a current 10% level to one as
high as 160% in 2016. This means that not only Vodacom will see termination
rates suffering drastic cuts but also these cuts will be asymmetric in relation to
competition. The key implied outcome is that small competitiors gain margin to
make more aggressive pricing strategies. We can see this dynamics in Exhibit
40.
According to Vodacom, a reasonable value of asymmetry for which they could
accommodate is around 20%-25%. If the glide path proposal is approved, this
might compromise future capital expenditure and operating expenses46
. Currently
the MTR in South Africa are among the highest in several world countries
(Exhibit 41).
The decrease in MTR is also important in terms of the effect it can cause on
Voice revenues, as already mentioned: lower MTRs lead to more competition,
which is translated into tariff adjustments that are generally initiated by small
operators because they have additional flexibility. This in turn forces larger
operators to accompany price reductions which may lead to lower voice
revenues. The impact will be a function of the interplay between changes in retail
45 Asymmetry is measured by the percentage increase between how much large operators and small operators pay for MTR. 46 This is a source of concern for Vodacom’s management, constituting the reason why it is attempting to negotiate the glide path.
-25%
-20%
-15%
-10%
-5%
0%
0,0
1,0
2,0
3,0
4,0
5,0
Interconnect (ZAR) yoy growth
Exhibit 38: Interconnect revenue (bn) and growth rate
10%
95%
120%
160%
100%
40%
0%
26%
50%
25% 33%
0% 0% 0%
0%
50%
100%
150%
200%
0,00
0,10
0,20
0,30
0,40
0,50
2013 2014 2015 2016 2017 2018 2019
Average MTR (ZAR)
Asymmetry
% MTR cut
Exhibit 40: MTR and the level of asymmetry
VODACOM GROUP COMPANY REPORT
PAGE 21/54
tariffs (the way small and large operators react to others’ tariff adjustments),
changes in on-net/off-net traffic mix, price elasticity and shifts in market share
enter in the equation as well.
The quantification of MTR net impact is therefore quite complex and unclear. In
addition to this voice impact, it influences not only Interconnect revenue but also
interconnect costs. In FY13 Vodacom’s net interconnect in SA was +R1.3bn,
representing 5% of Group’s EBITDA. In spite of MTRs reduction by 23% from
FY12 to FY13 and the lost revenue mentioned, Vodacom SA’s net interconnect
actually increased by 18% yoy. This highlights the complexity of trying to predict
the ultimate impact of lower termination rates.
Although management is attempting to smooth this path we believe it will be
enforced and thus, we incorporate the MTR proposal as it is in our forecasts.
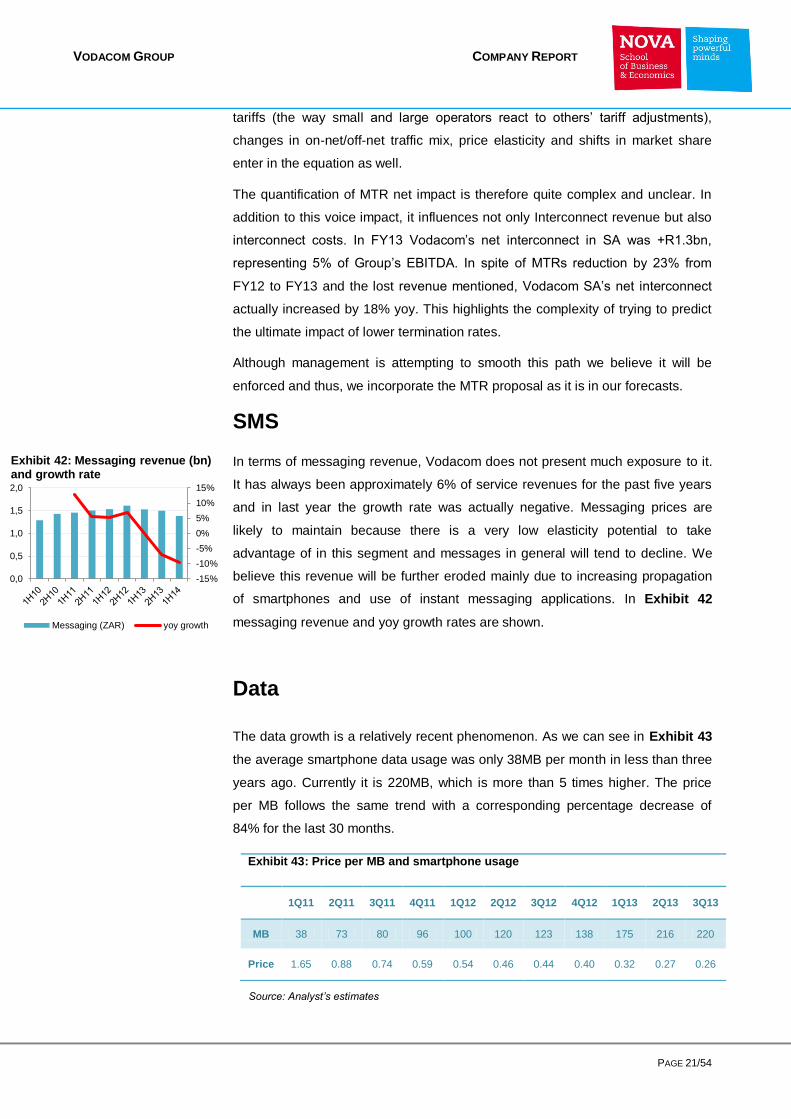
SMS
In terms of messaging revenue, Vodacom does not present much exposure to it.
It has always been approximately 6% of service revenues for the past five years
and in last year the growth rate was actually negative. Messaging prices are
likely to maintain because there is a very low elasticity potential to take
advantage of in this segment and messages in general will tend to decline. We
believe this revenue will be further eroded mainly due to increasing propagation
of smartphones and use of instant messaging applications. In Exhibit 42
messaging revenue and yoy growth rates are shown.
Data
The data growth is a relatively recent phenomenon. As we can see in Exhibit 43
the average smartphone data usage was only 38MB per month in less than three
years ago. Currently it is 220MB, which is more than 5 times higher. The price
per MB follows the same trend with a corresponding percentage decrease of
84% for the last 30 months.
Exhibit 43: Price per MB and smartphone usage
1Q11 2Q11 3Q11 4Q11 1Q12 2Q12 3Q12 4Q12 1Q13 2Q13 3Q13
MB 38 73 80 96 100 120 123 138 175 216 220
Price 1.65 0.88 0.74 0.59 0.54 0.46 0.44 0.40 0.32 0.27 0.26
-15%
-10%
-5%
0%
5%
10%
15%
0,0
0,5
1,0
1,5
2,0
Messaging (ZAR) yoy growth
Exhibit 42: Messaging revenue (bn) and growth rate
Source: Analyst’s estimates
VODACOM GROUP COMPANY REPORT
PAGE 22/54
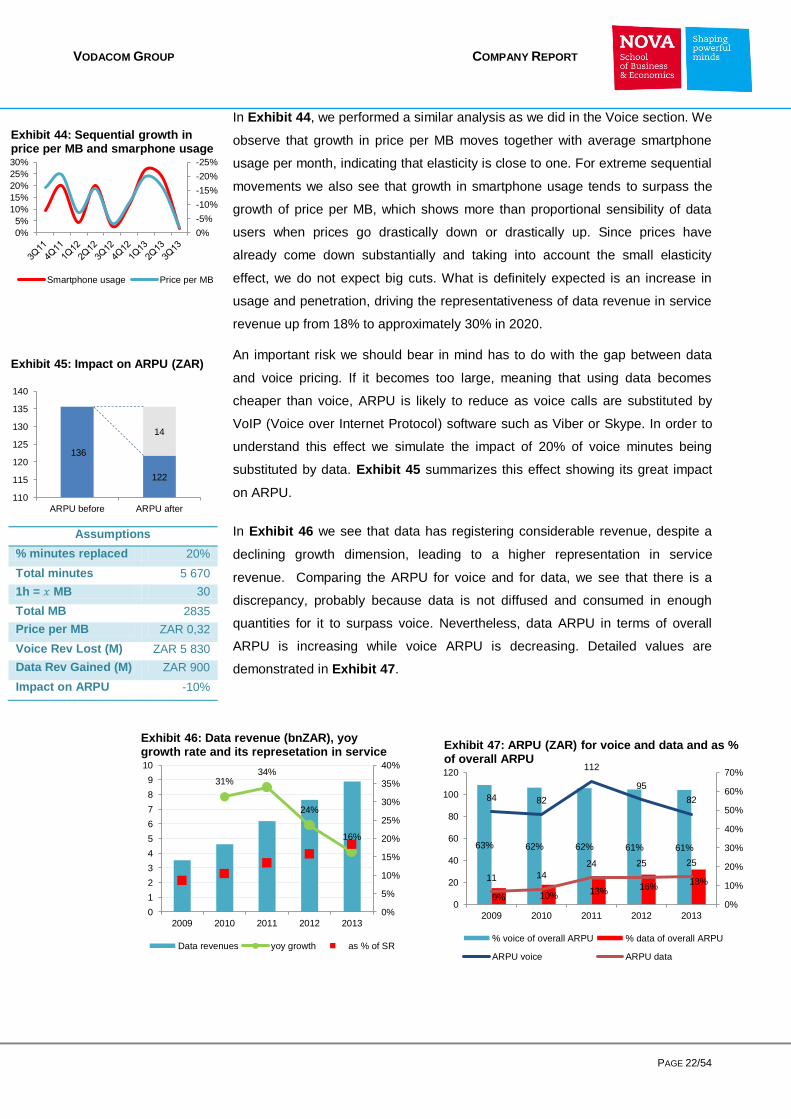
In Exhibit 44, we performed a similar analysis as we did in the Voice section. We
observe that growth in price per MB moves together with average smartphone
usage per month, indicating that elasticity is close to one. For extreme sequential
movements we also see that growth in smartphone usage tends to surpass the
growth of price per MB, which shows more than proportional sensibility of data
users when prices go drastically down or drastically up. Since prices have
already come down substantially and taking into account the small elasticity
effect, we do not expect big cuts. What is definitely expected is an increase in
usage and penetration, driving the representativeness of data revenue in service
revenue up from 18% to approximately 30% in 2020.
An important risk we should bear in mind has to do with the gap between data
and voice pricing. If it becomes too large, meaning that using data becomes
cheaper than voice, ARPU is likely to reduce as voice calls are substituted by
VoIP (Voice over Internet Protocol) software such as Viber or Skype. In order to
understand this effect we simulate the impact of 20% of voice minutes being
substituted by data. Exhibit 45 summarizes this effect showing its great impact
on ARPU.
In Exhibit 46 we see that data has registering considerable revenue, despite a
declining growth dimension, leading to a higher representation in service
revenue. Comparing the ARPU for voice and for data, we see that there is a
discrepancy, probably because data is not diffused and consumed in enough
quantities for it to surpass voice. Nevertheless, data ARPU in terms of overall
ARPU is increasing while voice ARPU is decreasing. Detailed values are
demonstrated in Exhibit 47.
Assumptions
% minutes replaced 20%
Total minutes 5 670
1h = MB 30
Total MB 2835
Price per MB ZAR 0,32
Voice Rev Lost (M) ZAR 5 830
Data Rev Gained (M) ZAR 900
Impact on ARPU -10%
-25%
-20%
-15%
-10%
-5%
0%0%
5%
10%
15%
20%
25%
30%
Smartphone usage Price per MB
Exhibit 44: Sequential growth in price per MB and smarphone usage
14
136
122
110
115
120
125
130
135
140
ARPU before ARPU after
Exhibit 45: Impact on ARPU (ZAR)
63% 62% 62% 61% 61%
9% 10% 13%
16% 18%
84 82
112
95
82
11 14
24 25 25
0%
10%
20%
30%
40%
50%
60%
70%
0
20
40
60
80
100
120
2009 2010 2011 2012 2013
% voice of overall ARPU % data of overall ARPU
ARPU voice ARPU data
Exhibit 47: ARPU (ZAR) for voice and data and as % of overall ARPU
31% 34%
24%
16%
0%
5%
10%
15%
20%
25%
30%
35%
40%
0
1
2
3
4
5
6
7
8
9
10
2009 2010 2011 2012 2013
Data revenues yoy growth as % of SR
Exhibit 46: Data revenue (bnZAR), yoy growth rate and its represetation in service

VODACOM GROUP COMPANY REPORT
PAGE 23/54
32% 32%
35%
29% 27%
21% 18%
17% 13%
0%
10%
20%
30%
40%
50%
60%
0
2
4
6
8
10
12
14
16
Active Data Users (M)
as % of total customers
yoy growth
Exhibit 50: Data users in SA
55%
41%
36%
29% 28% 29%
22%
0%
10%
20%
30%
40%
50%
60%
0
1
2
3
4
5
6
7
Active Smartphones (M)
as % of total customers
yoy growth
Exhibit 49: Smartphones in SA
Equipment
Boosting data usage among customers has been Vodacom’s strategic priority.
The approach to attain that is to make people buy more and better smartphones.
That is why data and equipment revenue have been following the same trend
(Exhibit 48).
The company has presented some remarkable results in regards to increasing
active smartphones and active data users. Growth rates on a yoy basis have
been consistently 2-digit in both figures. Exhibit 49 and 50 show the path for the
number of active smartphones and data users, as well as those figures as
percentage of total active customers. Roughly half of total subscriber base uses
data and only 22% of Vodacom’s subscribers holds a smartphone, leaving a lot
of room for improvement of data usage.
The evolution of smartphone penetration is impressive for the considered
temporal horizon but the majority of devices in place are of lower-end type
(approximately 50% are still Blackberry), translated in high-growing but still small
average data consumption. Regarding the first half results presentation, while
Vodacom in South Africa presents an average smartphone usage of
220MB/month, in Europe, Vodafone presents an average of 400MB.
Therefore, substituting low-end smartphones of existing customers by high-end
ones is key in order to fully explore the data momentum. Handset financing plays
a crucial role in this context, where we have still high priced devices. In the year
ending in September, 24% of new smartphones sold were through this financing
facility.
If we segregate the smartphone penetration in contract and prepaid segments,
the numbers are 50% in the first segment and 17% in the last one. In contract,
the figure is higher because handset financing is only available for contracts. On
prepaid, we see low penetration and low-end smartphones, revealing potential for
migration to contract.
Also in Exhibit 48, we can get a sense of the transformation in Vodacom’s
revenue mix, with data and equipment revenue gaining increasing importance
within total revenue, in contrast with voice, SMS or interconnect in accordance
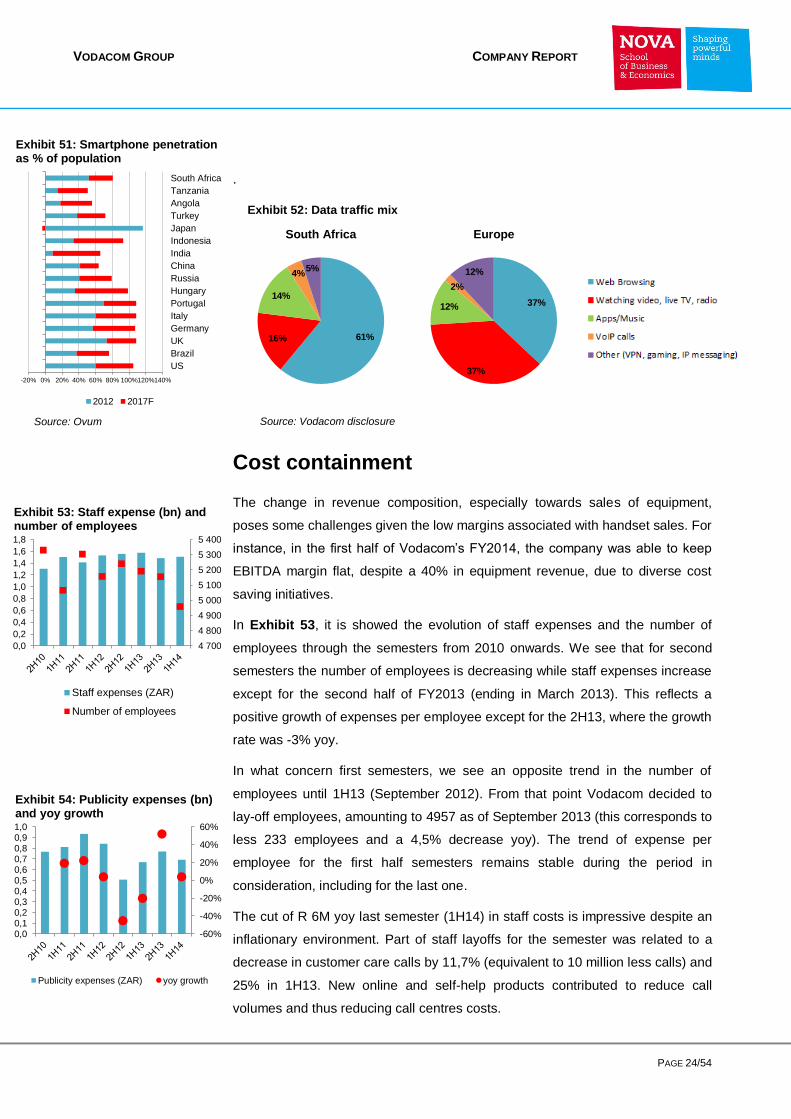
with what we saw earlier. This trend will intensify as smartphone penetration is
expected to increase in South Africa (Exhibit 51), as well as the data traffic mix
itself leans towards more data intensive (thus more expensive) activities such as
video/TV/radio (Exhibit 52)
0%
2%
4%
6%
8%
10%
12%
14%
16%
18%
0
2
4
6
8
10
12
2009 2010 2011 2012 2013
Data Equipment
% of TotRev % of TotRev
Exhibit 48: Data and equipment revenue (bnZAR) and as % of total SA revenue
VODACOM GROUP COMPANY REPORT
PAGE 24/54
Exhibit 52: Data traffic mix
-60%
-40%
-20%
0%
20%
40%
60%
0,00,10,20,30,40,50,60,70,80,91,0
Publicity expenses (ZAR) yoy growth
Exhibit 54: Publicity expenses (bn) and yoy growth
.
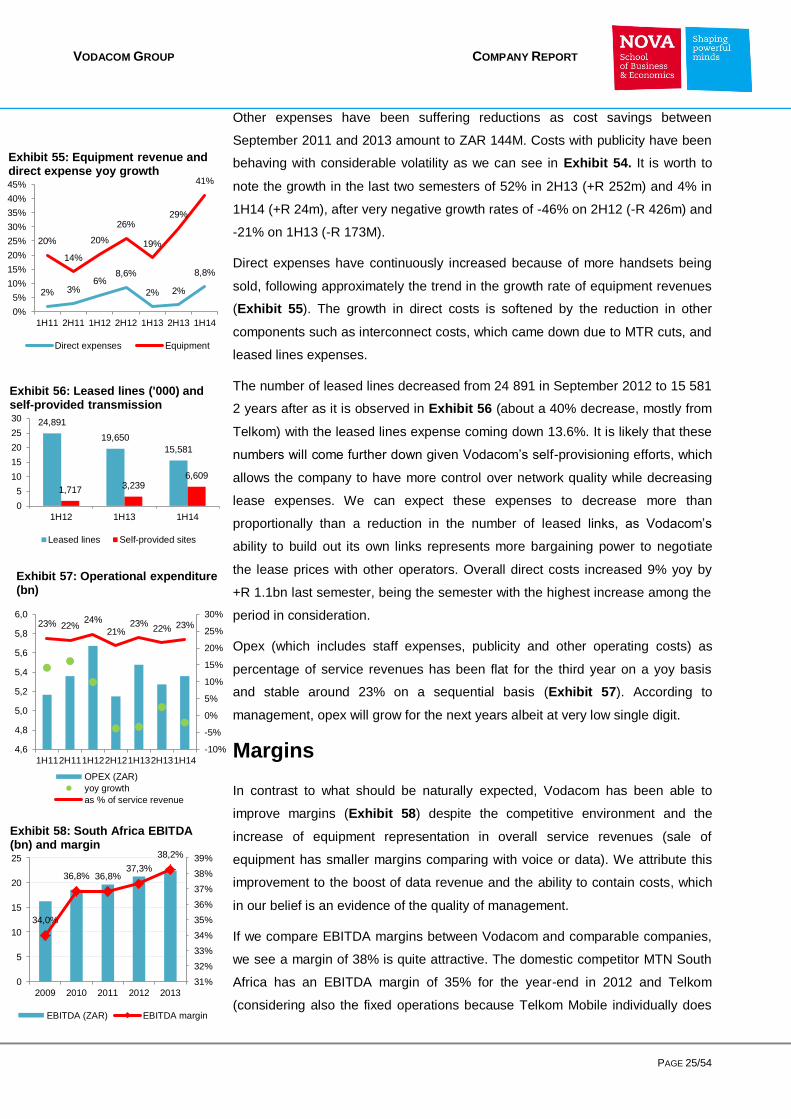
Cost containment
The change in revenue composition, especially towards sales of equipment,
poses some challenges given the low margins associated with handset sales. For
instance, in the first half of Vodacom’s FY2014, the company was able to keep
EBITDA margin flat, despite a 40% in equipment revenue, due to diverse cost
saving initiatives.
In Exhibit 53, it is showed the evolution of staff expenses and the number of
employees through the semesters from 2010 onwards. We see that for second
semesters the number of employees is decreasing while staff expenses increase
except for the second half of FY2013 (ending in March 2013). This reflects a
positive growth of expenses per employee except for the 2H13, where the growth
rate was -3% yoy.
In what concern first semesters, we see an opposite trend in the number of
employees until 1H13 (September 2012). From that point Vodacom decided to
lay-off employees, amounting to 4957 as of September 2013 (this corresponds to
less 233 employees and a 4,5% decrease yoy). The trend of expense per
employee for the first half semesters remains stable during the period in
consideration, including for the last one.
The cut of R 6M yoy last semester (1H14) in staff costs is impressive despite an
inflationary environment. Part of staff layoffs for the semester was related to a
decrease in customer care calls by 11,7% (equivalent to 10 million less calls) and
25% in 1H13. New online and self-help products contributed to reduce call
volumes and thus reducing call centres costs.
-20% 0% 20% 40% 60% 80% 100%120%140%
US
Brazil
UK
Germany
Italy
Portugal
Hungary
Russia
China
India
Indonesia
Japan
Turkey
Angola
Tanzania
South Africa
2012 2017F
Exhibit 51: Smartphone penetration as % of population
4 700
4 800
4 900
5 000
5 100
5 200
5 300
5 400
0,0
0,2
0,4
0,6
0,8
1,0
1,2
1,4
1,6
1,8
Staff expenses (ZAR)
Number of employees
Exhibit 53: Staff expense (bn) and number of employees
61% 16%
14%
4% 5%
South Africa
37%
37%
12%
2%
12%
Europe
Source: Ovum Source: Vodacom disclosure
VODACOM GROUP COMPANY REPORT
PAGE 25/54
2% 3% 6%
8,6%
2% 2%
8,8%
20%
14%
20%
26%
19%
29%
41%
0%
5%
10%
15%
20%
25%
30%
35%
40%
45%
1H11 2H11 1H12 2H12 1H13 2H13 1H14
Direct expenses Equipment
Exhibit 55: Equipment revenue and direct expense yoy growth
24,891
19,650
15,581
1,717 3,239
6,609
0
5
10
15
20
25
30
1H12 1H13 1H14
Leased lines Self-provided sites
Exhibit 56: Leased lines ('000) and self-provided transmission
23% 22% 24%
21% 23%
22% 23%
-10%
-5%
0%
5%
10%
15%
20%
25%
30%
4,6
4,8
5,0
5,2
5,4
5,6
5,8
6,0
1H112H111H122H121H132H131H14
OPEX (ZAR)
yoy growth
as % of service revenue
Exhibit 57: Operational expenditure (bn)
Other expenses have been suffering reductions as cost savings between
September 2011 and 2013 amount to ZAR 144M. Costs with publicity have been
behaving with considerable volatility as we can see in Exhibit 54. It is worth to
note the growth in the last two semesters of 52% in 2H13 (+R 252m) and 4% in
1H14 (+R 24m), after very negative growth rates of -46% on 2H12 (-R 426m) and
-21% on 1H13 (-R 173M).
Direct expenses have continuously increased because of more handsets being
sold, following approximately the trend in the growth rate of equipment revenues
(Exhibit 55). The growth in direct costs is softened by the reduction in other
components such as interconnect costs, which came down due to MTR cuts, and
leased lines expenses.
The number of leased lines decreased from 24 891 in September 2012 to 15 581
2 years after as it is observed in Exhibit 56 (about a 40% decrease, mostly from
Telkom) with the leased lines expense coming down 13.6%. It is likely that these
numbers will come further down given Vodacom’s self-provisioning efforts, which
allows the company to have more control over network quality while decreasing
lease expenses. We can expect these expenses to decrease more than
proportionally than a reduction in the number of leased links, as Vodacom’s
ability to build out its own links represents more bargaining power to negotiate
the lease prices with other operators. Overall direct costs increased 9% yoy by
+R 1.1bn last semester, being the semester with the highest increase among the
period in consideration.
Opex (which includes staff expenses, publicity and other operating costs) as
percentage of service revenues has been flat for the third year on a yoy basis
and stable around 23% on a sequential basis (Exhibit 57). According to
management, opex will grow for the next years albeit at very low single digit.
Margins
In contrast to what should be naturally expected, Vodacom has been able to
improve margins (Exhibit 58) despite the competitive environment and the
increase of equipment representation in overall service revenues (sale of
equipment has smaller margins comparing with voice or data). We attribute this
improvement to the boost of data revenue and the ability to contain costs, which
in our belief is an evidence of the quality of management.
If we compare EBITDA margins between Vodacom and comparable companies,
we see a margin of 38% is quite attractive. The domestic competitor MTN South
Africa has an EBITDA margin of 35% for the year-end in 2012 and Telkom
(considering also the fixed operations because Telkom Mobile individually does
34,0%
36,8% 36,8% 37,3%
38,2%
31%
32%
33%
34%
35%
36%
37%
38%
39%
0
5
10
15
20
25
2009 2010 2011 2012 2013
EBITDA (ZAR) EBITDA margin
Exhibit 58: South Africa EBITDA (bn) and margin

VODACOM GROUP COMPANY REPORT
PAGE 26/54
1 800
1 900
2 000
2 100
2 200
2 300
2 400
2 500
2 600
0
1 000
2 000
3 000
4 000
5 000
6 000
7 000
2H11 1H12 2H12 1H13 2H13 1H14
3G sites Data users per 3G site
Exhibit 71: Number of 3G base stations and number of active data users per 3G site
not disclose this information) has a margin of 23.7% for the same year. Other
African telcos such as Milicom and Safaricom have margins of 39.9% (year-end
March 2013) and 35.6% (December 2012) respectively. If we look at Vodafone in
other countries we find a lot of asymmetry. EBITDA margins for the year-end
March 2013 are around 15.6% in Turkey, 24% in UK, 36% in Germany, 41.8% in
Portugal, 43.7% in Egypt and 44% in Italy.
We believe the current environment in South Africa will eventually cause margins
to shrink, taking into account the inflation in the foreseeable future and
competition from other operators. Evidence that make us believe so is the high
unsustainable value of Return on Invested Capital (ROIC). Vodacom in SA has
currently a ROIC of 55% which is way above its cost of capital of 10.18%.
On the revenue side, prices are expected to go down despite inflation but on the
cost side, these are likely to increase with inflation, especially staff costs. There
are some cost mitigating factors such as the proven management ability to cut
costs and the company’s intention to progressively convert leases into self-
provided transmission.
Overall revenue is expected to increase at a slow pace given the considerations
developed until now. Projected revenue is represented in Exhibit 59.
Investment in Invested Capital
Capital Expenditure
Investment is critical for mobile operators because as affordability of
smartphones and data consumption increase, the network capacity is required to
increase as well. This is even more important in emerging markets since there
are fewer competitive infrastructures to deliver data services.
In Exhibit 70 we can find the evolution of capital expenditure for Vodacom in
South Africa and respective capital intensity47
. It is currently around R7 billion per
year and it represents about 12% of revenue. It absolute terms it might be a large
figure but comparing with MTN South Africa and Telkom48
, it has been lagging
behind for the past five years except in 2012 (in relation to MTN). For 2013, MTN
and Telkom had capital intensities of 16% and 18% respectively.
For the past five years Vodacom has concentrated capital expenditure mainly on
transmission. This involves improving its speed, the radio access renewal (RAN)
program and expanding coverage by adding new base stations.
47 Capital expenditure as percentage of total revenues. 48 Vodacom’s figures as well as Telkom’s are relative to the year ending in March and MTN’s to the year ending in December
immediately before. Telkom refers to Telkom Group, including the fixed and mobile segment, South Africa and International (although International operations only account for 1% of Telkom revenue)
0,0%
5,0%
10,0%
15,0%
20,0%
0,0
2,0
4,0
6,0
8,0
2009 2010 2011 2012 2013
Capex (ZAR)Capex % VodacomCapex % MTNCapex % Telkom
Exhibit 70: Capital expenditure (bn) and intensity
0%
1%
2%
3%
4%
5%
6%
7%
8%
9%
0
10
20
30
40
50
60
70
80
90
Revenue yoy % growth
Exhbit 59: Projected reveue for South Africa (bnZAR) and yoy growth
VODACOM GROUP COMPANY REPORT
PAGE 27/54
In South Africa over two thirds of Vodacom’s base stations have high capacity
transmission, either fibre or IP microwave. Vodacom has currently 9586 2G base
stations, 6574 3G base stations and 727 LTE sites. EDGE49
covers 96% of the
South African population (as of March 2013) and 3G covers 89%. (September
2013). In Exhibit 71 we can see the evolution in the number of 3G base stations.
In line with a data penetration strategy, investment in infrastructure that supports
3G has been at focus, registering a 50% increase since March 2011. Data users
per 3G site have been increasing until March 2013, when it dropped close to
2300.
More recently, LTE technology has also gained importance for Vodacom, which
was the first to launch LTE in South Africa on 10 October 2012. As we will see
next, access to spectrum is crucial to roll out LTE optimally.
The RAN renewal program across the Group is expected to be completed over
the next financial year. In South Africa 77% of the base stations were already
converted. This renewal allows to accommodate 2G, 3G and LTE in the same
network and to reduce in operational and energy costs.
In the semester ending in September 2013, Vodacom has increased the Group’s
medium-term guidelines for capital expenditure from 11%-13% to 14%-17%. To
this guideline upgrade contributes Vodafone’s upcoming cash from the sale of
Verizon50
and the consequent £7 billion allocation to Project Spring. This
investment program is to take place in the next three financial years and it
accrues directly to network quality improvement and customer services in the
various countries where Vodafone is present. The bulk of the windfall will be
handed to shareholders and repay Vodafone’s debt.
Nevertheless, Vodacom’s management was clear in the fact that this guideline is
conditional on the MTR outcome and level of asymmetry. For the CEO, a 25%
annual MTR cut along with 15% asymmetry would be compatible with those
capex guidelines. However the draft MTR points at a cut close to 50%, and
asymmetries of more than 100%, which makes us believe capex intensity will
lean towards the lower limit of 14%.
We believe more capital expenditure will be used to continue to improve,
transmission as well as converged services, which involves Fibre-to-the-
Premises (FTTP)51
and LTE. In Exhibit 72 we find forecasts for capex in South
Africa as well as its decomposition into depreciation and net capex. We estimate
capex intensity for South Africa so that values for the overall group for the next
49 Technology classified as 2.75G which is and evolution from 2.5G, known as GPRS. 50 Vodafone confirmed the sale of its 45% stake in Verizon Wireless on September 2013 for $130 billion. 51 FTTP encompasses both FTTH and FTTB
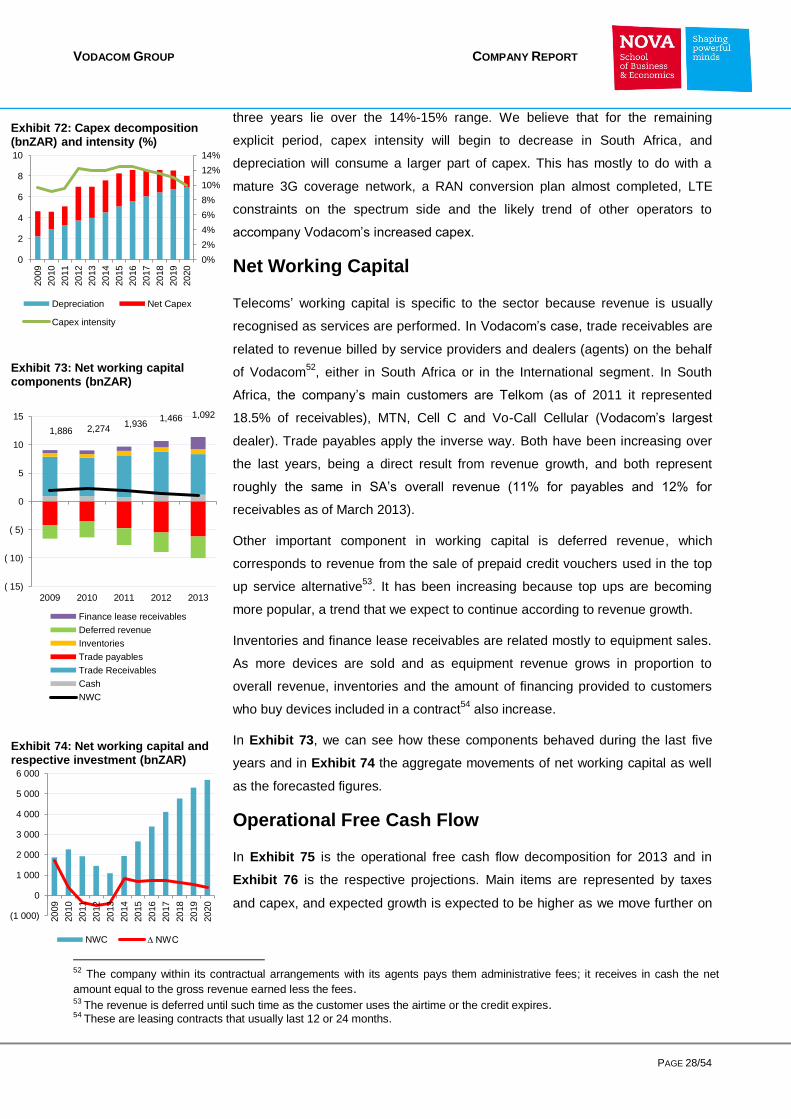
VODACOM GROUP COMPANY REPORT
PAGE 28/54
three years lie over the 14%-15% range. We believe that for the remaining
explicit period, capex intensity will begin to decrease in South Africa, and
depreciation will consume a larger part of capex. This has mostly to do with a
mature 3G coverage network, a RAN conversion plan almost completed, LTE
constraints on the spectrum side and the likely trend of other operators to
accompany Vodacom’s increased capex.
Net Working Capital
Telecoms’ working capital is specific to the sector because revenue is usually
recognised as services are performed. In Vodacom’s case, trade receivables are
related to revenue billed by service providers and dealers (agents) on the behalf
of Vodacom52
, either in South Africa or in the International segment. In South
Africa, the company’s main customers are Telkom (as of 2011 it represented
18.5% of receivables), MTN, Cell C and Vo-Call Cellular (Vodacom’s largest
dealer). Trade payables apply the inverse way. Both have been increasing over
the last years, being a direct result from revenue growth, and both represent
roughly the same in SA’s overall revenue (11% for payables and 12% for
receivables as of March 2013).
Other important component in working capital is deferred revenue, which
corresponds to revenue from the sale of prepaid credit vouchers used in the top
up service alternative53
. It has been increasing because top ups are becoming
more popular, a trend that we expect to continue according to revenue growth.
Inventories and finance lease receivables are related mostly to equipment sales.
As more devices are sold and as equipment revenue grows in proportion to
overall revenue, inventories and the amount of financing provided to customers
who buy devices included in a contract54
also increase.
In Exhibit 73, we can see how these components behaved during the last five
years and in Exhibit 74 the aggregate movements of net working capital as well
as the forecasted figures.
Operational Free Cash Flow
In Exhibit 75 is the operational free cash flow decomposition for 2013 and in
Exhibit 76 is the respective projections. Main items are represented by taxes
and capex, and expected growth is expected to be higher as we move further on
52 The company within its contractual arrangements with its agents pays them administrative fees; it receives in cash the net
amount equal to the gross revenue earned less the fees. 53 The revenue is deferred until such time as the customer uses the airtime or the credit expires. 54 These are leasing contracts that usually last 12 or 24 months.
0%
2%
4%
6%
8%
10%
12%
14%
0
2
4
6
8
10
20
09
20
10
20
11
20
12
20
13
20
14
20
15
20
16
20
17
20
18
20
19
20
20
Depreciation Net Capex
Capex intensity
Exhibit 72: Capex decomposition (bnZAR) and intensity (%)
1,886 2,274 1,936
1,466 1,092
( 15)
( 10)
( 5)
0
5
10
15
2009 2010 2011 2012 2013
Finance lease receivables
Deferred revenue
Inventories
Trade payables
Trade Receivables
Cash
NWC
Exhibit 73: Net working capital components (bnZAR)
(1 000)
0
1 000
2 000
3 000
4 000
5 000
6 000
20
09
20
10
20
11
20
12
20
13
20
14
20
15
20
16
20
17
20
18
20
19
20
20
NWC ∆ NWC
Exhibit 74: Net working capital and respective investment (bnZAR)

VODACOM GROUP COMPANY REPORT
PAGE 29/54
the explicit period. Large negative growth is due to higher investment in net
working capital and higher capex.
Other Issues
Spectrum
On October 2012, Vodacom launched South Africa’s first LTE network, counting
with 727 sites by September 2013. Vodacom has to leverage existing LTE
opportunities in order to fully exploit this data phenomenon. They comprise
offloading traffic from the 3G network, achieving higher volumes as devices get
faster, as well as the creation of a DSL-like LTE service. This means providing
sufficient LTE coverage in a way that it becomes an alternative to DSL. However
these opportunities require spectrum, whose delayed allocation by ICASA has
been stalling operators’ ability to expand services and to continue network rollout.
Currently Vodacom and MTN use the 1800MHz band to provide LTE services
while Telkom uses the 2.3GHz band and Cell C the 2.1GHz one. In March 2013
66% of Vodacom’s network was ready to support LTE technology.
ICASA postponed the auction to allocate spectrum in the 800MHz and 2.6GHz
bands which was supposed to be completed in April 2012 in a “beauty contest”
framework (factors to take into consideration include business plan, technical
plan, market innovation and network rollout in opposition to a traditional auction
procedure). The postponement was justified by the need to “ensure that the
minister’s policy direction in high demand spectrum was taken into
consideration”. In September the government announced its plans to finalize the
spectrum policy by March 2014. Vodacom’s management appears to be
confident that the allocation of the 2.6GHz band will take place during the last
quarter of the year, hoping to start using it during the first quarter of 2014.
Regarding the 800MHz band, it will not be auctioned unless the migration of
analogue broadcast TV (whose first policy document was released in 2008) to
digital terrestrial television (DTT) is completed.
The band frequency of the spectrum to be allocated is crucial since it comprises
a tradeoff between coverage and traffic. The higher the band frequency, the
lower the coverage provided by the radio cell in the base station but the higher
the associated traffic capacity. For instance, a 2.6GHz band is adequate for high
populated cities because it is preferable to invest in many base stations with
smaller coverage each than manage traffic collisions, clashing signals and
interference. The opposite is true for frequency bands like 800MHz which are
more suitable for rural areas.
0
5
10
15
20
25
Exhibit 75: Operational free cash flow breakdown for SA in 2013
-30%
-25%
-20%
-15%
-10%
-5%
0%
5%
10%
15%
0
2
4
6
8
10
12
14
Operational FCF growth rate
Exhibit 76: Operational FCF (bnZAR) and growth rate

VODACOM GROUP COMPANY REPORT
PAGE 30/54
On top of the risk inherent to the spectrum allocation, Neotel’s acquisition by
Vodacom puts more uncertainty on the table. The terms in which the acquisition
should go through, especially regarding Neotel’s spectrum are not clarified yet
and are currently subject to approval by the Competition Committee and ICASA.
M&A – The Neotel Acquisition
In late September 2013, Vodacom announced that it is in exclusive negotiations
to buy 100% of Neotel SA55
. Neotel shareholder structure is constituted by Tata
Communications (68.5%), Nexus Connection (19%) and Communitel (12.5%).
The Indian-based Tata Communications is one of the main tier 1
telecommunications company at global scale. Currently Neotel represents 12% of
the overall group revenue.
If the deal gets past ICASA and the Competition Commission, we believe there
will be relevant synergies for Vodacom. The main benefits are related to
spectrum and infrastructure. Given the current spectrum constraints Vodacom is
facing, the acquisition would allow Vodacom to improve spectrum employment
and put it to work on the LTE network (especially in the 1800 MHz range). As for
infrastructure, Vodacom would benefit from 15,000km of fibre which is
considerable for a company whose core operations concentrate on mobile
services. Currently Vodacom has fibre in all major metropolitan areas and is
working in cooperation with other parties to deploy long-distance fibre nationally
to connect all areas. This represents an opportunity for the company to scale up
Vodacom Business and accelerate the mentioned process of delivering fibre-to-
the-business and fibre-to-the-home. While enhancing the fixed line market
Vodacom also saves a lot in capex.
Challenges of the deal include the spectrum itself from a competitive point of
view, which may cause competition authorities to hamper the transaction. Should
regulatory impediments arise in what spectrum is concerned, Vodacom will likely
abandon the deal. Furthermore, as usual in M&A activity, there is risk associated
with proper implementation of the business, culture clash between employees as
well as brand management.
Other aspect to point out is the price of the transaction. After the announcement,
Bloomberg cited a price of R5bn, which in case the transaction was to occur in
the present financial year and funded entirely with debt, Vodacom’s net debt-to-
EBITDA would only increase by 0.1pp to 0.6 (this price represents 1/5 of
Vodacom Group’s EBITDA as of March 2013). Since the bulk of the upside
potential remains on spectrum and infrastructure and not in operations, we
55 Neotel is the second fixed line operator after Telkom and was set up precisely as the second national operator (SNO) in 2005-2006. Its business units are Managed Services, Network Services, NeoVoice and NeoInternet/NeoBroadband.

VODACOM GROUP COMPANY REPORT
PAGE 31/54
Exhibit 77: Selected information on
Neotel
Source: Tata Communications reports
believe the price range is not very wide. On the other hand Vodacom’s rationale
of the transaction may be an argument for ending up overpaying.
Neotel has presented consistent revenue growth in the last two years and has
become profitable at the operating (EBIT) level in the financial year ending in
March 2013. Despite its short customer base, its growth has been impressive
with the business segment growing 25% in 2013 (2012: 92%) and the retail
segment improving 52% (2012: 100%). A summary of Neotel financials are
presented in Exhibit XXX. Albeit encouraging, Neotel’s activity still lags behind
Telkom in terms of size56
.
Geographical expansion is also an option but is constrained by Vodafone’s
presence in three African countries57
and by the fact that attractive markets are
already crowded. Ethiopia is an example of an interesting market to enter, where
Vodacom inclusively has already opened offices, but, according to Vodacom’s
CFO Ivan Dittrich, is a market where diverse operators want to enter as well.
This emphasizes the importance of M&A potential in the countries where
Vodacom is present.
We also want to highlight that Vodacom’s high ROIC58
makes value creation
through margins more difficult and value creation through growth more likely,
evidencing again the importance of M&A and high-ROIC growth opportunities.
56 Telkom, as of March 2013 presented revenue of R 32.5bn, EBITDA of R 7.1bn, 870.5 thousand ADSL subscribers, 3.3M fixed line subscribers (versus 5.5m in 2000), 22,000 employees and 147,000 km of fibre. 57 Ghana, Egypt and Kenya (through Safaricom). 58 For a more detailed analysis on ROIC refer to the section ROIC and growth framework.
FY ending in March
mZAR 2012 2013
Revenue 2 841 3 182
growth 25% 12%
Operational expense
(1 561) (1 382)
Employee expense
( 463) ( 460)
Other ( 809) ( 872)
EBITDA 9 467
margin 0% 15%
D&A expense
( 438) ( 413)
EBIT ( 404) 54
Fin. Costs ( 811) ( 569)
Fin. Income 39 51
EBT (1 176) ( 464)
Assets 5 493 6 808
Net debt
5 219
Customers (‘000)
Business 2.4 3.0
growth 92% 25%
Retail 100 152
growth 100% 52%
No. employees 1 000
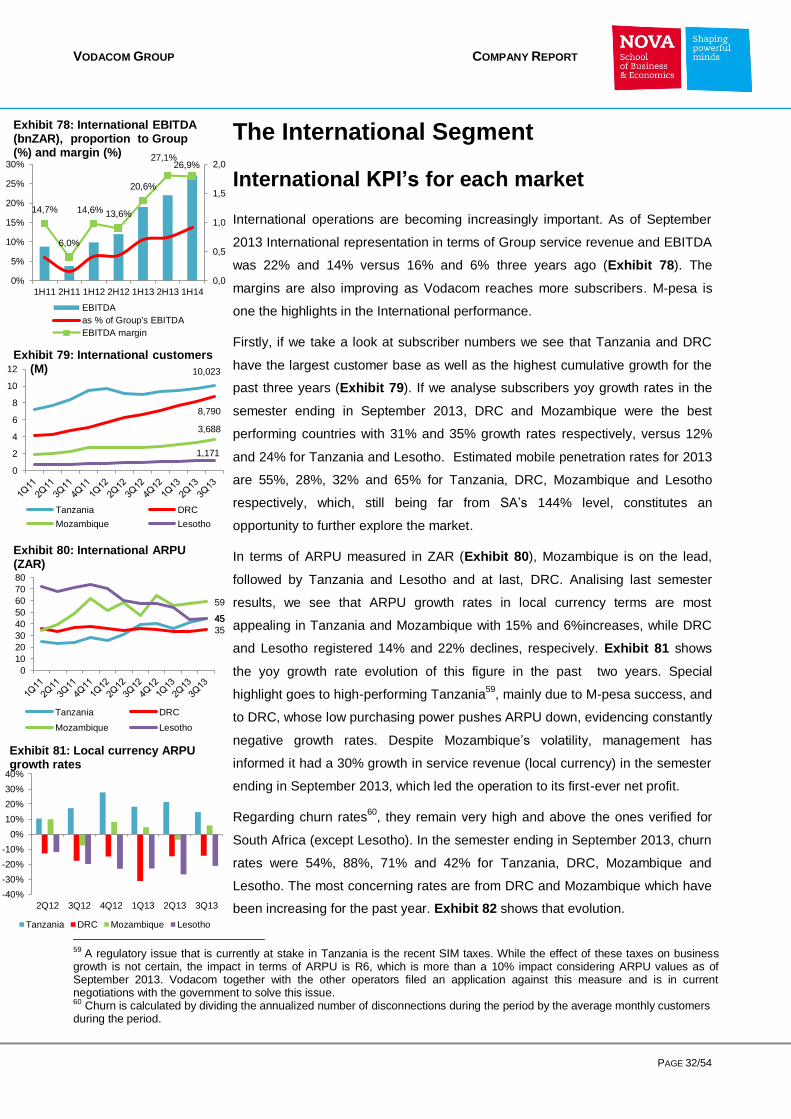
VODACOM GROUP COMPANY REPORT
PAGE 32/54
10,023
8,790
3,688
1,171
0
2
4
6
8
10
12
Tanzania DRC
Mozambique Lesotho
Exhibit 79: International customers (M)
45
35
59
45
0
10
20
30
40
50
60
70
80
Tanzania DRC
Mozambique Lesotho
Exhibit 80: International ARPU (ZAR)
The International Segment
International KPI’s for each market
International operations are becoming increasingly important. As of September
2013 International representation in terms of Group service revenue and EBITDA
was 22% and 14% versus 16% and 6% three years ago (Exhibit 78). The
margins are also improving as Vodacom reaches more subscribers. M-pesa is
one the highlights in the International performance.
Firstly, if we take a look at subscriber numbers we see that Tanzania and DRC
have the largest customer base as well as the highest cumulative growth for the
past three years (Exhibit 79). If we analyse subscribers yoy growth rates in the
semester ending in September 2013, DRC and Mozambique were the best
performing countries with 31% and 35% growth rates respectively, versus 12%
and 24% for Tanzania and Lesotho. Estimated mobile penetration rates for 2013
are 55%, 28%, 32% and 65% for Tanzania, DRC, Mozambique and Lesotho
respectively, which, still being far from SA’s 144% level, constitutes an
opportunity to further explore the market.
In terms of ARPU measured in ZAR (Exhibit 80), Mozambique is on the lead,
followed by Tanzania and Lesotho and at last, DRC. Analising last semester
results, we see that ARPU growth rates in local currency terms are most
appealing in Tanzania and Mozambique with 15% and 6%increases, while DRC
and Lesotho registered 14% and 22% declines, respecively. Exhibit 81 shows
the yoy growth rate evolution of this figure in the past two years. Special
highlight goes to high-performing Tanzania59
, mainly due to M-pesa success, and
to DRC, whose low purchasing power pushes ARPU down, evidencing constantly
negative growth rates. Despite Mozambique’s volatility, management has
informed it had a 30% growth in service revenue (local currency) in the semester
ending in September 2013, which led the operation to its first-ever net profit.
Regarding churn rates60
, they remain very high and above the ones verified for
South Africa (except Lesotho). In the semester ending in September 2013, churn
rates were 54%, 88%, 71% and 42% for Tanzania, DRC, Mozambique and
Lesotho. The most concerning rates are from DRC and Mozambique which have
been increasing for the past year. Exhibit 82 shows that evolution.
59 A regulatory issue that is currently at stake in Tanzania is the recent SIM taxes. While the effect of these taxes on business growth is not certain, the impact in terms of ARPU is R6, which is more than a 10% impact considering ARPU values as of September 2013. Vodacom together with the other operators filed an application against this measure and is in current negotiations with the government to solve this issue. 60 Churn is calculated by dividing the annualized number of disconnections during the period by the average monthly customers during the period.
-40%
-30%
-20%
-10%
0%
10%
20%
30%
40%
2Q12 3Q12 4Q12 1Q13 2Q13 3Q13
Tanzania DRC Mozambique Lesotho
Exhibit 81: Local currency ARPU growth rates
14,7%
6,0%
14,6% 13,6%
20,6%
27,1% 26,9%
0,0
0,5
1,0
1,5
2,0
0%
5%
10%
15%
20%
25%
30%
1H11 2H11 1H12 2H12 1H13 2H13 1H14
EBITDA
as % of Group's EBITDA
EBITDA margin
Exhibit 78: International EBITDA (bnZAR), proportion to Group (%) and margin (%)
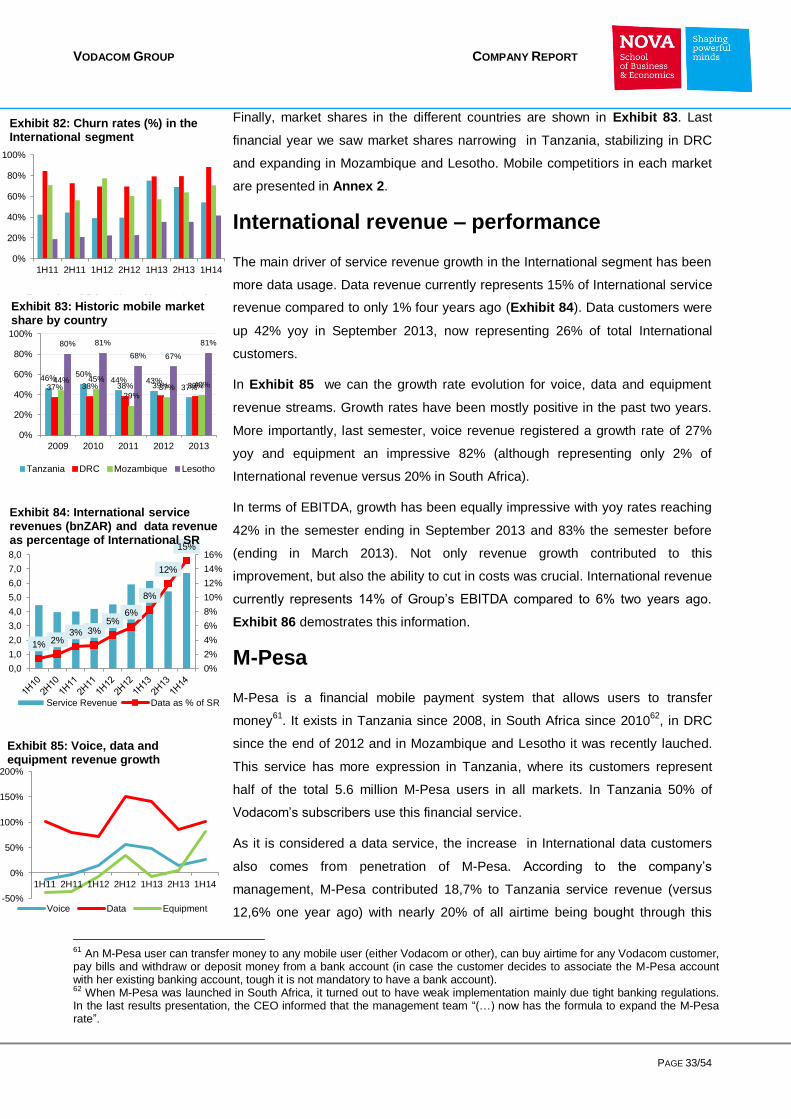
VODACOM GROUP COMPANY REPORT
PAGE 33/54
Finally, market shares in the different countries are shown in Exhibit 83. Last
financial year we saw market shares narrowing in Tanzania, stabilizing in DRC
and expanding in Mozambique and Lesotho. Mobile competitiors in each market
are presented in Annex 2.
International revenue – performance
The main driver of service revenue growth in the International segment has been
more data usage. Data revenue currently represents 15% of International service
revenue compared to only 1% four years ago (Exhibit 84). Data customers were
up 42% yoy in September 2013, now representing 26% of total International
customers.
In Exhibit 85 we can the growth rate evolution for voice, data and equipment
revenue streams. Growth rates have been mostly positive in the past two years.
More importantly, last semester, voice revenue registered a growth rate of 27%
yoy and equipment an impressive 82% (although representing only 2% of
International revenue versus 20% in South Africa).
In terms of EBITDA, growth has been equally impressive with yoy rates reaching
42% in the semester ending in September 2013 and 83% the semester before
(ending in March 2013). Not only revenue growth contributed to this
improvement, but also the ability to cut in costs was crucial. International revenue
currently represents 14% of Group’s EBITDA compared to 6% two years ago.
Exhibit 86 demostrates this information.
M-Pesa
M-Pesa is a financial mobile payment system that allows users to transfer
money61
. It exists in Tanzania since 2008, in South Africa since 201062
, in DRC
since the end of 2012 and in Mozambique and Lesotho it was recently lauched.
This service has more expression in Tanzania, where its customers represent
half of the total 5.6 million M-Pesa users in all markets. In Tanzania 50% of
Vodacom’s subscribers use this financial service.
As it is considered a data service, the increase in International data customers
also comes from penetration of M-Pesa. According to the company’s
management, M-Pesa contributed 18,7% to Tanzania service revenue (versus
12,6% one year ago) with nearly 20% of all airtime being bought through this
61 An M-Pesa user can transfer money to any mobile user (either Vodacom or other), can buy airtime for any Vodacom customer, pay bills and withdraw or deposit money from a bank account (in case the customer decides to associate the M-Pesa account with her existing banking account, tough it is not mandatory to have a bank account). 62 When M-Pesa was launched in South Africa, it turned out to have weak implementation mainly due tight banking regulations. In the last results presentation, the CEO informed that the management team “(…) now has the formula to expand the M-Pesa rate”.
0%
20%
40%
60%
80%
100%
1H11 2H11 1H12 2H12 1H13 2H13 1H14
Tanzania DRC Mozambique Lesotho
Exhibit 82: Churn rates (%) in the International segment
1% 2% 3% 3%
5% 6%
8%
12%
15%
0%
2%
4%
6%
8%
10%
12%
14%
16%
0,0
1,0
2,0
3,0
4,0
5,0
6,0
7,0
8,0
Service Revenue Data as % of SR
Exhibit 84: International service revenues (bnZAR) and data revenue as percentage of International SR
-50%
0%
50%
100%
150%
200%
1H11 2H11 1H12 2H12 1H13 2H13 1H14
Voice Data Equipment
Exhibit 85: Voice, data and equipment revenue growth
46% 50%
44% 43% 37% 37% 38% 38% 39% 39%
44% 45%
29% 37% 40%
80% 81%
68% 67%
81%
0%
20%
40%
60%
80%
100%
2009 2010 2011 2012 2013
Tanzania DRC Mozambique Lesotho
Exhibit 83: Historic mobile market share by country
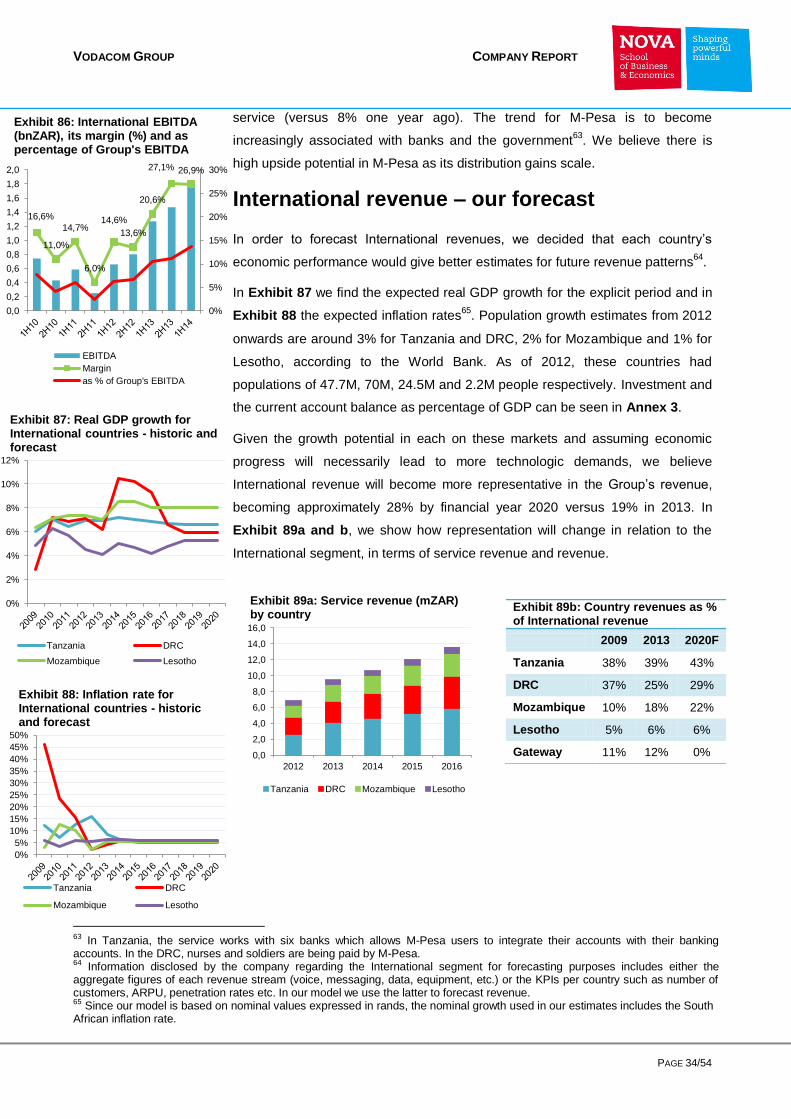
VODACOM GROUP COMPANY REPORT
PAGE 34/54
service (versus 8% one year ago). The trend for M-Pesa is to become
increasingly associated with banks and the government63
. We believe there is
high upside potential in M-Pesa as its distribution gains scale.
International revenue – our forecast
In order to forecast International revenues, we decided that each country’s
economic performance would give better estimates for future revenue patterns64
.
In Exhibit 87 we find the expected real GDP growth for the explicit period and in
Exhibit 88 the expected inflation rates65
. Population growth estimates from 2012
onwards are around 3% for Tanzania and DRC, 2% for Mozambique and 1% for
Lesotho, according to the World Bank. As of 2012, these countries had
populations of 47.7M, 70M, 24.5M and 2.2M people respectively. Investment and
the current account balance as percentage of GDP can be seen in Annex 3.
Given the growth potential in each on these markets and assuming economic
progress will necessarily lead to more technologic demands, we believe
International revenue will become more representative in the Group’s revenue,
becoming approximately 28% by financial year 2020 versus 19% in 2013. In
Exhibit 89a and b, we show how representation will change in relation to the
International segment, in terms of service revenue and revenue.
63 In Tanzania, the service works with six banks which allows M-Pesa users to integrate their accounts with their banking accounts. In the DRC, nurses and soldiers are being paid by M-Pesa. 64 Information disclosed by the company regarding the International segment for forecasting purposes includes either the aggregate figures of each revenue stream (voice, messaging, data, equipment, etc.) or the KPIs per country such as number of customers, ARPU, penetration rates etc. In our model we use the latter to forecast revenue. 65 Since our model is based on nominal values expressed in rands, the nominal growth used in our estimates includes the South African inflation rate.
Exhibit 89b: Country revenues as % of International revenue
2009 2013 2020F
Tanzania 38% 39% 43%
DRC 37% 25% 29%
Mozambique 10% 18% 22%
Lesotho 5% 6% 6%
Gateway 11% 12% 0%
16,6%
11,0%
14,7%
6,0%
14,6%
13,6%
20,6%
27,1% 26,9%
0%
5%
10%
15%
20%
25%
30%
0,0
0,2
0,4
0,6
0,8
1,0
1,2
1,4
1,6
1,8
2,0
EBITDA
Margin
as % of Group's EBITDA
Exhibit 86: International EBITDA (bnZAR), its margin (%) and as percentage of Group's EBITDA
0%
2%
4%
6%
8%
10%
12%
Tanzania DRC
Mozambique Lesotho
Exhibit 87: Real GDP growth for International countries - historic and forecast
0%
5%
10%
15%
20%
25%
30%
35%
40%
45%
50%
Tanzania DRC
Mozambique Lesotho
Exhibit 88: Inflation rate for International countries - historic and forecast
0,0
2,0
4,0
6,0
8,0
10,0
12,0
14,0
16,0
2012 2013 2014 2015 2016
Tanzania DRC Mozambique Lesotho
Exhibit 89a: Service revenue (mZAR) by country

VODACOM GROUP COMPANY REPORT
PAGE 35/54
Investment in Invested Capital
Capital Expenditure
While in developed countries mobile subscribers have broad access to data
services (mobile, fixed, cable and satellite) there are fewer competitive
infrastructures to deliver data service in the International markets where
Vodacom operates (generally mobile, sometimes fixed). This represents an
opportunity for growth but at the same time it is a challenge because more capital
must be employed.
Capital expenditure in the International segment is concentrated on the RAN
renewal program, similarly to South Africa, and network improvement for more
basic technologies. Given the relatively low penetration rates and the
population’s income (refer to Exhibit 90) the priority is to provide 2G and 3G
technologies rather than for instance LTE.
On March 2013 the rate of conversion of the RAN renewal program (conversion
base stations to single RAN technology) was 100% in Mozambique and Lesotho,
81% in Tanzania and 84% in the DRC. It is expected to be completed by March
2014.
The lack of infrastructure is especially true in the DRC, where telecoms have to
rely on costly satellite transmission. In order to change this, Vodacom established
connection to the West Africa Cable System (WACS) sea cable and the
SEACOM (which lands in East Africa East coast of DRC).
In Exhibit 91 we see that capex enhancement is clearly part of the international
strategy66
. In the last year capex intensity evolved from 16% to close to 25% and
we believe this trend will persist during the next years, in line with the medium-
term investment guideline.
Net Working Capital
The net working capital behaviour is similar to the one in South Africa67
,
evidencing a declining trend throughout the last five years, and inclusively being
negative in 2013. The main differences are mainly related to a small, albeit
growing, equipment revenue which leads to low finance lease receivables and
low inventory needs.
66 In fact comparing capex-to-revenue between Vodacom (March 2012) and MTN South Africa and MTN Nigeria (December 2012) the figures are 13%, 16% and 36% respectively. 67 Net working capital for the International segment is allocated in terms of the revenue representation these operations have in the Group.
0%
5%
10%
15%
20%
25%
30%
35%
0
1
2
3
4
5
6
20
09
20
10
20
11
20
12
20
13
20
14
20
15
20
16
20
17
20
18
20
19
20
20
Depreciation Net Capex
Capex intensity
Exhibit 91: Capex decomposition (bnZAR) and capex intensity (%)
0
200
400
600
800
1000
1200
1400
2008 2009 2010 2011 2012
Tanzania DRC
Mozambique Lesotho
Exhibit 90: GDP per capita (USD)
149,365 204,886 90,326 -53,547
-334,162
(2 500)
(2 000)
(1 500)
(1 000)
( 500)
0
500
1 000
1 500
2 000
2009 2010 2011 2012 2013
Finance lease receivables
Deferred revenue
Inventories
Trade payables
Trade Receivables
Cash
NWC
Exhibit 92: Net working capital components (mZAR)
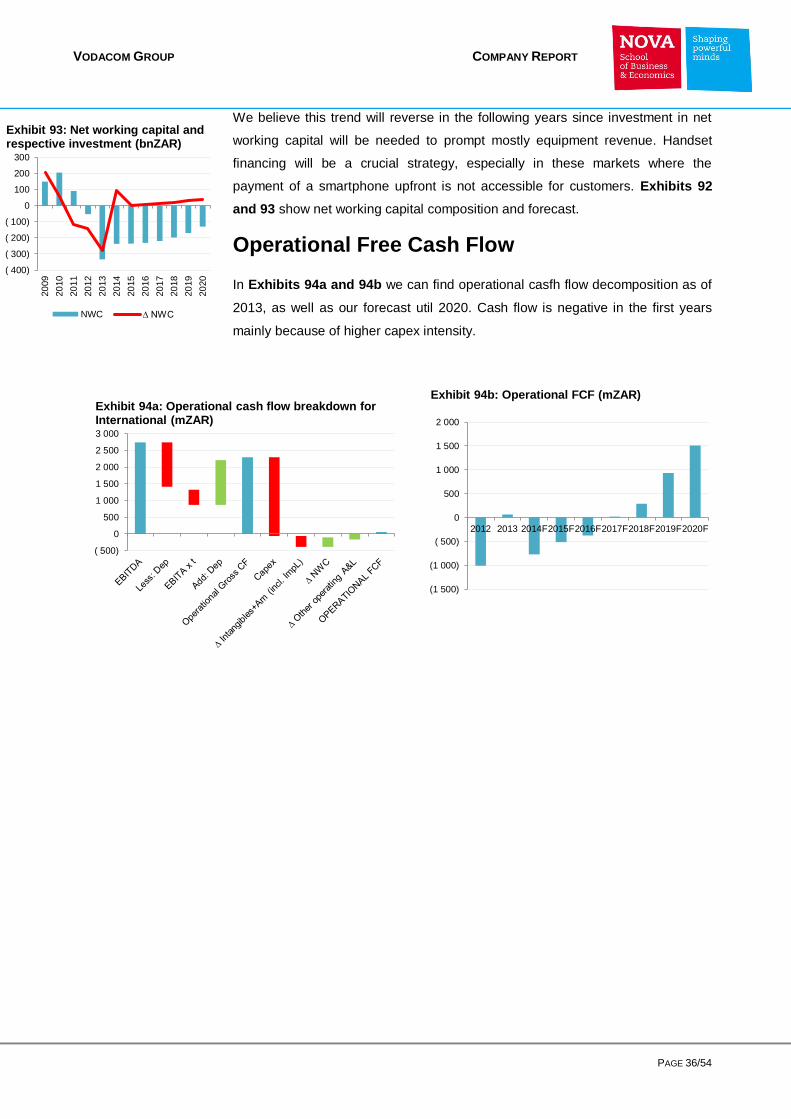
VODACOM GROUP COMPANY REPORT
PAGE 36/54
We believe this trend will reverse in the following years since investment in net
working capital will be needed to prompt mostly equipment revenue. Handset
financing will be a crucial strategy, especially in these markets where the
payment of a smartphone upfront is not accessible for customers. Exhibits 92
and 93 show net working capital composition and forecast.
Operational Free Cash Flow
In Exhibits 94a and 94b we can find operational casfh flow decomposition as of
2013, as well as our forecast util 2020. Cash flow is negative in the first years
mainly because of higher capex intensity.
( 400)
( 300)
( 200)
( 100)
0
100
200
300
20
09
20
10
20
11
20
12
20
13
20
14
20
15
20
16
20
17
20
18
20
19
20
20
NWC ∆ NWC
Exhibit 93: Net working capital and respective investment (bnZAR)
(1 500)
(1 000)
( 500)
0
500
1 000
1 500
2 000
2012 2013 2014F2015F2016F2017F2018F2019F2020F
Exhibit 94b: Operational FCF (mZAR)
( 500)
0
500
1 000
1 500
2 000
2 500
3 000
Exhibit 94a: Operational cash flow breakdown for International (mZAR)
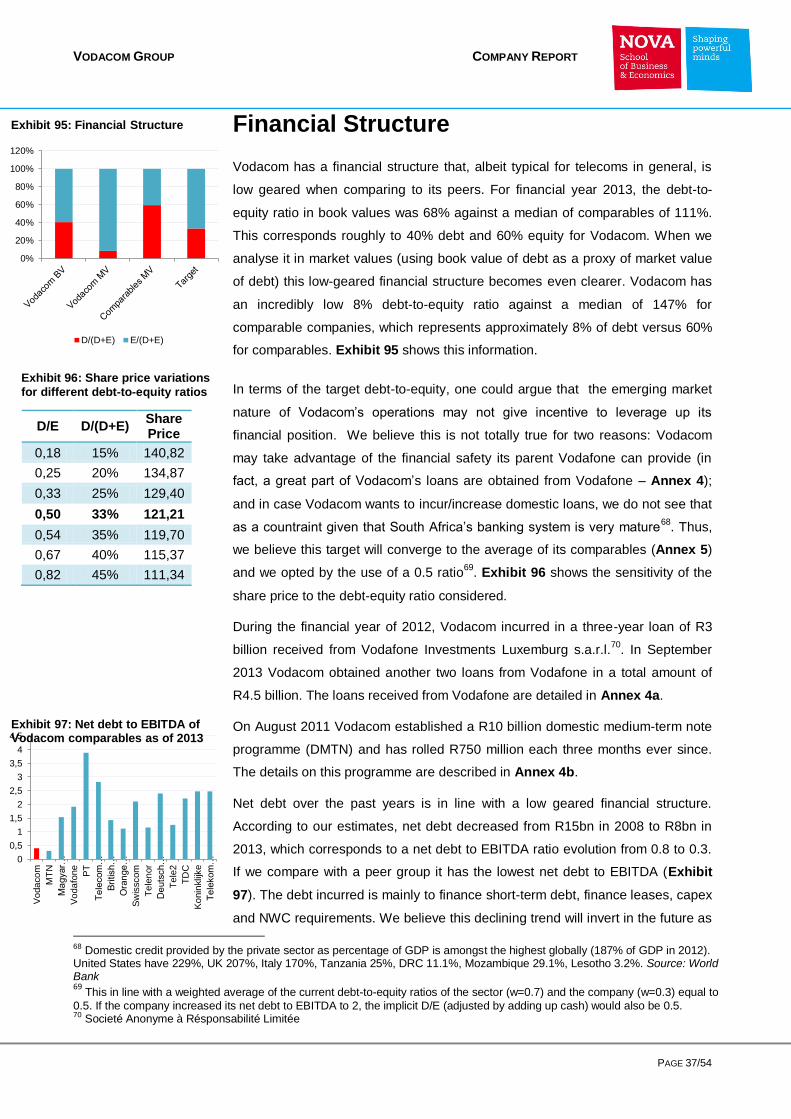
VODACOM GROUP COMPANY REPORT
PAGE 37/54
Exhibit 96: Share price variations
for different debt-to-equity ratios
Financial Structure
Vodacom has a financial structure that, albeit typical for telecoms in general, is
low geared when comparing to its peers. For financial year 2013, the debt-to-
equity ratio in book values was 68% against a median of comparables of 111%.
This corresponds roughly to 40% debt and 60% equity for Vodacom. When we
analyse it in market values (using book value of debt as a proxy of market value
of debt) this low-geared financial structure becomes even clearer. Vodacom has
an incredibly low 8% debt-to-equity ratio against a median of 147% for
comparable companies, which represents approximately 8% of debt versus 60%
for comparables. Exhibit 95 shows this information.
In terms of the target debt-to-equity, one could argue that the emerging market
nature of Vodacom’s operations may not give incentive to leverage up its
financial position. We believe this is not totally true for two reasons: Vodacom
may take advantage of the financial safety its parent Vodafone can provide (in
fact, a great part of Vodacom’s loans are obtained from Vodafone – Annex 4);
and in case Vodacom wants to incur/increase domestic loans, we do not see that
as a countraint given that South Africa’s banking system is very mature68
. Thus,
we believe this target will converge to the average of its comparables (Annex 5)
and we opted by the use of a 0.5 ratio69
. Exhibit 96 shows the sensitivity of the
share price to the debt-equity ratio considered.
During the financial year of 2012, Vodacom incurred in a three-year loan of R3
billion received from Vodafone Investments Luxemburg s.a.r.l.70
. In September
2013 Vodacom obtained another two loans from Vodafone in a total amount of
R4.5 billion. The loans received from Vodafone are detailed in Annex 4a.
On August 2011 Vodacom established a R10 billion domestic medium-term note
programme (DMTN) and has rolled R750 million each three months ever since.
The details on this programme are described in Annex 4b.
Net debt over the past years is in line with a low geared financial structure.
According to our estimates, net debt decreased from R15bn in 2008 to R8bn in
2013, which corresponds to a net debt to EBITDA ratio evolution from 0.8 to 0.3.
If we compare with a peer group it has the lowest net debt to EBITDA (Exhibit
97). The debt incurred is mainly to finance short-term debt, finance leases, capex
and NWC requirements. We believe this declining trend will invert in the future as
68 Domestic credit provided by the private sector as percentage of GDP is amongst the highest globally (187% of GDP in 2012). United States have 229%, UK 207%, Italy 170%, Tanzania 25%, DRC 11.1%, Mozambique 29.1%, Lesotho 3.2%. Source: World Bank 69 This in line with a weighted average of the current debt-to-equity ratios of the sector (w=0.7) and the company (w=0.3) equal to
0.5. If the company increased its net debt to EBITDA to 2, the implicit D/E (adjusted by adding up cash) would also be 0.5. 70 Societé Anonyme à Résponsabilité Limitée
D/E D/(D+E) Share Price
0,18 15% 140,82
0,25 20% 134,87
0,33 25% 129,40
0,50 33% 121,21
0,54 35% 119,70
0,67 40% 115,37
0,82 45% 111,34
0%
20%
40%
60%
80%
100%
120%
D/(D+E) E/(D+E)
Exhibit 95: Financial Structure
0
0,5
1
1,5
2
2,5
3
3,5
4
4,5
Vo
da
co
m
MT
N
Ma
gyar…
Vo
da
fone
PT
Te
lecom
…
Bri
tish…
Ora
nge
…
Sw
isscom
Te
len
or
De
uts
ch…
Te
le2
TD
C
Ko
nin
klij
ke
Te
lekom
…
Exhibit 97: Net debt to EBITDA of Vodacom comparables as of 2013

VODACOM GROUP COMPANY REPORT
PAGE 38/54
0123456789
Exhibit 100: Dividend yield (%) of Vodacom comparables as 2013
Source: Bloomberg
capex increase as well as net working capital requirements due to more
importance of handset sales. We expect that debt-to-equity and net debt to
EBITDA will increase in the future to similar values of 200971
. This process yields
a debt-to-equity at market values of 28.5%72
in 2020 versus close to 8% in 2013,
which puts Vodacom in the path to achieve the debt-to-equity target of 0.5.
Exhibit 98 summarizes this information.
In terms of dividends, Vodacom has been able to deliver a very attractive
dividend to its shareholders with consistently high payout ratios without incurring
in more debt. Last year, dividend payout was close to 90%. In the future we
expect payouts to slightly decrease as capex increases. We believe that is
strategically preferable to cut dividends rather than capex because of the
irreversible consequences related to service quality and competitiveness loss.
With the growth rates assumed for each country where Vodacom operates and
the estimated ROIC for the explicit period we triangulate payout for the values to
be consistent. In Exhibit 99 we can find historic and forecasted dividends.
Historic dividend yield has also been attractive especially in relation to
comparable companies. In Exhibit 100 we see that Vodacom has the second
highest dividend yield for 2013 (7%), only surpassed by the Danish telecom TDC
(8.5%). This dividend yield is also above the average dividend yields for telecoms
in CEEMEA73
(5.3%), Latin America (1.6%) or Europe (4.7%)74
. We expect this
dividend yield to continue increasing but at a much slower pace than the years
before. In Exhibit 101 we find historic and forecast75
dividend yields.
71 Management in the interim presentation for FY2014 said it was willing to increase net debt to EBITDA to 2 in order to face possible capital expenditures of 17% of revenue. As explained before we are not convinced capex is going to be as high and therefore, not ignoring the possibility of net debt to EBITDA being equal to two in the future (it is in fact a likely outcome considering a debt-to-equity target of 0.5), we believe that for the explicit period this value will not surpass the 0.8 threshold. 72 This ratio was computed as the future value of the equity value obtained from the valuation of the company as of December 2014. The discount rate used was a Group average WACC weighted by the value from operations of each segment. Although this assumes a constant segment representation for the future, this gives a sense of the behavior of the company in terms of capital structure. 73 Central and Eastern Europe, Middle East and Africa. 74 These values were sourced by Absa Capital and include 19 companies in the first group, 5 in the second and 14 the third. 75 Note that dividend yield for the years 2010-2013 is computed with the market share price, whereas for 2014-2020 period is with our own estimates. Also the dividend per share used for the period 2010-2013 is the one disclosed in the company annual reports.
0%
10%
20%
30%
40%
50%
60%
70%
80%
90%
100%
0
2
4
6
8
10
12
14
16
20
09
20
10
20
11
20
12
20
13
20
14
20
15
20
16
20
17
20
18
20
19
20
20
Dividends (bnZAR) Payout ratio
Exhibit 99: Dividends and payout ratio - historic and forecast
2,0%
5,3%
5,9%
7,4%
6,6%
6,5% 6,6% 6,7% 6,9% 7,2% 7,4%
0%
1%
2%
3%
4%
5%
6%
7%
8%
Exhibit 101: Dividend yield - historic and forecast
0%
20%
40%
60%
80%
100%
120%
0
5
10
15
20
25
30
20
09
20
10
20
11
20
12
20
13
20
14
20
15
20
16
20
17
20
18
20
19
20
20
Net debt (bnZAR)
Book D/E
Net debt to EBITDA
Exhibit 98: Vodacom net debt, book value of deb-to-equity, net debt to EBITDA - historic and forecast
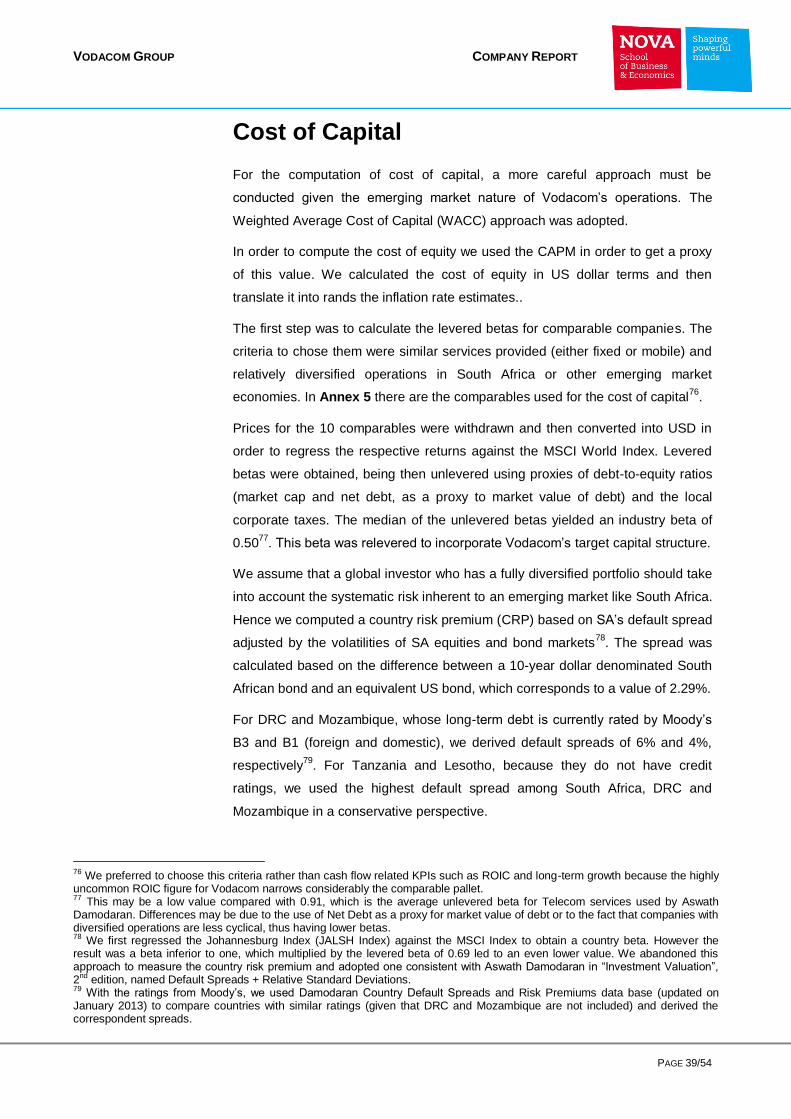
VODACOM GROUP COMPANY REPORT
PAGE 39/54
Cost of Capital
For the computation of cost of capital, a more careful approach must be
conducted given the emerging market nature of Vodacom’s operations. The
Weighted Average Cost of Capital (WACC) approach was adopted.
In order to compute the cost of equity we used the CAPM in order to get a proxy
of this value. We calculated the cost of equity in US dollar terms and then
translate it into rands the inflation rate estimates..
The first step was to calculate the levered betas for comparable companies. The
criteria to chose them were similar services provided (either fixed or mobile) and
relatively diversified operations in South Africa or other emerging market
economies. In Annex 5 there are the comparables used for the cost of capital76
.
Prices for the 10 comparables were withdrawn and then converted into USD in
order to regress the respective returns against the MSCI World Index. Levered
betas were obtained, being then unlevered using proxies of debt-to-equity ratios
(market cap and net debt, as a proxy to market value of debt) and the local
corporate taxes. The median of the unlevered betas yielded an industry beta of
0.5077
. This beta was relevered to incorporate Vodacom’s target capital structure.
We assume that a global investor who has a fully diversified portfolio should take
into account the systematic risk inherent to an emerging market like South Africa.
Hence we computed a country risk premium (CRP) based on SA’s default spread
adjusted by the volatilities of SA equities and bond markets78
. The spread was
calculated based on the difference between a 10-year dollar denominated South
African bond and an equivalent US bond, which corresponds to a value of 2.29%.
For DRC and Mozambique, whose long-term debt is currently rated by Moody’s
B3 and B1 (foreign and domestic), we derived default spreads of 6% and 4%,
respectively79
. For Tanzania and Lesotho, because they do not have credit
ratings, we used the highest default spread among South Africa, DRC and
Mozambique in a conservative perspective.
76 We preferred to choose this criteria rather than cash flow related KPIs such as ROIC and long-term growth because the highly uncommon ROIC figure for Vodacom narrows considerably the comparable pallet. 77 This may be a low value compared with 0.91, which is the average unlevered beta for Telecom services used by Aswath Damodaran. Differences may be due to the use of Net Debt as a proxy for market value of debt or to the fact that companies with diversified operations are less cyclical, thus having lower betas. 78 We first regressed the Johannesburg Index (JALSH Index) against the MSCI Index to obtain a country beta. However the result was a beta inferior to one, which multiplied by the levered beta of 0.69 led to an even lower value. We abandoned this approach to measure the country risk premium and adopted one consistent with Aswath Damodaran in “Investment Valuation”, 2nd edition, named Default Spreads + Relative Standard Deviations. 79 With the ratings from Moody’s, we used Damodaran Country Default Spreads and Risk Premiums data base (updated on January 2013) to compare countries with similar ratings (given that DRC and Mozambique are not included) and derived the correspondent spreads.
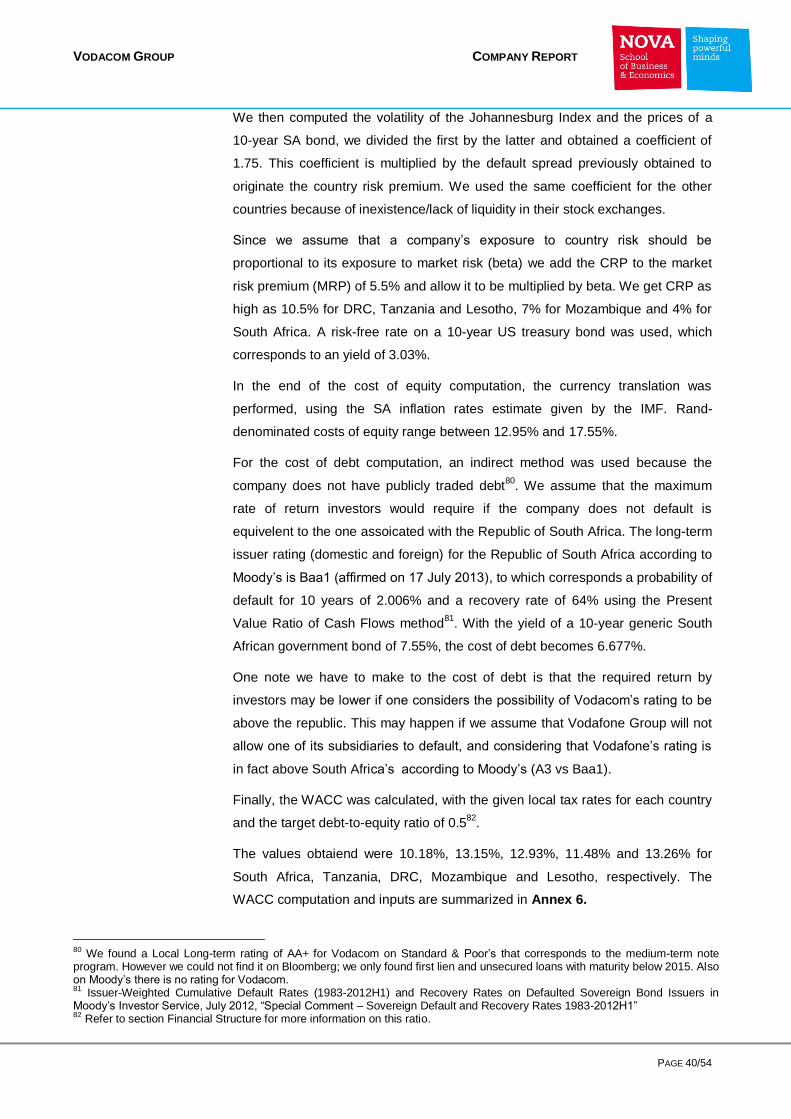
VODACOM GROUP COMPANY REPORT
PAGE 40/54
We then computed the volatility of the Johannesburg Index and the prices of a
10-year SA bond, we divided the first by the latter and obtained a coefficient of
1.75. This coefficient is multiplied by the default spread previously obtained to
originate the country risk premium. We used the same coefficient for the other
countries because of inexistence/lack of liquidity in their stock exchanges.
Since we assume that a company’s exposure to country risk should be
proportional to its exposure to market risk (beta) we add the CRP to the market
risk premium (MRP) of 5.5% and allow it to be multiplied by beta. We get CRP as
high as 10.5% for DRC, Tanzania and Lesotho, 7% for Mozambique and 4% for
South Africa. A risk-free rate on a 10-year US treasury bond was used, which
corresponds to an yield of 3.03%.
In the end of the cost of equity computation, the currency translation was
performed, using the SA inflation rates estimate given by the IMF. Rand-
denominated costs of equity range between 12.95% and 17.55%.
For the cost of debt computation, an indirect method was used because the
company does not have publicly traded debt80
. We assume that the maximum
rate of return investors would require if the company does not default is
equivelent to the one assoicated with the Republic of South Africa. The long-term
issuer rating (domestic and foreign) for the Republic of South Africa according to
Moody’s is Baa1 (affirmed on 17 July 2013), to which corresponds a probability of
default for 10 years of 2.006% and a recovery rate of 64% using the Present
Value Ratio of Cash Flows method81
. With the yield of a 10-year generic South
African government bond of 7.55%, the cost of debt becomes 6.677%.
One note we have to make to the cost of debt is that the required return by
investors may be lower if one considers the possibility of Vodacom’s rating to be
above the republic. This may happen if we assume that Vodafone Group will not
allow one of its subsidiaries to default, and considering that Vodafone’s rating is
in fact above South Africa’s according to Moody’s (A3 vs Baa1).
Finally, the WACC was calculated, with the given local tax rates for each country
and the target debt-to-equity ratio of 0.582
.
The values obtaiend were 10.18%, 13.15%, 12.93%, 11.48% and 13.26% for
South Africa, Tanzania, DRC, Mozambique and Lesotho, respectively. The
WACC computation and inputs are summarized in Annex 6.
80 We found a Local Long-term rating of AA+ for Vodacom on Standard & Poor’s that corresponds to the medium-term note program. However we could not find it on Bloomberg; we only found first lien and unsecured loans with maturity below 2015. Also on Moody’s there is no rating for Vodacom. 81 Issuer-Weighted Cumulative Default Rates (1983-2012H1) and Recovery Rates on Defaulted Sovereign Bond Issuers in Moody’s Investor Service, July 2012, “Special Comment – Sovereign Default and Recovery Rates 1983-2012H1” 82 Refer to section Financial Structure for more information on this ratio.
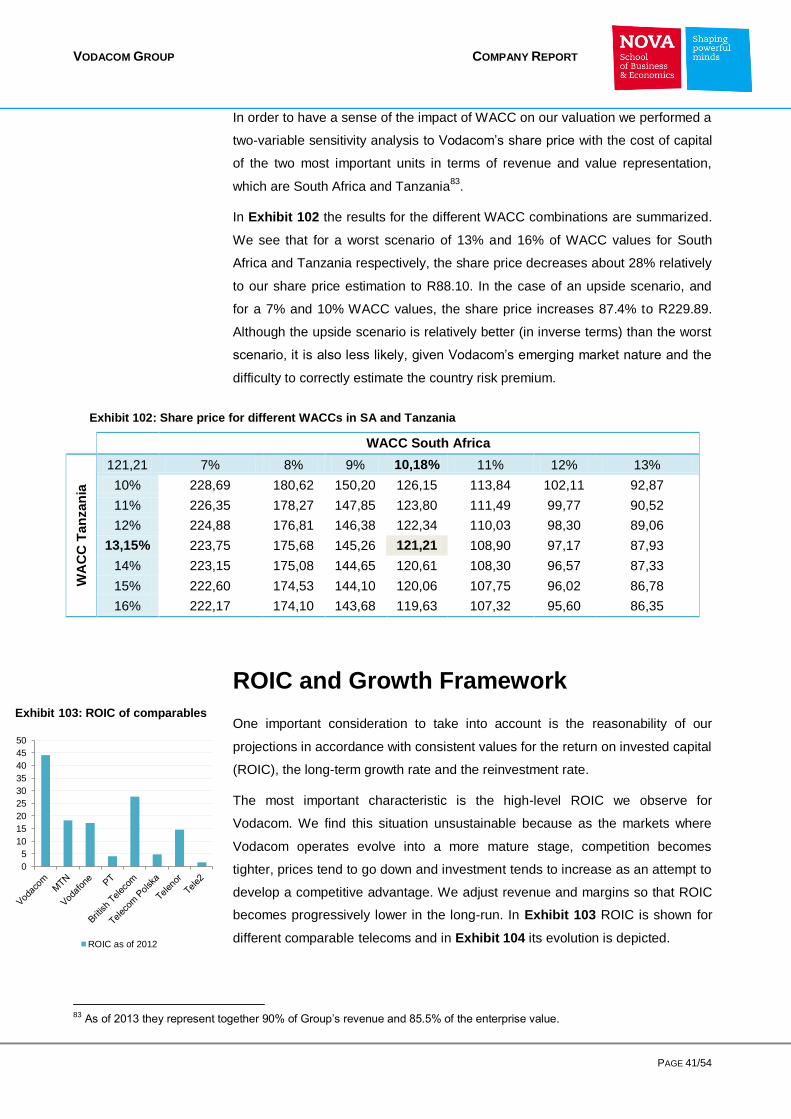
VODACOM GROUP COMPANY REPORT
PAGE 41/54
Exhibit 102: Share price for different WACCs in SA and Tanzania
In order to have a sense of the impact of WACC on our valuation we performed a
two-variable sensitivity analysis to Vodacom’s share price with the cost of capital
of the two most important units in terms of revenue and value representation,
which are South Africa and Tanzania83
.
In Exhibit 102 the results for the different WACC combinations are summarized.
We see that for a worst scenario of 13% and 16% of WACC values for South
Africa and Tanzania respectively, the share price decreases about 28% relatively
to our share price estimation to R88.10. In the case of an upside scenario, and
for a 7% and 10% WACC values, the share price increases 87.4% to R229.89.
Although the upside scenario is relatively better (in inverse terms) than the worst
scenario, it is also less likely, given Vodacom’s emerging market nature and the
difficulty to correctly estimate the country risk premium.
WACC South Africa
WA
CC
Ta
nza
nia
121,21 7% 8% 9% 10,18% 11% 12% 13%
10% 228,69 180,62 150,20 126,15 113,84 102,11 92,87
11% 226,35 178,27 147,85 123,80 111,49 99,77 90,52
12% 224,88 176,81 146,38 122,34 110,03 98,30 89,06
13,15% 223,75 175,68 145,26 121,21 108,90 97,17 87,93
14% 223,15 175,08 144,65 120,61 108,30 96,57 87,33
15% 222,60 174,53 144,10 120,06 107,75 96,02 86,78
16% 222,17 174,10 143,68 119,63 107,32 95,60 86,35
ROIC and Growth Framework
One important consideration to take into account is the reasonability of our
projections in accordance with consistent values for the return on invested capital
(ROIC), the long-term growth rate and the reinvestment rate.
The most important characteristic is the high-level ROIC we observe for
Vodacom. We find this situation unsustainable because as the markets where
Vodacom operates evolve into a more mature stage, competition becomes
tighter, prices tend to go down and investment tends to increase as an attempt to
develop a competitive advantage. We adjust revenue and margins so that ROIC
becomes progressively lower in the long-run. In Exhibit 103 ROIC is shown for
different comparable telecoms and in Exhibit 104 its evolution is depicted.
83 As of 2013 they represent together 90% of Group’s revenue and 85.5% of the enterprise value.
0
5
10
15
20
25
30
35
40
45
50
ROIC as of 2012
Exhibit 103: ROIC of comparables
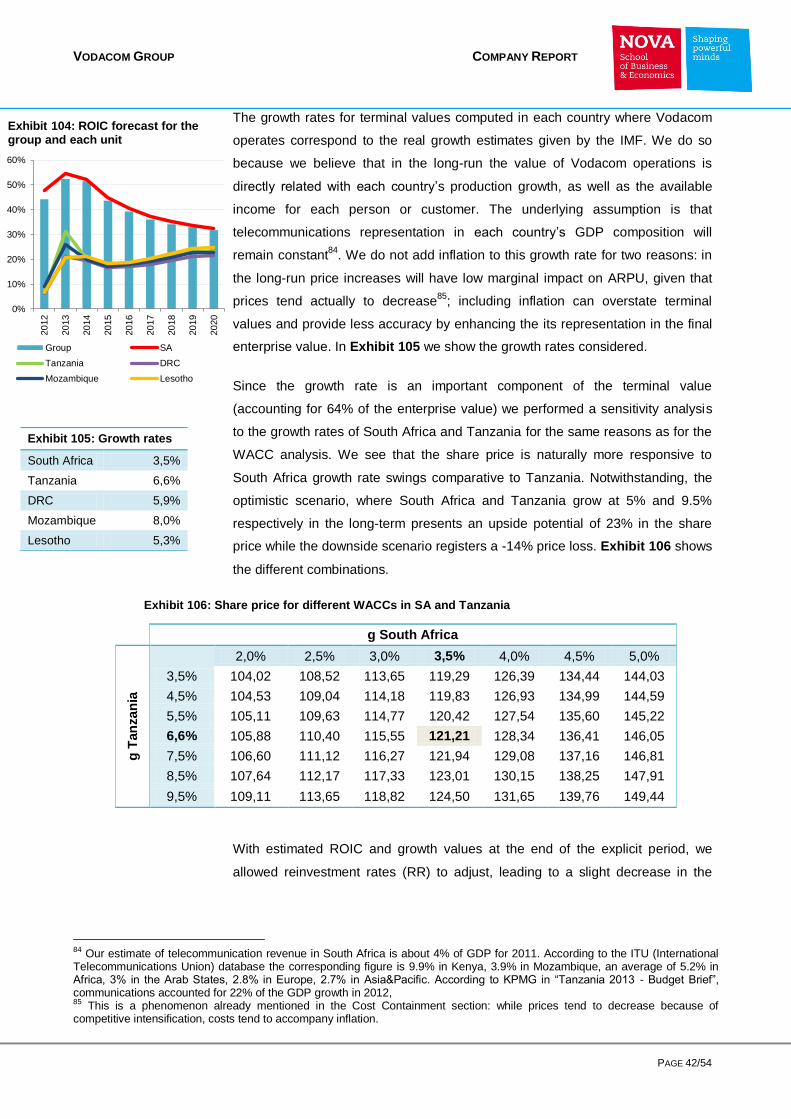
VODACOM GROUP COMPANY REPORT
PAGE 42/54
0%
10%
20%
30%
40%
50%
60%
20
12
20
13
20
14
20
15
20
16
20
17
20
18
20
19
20
20
Group SA
Tanzania DRC
Mozambique Lesotho
Exhibit 104: ROIC forecast for the group and each unit
Exhibit 106: Share price for different WACCs in SA and Tanzania
The growth rates for terminal values computed in each country where Vodacom
operates correspond to the real growth estimates given by the IMF. We do so
because we believe that in the long-run the value of Vodacom operations is
directly related with each country’s production growth, as well as the available
income for each person or customer. The underlying assumption is that
telecommunications representation in each country’s GDP composition will
remain constant84
. We do not add inflation to this growth rate for two reasons: in
the long-run price increases will have low marginal impact on ARPU, given that
prices tend actually to decrease85
; including inflation can overstate terminal
values and provide less accuracy by enhancing the its representation in the final
enterprise value. In Exhibit 105 we show the growth rates considered.
Since the growth rate is an important component of the terminal value
(accounting for 64% of the enterprise value) we performed a sensitivity analysis
to the growth rates of South Africa and Tanzania for the same reasons as for the
WACC analysis. We see that the share price is naturally more responsive to
South Africa growth rate swings comparative to Tanzania. Notwithstanding, the
optimistic scenario, where South Africa and Tanzania grow at 5% and 9.5%
respectively in the long-term presents an upside potential of 23% in the share
price while the downside scenario registers a -14% price loss. Exhibit 106 shows
the different combinations.
g South Africa
g T
an
za
nia
2,0% 2,5% 3,0% 3,5% 4,0% 4,5% 5,0%
3,5% 104,02 108,52 113,65 119,29 126,39 134,44 144,03
4,5% 104,53 109,04 114,18 119,83 126,93 134,99 144,59
5,5% 105,11 109,63 114,77 120,42 127,54 135,60 145,22
6,6% 105,88 110,40 115,55 121,21 128,34 136,41 146,05
7,5% 106,60 111,12 116,27 121,94 129,08 137,16 146,81
8,5% 107,64 112,17 117,33 123,01 130,15 138,25 147,91
9,5% 109,11 113,65 118,82 124,50 131,65 139,76 149,44
With estimated ROIC and growth values at the end of the explicit period, we
allowed reinvestment rates (RR) to adjust, leading to a slight decrease in the
84 Our estimate of telecommunication revenue in South Africa is about 4% of GDP for 2011. According to the ITU (International Telecommunications Union) database the corresponding figure is 9.9% in Kenya, 3.9% in Mozambique, an average of 5.2% in Africa, 3% in the Arab States, 2.8% in Europe, 2.7% in Asia&Pacific. According to KPMG in “Tanzania 2013 - Budget Brief”, communications accounted for 22% of the GDP growth in 2012, 85 This is a phenomenon already mentioned in the Cost Containment section: while prices tend to decrease because of competitive intensification, costs tend to accompany inflation.
Exhibit 105: Growth rates
South Africa 3,5%
Tanzania 6,6%
DRC 5,9%
Mozambique 8,0%
Lesotho 5,3%
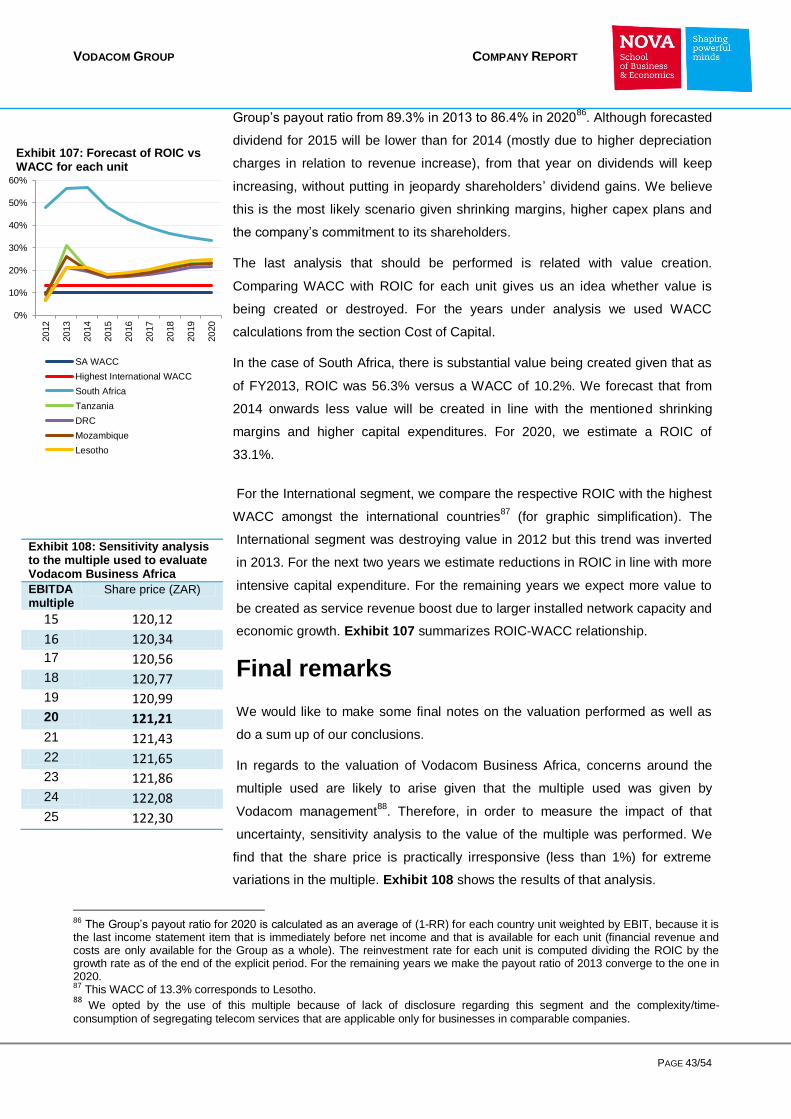
VODACOM GROUP COMPANY REPORT
PAGE 43/54
Group’s payout ratio from 89.3% in 2013 to 86.4% in 202086
. Although forecasted
dividend for 2015 will be lower than for 2014 (mostly due to higher depreciation
charges in relation to revenue increase), from that year on dividends will keep
increasing, without putting in jeopardy shareholders’ dividend gains. We believe
this is the most likely scenario given shrinking margins, higher capex plans and
the company’s commitment to its shareholders.
The last analysis that should be performed is related with value creation.
Comparing WACC with ROIC for each unit gives us an idea whether value is
being created or destroyed. For the years under analysis we used WACC
calculations from the section Cost of Capital.
In the case of South Africa, there is substantial value being created given that as
of FY2013, ROIC was 56.3% versus a WACC of 10.2%. We forecast that from
2014 onwards less value will be created in line with the mentioned shrinking
margins and higher capital expenditures. For 2020, we estimate a ROIC of
33.1%.
For the International segment, we compare the respective ROIC with the highest
WACC amongst the international countries87
(for graphic simplification). The
International segment was destroying value in 2012 but this trend was inverted
in 2013. For the next two years we estimate reductions in ROIC in line with more
intensive capital expenditure. For the remaining years we expect more value to
be created as service revenue boost due to larger installed network capacity and
economic growth. Exhibit 107 summarizes ROIC-WACC relationship.
Final remarks
We would like to make some final notes on the valuation performed as well as
do a sum up of our conclusions.
In regards to the valuation of Vodacom Business Africa, concerns around the
multiple used are likely to arise given that the multiple used was given by
Vodacom management88
. Therefore, in order to measure the impact of that
uncertainty, sensitivity analysis to the value of the multiple was performed. We
find that the share price is practically irresponsive (less than 1%) for extreme
variations in the multiple. Exhibit 108 shows the results of that analysis.
86 The Group’s payout ratio for 2020 is calculated as an average of (1-RR) for each country unit weighted by EBIT, because it is the last income statement item that is immediately before net income and that is available for each unit (financial revenue and costs are only available for the Group as a whole). The reinvestment rate for each unit is computed dividing the ROIC by the growth rate as of the end of the explicit period. For the remaining years we make the payout ratio of 2013 converge to the one in 2020. 87 This WACC of 13.3% corresponds to Lesotho. 88 We opted by the use of this multiple because of lack of disclosure regarding this segment and the complexity/time-
consumption of segregating telecom services that are applicable only for businesses in comparable companies.
Exhibit 108: Sensitivity analysis to the multiple used to evaluate Vodacom Business Africa
EBITDA multiple
Share price (ZAR)
15 120,12
16 120,34
17 120,56
18 120,77 19 120,99 20 121,21
21 121,43
22 121,65 23 121,86
24 122,08
25 122,30
0%
10%
20%
30%
40%
50%
60%
20
12
20
13
20
14
20
15
20
16
20
17
20
18
20
19
20
20
SA WACC
Highest International WACC
South Africa
Tanzania
DRC
Mozambique
Lesotho
Exhibit 107: Forecast of ROIC vs WACC for each unit
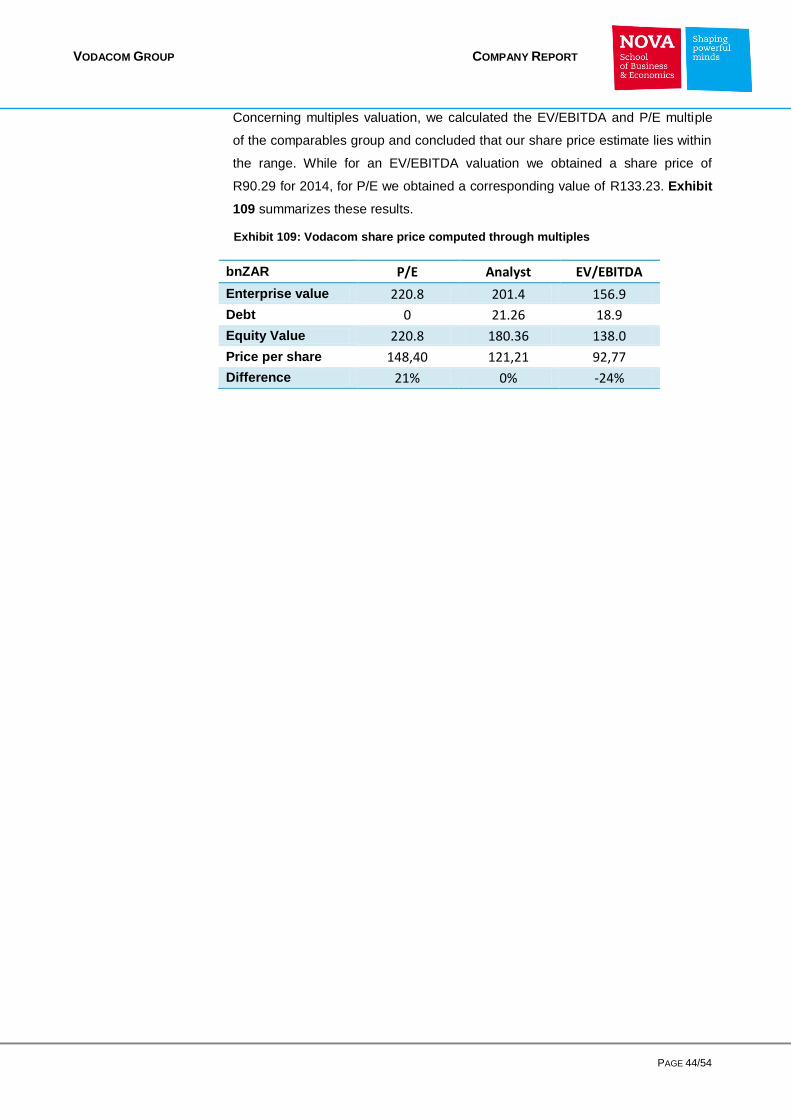
VODACOM GROUP COMPANY REPORT
PAGE 44/54
Exhibit 109: Vodacom share price computed through multiples
Concerning multiples valuation, we calculated the EV/EBITDA and P/E multiple
of the comparables group and concluded that our share price estimate lies within
the range. While for an EV/EBITDA valuation we obtained a share price of
R90.29 for 2014, for P/E we obtained a corresponding value of R133.23. Exhibit
109 summarizes these results.
bnZAR P/E Analyst EV/EBITDA
Enterprise value 220.8 201.4 156.9
Debt 0 21.26 18.9
Equity Value 220.8 180.36 138.0
Price per share 148,40 121,21 92,77
Difference 21% 0% -24%
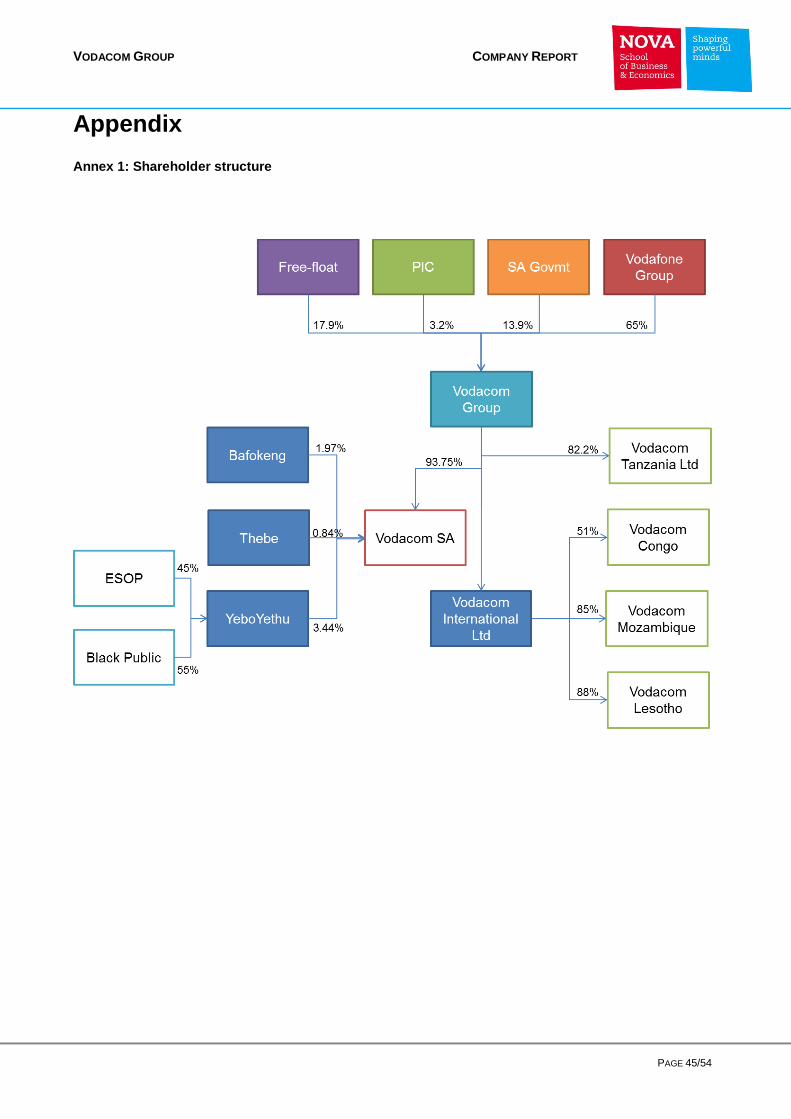
VODACOM GROUP COMPANY REPORT
PAGE 45/54
Appendix
Annex 1: Shareholder structure
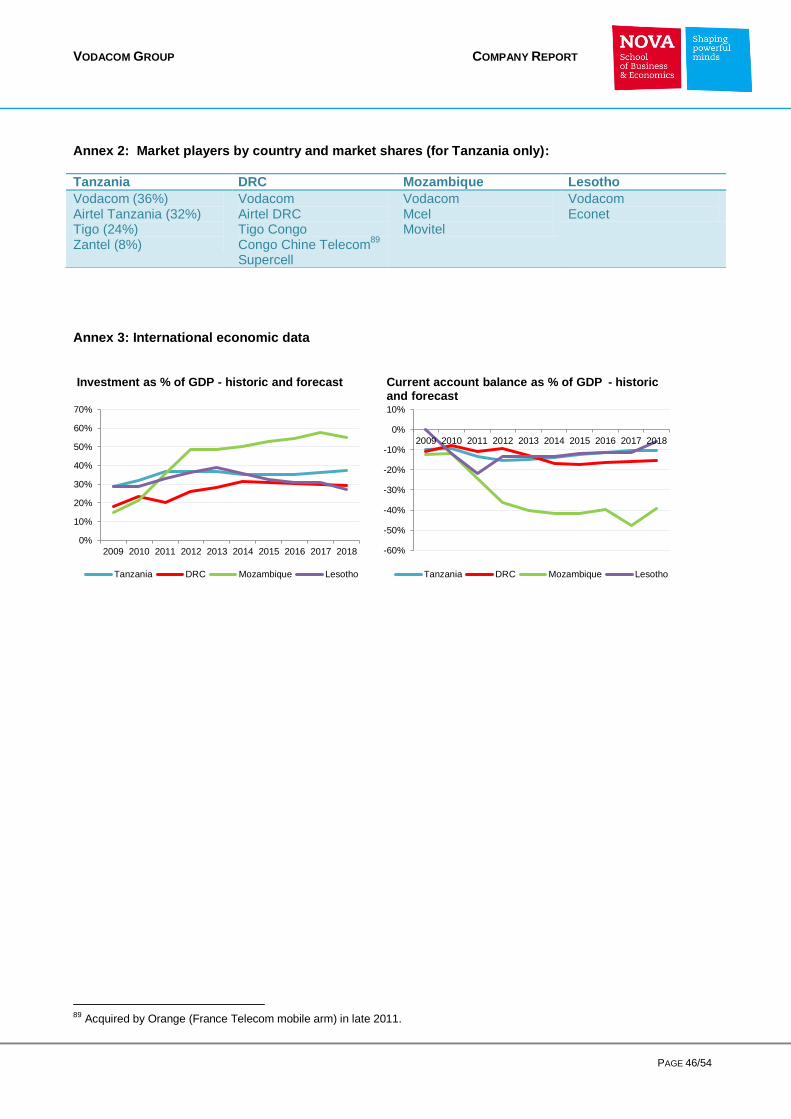
VODACOM GROUP COMPANY REPORT
PAGE 46/54
Annex 2: Market players by country and market shares (for Tanzania only):
Annex 3: International economic data
89 Acquired by Orange (France Telecom mobile arm) in late 2011.
Tanzania DRC Mozambique Lesotho
Vodacom (36%) Airtel Tanzania (32%) Tigo (24%) Zantel (8%)
Vodacom Airtel DRC Tigo Congo Congo Chine Telecom
89
Supercell
Vodacom Mcel Movitel
Vodacom Econet
-60%
-50%
-40%
-30%
-20%
-10%
0%
10%
2009 2010 2011 2012 2013 2014 2015 2016 2017 2018
Tanzania DRC Mozambique Lesotho
Current account balance as % of GDP - historic and forecast
0%
10%
20%
30%
40%
50%
60%
70%
2009 2010 2011 2012 2013 2014 2015 2016 2017 2018
Tanzania DRC Mozambique Lesotho
Investment as % of GDP - historic and forecast
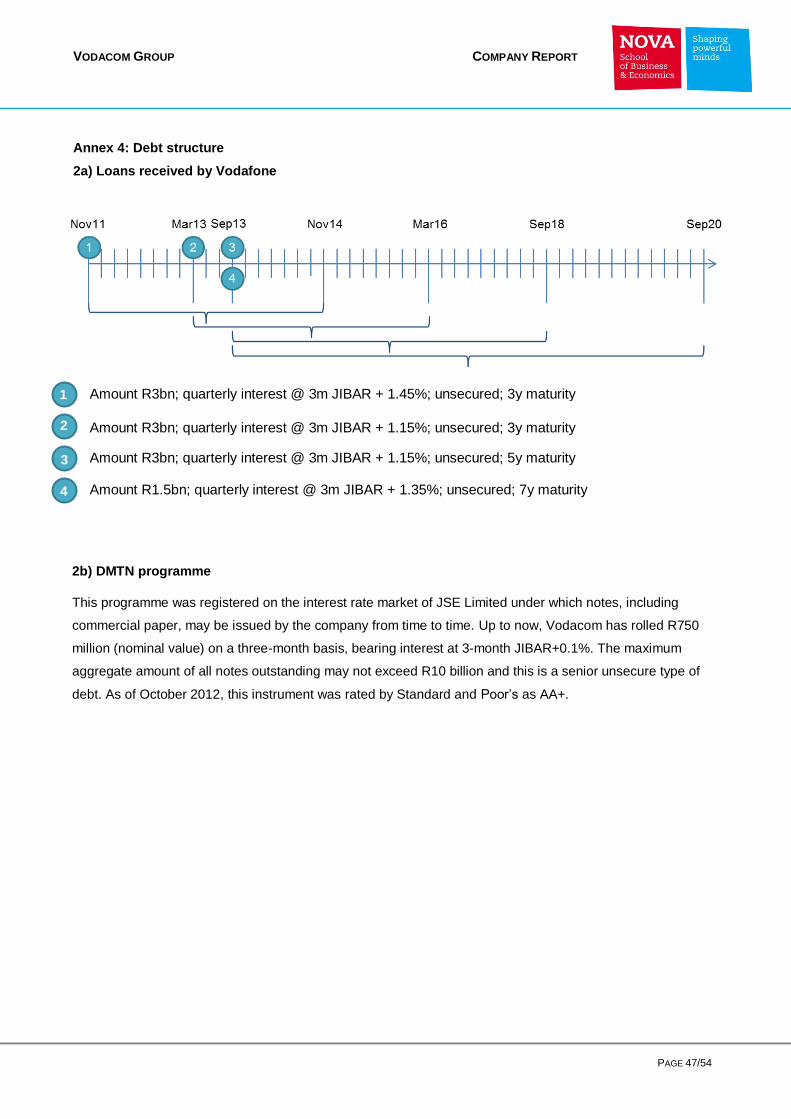
VODACOM GROUP COMPANY REPORT
PAGE 47/54
Annex 4: Debt structure
2a) Loans received by Vodafone
Amount R3bn; quarterly interest @ 3m JIBAR + 1.45%; unsecured; 3y maturity
Amount R3bn; quarterly interest @ 3m JIBAR + 1.15%; unsecured; 3y maturity
Amount R3bn; quarterly interest @ 3m JIBAR + 1.15%; unsecured; 5y maturity
Amount R1.5bn; quarterly interest @ 3m JIBAR + 1.35%; unsecured; 7y maturity
1
2
3
4
2b) DMTN programme
This programme was registered on the interest rate market of JSE Limited under which notes, including
commercial paper, may be issued by the company from time to time. Up to now, Vodacom has rolled R750
million (nominal value) on a three-month basis, bearing interest at 3-month JIBAR+0.1%. The maximum
aggregate amount of all notes outstanding may not exceed R10 billion and this is a senior unsecure type of
debt. As of October 2012, this instrument was rated by Standard and Poor’s as AA+.

VODACOM GROUP COMPANY REPORT
PAGE 48/54
Annex 5: List of comparable companies
Annex 6: WACC computation
Company Listing Geographic operations
MTN Group
Johannesburg, SA
Main markets: South Africa, Nigeria, Iran, Ghana, Cameroon, Ivory Coast, Uganda, Syria, Sudan. Others: Guinea Bissau, Guinea Conakry, Liberia, Benin, Cyprus, Dubai, Afghanistan, Yemen, South Sudan, Rwanda, Congo, Zambia, Botswana, Swaziland
Vodafone Group
London, UK Subsidiaries: Albania, Czech Republic, Germany, Greece, Hungary, Ireland, Malta, Netherlands, Portugal, Romania, Spain, Turkey, UK, Egypt, Ghana, India, New Zealand, Qatar, Vodacom Group. Joint-ventures: Australia, Italy, Fiji. Associates: Safaricom (Kenya)
PT Lisbon, Portugal
Main markets: Portugal, Brazil. Others: Angola, Namibia, Cape Verde, S. Tomé e Principe, Macau and Timor-Leste
Telecom Italia
Milan, Italy Main markets: Italy, Brazil, Argentina. Others: Europe, Asia and South America.
British Telecom
London, UK Operations in over 170 countries
Orange Polska
Warsow, Poland
Main markets: France, Spain, Poland. Others: Belgium, Luxembourg, Dominican Republic, Slovakia, Romania, Moldova, Armenia and presence in Africa and Middle East.
Telenor Oslo, Norway Main markets: Norway, Sweden, Denmark, Hungary, Serbia, Montenegro, Thailand, Bangladesh, India, Malaysia, Pakistan
Tele2 Stockholm, Sweden
Main markets: Sweden, Norway, Netherlands, Lithuania, Russia, Kazakhstan,
Telekom Austria
Vienna, Austria Austria, Bulgaria, Croatia. Others: Belarus, Slovenia, Serbia, Macedonia, Liechtenstein
South Africa Tanzania DRC Mozambique Lesotho
10y US Treasury bond 3,03% 3,03% 3,03% 3,03% 3,03%
risk-free rate 6,22% 6,35% 6,93% 7,03% 7,33%
Industry β unlevered 0,50 0,50 0,50 0,50 0,51
Tax rate 28% 30% 40% 32% 25%
Target D/E 0,50 50% 50% 50% 50%
β levered 0,69 0,69 0,69 0,69 0,69
SA 10y WB 5,046%
US 10y WB 2,754%
Default spread 2,29% 6,00% 6,00% 4,00% 6,00%
σ SA equities 17,8% 17,8% 17,8% 17,8% 17,8%
σ SA bond 10,2% 10,2% 10,2% 10,2% 10,2%
coeff 1,747 1,747 1,747 1,747 1,747
CRP 4,0% 10,5% 10,5% 7,0% 10,5%
MRP 5,50% 5,50% 5,50% 5,50% 5,50%
CPI country 4,8% 4,93% 5,50% 5,60% 5,90%
CPI US 1,66% 1,66% 1,66% 1,66% 1,66%
differential 1,0309 1,032 1,038 1,039 1,042
COST OF EQUITY 12,86% 17,39% 17,39% 14,95% 17,39%
COST OF DEBT 6,68% 6,68% 6,68% 6,68% 6,68%
WACC 10,18% 13,15% 12,93% 11,48% 13,26%

VODACOM GROUP COMPANY REPORT
PAGE 49/54
Summary Tables and Financial Statements
Summary of historic quarterly revenue for the Group
FY March Mar-11 Jun-11 Sep-11 Dec-11 Mar-12 Jun-12 Sep-12 Dec-12 Mar-13 Jun-13 Sep-13
mZAR 4Q11 1Q12 2Q12 3Q12 4Q12 1Q13 2Q13 3Q13 4Q13 1Q14 2Q14
South Africa
Voice 7 246 7 028 7 258 7 753 7 356 7 136 7 364 7 573 7 078 6 956 7 166
Interconnect 1 637 1 469 1 530 1 611 1 452 1 215 1 256 1 317 1 128 930 958
Data 1 689 1 856 1 864 1 929 1 990 2 044 2 180 2 261 2 397 2 489 2 607 Service Revenue 11 863 11 558 11 891 12 755 12 223 11 769 11 988 12 532 11 945 11 678 12 059
Equipment 1 504 1 819 1 777 2 208 2 013 2 021 2 258 2 808 2 653 2 703 3 340
Revenue 13 602 13 537 13 881 15 135 14 379 14 007 14 426 15 475 14 699 14 549 15 575
International
Voice 906 942 1 126 1440 1 362 1 490 1 564 1 719 1 486 1805 2 078
Interconnect 174 157 190 213 216 231 276 311 249 300 393
Data 69 90 114 153 183 225 266 306 320 421 564 Service Revenue 2 080 2 064 2 326 2 905 2 848 3 028 2 964 2 786 2 480 2 981 3 535
Equipment 26 30 35 39 34 27 33 41 36 43 66
Revenue 2 138 2 119 2 394 2 983 2 930 3 097 3 058 2 875 2 553 3 065 3 655
Group Service
Revenue 13 856 13 552 14 144 15 567 14 982 14 736 14 896 15 298 14 406 14 639 15 564
Revenue 15 618 15 569 16 178 17 997 17 185 17 024 17 402 18 294 17 197 17 536 19 143
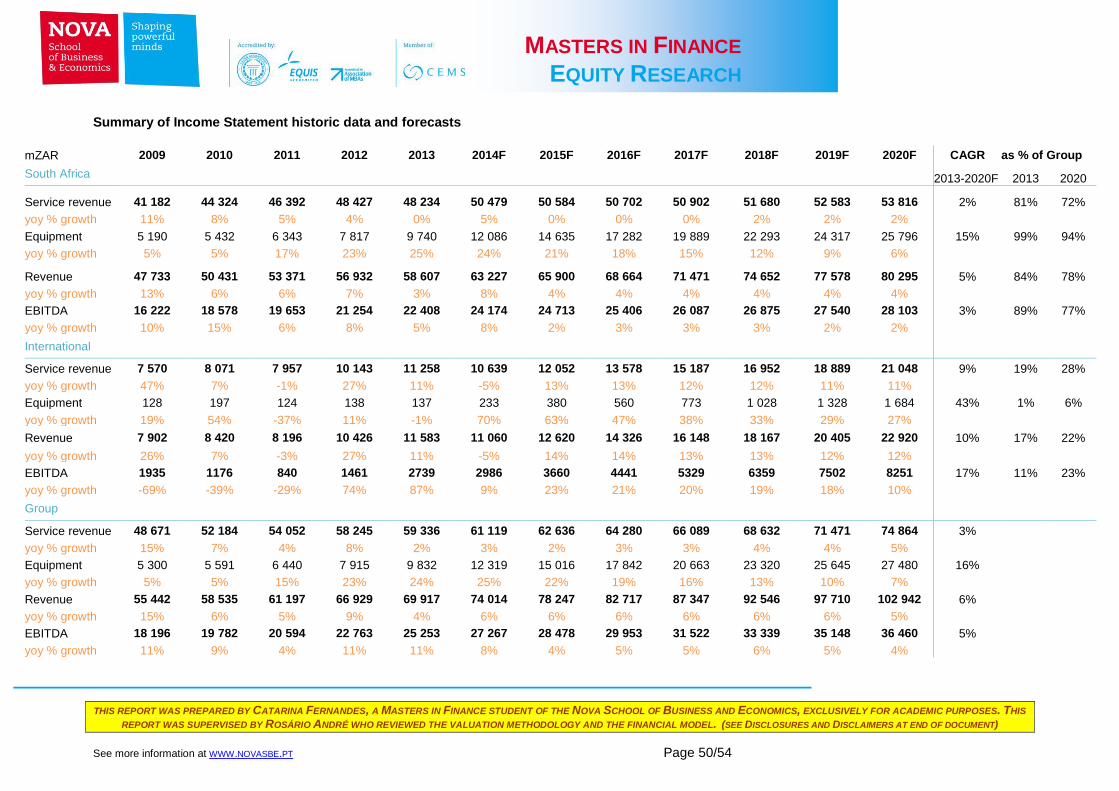
THIS REPORT WAS PREPARED BY CATARINA FERNANDES, A MASTERS IN FINANCE STUDENT OF THE NOVA SCHOOL OF BUSINESS AND ECONOMICS, EXCLUSIVELY FOR ACADEMIC PURPOSES. THIS
REPORT WAS SUPERVISED BY ROSÁRIO ANDRÉ WHO REVIEWED THE VALUATION METHODOLOGY AND THE FINANCIAL MODEL. (SEE DISCLOSURES AND DISCLAIMERS AT END OF DOCUMENT)
See more information at WWW.NOVASBE.PT Page 50/54
MASTERS IN FINANCE
EQUITY RESEARCH Summary of Income Statement historic data and forecasts
mZAR 2009 2010 2011 2012 2013 2014F 2015F 2016F 2017F 2018F 2019F 2020F CAGR as % of Group
South Africa
2013-2020F 2013 2020
Service revenue 41 182 44 324 46 392 48 427 48 234 50 479 50 584 50 702 50 902 51 680 52 583 53 816 2% 81% 72%
yoy % growth 11% 8% 5% 4% 0% 5% 0% 0% 0% 2% 2% 2% Equipment 5 190 5 432 6 343 7 817 9 740 12 086 14 635 17 282 19 889 22 293 24 317 25 796 15% 99% 94%
yoy % growth 5% 5% 17% 23% 25% 24% 21% 18% 15% 12% 9% 6%
Revenue 47 733 50 431 53 371 56 932 58 607 63 227 65 900 68 664 71 471 74 652 77 578 80 295 5% 84% 78%
yoy % growth 13% 6% 6% 7% 3% 8% 4% 4% 4% 4% 4% 4% EBITDA 16 222 18 578 19 653 21 254 22 408 24 174 24 713 25 406 26 087 26 875 27 540 28 103 3% 89% 77%
yoy % growth 10% 15% 6% 8% 5% 8% 2% 3% 3% 3% 2% 2% International
Service revenue 7 570 8 071 7 957 10 143 11 258 10 639 12 052 13 578 15 187 16 952 18 889 21 048 9% 19% 28%
yoy % growth 47% 7% -1% 27% 11% -5% 13% 13% 12% 12% 11% 11% Equipment 128 197 124 138 137 233 380 560 773 1 028 1 328 1 684 43% 1% 6%
yoy % growth 19% 54% -37% 11% -1% 70% 63% 47% 38% 33% 29% 27% Revenue 7 902 8 420 8 196 10 426 11 583 11 060 12 620 14 326 16 148 18 167 20 405 22 920 10% 17% 22%
yoy % growth 26% 7% -3% 27% 11% -5% 14% 14% 13% 13% 12% 12% EBITDA 1935 1176 840 1461 2739 2986 3660 4441 5329 6359 7502 8251 17% 11% 23%
yoy % growth -69% -39% -29% 74% 87% 9% 23% 21% 20% 19% 18% 10% Group
Service revenue 48 671 52 184 54 052 58 245 59 336 61 119 62 636 64 280 66 089 68 632 71 471 74 864 3% yoy % growth 15% 7% 4% 8% 2% 3% 2% 3% 3% 4% 4% 5%
Equipment 5 300 5 591 6 440 7 915 9 832 12 319 15 016 17 842 20 663 23 320 25 645 27 480 16% yoy % growth 5% 5% 15% 23% 24% 25% 22% 19% 16% 13% 10% 7%
Revenue 55 442 58 535 61 197 66 929 69 917 74 014 78 247 82 717 87 347 92 546 97 710 102 942 6% yoy % growth 15% 6% 5% 9% 4% 6% 6% 6% 6% 6% 6% 5%
EBITDA 18 196 19 782 20 594 22 763 25 253 27 267 28 478 29 953 31 522 33 339 35 148 36 460 5% yoy % growth 11% 9% 4% 11% 11% 8% 4% 5% 5% 6% 5% 4%

THIS REPORT WAS PREPARED BY CATARINA FERNANDES, A MASTERS IN FINANCE STUDENT OF THE NOVA SCHOOL OF BUSINESS AND
ECONOMICS, EXCLUSIVELY FOR ACADEMIC PURPOSES. THIS REPORT WAS SUPERVISED BY ROSÁRIO ANDRÉ WHO REVIEWED THE
VALUATION METHODOLOGY AND THE FINANCIAL MODEL. (SEE DISCLOSURES AND DISCLAIMERS AT END OF DOCUMENT)
See more information at WWW.NOVASBE.PT Page 51/54
MASTERS IN FINANCE
EQUITY RESEARCH
Consolidated Income Statement
mZAR 2012 2013 2014F 2015F 2016F 2017F 2018F 2019F 2020F
Total revenue 66 929 69 917 74 014 78 247 82 717 87 347 92 546 97 710 102 942
EBITDA 22 763 25 253 27 267 28 478 29 953 31 522 33 339 35 148 36 460
Depreciation (4 860) (5 338) (6 174) (7 047) (7 907) (8 667) (9 386) (10 006) (10 427)
Amortisation (1 022) (1 026) (1 075) (1 144) (1 218) (1 295) (1 381) (1 469) (1 560)
Impairment losses ( 199) ( 14) 0 0 0 0 0 0 0
BBBEEC 0 0 0 0 0 0 0 0 0
Operating profit 16 617 18 897 20 018 20 287 20 827 21 560 22 571 23 673 24 473
Profit on subsidiary 0 224 0 0 0 0 0 0 0
Finance income 109 117 117 117 117 117 117 117 117
Finance costs ( 748) ( 927) (1 360) (1 692) (1 992) (2 272) (2 513) (2 708) (2 830) (Loss)/Gain on remeasurement and disposal of financial instruments ( 45) 123 0 0 0 0 0 0 0
Loss from associate 0 0 0 0 0 0 0 0 0
Profit before tax 15 933 18 434 18 775 18 713 18 952 19 405 20 175 21 081 21 760
Taxation (5 730) (5 210) (5 306) (5 289) (5 356) (5 485) (5 702) (5 958) (6 150)
Net profit 10 203 13 224 13 468 13 424 13 596 13 921 14 473 15 123 15 610
- Owners of the parent 10 156 12 991 13 231 13 187 13 356 13 676 14 218 14 856 15 335
- Non-controlling interests 47 233 237 237 240 245 255 266 275
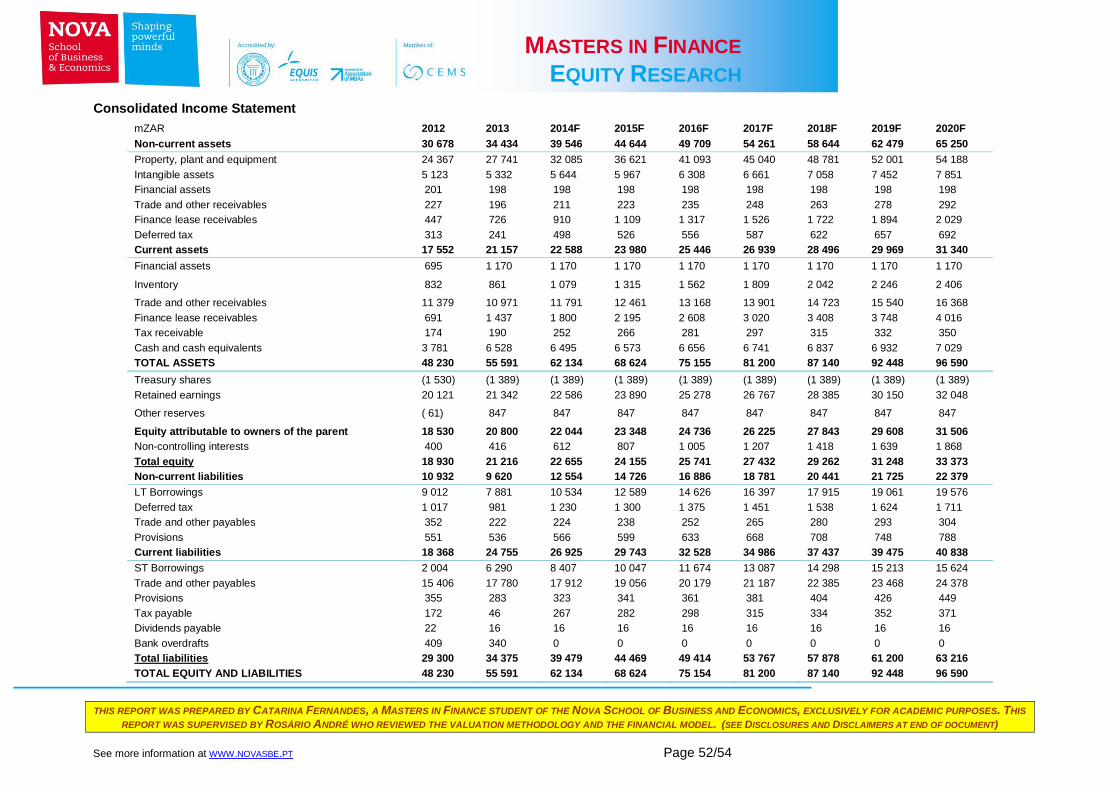
THIS REPORT WAS PREPARED BY CATARINA FERNANDES, A MASTERS IN FINANCE STUDENT OF THE NOVA SCHOOL OF BUSINESS AND ECONOMICS, EXCLUSIVELY FOR ACADEMIC PURPOSES. THIS
REPORT WAS SUPERVISED BY ROSÁRIO ANDRÉ WHO REVIEWED THE VALUATION METHODOLOGY AND THE FINANCIAL MODEL. (SEE DISCLOSURES AND DISCLAIMERS AT END OF DOCUMENT)
See more information at WWW.NOVASBE.PT Page 52/54
MASTERS IN FINANCE
EQUITY RESEARCH
Consolidated Income Statement
mZAR 2012 2013 2014F 2015F 2016F 2017F 2018F 2019F 2020F
Non-current assets 30 678 34 434 39 546 44 644 49 709 54 261 58 644 62 479 65 250
Property, plant and equipment 24 367 27 741 32 085 36 621 41 093 45 040 48 781 52 001 54 188
Intangible assets 5 123 5 332 5 644 5 967 6 308 6 661 7 058 7 452 7 851
Financial assets 201 198 198 198 198 198 198 198 198
Trade and other receivables 227 196 211 223 235 248 263 278 292
Finance lease receivables 447 726 910 1 109 1 317 1 526 1 722 1 894 2 029
Deferred tax 313 241 498 526 556 587 622 657 692
Current assets 17 552 21 157 22 588 23 980 25 446 26 939 28 496 29 969 31 340
Financial assets 695 1 170 1 170 1 170 1 170 1 170 1 170 1 170 1 170
Inventory 832 861 1 079 1 315 1 562 1 809 2 042 2 246 2 406
Trade and other receivables 11 379 10 971 11 791 12 461 13 168 13 901 14 723 15 540 16 368
Finance lease receivables 691 1 437 1 800 2 195 2 608 3 020 3 408 3 748 4 016
Tax receivable 174 190 252 266 281 297 315 332 350
Cash and cash equivalents 3 781 6 528 6 495 6 573 6 656 6 741 6 837 6 932 7 029
TOTAL ASSETS 48 230 55 591 62 134 68 624 75 155 81 200 87 140 92 448 96 590
Treasury shares (1 530) (1 389) (1 389) (1 389) (1 389) (1 389) (1 389) (1 389) (1 389)
Retained earnings 20 121 21 342 22 586 23 890 25 278 26 767 28 385 30 150 32 048
Other reserves ( 61) 847 847 847 847 847 847 847 847
Equity attributable to owners of the parent 18 530 20 800 22 044 23 348 24 736 26 225 27 843 29 608 31 506
Non-controlling interests 400 416 612 807 1 005 1 207 1 418 1 639 1 868
Total equity 18 930 21 216 22 655 24 155 25 741 27 432 29 262 31 248 33 373
Non-current liabilities 10 932 9 620 12 554 14 726 16 886 18 781 20 441 21 725 22 379
LT Borrowings 9 012 7 881 10 534 12 589 14 626 16 397 17 915 19 061 19 576
Deferred tax 1 017 981 1 230 1 300 1 375 1 451 1 538 1 624 1 711
Trade and other payables 352 222 224 238 252 265 280 293 304
Provisions 551 536 566 599 633 668 708 748 788
Current liabilities 18 368 24 755 26 925 29 743 32 528 34 986 37 437 39 475 40 838
ST Borrowings 2 004 6 290 8 407 10 047 11 674 13 087 14 298 15 213 15 624
Trade and other payables 15 406 17 780 17 912 19 056 20 179 21 187 22 385 23 468 24 378
Provisions 355 283 323 341 361 381 404 426 449
Tax payable 172 46 267 282 298 315 334 352 371
Dividends payable 22 16 16 16 16 16 16 16 16
Bank overdrafts 409 340 0 0 0 0 0 0 0
Total liabilities 29 300 34 375 39 479 44 469 49 414 53 767 57 878 61 200 63 216
TOTAL EQUITY AND LIABILITIES 48 230 55 591 62 134 68 624 75 154 81 200 87 140 92 448 96 590

THIS REPORT WAS PREPARED BY CATARINA FERNANDES, A MASTERS IN FINANCE STUDENT OF THE NOVA SCHOOL OF BUSINESS AND
ECONOMICS, EXCLUSIVELY FOR ACADEMIC PURPOSES. THIS REPORT WAS SUPERVISED BY ROSÁRIO ANDRÉ WHO REVIEWED THE
VALUATION METHODOLOGY AND THE FINANCIAL MODEL. (SEE DISCLOSURES AND DISCLAIMERS AT END OF DOCUMENT)
See more information at WWW.NOVASBE.PT Page 53/54
MASTERS IN FINANCE
EQUITY RESEARCH
Consolidated Cash Flow Map
mZAR 2012 2013 2014F 2015F 2016F 2017F 2018F 2019F 2020F
EBITDA 22 763 25 253 27 267 28 478 29 953 31 522 33 339 35 148 36 460
Less: Dep (4 860) (5 338) (6 174) (7 047) (7 907) (8 667) (9 386) (10 006) (10 427)
EBITA 17 838 19 937 21 093 21 432 22 046 22 855 23 953 25 142 26 033
Tax Adjustment 440 348 345 374 408 446 490 539 579
Taxes (6 416) (5 690) (6 005) (6 112) (6 300) (6 548) (6 880) (7 243) (7 512)
NOPLAT 11 862 14 595 15 432 15 694 16 153 16 753 17 562 18 437 19 101
Add: Dep 4 860 5 338 6 174 7 047 7 907 8 667 9 386 10 006 10 427
Operational Gross CF 16 722 19 933 21 606 22 740 24 060 25 420 26 949 28 443 29 527
Capex (7 650) (8 712) (10 518) (11 582) (12 380) (12 614) (13 127) (13 227) (12 614)
∆ Intangibles+Am (incl. ImpL) (1 129) (1 249) (1 387) (1 467) (1 559) (1 648) (1 778) (1 863) (1 959)
∆ NWC 611 653 (968) (711) (744) (738) (672) (571) (418) ∆ Other operating assets & liabilities 1 071 804 (314) 323 255 107 187 77 (111)
Operational Investing CF (7 097) (8 504) (13 188) (13 437) (14 428) (14 893) (15 390) (15 583) (15 102)
OPERATIONAL FCF 9 625 11 429 8 419 9 303 9 632 10 527 11 559 12 860 14 426
Financial Revenues 64 464 117 117 117 117 117 117 117
Taxes paid (23) (132) (33) (33) (33) (34) (34) (34) (34)
Non-operating gross CF 41 332 84 84 84 83 83 83 83
Non-operating investing CF (2 778) (3 246)90
70 51 54 56 62 62 63
NON-OPERATIONAL FCF (2 737) (2 915) 154 134 137 139 146 145 146
6 888 8 514 8 573 9 438 9 769 10 667 11 705 13 005 14 572
FCF
∆ Debt 1 031 3 086 4 430 3 696 3 664 3 184 2 730 2 060 926
∆ Other financial A&L91
(1) 6 0 0 0 0 0 0 0
∆ Equity (7 453) (10 938) (12 029) (11 924) (12 010) (12 229) (12 644) (13 137) (13 484)
Interests paid (748) (927) (1 360) (1 692) (1 992) (2 272) (2 513) (2 708) (2 830)
ITS 269 265 387 483 569 651 722 780 817
∆ Dividends payable 14 (6) 0 0 0 0 0 0 0
CF from Financing (6 888) (8 514) (8 572) (9 438) (9 769) (10 667) (11 705) (13 005) (14 572)
Notes to designations in the CF map:
∆ Stands for annual change or variation
A&L stands for assets net of liabilities ITS stands for interest tax shield
90 The large amount of investment in Non-operating investing cash flow for 2013, as well as the year before, comes from
increases in excess cash, which believe to become stable in the future. 91 Other financial assets and liabilities refer to net derivative financial instruments that are not considered interest bearing debt.

VODACOM GROUP COMPANY REPORT
PAGE 54/54
Disclosures and Disclaimer
Research Recommendations
Buy Expected total return (including dividends) of more than 15% over a 12-month period.
Hold Expected total return (including dividends) between 0% and 15% over a 12-month period.
Sell Expected negative total return (including dividends) over a 12-month period.
This report was prepared by “Student’s Name”, a student of the NOVA School of Business and Economics, following the Masters in Finance Equity Research – Field Lab Work Project, exclusively for academic purposes. Thus, the author, which is a Masters in Finance student, is the sole responsible for the information and estimates contained herein and for the opinions expressed, which reflect exclusively his/her own personal judgement. This report was supervised by professor Rosário André (registered with Comissão do Mercado de Valores Mobiliários as financial analyst) who revised the valuation methodology and the financial model. All opinions and estimates are subject to change without notice. NOVA SBE or its faculty accepts no responsibility whatsoever for the content of this report nor for any consequences of its use. The information contained herein has been compiled by students from public sources believed to be reliable, but NOVA SBE or the students make no representation that it is accurate or complete, and accept no liability whatsoever for any direct or indirect loss resulting from the use of this report or its content. The author hereby certifies that the views expressed in this report accurately reflect his/her personal opinion about the subject company and its securities. He/she has not received or been promised any direct or indirect compensation for expressing the opinions or recommendation included in this report. The author of this report may have a position, or otherwise be interested, in transactions in securities which are directly or indirectly the subject of this report. NOVA SBE may have received compensation from the subject company during the last 12 months related to its fund raising program. Nevertheless, no compensation eventually received by NOVA SBE is in any way related to or dependent on the opinions expressed in this report. The Nova School of Business and Economics, though registered with Comissão do Mercado de Valores Mobiliários, does not deal for or otherwise offers any investment or intermediation services to market counterparties, private or intermediate customers. This report may not be reproduced, distributed or published without the explicit previous consent of its author, unless when used by NOVA SBE for academic purposes only. At any time, NOVA SBE may decide to suspend this report reproduction or distribution without further notice.