Embed Size (px)
Citation preview
A study to examine the importance of forecast accuracy to supply chain performance: A case study at a company from the FMCG industry
Author: Ömer Avci University of Twente
P.O. Box 217, 7500AE Enschede The Netherlands
ABSTRACT Nowadays, managing global food supply chains is becoming ever more challenging and the increasing complexity
in food supply chains calls for awareness in supply chain forecasting. Since forecasting is the starting point of all
supply chain activities, its degree of accuracy plays a critical role in supply chain management. The purpose of this
study is to examine the importance of forecast accuracy to supply chain performance. By collecting qualitative and
quantitative data, a small case study has been conducted at a firm which is active in the FMCG sector. This study
indicates that several determining factors influence the accuracy of the forecasts. By analysing three KPIs with
significant mismatches between the forecast and actual values, it became clear that the forecast accuracy mainly is
influenced by production related factors, information related factors, the human factor and technology & tools. The
literature review aligns with these findings, however, the case study shows that organisational culture, new product
development and supplier delivery performance must be considered as new determining factors, since their influence
is significantly noticeable. Additionally, the literature review and case study have shown that forecasting and
planning are both related with each other as well as the importance of forecasting in the decision-making process. It
has been restricted in its time and scope, leading to an analysis on only three KPIs. It is advisable to study other
KPIs, where significant mismatches between the forecast and actual values occur, with the same depth in order to
fully understand the impact of forecast accuracy on supply chain performance.
Graduation Committee members:
Prof.dr. Holger Schiele
Dr. Henry van Beusichem
Keywords Advisory, Decision-Making, Determining Factors, Forecast Accuracy, FMCG Industry, Performance Tracking,
Planning, Supply Chain Management
Permission to make digital or hard copies of all or part of this work for personal or classroom use is granted without fee provided
that copies are not made or distributed for profit or commercial advantage and that copies bear this notice and the full citation on the first page. To copy otherwise, or republish, to post on servers or to redistribute to lists, requires prior specific permission and/or
a fee.
12th IBA Bachelor Thesis Conference, July 9th, 2019, Enschede, The Netherlands.
Copyright 2019, University of Twente, The Faculty of Behavioural, Management and Social sciences.
1
1. SUPPLY CHAIN PERFOMANCE
INFLUENCED BY FORECAST
ACCURACY: AN INTRODUCTION In any business, forecasting is a crucial activity that drives
operations, promotes efficiency and serves as a key metric of
effectiveness in planning processes. Moreover, in the field of
supply chain management (SCM) forecasting is often
considered as the driving factor in planning and decision-
making processes. When forecasting is based on partial or
inaccurate information, forecasting is likely to be susceptible
to errors and fluctuations, with dire consequences for the
planning and decision-making processes.
This research is a combination of the knowledge areas finance &
SCM and focuses on the forecast accuracy for Company X.
Company X is a company that manufactures ice cream products
and it is a subsidiary of Company Y. The only European plant of
Company X is located in western Europe and is responsible for
the supply of ice cream for the European market. The brand is an
innovative leader in the premium ice cream industry and is
committed to providing all natural, high quality ice cream with
respect to environmental and social responsibility. Apart from
the production of Brand A the plant is also responsible for the
production of Brand B and Brand C.
Company X has a unique organisational structure. It has
departments responsible for supply chain, including operation
and line managers. This department focuses on the production of
ice creams and this involves efficient operations in terms of using
few resources as needed and effective in terms of meeting the
customer requirements. Besides, the company has a planning &
logistics department which is responsible for the procurement of
raw materials and packaging materials, and the flow and storage
of products from the point of origin to the point of consumption.
The quality assurance department is responsible for preventing
mistakes and defects in the manufactured products and deals with
deliveries of products and services to the customers. The
technology & innovation department consists of two divisions:
the product introduction and engineering division. The product
introduction division covers the complete process of bringing a
new product into the plant, considering the different flavours,
sauces and toppings. The engineering division focuses on
improving the company’s equipment by using incremental and
modular innovations in their projects. The officers of the HRBP
department ensures effective management and relations between
business managers and employees, from strategic to operational
level. The last department is the financial department, which is
responsible for forecasting, organising, auditing, accounting for
and controlling its company’s finances. The department of
finance acts as a guide to various departments in financial matters
and monitors several financial allocations.
Since ice cream is generally considered as a seasonal product,
several internal and external factors were found to influence the
forecast accuracy and the company’s financial performance. For
the production of ice creams, the organisation tracks and
monitors several key performance indicators (KPIs). In the
financial forecast of Company X there is room for improvement.
The forecast states its expectations and in reality, there are
mismatches between the forecast values and the actual values.
The consequence of these mismatches is visible in the financial
budget. In the real world it is impossible to have 100% accuracy
in forecasting, but by analysing these mismatches, there is the
possibility to increase the effectiveness of the supply chain,
reduce the uncertainty and to decrease the costs. According to
the financial department, there are significant mismatches
between the forecast and actual values in the following KPIs:
utilities, labour productivity and the usage of the biodigester.
These three KPIs are direct and indirect related to the supply
chain and will be analysed.
The purpose of this report is to understand the whole picture of
forecast accuracy and to identify the causes of the mismatches
between the forecast values and actuals of the following KPIs:
utilities, labour productivity and the usage of the biodigester.
From practical perspective, this report will be an advisory on the
process of forecasting and provides recommendations for solving
these mismatches, in order to optimise the production process.
From theoretical perspective, this research provides insights in
forecasting and planning, and by analysing determining factors,
this research highlights the importance of forecast accuracy to
supply chain performance. Based on this research objective, the
following research question has been constructed:
’In the financial forecast, which determining factors are the
primary drives in causing mismatches between the forecast
and actual values of the analysed KPIs, and which
recommendations will solve these mismatches and will
contribute positively to the forecast accuracy and supply
chain performance?’
The structure of this paper is divided into four sections: first, a
review of the literature based on forecasting and planning.
Secondly will be the methodology part, including research
design, data collection and research context. Research is based
on the most recently available data from the first quartile of 2019,
started from 1 January 2019 until 31 March 2019, and from the
interviews with company’s representatives. The following
section will be the result section. This section is a summary of
the data analysis and interviews. Discussion & conclusion is the
next section, where the case will be compared to the literature
review. Lastly, in the recommendation section recommendations
will be provided to Company X in which they can solve these
mismatches, optimise their forecast accuracy and supply chain
performance.
2. LITERATURE REVIEW
2.1 The importance of forecasting and KPI
management in SCM According to a study of forecasting practices in SCM by
Albarune & Habib (2015, p. 55), forecasting is by far the most
beginning activity of SCM, which initiates all the other actions
of SCM. Stevenson (2002, p. 72) defined that forecasting is the
form of statement that reveals future value of interest for a
specific time period that is used as prime output in the decision-
making process of SCM. Forecasting has impact on the
fulfilment of the customer requirements and is an ideal starting
point for the supply chain process improvement. Besides,
forecasting can be seen as the key driving factor in planning and
making decisions in SCM (Reiner & Fichtinger, 2009, pp. 55-
56). Furthermore, according to Reiner & Fichtinger (2009, p. 57),
companies are highly dependent on true numerical values of the
forecast for taking major decisions such as capacity building,
resource allocation, expansion and forward or backward
integration etc.
KPIs are normally used to measure the performance of the
process in order to recommend appropriate future decisions.
Executives define certain KPIs that best fit their business needs
and utilise them in threefold: 1) to inspect the current company
status and create a new action plan in case the metrics are
2
pointing to a bad future scenario; 2) to provide information that
facilitates the understanding of the business progress; 3) to
communicate to employees who are at the lowest hierarchical
level about the company development (Andrade & Sadaoui,
2017, p. 1). According to Choi et al. (2017, p. 82), the
combination of KPIs and business information turns out to be
something natural in the corporate world, since they can be used
to assess whether the business goals have been achieved or not.
Plischke (2012, p. 188), mentioned that the importance of KPIs
already has been justified in the literature, especially in the field
of Business Intelligence, however companies are still using
spreadsheets to conduct the analysis of their indicators. It is clear
that this is not an efficient evaluation approach and there are
some authors who focused their attention on this practice, but yet
pointed out that KPI management should be enhanced.
According to Parr et al. (1999, p. 1), having a system to manage
business relevant data is a fundamental part of the
competitiveness.
By using KPI dashboards, organisations can access their success
indicators in real time and make informed decisions that bring
closer to achieving long-term goals. As defined by Clark et al.
(2006, p. 19), Lehmann et al. (2006, pp. 7-8) and Wind (2005, p.
869), a dashboard is a relatively small collection of
interconnected KPIs, and the underlying performance should be
in common throughout the organisation’s short- and long-term
interests. The key elements of dashboards include the
summarisation and integration of KPIs with underlying drivers
to communicate performance throughout the organisation.
According to LaPointe (2005, p. 99), managers mentioned at
least three factors driving the need for dashboards: 1) poor
organisation of the many pieces of potentially decision-relevant
data; 2) the managerial biases in information processing and
decision-making; 3) the need for cross-departmental integration
in performance reporting practices and for resource allocation.
Also, Krapp et al. (2013, p. 977) emphasise the importance of
forecasting. He called that more research should be done on
forecasting methods and models that increase the accuracy on the
product quantity, timing and quality, which will improve the
overall supply chain performance.
Nowadays, the increasing complexity of the physical
connections along the food supply chain boosts the adoption of
holistic and quantitative methodologies and tools by the SCM,
which attracts researchers and practitioners (Georgiadis, Vlachos
& Lakovou, 2005, p. 351). These approaches aim to manage the
flow of materials throughout the network via data-driven
planning and optimisation. As reported by Akkerman et al.
(2010, pp. 863-864), in the food sector is the recent trend to focus
on reaching a global optimum that incorporates actors and
stakeholders, as well as economic, environmental and social
sustainability goals. The key question in the supply chain
forecasting is how to collaborate and integrate data from different
supply chain levels, in such a way that the forecasts at different
levels of the supply chain are consistent and provide required
information to each single decision-making process.
According to Holden et al. (1991, p. 14), in financial markets, the
relations between the present and future values of resources are
important for the forecasts. Forecasts of the future state of the
economy are an essential input into the decision-making process.
Financial forecasting is one of the important aspects of
management. Knowing or having a close estimation of firm’s
financial situation overcoming time will help the firm to revise
its business decisions and strategy for the future. Financial
forecasting is a time-consuming process which requires being
patient. It is necessary that information for assumptions need to
be collected carefully for the reliability of the forecast, including
clarifying all variables. Once forecasts have been completed, it
should be reviewed periodically. An updated forecast can enable
you to see if the goals in the past reached or not (Abu-Mostafa &
Atiya, 1996, pp. 206-207). An accurate financial forecast can be
extremely helpful, while making wrong financial forecast can
result in high costs such as excess staff or inventory.
As mentioned earlier, companies are highly dependent on true
numerical values of the forecasting activities and a well-defined
dashboard, including KPIs, will encourage to make informed
decisions. In order to obtain effective output and to optimise the
resources, forecasting must be shared among partners, suppliers,
third-party logistics (3PL), financial departments and also within
the supply chain department. It is usual that there might be
forecast errors as actuals differ from the forecasted values,
especially in the FMCG industry, which is impacted by volatility.
Volatility can have an impact on the process and control side of
the organisation, and on the supply and demand that a company
faces (Yang & Burns, 2003, p. 2082). One of the main causes of
uncoordinated forecasting is the bullwhip effect, which will be
described in detail in the volatility section below.
2.1.1 SCV as critical factor in forecast accuracy Managing global supply chains is becoming ever more
challenging, leading to calls for new concepts to deal with the
accompanying turbulence. Supply chain volatility (SCV) is one
of the most prominent challenges for supply chain managers
(Christopher & Holweg, 2017, p. 3). According to Yang & Burns
(2003, p. 2082), almost every company, especially within the
FMCG industry, is impacted by volatility on a daily basis.
Tachizawa & Thomsen (2007, p. 1115) emphasise that many
companies face an uncertain environment which is highly
turbulent and volatile. In general, SCV is understood as a
multidimensional construct that originates not solely from shifts
in customer demand, but also from several other sources, such as
short product life-cycles, increasing lead times, governmental
regulations, competition, raw material price variations, and other
factors (Christopher & Holweg, 2011, p. 77-78). An often-
researched type of volatility is production volatility, also called
output volatility. This type investigates the uncertainty in the
supply chain. A reduction in this uncertainty will help to improve
the performance in the supply chain and to increase the value
(Ewing & Thompson, 2008, p. 553). Another type of volatility is
demand volatility. Demand volatility is related to SCM and
focuses mainly on the bullwhip effect.
Lee et al. (1997, p. 546) described the bullwhip effect as the
demand variance amplification while moving through to
upstream echelons from downstream echelons. Wang & Disney
(2016, p. 691) notice that the bullwhip effect refers to the
phenomenon where order variability increases as orders move
upstream in the supply chain. The term bullwhip effect was first
coined by Procter & Gamble (P&G) in the 1990s to refer to the
order variance amplification phenomenon observed between
P&G and its suppliers. Interestingly, a similar phenomenon
between P&G and its wholesalers has been documented during
1910s (Schisgall, 1981). Lee et al. (1997, pp. 549-555) identified
four main causes for the bullwhip effect: 1) all players in the
supply chain base their forecasting on orders they received from
the succeeding player in the chain. Increasing orders will lead to
higher forecast which will lead to increase order quantities at the
proceeding link in the supply chain. When demand decreases, it
works the other way around; 2) rationing and shortage gaming
effects. In periods of shortage, a manufacturer will ration their
products to the retailers in proportion of their orders. When this
is recognized, retailers will order more than they actually need to
3
ensure they can cover the demand of their customers; 3) order
batching. A retailer faces continuous demand from its customers.
However, it is unlikely that the retailers will also place
continuous orders at a manufacturer, often due to fixed order
costs, agreed lead times or distribution efficiency. This results in
higher price variability in the orders the retailer places than in the
demand the retailer experiences; 4) price fluctuations.
Promotions or other cost changes can upset regular buying
patterns, will increase the variability in demand. Buyers want to
take con discounts offered during a short time periods, which can
cause uneven production and distorted demand information.
Overall, SCV affect the forecast accuracy, inventory levels,
production plans and outputs, service level and even the product
prices (Germain, Claycomb & Dröge, 2008, p. 560). This results
in an ineffective coordination and high supply chain costs.
According to Balakrishnan et al. (2004, p. 163), downstream
supply chain members spread their volatility upstream, resulting
in high capacity and inventory costs. When demand becomes
more volatile, there will be a greater demand for inventory to
have a buffer available that enables a manufacturer to deliver the
requested products at all the time. A stable demand will lead to a
smaller safety stock. For this reason, an increase in volatility can
lead to inventory build-ups, and increasing inventory will result
in higher costs (Pindyck, 2004, p. 1030). Nowadays, supply
chains are forecast driven, this means that manufactures
periodically revise their supply chain plans base on a forecast of
future demand over a specified planning horizon. According to
Hendricks & Singhal (2009, p. 511), the poor forecast and related
inefficient operations schedule can result in either excess stock
or out of stock situation, both indicators of a demand-supply
mismatch.
2.1.2 Other determining factors in forecasting Besides volatility, other determining factors play a role on the
forecast accuracy. Sébastien Thomassey (2010, pp. 481-483)
studied forecast systems in the clothing industry, comparable
with the FMCG industry. Both industries are dealing with
volatile demand, strong seasonality of sales, wide number of
items with a short product life-cycle, frequent and unpredictable
changes or lack of historical data. As pointed out by Thomassey,
the existence, relevance and reliability of data contained in the
information system are the key factors that influence the forecast
accuracy. These elements can be translated as following;
existence is related to the availability of data, which come from
the share of information. Relevance is related to the range of
information and reliability of data is related to the quality of
information.
Since forecasts are based on the available information at the time
of the forecasting activity, with so many uncertainties presenting
among the demand, supply and manufacture process, it is
apparent that the forecasts could easily become inaccurate.
Gathering the latest information and sharing with the relevant
parties will minimise the impact of uncertainties and increase the
chances of adjusting the forecast close to a real-time manner,
which can be used to reflect on the current situation. According
to a study in the franchisor-franchisee supply chain, Yan & Wang
(2012, p. 1171) found out that information sharing increases
forecast accuracy, which enables firms to respond to customer
demand in a real-time manner. Their model has demonstrated
that by sharing information, forecast accuracy significantly
increased and both parties benefit from such an improvement.
Besides, information sharing contributes significantly in
reducing the bullwhip effect. According to Ali & Boylan (2010,
p. 5), without sharing information between supply chain
participants, but only passing through individual forecast from
downstream customers to upstream customers, adjustments are
done at each hand over of the forecast based on separate
assumptions which effects the forecast accuracy and becomes a
total different picture from its original version. Sharing
information creates more transparency (among partners) and
improves the forecast accuracy and supply chain performance.
Finally, Zhu et al. (2011, p. 284) developed a model that
illustrates the relationship between forecast effort and
profitability under several different information sharing
scenarios, and it has been found out that sharing information
between supply chain partners improves the forecast accuracy
and the profitability of the organisation.
Besides information sharing, the quality of information plays a
critical role in the final level of forecast accuracy (Chen & Wolfe,
2011, p. 70). Chen & Wolfe found out that information quality is
affected by the number of relays and handlings from its origin to
its destination. For example, the exchange directly between two
parties ensures higher quality, while multiple handlings along
several parties, the quality tends to decrease due to manipulation
along the way such as formant change, data conversion and
inappropriate interpretation and communication which makes the
information less visible or more difficult to understand. Lastly,
the type of information to be shared, the range of information, is
an additional factor contributing to the forecast accuracy. The
type of information shared should include a good range of both
internal and external data as well as direct and indirect data. A
combination of both internal and external data will result in a
better forecast, according to a case study by Ramanathan (2012,
p. 78).
Sharing the right and relevant information in a wide range with
the highest possible quality does not automatically lead to an
accurate forecast outcome. Information analysis, interpretation
and utilisation are some critical determinants in producing an
accurate forecast. The human factor, technological systems and
tools also play an important role in the forecast capability. Singh
(2014, p. 5) mentioned that the forecaster is the leader in the
forecasting process for making the right adjustments and the right
decisions and that the forecasting capability is mainly depending
on the forecaster’s competence, such as experience, skills and
even their personalities. Additionally, the fact that information
technology becoming an essential part of today’s businesses,
various systems and tools are now consisting a major part of
forecasting capability (Fildes & Hastings, 1994, p. 16). They
make it possible to store and exchange large quantities of data,
enable fast and complex analysis and produce and efficient
forecast. As stated by Wang & Pervaiz (2007, p. 27), the
combination of information technology and ability to effectively
use the organisational resources can create a unique and
sustainable competitive advantage.
Finally, apart from volatility and the information related factors,
factors such as globalisation, seasonality and fast-moving data
influence the forecast accuracy, especially in the FMCG
industry. According to Lee (2002, p. 105), the increasing
globalisation and market competition have forced companies to
expand their business networks, moving from local to more
complex and vulnerable supply chains. Evidence from literature
suggest seasonality as another major drives to demand volatility
(Gupta & Maranas, 2003, p. 1219). Seasonal effects are periodic
fluctuations that occur on a certain base or on certain seasons.
During these periods, companies experience demand fluctuations
which may lead to gains or significant losses in sales. According
to Wong & Hvolby (2007, pp. 407-408), the influence of
seasonality can be reduced by designing a coordinated
4
responsive supply chain. Lastly, a study by Petropoulos et al.
(2014, p. 152) found out that forecast accuracy is influenced by
fast-moving data and concluded that fast-moving data has a
negative effect on the forecast accuracy. The lack of data
traceability is partly responsible for this negative effect.
2.1.3 Types of forecasting Different forecasting methods and/or approaches influences the
forecast accuracy. The type of forecasting is related to the human
factor, and technology and tools, both associated with the
forecaster’s capability. Various forecasting techniques, based on
quantitative and qualitative data, exist. Two common and
different forecasting methods are time series analysis and
causal/explanatory models (Kilger & Wagner, 2015, p.125).
Time series approaches assume that demand exhibits certain
pattern over time. Therefore, the aim of these forecasting
methods is to derive a forecast by identifying and estimating that
pattern from historical data. The next step is that the future
forecasts, based on the observed pattern, are calculated.
According to Kilger & Wagner (2015, p. 127), one of the major
advantages of time series analysis is their unique reliance on the
history of demand. Silver et al. (1998, p. 46) and Mentzer &
Moon (2005, p. 74) mentioned that common data pattern are
level, trend and seasonal models. Related forecasting techniques
for time series analysis are: simple moving average (SMA),
exponential smoothing and autoregressive integrated moving
average (ARIMA) among others (Brockwell & Davis, 2013, p.
17). Kilger & Wagner (2015 pp. 127-128) conclude that the main
advantage of time series analysis is to use historical data to
identify and extrapolate a pattern or trend.
On the other hand, causal models imply that the forecast is
modelled by certain known factors. According to Kilger &
Wagner (2015, pp. 131-133), this forecasting approach is an
estimation of parameter values and an investigation of causality
between dependent and independent variables. They both
mentioned that qualitative, or also known as judgmental
forecasts, do not use calculations, but individual or group-based
estimations. Wright & Goodwin (1998, p. 23) describe the
procedure for the judgmental forecast as follows: 1)
considerations are made on the relevant data, suitable for the
underlying forecasting activity; 2) the decision on the forecasting
approach is made; 3) the final judgement is about the outcome of
the forecast. In general, causal models are beneficial as external
factors are considered, however a much higher level of data is
generally required. Furthermore, qualitative methods consider
the business environment, when generating a forecast, as an
important aspect for recognizing information related to specific
events (e.g. promotions, customer feedback on new products)
and changes in demand pattern, which are not perceived by
statistical models. The obvious and popular forecasting
techniques for causal models are multiple regression models,
econometric models and multivariate autoregressive integrated
moving average (MARIMA) models (Kilger & Wagner, 2015, p.
135).
Diverse studies focus on understanding qualitative and
quantitative methods, and their advantages related to forecasting.
Some studies reveal that judgmental forecasts are preferable over
statistical techniques because of the highly variable nature of data
series and environmental uncertainty, which is only
knowledgeable via human expertise. Moreover, research in the
fashion industry, by Nenni et al. (2013, pp. 1-6) document how
poor performance is more likely be caused by statistical
techniques in case of highly volatile demand. Other researchers
suggest that further variability and forecasting biases are caused
by behavioural decisions in qualitative methods (Zotteri et al.,
2005, pp. 480-481). Evidence from literature suggests that a
combination of quantitative and qualitative forecasting
techniques overwhelm the benefits obtained from one single
method and allow getting a more accurate and reliable forecast
(Chase, 2009, p. 7). Combining the benefits of both worlds seems
preferable to capture and reduce variability and uncertainty.
2.1.4 Decision-making influenced by forecasting The importance of forecasting can be seen in the decision-
making process. Several researchers conclude that a strong
forecast, including relevant, reliable, qualitative and valuable
data, has influence on the forecast accuracy and next to that, on
the decision-making process. Krapp et al. (2013, p. 977) already
demonstrated with his generic forecasting framework that an
accurate forecast will contribute to a more accurate decision-
making process, and at the same time present decision makers
the impact of forecasting errors. According to Reiner &
Fichtinger (2009, pp. 55-56), forecasting can be seen as the key
driving factor in planning and making decisions in SCM. For
taking major decisions such as capacity building, resource
allocation, expansion and forward or backward integration
companies are highly dependent on true numerical values of the
forecast. From financial perspective, Holden et al. (1991, p. 14)
highlight and express that in financial markets, the relations
between the present and future values of resources are important
for the forecasts. Forecasts of the future state of the economy are
an essential input into the decision-making process. As already
known, financial forecasting is one of the important aspects of
management. Knowing or having a close estimation of firm’s
financial situation overcoming time will help the firm to revise
its business decisions and strategy for the future.
Polat (2008, pp. 419-424) analysed in greater detail that
forecasting can be used as a strategic decision-making tool. His
research paper points out the potential internal and external
decision areas, where forecasting can extensively be used for
strategic decisions as an essential support tool. Besides, the paper
pointed out the central role of the forecasting function as regard
to how it provides the critical needs of information for the
strategic management, which is the key to strategic managerial
decisions. He found out that forecasting has a capability to be
used in almost in every step of strategic and functional
management. Forecasting has substantial potential in terms of
capabilities Being different from many other decision tools, its
main capability lies in producing and providing information
about the future, which is directly related to the most of the
strategic decision processes. The forecasting process contributes
significantly to building up a background and stand for strategic
decisions. In this sense, forecasting is more like a collection of
essential support procedures in the background, which feed the
information required by strategic managers. It can be generally
concluded that forecasting has a major role and the potential
capability to use in many of the functional and strategic decision-
making areas.
2.2 The importance of planning on
forecasting: CPFR and S&OP highlighted Although information sharing is essential in forecast accuracy,
only information not enough. How to share the information and
how to best utilise the shared information for the optimal result
are the two main questions for an organisation. If each party in
the supply chain still does their own forecast with a focus to
maximise their own benefit, sharing information adds no value
to the overall forecast accuracy and supply chain performance.
5
Viswanathan et al. (2007, p. 5059) mentioned that the only way
to bring out the value in sharing information is to draw a unified
focus from all supply chain participants into one single forecast,
where participants work collaboratively on this single forecast
with the aim to achieve the best for the whole supply chain.
According to Gupta & Maranas (2003, pp. 1220-1221), effective
integration of various functionalities is the primary objective of
supply chain planning. One managerial activity which is closely
related to forecasting, is planning. Planning is often confused
with forecasting. Forecasting is about what the world will be look
like, while planning concerns what it should like (Armstrong,
2000, p. 1). The three critical stages of supply chain planning are
the following: 1) operational planning; 2) tactical planning; 3)
strategic planning. These three stages are all vital to the efficient
and effective functioning of supply chains, with strategic
planning being at the highest level and operational planning
being at the lowest level. According to Ahumada et al. (2009, p.
1), the increasing complexity of food supply chains and their
attempt to match seasonal food production to a global demand
has encouraged the adoption of more systemic planning.
Optimisation of the complete supply chain is accomplished in the
form of efficient planning decisions. Within this section,
important approaches such as collaborative planning, forecasting
and replenishment (CPFR) and sales & operations planning
(S&OP) will be addressed.
2.2.1 CPFR: focus on collaboration According to Vlčková (2008, p. 337), CPFR is an approach based
on strong environmental collaboration and it brings all concerned
parties in the supply chain together to create a shared information
system and manage a single shared planning, forecasting and
replenishment process in their supply chains. In 1966, the first
pilot of this approach was done between Wal-Mart and Warner-
Lambert on the Listerine products. The relevant data was
exchanged timely and adequately to support the single co-
managed planning, forecasting and replenishment process. The
effect from this pilot can be seen in the increasing number of
sales, better fill rates and reduction in inventory. Since then, a
considerable number of other similar pilots on CPFR have gained
success for leading businesses from different industries, such as
P&G, Levi Straus and Heineken (Aviv, 2001, p. 1327).
According to Attaran & Attaran (2007, p. 394), the underlying
result of the CPFR process is the improvement in forecast
accuracy which ensures the successful and sustainable business
operations. The main advantage of CPFR is that it is not limited
to certain industries or sectors and is widely used by retailers and
manufactures. CPFR has some challenging issues which are
identified by many researchers. Albarune & Habib (2015, p. 56)
mentioned the most common challenges: 1) lack of trust; 2) lack
of internal & external forecast collaboration; 3) availability &
cost of technology; 4) fear of collusion; 5) lack of training &
skills. Aviv (2001, p. 1327) support this and pointed out that high
level of collaboration, willingness to share adequate information
and strong technical support are crucial factors that influence the
success of CPFR.
2.2.2 S&OP: focus on strategy For achieving a better performance of the business, Thomé et al.
(2012, p. 360) described S&OP as a process of integrating all
functional plans into a unified tactical plan over a time horizon,
from less than three months to 18-24 months, that strategically
directs a firm’s operational planning and related activities. Aviv
(2001, p. 1327) & Ramanathan (2012, p. 78) emphasised both
that collaboration is important to improve the forecast accuracy,
which in the end improves the supply chain performance. Oliva
& Watson (2009, p. 140) describe S&OP as an integration
process used in business organisation to ensure efficient
coordination among different functions for aligning company
strategy with the supply chain planning. The S&OP process
requires management involvement in all the three business
levels: 1) strategic level; 2) tactical level; 3) operational level.
Stahl & Wallace (2012, pp. 29-33) mentioned that the senior
management is the key to a successful S&OP process, and they
worked out ten principles for the success of S&OP. To encourage
high level commitment from all parties in the whole planning
process, a united focus from top-down and maximum alignment
between strategic planning, tactical planning and day-to-day
operational planning is necessary. This will result in a platform
for proactive information sharing. including the most available
and high-quality information. Together with justified investment
on relevant forecasting systems, as well as the most capable
forecasters, accurate forecasts can be delivered. These high-
quality forecasts will assist the management in decision-making
and will contribute the overall supply chain performance.
2.3 Armstrong’s framework: relationship
between forecasting & planning Research by Armstrong (2000, p. 1) highlights the distinctions
between forecasting and formal planning. Planning provides the
strategies, given a certain forecast, whereas forecasting estimates
the results, given a plan. Planning relates to what the firm should
do, while forecasting relates to what will happen if the firm tries
to implement a given strategy in a possible environment.
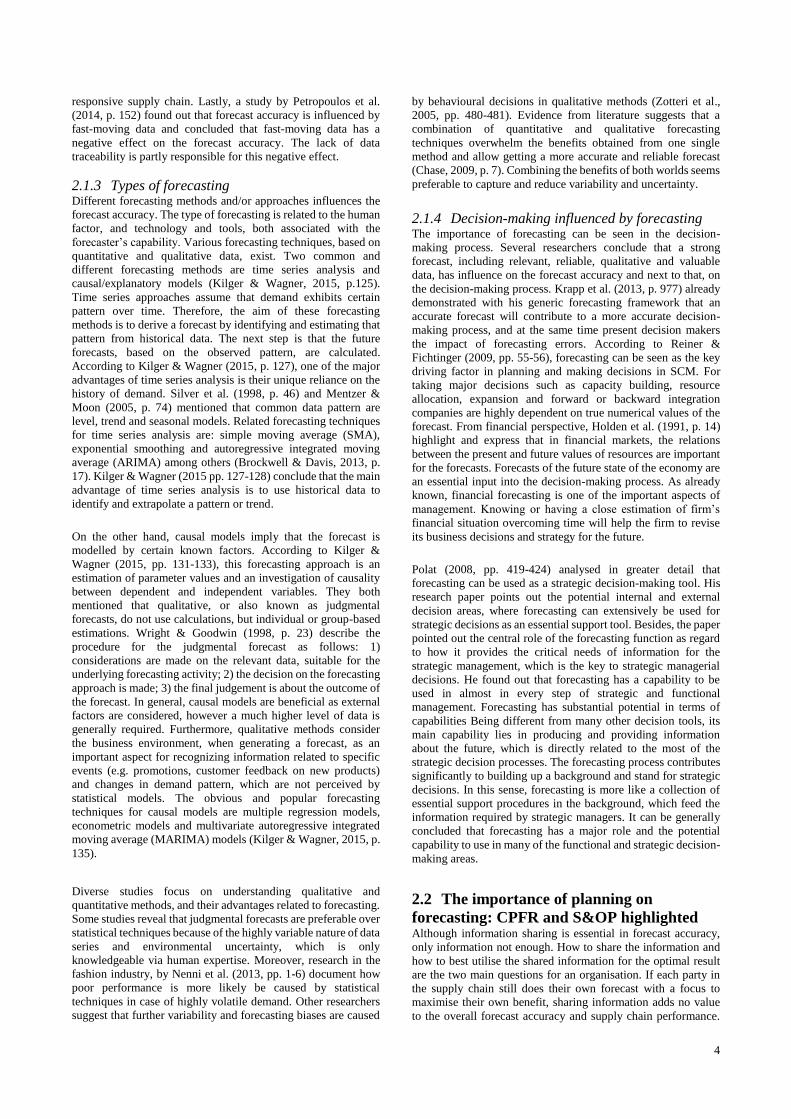
Armstrong (2000, p. 3) developed a framework for planning and
forecasting. Exemplified, the relation between formal planning
and forecasting is shown in Figure 1 below.
\
In this framework, the environment is free-standing. Scanning of
the environment yields relevant data for the so called ‘Data
Bank’. This data bank (or information system) contains data such
as government regulations, industry sales, the resources of the
company, information of available technologies etc. Ideally,
Figure 1. Framework for formal planning and
forecasting (Armstrong, 2000, p. 3)
.
6
these data would be assembled in a central location, such as a
filing cabinet or computer. The framework suggests to start with
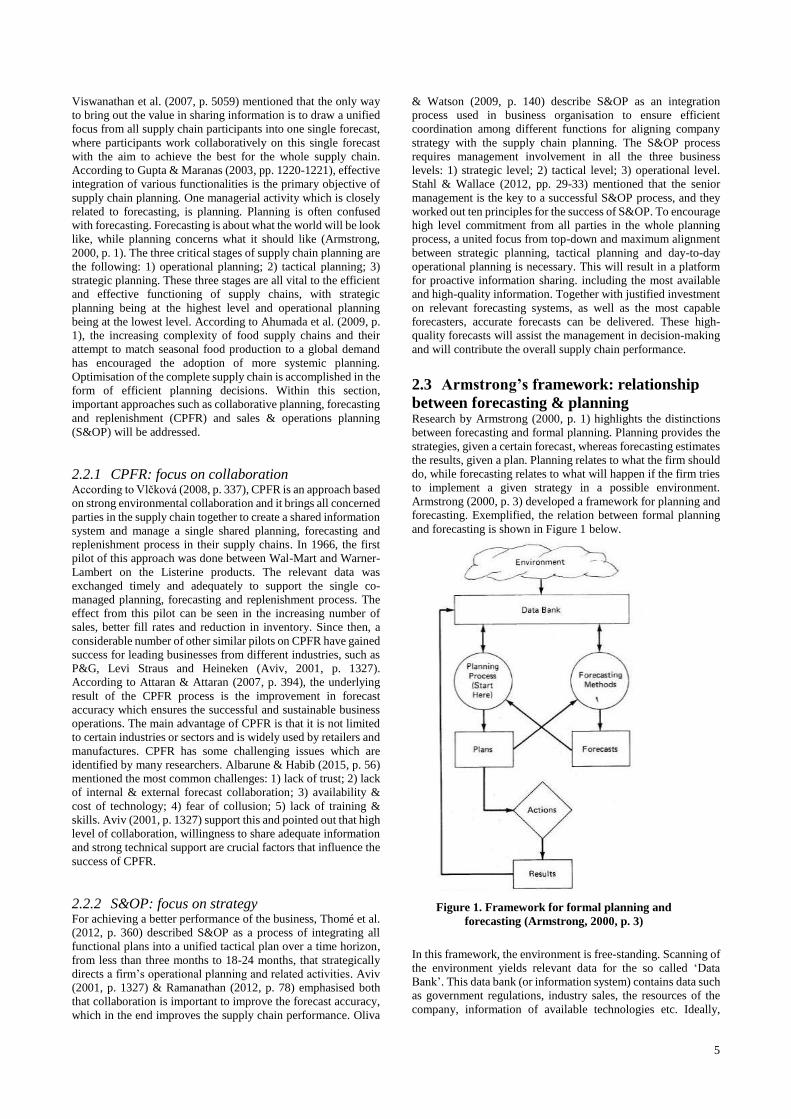
formal strategic planning. According to Armstrong (2000, p. 4),
formal strategic planning calls for an explicit written process for
determining the firm’s long-term objectives, the generation of
alternative strategies for achieving these objectives, the
evaluation of these strategies, and a systematic procedure for
monitoring results. This process is summarised in Figure 2.
Formal planning starts with the identification of the ultimate
objective of the organisation. The stakeholder approach and the
strengths and weakness analysis should be conducted, to ensure
a comprehensive analysis of the objectives. The next step is to
generate alternative strategies, which helps to recognize that the
objectives can be achieved in different ways. Alternative
strategies can improve the adaptability of the organisation in two
ways: 1) by explicitly examining alternatives, it is likely that the
organisation will find that they are superior to their current
strategy; 2) the environment might change and if alternative
contingency plans have been prepared, the organisation is in a
better position to respond successfully. The evaluation part is a
procedure by which each alternative plan is judged for its ability
to meet the objectives. Finally, monitoring results is an important
activity to see if objectives are met and to provide feedback to
the management team. It is advisable to seek and develop
commitment to ensure that various stakeholders will co-operate
and implement the chosen strategy.
Reviewing the framework, the left-hand side of Figure 1
examines formal planning. The ‘Planning Process’ draw upon
information from the ‘Data Bank’ (evidence on the current
situation) and also upon the ‘Forecasts’ (evidence on what will
happen in the future). The two-way arrow from ‘Data Bank’ to
‘Planning Process’ indicates that the planning process, to a large
extent, dictates which information is required. The ‘Planning
Process’ produces a set of ‘Plans’. These plans describe
objectives and alternative strategies. One strategy is selected as a
basis for ‘Action’. Actions will lead to ‘Results’, both intended
and unintended. The results will go back to the ‘Data Bank’ and
will be saved. The right-hand side examines forecasting. To
make ‘Forecasts’ for an organisation, it is necessary to have
information about the company’s proposed strategies. This can
be seen in the arrow from ‘Plans’ to ‘Forecasting Methods’. Then
an examination of the ‘Forecasting Methods’ will help determine
which data is required. This can be considered as the two-way
arrow from ‘Data Bank’ to ‘Forecasting Methods’. Armstrong
(2000, p. 13) defined forecasting methods as procedures for
translating information about the environment and the
company’s proposed strategy into statements about the future
results. These ‘Forecasts’ are then used as inputs to the ‘Planning
Process’.
3. METHODOLOGY
3.1 Research design: determining factors
assessed against KPIs To investigate the importance of forecast accuracy to supply
chain performance, this research focuses on multiple internal and
external determining factors, retrieved from the literature review.
In order to understand the influences of these factors on forecast
accuracy, the factors will be assessed against the KPIs of the case
company. According to the financial department of Company X,
there are substantial mismatches between the forecast and actual
values on the following three KPIs: utilities, labour productivity
and the usage of the biodigester. Therefore these three KPIs have
been selected as sample to analyse the mismatches between the
forecast and actual values. The determining factors, retrieved
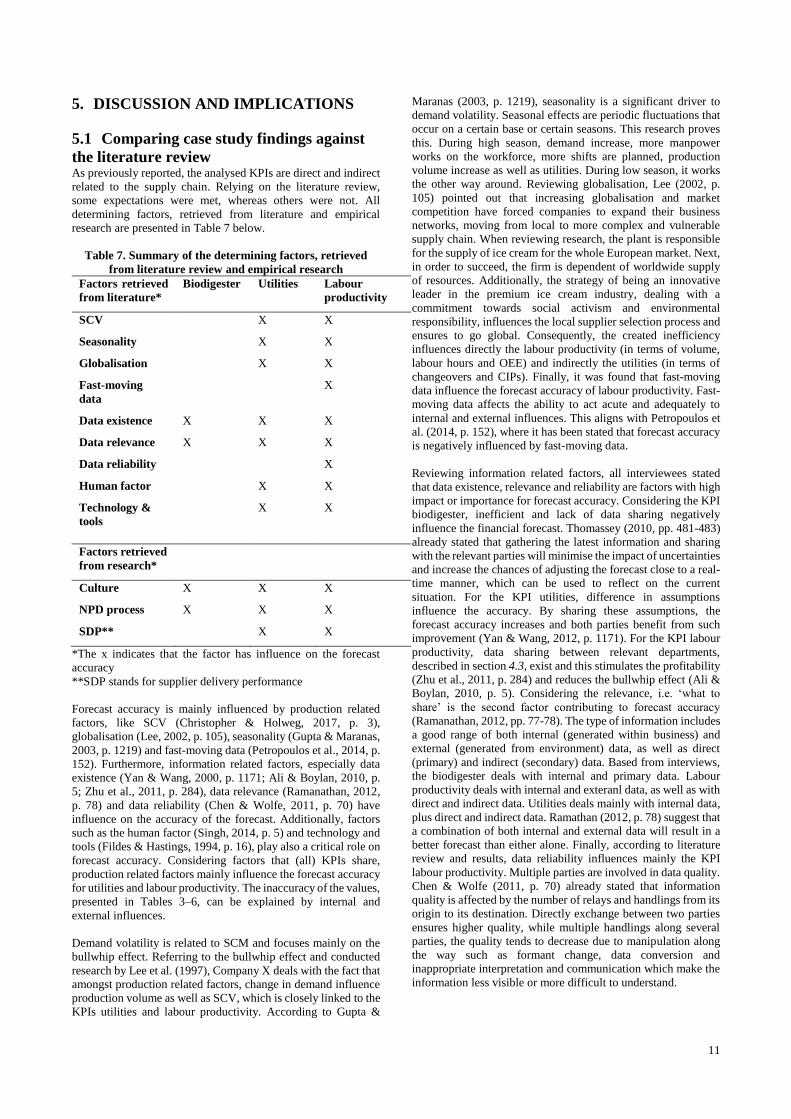
from literature review, are presented in Table 1 below.
Table 1. Determining factors against the KPIs
Factors Biodigester Utilities Labour
productivity
SCV
Seasonality
Globalisation
Fast-moving
data
Data existence
Data relevance
Data reliability
Human factor
Technology &
tools
3.2 Data collection: quantitative as
secondary and qualitative as primary source For the production of ice cream, Company X tracks and monitors
these KPIs. For the KPI analysis, business data will be retrieved
from both primary and secondary sources. To understand and
outline the current situation, secondary data such as the forecast
files, current performances and financial reports are collected. In
the following subsections, description and the current
performance of these KPIs will be summarised. The green values
can be seen as benefits, whereas the red values indicate losses.
Additionally, as primary source, interviews will be conducted to
understand the influence of the determining factors on the
forecast accuracy. This can be seen as the empirical part of this
research and by conducting interviews with the industrial
financial manager (labour productivity) and the technical service
engineers (utilities and the usage biodigester) the root causes of
these mismatches will become clear. Although individual
interviews are considered as a traditional approach, they offer the
advantage of maximising the response rate and the quality of
information as the opportunity to ask clarifications on aspects of
concern (Hofisi, Hofisi & Mago, 2014, pp. 60-64). Besides,
according to Alsaawi (2014, p. 150), the semi-structured
approach allowed elaborating open-ended questions beforehand
while giving space to further questions as dependent on the case.
Also, it was expected to retrieve as much information as possible
and to use them to interpret and understand the connections
between the investigated factors in order to answer the research
question. Finally, it was also anticipated that that respondents
realise the extent of their problems which could provide input for
Figure 2. The planning process (Armstrong, 2000, p. 4)
.
7
a problem-solving approach and inconsistencies between
different expectations can be further detected.
The semi-structured interviews have been conducted as
qualitative research approach. In total, three semi-structured
interviews were organised, each lasting from 50 minutes to one
hour. Each interview was held face-to-face at the company. Prior
to the interview process, some questions were prepared acting as
a guideline to follow during each interview session. The
interview starts with a brief introduction of the research purpose.
After introduction, questions related to the KPIs background
where asked to fully understand the content of the KPI.
Additionally, questions about information related factors,
determining factors, interactions, forecasting and planning where
asked, with the purpose to compare findings from literature
against this case study. The used interview scheme is reported in
Appendix A and the outcome of these interviews can be seen in
the result section.
3.3 Research context: description of the
KPIs, including the current situation
3.3.1 KPI: biodigester The biodigester gives Company X the opportunity to take what
had been seen as a waste product and turn it into a benefit for
their business by producing their own energy. The biodigester is
an anaerobic flotation reactor. Ice cream waste is fed into a tank,
where 24 billion natural micro-organisms break down the
particles, turning them into biogas. At the same time wastewater,
used in keeping the factory clean, is also fed into the tank with
the micro-organisms. What makes it original is that the
wastewater streams, containing fat and oil, are treated in one
reactor, together with the degradable particles. This is in contrast
with conventional systems, whereby this is only possible by
going through a number of processing stages. The biogas created
by the biodigester is used in the factory’s ‘Sustainable’ project
which acts like a battery by insulating water at the correct
temperatures for ice cream creation and dramatically reducing
the need for natural gas to heat the plant. This initiative ties in
with Company’s X core values of being good to the community
and planet.
3.3.2 Current situation As already described above, the biodigester gives Company X
the opportunity to turn waste into biogas. This results in a
reduction of gas consumption, cleaner water output and more
importantly, financial savings over long-term. The forecast for
the savings of the biodigester, including the forecast and actual
values, is shown in Table 2 below. This overview is based on the
available data from the first quartile of 2019, started from 1
January 2019 until 31 March 2019.
Time Actual Forecast Difference VAR
Jan 30,259 32,274 -2,015 -6.24%
Feb n/a* 29,151 n/a* n/a*
March 27,603 32,274 -4,671 -16.92%
Total 57,862 93,699 -35,837 -38.25%
*Maintenance of the biodigester, one month out of control
3.3.3 KPI: utilities For the production of ice creams is, besides raw materials, labour
and packaging, energy needed. According to the internal
terminology of Company X, utilities are the sum of the following
elements: gas, electricity and water usage. In general,
manufactures in the FMCG industry generates substantial energy
consumption, with energy costs that account for a sizeable
portion of the overall indirect costs.
3.3.4 Current situation Utilities are essential services that play an important role in the
production process and are directly related to the supply chain.
The forecast for the utilities, including the forecast and actual
values, are presented respectively in Tables 3 (electricity usage),
4 (water usage) and 5 (gas usage). These overviews are based on
the available data from the first quartile of 2019, started from 1
January 2019 until 31 March 2019.
Table 3. Forecast electricity usage (in kWh)
Time Actual Forecast Difference VAR
Jan 1,287,458 1,235,284 52,174 4.22%
Feb 1,153,384 1,139,386 13,998 1.23%
March 1,427,816 1,289,914 137,902 10.69%
Total 3,868,658 3,664,584 204,074 5.57%
Table 4. Forecast water usage (in m3)
Time Actual Forecast Difference VAR
Jan 13,289 10,991 2,298 20.91%
Feb 12,218 10,199 2,019 19.80%
March 14,127 13,401 726 5.42%
Total 39,634 34,591 5,043 14.58%
Table 5. Forecast gas usage (in m3)
Time Actual Forecast Difference VAR
Jan 94,754 82,622 12,132 14.68%
Feb 76,430 80,631 -4,201 -5.21%
March 90,910 88,840 2,070 2.33%
Total 262,094 252,093 10,001 3.98%
3.3.5 KPI: labour productivity In general, labour productivity is concerned with the amount
(volume) of output that is obtained from each employee. Several
factors, such as the proficiency of the workers, the degree of the
used science and technology, the organisation and management
of the production process and natural conditions influence the
labour productivity. In this case, the KPI labour productivity
consists of several variables and these are related with each other.
All these variables have their own KPI. It is important to measure
and monitor labour productivity, since labour costs are usually a
significant part of the total costs (Andrade & Sadaoui, 2017, p.
1). Zhu et al. (2011, p. 284) mentioned already that business
efficiency and profitability are closely linked to the productive
use of labour. A reduction of the labour costs will provide the
firm competitive advantage.
Table 2. Forecast savings biodigester (in €)
.
8
Company X formulated seven indicators of labour productivity:
1) number of shifts; 2) number of hours for Company X and
Strategic Partner Z; 3) labour costs for Company X and Strategic
Partner Z; 4) number of hours sickness; 5) total production
volume; 6) Overall Equipment Effectiveness (OEE); 7) the
volume/shift ratio. The metrics number of hours and labour costs
for Company X, and OEE may need further clarification. During
high season, the company operates 24/6 and the shift plan of the
company consists of three shifts: day shift, swing shift and night
shift. Two types of employees are working in the plant:
permanent employees, which are on the payroll of Company X
and temporary workers, which are paid via the employment
agency, Strategic Partner Z. And lastly, the OEE measures the
operational performance of the production line, taking into
account the manufacturing performance losses and process
driven losses.
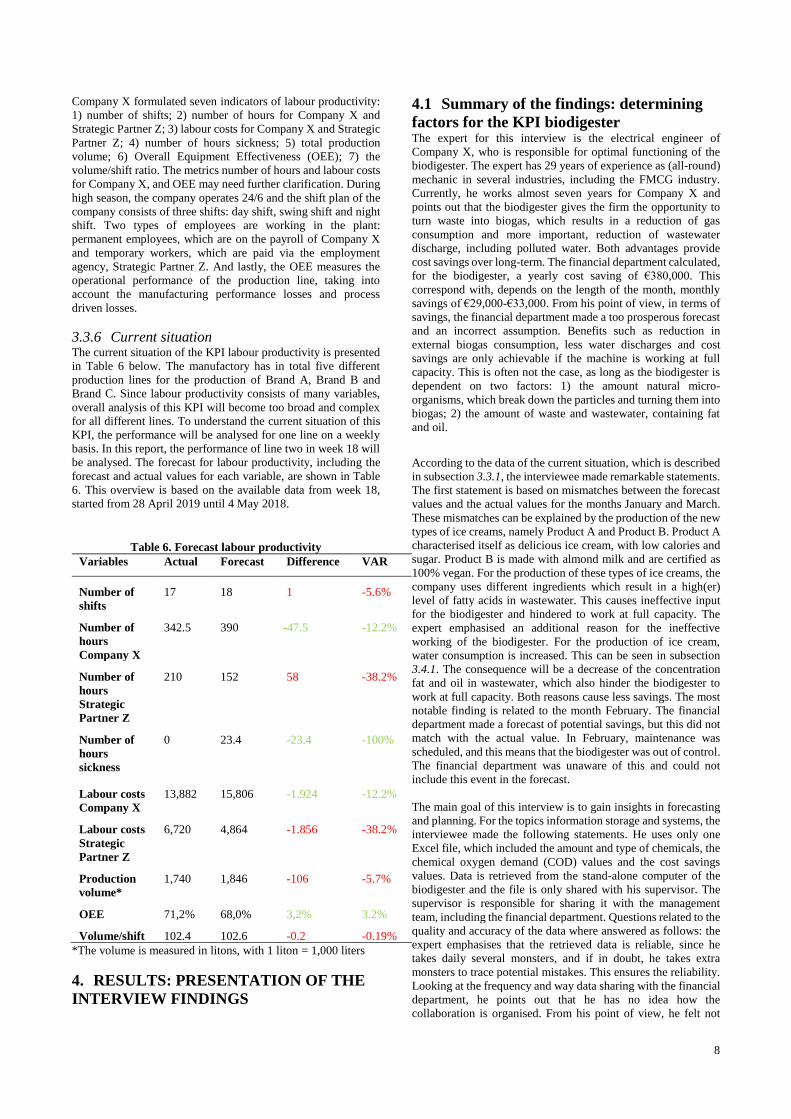
3.3.6 Current situation The current situation of the KPI labour productivity is presented
in Table 6 below. The manufactory has in total five different
production lines for the production of Brand A, Brand B and
Brand C. Since labour productivity consists of many variables,
overall analysis of this KPI will become too broad and complex
for all different lines. To understand the current situation of this
KPI, the performance will be analysed for one line on a weekly
basis. In this report, the performance of line two in week 18 will
be analysed. The forecast for labour productivity, including the
forecast and actual values for each variable, are shown in Table
6. This overview is based on the available data from week 18,
started from 28 April 2019 until 4 May 2018.
Table 6. Forecast labour productivity
Variables Actual Forecast Difference VAR
Number of
shifts
17 18 1 -5.6%
Number of
hours
Company X
342.5 390 -47.5 -12.2%
Number of
hours
Strategic
Partner Z
210 152 58 -38.2%
Number of
hours
sickness
0
23.4 -23.4 -100%
Labour costs
Company X
13,882 15,806 -1.924 -12.2%
Labour costs
Strategic
Partner Z
6,720 4,864 -1.856 -38.2%
Production
volume*
1,740 1,846 -106 -5.7%
OEE 71,2% 68,0% 3,2% 3.2%
Volume/shift 102.4 102.6 -0.2 -0.19%
*The volume is measured in litons, with 1 liton = 1,000 liters
4. RESULTS: PRESENTATION OF THE
INTERVIEW FINDINGS
4.1 Summary of the findings: determining
factors for the KPI biodigester The expert for this interview is the electrical engineer of
Company X, who is responsible for optimal functioning of the
biodigester. The expert has 29 years of experience as (all-round)
mechanic in several industries, including the FMCG industry.
Currently, he works almost seven years for Company X and
points out that the biodigester gives the firm the opportunity to
turn waste into biogas, which results in a reduction of gas
consumption and more important, reduction of wastewater
discharge, including polluted water. Both advantages provide
cost savings over long-term. The financial department calculated,
for the biodigester, a yearly cost saving of €380,000. This
correspond with, depends on the length of the month, monthly
savings of €29,000-€33,000. From his point of view, in terms of
savings, the financial department made a too prosperous forecast
and an incorrect assumption. Benefits such as reduction in
external biogas consumption, less water discharges and cost
savings are only achievable if the machine is working at full
capacity. This is often not the case, as long as the biodigester is
dependent on two factors: 1) the amount natural micro-
organisms, which break down the particles and turning them into
biogas; 2) the amount of waste and wastewater, containing fat
and oil.
According to the data of the current situation, which is described
in subsection 3.3.1, the interviewee made remarkable statements.
The first statement is based on mismatches between the forecast
values and the actual values for the months January and March.
These mismatches can be explained by the production of the new
types of ice creams, namely Product A and Product B. Product A
characterised itself as delicious ice cream, with low calories and
sugar. Product B is made with almond milk and are certified as
100% vegan. For the production of these types of ice creams, the
company uses different ingredients which result in a high(er)
level of fatty acids in wastewater. This causes ineffective input
for the biodigester and hindered to work at full capacity. The
expert emphasised an additional reason for the ineffective
working of the biodigester. For the production of ice cream,
water consumption is increased. This can be seen in subsection
3.4.1. The consequence will be a decrease of the concentration
fat and oil in wastewater, which also hinder the biodigester to
work at full capacity. Both reasons cause less savings. The most
notable finding is related to the month February. The financial
department made a forecast of potential savings, but this did not
match with the actual value. In February, maintenance was
scheduled, and this means that the biodigester was out of control.
The financial department was unaware of this and could not
include this event in the forecast.
The main goal of this interview is to gain insights in forecasting
and planning. For the topics information storage and systems, the
interviewee made the following statements. He uses only one
Excel file, which included the amount and type of chemicals, the
chemical oxygen demand (COD) values and the cost savings
values. Data is retrieved from the stand-alone computer of the
biodigester and the file is only shared with his supervisor. The
supervisor is responsible for sharing it with the management
team, including the financial department. Questions related to the
quality and accuracy of the data where answered as follows: the
expert emphasises that the retrieved data is reliable, since he
takes daily several monsters, and if in doubt, he takes extra
monsters to trace potential mistakes. This ensures the reliability.
Looking at the frequency and way data sharing with the financial
department, he points out that he has no idea how the
collaboration is organised. From his point of view, he felt not
9
responsible since he shared the file with his supervisor.
Unfortunately, the supervisor (and manager of the supervisor)
did not share this with the financial department (on time). Indeed,
the supervisor knows the existence of the file, but he is more
interested in the fact that the biodigester works than the daily
savings. The interactions are done via small conversations and
are done at random times. This implies that the supervisor does
not receive the file on a fixed time perioded, indeed, he received
the file hardly ever. Examining the quality of the planning, the
expert emphasises that the activities planning and forecasting are
both related with each other and that the planning between the
supervisor and the management team, should be improved, with
the aim of having an accurate financial forecast. In order to
investigate the influence of determining factors, which influence
the forecast accuracy, the expert points out that SCV, seasonality,
globalisation and fast-moving data has no influence on the
operation efficiency of the biodigester, and also no influence on
the planning and forecasting activities. On the one hand, the
composition of the wastewater and the level of fatty acids
influence the operation efficiency of the biodigester, one the
order hand, (the lack of) existence knowledge and inefficient data
sharing influence the planning and more important, the forecast
activities.
When taking a closer look to the current situation, he mentioned
that the calculated yearly saving of €380,000 is based on savings
of 2017, which can be considered as a peak year. If we cannot
manage the high level of fatty acids in the wastewater, the
maximum savings will be €200,000. By changing the production
and cleaning process, it is possible to gain the missing benefit of
€180,000. Finally, the last statement is related to the stagnation
of the biodigester. One day stagnation will cost the firm +/-
€1,000. The expert is the only person who can manage the
machine. At the moments when he is on leave, the machine is out
of control, and this will hurt the financial forecast. He assumed
that the financial department is unaware of his absence. After all,
he mentioned that he is aware of the negative results and that cost
savings should be the key motivation, however, instead of
focusing solely on savings, he highlights that this initiative ties
in with the firm’s core values of being good to the community
and planet.
4.2 Summary of the findings: determining
factors for the KPI utilities The person participating in the second interview for this research
is the utility engineer of Company X, who is responsible for the
operational conditions of the utilities. Besides, the expert is the
environmental pillar leader of the World Class Manufacturing
(WCM) program. The WCM-program is based on a continuous
improvement approach, including the integration of Six Sigma,
Lean Manufacturing and Total Productive Maintenance (TPM).
The goal of the WCM-program is to use the best available work
practices in order to achieve the best efficiency on the operation
level, with more focus and opportunities for cross-departmental
improvement. The interviewee has 24 years of work experience,
including six years for Company X, in the optimisation of supply
chain processes. As mentioned previously, utilities are the sum
of the following three elements: gas, electricity and water usage.
These elements correspond with expenses of €1,6 million.
The financial department assumed that the energy usage of this
year should be equal to previous year, 2018. This assumption is
based on the production volume data and the number of times of
changeovers. In the first quartile of 2019, the company had one
extra shift, compared with the previous year. The extra shift
ensures a small increase in volume, which is hardly changed
compared with 2018. Furthermore, the company enjoys a wide
range of product portfolio, which will lead to more changeovers.
The changeover is needed when there is a change in product
variants. Because of uncertain supply of raw materials, the firm
had in 2018 more changeovers than planned. This means that the
utilities, especially the water usage, increased. A simple analogy
would be: two opposing actions, the increase in production
volume (which causes an increase in utilities) and the reduction
of changeovers (which causes a decrease in utilities), will cancel
each other out. Based on this interpretation, the forecast for
utilities was made. The data of the current situation, which is
described in subsection 3.4.1, proves the opposite. Compared to
one year previously, there is an increase of 3.98%, 5.57% and
14.15% respectively for the gas, electricity and water usage. The
financial department is concerned about this situation, especially
the increase in water consumption. The interviewee indicates that
he is aware of this fact. In his eyes, utilities belong to the
environmental pillar of WCM. The purpose is to develop an
energy management culture, with energy and cost reduction as
aim. Additionally, to better understand the whole picture of
forecasting and planning, related questions have been asked.
For the topics information storage and systems, the expert
indicated that he uses the programs Excel, Vispro and Strata.
With Excel, the expert makes clear spreadsheets, including the
values of utilities. Vispro gives visual insights into the values of
utilities. The final program, Strata, is an energy management
software with the focus on energy and process optimisation. The
software is connected to the measuring devices of the plant. An
advantage of this system is that it collects high frequency process
data or increment utility data for real time exception analysis or
management reporting. He points out that he is aware of the
existence and advantage of Strata, however, he emphasises that
time constraint affects the focus to fully understand Strata.
Another noticeable point he made is that he was obligated by
Company Y to use it. Indeed, some plants of Company Y have
even built an entire business model for tracking, monitoring and
analysing utilities. Company Q, ice cream factory in south of
Europe, is a nice example. This plant fully integrated Strata in
their business process and receives notifications and exception
reports if targets are not matched with established benchmarks.
The files created by the expert are saved in the network drive and
only accessible for technical service managers. By examining the
information accuracy and reliability, he points out that the utility
values retrieved from Strata and Vispro corresponds with the
invoices of the energy companies. By reviewing the frequency of
interactions and the way of data sharing with the financial
department, the interviewee emphasised that he has a small
number of face-to-face meetings with the financial department.
The meetings deal with topics related to energy consumption and
forecasting. By examining the quality of planning, also he
emphasises that planning and forecasting are both related with
each other. Additionally, he mentioned that transparency of data
is key factor that influence the forecast accuracy. With the
objective to investigate the influence of determining factors, he
points out that SCV, seasonality and globalisation have direct
influence on the sales, production and indirectly on the utilities
forecast. Generally, these three factors are dealing with uncertain
environmental conditions and forced Company X to expand the
business network, moving from a local to more complex and
vulnerable supply chain.
Exploring in detail the current situation, the expert mentioned
that the ‘same utilities’ assumption is unjustifiable. The forecast
of the financial department did not fully include the following
projects and issues: 1) expansion of equipment; 2) production
speed up line four; 3) expected volume growth. According to the

10
interviewee, these trends affect the utilities significantly. The
increase in water usage can be explained by the introduction of
Product B. To avoid cross-contamination, different and extensive
cleaning methods must be applied. Also, the new product range
of Brand C influence the utilities. In the new product
development process (NPD), the firm performed several test
trials for these products. In practice, the results did not match
with the expectations and leads to an increase in utilities. This
impact was not included in the agenda and forecast. In general,
he indicates that he is aware of the increase in utilities and the
importance of an accurate financial forecast, therefore he made
some recommendations. To exploit the full potential of an
accurate utilities forecast, he advised to strive for excellence in
tracking, monitoring and analysing utilities. The ultimate aim is
to have the same business model as Company Q. Therefore, it is
necessary to focus more on automation and to measure the
performances per line, which results in enlargement of the
current line performance indicators (LPIs). Since this plan is
long-term oriented, he advised the financial department, with the
intention of performance tracking, to gain access into Strata.
After all, he mentioned that for meeting the forecast, which is
described in subsection 3.4.1, not only the forecast should be
corrected into a more reliable forecast, no, actions are needed
which will reduce the energy consumption and give the company
the opportunity to build an energy-efficient supply chain.
4.3 Summary of the findings: determining
factors for the KPI labour productivity With the objective to understand the KPI labour productivity and
to further investigate the importance of forecast accuracy to
supply chain performance, interview was held with the industrial
finance manager. This person works one year for Company X
and previously she worked for other (financial) departments of
Company Y. Aforementioned, labour productivity is a crucial
KPI for the firm. As stated in subsection 3.5.1, the KPI labour
productivity consist of several variables and these are related
with each other. Corresponding to the data of the current
situation, the interviewee made some statements. The first
statement is based on mismatches between the forecast and actual
values for the number of shifts and production volume. Small
change in demand, unexpected maintenance and uncertain
supply of raw materials caused these mismatches. In week 18,
technical issues caused production problems resulting that the
production line cannot operate at full capacity. Uncertain supply
of raw materials caused more changeovers as wel as clean-in-
places (CIPs). CIP refers to the use of a mix of chemicals, heat
and water to clean machinery, vessels or pipework without
dismantling the plant. The mismatches for the work hours for
Strategic Partner Z and Company X can be explained by
unexpected leave of the firm’s personnel. This caused a smaller
actual value than the forecast value. On the other side, the lack
of manpower was compensated by temporary workers of
Strategic Partner Z. This effect is also observable in labour costs
for both type of workers; cost increase at Strategic Partner Z and
a cost reduction for Company X. For gaining insights into the
topics planning and forecasting, the interviewee made the
following statements. She points out that she uses several data
sources to create the overview, which is described in subsection
3.5.1. Strategic Partner Z utilise Planbition, a planning software
with integrated tools for smart planning. The number of Strategic
Partner Z hours and the corresponding costs are retrieved via
mail. The supply chain department is responsible for data related
to the production volume and OEE. For presenting the data, they
use Power Pivots. A Power Pivot is an Excel add-in which is
useful for performing powerful data analysis and to create
sophisticated data models. The files are saved in the network
drive and are accessible for the financial department. Personnel
costs of Company X are calculated by the fincial department,
relying on documents of the HRBR department. Questions
related to the quality and accuracy of the data where answered as
follows: she emphasises that the retrieved data from the several
departments are reliable, since production (volume) and labour
are measured accurately by the responsible departments. The
created overview is made weekly and will be presented to the
management team, consisting of the planning & logistics
department, supply chain department, quality assurance
department, technology & innovation department, HRBR
department, financial department and the factory director. The
goal of this meeting is to continually improve the internal and
external supply chain. By tracking labour productivity, the firm
monitors (potential) mismatches and this encourage to take
action. Looking at the frequency of interactions, she emphasises
that a weekly management team meeting is hold and, if possible,
necessary documents will be shared adequately via the mail or
network drive. Also, it became clear that these information
systems do not collaborate together plus with the financial
department. Consequently, making an overview such as
described in subsection 3.5.1. becomes a time-consuming and
labour-intensive activity. Only one production line for one year
is analysed in this research, in real-life there are five different
production lines and 52 weeks.
Examining the quality of the planning, the expert emphasises that
the activities planning and forecasting are both related with each
other. With the objective to create an accurate financial forecast,
it is important that several departments deliver important files
and share relevant information (with an eye on the future) with
the financial department. Internal and external factors influence
the production and cost structure of the firm, and it is important
to know these factors and their corresponding impacts. She
mentioned that financial forecasting identifies trends in external
and internal historical data, and projects these trends in order to
provide the decision-makers (in this case the management team)
with information about what the financial status of the company
is likely to be at some point in the future. Therefore commitment
is an important factor among internal supply chain members. So,
planning is related to forecasting and both are responsible for the
future results. With the objective to investigate the influence of
determining factors, she points out that SCV, seasonality,
globalisation and fast-moving data have direct influence on the
production (volume) as well as on the labour productivity, so
these factors influence the accuracy of the forecast. If suppliers
underperform, Company X uses quality claims to compensate the
(potential) losses. In general, it can be stated that unexpected
events such as changes in demand forced the manufactory to
implement a responsive supply chain.
When taking a closer look to the current situation, the forecast
for working hours can be explained by leave of the firm’s
personnel, which was in this case unexpected holiday leave and
no sick leave. The solution was to make use of Strategic Partner
Z personnel in order to have a balanced labour force and to
continue with the production. According to the interviewee, the
increase in OEE is not only beneficial for production processes,
it stimulates also the operational eco-efficiency which is in ties
in with the firm’s core values of being good to the planet. In week
18, there was no introduction of new flavours, however NPD
influence the KPI labour productivity on various levels.
Increasing the product portfolio deals with test trials including
new technology, which negatively influence the OEE. Apart
from the fact that operation cannot operate at full capacity, more
manpower is needed to eventually detect and adjust failures.
11
5. DISCUSSION AND IMPLICATIONS
5.1 Comparing case study findings against
the literature review As previously reported, the analysed KPIs are direct and indirect
related to the supply chain. Relying on the literature review,
some expectations were met, whereas others were not. All
determining factors, retrieved from literature and empirical
research are presented in Table 7 below.
Table 7. Summary of the determining factors, retrieved
from literature review and empirical research
Factors retrieved
from literature*
Biodigester Utilities Labour
productivity
SCV X X
Seasonality X X
Globalisation X X
Fast-moving
data
X
Data existence X X X
Data relevance X X X
Data reliability X
Human factor X X
Technology &
tools
X
X
Factors retrieved
from research*
Culture
NPD process
SDP**
X
X
X
X
X
X
X
X
*The x indicates that the factor has influence on the forecast
accuracy
**SDP stands for supplier delivery performance
Forecast accuracy is mainly influenced by production related
factors, like SCV (Christopher & Holweg, 2017, p. 3),
globalisation (Lee, 2002, p. 105), seasonality (Gupta & Maranas,
2003, p. 1219) and fast-moving data (Petropoulos et al., 2014, p.
152). Furthermore, information related factors, especially data
existence (Yan & Wang, 2000, p. 1171; Ali & Boylan, 2010, p.
5; Zhu et al., 2011, p. 284), data relevance (Ramanathan, 2012,
p. 78) and data reliability (Chen & Wolfe, 2011, p. 70) have
influence on the accuracy of the forecast. Additionally, factors
such as the human factor (Singh, 2014, p. 5) and technology and
tools (Fildes & Hastings, 1994, p. 16), play also a critical role on
forecast accuracy. Considering factors that (all) KPIs share,
production related factors mainly influence the forecast accuracy
for utilities and labour productivity. The inaccuracy of the values,
presented in Tables 3–6, can be explained by internal and
external influences.
Demand volatility is related to SCM and focuses mainly on the
bullwhip effect. Referring to the bullwhip effect and conducted
research by Lee et al. (1997), Company X deals with the fact that
amongst production related factors, change in demand influence
production volume as well as SCV, which is closely linked to the
KPIs utilities and labour productivity. According to Gupta &
Maranas (2003, p. 1219), seasonality is a significant driver to
demand volatility. Seasonal effects are periodic fluctuations that
occur on a certain base or certain seasons. This research proves
this. During high season, demand increase, more manpower
works on the workforce, more shifts are planned, production
volume increase as well as utilities. During low season, it works
the other way around. Reviewing globalisation, Lee (2002, p.
105) pointed out that increasing globalisation and market
competition have forced companies to expand their business
networks, moving from local to more complex and vulnerable
supply chain. When reviewing research, the plant is responsible
for the supply of ice cream for the whole European market. Next,
in order to succeed, the firm is dependent of worldwide supply
of resources. Additionally, the strategy of being an innovative
leader in the premium ice cream industry, dealing with a
commitment towards social activism and environmental
responsibility, influences the local supplier selection process and
ensures to go global. Consequently, the created inefficiency
influences directly the labour productivity (in terms of volume,
labour hours and OEE) and indirectly the utilities (in terms of
changeovers and CIPs). Finally, it was found that fast-moving
data influence the forecast accuracy of labour productivity. Fast-
moving data affects the ability to act acute and adequately to
internal and external influences. This aligns with Petropoulos et
al. (2014, p. 152), where it has been stated that forecast accuracy
is negatively influenced by fast-moving data.
Reviewing information related factors, all interviewees stated
that data existence, relevance and reliability are factors with high
impact or importance for forecast accuracy. Considering the KPI
biodigester, inefficient and lack of data sharing negatively
influence the financial forecast. Thomassey (2010, pp. 481-483)
already stated that gathering the latest information and sharing
with the relevant parties will minimise the impact of uncertainties
and increase the chances of adjusting the forecast close to a real-
time manner, which can be used to reflect on the current
situation. For the KPI utilities, difference in assumptions
influence the accuracy. By sharing these assumptions, the
forecast accuracy increases and both parties benefit from such
improvement (Yan & Wang, 2012, p. 1171). For the KPI labour
productivity, data sharing between relevant departments,
described in section 4.3, exist and this stimulates the profitability
(Zhu et al., 2011, p. 284) and reduces the bullwhip effect (Ali &
Boylan, 2010, p. 5). Considering the relevance, i.e. ‘what to
share’ is the second factor contributing to forecast accuracy
(Ramanathan, 2012, pp. 77-78). The type of information includes
a good range of both internal (generated within business) and
external (generated from environment) data, as well as direct
(primary) and indirect (secondary) data. Based from interviews,
the biodigester deals with internal and primary data. Labour
productivity deals with internal and exteranl data, as well as with
direct and indirect data. Utilities deals mainly with internal data,
plus direct and indirect data. Ramathan (2012, p. 78) suggest that
a combination of both internal and external data will result in a
better forecast than either alone. Finally, according to literature
review and results, data reliability influences mainly the KPI
labour productivity. Multiple parties are involved in data quality.
Chen & Wolfe (2011, p. 70) already stated that information
quality is affected by the number of relays and handlings from its
origin to its destination. Directly exchange between two parties
ensures higher quality, while multiple handlings along several
parties, the quality tends to decrease due to manipulation along
the way such as formant change, data conversion and
inappropriate interpretation and communication which make the
information less visible or more difficult to understand.
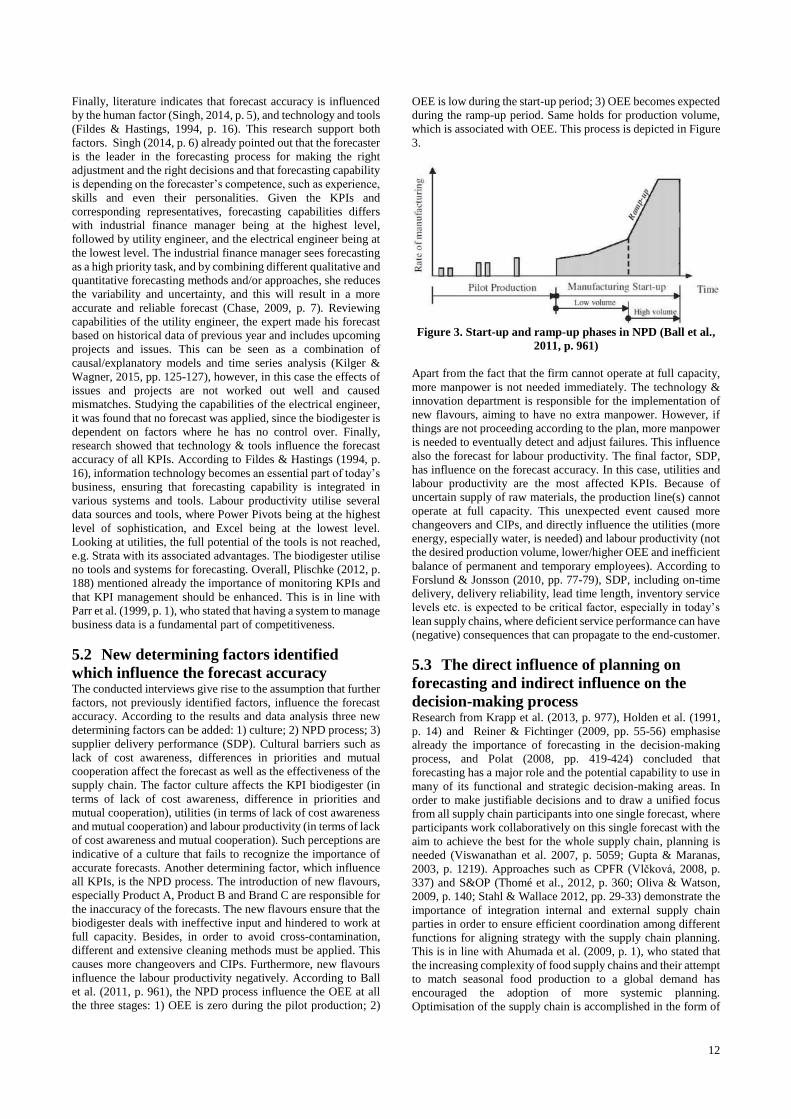
12
Finally, literature indicates that forecast accuracy is influenced
by the human factor (Singh, 2014, p. 5), and technology and tools
(Fildes & Hastings, 1994, p. 16). This research support both
factors. Singh (2014, p. 6) already pointed out that the forecaster
is the leader in the forecasting process for making the right
adjustment and the right decisions and that forecasting capability
is depending on the forecaster’s competence, such as experience,
skills and even their personalities. Given the KPIs and
corresponding representatives, forecasting capabilities differs
with industrial finance manager being at the highest level,
followed by utility engineer, and the electrical engineer being at
the lowest level. The industrial finance manager sees forecasting
as a high priority task, and by combining different qualitative and
quantitative forecasting methods and/or approaches, she reduces
the variability and uncertainty, and this will result in a more
accurate and reliable forecast (Chase, 2009, p. 7). Reviewing
capabilities of the utility engineer, the expert made his forecast
based on historical data of previous year and includes upcoming
projects and issues. This can be seen as a combination of
causal/explanatory models and time series analysis (Kilger &
Wagner, 2015, pp. 125-127), however, in this case the effects of
issues and projects are not worked out well and caused
mismatches. Studying the capabilities of the electrical engineer,
it was found that no forecast was applied, since the biodigester is
dependent on factors where he has no control over. Finally,
research showed that technology & tools influence the forecast
accuracy of all KPIs. According to Fildes & Hastings (1994, p.
16), information technology becomes an essential part of today’s
business, ensuring that forecasting capability is integrated in
various systems and tools. Labour productivity utilise several
data sources and tools, where Power Pivots being at the highest
level of sophistication, and Excel being at the lowest level.
Looking at utilities, the full potential of the tools is not reached,
e.g. Strata with its associated advantages. The biodigester utilise
no tools and systems for forecasting. Overall, Plischke (2012, p.
188) mentioned already the importance of monitoring KPIs and
that KPI management should be enhanced. This is in line with
Parr et al. (1999, p. 1), who stated that having a system to manage
business data is a fundamental part of competitiveness.
5.2 New determining factors identified
which influence the forecast accuracy The conducted interviews give rise to the assumption that further
factors, not previously identified factors, influence the forecast
accuracy. According to the results and data analysis three new
determining factors can be added: 1) culture; 2) NPD process; 3)
supplier delivery performance (SDP). Cultural barriers such as
lack of cost awareness, differences in priorities and mutual
cooperation affect the forecast as well as the effectiveness of the
supply chain. The factor culture affects the KPI biodigester (in
terms of lack of cost awareness, difference in priorities and
mutual cooperation), utilities (in terms of lack of cost awareness
and mutual cooperation) and labour productivity (in terms of lack
of cost awareness and mutual cooperation). Such perceptions are
indicative of a culture that fails to recognize the importance of
accurate forecasts. Another determining factor, which influence
all KPIs, is the NPD process. The introduction of new flavours,
especially Product A, Product B and Brand C are responsible for
the inaccuracy of the forecasts. The new flavours ensure that the
biodigester deals with ineffective input and hindered to work at
full capacity. Besides, in order to avoid cross-contamination,
different and extensive cleaning methods must be applied. This
causes more changeovers and CIPs. Furthermore, new flavours
influence the labour productivity negatively. According to Ball
et al. (2011, p. 961), the NPD process influence the OEE at all
the three stages: 1) OEE is zero during the pilot production; 2)
OEE is low during the start-up period; 3) OEE becomes expected
during the ramp-up period. Same holds for production volume,
which is associated with OEE. This process is depicted in Figure
3.
Figure 3. Start-up and ramp-up phases in NPD (Ball et al.,
2011, p. 961)
Apart from the fact that the firm cannot operate at full capacity,
more manpower is not needed immediately. The technology &
innovation department is responsible for the implementation of
new flavours, aiming to have no extra manpower. However, if
things are not proceeding according to the plan, more manpower
is needed to eventually detect and adjust failures. This influence
also the forecast for labour productivity. The final factor, SDP,
has influence on the forecast accuracy. In this case, utilities and
labour productivity are the most affected KPIs. Because of
uncertain supply of raw materials, the production line(s) cannot
operate at full capacity. This unexpected event caused more
changeovers and CIPs, and directly influence the utilities (more
energy, especially water, is needed) and labour productivity (not
the desired production volume, lower/higher OEE and inefficient
balance of permanent and temporary employees). According to
Forslund & Jonsson (2010, pp. 77-79), SDP, including on-time
delivery, delivery reliability, lead time length, inventory service
levels etc. is expected to be critical factor, especially in today’s
lean supply chains, where deficient service performance can have
(negative) consequences that can propagate to the end-customer.
5.3 The direct influence of planning on
forecasting and indirect influence on the
decision-making process Research from Krapp et al. (2013, p. 977), Holden et al. (1991,
p. 14) and Reiner & Fichtinger (2009, pp. 55-56) emphasise
already the importance of forecasting in the decision-making
process, and Polat (2008, pp. 419-424) concluded that
forecasting has a major role and the potential capability to use in
many of its functional and strategic decision-making areas. In
order to make justifiable decisions and to draw a unified focus
from all supply chain participants into one single forecast, where
participants work collaboratively on this single forecast with the
aim to achieve the best for the whole supply chain, planning is
needed (Viswanathan et al. 2007, p. 5059; Gupta & Maranas,
2003, p. 1219). Approaches such as CPFR (Vlčková, 2008, p.
337) and S&OP (Thomé et al., 2012, p. 360; Oliva & Watson,
2009, p. 140; Stahl & Wallace 2012, pp. 29-33) demonstrate the
importance of integration internal and external supply chain
parties in order to ensure efficient coordination among different
functions for aligning strategy with the supply chain planning.
This is in line with Ahumada et al. (2009, p. 1), who stated that
the increasing complexity of food supply chains and their attempt
to match seasonal food production to a global demand has
encouraged the adoption of more systemic planning.
Optimisation of the supply chain is accomplished in the form of
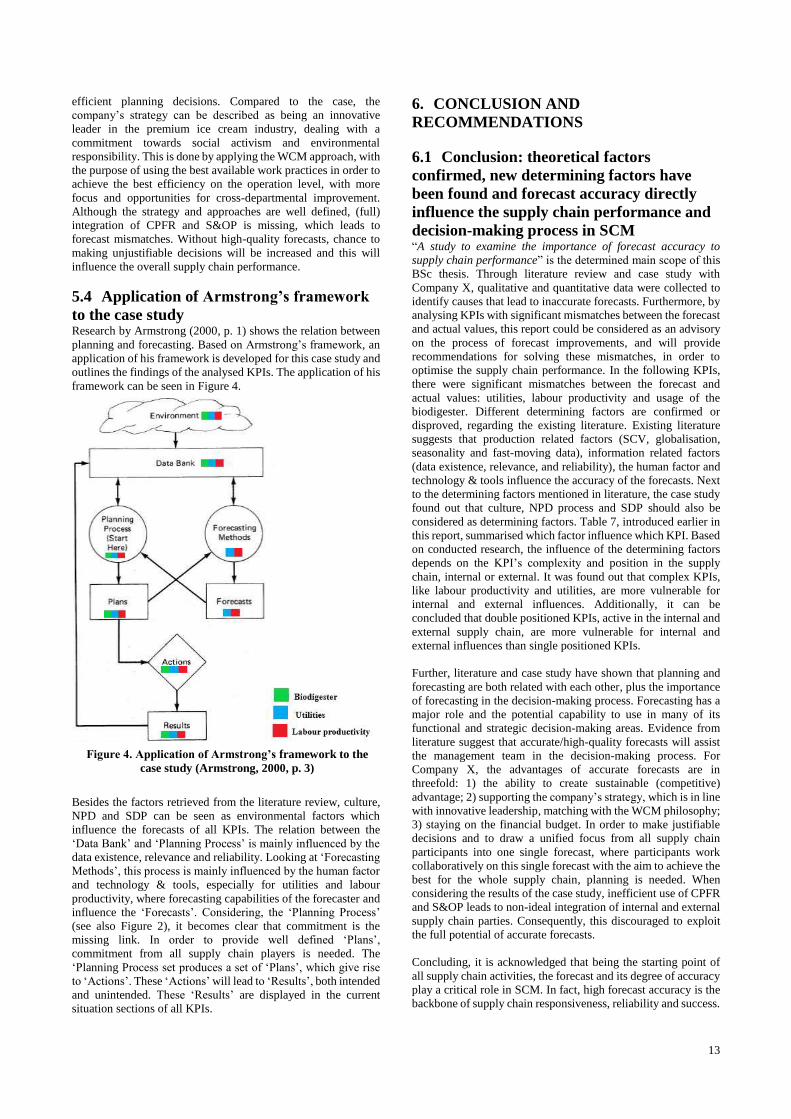
13
efficient planning decisions. Compared to the case, the
company’s strategy can be described as being an innovative
leader in the premium ice cream industry, dealing with a
commitment towards social activism and environmental
responsibility. This is done by applying the WCM approach, with
the purpose of using the best available work practices in order to
achieve the best efficiency on the operation level, with more
focus and opportunities for cross-departmental improvement.
Although the strategy and approaches are well defined, (full)
integration of CPFR and S&OP is missing, which leads to
forecast mismatches. Without high-quality forecasts, chance to
making unjustifiable decisions will be increased and this will
influence the overall supply chain performance.
5.4 Application of Armstrong’s framework
to the case study Research by Armstrong (2000, p. 1) shows the relation between
planning and forecasting. Based on Armstrong’s framework, an
application of his framework is developed for this case study and
outlines the findings of the analysed KPIs. The application of his
framework can be seen in Figure 4.
Besides the factors retrieved from the literature review, culture,
NPD and SDP can be seen as environmental factors which
influence the forecasts of all KPIs. The relation between the
‘Data Bank’ and ‘Planning Process’ is mainly influenced by the
data existence, relevance and reliability. Looking at ‘Forecasting
Methods’, this process is mainly influenced by the human factor
and technology & tools, especially for utilities and labour
productivity, where forecasting capabilities of the forecaster and
influence the ‘Forecasts’. Considering, the ‘Planning Process’
(see also Figure 2), it becomes clear that commitment is the
missing link. In order to provide well defined ‘Plans’,
commitment from all supply chain players is needed. The
‘Planning Process set produces a set of ‘Plans’, which give rise
to ‘Actions’. These ‘Actions’ will lead to ‘Results’, both intended
and unintended. These ‘Results’ are displayed in the current
situation sections of all KPIs.
6. CONCLUSION AND
RECOMMENDATIONS
6.1 Conclusion: theoretical factors
confirmed, new determining factors have
been found and forecast accuracy directly
influence the supply chain performance and
decision-making process in SCM “A study to examine the importance of forecast accuracy to
supply chain performance” is the determined main scope of this
BSc thesis. Through literature review and case study with
Company X, qualitative and quantitative data were collected to
identify causes that lead to inaccurate forecasts. Furthermore, by
analysing KPIs with significant mismatches between the forecast
and actual values, this report could be considered as an advisory
on the process of forecast improvements, and will provide
recommendations for solving these mismatches, in order to
optimise the supply chain performance. In the following KPIs,
there were significant mismatches between the forecast and
actual values: utilities, labour productivity and usage of the
biodigester. Different determining factors are confirmed or
disproved, regarding the existing literature. Existing literature
suggests that production related factors (SCV, globalisation,
seasonality and fast-moving data), information related factors
(data existence, relevance, and reliability), the human factor and
technology & tools influence the accuracy of the forecasts. Next
to the determining factors mentioned in literature, the case study
found out that culture, NPD process and SDP should also be
considered as determining factors. Table 7, introduced earlier in
this report, summarised which factor influence which KPI. Based
on conducted research, the influence of the determining factors
depends on the KPI’s complexity and position in the supply
chain, internal or external. It was found out that complex KPIs,
like labour productivity and utilities, are more vulnerable for
internal and external influences. Additionally, it can be
concluded that double positioned KPIs, active in the internal and
external supply chain, are more vulnerable for internal and
external influences than single positioned KPIs.
Further, literature and case study have shown that planning and
forecasting are both related with each other, plus the importance
of forecasting in the decision-making process. Forecasting has a
major role and the potential capability to use in many of its
functional and strategic decision-making areas. Evidence from
literature suggest that accurate/high-quality forecasts will assist
the management team in the decision-making process. For
Company X, the advantages of accurate forecasts are in
threefold: 1) the ability to create sustainable (competitive)
advantage; 2) supporting the company’s strategy, which is in line
with innovative leadership, matching with the WCM philosophy;
3) staying on the financial budget. In order to make justifiable
decisions and to draw a unified focus from all supply chain
participants into one single forecast, where participants work
collaboratively on this single forecast with the aim to achieve the
best for the whole supply chain, planning is needed. When
considering the results of the case study, inefficient use of CPFR
and S&OP leads to non-ideal integration of internal and external
supply chain parties. Consequently, this discouraged to exploit
the full potential of accurate forecasts.
Concluding, it is acknowledged that being the starting point of
all supply chain activities, the forecast and its degree of accuracy
play a critical role in SCM. In fact, high forecast accuracy is the
backbone of supply chain responsiveness, reliability and success.
Figure 4. Application of Armstrong’s framework to the
case study (Armstrong, 2000, p. 3)
.
14
It is valuable for a company to have accurate forecasts, since this
encourages healthy collaboration between supply chain partners,
positively influence the decision-making process, brings mutual
benefits to all supply chain participants and eventually creates a
win-win result for the company.
6.2 Recommendations: improving the
information quality management, applying
CPFR and S&OP, and considering the side
effects of culture, NDP and SDP on forecast
accuracy Based on the findings, it is for the financial department highly
recommendable to build a stable performance metric which will
contribute to a more accurate decision-making process, and at the
same time present decision makers (management team) the
impact of forecasting errors. By implementing advanced and
collaborative KPI dashboards, the organisation can access their
success indicators in real time manner in order to make decisions
toward achieving long-term goals (Clark et al., 2006, p. 19).
LaPointe (2005, p. 99) confirms this and mentioned two factors
driving the need for dashboards: 1) poor organisation of the many
pieces of potentially decision-relevant data; 2) the managerial
biases in information processing and decision-making. These
two causes are relevant and applicable for the case study. Next,
this case study explored that culture, NDP and SDP can be seen
as determining factors It would be advisable to analyse the
current organisational culture. In addition to that, it is
recommended to fully implement CPFR and S&OP into the
organisation and to put forecasting high on the agenda of all
relevant departments. Considering the information related
factors, it is advisable to build transparency into the many pieces
of (un)used data and tools (Thomassey, 2010, pp. 481-483).
Given all information related factors, it would be advisable to
revise and optimise the current information quality management,
especially in the field of technology and tools.
It is also heavily recommended to review the supply chain, since
NDP and SDP influence all three KPIs. Based on this study, the
complexity of supply chain and the organisational structure
makes the firm more vulnerable for internal and external
influences. Research suggest that coordinated responsive supply
chain reduces internal and external influences (Wong & Hvolby,
2007, pp. 407-408). Research by Ambe (2010, p. 5) suggest that
in order to survive, companies need to respond increasingly to
unexpected shocks and discontinuities, where more focus for
achieving greater agility is needed. This means shifting from
SCM to agile supply chain management (ASCM). Furthermore,
since NDP and SDP are determining factors it is advisable to go
into the detail of these factors. Research by Schiele (2010, p. 138)
suggest the importance of earlier supplier integration into the
NPD process, effecting the NPD contribution positively, while
also managing the overall costs.
7. IMPLICATIONS, LIMITATIONS AND
SUGGESTIONS FOR FUTURE
RESEARCH
7.1 Implications: proving practical evidence
on determining factors while contributing to
literature with new drivers This study has sought to contribute to the knowledge on the
importance of forecast accuracy to supply chain performance.
Even through SCM is a hotly debated and familiar researched
topic, there is a considerable amount of research available on
volatility and determining factors on forecast accuracy, but there
has been little actual research into the causes and effects of
forecast (in)accuracy, especially in the FMCG sector. From a
theoretical perspective, this study has therefore positively
contributed to theory development by combining insights from
forecasting and planning. This research not only highlights the
importance of forecast accuracy, but also the determining factors
which play a critical role in this process. Besides, based on
Armstrong’s (2000, p. 3) framework, application for this case is
made with the purpose of understanding the relation between
planning and forecasting. From a practical perspective, the
results of the study can be useful for organisation(s) (especially
in the FMCG sector) to extend their perspective on the
importance of forecast accuracy. The greatest value of this study
lies in the empirical findings and provided recommendations for
Company X, in which they can optimise their forecast accuracy
and SCM.
7.2 Limitations: due small sample of KPIs
and firms’ complexity, findings cannot be
generalised This study, however, is subject to a few major limitations to what
this study has suggested so far; these limitations give rise to
suggestion for future research. It has been restricted in its time
and scope, leading to an analysis on only three KPIs. It would be
interesting to study other KPIs, where significant mismatches
between the forecast and actual values occur, with the same depth
in order to fully understand the impact of forecast accuracy on
supply chain performance. The same time and scope restrictions
have also limited the range of the analysed KPIs. For the KPI
labour productivity, only the performance of line two in week 18
is analysed. This means that my study is just a snap-shot of the
current situation. Another production line and/or time period will
give a different result. Further, given that primary data for the
KPIs came from interviews with the responsible representatives,
the data may have been slightly biased. Besides, Company X is
a wholly owned subsidiary of Company Y. This study is based
on the complexity of the investigated company and it can be not
verified if the same findings and conclusions apply to small and
medium sized businesses. Additionally, this study did not take
the supply chain impacts and opportunities caused by the Brexit
into account.
7.3 Further research: extension of the case
study with novel KPIs and gain insights into
the effects of culture, NPD and SDP on
forecasting As mentioned in the whole report, forecast accuracy has been
considered one of the sensitive topics of SCM, especially in the
eyes of practitioners. From a theoretical perspective, in order to
fully understand the relation between forecasting and planning,
further research is suggested. Additionally, this report concludes
that determining factors, described in chapter 5, are the key
factors in forecast accuracy. More extensive research is needed
to support this. Same holds for new determining factors
(organisational culture, NPD process and SDP), which are
retrieved from empirical research. In order to validate the
findings of this thesis, it is recommended to replicate the analysis
with other KPIs, where significant mismatches between the
forecast and actual values occur. The specialised interview
scheme, which can be found in Appendix A, can be used.
15
8. ACKNOWLEDGEMENTS I have been working on my BSc thesis International Business
Administration since April 2019. I had the privilege of doing this
project at Company X. Without great support of Company X it
would be not possible to write this BSc thesis. Company X has
always been very responsive in providing necessary information,
and without their generous support, this report would lack in
accurate information on current and future developments. In
addition, I would like to thank my supervisor from Company X.
Your positivity and trust in my capabilities encouraged me to go
the extra mile and make me enthusiastic for the topic of
forecasting. Besides, I would like to thank my first and second
supervisors, Prof.dr. Holger Schiele and Dr. Henry van
Beusichem, for their guidance and expert contributions to this
BSc thesis. Their feedback and insights helped me to compose
my final report. Finally, I would like to thank the representatives
who contributed to this research by participating the interview
sessions and sharing relevant information with me.
9. GLOSSARY 3PL: Third-Party Logistics
ARIMA: Autoregressive Integrated Moving Average
ASCM: Agile Supply Chain Management
CIP: Clean in Place
COD: Chemical Oxygen Demand
CPFR: Collaborative Planning, Forecasting and Replenishment
FMCG: Fast-Moving Consumer Goods
HRBP: Human Resource Business Partners
KPI: Key Performance Indicator
LPI: Line Performance Indicator
MARINA: Multivariate Autoregressive Integration Moving
Average
NPD: New Product Development
OEE: Overall Equipment Effectiveness
P&G: Procter and Gamble
S&OP: Sales and Operations Planning
SCM: Supply Chain Management
SCV: Supply Chain Volatility
SDP: Supplier Delivery Performance
SKU: Stock Keeping Unit
SMA: Simple Moving Average
TPM: Total Productive Maintenance
WCM: World Class Manufacturing
10. BIBLIOGRAPHY Abu-Mostafa, Y.S. & Atiya, A. (1996). Introduction to
Financial Forecasting. Applied Intelligence, vol. 6(3),
205-213.
Ahumada, O. & Villalobos, J.R. (2009). Application of
Planning Models in the Agri-Food Supply Chain: A
Review. European Journal of Operational Research.
Vol. 196(1), 1-20.
Akkerman, R., Farahani, P. & Grunow, M. (2010). Quality,
safety and sustainability in food distribution: A
review of quantitative operations management
approaches and challenges. Operations Research-
Spektrum, vol. 32(4), 863-904.
Albarune, A.R.B. & Habib, Md Mamun. (2015). A study of
forecasting practices in supply chain management.
International Journal of Supply Chain Management,
vol 4(2), 55-61.
Ali, M.M., & Boylan, J.E. (2010). The value of forecast
information sharing in supply chains. Foresight: The
International Journal of Applied Forecasting, vol.
18(14), 14-18.
Alsaawi, A. (2014). A Critical Review of Qualitative
Interviews. SSRN Electronic Journal, vol 3(4), 149-
156.
Ambe, I.M. (2010). Agile Supply Chain: Strategy for
Competitive Advantage. Journal of Global Strategic
Management, vol. 4(1), 5-17.
Andrade, P.R.M.D. & Sadaoui, S. (2017). Improving Business
Decision Making based on KPI Management System.
IEE International Conference on Systems, Man and
Cybernetics (SMC), Banff Centre, Banff, Canada,
October 5-8, 2017.
Armstrong, J.S. (2000). Strategic Planning and Forecasting
Fundamentals. The Strategic Management Handbook,
Kenneth Albert ed., 1-32, New York, NY: McGraw-
Hill/Irwin.
Armstrong, J.S. (2001). Principles of Forecasting: A Handbook
for Researchers and Practitioners, 1st ed., New York,
NY: Springer US.
Attaran, M. & Attaran, S. (2007). Collaborative supply chain
management: The most promising practice for
building efficient and sustainable supply chains.
Business Process Management Journal, vol. 13(3),
390-404.
Aviv, Y. (2001). The effect of collaborative forecasting on
supply chain performance. Management Science, vol.
47(10), 1326-1343.
Balakrishnan, A., Geunes, J. & Pangburn, M.S. (2004).
Coordinating Supply Chains by Controlling Upstream
Variability Propagation. Manufacturing & Service
Operations Management, vol. 6(2), 163–183.
Ball, P., Roberts, S., Natalicchio., A. & Scorzafave, C. (2011).
Modelling production ramp-up of engineering
products. Journal of Engineering Manufacture, vol
225(6), 959-971
Brockwell, P.J. & Davis, R.A. (2013). Time Series: Theory and
Methods, 2nd ed., Berlin: Springer Science Business
Media.
Chase, C. (2009). Demand-Driven Forecasting: A Structured
Approach to Forecasting, 1st ed., New Jersey: John
Wiley & Sons.
Chen, P.C. & Wolfe, P.M. (2011). A data quality model of
information-sharing in a two-level supply chain.
International Journal of Electronic Business
Management, vol. 9(1), 70-77.
Choi, T.M. & Kai Chan, H.K. & Yue, X. (2017). Recent
Development in Big Data Analytics for Business
Operations and Risk Management. IEEE Transactions
on cybernetics, vol 47, 2017.
Christopher, M. & Holweg, M. (2011). Supply chain 2.0:
Managing supply chains in the era of turbulence.
International Journal of Physical Distribution and
Logistics Management, vol. 41(1), 63-82.
Christopher, M. & Holweg, M. (2017). Supply chain 2.0
revisited: a framework for managing volatility-
induced risk in the supply chain. International
Journal of Physical Distribution & Logistics
Management, vol. 47(1), 2-17.
Clark, B.H., Andrew, V., Abela T. & Ambler, T. (2006).
Behind the Wheel. Marketing Management, vol.
15(1), 18-23.
Ewing, B. T. & Thompson, M.A. (2008). Industrial production,
volatility, and the supply chain. International Journal
of Production Economics, vol.115(2), 553-558.
Fildes, R. & Hastings, R. (1994). The organization and
Improvement of market forecasting. The Journal of
the Operational Research Society, vol. 45(1), 1-16.

16
Forslund, H. & Jonsson, P. (2010). Integrating the performance
management process of on-time delivery with
suppliers. International Journal of Logistics, vol.
13(3), 225-241.
Georgiadis, P., Vlachos, D. & Iakovou, E. (2005). A system
dynamics modeling framework for the strategic
supply chain management of food chains. Journal of
Food Engineering, vol 70(3), 351-364.
Germain, R., Claycomb, C. & Dröge, C. (2008). Supply chain
variability, organizational structure, and performance:
The moderating effect of demand unpredictability.
Journal of Operations Management, vol. 26(5), 557-
570.
Gupta, A. & Maranas, C. (2003). Managing Demand
Uncertainty in Supply Chain Planning. Computers &
Chemical Engineering, vol. 27(8), 1219-1227.
Hendricks, K.B. & Singhal, V.R. (2009). Demand-Supply
Mismatches and Stock Market Reaction: Evidence
from Excess Inventory Announcements.
Manufacturing & Service Operations Management,
vol. 11(3), 509–524.
Hofisi, C., Hofisi, M. & Mago, S. Critiquing Interviewing as a
Data Collection Method. Mediterranean Journal of
Social Sciences, vol 5(16), 60-64.
Holden, K., Thomson, J.L. & Peel, D.A. (1991). Economic
Forecasting: An Introduction. New York, NY:
Cambridge UP.
Kilger, C. & Wagner, M. (2015). Demand Planning. In Supply
Chain Management and Advanced Planning 5th ed.,
125–154, Berlin: Springer Science Business Media.
Krapp, M., Nebel, J. & Sahamie, R. (2013). Using forecasts and
managerial accounting information to enhance closed-
loop supply chain management. Operations Research-
Spektrum, vol. 35(4), 975-1007.
LaPointe, P. (2005). Marketing by the Dashboard Light. New
York, NY: Association of National Advertisers.
Lee, H.L., Padmanabhan, V. & Wang, S. (1997). Information
Distortion in a Supply Chain: The Bullwhip Effect.
Management Science, vol. 43(4), 546-558.
Lee, LH. (2002). Aligning Supply Chain Strategies with
Product Uncertainties. California Management
Review, vol. 44(3), 105-119.
Lehmann, D.R., David, R. & Reibstein, J. (2006). Marketing
Metrics and Financial Performance. Marketing
Science Institute Monograph.
Mentzer, J.T. & Moon, M.A. (2005): Sales forecasting
management: a demand management approach, 2nd
ed., Thousand Oaks: SAGE publications Inc.
Nenni, M.E., Giustiniano, L. & Pirolo, L. (2013). Demand
Forecasting in the Fashion Industry: A Review.
International Journal of Engineering Business
Management, vol. 5(37), 1-6.
Oliva, R. & Watson, N. (2009). Managing functional biases in
organizational forecasts: a case study of consensus
forecasting in supply chain planning. Production &
Operations Management. vol. 18(2), 138-151.
Parr, N., Shanks, G. & Graeme & Darke, P. (1999).
Identification of Necessary Factors for Successful
Implementation of ERP Systems. International
Working Conference on New Information
Technologies in Organizational Processes, St. Louis,
Missouri, USA, August 21-22, 1999.
Petropoulos, F., Makridakis, S., Assimakopoulos, V. &
Nikolopoulos, K. (2014). Horses for Courses in
demand forecasting. European Journal of
Operational Research, vol. 237(1), 152-163.
Pindyck, R.S. (2004). Volatility and commodity price
dynamics. Journal of Futures Markets, vol. 24(11),
1029-1047.
Plischke, E. (2012). How to compute variance-based sensitivity
indicators with your spreadsheet software.
Environmental Modelling & Software, vol. 35(C),
188-191.
Polat, C. (2008). Forecasting as a strategic decision-making
tool: A review and discussion with emphasis on
marketing management. European Journal of
Scientific Research, vol. 20(2), 419-442.
Ramanathan, U. (2012). Supply chain collaboration for
improved forecast accuracy of promotional sales.
International Journal of Operations & Production
Management, vol. 32(6), 676-695.
Reiner, G.& Fichtinger, J. (2009). Demand forecasting for
supply processes in consideration of pricing and
market information. International Journal of
Production Economics, vol 118(1), 55-62.
Schiele, H. (2010). Early supplier ntegration: the dual role of
purchasing in new product development. R&D
Management, vol. 40(2), 138-153.
Schisgall, O. (1981). Eyes on Tomorrow, 1st ed. New York,
NY: J.G. Ferguson.
Silver, E., Pyke, D. & Peterson, R. (1998). Inventory
management and production planning and scheduling
3rd ed., New York, NY: John Wiley and Sons.
Singh, S. (2014). Critical skills for the business forecaster.
Foresight: The International Journal of Applied
Forecasting, issue 32, 5-11.
Stahl, R. A. & Wallace, T. F. (2012). S&OP principles: the
foundation for success. Foresight: The International
Journal of Applied Forecasting. vol. 27(3), 29-34.
Stevenson, W.J. (2002). Operation Management 7th ed. New
York, NY: McGraw-Hill/Irwin.
Tachizawa, E. M. & Thomsen, C. G. (2007). Drivers and
sources of supply flexibility: an exploratory study.
International Journal of Operations & Production
Management, vol. 27(10), 1115–1136.
Thomassey, S. (2010). Sales forecasts in clothing industry: the
key success factor of the supply chain management.
International Journal of Production Economics, vol.
128(2), 470-83.
Thomé, A.M.T., Scavarda, L.F., Fernandez, N.S. & Scavarda,
A.J. (2012). Sales and operations planning and the
firm performance. International Journal of
Productivity & Performance Management, vol. 61(4),
359-381.
Viswanathan, S., Widiarta, H. & Piplani, R. (2007). Value of
information exchange and synchronization in a multi-
tier supply chain. International Journal of Production
Research, vol. 45(21), 5057-5074.
Vlčková, V. (2008). Demand forecasting in CPFR. 13th
International Scientific Conference „Economics and
Management, Kaunas University of Technology,
Lithuania, 10-11April,2008.
Wang, L. & Pervaiz, A. (2007). Information technology
capability: firm valuation, earnings uncertainty, and
forecast accuracy. Journal of Information Systems,
vol. 21(2), 27-48.
Wang, X. & Disney, S.M. (2016). The Bullwhip Effect:
Progress, Trends and Directions. European Journal of
Operational Research, vol. 250(3), 691–701.
Wind, Y. (2005). Marketing as an Engine of Business Growth:
A Cross-Functional Perspective. Journal of Business
Research, vol.58(7), 863-873.

17
Wong, C.Y. & Hvolby, H.H. (2007). Coordinated
responsiveness for volatile toy supply chains.
Production Planning & Control: The Management of
Operations, vol. 18(5), 407– 419.
Wright, G. & Goodwin, P. (1998). Forecasting with Judgment
1st ed., New Jersey: John Wiley & Sons.
Yan, R.L. & Wang, K.Y. (2012). Franchisor–franchisee supply
chain cooperation: sharing of demand forecast
information in high-tech industries. Industrial
Marketing Management, vol. 41(7), 1164-1173.
Yang, B. & Burns, N. (2003). Implications of postponement for
the supply chain. International Journal of Production
Research, vol. 41(9), 2075-2090.
Zhu, X.W., Mukhopadhyay, S.K. & Yue, X.H. (2011). Role of
forecast effort on supply chain profitability under
various information sharing scenarios. International
Journal of Production Economics. vol. 129(2), 284-
291.
Zotteri, G., Kalchschmidt, M. & Caniato, F. (2005). The impact
of aggregation level on forecasting performance.
International Journal of Production Economics, vol.
94(1), 479–491.
18
11. APPENDIX
Appendix A - Interview scheme with the
industrial finance manager, utility engineer
and electrical engineer
INTRODUCTION
Research aim: analyse forecast accuracy and determine its major
causes. In the end, this report will be an advisory on the process
of forecast improvements and will provide recommendations for
solving mismatches, in order to optimise the production process
of the company.
Interview objectives: the focus is to understand the way of
interactions, the frequency of interactions, the accuracy/quality
of the exchanged information, collaboration on planning and
forecasting between you and the financial department.
Remarks: express the thankfulness for the participation, address
any confidentiality issue, refer to the approved ethical review of
the University of Twente, and address that it is our common
interest to find a common solution(s) for the current problem(s).
BACKGROUND INFORMATION
▪ What is your job title and what are your responsibilities?
▪ How many years of experience do you have in your job?
And at Company X?
▪ What is your educational background?
▪ Can you explain your KPI in detail?
DATA & INFORMATION SYSTEMS
▪ Which information systems (hardware, software, database
etc.) are you currently using? And if known, which systems
for the future?
▪ Where and how do you store the data?
▪ What are the (company) reports that you consult most while
performing your own activity? Or how do you collect the
data to perform your activity?
▪ Do you perceive the reports helpful or how would you
eventually improve them? In case you notice unfamiliar
figures/values in the reports, what do you usually do?
▪ How satisfied are you with your current information
systems as the main information sharing method? Any plan
of changing or improving?
INFORMATION QUALITY & ACCURACY
▪ Generally, which information do you use most while doing
your task (e.g. report, discuss in person/email)? Do you
create your own report/database to store important data for
your job activities?
▪ What are the key factors which influence the existence,
relevance and reliability of your KPI? (e.g. machine
deviations, lack of trace ability etc.)
▪ Is there any chance of mistakes in the created/retrieved
data?
FREQUENCY OF INTERACTION & DATA SHARING
▪ How does your information systems collaborate with the
information systems of the financial department?
▪ On which basis (e.g. weekly, monthly, randomly) do you
usually interact with the financial department?
▪ Based on your own experience at the company, have you
ever been any special situations that change the frequency
of interaction? And if so, how did you perceive the change?
▪ What specifications/information do you exchange during a
usual “alignment” meeting with the financial department?
▪ Where do you usually set up the meeting(s) with the
financial department? (e.g. physical place, via phone,
emails, Skype calls)
▪ Generally, how long does it take the process of
communication with the financial department? (meant as
from the first attempt of contact till getting (if get) a reply)
▪ In your opinion, is it useful for your work output(s) to
interact and collaborate with the financial department?
PLANNING QUALITY
▪ For your KPI, to what extent are forecasting and planning
related with each other?
▪ What are the benefits of CPFR brought to the improvement
of forecast accuracy? (explain CPFR if necessary)
▪ What are the benefits of S&OP brought to the improvement
of forecast accuracy? (explain S&OP if necessary)
▪ Based on your own experience, would you perceive an
enhancement in the collaboration with financial department
as beneficial for your work? If so, what would you like to
improve or eventually change? (e.g. create a page for direct
interaction, a dedicated report, platform etc.)
DETERMINING FACTORS
▪ To what extent has SCV, globalisation, seasonality and fast-
moving data influence on the forecast accuracy?
▪ If we talk about data collection and sharing, are you
behaving in a proactive or in a reactive attitude?
▪ For making the right adjustments and decisions, do you
think you have the capabilities and competences to perform
a reliable forecast? (skills, experiences, personalities)
▪ Based on your opinion, what are the main internal or
external influencing factors (economic outlook, market etc.)
that may influence the forecasting activities? (only your
own KPI)
CURRENT STATUS & MISMATCH KPI
▪ The financial department forecast your KPI on the value of
xxx (refer to values of section 3). To what extent is the
forecast achievable? And why is it (not) achievable?
▪ Are you aware of the negative effects of your KPI
mismatch? And how are you aware of this mismatch?
▪ Do you realise that your KPI influence the overall supply
chain performance? (investments, cash, budget, CSR etc.)
▪ Is your performance in line with the company’s strategy?
(explain that the brand is an innovative leader in the
premium ice cream industry and is committed to providing
all natural, high quality ice cream with respect to
environmental and social responsibility
CONCLUSION
▪ Do you have any question/ clarifications/ additional
information to add?

19


![[Add the document's title here]€¦ · Web viewAverage passenger trip length (PTL) Forecast accuracy. The forecast accuracy section evaluates system totals, that is, the total](https://img.pdfslide.us/doc/110x75/5e8c4b9686ff7a281003ee3a/add-the-documents-title-here-web-view-average-passenger-trip-length-ptl-forecast.jpg)