Embed Size (px)
Citation preview
A STUDY ON THE IMPACT OF THE BALANCED
SCORECARD AS A PERFORMANCE MANAGEMENT
SYSTEM ON PERFORMANCE AND MOTIVATION IN THE
RETAIL INDUSTRY
Nolan R. Shadrach
BADMIN (Hons), MA
9505773
Thesis is submitted in fulfilment of the requirements for the degree Doctor of Philosophy in
Industrial Psychology in the School of Applied Human Sciences,
University of KwaZulu-Natal, Durban, South Africa
School of Applied Human Sciences
Supervisor: Professor. J.H. Buitendach
February 2017
i
DECLARATION
I, NOLAN RODERICK SHADRACH declare that:
1. The research reported in this thesis, except where otherwise indicated, is my original
research.
2. This thesis has not been submitted for any degree or examination at any other
university.
3. This thesis does not contain other persons’ data, pictures, graphs or other information,
unless specifically acknowledged as being sourced from other persons.
4. This thesis does not contain other persons’ writing, unless specifically acknowledged
as being sourced from other researchers. Where other written sources have been quoted
then:
a. Their words have been re-written but the general information attributed to them has
been referenced.
b. Where their exact words have been used, then their writing has been placed inside
quotation marks, and referenced.
5. This thesis does not contain text, graphics or tables copied and pasted from the Internet,
unless specifically acknowledged, and the source being detailed in the thesis and in the
references sections.
Signed Date
February 2017
_______________________________ _______________
ii
REMARKS
The reader is reminded of the following:
The referencing, as well as the editorial style, as prescribed by the Publication Manual
(6th edition) of the American Psychology Association (APA), was followed in this
thesis.
This practice is in line with the policy of the programme in industrial psychology of the
University of KwaZulu-Natal (Howard College Campus) to use APA style in all
scientific documents.
The support and assistance of my employer towards this research is hereby
acknowledged.
Opinions expressed and conclusions arrived at, are those of the author and are not
necessarily to be attributed to the employer.

iii
SPECIAL DEDICATION
This doctoral thesis is dedicated in loving memory of my late dad, Brian Shadrach (1954 –
2016) – “To the world you were a Father, but to me you were the World”
You made all this possible, and I miss you so much.
iv
ACKNOWLEDGMENTS
Firstly, I would like to express my gratitude to my supervisor, Professor Johanna Hendrina
Buitendach, whose guidance, understanding, and patience added tremendous value to my
doctorial experience. You have persevered with me through difficult times, and refused to let
me quit. You are truly an academic giant of note. Thank you so much.
I would also like to thank Dr Kwaku Oppong Asante for providing me with guidance and
direction on my doctorial structure, and for been my external reader. You have taught me so
much. A very special thank you to Dr Herbert Kanengoni for his diligent assistance with my
statistical analysis. You never said NO, regardless of how busy your schedule was. To Dr James
Ramakau, you are a great friend and colleague, and finally to Jennifer Croll for her expertise
in language editing.
A very special thanks goes out to Mr Taahir Vajeth and Professor Sanjana Brijball from the
UKZN, Westville Campus, whose encouragement and guidance ensured that I considered a
graduate career in Industrial Psychology. I doubt I will ever be able to convey my full
appreciation to both of you. To Professor Basil and Cecilia Pillay, you have always been my
inspiration and mentors. I will cherish your support always.
To my employer, thank you for granting me the opportunity and time to conduct this research.
This is truly a great company, with great people.
To my siblings Namalda and Sheldon, and my little angel Kata, you guys always encouraged
and supported me. You the best…
A sincere appreciation to my extended family for your words of encouragement during my
academic and career growth. It is so true, ‘it take a whole village to raise a child’.

v
To my mum, you are truly the greatest inspiration for me. You the strongest person I know,
and without your sacrifices and commitment, none of this would be possible. You taught me
the importance of not accepting mediocre, and to always strive for greatest. Words cannot
adequate thank you for what you have done for us.
To my beautiful, brilliant, loving wife, you have brought so much joy to my life. I am eternally
thankful for everything you have done to encourage and support me. Your exuberance and
kind-heartedness are unparalleled. They say some people are worth the wait, and that truly
applies to you. You are my rock, my best friend, my love and my everything.
Finally, to my beautiful son, Nicholas Eli Shadrach. Words cannot described how I felt when
I first held you in my arms. Everything I have, and everything I am is forever yours. You are
the love of my life, and the air that I breathe…
vi
TABLE OF CONTENTS
CONTENT PAGE No.
DECLARATION i
REMARKS ii
SPECIAL DEDICATION iii
ACKNOWLEDGMENTS iv
TABLE OF CONTENT vi
APPENDICES xiii
LIST OF TABLES xiv
LIST OF FIGURES xiv
ABSTRACT xv
CHAPTER 1 1
1.1 Introduction 1
1.2 Background to Study 2
1.3 Rationale for the Study 8
1.4 Problem Statement 9
1.5 Aim and Objectives of the Study 10
1.6 Research Questions 11
1.7 Research Methodology 11
1.7.1 Literature Review 11
1.7.2 Empirical Study 12
1.8 Ethical Considerations 14
1.9 Structure of Thesis 14

vii
CHAPTER 2: 16
2.1 Introduction 16
2.2 Definition of the Balanced Scorecard 17
2.3 Conceptualisation of the Balanced Scorecard 19
2.4 Evolution of the Balanced Scorecard 21
2.5 The Four Perspectives of the Balanced Scorecard 23
2.5.1 Financial Perspective 24
2.5.2 Customer Perspective 25
2.5.3 Internal Business Processes 26
2.5.4 Learning and Growth 27
2.6 Interrelations between the Four Perspectives of the Balanced Scorecard 28
2.7 Balanced Scorecard and other similar Performance Management Systems 29
2.8 Balanced Scorecard and Performance Management 30
2.9 Balanced Scorecard and Strategic Management 32
2.10 Consequences of the Balanced Scorecard 33
2.10.1 Improve Organisational Strategic Performance 34
2.10.2 Balanced Scorecard and Creating Corporate Identity 37
2.10.3 Balanced Scorecard and Compensation 38
2.10.4 Balanced Scorecard and Positive Psychology 38
2.10.5 Balanced Scorecard in Non-Profit Organisations 39
2.10.6 Balanced Scorecard and Motivation 40
2.11 Criticism of the Balanced Scorecard 41
2.11.1 Top-down approach 42
viii
2.11.2 Lack of Communication and Implementation Issues 43
2.11.3 Assumed Interrelationships between the Four Perspectives 43
2.12 Chapter Summary 43
CHAPTER 3: 46
3.1 Introduction 46
3.2 Conceptualisation of Performance 46
3.3 What is performance Management? 49
3.4 Conceptualisation of Performance Management 50
3.5 Performance Measurement 53
3.6 Performance Management Models 54
3.6.1 The Balanced Scorecard 56
3.6.2 Activity-based Costs 57
3.6.3 Economic Value Added 59
3.7 Benefits of Performance Management 60
3.8 Consequences of Performance Management 61
3.8.1 Performance Management and Effective Organisational Performance 61
3.8.2 Performance Management and Effective Employee Engagement 62
3.8.3 Performance Management and Motivation 64
3.8.3.1 Motivation and Non-Monetary Incentives 66
3.8.4 Performance Management and Rewards 66
3.8.4.1 Intrinsic Rewards 67
3.8.4.2 Financial Rewards 67
ix
3.8.5 Performance Management and Organisational Culture 67
3.8.6 Performance Management and Diversity 68
3.9 Chapter Summary 69
CHAPTER 4: 72
4.1 Introduction 72
4.2 Conceptualisation of Motivation 75
4.3 Work Motivation 76
4.4. Importance of Motivation 78
4.5 Intrinsic and Extrinsic Motivation 79
4.5.1 Intrinsic Motivation 80
4.5.1.1 Goal Difficulty 80
4.5.2 Extrinsic Motivation 81
4.5.3 Effect of Extrinsic Motivation on Intrinsic Motivation 81
4.6 Theories of Motivation 83
4.6.1 Needs and Motive Theories 83
4.6.2 Expectancy Theory 84
4.6.3 Goal Setting Theory 85
4.6.4 Self-Efficiency Theory 86
4.6.5 Job Characteristic Model 87
4.6.6 Action Regulation Theory and Task Specific Motivation 88
4.6.7 Self-Determination Theory 88
4.7 Consequences of Motivation 91
4.7.1 Motivation and Performance 91
4.7.2 Motivation and Career Success 93
4.7.3 Motivation and Satisfaction 94
4.7.4 Motivation and Values 95
4.7.5 Motivation and Personality 96
4.7.6 Motivation and Different Cultures 97
4.8 Chapter Summary 98
x
CHAPTER FIVE 100
5.1 Introduction 100
5.1.2 Research Setting 100
5.2 Research Design 100
5.2.1 Sequential Explanatory Mixed Methods 101
5.3 Phase 1: Quantitative Study 102
5.3.1 Sampling and Study Participants 102
5.3.2 Research Instruments 104
5.3.2.1 Work Extrinsic and Intrinsic Motivation Scale (WEIMS) 104
5.3.3 Procedure 106
5.3.4 Ethical Aspects 106
5.3.5 Research Data Collection 107
5.3.6 Data Collection 108
5.3.7 Quantitative Data Analysis 110
5.3.8 Statistical Analysis Process 111
5.4 Phase 2: Qualitative study 111
5.4.1 Sampling and Study Participants 112
5.4.2 Qualitative Interview Schedule 113
5.4.3 Data Collection 114
5.4.4 Qualitative Data Analysis 114
5.5 Chapter Summary 115
xi
CHAPTER SIX 116
6.1 Introduction 116
6.2 Quantitative results 116
6.2.1 The Impact of Learning and Development (as measured by the BSC)
on Sales 117
6.2.2 The Impact of Learning and Development (as measured by the BSC)
on Inventory Loss 118
6.2.3 The Impact of the Learning and Development (as measured by the BSC)
on Manageable Expenses 119
6.2.4 The Impact of the Learning and Development (as measured by the BSC)
on Stock Integrity 120
6.2.5 The Impact of the Learning and Development (as measured by the BSC)
on Customer Service 121
6.1.1 The BSC as a Performance System in Improving overall Organisational
Performance 123
6.4. The BSC Effectiveness in Creating Intrinsic Motivation 124
6.4.1 Predicting Motivation from Year-End BSC 124
6.4.2 Predicting Employee Performance from BSC and Motivation 124
6.4.3 Predicting Organisational Performance from BCS and Motivation 125
6.5 Qualitative Results 125
6.5.1 Theme 1: Management Support 127
6.5.2 Theme 2: Communication 130
6.5.3 Theme 3: Strategic Alignment to Organisational and Employee Goals 133
xii
6.5.4 Theme 4: Influence on Management Practices, Processes and Systems 136
6.5.5 Theme 5: Impact on Work Motivation 139
6.6 Chapter Summary 142
CHAPTER SEVEN 143
7.1 Introduction 143
7.2 Balanced scorecard (BSC) and Employee Performance 143
7.2.1 Sales 144
7.2.2 Inventory Loss 145
7.2.3 Manageable Expenses 146
7.2.4 Stock Integrity 147
7.2.5 Customer Service 148
7.3 The BSC and Organisational Performance 153
7.3.1 Gross Profit Margins 153
7.3.2 Credit and Sales 153
7.4 The BSC and Intrinsic Motivation 157
7.5 Chapter Summary 158
CHAPTER EIGHT 159
8.1 Introduction 159
8.2 Recommendation to the Organisation 159
8.2.1 Align the BSC to the Organisational Strategy 160
xiii
8.2.2 Ensure Top and Senior Management Support 162
8.2.3 Formulate a Comprehensive BSC Communication Plan 163
8.2.4 Ensure a Quick and Efficient Relationship between the
Financial and Non-Financial Perspectives 164
8.3 Recommendations for Future Research 165
8.4 Contribution of the Study to Organisational Practice 165
8.5 Contributions to Academic Knowledge 166
8.6 Limitations of the Study 167
8.7 Philosophy towards the Study 167
8.7 Conclusion 168
REFERENCES 170
APPENDICES 194
Appendix A: Ethical Clearance to Conduct the Study 194
Appendix B: Consent Form to Participants 195
Appendix C: Introduction Letter to Participants describing the Purpose
of the Research Study 196
Appendix D: Biographical Details of Participates 197
Appendix E: Quantitative instrument - The Work Extrinsic and
Intrinsic Motivation Scale 198
Appendix F: Qualitative Instrument - Interview Schedule 200
Appendix G: Confirmation of Language Editing 204
xiv
LIST OF TABLES
Table 1: Summary of the most well-known Theories of Motivation 83
Table 2: Characteristics of Quantitative Study Participants 103
Table 3: Characteristics of Qualitative Study Participants 113
Table 4: ANOVA of Sales, Inventory Loss, Stock Integrity, Manageable
Expenses and Customer Service on BSC scores 117
Table 5: Regression Analysis 125
Table 6: Major Themes and their Sub-Themes that emerged from the
Semi-Structured Interviews. 127
LIST OF FIGURES
Figure 1: Mean Plots of Sales per Quarter 118
Figure 2: Mean plots of Inventory Loss per Quarter 119
Figure 3: Mean plots of Manageable Expenses per Quarter 120
Figure 4: Mean plots of Stock Integrity per Quarter 121
Figure 5: Mean plots of Customer Service per Quarter 122
Figure 6: Mean plots of Organisational Performance Scores per Quarter 123
xv
ABSTRACT
Background:
The retail industry is constantly changing due to changing customer expectations and profiles,
as well as changes in the economy, technology, new products and innovation. These changes
have created a need for new systems and strategies to better integrate and comprehend business
processes in the retail industry. As such, the success of many organisations are mainly
dependent upon performance which in turn, is dependent on strategy. The aim of this study is
to examine the impact of the balanced scorecard (BSC) as a performance management tool in
the retail industry, as well as its role on the motivation of employees.
Method:
An explanatory mixed method approach was used, where a quantitative study was conducted
to investigate the effect of the BSC as a performance management system, and its effect on
motivation. The participants consisted of 64 store managers in the retail industry, and a
sequential explanatory design was used in the study. A one-way ANOVA and standard multiple
regression models were used to analyse the quantitative data. This was followed by a qualitative
approach that examined managers’ perceptions on the implementation of the BSC, and its
effect on their operating business and motivation. For the qualitative study a non-probability
convenience sample of 10 store managers were interviewed using a semi-structured interview
schedule. A thematic analysis process was used to analyse the qualitative data.
Findings:
The quantitative results indicated that the BSC has a significant impact on employee
performance, but not on organisational performance. The BSC impact on employee
performance led to an increase in the store managers Sales and Customer Services, and a
decrease in their Inventory Loss and Manageable Expenses. The BSC impact on Stock Integrity
was inconstant. Two possible reasons were postulated from the qualitative analysis as to why
the BSC did not have an effect on organisational goals. These included the possibility of a lack
xvi
of strategic alignment between the BSC and the organisations, as well as the possibility that
other KPI’s, that may have had a more profound effect on organisational performance, were
not include in the BSC financial and non-financial KPI measures. Finally, the quantitative
results indicated that the BSC did not have an impact on motivation. However, the qualitative
findings showed that some store managers were highly motivated by the BSC. Furthermore,
the qualitative finding indicated that some of the interview participants felt that they had good
support from management and that the BSC communication plan was adequate. This, in turn,
enabled them to improve their business practices, processes and systems. However, an
important finding from the qualitative analysis was that the BSC and employee performance
goals were not aligned to the organisational performance goals.
Conclusions:
These finding seems to suggest that the BSC, as a performance management system, can be an
effective tool in improving the performance of employees. However, the organisation needs to
ensure that the BSC KPI’s are aligned, firstly to the employee performance goals, and secondly
to the organisation’s performance goals. This strategic alignment will ensure that any increase
in employee performance, will result in an increase in the organisations performance. While
the quantitative results indicated that the BSC had no impact on motivation, the qualitative
finding indicated that some managers experienced high levels of motivation. These managers
highlighted the proper implementation of the BSC into their business as possible reasons for
the increase in their motivation levels.
1
CHAPTER 1
1.1 INTRODUCTION
The retail world is constantly changing. Changes in the economy, technology, customer
profiles, new products and innovation have necessitated the development of new tools and
strategies to better comprehend business processes in the retail industry (Dumitrescu & Fuciu,
2009). According to Dumitrescu and Fuciu (2009), the Balanced Scorecard (BSC) is one such
tool that has been developed to help managers do this.
Kaplan and Norton (1992) first conceived and proposed the BSC during their research with
Senior Executives of 12 corporate companies. Kaplan and Norton (1992) found that these
executives wanted an equal representation of both operational and financial measures. As a
result of their study, these authors devised a ‘BSC’ which comprised four measures that gave
senior and top executives a quick but extensive view of their business. The results of their
studies were published in three articles Kaplan and Norton (1992); Kaplan and Norton (1993)
and Kaplan and Norton (1996a) and followed by a book Kaplan and Norton (1996b).
According to Kaplan and Norton (1992, p.72) “the balance scorecard allows managers to look
at their business from four important perspectives” i.e. the financial perspective, customer
perspective, internal business perspective and innovation and learning perspective. In addition
to giving managers information from the four perspectives, “the balanced scorecard minimises
information overload by limiting the number of measurements used, hence forcing managers
to focus on the measures that are most critical” (Kaplan & Norton, 1992, p.72).
Dumitrescu and Fuciu (2009, p.38) suggested that the BSC is a “framework, or what can be
best characterised as a strategic management system that claims to incorporate all quantitative
and abstract measures of true importance to the organisation”. Jackson and Qu (2008, p.110)
described the BSC as a “management tool that presents managers with a comprehensive view
of how the organisation is performing in relation to the organisation's strategic objectives”.
2
Their study suggested that the BSC scorecard goes further than just been an evaluation exercise,
but can be seen as a management system that can motivate breakthrough improvements in
essential areas such as customer, product, market development and processes (Jackson & Qu,
2008).
Bach, Calais and Calais (2001) suggested that the BSC incorporates the concerns of important
stakeholders such as owners, employees, and customers. According to Bach et al. (2001,
p.211), the term balance “reflects the attempt to capture both financial and non-financial
measurements with emphasis on lagging and leading indicators, long-term strategic objectives
and short-term actions, external and internal performance perspectives, as well as quantitative-
objective and qualitative-subjective measures”.
Continued research and innovations over the last few years, has resulted in the BSC going
through an evolutionary process of improvement (Johnson, Beiman & Collaborative, 2007).
The balanced scorecard has evolved from performance measurement between the years 1990
to 1996, to performance management in 1996 to 2000, to eventually becoming a world-wide
recognised best practice for strategic management currently.
The Executive Committee at Retek (the real name of the organisation has been changed)
decided to implement a BSC in the organisation to address key strategic talent objectives for
the organisations. These talent objectives were aimed at using the BSC to identify top
performers based on key performance indicators (KPI’s) in order to fast track them into more
senior roles. No consideration was given to using the BSC as a performance management
system.
1.2 BACKGROUND TO STUDY
Kaplan and Norton (1992, p.71) initially defined the BSC as a “set of measures that give top
managers a fast but comprehensive view of business.” Kaplan and Norton (1992, p.71) further
stated that “the BSC includes financial measures that tells the results of actions already taken,

3
and complements the financial measures with operational measures on customer service,
internal processes, and the organisation’s innovation and improvement activities”. According
to Kaplan and Norton (1996a), the BSC enables managers to regulate key performance areas
based on a cause and effect logic.
According to Chu, Wang and Dai (2009, p.403), the BSC “translates an organisation’s mission
and strategy into a set of performance measures that provide the framework for implementing
the strategy”. Thus, according to Chu et al. (2009, p.403), the BSC “goes beyond the narrow
focus of financial objectives to highlight the non-financial objectives that an organisation must
achieve to meet various goals, financial and otherwise”. Dumitrescu and Fuciu (2009)
suggested that firstly, the BSC’s overall aim is to give the organisation a clear indication of
what it should be measuring, and secondly on what it should be focusing on to make sure that
there is continuous improvement in strategic organisational performance. According to
Dumitrescu and Fuciu (2009, p.38), “unlike other performance measures approaches, which
rely on financial performance, the balanced scorecard assesses and communicates
organisational performance in both financial and non-financial terms, and uses these results to
address both long and short term organisational objectives; hence, it presents a balance
scorecard of the organisation”.
According to Kaplan and Norton (1992, p.72), “the balance scorecard allows managers to look
at the business from four important perspectives”. The first is the financial perspectives, which
pertains to how the business looks to shareholders; the second is customer satisfaction which
indicates how customers see the business; the third refers to what the business must do to excel
from an internal perspective; and finally the last perspective is learning and growth which refers
to how can the business continue to improve and create value (Kaplan & Norton, 1992).
Kaplan and Norton (1996a, p.65) suggested that the “cause and effect relationship can be
expressed by a sequence of if-then statement, and then the chain of cause and effect should
pervade all four perspectives of a balanced scorecard”. Studies conducted by researchers have
found a significant correlation between the four perspectives of business (Fletcher & Smith,
2004 and Chiang & Lin, 2009). For example, Chiang and Lin (2009) found that the four
4
perspective of the BSC were valid and interrelated in their study. According to Chiang and Lin
(2009, p.1169) “the learning and growth perspective was significantly related to the internal
business process perspective, which in turn was positively related to the customer perspective”.
The use of the balance scorecard in business has not seemed to diminish in recent years.
According to Johnson et al. (2007, p.17), the “BSC is used by more than 70% of the Fortune
500 companies”. In addition, companies such as Mobil, UPS (United Parcel Service), Wells
Fargo Bank and Chemical Bank have all shown the effectiveness of the BSC in their businesses
(Johnson et al., 2007). According to Cameron (2002, p.30), the “Gartner Group Inc. predicted
by the year 2000, at least 40% of the fortune 1000 companies would implement the balanced
scorecard”. The most pivotal facet of the BSC is that it permits companies to align long-term
strategies with short-term actions (Cameron, 2002).
The BSC has also been successful among major retailers such as Sears and Tesco. The success
of the balance scorecard in these retail organisations is highly significant as the general aim of
this research is to determine the impact of the balanced scorecard as a performance
management system on employee performance, and ultimately organisational performance, in
the retail industry of South Africa. The organisation that is the subject of this research is the
largest retailer in South Africa, with close to 1200 store managers. This retail organisation
intends to use the BSC to manage store manager performance within one of its major retail
chains. The employees’ individual key performance indicators are linked to the organisations
strategic objectives that form the BSC.
Increased competition among organisations globally has compelled firms to utilise various
types of performance measurement tools to improve the quality of their products and services
(Mooraj, Oyon & Hostettler, 1999). According to Mooraj et al. (1999), the process of
performance measurement can highlight performance fluctuations and provide a sense of
direction for performance improvement.
5
The BSC has been described as the most widely applied performance management system
implemented today (Johnson et al., 2007). A reason for this is that the BSC is unlike other
performance management systems, in that it measures performance across financial and non-
financial perspectives. According to Johnson et al. (2007, p.3), the “BSC captures both leading
and lagging performance measures, thereby providing a more “balanced” view of company
performance”. Johnson et al. (2007, p.3) further suggested that “the BSC performance
management system have been widely adopted globally, in part, because this approach enables
organisations to align all levels of staff around a single strategy so that it can be executed more
successfully.
In this study, the BSC is used as a performance management system with the objective of
determining whether the BSC as a performance management system would lead to an increase
in employee and organisation performance, as well as an increase in employee motivation. The
relationship between the BSC and performance management is discussed below.
According to Cederblom and Pemerl (2002, p.132), “performance management refers to an
umbrella of all organisational components and activities affecting individual, work group, and
agency performance”. Cederblom and Pemerl (2002) suggested that performance appraisals
would form part of a performance management system, together with other factors such as
manager accountability, pay, strategic plans, training/development, discipline and promotion.
Such system would co-ordinate these factors effectively to improve organisational performance
(Cederblom & Pemerl, 2002). Performance management can lead to important benefits for
organisations. For example, according to Cochran, Campinas, Lobo and Lima (2001, p.64), a
“well-designed performance management process stimulates managers to develop high-quality
strategic plans, set ambitious targets, and track performance closely - all activities which help
to achieve strategic objectives and consequently, sustained value creation”.
.
The BSC contribution to organisational performance was first documented by Kaplan and
Norton (1996a and 2001), based on their own case studies. According to Shieh (2008), there is
no one definition for organisational performance. Shieh (2008, p.829) suggested that
organisational performance is “understood as the concentrated reflection of achievements of
6
each organisational function, and reflects the realisation of organisational objectives”. Chien
(2004) suggested that there are certain dimensions included in organisational performance.
According to Chien (2004, p.290), the “five factors effecting organisational performance are
model of motive, leadership styles, organisational culture and environment, job design and
human resource policy”.
Kaplan and Norton (1996a, p.76) described how the BSC “let’s managers communicate their
strategy up and down the organisation and link it to departmental and individual objectives”.
According to Kaplan and Norton (2001, p.77), the BSC firstly “describes the vision of the
future of the entire organisation”. Secondly, according to these authors, the BSC creates a
shared understanding which permits employees to view how they can contribute to the
organisations success. Finally, these authors suggested that the BSC focuses change efforts and
organised learning at the executive levels.
Research by De Geuser, Mooraj and Oyon (2009) showed that the use of the BSC had a positive
impact on organisational performance. De Geuser et al. (2009, p.93) found that the balanced
scorecard “improves the integration of management processes and empowers people”. These
authors also found empirical evidence that the balanced scorecard adds value to companies and
organisational performance comes mainly from three perspectives, namely the BSC’s role in
the translation of the strategy; its capacity to influence the managerial practices on a continuous
basis; and its role in aligning resources to strategic objectives.
In addition to the impact of the BSC on performance management, this study also explores the
relationship between the BSC and performance management on motivation. The researcher
investigates whether the use of the BSC as a performance management system leads to an
increase in employee motivation. The relationship between the BSC and performance
management on motivation is discussed below.
According to Robbins (1993), motivation refers to the “willingness to exert high levels of effort
towards organisational goals, conditioned by the efforts and ability to satisfy some individual
7
need”. A need in this context refers to “an internal state that makes certain outcomes appear
unattractive while an unsatisfied need creates tension that stimulates drives within the
individual” (Robbins, 1993). These drives, according to Robbins (1993), then “generate a
search behaviour to find particular goals that if attained, will satisfy the need and reduce the
tension”.
While studies have provided an exceptionally vast and rich array of motivational theories, there
is much room for improvement in how applied performance management takes advantage of
motivation theories (Buchner, 2007). According to Buchner (2007), there are many streams of
motivation theories to consider with regard to performance management such as the Justice
Theory by Latham, Almost, Mann and Moore (2005), the Self-Determination Theory by Ryan
and Deci (2000) and even older theories such as Vroom’s (1964) Expectancy Theory.
Kaplan and Norton (1996) initially introduced the BSC for motivating and measuring
performance. Research conducted by Malina and Selto (2001) and Decoene and Bruggeman
(2006) indicates that motivation plays a significant role in a BSC setting. For example, Malina
and Selto (2001, p.72) found that the BSC led to “effective motivation, strategic alignment and
then positive outcomes.” In their study, Decoene and Bruggeman (2006, p.429) found that a
“combination of strategic alignment and balanced scorecard-based compensation plans had a
positive effect on the extrinsic motivation of manufacturing executives”.
This research attempts to fill this void by determining the extent to which using the BSC as a
performance management system increases an employee’s performance and ultimately
organisational performance. By performance managing employees in an organisation where
the BSC has already being cascaded down to all employees, and in an industry where the
balanced scorecard has proven to be successful, the researcher can determine the true impact
of the BSC as a performance management system.
8
1.3 RATIONALE FOR THE STUDY
In South Africa, there appears to be a gap in research in the study of the BSC. For example, in
Naves (2002)’s study examining the impact of human resource practices on organisational
performance, Naves (2002) found that the balance scorecard effectively demonstrated how to
link Human Resource results to measures such as profitability and shareholder values, that line
managers and senior executives will understand, embrace and respect. In a comparative study
between South African and Australian universities, Vermaak and Cronje (2004, p.490) found
that the Head of the Departments investigated in the study “were reasonable positive about the
benefits of the balanced scorecard”. According to Vermaak and Cronje (2004, p.490), “South
African universities rated the ‘customer’ component as more important, while the Australian
universities placed more emphasis on the ‘customer’ and ‘learning and growth’ perspective”.
With regard to performance management, Rademan and Vos (2001) suggested that “South
African organisations in particular often fail to follow best practice in performance
management and are still struggling to implement performance management effectively”.
Kock, Roodth and Veldsman (2002, p.90) similarly suggested the people management policies
and practices of organisations in South Africa were “misaligned with the dynamic growth
strategy and thus unable to sufficiently unleash the contribution of people to business success”.
This study also contributes to the field of Industrial Psychology by examining the effect of the
BSC on performance and motivation. With regard to performance management, there are
currently numerous performance management systems currently in use in various organisations
and industries throughout the world. From a traditional perspective there is the ABC model of
behaviour change (Ayers, 1995) and the Systems Analysis Theory (Skidmore, 1994). Current
performance management systems widely used in many industries today also include the
Tableau de Bord, the Performance Prism (Neely and Adams, 2000), Performance Pyramid
System (Lynch and Cross, 1991), and the Economic Value Added (Stern Steward
Cooperation).
However, for the purpose of this study, the BSC was chosen as a preferred performance
management system due to the fact that it provides a ‘balanced’ view of organisations’ financial
and non-financial measures. By focusing on non-financial measures, the BSC pays attention
9
to the requirements of customers and business processes, and more especially to the ultimate
sustainability of the organisation; all of which significantly impacts on business profitability.
In addition, the BSC has the ability to effectively translate the strategy objectives of an
organisation into financial and non-financial measurements to improve performance (De
Geuser et al., 2009). The BSC capacity to influence managerial practices on a continuous basis
and the role it plays in aligning resources to strategic objectives, supported by De Geuser et al.
(2009), was also a major contributing factor.
There are currently very few studies, notably Malina and Selto (2001) and Decoene and
Bruggeman (2006) that examine the relationship between the BSC, performance and
motivation. It is important to determine how implementation of the BSC has impacted the
motivational levels of managers, as this motivation will impact their performance levels. While
there are currently numerous theories of motivation that have validity, the researcher has
chosen the self-determination theory of motivation as the most applicable to this study. The
reason for this is that the self-determination theory argues that different types of motivators,
even if the motivation is high, will lead to different types of outcomes (Williams, Saizow, &
Ryan (1999). According to Williams et al. (1999, p.993), the self-determination theory
differentiated between two types of motivation, namely, “controlled motivation - which
depends on either explicit or implicit rewards or punishment or on peoples’ internalised beliefs
about what is expected from them, and autonomous motivation which involves compliance
with pressures”. Prior studies, as highlighted previously, have shown that the BSC and
Motivation significantly impact Performance, while some studies have shown minimal
significance. This study adds to the growing research on BSC, performance and motivation,
especially within a South African context, by either supporting or refuting those studies.
1.4 PROBLEM STATEMENT
Managing an employee’s performance is important for organisations. Poor performance may
not only impact on the performance of the organisation, but it could also lead to the dismissal
of the employee. In terms of the Labour Relations Act (1995), poor performance in the form
of incapacity, may lead to an employee being dismissed. Therefore, performance management
has become critical to the sustainability of many organisations.
10
Performance management can lead to important benefits for organisations. Managing and
developing key talent in the face of internal and global competition has resulted in many
organisations re-evaluating their talent management strategy. Studies also indicate that
performance management may have a positive effect on motivation. Rabey (2001, p.27)
suggested that “motivation impacts on the organisation by influencing performance, reducing
absenteeism and turnover, influences commitment to the organisation, job satisfaction, and
attracts people to the organisation”.
While there are several performance management models available, the “balanced scorecard
(BSC) is described as the most widely applied performance management system” implemented
today (Johnson et al., 2007, p.2). The BSC has been seen to add tremendous value to
organisations. For example, De Geuser et al. (2009) found that the BSC improved the
integration of the management processes and empowered people, while Ling Sim and Chye
Koh (2001, p.25) suggested that the BSC can be used as a “tool for monitoring the long-term
value creation process”. This study examines the effect of the BSC as a performance
management system on store manager performance in the retail industry, and also examines its
impact on store manager motivation.
1.5 AIM AND OBJECTIVES OF THE STUDY
In this study, the general aim is to determine the effect of the BSC as a performance
management system on performance and motivation in the retail industry. In order to address
the broad aim of the study, the specific objectives of the study were to:
To examine the extent to which the BSC as a performance tool may lead to an
improvement in employee performance
To examine the extent to which the BSC as a performance tool may lead to an
improvement in organisational performance
11
To investigate whether the BSC is effective in creating intrinsic motivation based on
the self-determination theory
1.6 RESEARCH QUESTIONS
In lieu of the objectives, the study strove to provide answers to the following research questions
which are presented below adding to the various phases of the study:
Phase 1: Quantitative Research Questions
Is there a relationship between the BSC and employee performance?
Does an increase in employee performance lead to an increase in organisational
performance?
Does the use of the BSC as a performance management system lead to an increase in
intrinsic motivation based on the self-determination theory?
Phase 2: Qualitative Research Questions
How did the implementation of the BSC impact on employee performance?
Does the BSC have an effect on employee motivation?
1.7 RESEARCH METHODOLOGY
The research method consists of a literature review and empirical study.
1.7.1 Literature Review
The literature review focuses on existing research related to the BSC, performance
management and motivation. Applicable articles published between 1920 and 2016 were
identified through consulting the various sources: Textbooks, subject journals, EBSCOHOST,
JSTOR, Sabinet online, Emerald, SA ePublications, and Google Scholar. The following search

12
terms were used (individually, or in combination): the balanced scorecard, performance,
performance management, performance management systems, motivation, theories of
motivation, intrinsic motivation, and self-determination theory. Other crucial sources of
information was identified by cross-referencing information when a specific article mentioned
a reliable source.
1.7.2 Empirical Study
The empirical study consists of research, participants, research instruments, procedure and
statistical analysis.
Research Design
The study attempts to adequately address the research questions by using a quasi-experimental
time series design. The researcher aims to manipulate events by initiating various training,
learning and coaching programmes to assist employees in improving their individual key
performance indicators in the Balanced Scorecard over three month periods. The rationale for
using this design is that a quasi-experimental design allows the study to explore the problem
precluding the use of procedures required by a true experimental design.
For the purpose of this study, the researcher used a sequential explanatory design. The rationale
for choosing this design is as follows. Firstly, the researcher did not use an explicit theoretical
lens, hence the choice of a sequential explanatory design. An explicit theoretical lens “refers
to the philosophical basis, or paradigm that underlies a researcher’s study and subsequent
methodological choices” (Hanson et al., 2005, p.226). Secondly, the choice of how data is
collected and analysed also influences the choice of the mixed method design. The researcher
uses both quantitative and qualitative data, however there is a greater focus on the quantitative
data, with the qualitative data used to supplement the quantitative data. Finally, according to
these authors, the choice of the mixed method design also depended on the “point at which the
data analysis and integration occurred”.
13
Phase 1: Quantitative Study
Phase 1 focuses on answering the research questions pertaining to the impact of the BSC as a
performance management system and on employee motivation. The sequential explanatory
design is adopted in this research.
Sampling and study participants
A convenient sample of employees in a selected Retek Chain is used. According to Marshall
(1996, p.523), convenient sampling “involves the selection of the most accessible subjects and
is the least costly to the researcher, in terms of time, effort and money”. The sample in this
study consists of 64 Managers. The total population of Managers in the selected Retek Chain
is currently 430 employees. The participants’ includes all permanent employees that scored
below the Retek’s required key performance indicators.
Phase 2: Qualitative Study
The qualitative methodology followed in phase 2, will consist of conducting semi-structured
interviews, using an interview schedule. The semi-structured interview relates specifically to
the research questions, and consisted of questions pertaining to the impact of the BSC as a
performance management system and on employee motivation.
Sampling and study participants
The sample will only include 10 Store Managers as they are solely responsible for Store
Performance. Samples sizes for the interviews were chosen for each population/chain as per
Sekaran’s (2002) population to sample size tables. A non-probability sampling procedure will
be used for the qualitative study. For the purpose of this study, a convenience sampling was
used due to the fact that the participants were conveniently available, and will be cost effective
and less time consuming. The semi-structured interview questions address the five conditions
that Kaplan and Norton (2001) suggest must first be met for the BSC to be successful.
14
1.8 ETHICAL CONSIDERATIONS
The researcher complied with all the necessary steps to ensure that the participants in the study
were treated in a fair and ethical way. Participation in the study was voluntary, and no employee
was forced to participate. The researcher ensured that the rationale and objectives of the study
was discussed with all participating employees prior to the onset of the study. Employees were
given the opportunity to ask questions, make statements and discuss the project before
considering participation. Participants were given the opportunity to decline completing the
Work Extrinsic and Intrinsic Work Motivation Questionnaire at any time during the process.
Employees were also given the opportunity to decline the invitation to be interviewed.
Confidentiality was assured and maintained at all stages during the research process.
In addition, an application to the University of KwaZulu-Natal’s Social Sciences and
Humanities Ethics Committee was submitted and approved before continuing with this
research project (Ethical protocol number: HSS/0353/011D). Furthermore, permission was
sought and approval obtained from the organisation’s HR and Transformation Officer, Group
HR Executive, HR Operation Executive and Divisional Operations Manager.
1.9 STRUCTURE OF THESIS
The research study is divided into eight chapters briefly described below:
Chapter One outlines the background, rationale and general problem statement for
investigating the effect of the BSC on performance and motivation. The reason why this study
is important, as well as the research approach is also discussed.
Chapters Two to four includes a comprehensive summary of prior research related to the BSC,
performance management and motivation. The literature review forms a conceptual
background to the current study by highlighting the existing body of knowledge with regard to
the BSC, performance management and motivation.
Chapter Five provides a description of the research methodology in detail. Specifically, this
chapter discusses the mixed method research approach, research method, data collection
techniques, and the analysis of both qualitative and quantitative data.
15
Chapter Six outlines the research results obtained from the qualitative and quantitative data.
The study consists of two phases. In Phase 1, the BSC data and work extrinsic and intrinsic
motivation scale (WEIMS) is statistically analysed and compared to employee performance
and organisational performance. In Phase 2, semi-structured interviews were conducted on a
sample of the participants. The qualitative data was then analysed using a thematic approach.
The results are presented and reported on.
Chapter Seven involves a detailed discussion on the quantitative and qualitative results. The
results are analysed, explained and discussed in relation to the aims and research questions
posed by the study. Research conclusions are drawn and discussed.
In Chapter Eight conclusions are drawn from the study. The study is summarised with an
emphasis on the overall results obtained. The empirical finding from both the quantitative
analysis and qualitative are provided, with recommendations and implications to the
organisation discussed. Finally, the limitations of the study are discussed, as well as
suggestions for future related research
16
CHAPTER 2:
LITERATURE REVIEW: BALANCED SCORECARD
2.1 INTRODUCTION
In this chapter, a literature review is presented pertaining to the Balanced Scorecard (BSC).
Firstly, context is provided as to why the BSC is necessary in the business world, followed by
the definition, conceptualisation and evolution of the BSC. Secondly the four perspectives of
the BSC is discussed, followed by their inter-relatedness. Thirdly, the relationship between the
BSC and performance is discussed, including the relationship of the BSC compared to other
performance management systems. Finally, the chapter ends with a discussion on the
consequences and critique of the BSC.
The retail world is constantly changing as the changing expectations and shopping tastes of
consumers slowly alter the retail industry (Thau, 2015). Changes in the economy, technology,
customer profiles, new products and innovation have necessitated the development of new tools
and strategies to better comprehend business processes in the retail industry (Dumitrescu &
Fuciu, 2009). According to Sharma (2009, p.7), “the success of any organisation is largely
reflected upon performance which is, in turn, dependent on strategy”.
According to Dumitrescu and Fuciu (2009) and Sharma (2009), the balanced scorecard (BSC)
is one such instrument designed to help organisations do this. Dumitrescu and Fuciu (2009,
p.39) described the BSC as a “management system that can motivate breakthrough
improvements in such critical areas as product, process, customer, and market development”.
According to these authors, the BSC helps organisations act in their best long-term interests by
focusing not only on financial outcomes, but also on the operational, marketing and
developmental inputs by providing a holistic view of their businesses.
Sharma (2009, p.7) believed that organisations have to understand that “they need to give
impetus not only towards the financial results, but also towards satisfaction of the customers,
17
development of state-of the-art technologies and the creation of an environment of learning and
growth”. Therefore, Sharma (2009, p.7) suggested that the BSC could be thought of as “the
‘strategic chart of accounts’ for an organisation, where the long-term success of any
organisation is determined by the capabilities and the competencies it has developed”.
According to Johnson and Scholes (2002, p.436), the BSC addresses the “explicated challenges
of balancing qualitative vs. quantitative measures of performance, as well as those related to
stockholders vs. stakeholders by recognising four distinct perspectives of (business) success”.
These four perspectives, according to Kaplan and Norton (1992, p.73-77) “refer to:
1. Financial success - relates to the potential of the chosen strategy and the capability of
the organisation to generate the long-term shareholder value
2. Customer satisfaction – indicates how well does the organisation meets the customer
requirements and expectations
3. Internal Business Processes - assesses in terms of the business processes, which should
adequately serve customers’ requirements
4. Learning and Growth – refers to the organisational capabilities and the overall capital
which is associated with the development of human resources, as well as the strategic
capability of the organisation to innovate and adapt to the changing environment”.
According to Martinsons, Davison, and Tse (1999, p.73), “many companies are using the BSC
as the foundation for their strategic management system”. Martinsons et al. (1999, p.73)
suggested that some managers use the BSC to “align their businesses to new strategies, moving
away from cost reduction and towards growth opportunities based on more customised, value-
adding products and services”.
2.2 DEFINITION OF THE BALANCED SCORECARD
The Balanced Scorecard was first described by Kaplan and Norton (1992, p.72-73) as a key
performance indicator (KPI) system. According to these authors, the BSC was somewhat like
an “airplane cockpit enabling executives to manage their organisations more effectively”.
Using this analogy, where pilots use dials and indicators to get important information on the
18
plane, such as fuel speed and altitude, these authors similarly suggested that the “complexity
of managing an organisation requires that managers are able to view performance in several
areas simultaneously”.
According to Kaplan and Norton (1992, p.72), the BSC “provides answers to four important
questions:
1. How do customers see the organisation (customer perspective)
2. What the organisation must excel at (internal business processes)
3. How can the organisation continue to improve and develop (innovation and learning
perspective)
4. How does the organisation look to shareholders (financial perspective)”.
Over the last few years, many authors have developed on Kaplan and Norton’s definition of
the BSC. For example, Jackson and Qu (2008, p.111) described the “BSC as a management
tool that presents managers with a complete view of how the organisation is performing in
relation to the organisation's strategic objectives”. Jackson and Qu (2008, p.111) suggested that
the main goal of the BSC was to “provide a clear indication of what the organisation should be
measuring, on what issues it should focus to ensure continuous organisational improvement in
strategic performance”. According to these researchers, while “other performance measures
approaches rely on financial performances, the BSC assesses and communicates organisational
performance in both financial and non-financial terms, and uses these results to address both
long and short term organisational objectives”.
Bach, Calais and Calais (2001, p.212) suggested that the “BSC integrates the interests of the
key stakeholders; this includes owners, customers and employees”. According to Bach et al.
(2001, p.212), the “term ‘balance’ reflects the attempt to capture both financial and non-
financial measurements with emphasis on lagging and leading indicators, long-term strategic
objectives and short-term actions, external and internal performance perspectives, as well as
quantitative-objective and qualitative-subjective measures”. According to Cravens, Oliver and
Stewart (2010, p.270), the BSC is a “performance evaluation system that balances performance
metrics across four dimensions, employing both financial and non-financial metrics as
19
indicators of achieving strategic objectives”. By using the four perspectives, the BSC embraces
non-traditional “performance measures to give managers a specific recommendation as to how
their actions affect strategic goals” (Cravens et al., 2010, p270).
Cameron (2002, p.30) suggested that the BSC provides the means for “linking the strategies of
different operating units within an organisation to the overall missions and values”. According
to Cameron (2002, p30), the most important aspect of the BSC is its “ability to allow
organisations to link long term strategy with short term actions”. Sharma (2009) similarly
described the BSC as a strategic planning and management system. Based on this description,
Sharma (2009, p.7) suggested that the “BSC is used extensively in business and industry,
government and non-profit organisations worldwide to align business activities to the vision
and strategy of the organisation, improve internal and external communications, and monitor
organisation performance against strategic goals”.
According to West, Quazi and Davies (2009, p.4), the BSC combines “elements of strategic
management that converts financial and non-financial perspectives into performance
measures” which, unlike finance-driven performance models, allows for the “inclusion of the
human element”. West et al. (2009, p.4) further suggested that the “incorporation of strategic
alignment with the four interconnected financial and non-financial perspectives provided
components for developing a comprehensive and integrated framework that is missing in
finance-focused performance management models”.
2.3 CONCEPTUALISATION OF THE BALANCED SCORECARD
Kaplan and Norton initially created the phrase the ‘balanced scorecard’ in the early 1990s.
However, this approach to measurement existed previously, through for example, the
innovative performance measurement work of General Electric (GE), as well as the work of
Simon, Guetzkow, Kozmetsky and Tyndall (1954) and Drucker (1954).
According to Lewis (1955), GE conducted a “project to develop performance measures for its
decentralised business units”. The project team recommended that “divisional performance be
20
measured by eight objectives consisting of one financial and seven non-financial metrics”
(Lewis, 1955). However, according to this researcher, the “GE project never got ingrained into
the management system and incentive structure of GE’s line business units”.
During the same period as the GE study, Simon et al. (1954) identified several purposes for
accounting information in organisations which consisted of scoreboard questions, attention-
directed questions and problem solving questions. These researchers looked at the role of
financial and non-financial information to inform these three questions. Building on the work
of these researchers, Anthony (1965, p.24 - 27) proposed a “comprehensive framework for
planning and control systems and identified three different types of systems: strategic planning,
management control, and operational control”. According to this researcher, “strategic
planning depended on an estimate of a cause-and-effect relationship between a course of action
and a desired outcome while management control systems had an underlying financial
structure”. The researcher found that “operational or task control was described as the process
of assuring that specific tasks are carried out effectively and efficiently”, and therefore
suggested that “information for operational control was mostly non-monetary, though some
information could be denominated in monetary terms”. The researcher did note certain
concerns related to all three components in the planning and control system. However, despite
the research conducted by Simon et al. (1954) and Anthony (1965) in relation to the impact of
financial and non-financial measurement in management systems, most companies up until the
late 1980’s still focused on financial information rather than non-financial aspects of the
business.
Between the 1980’s and 1990’s, measurement systems still focused on financial information.
In response to this, Kaplan and Norton (1992) published their proposals that led to introduction
of Balanced Scorecard concept. Kaplan and Norton (1996a, p.8) “argued that traditional
financial accounting measures like the ROI and payback period offer a narrow and incomplete
picture of business performance, and that a reliance on such data hinders the creation of future
business value.” As a result, these authors suggested “that financial measures be supplemented
with additional measures that reflect customer satisfaction, internal business processes, and the
ability to learn and grow”. According to these authors, the “BSC is designed to complement
‘‘financial measures of past performance with measures of the drivers of future performance”.
21
While “several organisations may have started using non-financial data before Kaplan and
Norton (1992) published their finding”, according to Rillo (2004, p.155), they were the “first
to capture the organisation’s entire strategy and establish methodology according to which the
measures are derived by a logical cascade of the organisation’s vision and values”. These were
“implemented from top management to the lowest effectively measured level possible, into one
holistic set” (Rillo, 2004, p.155).
Kaplan and Norton (1992, p.71) first proposed the BSC during their research with Senior
Executives of 12 companies. These authors found that these executives wanted an equal
representation of both financial and operational measures. As a result of their study, the authors
devised a ‘BSC’ which comprised “a set of measures that gave top management a fast but
comprehensive view of their business”. Their conclusions were published in three articles;
Kaplan and Norton (1992); Kaplan and Norton (1993) and Kaplan and Norton (1996a) and
followed by a book, Kaplan and Norton (1996b). The authors explained that no single measure
can determine a premise course for action. However, the authors suggested that the complexity
of organisations necessitates them to pay attention to both financial and non-financial data.
Based on Kaplan and Norton’s (2001) research, five basic principles emerged for a strategy
focused organisation. According to Kaplan and Norton (2001, p.147), these five principles
include; “mobilise change through executive leadership translate the strategy into operational
terms; align the organisation to the strategy, make strategy everyone’s job and make strategy a
continual process are seen as key elements of building an organisation able to focus on strategy
and deliver breakthrough results”.
2.4 EVOLUTION OF THE BALANCED SCORECARD
In the last few years, the initial model and design of the BSC conceptualised by Kaplan and
Norton (1992) has undergone an evolutionary change. According to Ba-Abaad (2009, p.39),
the “balanced scorecard has evolved considerably from its roots as a measure selection
framework”. Ba-Abaad (2009, p.39) suggested that “while the underlying principles were
sound, many aspects of Kaplan and Norton's original approach were unworkable in practice”.
Similarly, Johnson, Beiman and Collaborative (2007, p.5) suggested that “continued research
22
and innovations over the last 15 years has resulted in the BSC going through an evolutionary
process of improvement”. The balanced scorecard has “evolved from performance
measurement between the years 1990 to 1996, to performance management in 1996 to 2000,
to eventually becoming a globally recognised best practice for strategic management presently”
(Johnson & Beiman, 2007, p.5).
Tayler (2010, p.1096) similarly suggested that the “early writings on the balanced scorecard
emphasized the importance of using multiple measures to provide a balanced perspective of
firm’s performance, using the four distinct perspectives of financial, customer, internal
processes, and learning and growth”. The focus of early research on the BSC was solely “on
the “balance” of the scorecard, investigating how managers use scorecard measures to evaluate
performance” (Tayler, 2010, p.1098). However, more recently this author suggested “that the
BSC proponents have shifted emphasis from balance to strategy”. According to this author,
these “proponents argue that the BSC scorecard serves as a tool for defining strategic objectives
and communicating these throughout the organisation, identifying initiatives to achieve those
objectives, and evaluating whether those objectives have been achieved”.
There has also evolved different schools of thought regarding the BSC. For example, a large
number of books and articles have focused on the concept and theoretical writing of the BSC.
Norreklit (2000, p.65) examined “the extent to which there is a cause-and-effect relationship
among the four areas of measurement” suggested by Kaplan and Norton (1992), as well as
whether “the balanced scorecard can link strategy to operational metrics which managers can
understand and influence”.
Towards the end of the 1990’s and early 2000, two additional schools of thought developed.
One school focused on case-studies such as Kaplan and Norton (1996a), Malina and Selto
(2001) and Kraus and Lind (2010), while the other focused on surveys such as Hoque and
James (2000) and Malmi (2001). For example, Kaplan and Norton (1996a, p.81) used case
studies to show the impact of the BSC on performance by describing “helps to communicate
corporate and business unit objectives to the people and teams performing the work, enabling
them to translate the objectives into meaningful tasks and targets for themselves”. With regard
to surveys, Hoque and James (2000, p.1) used a questionnaire to “search for a relationship

23
between the BSC usage and organisation size, product life-cycle stage and strength of market
position”. Malmi (2001, p.207) also used semi-structured interviews to “find out how BSCs
are applied and why companies adopt them”.
Also in the early 2000’s, another school developed. This school was quantitatively focused,
dedicated to “analytical studies and frameworks concerning the problem of transforming the
BSC into a dynamic model” (Nielsen and Nielsen, 2006, p.3). For example, Nielsen and
Nielsen (2006) developed a System Dynamics model based on the theory of the balanced
scorecard. Nielsen and Nielsen (2006), using five BSC perspectives and a number of key
performance indicators, showed that companies tend to overlook the possible benefits of
combining and integrating several accounting practices into a single BSC-framework using a
system dynamic model. Schöneborn (2003) similarly proposed using a system-dynamic causal-
loop diagram to reach long-term financial success, while Laitinen (2004) developed a
mathematical model of a firm to derive theoretical foundations for the BSC concept.
The use of the BSC has increased substantially throughout the world. According to Rigby
(2005, p.13), “a study conducted by Bain & Company on management tools stated that 57% of
960 international executives reported using the BSC”. In 2007, “this percentage increased to
66% in 2007, out of a sample of 1221 firms” (Rigby, 2007, p.14).
2.5 THE FOUR PERSPECTIVES OF THE BALANCED SCORECARD
The balanced scorecard “allows managers to look at their business from four important
perspectives” i.e. the financial perspective, customer perspective, internal business perspective
and innovation and learning perspective (Kaplan & Norton, 1992, p.72). In addition to
providing managers with information from the four perspectives, “the balanced scorecard
minimises information overload by limiting the number of measurements used, hence forcing
managers to focus on the measures that are most critical” (Kaplan & Norton, 1992, p.72).

24
2.5.1 Financial Perspective
According to Kaplan and Norton (1992, p.77), a company’s financial performance measure is
an indication of whether a “company’s strategy, implementation, and execution contribute to
bottom-line improvement”. Kaplan and Norton (1992, p.77) suggested that a “company’s
typical financial goals have to do with its profitability, growth and shareholder value”.
Jackson and Qu (2008, p.12) similarly suggested that the “financial perspectives related to the
organisation's financial objectives, as they involved revenue and growth mix, cost
management, profitability and finally, asset utilisation and investment strategy”. According to
Ba-Abaad (2009, p.39), “the financial perspective examined whether the company’s
implementation and execution of its strategy contributed to the bottom-line improvement of
the company”. The financial perspective “represented the long-term strategic objectives of the
organisation and thus it incorporates the tangible outcomes of the strategy in traditional
financial terms” (Ba-Abaad, 2009, p.39-40).
Kaplan and Norton (1996b, p.56) described the three possible stages in the financial perspective
as “rapid growth, sustain and harvest”. According to Kaplan and Norton (1996b, p.57),
“financial objectives and measures for the growth stage will stem from the development and
growth of the organisation which will lead to increased sales volumes, acquisition of new
customers and growth in revenues”. “The sustain stage”, on the other hand, will be
characterised by “measures that evaluate the effectiveness of the organisation to manage its
operations and costs, by calculating the return on investment and the return on capital
employed” (Kaplan & Norton, 1996b, p.57). Finally, according to Kaplan and Norton (1996b,
p.57), the “harvest stage will be based on cash flow analysis with measures such as payback
periods and revenue volume”.
Some of the key performance indicators specific to the financial perspectives included “an
organisation’s cash flow, return on investment, financial results, return on capital employed,
and return on equity” (Ba-Abaad, 2009, p.40). Kaplan and Norton (1992) still suggested that
financial information was important, however, they believed that there needs to be a ‘balance’
between the financial and non-financial perspectives.

25
2.5.2 Customer Perspective
According to Kaplan and Norton (1992, p.73), the BSC enforces “that managers translate their
general mission statement on customer service into specific measures that reflect the factors
that really matter to the customer”. The customer perspective defines “the value proposition
that the organisation will apply in order to satisfy customers and thus generate more sales to
the most desired” (Ba-Abaad, 2009, p.40). Ba-Abaad (2009, p.40) suggested that the “measures
that are selected for the customer perspective should measure both the value that is delivered
to the customer (value position) which may involve time, quality, performance and service and
cost and the outcomes that come as a result of this value proposition (e.g., customer satisfaction,
market share)”.
Kaplan and Norton (1992, p.73) believed that customer concerns tended to fall into four
categories consisting of “time, quality, performance and service”. According to Kaplan and
Norton (1992, p.73), for the “BSC to work, companies should articulate for time, quality,
performance and service and then translate these goals into specific measures”. Kocakülâh and
Austill (2007, p.85) suggested that the customer perspective “required management to select
measures or metrics that defined who the target customers were and what qualities or values
those customers looked for in a company”. Those measures, according Kocakülâh and Austill
(2007, p.85), may include “customers answering questions as to how they perceive quality,
price, customer service, innovation, and competitors”.
According to Niven (2006, p.17), the customer perspective should consist of three important
questions, namely “who are our customers, what do our customers demand or want from us,
and what is our value proposition in serving them”. Niven (2006) suggested that that while this
may sound easy to understand, most companies still have a holistic approach to customers even
though they have a target customer market. According to Kaplan and Norton (1996b, p.60-61),
the emphasis on customers should take care of “customer satisfaction, customer loyalty,
customer retention and customer acquisition”. Sharma (2009, p.10) suggested that when an
organisation shows a poor performance in the customer perspective, that could be “a leading
indicator of future decline, even if the current financial picture looks good”.
26
Some of the key performance indicators specific to the customer perspective “include delivery
performance to customers, quality performance to customers, customer satisfaction rate,
customer loyalty and customer retention” (Ba-Abaad, 2009, p.41). According to Banker, Chang
and Pizzini (2004, p.3), customer measures “are intended to measure the company’s
performance from the customers’ perspective”.
2.5.3 Internal business processes
Kaplan and Norton (1992, p.74-75) suggested that the “internal business processes stem from
the business processes that have the greatest impact on customer satisfaction”. According to
Kaplan and Norton (1992), these include cycle time, quality, employee skills and productivity.
Similarly, Jackson and Qu (2008, p.112) suggested that the internal business process
perspective “relates to internal processes that are essential and critical to achieving customer
objectives”, while Kocakülâh and Austill (2007, p.85) also suggested that the “internal process
perspective requires management to consider the firm’s operations or processes that affect or
are essential to achieving the strategic objectives with regard to satisfying the customer’s
desires for each of those qualities or values important to the customer”.
According to Ba-Abaad (2009, p.40), “the internal process perspective is concerned with the
processes that create and deliver the customer value proposition”. Ba-Abaad (2009, p.40)
suggested that the “internal business process focuses on all the activities and key processes
required in order for the company to excel at providing the value expected by the customers,
both productively and efficiently”. According to this author, these could “include both short-
term and long-term objectives as well as incorporating innovative process development in order
to stimulate improvement”. According to Niven (2006, p.18), to ensure customer satisfaction,
organisation must “must identify entirely new internal processes rather than focussing their
efforts on the incremental improvement of existing activities”.
The key performance indicators specific to the internal business processes include “a number
of activities, opportunity success rate, accident ratios and overall equipment effectiveness” (Ba-
Abaad, 2009, p.41). Banker et al. (2004, p.3) suggested that internal business process measures
are “employed to identify core competencies, recognise strengths and shortcomings, and to
27
make improvements”. Banker et al. (2004, p.3) believed that, “since the path to any business
changes with time, a company’s ability to innovate new products and processes is critical in
achieving success”.
2.5.4 Learning and Growth
According to Kocakülâh and Austill (2007, p.86), the learning and growth perspective relates
to “employee skills and information systems that drive improvements and successes with
respect to the other perspectives”. Typically, according to Kocakülâh and Austill (2007), the
goal in this perspective is to hire the best and brightest employees, train them, and keep them
satisfied and productive.
Ba-Abaad (2009, p.40) believed that the “innovation and learning perspective was the
foundation of any strategy and focused on the intangible assets of an organisation”. According
to this author, the “innovation and learning perspective was concerned with human capital,
systems and the organisation capital of the enterprise”.
Sharma (2009, p.9) describes the learning and growth perspective as “including all employee
training and corporate cultural attitudes related to both individual and corporate self-
improvement”. Sharma (2009, p.9-10) suggested that “in a knowledge-worker organisation
people are the only repository of knowledge and in the current climate of rapid technological
change, it is becoming necessary for knowledge workers to be in a continuous learning mode”.
Niven (2006, p.18) believes that the current climate of rapid technological change has
necessitated the “need for knowledge workers to be in a continuous learning mode”. According
to Niven (2006, p.18), “measurement techniques can be developed to guide managers in
focusing training funds where they can help the most”.
Some of the key performance indicators specific to the learning and growth perspective include
“investment rate, illness rate, internal promotions, employee turnover and gender ratios” (Ba-
Abaad, 2009, p.41). According to Banker et al. (2004), the learning and growth perspective
focuses on measure related to factors that facilitate continuous improvement. Other measures
28
include “lost time accidents, productivity, training hours, certifications, leadership
development, and job satisfaction” (Kocakülâh & Austill, 2007, p.86).
2.6 INTERRELATIONS BETWEEN THE FOUR PERSPECTIVES OF THE
BALANCED SCORECARD
The synergy between the four perspectives of the BSC is one of the factors that distinguish the
BSC from other performance management tools (Chiang & Lin, 2009). The cause-and-effect
relationship among the four perspectives of BSC was proposed by Kaplan and Norton (1996a,
p.84) by measuring the “strength of the linkages among measures in different perspectives”.
These authors believed that one of the “greatest strengths of the BSC model is that it makes
these relationships between activities and outcomes clear”. According to Niven (2006, p6)
Kaplan and Norton (1996a) drew a distinction between “causes and outcomes” and argued that
much of performance evaluation focused “on the outcomes or effects rather than the causes,
which they liken to driving a car looking in the rear-view mirror”.
Chiang and Lin (2009) found empirically evidence that the four perspectives of the BSC were
inter-related. According to Chiang and Lin (2009, p.1169), the learning and growth, customer
and financial perspectives were all positively related to each other, with the “relationship
between customer perspective and financial perspective been the most significant among the
inter-relationships”.
Conversely, Norreklit (2000) suggested that the relationship between the four perspectives of
the BSC was a logical relationship as opposed to a causal one. He suggested that “customer
satisfaction does not necessarily lead to good financial results, even though this may seem to
be intuitively logical”. For example, according to Norreklit (2000, p.75) “financially successful
firms only sell to loyal customers who are profitable; otherwise the firms would not be
successful; if a company has nothing but profitable loyal customers, the explanation may be
that its management control system works well and that the company does not sell to non-
profitable loyal customers.” This author suggested that the “creation of profitable loyal
customers depends on the revenues and costs of making them loyal” i.e. it depends on a
financial calculus, which is a logical relationship. This author went on to “argue from a
29
‘philosophy of science perspective’ that the BSC makes invalid assumptions about the causal
relationships between performance indicators and that these invalid assumptions will result in
dysfunctional behaviour in organisations and as a consequence lower organisational
performance”.
Bukh and Malmi (2005, p.95-96) looked at the relationship between the four perspectives more
realistically and “argued that if establishing significant correlations between measures and
causal chains was immediately obvious and easy then the need for strategy or even
management is diminished”. According to these researchers, “establishing association between
inputs that are assumed to have the greatest impact on outcomes is what developing cause and
effect is about”. Furthermore, according to these authors, “in many organisations these
relationships can be discovered and attuned through a process of learning and experimentation
over time”.
2.7 BALANCED SCORECARD AND OTHER SIMILAR PERFORMANCE
MANAGEMENT SYSTEMS
Maisel (1992, p.48) introduced the Maisel BSC, which like Kaplan and Norton (1992) BSC,
defined four perspectives based on which business activity should be evaluated. However,
unlike Kaplan and Norton (1992) learning and growth perspective, this author suggested the
“human resource perspective which measured innovation, as well as such factors as education,
development of production services, enhancement of competence and corporate culture”.
Maisel (1992, p48) believed that an “organisations management should be more attentive to
personnel, and measure not only efficiency of processes and systems but also evaluate
performance efficiency of employees”.
McNair, Lynch and Cross (1990, p.28-30) introduced the efficiency pyramid where the “key
concept of was the connection of customer oriented corporate strategy with financial indicators,
supplemented by several key quality (non-financial) indicators”. According to these authors,
“the efficiency pyramid is based on concepts of total quality management, industrial
engineering and counting based on actions, where actions imply everything done by people
and machines to satisfy customers’ needs”. McNair et al. (1990, p.28-30) suggested that
efficiency pyramid has four different levels that show organisation structure with feedback and
30
communication systems necessary for decision making at different managerial levels. In the
efficiency pyramid, objectives and indicators link organisation strategy to its operational
activity (McNair et al., 1990).
According to McNair et al. (1990), the corporate vision is formulated at the top level. The
second level is where “customers and shareholders define what needs to be evaluated, includes
objectives for departments and subdivisions in accordance with certain market and financial
indicators” (McNair et al., 1990, p.30). The third level, according to these authors, is non-
organisational and “consists of a number of aspects focusing on satisfaction of customer needs
and flexibility of production process where the measuring indicators are customer and financial
objectives”. The final level “deals with quality and delivery terms which are related to the
external environment and production cycle and losses which are indicators for internal
processes of an organisation” (McNair et al., 1990, p.30).
2.8 BALANCED SCORECARD AND PERFORMANCE MANAGEMENT
Chang and Young (1995, p.5) suggested that while “vision and statements do a good job of
providing overall guidance and direction”, it is “good measurements provide the operational
definitions everyone can understand. According to Ling Sim and Chye Koh (2001, p.18), some
of the criticisms of traditional performance measurement systems were that “they were too
narrowly focused on financial figures and functional level performance such that they often
fail to capture organisational long-term business success”. The BSC, however, “called on
managers to first make a commitment to introduce an array of measures or scorecards that
would guide their decisions away from the narrowly focused financial measures” (Ling Sim &
Chye Koh, 2001, p.18). The BSC, according to these authors, “served as dials on a dashboard
and guided businesses into greater profitability as managers position themselves to better serve
their employees, customers, and shareholders at large”.
Many studies have supported this proposal. For example, using case-studies, Kaplan and
Norton (1996a, p.155) showed the impact of the BSC on performance by “describing how the
BSC provided the ability to communicate the strategy to all members of the organisation and
enabled the organisation to obtain valuable feedback and ideas from employees closest to
customers”. Using another case-study, these authors indicated that a fundamental advantage of
31
the BSC “came from its ability to link scorecard measures for each employee to an internal
share price”. According to these authors, “this dramatically improved productivity as it meant
that each individual reconsidered his/her role within the organisation, and concentrated on areas
in which he/she could add value to the business”. However, these authors noted that the
“motivation for this change of behaviour was also reinforced by the fact that each employee
owned company shares and could win or lose according to overall company performance, as
perceived internally”.
In their study of the BSC and strategic performance measurement, Ling Sim and Chye Koh
(2001, p.22), suggested “that companies that continuously improve their capabilities should
achieve better performance in their internal business process perspective” which will, in turn,
“lead to better performance in their customer perspective”. These authors further proposed that
the resultant improvement in customer performance should lead to “improved financial
performance”. Correlating and using statistical regressions from information collected from 83
companies, these authors found positive support for the BSC. Their findings suggested that the
“BSC can be used as a tool for monitoring the long-term value creation process” (Ling Sim &
Chye Koh, 2001, p.23).
De Geuser, Mooraj and Oyon (2009, p.93) investigated the value of the BSC with regard to
performance. These authors looked at “whether the BSC adds value to companies and, if so,
how it contributes to organisational performance”. These authors separated and quantified
“both the BSC contribution to performance and the way that the contribution is achieved, by
applying a unique cause-and-effect scheme to the BSC”. De Geuser et al. (2009, p.93) found
that the BSC improved the “integration of the management processes and empowered people”.
Using Kaplan and Norton’s (2001) Strategy-Focused-Organisation model, these authors found
that the sources of performance derived from the BSC come mainly from the strategic focus
which consisted of three primary types, namely, that strategizing becomes a constant process,
a better understanding of the strategy into operational terms, and a better alignment of various
services, processes, competencies and units of an organisation. Geuser et al. (2009, p.114) also
noted that when the “BSC is used to align resources to the strategic objectives, it apparently
leads to positive organisational performance”.
32
2.9 BALANCED SCORECARD AND STRATEGIC MANAGEMENT
Kaplan and Norton (1992) originally saw the BSC as a performance measurement tool. Only
later did they see it as an approach for strategic management (Kaplan & Norton, 2001). The
strategic conception centred on the needs of an “organisation’s strategic vision” (Kaplan &
Norton, 1996a, p.160). According to these authors, “a strategy map provided management with
a methodology to identify and explore systematically the critical success factors that may
influence the cause-and-effect relationships of the four perspectives”. These authors suggested
“that basing a scorecard on vision has the advantage of limiting objectives and measures to a
manageable number” which helps executives concentrate their “time and effort on those
measures that will take the organisation forward to its future goals”.
Kaplan and Norton (1996a, p.161) saw that companies had moved beyond their initial vision
of the scorecard, towards discovering the “value of the BSC as a new strategic management
system”. The BSC used in this way addressed a serious deficiency in traditional management
systems i.e. the inability to link a company’s long-term strategy to its short term actions
(Kaplan & Norton, 2006). According to these authors, the BSC used a strategic management
system, introduced four new management processes that, both “separately and in combination,
contribute to linking long term strategy to short term actions.
These four management processes consist of:
1. Translating the vision – helps managers build consensus around the organisation’s
vision and strategy
2. Communicating and linking – lets managers communicate their strategy up and down
the organisation and link it to its departments and individual objectives
3. Business planning - enables companies to integrate their business and financial plans
4. Feedback and learning – gives companies the capacity for what is referred to as strategic
learning (Kaplan and Norton 1996, p.152).
According to Kaplan and Norton (1996a, p.161), adopting the BSS as a strategic
management system helps provide “clarification, consensus, and focus on the desired
33
improvements in performance”. These authors believed that without a BSC, “most
companies would be unable to achieve a similar consistency of vision and action when they
attempt to change direction and introduce new strategies and processes”. Kaplan and
Norton (1996a: 161) suggest that the BSC provides a “framework for managing the
implementation of strategy while also allowing the strategy itself to evolve in response to
changes in the company’s competitions, market, and technological environments.”
2.10 CONSEQUENCES OF THE BALANCED SCORECARD
According to Sharma (2009, p.13), the BSC helps make “strategy operational by translating
strategy into performance measures and targets”. The BSC creates breakthrough performance
by focusing the entire organisation on what must be done, and “integrates and acts as an
umbrella for a variety of often disconnected corporate programmes, such as quality, re-
engineering, process redesign and customer service” (Sharma, 2009, p.13). Finally, this author
suggested that the BSC disintegrates management level measures so that employers and
employees can see what they must do so as to improve organisational effectiveness.
Dumitrescu and Fuciu (2009, p.39) suggest that the BSC is a tool that “helps managers to better
create objectives, to better achieve their goals, lay out better strategy maps and to better
evaluate the company’s activity”. The BSC is a quantifying tool that will assist leaders in
keeping a “closer eye on four important aspects of the company i.e. the learning and growth
perspective, the business process, the customer and the financial perspective” (Dumitrescu &
Fuciu, 2009, p.39). These authors believed that the BSC will give companies a better picture
on the four perspectives that will enable leaders to better recognise what is happening in the
market, organisation and simultaneously enable them to have a better view of the future trends
of the market.
Malina and Selto (2001, p.74) suggested that “the BSC does present significant opportunities
to develop, implement and communicate strategy”. These authors determined that managers
respond favourably to the BSC by adjusting their resources and activities with the aim of
improving their performance in those measures. In addition, these authors suggested that the

34
“BSC converts some of the strategic tacit and objective knowledge of senior management into
metrics which are then communicated to lower levels of the organisation through the cascading
of the BSC”. At the lower levels, knowledge of how actions can contribute to the organisations
strategy is also created by the systematic process of considering metric design and its impact
on higher levels of BSC (Malina & Selto, 2001).
2.10.1 Improve Organisational Strategic Performance
The premise of the strategic benefit of BSC is that organisations will improve performance.
Performance will firstly improve, according to Kaplan and Norton (1996a), through
management clarifying and gaining consensus about strategy. This will occur when senior
managers “work together to translate its business units strategy into specific strategic
objectives” (Kaplan & Norton, 1996a, p.80). According to these authors, the “BSC will then
enable the strategy to be communicated throughout the organisation for personal and
departmental goals to be aligned”.
According to Kaplan and Norton (1996a, p.82), as part of this strategic process, long term
strategic initiatives will be identified and aligned through a “reduced emphasis on short term
financial measures”, and more of a “focus placed upon drivers of long term success”. These
authors believed that the BSC provided a “strategic learning framework where the capability
for organisational learning is able to take place at an executive level”. They further suggested
“that by enabling a feedback loop on the strategic process, managers will be able to question
strategic priorities and the assumptions made, leading to a realignment of strategy and
organisational objectives where necessary.
The use of the BSC as a strategic management system has yielded positive results. For example,
the world class Institute of Technical Education (ITE) in Singapore “began using the BSC as a
strategic management system to improve quality and performance in its institution” (Yek,
Penney, & Seow, 2007, p.1). The aim of the study, according to these authors, was to explore
and enhance the understanding of “quality and performance with regard to Vocational
Educational Training (VET) in Singapore, and how using the BSC, to best measure, manage
35
and realise these as a strategic management system”. According to Yek et al. (2007, p.6), the
ITE “linked the four perspectives of the BSC to 12 strategic objectives and 31 key performance
indicators”. The results by these authors revealed that there was a significant improvement in
“the quality and performance of VET delivered by ITE using the BSC”. According to Yek et
al. (2007, p.20-21), “these improvements have been observed through qualitative assessments
by independent SQA assessors, as well as others, and are reaffirmed by quantitative data over
the period”.
Martinsons et al. (1999, p.71) proposed using the BSC to “measure and evaluate IT application
projects and the IS department or functional area as a whole”. These authors found that the
“BSC framework does represent a strategic IS management tool that can be used to monitor
and guide specific projects as well as general performance improvement efforts”. According to
these authors, “the balanced IS scorecard will allow managers to see the positive and negative
impacts of IT applications and IS activities on the factors that are important to the organisation
as a whole”. These authors concluded that the value of the BSC information system rises if it
is used to co-ordinate a wide range of information “system management processes, such as
individual and team goal-setting, performance appraisal and rewards for IS personnel, resource
allocation, and feedback-based learning”. According to these authors, the management of both
information system people and projects are “likely to benefit from a systematic framework
based on goals and measures that are agreed upon in advance”.
The use of the balanced scorecard in business has not seemed to diminish in recent years.
According to Kaplan and Norton (2001), some of the companies that have had success using
the BSC include Mobil Oil North America Marketing and Refining Division, CIGNA,
Chemical Retail Bank, and Brown and Root Energy Services and Rockwater Division, Aetna,
Amoco Corporation, Bellsouth Communications, Sears, Sprint, Sears, Tesco and Dow
Chemical.
The performances of some of the companies that first used the BSC are illustrated below
(Norton & Daum, 1999). Their performances are very impressive. For example, in 1992, Mobil
Oil’s US Marketing and Refining division was performing poorly and was last in its industry.
36
The Balanced Scorecard was introduced to Mobil Oil in 1993. By 1995, according to Norton
and Daum (1999, p.6), “Mobil had moved from last place to first place in industry profitability
and has maintained the number 1 position for four consecutive years”. Furthermore, these
authors stated that “the negative cash flows initially experienced have been dramatically
reversed, and Mobil’s ROI leads all competitors”. In another example, the Property and
Casualty Division of Cigna lost nearly $275 million. According to these authors, “a new
strategy was developed where Cigna would be a "specialist," focusing on niches where it had
comparative advantage”. This strategic initiative was implemented out to several business units
within the organisation, with the BSC used as the core management process. Within two years,
according to these authors, “Cigna had returned to profitability with their performance being
sustained for four consecutive years”. At the end of 1998, Cigna sold Property and Casualty
Division for a price of $3.45 billion, with Gerald Isom, President of Cigna Property and
Casualty, attributing the BSC as an important part of their success story (Norton & Daum,
1999).
The BSC was introduced to Chase Manhattan Bank, previously known as Chemical Retail
Bank, in 1993. Prior to the BSC introduction, according to Norton and Daum (1997, p.7), Chase
Manhattan Bank “was still struggling to assimilate a recent merger, as well as attempting to
introduce more integrated financial services and greater use of electronic banking to its
customers”. Using the BSC, the strategic priorities were clearly defined, and the strategy and
budget properly aligned, resulting in profitability increasing within three years by a factor of
20 (Norton and Daum, 1999).
Recent examples from the retail industry include Sears and Tesco. In the early 1990’s, Sears
Roebuck and Company reported the “worst performance in its history”, with “the company’s
net loss at $3.9 billion” (Rucci, Kim & Quinn, 1998, p.85). However, with the introduction of
the BSC, “Sears reported a 4% increase in employee satisfaction and customer satisfaction”
within two year (Rucci et al., 1998, p.97). According to these authors, “the increase in customer
satisfaction led to an estimated $200 million increase in revenue”, in addition to increasing
Sears' “market capitalisation by almost $250 million”.
37
Tesco, the largest retailer in the United Kingdom, currently uses a balanced scorecard approach
which they refer to as the ‘Steering Wheel’ (Heskett, Sasser & Schlesinger, 1997). Sir Terry
Leahy, CEO of Tesco, revealed that Tesco had implemented Kaplan's "Balanced Scorecard"
approach to management through Tesco's "Steering Wheel" system. According to these
authors, while the ‘Steering Wheel’ is the core of Tesco’s business planning strategy, Tesco
also uses its balanced scorecard to set objectives throughout the business i.e. the ‘Steering
Wheel’ ensures that everyone’s objectives are linked to company strategy. Leahy believes that
“objectives across the five perspectives allow Tesco to be balanced in its approach to
performance” (Marr, 2009, p.5). The success of the Balanced Scorecard approach is evident in
“Tesco’s reported sales of £59.4 billion in 2009 with a 15.1% growth in annual sales and a
5.5% growth in profits” (Marr, 2009, p.3).
2.10.2 Balanced Scorecard and Creating Corporate Identity
A significant challenge “for organisations is how to effectively manage corporate identity to
achieve the alignment of individuals with the organisation, and corporate identity is one of the
central forms of management control” (Kim & Hatcher, 2008, p.119). These authors explored
the “regulatory roles of the use of the balanced scorecard in shaping key dimensions of
corporate identities”. According to these authors, one of the features of the BSC is its “capital
readiness report which systematically measures three intangible assets”, i.e. human,
information and organisational capital, in its learning and growth perspective. These authors
suggested that the “organisational capital aspect which assesses culture, leadership, teamwork
and knowledge sharing has an especially close relationship with the measures developed in the
corporate identity literature”.
In their study, Kim and Hatcher (2008, p.122) further found that the BSC has the “potential to
support identity construction, as an organisational symbol, a communication tool of vision, and
as strategy, through creating conversations that self-regulate behaviour”. These authors
suggested that the “development of an integrated performance measurement system”, such as
the BSC, “becomes an expression of a desired corporate identity, and the performance
measures and continuous process provide the resource for interpreting actual corporate
identities”. According to these authors, “through this process of understanding and mobilising
38
the interaction, it may be possible to create a less obtrusive and more subtle way to control
what an organisation is”.
2.10.3 Balanced Scorecard and Compensation
Kaplan and Norton (1996a, p.81) suggested “that reward and compensation is a central
component to BSC design as it increases the impact through attaching incentives to measures
thereby focusing individual’s efforts”. They further suggested that with a “strategically linked
scorecard and incentive systems based on this, strategy becomes everyone’s job because
employees now understand the strategy and are motivated to make it succeed”. (Kaplan &
Norton, 2001 p.152).
However, Tuomela (2005, p.218) “found that compensation was not linked to BSC measures
as staff in the organisation felt that attaching bonuses to measures reduced the power of the
BSC to be used interactively as a learning vehicle, at least in the early stages of
implementation”. According to this author, the focus of the organisation was on discussion and
learning, and there was no interest in creating a reward or punishment atmosphere. It was
perceived, according to this author, that reward systems should not be tightly linked to the
bonus systems when ambiguity about measures and appropriate target levels prevails.
2.10.4 Balanced Scorecard and Positive Psychology
Cravens et al. (2010, p269) suggested that “creativity, more problem solving ability, and a
greater communication among managers can be generated by using performance measures
framed in a positive manner”. This, in turn, according to these authors, may lead to progress
towards organisational goals. These authors further suggested that “the measures in the BSC
are not only important as a management system to provide information on achieving strategic
objectives, but also as a means of stimulating the range of options for managers in dealing with
uncertainty”. These authors proposed that by “using measures framed in a positive manner to
kindle rather than stifle manager’s creativity, it will provide them with a greater capacity to
develop ideas that allow the achievement of strategic objectives”. In order to describe how
positive measures could facilitate more effective performance, these authors linked the positive
measures to Kaplan and Norton’s (2001, p.147) “five principles of a strategic focused
39
organisation” to ensure a stronger link to organisational objectives when using the BSC.
Applying positive metrics to the BSC, Craven et al. (2010, p.269) found that “individual
managers achieved their personal goals, while the organisation satisfied its strategic
objectives”.
2.10.5 Balanced Scorecard in Non-Profit Organisations
The “BSC concept has enjoyed wide popularity in the profit sector, both as a performance
measurement and improvement framework” (Alfirević, Pavičić, Adžić, Šimurina & Bratić,
2005, p.5). However, very little notice is given to its impact on the non-profit world.
According to Kaplan and Norton (2004, p.429), the use of the BSC in non-profit and
government sector “was widely accepted and adopted in many knowledge-based non-profit
organisations all over the world”. Kaplan and Norton (2004, p.429) described this ‘migration’
as “one of the most gratifying extensions of the original concept”.
In order for the BSC to be used in non-profit organisations, it had to be adapted to cater for
differences in the measures of the four perspectives. Alfirević et al. (2005, p.9) maintain that
the most crucial difference between “the profit and non-profit sectors is the performance
evaluation principle used for all derived performance measurement techniques/methods”.
Beside financial measures, the management of governmental agencies and NGO’s have to cope
with different issues of a wide-ranging of non-financial measurements and evaluations of
activities addressed to all target groups (Alfirević et al., 2005). According to these authors, the
importance of the “financial perspective was very confusing for managers in the non-profit
sector, so the whole concept needed to be rearranged”. As a result of these perceived problems,
Kaplan and Norton (2004, p.135) suggested “adaptations, with the most important “innovation”
being the placement of the long-term objectives/mission to the top of the scorecard”.
Using Kaplan and Norton (2004)’s framework in their analysis of a representative non-profit
organisation, Alfirević et al. (2005, p.5) concentrated both on the “issues of implementing the
strategy of a non-profit organisation through the BSC framework, as well as managing all
aspects of its performance in the specific context of transition”. These authors found that the
performance management framework used by the Commercial Trade Union in Croatia closely
40
aligned to the strategic management process, thus maintaining the balance between competence
and the environment, as well as ensuring adequate asset allocation. According to these authors,
“the most important benefits of implementing strategy” through a BSC in a non-profit
organisation could be the “increased transparency, less sensitivity to crises and successful
focusing on the fundamental drivers of the social success and long-term sustainability”.
2.10.6 Balanced Scorecard and Motivation
In their empirical study of the effectiveness of the BSC, Malina and Selto (2001, p.47) found
a causal relationship between motivation and the beneficial effects of the BSC which included
“changes in processes and improvements in both the BSC and customer-oriented services”.
Malina and Selto (2001, p.53) suggested that “positive motivational impact induces managers
to exert effort” to achieve organisational goals. According to these authors, in order to
“promote positive motivation, an effective management control device” should consist of
firstly, “performance measures that reflect managers' controllable actions and/or influenceable
actions”, secondly “performance targets or appropriate benchmarks that are challenging but
attainable”, and finally “performance measures that are related to meaningful rewards”. The
study conducted by these authors provided “consistent evidence of causation” and supported
the “contention that perceptions of the BSC’s effective management control characteristics,
used in the study, led to effective motivation, strategic alignment, and then positive outcomes”.
Decoene and Bruggeman (2006, p.429) looked at developing and illustrating a “model of the
relationship between strategic alignment, motivation and organisational performance in a
BSC”. In their case study, these authors distinguished between intrinsic and extrinsic
motivation. Decoene and Bruggeman (2006, p.444) found that the “lack of strategic alignment
negatively impacted managers' intrinsic motivation to improve organisational performance”.
According to these authors, this was the direct result of a lack of cascading which led middle-
level manufacturing managers to perceive that their “performance measures in the
manufacturing-level BSC was uncontrollable”. These authors also found that the “linking of
bonus pay to the BSC performance index parameter further reduced the level of motivation” as
the “bonus pay of middle-level manufacturing managers and staff personnel was contingent on
corporate performance objectives rather than on manufacturing performance objectives”.

41
In addition, these authors found that a “top-down implemented BSC-based compensation plan
does not create positive motivation to improve organisational performance”. These authors
suggested that top management must be actively involved in a BSC design and implementation
process. Also, during the “BSC's cascading process, senior management should not issue
detailed instructions on how to achieve these functional-level performance objectives”
(Decoene & Bruggeman, 2006, p.445). This, according to these authors, will empower
managers and take advantage of the company’s personnel's specific knowledge and abilities to
improve organisational performance. According to these authors, this working method will
“intrinsically motivate manufacturing personnel to achieve higher levels of organisational
performance”. Finally, these authors suggested that a “BSC based compensation plan will
motivate manufacturing personnel extrinsically if meaningful rewards are linked to
performance measures that they can influence”.
Decoene and Bruggeman (2006, p.445) concluded that “effective strategic alignment
empowers and motivates manufacturing executives”. They also found that a “combination of
effective strategic alignment and a BSC-based compensation plan had a positive effect on the
extrinsic motivation of manufacturing executives” (Decoene & Bruggeman, 2006, p.445).
2.11 CRITICISM OF THE BALANCED SCORECARD
While the BSC model has been praised for the value it has added to management philosophies,
there are certain criticisms of the model. For example, Sharma (2009, p.14) suggested that the
BSC is not an easy tool to implement because of its subjectivity. According to this author, the
“measures that need to be taken in consideration are contingent upon the kind of environment,
industry and the business in which the organisation is engaged”. This author further suggests
that “the BSC has tried to bridge the gap that exists in most management systems, which is the
lack of a systematic process to implement and obtain feedback about the organisation’s
strategy”.
Butler, Letza and Neale (1997) also described the BSC model as being too general. Butler et
al. (1997) suggested that the BSC may not fit the organisational culture or jargon and that the
BSC may also ignore corporate missions. According to Butler et al. (1997, p.253), this may
42
occur “in situations where employees accept the company mission and where it may be better
to build metrics on that mission instead of importing an unfamiliar concept from outside the
company”.
2.11.1 Top-Down Approach
The Balanced Scorecard is often perceived as a Top-Down Approach. For example, Kanji and
e Sá (2002, p.17) found that the “interactions between the criteria are not clear, and that there
is an increased focus on customers and not on other stakeholders”. There is also no formal
implementation or communication process regarding the Balanced Scorecard (Kanji & e Sá,
2002). Kanji and e Sá (2002, p.26) believed that the “BSC does not adequately explain the
factors that lead to enhanced organisational performance, and the way they interrelate to each
other”. These authors suggested “building a framework that incorporates the important success
components and using a model to describe its entrenched relationship”.
Cokins (2005) and Tayler (2010) both suggested that manager and leadership involvement in
the selection of measures will increase the impact of the BSC. According to Cokins (2005,
p.67), leadership involvement in scorecard implementation generates “buy-in and ownership
of the scorecard and key performance indicators”. Tayler (2010, p.1095) similarly found that
“managers who are involved in selecting strategic initiatives perceive those initiatives as
having been more successful than managers who are not involved in the initiative-selection
process”.
According to Witcher and Chau (2008, p.111), for the “strategic balanced scorecard to work in
a company setting” and to develop “strategically linked priorities for use in daily management”,
executives have to focus the rest of the organisation “on those very few change objectives that
strategically matter most”. Witcher and Chua (2008, p.111) suggested that “strategically linked
objectives should take the form of handed down targets, but should be developed in the context
of the actual work being done in daily management”. The BSC, according to these authors,
puts stress on the measurement principle which, while it may work for the strategic aspect of
the BSC scorecard, does not work at operation level as it is “more important to develop
measures within the context of the means for the progression of a related objective”. These
43
authors cites “Tesco’s performance management scorecard the Steering Wheel” as an example
of where there is “no necessary vision-linked focus”. Instead, according to these authors, “the
purpose of the steering wheel is to condition how people work, rather than directly try to
influence what people should achieve”.
2.11.2 Lack of Communication and Implementation Issues
Lohman, Fortuin and Wouters (2004, p.275) also found that the balanced scorecard “did not
provide an opportunity to develop, communicate and implement strategy in a corporate
setting”. They suggested that although “BSC has been adopted widely by different industries,
there was no formal implementation methodology” (Lohman et al., 2004, p.275). These authors
believed that the “lack of formal implemented methodology and subjective measures often
leads to focusing on short-term financial measures”.
Another concern regarding the BSC was whether its implementation was practically feasible
for organisations. Although the BSC benefited organisations, it was not so easy to implement.
For example, Sharma (2009, p.14) suggested that the BSC “involved a lot of subjectivity and
is much more complex compared to the other tools”. According to the author, “the measures
that need to be taken into consideration are contingent upon the kind of environment, industry
and the business the organisation is in”.
2.11.3 Assumed Interrelationships between the Four Perspectives
One of the main criticisms of the BSC is its claim to possess strong casual interrelationships
between the four perspectives. However, Norreklit (2000, p.73) believed that such connection
may not be established. According to this author, when an organisation tries to satisfy very
loyal clients, these organisations generate no profit for the organisation as these “customers
possess abnormally high quality expectations and make very small purchases”. Typically,
according to this author, “there are individual clients of higher age and moderate budget who
demand high quality service”. Laitinen (1996) similarly highlighted the four BSC perspectives
and their interrelationships problematic. Laitinen (1996, p.16-17) suggested “that the measures,
in practical applications, appear to be only loosely connected to each other”. According to this
44
author, the BSC does not provide any indication about which “company-internal factors should
be developed to achieve success in the market place and in financial terms”.
While the BSC has had success in many companies, there are instances where its success has
been limited. For example, at Arran Ltd, the BSC was first introduced as a “performance
measurement tool for the Retail Division” (Cobbold, 2001, p.2). According to this author, the
measures chosen in the BSC were based on the “information needs of the division’s senior
managers”. The BSC, according to this author was initially successful and “met the firm’s
expectations and the initiative was considered as a success”. However, “the need for a more
organised performance management system drove wider changes in management style and
behaviour that was generally and persistently beneficial to the organisation” (Cobbold, 2001,
p.2). The result, according to this author was that “as the system was developed to include other
components of the organisation, the appropriateness of the Retail Division design and software
system was diminished i.e. these other BSC needed more appropriate Balanced Scorecard
designs and more flexible reporting systems”.
2.12 CHAPTER SUMMARY
The BSC has become one of the most utilised management tools in industry. According to
Sharma (2009, p.14), the BSC is a “very important strategic management tool which helps an
organisation not only to measure performance, but also decide/manage the strategies needed to
be adopted and/or modified so that the long-term goals are achieved”.
According to Kaplan and Norton (1992), the balanced scorecard allows managers to look at
their business from four important perspectives i.e. the financial perspective, customer
perspective, internal business perspective and innovation and learning perspective. There has
been mixed research supporting the interrelationships between the four perspectives, with
studies by Kaplan and Norton (1992), Fletcher and Smith (2004), and Chiang and Lin (2009)
supporting the interrelationships and studies by Norreklit (2000) and Bukh and Malmi (2005)
refuting the interrelationships.
45
The BSC has been proven to have significant consequences for organisations. Most
importantly, the proper implementation of the BSC has resulted in increasing organisational
performance. Studies by Kaplan and Norton (1996a), Rucci et al. (1998), Heskett et al. (1997)
and De Geuser et al. (2009) support this. The BSC has also influenced corporate identity (Kim
& Hatcher, 2008), has led to increases in positive psychology (Cravens et al., 2010) and
motivation (Malina & Selto, 2001 and Decoene & Bruggeman, 2006) , and has been successful
in non-profit organisations (Alfirević et al., 2005).
While the BSC model has been praised for the value it has added to management philosophies,
there are certain criticisms of the model (Sharma, 2009; and Kanji & e Sá, 2002 and Butler et
al., 1997). Regardless of these criticisms, the BSC still remains one of the most widely applied
performance management systems implemented today.
In the next chapter, a literature review on performance management will be discussed.
46
CHAPTER 3:
LITERATURE REVIEW: PERFORMANCE MANAGEMENT
3.1 INTRODUCTION
In this chapter, a literature review is presented pertaining to the Performance Management.
Firstly, the concept of job performance is discussed, followed by the conceptualisation of
performance. Secondly, the concept of performance management and its conceptualised is
discussed, followed by a discussion on performance measurement and the different
performance management models. Finally the benefits and consequences of performance
management is discussed.
Job performance is seen as imperative to the success of an organisation. How well employees
perform at their jobs significantly impacts on the performance of an organisation. According
to Mathis and Jackson (2000), job performance is a function of the capacity to perform, the
opportunity to perform, and the willingness to perform. Mathis and Jackson (2000) suggested
that the combination of these three factors may strongly motivate individual employees to
achieve the benchmarks set up by their organisations. Campbell, McCloy, Oppler and Sager
(1993) similarly believed that performance is important as they viewed it as a critical
determinant of individual, team and organisational effectiveness. According to Campbell et al.
(1993), any measure of performance should capture all aspects of behaviour that have value
for the organisation, while excluding aspects that are outside of the individual's control.
Porter and Lawler (1968) suggested that there are three types of performance i.e. the measure
of output rates, the measure of performance which involves ratings of individuals by someone
other than the person whose performance is being considered, and self-appraisal and self-
ratings. Therefore, according to Porter and Lawler (1968), the use of self-appraisal and self-
rating techniques are useful in encouraging employees to take an active role in setting his or
her own goals. These authors further suggested that an individual's effort only translates into
high job performance if the individual has a clear understanding of the ways in which it is
appropriate to direct that effort.
47
3.2 CONCEPTUALISATION OF PERFORMANCE
According to Otley (1999, p.364), “performance is an ambiguous term and capable of no simple
definition”, Muchinsky (2003, p.258) suggested that “job performance was the set of worker's
behaviours that can be monitored, measured, and assessed for achievement at the individual
level”. Harrison and Shaffer (2005, p.1458) believed that “job performance was an element of
the amount of energy and time” an employee devoted to their job.
Fitzgerald and Moon (1996, p.110) suggested that performance is a “multidimensional
construct i.e. consisting of more than one type of behaviour, the measurement of which varies,
depending on a variety of factors” that can be considered to comprise the performance. These
factors include the knowledge and skill possessed by the individual, as well as motivational
variables (Motowidlo, Borman, & Schmit, 1997). According to Motowidlo et al. (1997), if an
individual does not choose to apply that skill to the tasks at hand, all the skill in the world will
not result in performance behaviours.
In their study of expatriates and job performance, Harrison and Shaffer (2005) similarly
suggested that job performance was a multidimensional construct, and consisted of both a
contextual and a task dimension. According to Borman and Motowidlo (1993), task
performance consists of two types, namely, the transformation of raw materials to products and
services, while the other is to provide service and maintenance to assure the organisational
operation for production and service. On the other hand, according to these authors, contextual
performance is a set of interpersonal and volitional behaviours that support “the social and
motivational context in which organisational work is accomplished”. These authors suggested
that task performance adds value to the organisation through the technical core, while
contextual performance adds to the organisational goals by providing support to the society,
organisation, and psychological background.
Further development in the concept of job performance as a multidimensional construct
occurred when some researchers started to recognize the importance of adaptive employees in
the ever changing working environments. According to Pulakos, Arad, Donovan and
48
Plamondon (2000, p.613), the concept of adaptability had been discussed by many authors with
regard to “different phenomena at the individual, team, and organisational levels”. Pulakos et
al. (2000, p.617) presented an “eight-dimensional taxonomy of adaptive performance
consisting of, namely, handling emergencies or crisis situations; handling work stress; solving
problems creatively; dealing with uncertain and unpredictable work situations; learning work
tasks, technologies and procedures; demonstrating interpersonal adaptability; demonstrating
cultural adaptability; and demonstrating physically oriented adaptability”. These authors
similarly found that adaptive performance appeared to be a multidimensional construct, and
that the “profile of a job's adaptive performance requirements differ along the eight dimensions
identified in their model, thus indicating that the dimensions in their study appeared to represent
adaptive performance needs that exist across numerous other types of jobs”.
In their study to integrate performance concepts, Griffin, Neal, and Parker (2007) argued that
two principle changes, namely, increasing interdependence and uncertainty of work systems,
required an integrative model of different performance dimensions. Griffin et al. (2007)
classified three core performance dimensions i.e. proficiency – refers to the fulfilment of role
requirements that can be formalised; adaptivity – refers to the extent of adaptation to changes
at the workplace; and pro-activity – describes the extent of self-directed action necessary to
adapt to changes. According to these authors, individual task proficiency can be compared to
task performance, while adaptivity and pro-activity are especially important in uncertain
situations. Finally, these authors suggested that the three different types of behaviour indicated
above, should not be looked at as mutually exclusive, as their importance could vary, depending
on the uncertainty of the environment.
In the context of this study, all participates have the same set of skill requirements, their outputs
are similar, and the environment in which they are expected to operate is also similar. However,
one of the aims of this study is to determine whether their motivational reasons may be
different.
In the organisation on which the study is based, the performance expectations of the store
managers are to increase the sales of the store, while simultaneously manage their budgets and
49
costs. Managers are expected to drive their sales through excellent customer service, product
availability and knowledge, attractive store and product presentation, and most importantly, a
competent staff complement. The management of costs is also important, as the balance of
increasing sales and managing costs, impact on the store and the organisation’s profits. This
study explores the impact of the BSC on employee’s performance, and determines whether
using the BSC as a performance management system leads to an increase in the employees’
and organisation performance.
3.3 WHAT IS PERFORMANCE MANAGEMENT?
Managing employee and organisational performance is often seen as important to the success
of any organisation. Due to the importance of managing performance, performance
management definitions have evolved over the last few decades in response to the changing
work environment. In the 1990’s, for example, Rogers (1990, p.16) defined “performance
management as an integrated set of planning and review procedures, which cascades down
through the organisation to provide a link between each individual and the overall strategy of
the organisation”, while Edis (1995, p.3) referred to performance management “as any
integrated, systematic approach to improving organisational performance to achieve corporate
strategic aims and promote its mission and values”. Both these researchers identified the
importance of an integrated approach to managing performance, as opposed to a singular
activity.
According to Edis (1995, p.12), performance management was a “means through which
employees' performance could be improved by ensuring appropriate recognition and reward
for their efforts”, and by “improving communication, learning and working arrangements as
stipulated in the balanced scorecard model”. In addition to an integrated approach, Edis (1995)
suggested aligning performance management with monetary and non-monetary remuneration.
Armstrong and Baron (1998, p.7) saw performance management as a “strategic intent”, and
suggested that in order for it to be effective, it needed to be “concerned with the broader issues
facing the business, with the general direction in which it intended to go to achieve longer-term
goals”. According to these authors, performance management must also be “concerned with
development, as performance improvement is not achievable unless there are effective
50
processes of continuous development”. This view was earlier shared by Kaplan and Norton
(1996a), who initially suggested that balanced scorecard be used as a performance
measurement tool, but then saw its applicability as a strategic performance management tool.
In the 2000’s, Mondy, Noe and Premeaux (2002, p.308) saw performance management as an
integrated process “where a manager will work with employees to determine expectations,
measure and review results, and reward performance”. The aim of this, according to Mondy et
al. (2002), was to improve the employee’s performance, which in turn, will ultimately and
positively affect the organisation’s success. Although the definition of performance
management among researchers differs slightly, the most consistent factor of all the definitions
is the focus on an integrated system of managing performance.
In this study, the balanced scorecard is used as an integrated performance management system
to improve employee performance, while simultaneously trying to determine the intrinsic
motivational levels of employees. While there are many types of performance management
systems available, organisations need to determine which of these is most suitable to their
business environments. For this study, the organisation chose to use the BSC as a performance
management system. The rationale behind the choice of the BSC was that the organisation felt
that the BSC principles best aligned to the organisation’s business strategy. The business
strategy placed an emphasis on increasing sales and minimising costs. The four pillars of the
BSC aligned to the organisation’s KPI’s of sales growth (financial measures), customer service
(customer measure), inventory loss, manageable expenses and stock integrity (internal business
processes measures) and training and development (learning and growth measures).
The conceptualisation of performance management is discussed below.
3.4 CONCEPTUALISATION OF PERFORMANCE MANAGEMENT
Prior to the emergence of performance management, organisations focussed on performance
appraisal systems. Taylor (1911), having scientifically measured workers’ jobs, laid the
51
foundation for appraisal systems and believed that good workers should not be limited to their
rewards if their productivity was good. In the late 1950’s, McGregor (1957) suggested a shift
towards job performance by assessing goals, using Drucker’s (1954) management by
objectives principles. Over the next few years, there was an increased focus on employee
participation in improving employee and organisational performance. As a result of this focus,
the concept of performance management began to emerge.
Beer and Ruh (1976) first used the concept of ‘performance management’. Beer and Ruh (1976,
p.60) analysed a “performance management system” that was designed with the aim of
incorporating the strengths of Management by Objectives so that managers could better
“observe, evaluate and aid in improving the performance of subordinates”. Performance
management differed from the traditional appraisal system in that performance management
was about translating goals to results, where the focus is not only on individual employees, but
also on teams, programmes, processes and the organisation as a whole (Shamsi, 2010). Shamsi
(2010, p.80) suggested that performance management should have “a long term perspective,
with an emphasis on employee development and process improvement” integrated with
leadership development, succession planning, and training programmes.
During the 1980’s and 1990’s, as organisations adapted to changing internal and external
environments, Eccles (1991, p.131) suggested a performance measurement revolution would
take place where “senior executives will recognise that new strategies and competitive realities
demand new measurement systems”. According to Eccles (1991, p.131), there would be a “shift
from treating financials as the foundation for performance measurement, to treating them as
one of a broader set of measures. The introduction of the balanced scorecard by Kaplan and
Norton (1992) in the early 1990’s, was seen as one of the most revolutionary theories in
performance management at the time. Kaplan and Norton (1992)’s balanced scorecard (BSC)
was first proposed as a performance measurement tool. Kaplan and Norton’s BSC (1992, p.73-
77) consisted of “four perspectives, namely financial, internal business processes, customer,
and learning and growth, and was aimed at capturing both financial and value-creating
activities from the organisation’s intangible assets”. From initially been considered as a
performance measurement tool, these authors later proposed the BSC as a strategic
performance management tool, that could translate the organisation’s mission and strategy into
52
objectives and measures, as well as allow a balance between short-and long-term objectives.
Although not devoid of its critics, Kanji and e Sá (2002) criticized its top down approach, while
Norreklit (2000) was critical of the assumed relationship between the four perspectives, the
BSC still remains a popular performance management tools.
The shift in the late 1990’s until the 2000’s was towards seeing performance management as a
strategic imperative for organisations. This was indicated by the way Kaplan and Norton
(1996a) suggested a better alternative to using the balanced scorecard i.e. as a strategic
performance management tool. The new direction emphasised the importance of aligning and
developing employee performance to business performance. Armstrong and Baron (1998, p.7)
emphasised the “strategic and integrated nature of performance management” which they
believed “focused on increasing the effectiveness of organisations by improving the
performance of the people who work in them and by developing the capabilities of teams and
individual contributors”. Dessler (2005) similarly saw performance management as an
integrated strategic method which comprises multiple components such as appraisals, goal-
setting, and development. These, according to Dessler (2005), form a united and coherent
structure with a clear aim of aligning the individuals’ performance goals with the wider
objectives of the organisation. In this study, the BSC was used to manage performance as it
was hypothesised that it’s underlying four perspectives of financial, customer, internal business
process, and learning and growth could effectively lead to an improvement in the performance
of employee performance, and ultimately organisational performance.
The managers’ role in performance management has also been emphasised in recent years.
Managers play an integral part in ensuring organisational and individual success. According to
Stivers and Joyce (2000, p.22), “managers must play a major role in helping organisations
design and implement new performance management systems”. Specifically, according to
Strivers and Joyce (2000, p.22), managers can educate co-workers “about the importance of
performance management systems, assist the management team in gaining consensus on
strategic goals, help identify the financial and nonfinancial performance measures that are
linked directly to strategic goals, assist in the implementation of new performance management
systems, and review and update their performance management systems as necessary”.
53
3.5 PERFORMANCE MEASUREMENT
According to Simons (1995, p.5), performance measurement is a “formal, information-based
routine and procedures” the managers use “to maintain or alter patterns in organisational
activities”. Performance measurement is seen as an important component of performance
management. Garvin (1993, p.89) famously suggested that “if you can't measure it, you can't
manage it”. Performance management uses the information that performance measurement
provides on employee performance to manage and develop their future performance. In the
context of this study, performance measurement is critical to managing performance, as the
quantified performance data that the balanced scorecard provides for each employee, is used
to manage and develop future employee performance which in turn impacts on organisational
performance. Thus, as Saxena (2010) suggests, since performance measurement drives a
company or system towards favourable future goals and delivers solutions for management, it
can be considered principle indicator of performance management.
According to Lemieux-Charles, McGuire, Champagne, Barnsley, Cole and Sicotte (2003),
performance measurement indicates where change is required and which will, in turn, produce
the desired behaviour that will produce improved performance. Hopf, Pratsch, Executive,
Welch, Denett, Litman and Tychan (1999, p.35) suggested “that the results of performance
measurement will tell you what happened, not why it happened, or what to do about it”. These
authors further suggested that “performance measurement can provide the basis to assess how
well you are progressing towards your predetermined objectives, help identify areas of strength
and weakness, and decide on next steps, with the ultimate goal of improving organisational
performance”. By understanding where performance gaps are through measurement,
organisations can strategically devise business and learning initiatives to address those gaps.
The success of any performance management system is dependent on a quantifiable
performance measurement process. This is emphasised by Oakland (1993), who suggested that
in terms improving the quality and productivity within a company, performance measurement
has a key part to play. According to Oakland (1993), when organisation measure performance,
they ensure that the principles for determining comparisons are provided, the customer desires
are being met and that feedback for ensuring improvements are provided.
54
Many types of job measures are used to measure employee performance. These include, but
are not limited to, performance scorecards, performance rating scales and employee
productivity reports. According to Viswesvaran and Ones (2005), the measurement of
employee job performance was previously distinguished into organisational records and
subjective evaluations. Subjective evaluations, according to Viswesvaran and Ones (2005),
depends on human judgement and could include either ratings or rankings, while organisational
records could refer to direct measures of productivity and personnel data. However, the
introduction of the balanced scorecard allowed managers to look at a unique way of measuring
performance. According to Kaplan and Norton (1992, p.79), the combination of the BSC four
perspectives “helps managers understand many interrelationships”. This in turn, according to
these authors, “transcends the traditional notion about functional barriers” and ultimately
“leads to improved decision making and problem solving”. In the context of this study, Kaplan
and Norton’s balanced scorecard is seen as the most appropriate method to improve and
develop employee performance. The financial performance target required by the stores in the
study is dependent on non-financial components: customer service, seamless system processes,
and the technical competencies of the managers.
The inclusion of performance measurement as part of a comprehensive performance
management system, is seen as imperative in today’s competitive environment. The reason for
this, according to Eker and Eker (2009), is that organisations need to create value for both
shareholders and customers in a competitive environment. The best way to do this, according
to Eker and Eker (2009), is to continuously monitor activities and processes, compare standard
targets with actual results, reveal reasons for the deviations and perform necessary corrections,
and finally convey the organisation’s strategy to employees.
3.6 PERFORMANCE MANAGEMENT MODELS
According to Garr (2010, p.8), most organisations “typically use either a competitive
assessment or a coaching and development model of performance management”. This author
suggested that the “competitive assessment is based on the belief that by evaluating employees
against their goals and against one another, the company will encourage competition and foster
high performance”; while the “coaching and development model focuses on identifying
55
employees’ strengths and weaknesses, with the aim of coaching and developing them to
improve performance and retain the most talented.”.
Both models are “similar in terms of goal- and objective-setting, alignment between individual
goals and business goals, performance appraisal, and development and coaching” (Garr, 2010,
p.9). However, they differ in terms of priorities. The aim of the competitive assessment is to
reward top performers and weed out poor ones, while the underlying foundation of the coaching
and development model is strengths and weaknesses will be exposed through continuous
coaching; thus enhance performance.
Both models are not without criticism. According to Garr (2010, p.9), enthusiasts for the
“coaching and development model stress that it is not appropriate to compare employees to
each other due to the fact that job activities, responsibilities and goals differ significantly”.
Whilst, “enthusiasts of the competitive assessment model believe that it is not possible to create
a culture of high performance without comparing employees” (Garr, 2010, p.9).
According to O’Leonard (2009), a survey of both models revealed that neither is better that the
other as both have achieved similar results in organisations. The concern, according to
O’Leonard (2009), was not the models, but rather the activities that organisations set to support
employees reaching performance management outcomes. In this study, the coaching and
developing model was relied on. It was hypothesised that through continuous coaching,
training and development by using the balanced scorecard as a performance management
system, employees’ performance will improve.
Johnson et al. (2007, p.1-2) maintain that performance systems enable organisations to “plan,
measure, and control performance according to a pre-defined strategy”. There are numerous
performance management systems. However, the three most popular include the BSC, activity
based costs and the economic value add. These performance management systems are
discussed below.
56
3.6.1 The Balanced Scorecard (BSC)
According to Johnson, Beiman and Collaborative (2007, p.2), the BSC has been described as
the “most widely applied performance management system implemented today”. A reason for
this, according to these authors, is that “the BSC measures performance across a number of
different perspectives”, capturing “both leading and lagging performance measures, thereby
providing a more balanced view of company performance” as opposed to focusing on the
traditional lagging indicators which only include financial measures.
Kaplan and Norton (1992, p.72) initially proposed “the BSC as a performance measurement
tool consisting of four perspectives, namely financial, customer, internal business processes
and learning and growth”. However, Kaplan and Norton (1996a) then saw its value as a
performance management tool based on the assumption that the four perspectives have a
“cause-and-effect relationship”. According to Kaplan and Norton (1996a), managerial action
directed at improving the internal business, customer and learning and growth, will eventually
result in performance been driven towards improvement in the financial perspective.
The use of the BSC has increased substantially throughout the world. In 2005, “a study
conducted by Bain & Company on management tools stated that 57% of 960 international
executives reported using the BSC” (Rigby, 2005, p.13). In 2007, “this percentage increased
to 66% “, out of a sample of 1221 firms (Rigby, 2007, p.14).
As a performance management tool, the BSC has shown to have achieved success. For
example, in their study of 83 companies across different industries, Ling Sim and Chye Koh
(2001, p.25) found positive support for the BSC and suggested “that the BSC can be used as a
tool for monitoring the long-term value creation process”. De Geuser, Mooraj and Oyon (2009,
p.93) also found that the BSC improved the integration of the management processes and
empowered people”, as well as that sources of performance derived from the BSC come mainly
from “the strategic focus which consisted of three primary types i.e. a better translation of the
strategy into operational terms, the fact that strategizing becomes a continuous process, and the
greater alignment of various processes, services, competencies and units of an organisation”.
57
These authors also noted that when the BSC is used “to align resources to the strategic
objectives, it apparently leads to positive organisational performance”.
In this study, the BSC was used as it was hypothesised that if managers focused on the customer
perspective, business processes and training and development, it would lead to them meeting
and/or exceeding their financial targets.
3.6.2 Activity-Based Costs (ABC)
Cardos and Pete (2011, p.155) describe ABC as “one of the most important innovations in cost
calculation and managerial accounting”. According to these authors, “ABC was developed as
an approach to address problems associated with traditional cost management systems”. These
problems, according to these authors, related to their inability to “accurately determine actual
production and service costs, or to provide useful information for operating decisions” which
could expose “managers to making decisions based on inaccurate data”.
According to Cooper and Kaplan (1992, p.1), ABC systems “estimate the cost of resources
used in organisational processes to produce outputs”. Specifically, according to these authors,
“resources are assigned to activities, then activities are assigned to cost objects based on their
use”. Hughes and Gjerde (2003, p.23) say that ABC recognises the causal relationships of cost
drivers to activities, which “begins with the companies’ products, determines the activities used
in the production and delivery of those products, and computes the costs of various activities”.
According to these authors, “the costs of the activities used in the production of a product are
then assigned to that product in a manner that approximates a causal relationship”. This
relationship, according to Hughes and Gjerde (2003, p.23), causes ABC supporters to insist
that “ABC systems provide more useful information for cost management purposes than
traditional systems do”.
Companies that do not use the ABC, normally make “simple adjustments to allocate overhead
costs that do not accurately fit elsewhere” (Johnson et al., 2007, p.6). According to these
58
authors, companies that use the ABC, link related expenses to “resources supplied to the
company to the activities performed within the company”. As a result of ABC, “expenses are
allocated from resources to activities and then to products, services, and customers” (Johnson
& Beiman, 2007, p.6).
According to these Johnson and Beiman (2007, p.7), firms that “implement an ABC
methodology are able to:
1. Identify the most and least profitable customers, products, and channels
2. Determine the true contributors to (and detractors from) financial performance
3. More accurately predict costs, profits, and resource requirements associated with
changes in production volumes, organisational structure, and resource costs
4. More easily identify the root causes of poor financial performance
5. Better track costs of activities and work processes
6. Provide front-line managers with cost intelligence to drive improvements”.
According to Cooper and Kaplan (1992, p.12), “ABC systems contain two important insights,
firstly the activities performed by many resources are not demanded in proportion to the total
volume of units produced (or sold) i.e. the demands arise from the diversity and complexity of
the product and customer mix; and secondly the ABC systems are not models of how expenses
or spending vary in the short-run i.e. ABC systems estimate the costs of resources used to
perform activities for various outputs”. According to these authors, at any given time, “the
production of products and services, and their marketing, sale, and delivery to customers, create
a demand for organisational activities”. The capacity of the individual activity supplied to
outputs is valued by activity cost drivers, and by adding across the costs of all resources
supplied to achieve activities for individual outputs; thus the costs of resources used during the
period are estimated by the ABC model by all the organisation's outputs (Cooper & Kaplan,
1992).
59
3.6.3 Economic Value Added (EVA)
EVA was developed by US-based business consultants, Stern Stewart and Company, who
stated that “Earnings, earnings per share, and earnings growth are misleading measures of
corporate performance and the best practical periodic performance measure is economic value-
added. EVA is the financial performance measure that comes closer than any other to capturing
the true economic profit of an enterprise. EVA is also the “performance measure most directly
linked to the creation of shareholder wealth over time” (Stewart, 1991, p.66). Stewart (1994,
p.64) suggested that “the EVA is the single best measure of wealth creation on a
contemporaneous basis and is almost 50% better than its closest accounting-based competitor
in explaining changes in shareholder wealth”.
According to Johnson and Beiman (2007, p.8), the EVA is a “financial performance metric”
that is most specifically associated to the “creation of shareholder value over time”. These
authors suggested that the EVA calculation is the “net operating profit less an appropriate
charge for the opportunity cost of all capital invested in an enterprise”, with it’s the calculation
being “EVA = NOPAT-(CC x IC), Where EVA = Economic Value Added, NOPAT = Net
Operating Profit after Tax, CC = Cost of Capital, and IC = Invested Capital”. These authors
suggested that “the EVA is designed to give managers better information and motivation to
make decisions that will create the greatest shareholder wealth”.
Worthington and West (2001), suggested that the EVA system is widely used in many
countries, as well as being adopted for use in performance measurement and/or incentive
compensation packages. According to these authors, “Fortune Magazine has called the EVA
system today’s hottest financial idea, the real key to creating wealth, and a new way to find
bargains” (Worthington & West, 2001). Worthington and West (2001, p.5), cited an article by
Peter Drucker (1998) in the Harvard Business Review that suggested that the “EVA’s growing
popularity reflects, amongst other things, the demands of the information age for a measure of
total factor productivity”.
60
There are certain criticisms to the EVA process. According to Johnson and Beiman (2007, p.8),
the “EVA may cause managers to invest in less risky, cost-reducing activities rather than in
growth activities”. Also, according to these authors, “because it is a pure financial model, EVA
does not serve as a vehicle for articulating a strategy”. However, when the EVA is tied with
the BSC, it is suggested by these authors, that the adjustments between long-term growth goals
and short-term productivity improvements can be achieved. Finally, these authors suggested
that the “EVA is that it is a very complex framework” that relies on “complicated calculations”,
and this is mostly difficult to calculate and prone to errors that can lead to misleading results.
According to these authors the EVA may not be “easily understood by the majority of
employees” because of its multifaceted calculations and framework.
3.7 BENEFITS OF PERFORMANCE MANAGEMENT
According to Grigore, Bagu and Radu Catalina (2009, p.277), performance management
strategies aim to “provide the means through which better results can be obtained from the
organisation, teams and individuals by understanding and managing performance within an
agreed framework of planned goals, standards and competence requirements”. According to
these authors, “it involves the development of processes for establishing shared understanding
about what is to be achieved, and an approach to managing and developing people in a way
that increases the probability that it will be achieved in the short and longer term”.
Kandula (2006, p.5) suggests that the “purpose of performance management is to transform the
raw potential of human resource into performance by removing intermediate barriers as well
as by motivating and rejuvenating the human resource”. According to Stivers and Joyce (2001,
p.22), the performance management system is a “powerful behavioural tool”, where “what you
measure is what you get, and when the system includes the right measures, linked to the
organisation’s strategy, people are provided guidance for their actions”. According to these
authors, it is especially important “when the organisation faces environmental challenges,
implements improvement programmes, or alters its strategy”. According to Saxena (2010), an
imperative factor in the implementation of an effective performance management system is
when employees gain quality in their own performance, thus developing strengths that can be
applied across the organisation. Saxena (2010) suggested that when a performance process is
61
designed well enough, it will allow managers and leaders to bring out the best in people and
themselves through a well-defined process.
3.8 CONSEQUENCES OF PERFORMANCE MANAGEMENT
Performance management has numerous consequences for the organisation. Some of these
consequences are discussed below.
3.8.1 Performance Management and Effective Organisational Performance
Research indicates that the implementation of performance management systems has led to
increased organisational performance, identification of talent and service delivery. According
to Cochran, Campinas, Lobo and Lima (2001, p.64), a “well-designed performance
management process stimulates managers to develop high-quality strategic plans, set ambitious
targets, and track performance closely - all activities which help to achieve strategic objectives
and consequently, sustained value creation”.
Examples of the positive impact of a well-designed performance management system include
TRW and Caterpillar. According to Neary (2002), TRW, a global company with four key
businesses of more than $16 billion in annual revenues, decided to implement a comprehensive
performance management system in 2001. This was necessitated by the company’s heavy debt
load due to a large acquisition in the automotive business, as well as general market conditions
being depressed (Neary, 2002). According to Neary (2002), by using an effective performance
management system, managers were able to properly identify company talent throughout the
world more easily. Also, according to this author, managers could now review the
developmental needs of all of their employees in an instant as opposed to the months it took
previously.
Another example includes Caterpillar, who embarked on an ambitious strategy to grow
business targets by 50% within 5 years (Goh & Anderson, 2007, p.219). One of the capabilities
focused on to achieving these targets was managing people performance. According to these
62
authors, Caterpillar decided to implement a “well-defined performance management system
with the objective being to improve the performance of their people”. This strategy entailed
emphasizing goals, aligning “individual development goals, departmental business goals, and
overall business critical success factors” (Goh & Anderson, 2007, p.219). The success of the
performance management system was realized three months later, when, through the use of
focus groups, managers indicated numerous tangible and intangible benefits (Goh & Anderson,
2007). According to these authors, the tangible benefits included increases in personal
productivity, work group efficiency, quality and sales, and cost reductions, while the intangible
benefits included improved team work, greater consistency in how performance was managed,
increased focus on business goals, etc.
3.8.2 Performance Management and Effective Employee Engagement
According to Gatenby, Rees, Soane, and Truss (2009), employee engagement refers to the
opportunities available for employees and colleagues, and the employee and their managers
and the wider organisation to connect. These authors further suggested that employee
engagement is about establishing an atmosphere where people are motivated to connect, both
with their work and about doing a good job.
These authors described three stages that are integral in integrating performance management
with employee engagement. These three stages include performance agreements, engagement
facilitation, and performance and engagement appraisal and feedback (Gruman & Saks, 2011).
I. Performance Agreements
Gruman and Saks (2011, p.128-129) highlighted “two processes important in performance
agreements, namely, goal setting and psychological contracts.
1. Goal Setting - According to Gruman and Saks (2011), goals are extremely important
for initiating the employee engagement process because goals stimulate energy, focus,
and intensity or the feeling of engagement.

63
2. Psychological Contracts - Schaufeli and Salanova (2007) suggested that the failure of
an organisation to live up to its end of the contract constitutes a contract violation and
may produce numerous undesirable outcomes, including a reduction of employee
engagement”.
II. Engagement Facilitation
Gruman and Saks (2011, p.129-130) postulates that engagement facilitation focuses on
“identifying and providing employees with the resources they need to become engaged”. Four
processes were highlighted by these authors in the engagement facilitation stage, namely, ‘job
design, coaching and social support, leadership, and training.
1. Job Design - allowing employees to have a say in the design of their work, and the roles
and assignments they perform” is a form of engagement management. According to
these authors, “doing so will promote psychological meaningfulness and foster
engagement by better allowing employees to bring their true selves to their role
performance”.
2. Coaching and Social Support - fostering engagement, coaching should be an ongoing
process and not limited to quarterly or annual performance evaluations”.
3. Leadership - leaders who are high in task behaviour and support behaviour have been
shown to be particularly effective at promoting engagement. Transformational leaders
are particularly effective at producing engagement because they are inspiring and
visionary.
4. Training - one key to keeping employees engaged is to allow them to continue
developing throughout their careers”.
III. Performance and Engagement Appraisal and Feedback
According to Gruman and Saks (2011, p.131), employee engagement should “include an
assessment of an employee's engagement behaviour, such as, persistence, proactivity, role
expansion and adaptability, in addition to job performance”. These authors also suggested that
“for the purpose of enhancing engagement, trust and justice perceptions are especially
important”. Three processes were highlighted by these authors, namely, trust and justice,
64
engagement appraisal, and feedback. According to these authors, “in order for employees to
feel comfortable employing and expressing themselves fully during role performances, they
must trust that their organisation and managers will treat them fairly and justly”. Trust is
integral in employee engagement. According to Macey, Schneider, Barbera, and Young (2009,
p.20), “engagement cannot exist without trust as trust and fairness are the foundation for
employees to feel and act engaged”. According to Gruman and Saks (2011), positive
engagement appraisals and feedback was also likely to promote positive engagement and
performance.
3.8.3 Performance Management and Motivation
Motivation has strongly been linked to increased performance. Furnham (1997) suggested that
motivation was a concept defining what drives intensity, direction and human behaviour.
According to Furnham (1997), theories of motivation focus on what causes behaviour, and
understanding why individuals act in the way they do. Sobotka and Platts (2010, p.29) point
out that motivation theories may be “divided into two areas, namely, content theories and
process theories”. These authors suggested that “content theories examine what a person aims
to do and what motives are behind their particular behaviour, whilst process theories examine
how a particular behaviour is caused and how it is directed”. According to these authors,
content theories “show that performance measurement is not only a monitoring and control
mechanism for managers, but also appeals to employees' own sense of achievement”.
Atkinson and Shaw (2008) suggested the motivation theory was the foundation for the
fundamental theoretical basis of performance management; especially with regard to the theory
of goal-setting and theory of expectancy. According to Locke and Latham (1984), the goal-
setting theory states that the expectancy, instrumentality, and valence of outcomes will be high
if goals are difficult, as well as specific and attainable. Locke and Latham (1984) based this on
the supposition that a persons’ behaviour mirrors conscious goals, and intentions imply that the
persons’ efforts and performance in the organisation will be influenced by the goals assigned
and/or selected by the employees. Vroom’s (1964) theory of expectancy hypothesised that an
individual will change their behaviour according to their expected fulfilment in realising certain
goals. According to Atkinson and Shaw (2008), both Locke and Latham (1984) and Vroom’s
65
(1964) theories have important consequences for the development of performance management
systems.
Research indicates that people may be motivated to improve or increase performance either
through monetary or non-monetary reasons. Intrinsic motivation is used to describe people who
are motivated by non-monetary reasons, while extrinsic motivation describes people who are
motivated by rewards, incentives or other monetary reasons. According to Sobotka and Platts
(2010, p.30), intrinsic motivation refers to the “interest in and enjoyment of an activity for its
own sake while extrinsic motivation refers to behaviour or activity that is encouraged by a
reward based on some form of measurement”.
Examples of the impact of motivation on performance include DeNisi and Pritchard (2006)’s
study of performance appraisals, performance management and improving individual
performance. DeNisi and Pritchard (2006, p.262) found that their motivational model predicted
“how an employee will allocate effort across actions that will lead to performance
improvement”. According to these authors, “if an employee’s allocation will ultimately lead to
outcomes that result in need satisfaction, the employee will be motivated to continue to act in
the same way”. These authors suggested that the key for performance appraisal and
performance management “is to ensure that evaluations and outcomes are structured so that the
employee will focus his or her actions in the ways desired by the organisation, which will result
in the kind of performance that is needed”. These authors believed that as the employee realises
how their energies can lead to the preferred outcomes, their self-efficacy, job involvement, and
self-esteem will become heightened. Rabey (2001, p26), suggested that “ingredients of
motivation lie within us all”, and that “circumstances and situations will determine the stimulus
which will generate response – to drive forward, to withdraw or to wait for a further signal”.
According to this author, managers have the influence to determine employee compliance or
team commitment, with commitment being the desired outcome. Rabey (2001) suggests that
managers are the key in determining organisation effectiveness.
66
3.8.3.1 Motivation and Non-Monetary Incentives
According to Heinrich and Marschke (2010, p.191), there is a growing belief among
researchers that “individuals in organisations may be motivated to exert effort in their work by
something other than the monetary compensation they receive”. According to these authors,
“the implications of intrinsic, stewardship, or public-service motivations among employees are
that they derive intrinsic rewards from work” and will “exert more effort for the same (or a
lower) level of monetary compensation; and through their identification with the goals of the
principal or organisation, they are also more likely to take actions that are favourable to the
interests of the principal”.
Performance management has become critical to the sustainability of many organisations.
Managing and developing key talent in the face of internal and global competition has resulted
in many organisations re-evaluating their talent management strategy. Performance
management is at the apex of this strategy. According to Neary (2002), imperative to any large
multinational company is effective employee performance management and professional
development. Shamsi (2010, p.79) also suggested that appraising employees “on the basis of
their performance” will instil “motivation in them to excel in their work”, which in turn, will
increase the productivity of the organisation.
3.8.4 Performance Management and Rewards
There has been mixed research regarding the use of incentives to motivate performance. For
example, Pearce, Stevenson and Perry (1985) found that merit pay programmes had no effect
on organisation performance. Pearce et al. (1985, p.261) also inferred that “the use of incentives
had no motivation effects”. A review by Heneman (1990, p.245) concluded that the “results to
date on the relationship between merit pay and subsequent motivation and performance are not
encouraging”. A meta-analyses by Deci, Koestner, and Ryan (2001, 15) showed “mixed
findings on the effects of performance incentives, depending on the scale of rewards and
competition for them, the extent to which they limit autonomy, and the level of difficulty in
meeting performance goals”.
67
3.8.4.1 Intrinsic Rewards
According to Atkinson and Shaw (2008), performance management systems in combination
with other HR systems provide employees with an opportunity to identify their learning needs,
as well to obtain advice on career opportunities. Therefore, according to these authors, a
performance management system that has a learning aim is will tend to be more effective in
conveying intrinsic rewards to employees involved. However, these authors stressed that while
this may be evident in Western cultures, in other cultures this may not be the case due to
differences in their learning approach to performance management.
3.8.4.2 Financial Reward
Atkinson and Shaw (2008) suggested that performance management is driven by goals, and
uses objectives, rewards, and competencies to achieve these goals. According to Lawler (1990),
there needs to be a distinctive field of vision between achievement and reward. This premise,
according to Atkinson and Shaw (2008), is derived from Vroom’s (1964) expectancy theory
“where motivation only occurs when people expect that they will get worthwhile rewards for
their effort and contribution”. Although many researchers question the effectiveness of a pay
for performance strategy where motivation is used to achieve high levels of performance, some
have found evidence of its positive impact. For example, Kahn and Sherer (1990, p.119) found
that a company’s bonus system should be targeted towards “a select group of high performing
managers”. These authors also found that higher performance levels are associated with those
managers “for whom the impact of performance on bonus is high” compared to other managers.
3.8.5 Performance Management and Organisational Culture
According to Owens (1987), Organisational culture can be seen as patterns of shared values
and beliefs over a period that develops behavioural norms that are implemented in problem
solving. Schein (1985) defines organisational culture as the contextual structure composed of
a series of presumptions for firms. According to Schein (1985), this contextual structure might
be invented or established by a certain group to deal with issues encountered during the
processes of outside adaptation and realization of inside integration.
68
Kandula (2006) suggested that good performance is the crucial component to a strong culture.
According to Kandula (2006), a differences in culture between organisations will produce
different results, even if they have the same strategy, operate in the same industry, and are
located in the same environment. This author further suggested that strong and positive cultures
“can make an average individual perform and achieve brilliantly whereas a negative and weak
culture may demotivate an outstanding employee to underperform who will end up with no
achievement”.
3.8.6 Performance Management and Diversity
Research has suggested that diversity can affect employee behaviour with regard to
performance outcomes. Jehn and Bezrukova (2004, p.706) suggested that “people-oriented
workgroup environments emphasising collective and group work can actually facilitate the
alignment of actions of diverse employees with desired performance outcomes”. Jehn and
Bezrukova (2004, p.703) found that “members of groups diverse in functional background
were more likely to have higher levels of composite bonuses in the departments that cultivated
people-oriented organisational”. According to these authors, a possible explanation is that
“group members in such environments may be less likely to categorise themselves based on
their functional background and accompanying social status” and more likely to be concerned
with the success of the group. However, these authors found no results in a competitive
environment with regard to diverse groups. According to these authors, a probably explanation
for this could be “competition-oriented cultures do not moderate the effect of group diversity
on performance” and that “individualistic values can be inherently in conflict with the synergy
usually generated out of group work”. These authors’ overall suggestion was that managers
should capitalise on differences in certain diversities, if the suitable employee working
environment is considered.
Researchers, such as Eker and Eker (2009) and Srinivasa Rao (2007), have suggested that
performance measures differentiate in different cultures. According to Eker and Eker (2009),
since control cultures consider values like stability, hierarchy and formality, measures are often
financial, whilst in flexible cultures, change, adaptation, and creativity are some evident values.
69
Based on this differentiation, these authors suggested that performance measures are used for
different aims.
Eker and Eker (2009, p.69) studied the relationship between organisational culture and
performance measurement systems in the Turkish Business environment. These authors found
that there was a “positive and significant relationship between the flexibility valued by firms
and the use of performance management for organisational attention and strategic decision
making”. Furthermore, these authors found that organisational strategies take into
consideration the use of “multiple performance measurement systems to focus organisational
attention and to support strategic decision making” is necessary to follow up the changes in an
organisational culture which was directed by flexibility value.
Srinivasa Rao (2007) studied the effectiveness of the performance management systems in
selected Indian companies. Srinivasa Rao’s (2007, p.1812) study focused on “the factors
responsible for effectiveness of the performance management systems and its alignment with
organisation goals”. Srinivasa Rao (2007, p.1812) found that “managers having good academic
backgrounds with high profiles are effective implementers of the system”, and that “personality
characteristic and consequences, such as system discipline, exposure to the system, effective
interpersonal relations and team working are essentially required for the effective
implementation of the system”. This author suggested that it is responsibility of dedicated
individuals for in achieving individual goals and aligning to their departmental objectives.
According to this author, “individuals must constantly solicit performance feedback and
coaching from their seniors and also clarify performance measurement related issues”.
3.9 CHAPTER SUMMARY
In this chapter the concept of job performance and performance management was discussed.
The research indicated that effective performance management significantly contributes to
organisation success. According to Ana-Maria, Constantin and Cătălina (2009), organisations
that have implemented a performance management system, and are using it, perform better,
70
both financially and non-financially, than organisations that are less performance
management driven.
The conceptualisation of performance management was discussed, where the term
‘performance management’ was first coined by Beer and Ruh (1976). The late 1990’s saw
performance management being seen as a strategic management initiative, which resulted in
Dessler (2005) described performance management as an integrated strategic process that
combines performance appraisal, goal-setting, and development into a comprehensive
framework with the specific goal of aligning the individual’s performance with the
organisation’s broader objectives.
The need for effective performance management systems gave rise to several performance
management models. Some of the most popular included the Balanced Scorecard (BSC),
Activity-Based Cost and the Economic Value Add. The BSC is often regarded as the most
popular performance management systems in use today, and forms the basis of this study.
Research indicates that these performance management systems, when implemented correctly,
have significantly contributed to the success of organisations.
There are several positive consequences of performance management. These include effective
performance, employee engagement and motivation. Studies have shown that the successful
design and implementation of a performance management system, aligned with employee
needs and the strategy of the organisation, leads to a positive effect on organisations.
Research has been mixed regarding the use of incentives to motivate performance. Some
researchers believe that there is no relationship between incentives and performance, while
others have suggested that pay-for-performance significantly affects performance. Research
also indicates that performance management systems impact on employees and the
organisations differently, depending on organisational culture and the diversity of the
organisation.

71
Yet, despite all the criticisms of performance management, the overwhelming evidence
indicates that the successful design and implementation of a performance management system
leads to organisational success and employee well-being.
In the next chapter, a literature review on motivation will be discussed.
72
CHAPTER 4:
LITERATURE REVIEW: MOTIVATION
4.1 INTRODUCTION
This chapter deals with the concept of motivation. In this chapter, a literature review is
presented pertaining to the concept of Motivation. Firstly, an introduction to motivation and
work motivation is presented, followed by its conceptualisation and importance. Secondly,
both extrinsic and intrinsic motivation is discussed, followed by an examination of the different
theories of motivation. Finally, the benefits and consequences of motivation is discussed.
Over the years, numerous principles and theories have been proposed regarding motivation.
According to Young (1950), some of the major research concerns of the 1940’s and 1950’s era
were activity level, appetites and aversions, incentives, defence mechanisms. These topics were
mainly associated with the motivational drive theory (Young, 1950). In the 1940’s, Hull (1943)
suggested that it was a physiological deficit or a need that instigated organisms to undertake
behaviours that resulted in the offset of a need. Hull (1943) suggested that in order for prior
associations to be displayed, there had to be some unsatisfactory need that in turn produced a
drive to action. This drive, according to Hull (1943), which resulted from physiological
disequilibrium, instigated behaviours that returned the organism to a state of equilibrium.
Between 1935 and 1960, Kurt Lewin’s field theory was prominent. Lewin (1935) suggested
that the motivational force on a person to reach an environmental goal is determined by three
factors i.e. the magnitude of the need, the properties of the goal, and the psychological distance
of the person from the goal. According to Lewin (1935), when a person experiences a need, or
intent, he or she is in a state of tension. However, when the goal is attained, the tension is
eliminated (Lewin, 1935). Lewin (1935) also suggested that the intent to complete a task or
solve a problem similarly produced states of tension.
Towards the mid-21st century, the concept of the Expectancy Theory began to take prominence.
These included Atkinson’s (1957) Theory of Achievement and Rotter’s (1954) Social Learning
Theory. Atkinson (1957; p.371) suggested that the “tendency to approach an achievement-
related goal was the product of three factors, namely, the need for achievement, the probability
73
that one will be successful at the task, and the incentive value of success”. Rotter’s (1954)
Social Learning Theory focused on the choices that people made when confronted with a
number of possible alternative ways to behave.
With regard to work motivation, different theories similarly arose. The most popular theories
focused on theories of arousal and theories of choice. Theories of arousal emphasize needs,
while theories of choice focused on behaviour. According to Mitchell (1982, p.84), the theories
that emphasize individual or group needs all hypothesized “that the arousal process is due to
need deficiencies”. In other words, “people want certain things in their jobs and they will work
to fulfil those needs” (Mitchell, 1982, p.84). According to this author, the two major
implications of this research was that these theories clearly “recognized and made central the
idea of individual differences”, and that organisations had generally overlooked upper level
needs. Some of these theorists included Maslow’s (1943) Hierarchy of Needs Theory,
Herzberg, Mausner, and Snyderman’s (1959) Motivation and Hygiene, and McClelland's
(1961) Need for Achievement. According to Mitchell (1982, p.84), these theorists suggested
that organisations “spend much more time being concerned with the fulfilment of lower level
needs than with the fulfilment of upper level needs”.
Vroom’s (1964)’s Expectancy theory, Locke and Latham (2002)’s Goal Setting Theory, and
Adam’s (1963)’s Equity theory were examples of behavioural choice. Locke (1978, p.598)
suggested “that people work harder with goals than without goals, and that this was especially
true if the goals are specific and difficult and if feedback exists”. According to Vroom (1964),
perceptions, attitudes, and beliefs result in people choosing particular courses of action. These
perceptions, actions and beliefs are the result of their yearnings to avoid pain and enhance
pleasure. Adams’ (1963) equity theory explored the motivational effects of distributive justice.
The equity theory was based on the comparisons between the outputs and inputs oneself versus
others. Greenberg (2000) expanded on Adams’ (1965) theory through a study of procedural
justice, and stressed the importance employee satisfaction based on the methods by which
organisational decisions affecting employees are made.
According to Mitchell (1982, p.85), the most striking difference between the theories of choice
and theories of behaviour “is the basic underlying motivational mechanism” assumed as the
cause of behaviour. These are “intentions to reach a goal, the expectations of maximum payoff,
past reinforcement histories, and a desire for fairness” (Mitchell, 1982, p.85). Also, according
74
to this author, the expectancy and equity theory define motivation as directly influenced “by
outcomes”, while the goal setting theory sees “outcomes as indirectly influencing motivation
through goal level and intentions”. The similarities, according to this author, were that all four
approaches define “motivation as an individual, intentional process”.
Cognitive motivational theories such as Bandura’s (1982) Self-Efficiency Theory, Weiner’s
(1985) Attribution Theory, and Deci and Ryan’s (1985) Self-Determination Theory involve
intrinsic and extrinsic factors, as well as past and current information. Bandura (1982)’s self-
efficacy theory proposes that employees with positive beliefs about their ability to perform
successfully are more likely to attempt and persist at difficult tasks, while Weiner’s (1985)
attribution theory suggest that motivation is best represented as a temporal process initiated
with an event and ending with some behaviour or behavioural intention. One of the popular
cognitive theories is Deci and Ryan’s (1985) self-determination theory. According to Ryan and
Deci (2000, p.68), “the self-determination theory proposes that people’s actions are driven by
three core needs i.e. the need for autonomy, the need for competence and the need for
relatedness”. These authors suggested that if “an individual’s experience of autonomy,
competence, and relatedness” are supported, then this could lead to the “most volitional and
high quality forms of motivation and engagement for activities, including enhanced
performance, persistence, and creativity”. However, according to these authors, if any of these
three psychological needs are not supported, or if they are thwarted “within a social context,
this will have a robust detrimental impact on wellness in that setting”.
Other popular theories of motivation that have also evolved included Porter and Miles’ (1974)
classification system and Hackman and Oldman’s (1980) job enrichment. Herzberg et al.
(1959)’s theory of work satisfaction primarily focused on sources of work satisfaction and how
jobs can be designed to create enrichment and challenge in the work. Extending on Herzberg's
et al. (1959) work, Hackman and Oldham (1980) postulated a model focusing on psychological
processes and certain work characteristics that intend to increase motivation and the
satisfaction of the employee to excel. The theory of job enrichment, according to Hackman and
Oldham's (1980), suggested that a job that is enriched is only motivating to those employees
that high a high need for growth.
The next paragraph discusses the different meanings and definitions of motivation as
understood by different theorists.
75
4.2 CONCEPTUALISATION OF MOTIVATION
These are several definitions of motivation that have evolved over the years. According to
Perry and Porter (1982, p.29), motivation usually stands for that which “energizes, directs, and
sustains behaviour”. Perry and Porter (1982) suggested that motivation is the degree and type
of effort that an individual exhibits in a behavioural situation; but cautioned not to equate
motivation simply with sheer amount of effort as it also has to do with the direction and quality
of that effort. According to Mitchell (1982, p.81), people in non-academia would probably
“describe motivation as the degree to which an individual wants and tries hard to do well at a
particular task or job”.
According to Maslow (1943), sources of motivation are the result of unsatisfied needs, whilst
the impact of a satisfied need creates no tension and thus no motivation. Vroom (1964, p.6)
defined “motivation as a process governing choices made by persons among alternative forms
of voluntary activity”, while according to Dessler (1986, p.332), most psychologists “believe
that all motivation is ultimately derived from a tension that results when one or more of our
important needs are unsatisfied”.
Early motivational theorists, such as Atkinson (1964), viewed overall motivation as the product
of two key components: motives and expectancies. According to Atkinson (1964), motives are
dispositions to approach or avoid certain behaviours; they are thought to be developed in
childhood and to remain fairly stable throughout life. Extensions of Atkinson's (1964) original
motivational framework expanded the theory to account for motivation toward actions related
to outcomes in the distant future; this accounting suggests that motivation is intensified when
an activity is viewed as having not only immediate consequences, but also future payoffs
(Atkinson 1964). This motivation, according to Atkinson (1964), could result from an
expectancy of achieving success in the training activities themselves, or from expectancy that
the training will pay off in future earnings.
More definitions of motivation include Robbins (1993, p.205), who defined “motivation as the
willingness to exert high levels of effort towards organisational goals, conditioned by the
efforts ability to satisfy some individual need”. A need in this context refers to an “internal
state that makes certain outcomes appear unattractive” while an “unsatisfied need creates
tension that stimulates drives within the individual” (Robbins, 1993, p.205). Mitchell (1997:
60) describes motivation as psychological processes involving “arousal, direction, intensity,
76
and persistence of voluntary actions that are goal directed.” According to this author, arousal
refers to the “motivational process of being interested in a given goal, while direction is the
process of actually selecting a goal and choosing to pursue it”. Intensity relates to the “amount
of effort that one puts forth in pursuit of the goal” (Mitchell, 1997, p.60). Therefore motivation,
according to this author, relates to what we “choose to pursue (arousal and direction) and how
we pursue it (intensity and persistence)”.
Locke and Latham (2004, p.388) further described the concept of motivation as “the internal
factors that impel action and the external factors that can act as inducements to action”.
According to Locke and Latham (2004), the three areas of action that can influence motivation
are direction, intensity and duration. These authors suggested that motivation can affect “not
only the acquisition of people's skills and abilities but also how and to what extent they utilize
their skills and abilities”.
According to Wright (2004), there is no single, accepted theory that currently exists that can
fully and accurately explain motivation. Research addressing motivation has produced varied
and often inconsistent results which have been a source of frustration to managers who want to
design better ways to motivate employees (Wright, 2004).
The next paragraph discusses motivation, specifically in the organisational setting.
4.3 WORK MOTIVATION
According to Locke and Latham (2004, p.388), work motivation has been of “interest to
industrial and organisational psychologists at least since the 1930s”, inspired by the Hawthorne
studies. These studies focused mainly on the “effects of supervision, incentives, and working
conditions” (Locke & Latham, 2004, p.388). However, according to these authors, “it was not
until 1964 that Vroom made the first attempt to formulate an overarching theory” which he
referred to as the ‘valence-instrumentality expectancy model.’
According to Campbell and Pritchard (1976, p.112-114), work motivation has “typically been
described within the organisational behaviour literature as the set of psychological processes
that cause the initiation, direction, intensity, and persistence of behaviour”. Steers and Porter
(1983, p.637) described work motivation as that “which energizes, directs and sustains
77
behaviour”. Motivation, according to Campbell and Pritchard (1976), is concerned with the
direction, arousal, amplitude, and persistence of an individual's behaviour (Campbell &
Pritchard, 1976). London (1983, p.620) says that “work motivation is a construct that generally
refers to motivation to do one's current job”. According to this author, “managerial motivation”
refers to the “desire to engage in and meet managerial role requirements”, while career
motivation “encompasses the terms work motivation and managerial motivation, and goes
further to include motivation associated with a wide range of career decisions and behaviours”.
London (1983) suggested that these “include searching for and accepting a job, deciding to stay
with an organisation, revising one's career plans, seeking training and new job experiences, and
setting and trying to accomplish career goals”.
Many theories regarding factors that affect workers' motivation in organisations have been
posited and tested. Porter and Miles (1974) divided these theories into four classes. According
to these authors the first is individual characteristics, followed by job characteristic. This was
followed by environment characteristics, and finally external environment characteristics
(Porter & Miles, 1974). According to these authors, individual characteristics focused on what
individual characteristics a person brought to the work situation, while job characteristics
referred to the “nature of the job or the collection of tasks that comprise the job”. Work
environment characteristics referred to the variables dealing with work environment
characteristics that can be changed or modified to impact motivation and included two
subcategories of immediate work environment characteristics and organisational actions
(Porter & Miles, 1974). The last variable that can affect employee motivation, according to
these authors, is the external environment which refers to the changes or the anticipation of
changes in the external environment that can have powerful impacts on individuals' behaviour
in work organisations. According to these authors, in order to affect a change in motivation,
there needs to be a change in one or more of these variables.
From a theoretical perspective, there has been a keen focus by researchers to determine the
factors that energise, direct, and sustain work-related behaviour. According to Ellemers, De
Gilder and Haslam (2004, p.459), these researchers aim to understand which “conditions
encourage people to invest behavioural energy in their work (energize); which activities people
are likely to focus their efforts on (direction); and what makes people persist in such efforts
over time (persistence)”. This has resulted, according to these authors, in the development of a
“range of work motivation models that show how the different aspects of motivation operate,
78
as well as how they are interrelated”. According to these authors, these motivational models
speak to energizing aspects, stipulating what causes workers to be motivated by appealing to
their particular needs, and relating the needs that may be satisfied by work-related behaviour.
Other needs provide awareness into the work-related efforts that are likely to take place by
exploring cognitive processes that underlie behavioural choices (Ellemers et al., 2004). The
reinforcement theories, according to these authors, are based on psychological learning
principles and “help us understand why certain behaviours are more likely to be sustained than
others”. Theories, like the goal setting theory, address multiple components of the motivation
process, namely persistence and motivational direction.
The following paragraph discusses the importance of motivation in organisations and the
impact it has had on employees.
4.4. IMPORTANCE OF MOTIVATION
Vroom (1964) posited through his expectancy theory that people are most likely to participate
in actions that lead to valued outcomes, if they perceive that they can effectively display such
behaviours. Therefore, according to Kuvaas (2006, p.367), if financial incentives are
“perceived as valuable and that increased performance is expected to lead to outcomes that are
believed to result in financial rewards, financial rewards should enhance performance through
increased extrinsic motivation and effort”. Furthermore, according to Kuvaas (2006, p.367),
the reinforcement theory basically “predicts that tying money to performance will reinforce
performance”. Therefore, these authors suggested monetary remunerations can be successful
in directing the behaviour of employees at what is needed to get the remuneration, to such a
degree that there exists the potential for individuals to receive a visible increase in their salaries.
Motivation has been seen as been pivotal in increasing the performance of individuals and the
efficiency of organisations. According to Scott and Hart (1979), the principle of rationality is
used by most organisations, where the main focus in management is to increase the proficiency
by ensuring greatest output at the lowest cost. Therefore, Scott and Hart (1979) suggested that
those behaviours that encourages an increase in efficiency, will be the behaviours that
organisations will encourage. Examples of these behaviours include coming to work, being
punctual, or exerting a lot of effort.

79
Cherniss and Kane (1987) suggested then when managers are able to know what motivates
employees, they will be more effective at improving performance, maximizing productivity,
and advancing the notion of organisational accountability. Both Kovach (1987) and Harpaz
(1990) conducted research focused on identifying the ranked importance of motivational
factors in the workplace, While Kovach (1987) found that interesting work, full appreciation,
and feeling of being on top of things were ranked highest; Harpaz (1990) found that interesting
work, good wages, and job security was the highest. A study by Lindner (1998) similarly
ranked interesting work as the highest, with good wages and full appreciation of work the next
in line. Based on his study, Lindner (1998, p.1) suggested that “carefully designed reward
systems must include job enlargement, job enrichment, promotions, internal and external
stipends, monetary, and non-monetary compensation” as initiatives to increase employee
motivation.
In recent years, many studies have shown the importance of motivation in organisational
settings. These studies have focused on the relationship of motivation in influencing job
satisfaction, career success and performance. For example, Furnham, Eracleous and Camorro-
Premuzic (2009) found that both intrinsic and extrinsic motivation, was correlated to job
satisfaction which was also significantly associated with conscientiousness, while Wayne,
Liden, Kraimer, and Graf (1999, p.590) found that two of the motivational factors were related
to career outcomes i.e. the desire for mobility was positively related to salary progression, but
“negatively related to career satisfaction, while career planning was significantly related to
career satisfaction”. The relationship between motivation and these factors is discussed in more
detail later in this chapter.
4.5 INTRINSIC AND EXTRINSIC MOTIVATION
A model of intrinsic and extrinsic work motivation was first proposed by Porter and Lawler
(1968). According to Gagné and Deci (2005, p.331), “intrinsic motivation involves people
doing an activity because they find it interesting and derive spontaneous satisfaction from the
activity itself”. Extrinsic motivation, on the other hand, “requires an instrumentality between
the activity and some separable consequences, such as tangible or verbal rewards” (Gagné &
Deci, 2005, p.331). According to these authors, “extrinsic motivation satisfaction comes not
from the activity itself, but rather from the extrinsic consequences to which the activity leads”.
According to Porter and Lawler (1968), the realignment of the workplace can induce effective
performance, which may lead to both intrinsic and extrinsic rewards that can produce total job
80
satisfaction. In order to do this, according to these authors, one had to “enlarge jobs to make
them more interesting and thus more intrinsically rewarding, and by making extrinsic rewards,
such as, higher pay and promotions, clearly contingent upon effective performance”.
4.5.1 Intrinsic Motivation
According to Lawler, Hackman and Kaufman (1973), intrinsic motivation refers to the degree
to which employees are motivated. Vallerand (1997) suggested that the motivation to perform
an activity in order to experience the pleasure and satisfaction inherent in the activity is an
example of intrinsic motivation. Deci (1975) believed that people are intrinsically motivated
when they engage in a task for no apparent reward other than the task itself. According to
Lambert (1991, p.343), “intrinsic motivation is primarily determined by the intrinsic properties
of the jobs workers perform”, which are similar to job satisfaction and job involvement.
Lambert (1991, p.343) further suggested that in contrast to both job involvement and job
satisfaction, extrinsic characteristics are not seen to impact on intrinsic motivation directly, and
“that certain levels of extrinsic rewards and comforts are necessary for a job to achieve its
motivating potential”. However, according to Lambert (1991), the job characteristics of
extrinsic motivation are not deemed adequately enough to determine intrinsic motivation.
According to Hackman and Oldman (1980), workers show a greater tendency to react
positively to potentially motivating jobs. Hackman and Oldman (1980) found that workers high
in “growth need strength” i.e. learning, develop themselves beyond where they are now and
react more favourably to jobs “high in motivating potential” than workers with “low growth
need strength”. The difficulty of goals is seen as an important factor in driving intrinsic
motivation. This relationship is described below.
4.5.1.1 Goal Difficulty
According to Shalley and Oldham (1985, p.553), “goal difficulty and evaluative context
combine to influence intrinsic motivation”. These authors found that “individuals who were
assigned an easy goal and expected a performance evaluation exhibited high intrinsic
motivation”, but those in the “remaining experimental conditions, which included easy goal/no
evaluation, hard goal/evaluation, and hard goal/no evaluation”, exhibited fairly low intrinsic
motivation. According to these authors, intrinsic motivation was affected by goal difficulty and
external evaluation; mainly by their effect on the info related to the competencies individuals
receive”. Therefore, according to these authors, “high intrinsic motivation was exhibited in the
easy goal/evaluation condition because most individuals attained the goal and therefore

81
anticipated positive feedback from an external evaluator concerning their competence”.
Contrary to this, the authors found that where individuals were unable to attain their goals and
anticipated no positive feedback on their own competence, such employees experienced fairly
low intrinsic motivation in difficult goal conditions. According to these authors, “individuals
in the easy goal/no evaluation condition also exhibited low intrinsic motivation because they
did not anticipate positive feedback from an external evaluator”.
However, research by Shalley, Oldham and Porac (1987, p.553) found that only the method of
setting goals has an effect on individuals' intrinsic motivation to perform a task, and that “goal
difficulty and expected external evaluation” had no effect on the measure of intrinsic
motivation. These authors posit that a possible answer for this was the differences in the goal-
difficulty manipulation used in the two studies i.e. in the later study subjects were told their
practice times and what percentage of the practice time the goal represented. Therefore,
according to these authors, failure to achieve the goal and expecting negative feedback for non-
attainment may have had little effect on intrinsic motivation, since subjects were able to
contrast their goal performance with alternative standards based on performance in a practice
trial.
4.5.2 Extrinsic Motivation
According to Porter and Lawler (1968), in order for there to be extrinsic motivation, it requires
an action between the activity and some separable consequences, so that satisfaction comes
from the extrinsic consequences to which the activity leads, and not the activity itself. Ke and
Zwang (2009, p.787) suggested that “when an individual acts with external motivation, he or
she has the intention of obtaining a desired consequence or avoiding an undesired one”. As
such, “they are energized into action only when the action is instrumental to those ends” (Ke
& Zwang, 2009, p.787). Ryan and Deci (2000) suggested that extrinsic rewards can diminish
intrinsic motivation. Ryan and Deci (2000, p.70) suggested that rewards linked to the
completion of a “task, threats, deadlines and directives undermine intrinsic motivation because
individuals perceive them as behaviour control techniques”.
According to Igun (2008, p.275), extrinsic motivation encompasses using “external rewards
such as increased wages/salaries, promotion and credits for work well done, monetary
rewards and public recognition through reward”. In his study of extrinsic motivation and
work attitudes, Igun (2008) found that extrinsic motivation correlated with the work attitudes
82
of his sample and “suggested that promotion and enhanced salary income can effectively
promote work attitudes”. In a more recent study looking at the effectiveness of both intrinsic
and extrinsic factors on motivation, Çınar, Bektaş and Aslan (2011) found that both intrinsic
and extrinsic factors affect workers while they achieve their tasks. However, Çınar et al.
(2011) found that intrinsic factors were more motivating than extrinsic factors.
4.5.3 Effect of Extrinsic Motivation on Intrinsic Motivation
Early studies by Deci (1971, p.114) found that “tangible extrinsic rewards undermined intrinsic
motivation whereas verbal rewards enhanced it”. Deci (1971) suggested that both intrinsic and
extrinsic motivation can either be negatively or positively interactive, rather than additive.
Further studies by cognitive evaluation theorists, such as Amabile, DeJong and Lepper (1976)
and Lepper and Greene (1975), suggested that external factors may lead to a decrease in
feelings of autonomy and undermine intrinsic motivation, while Zuckerman, Porac, Lathin,
Smith, and Deci (1978) suggested that some external factors tend to enhance feelings of
autonomy, and an increase in intrinsic motivation. Deci and Ryan (1985) found that negative
feedback challenged extrinsic and intrinsic motivation, and this in turn left people amotivated.
Research by Deci, Koestner, and Ryan (1999) confirmed the cognitive evaluative theories by
showing that extrinsic rewards did not diminish intrinsic motivation when rewards were either
given independently of specific task engagement or were not anticipated,.
A study by Gagné and Deci (2005, p.354) examining the effects of rewards on intrinsic
motivation found that that “the interpersonal climate within which rewards are administered
had a significant influence on the rewards' effects”. Specifically, according to Gagné and Deci
(2005, p.354), when “rewards are administered in an autonomy-supportive climate, they are
less likely to undermine intrinsic motivation and, in some cases, can enhance intrinsic
motivation”. Gagné and Deci (2005) suggested that as a result of this, incentive programmes
need to be equitable developed, and be able to recognise effective performance without
including controlling features, such as competition or pressure among teammates to meet goals.
Over many decades, several theories of motivation have been hypothesised. The next paragraph
highlights some of the most important theories developed.
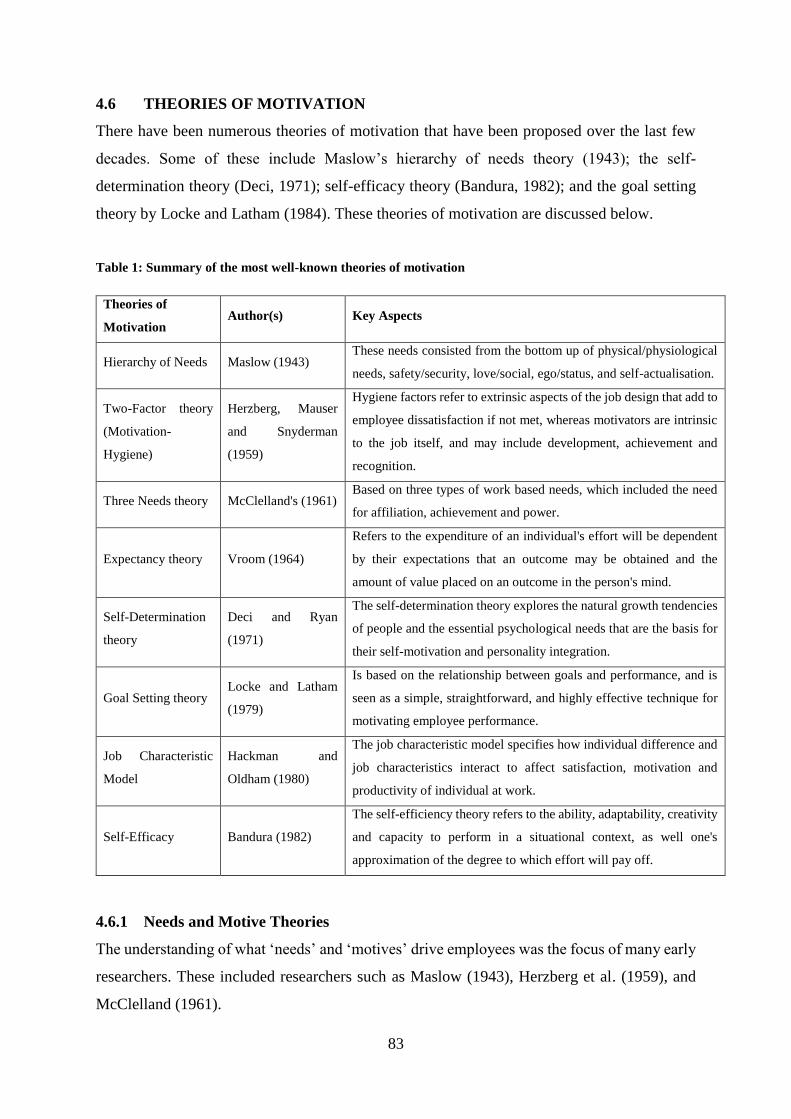
83
4.6 THEORIES OF MOTIVATION
There have been numerous theories of motivation that have been proposed over the last few
decades. Some of these include Maslow’s hierarchy of needs theory (1943); the self-
determination theory (Deci, 1971); self-efficacy theory (Bandura, 1982); and the goal setting
theory by Locke and Latham (1984). These theories of motivation are discussed below.
Table 1: Summary of the most well-known theories of motivation
Theories of
Motivation Author(s) Key Aspects
Hierarchy of Needs Maslow (1943) These needs consisted from the bottom up of physical/physiological
needs, safety/security, love/social, ego/status, and self-actualisation.
Two-Factor theory
(Motivation-
Hygiene)
Herzberg, Mauser
and Snyderman
(1959)
Hygiene factors refer to extrinsic aspects of the job design that add to
employee dissatisfaction if not met, whereas motivators are intrinsic
to the job itself, and may include development, achievement and
recognition.
Three Needs theory McClelland's (1961) Based on three types of work based needs, which included the need
for affiliation, achievement and power.
Expectancy theory Vroom (1964)
Refers to the expenditure of an individual's effort will be dependent
by their expectations that an outcome may be obtained and the
amount of value placed on an outcome in the person's mind.
Self-Determination
theory
Deci and Ryan
(1971)
The self-determination theory explores the natural growth tendencies
of people and the essential psychological needs that are the basis for
their self-motivation and personality integration.
Goal Setting theory Locke and Latham
(1979)
Is based on the relationship between goals and performance, and is
seen as a simple, straightforward, and highly effective technique for
motivating employee performance.
Job Characteristic
Model
Hackman and
Oldham (1980)
The job characteristic model specifies how individual difference and
job characteristics interact to affect satisfaction, motivation and
productivity of individual at work.
Self-Efficacy Bandura (1982)
The self-efficiency theory refers to the ability, adaptability, creativity
and capacity to perform in a situational context, as well one's
approximation of the degree to which effort will pay off.
4.6.1 Needs and Motive Theories
The understanding of what ‘needs’ and ‘motives’ drive employees was the focus of many early
researchers. These included researchers such as Maslow (1943), Herzberg et al. (1959), and
McClelland (1961).

84
Maslow (1943) organised human needs into a hierarchy with the basic survival needs at the
bottom. These needs consisted from the bottom up of physical/physiological needs,
safety/security, love/social, ego/status, and self-actualisation (Maslow, 1943). Maslow (1943)
suggested that once these need are filled, people can progress up the hierarchy to focus on
emotional satisfaction and self-fulfilment.
Herzberg et al. (1959)’s two-factor theory of motivation postulated that satisfaction and
dissatisfaction were two separate entities caused by quite different facets of work. Herzberg et
al. (1959) referred to these as “hygiene factors” and “motivators”. According to Herzberg et al.
(1959), hygiene factors refer to extrinsic aspects of the job design that add to employee
dissatisfaction if not met, whereas motivators are intrinsic to the job itself, and may include
development, achievement and recognition.
A study by McClelland (1961) identified three types of work based needs, which included the
need for affiliation, achievement and power. According to McClelland (1961), not everyone
has the same level of need. For example, a dominant person may have a strong need for power,
a secondary need for achievement, but little need for affiliation; a sociable worker’s greatest
need may be for affiliation rather than power, and a worker with low self-esteem might focus
on achievement but be too shy to seek power or affiliation (McClelland, 1961).
4.6.2 Expectancy Theory
According to Fudge and Schlacter (1999, p.296), the expectancy theory is classified as a
“process theory of motivation” as opposed to a “content theory of motivation because it
emphasizes individual perceptions of the environment and subsequent interactions arising as a
consequence of personal expectations”. Content theories, according to Fudge and Schlacter
(1999, p.296), “focus upon internal attributes of the person”.
According to Vroom (1964), particular sequences of action were chosen by employee based
upon attitudes, perceptions and beliefs, as a result of their desires to avoid pain and increase
pleasure. This theory was built upon by Porter and Lawler (1968), who suggested that the
“expenditure of an individual's effort” will be dependent by their expectations that an outcome
may be obtained and the amount of value placed on an outcome in the person's mind. In
85
essence, according to Isaac, Zerbe and Pitt (2001, p.215), the expectancy model suggests that
“individual feels motivated when three conditions are perceived”. Isaac et al. (2001, p.215)
suggested that these three conditions are “the personal expenditure of effort will result in an
acceptable level of performance; the performance level achieved will result in a specific
outcome for the person; and the outcome attained is personally valuable”.
According to Wright (2004), the expectancy theory has been widely tested in a variety of work
settings. Wright (2004) suggested that the principle of this theory is based on employees
varying in their beliefs about the extent to which their levels of effort, performance, and
subsequent rewards are related. According to expectancy theory, employees tend to make
decisions (e.g., to work hard or not) based on a utilitarian, cost-benefit perspective (Wright,
2004). Katzell and Thompson (1990) suggested that employees put forth more effort in doing
their work when they believe that the good performance will result in both intrinsic and
extrinsic rewards.
Isaac et al. (2001, 214) suggested that the expectancy theory relies mainly upon “extrinsic
motivators to explain causes for behaviours exhibited in the workplace”. According to these
authors, “external rewards are viewed as inducing motivational states that fuel behaviours”, as
opposed to “intrinsic motivators where behaviours are derived as a consequence of internal
forces, such as enjoyment of the work itself”.
4.6.3 Goal Setting Theory
The goal setting theory was suggested by Locke and Latham (1979). The theory was based on
the relationship between goals and performance. Locke and Latham (1979, p.80) suggested
that “goal setting was a simple, straightforward, and highly effective technique for motivating
employee performance”. However, according to Locke and Latham (1979), goal setting, may
not alleviate issues if used incorrectly; for example, it will not solve poor management issue or
salary concerns.
Based on a decade of research, Locke and Latham (1990a) suggested three propositions.
Firstly, the individual’s goal/intention can be described as the most direct motivational
determinant of task performance; secondly, external incentives affect action through their
effects on the individual's goals and intentions; and finally, affective reactions are the results
of evaluations, which consist of estimating the relationship between the existents one perceives
86
and one's values or value standards. Locke and Latham’s (1990a) research indicated that the
basic determinant of motivation is the individual's goals and that the variables which have been
considered by other theorists to determine motivation do so largely through their effects on
goal setting.
According to Lunenburg (2011), the goal setting theory is the underlying explanation for all
major theories of work motivation. This includes Vroom’s (1994) VIE theory, Maslow’s
(1943) or Herzberg’s (1959) motivation theories, Bandura’s (1986) social cognitive theory, or
Skinner’s (1979) operant-based behaviourism theory (Lunenburg, 2011). Based on hundreds
of research, Lunenburg (2011) suggested that the major finding of goal setting is that
individuals who are provided with specific, difficult but attainable goals perform better than
those given easy, nonspecific, or no goals at all.
4.6.4 Self-Efficiency Theory
According to Bandura (1982, p.123), self-efficacy refers to “one's judgment of how well one
can execute courses of action required to deal with prospective situations”. Bandura (1982)
suggested that self-efficiency refers to the ability, adaptability, creativity and capacity to
perform in a situational context, as well one's approximation of the degree to which effort will
pay off. According to Locke and Latham (2006, p.265), goals, together with self-efficacy,
sometimes facilitate the “effects of other potential motivating variables”. These potential
motivating variables can include feedback, personality traits, decision making, job autonomy,
and incentives (Locke & Latham, 2006).
Bandura’s self-efficiency theory has several implications in the work place. For example,
according to Luthans, Youssef, and Avolio (2007), these include implications for recruitment,
training and development and goal setting and performance. Luthans et al. (2007) suggested
that organisations should recruit candidates who display a high level of self-efficacy because
these appointees will be more motivated to engage in the behaviours that will help them
perform well in the workplace. Where organisations have training and development budget
constraints, they should consider an employee’s level of self-efficacy (Luthans et al., 2007).
According to these authors, employees with a high level of self-efficiency will have a greater
return on investment on training as they will tend to learn more from the training and,
ultimately, will be more likely to use that learning to enhance their job performance. Finally,
organisations can encourage higher performance goals from employees who have high levels
87
of self-efficacy; this will result in higher performance from employees, which is seen as critical
for many organisations in an era of high competition (Luthans, et al., 2007).
4.6.5 Job Characteristic Model
According to Casey and Robbins (2010, p.78), the job characteristic model specifies “how
individual difference and job characteristics interact to affect satisfaction, motivation and
productivity of individual at work”. The job characteristic model is based on the work of
Hackman and Oldham (1980). According to Casey and Robbins (2010), the job characteristic
model has been found to considerably improve job satisfaction, quality of products,
productivity and output, and reduce turnover and absenteeism.
According to Hackman and Oldman (1975, p.78-81), the Job Characteristics Model comprises
of five core dimensions, namely, skill variety, task identity, task significance, autonomy and
feedback. These authors also referred to “three critical psychological states” which included
“experienced meaningfulness of the work, experienced responsibility for outcomes of the work,
and knowledge of the actual results of the work”. According to these authors, “these five core
job dimensions” and “three critical psychological states influence a number of personal and
work outcomes, including internal work motivation, general job satisfaction, growth
satisfaction, lower absenteeism, lower turnover and work effectiveness”.
The job characteristic model is still popular today. For example, DeVaro, Li and Brookshire
(2007) evaluated the Job Characteristics Model in the modern organisational environment.
DeVaro et al. (2007, p.986)’s study generally supported the “Job Characteristics Model’s
predictions that task variety and worker autonomy are positively associated with labour
productivity and product quality and that autonomy is positively associated with worker
satisfaction”. However, DeVaro et al. (2007, p.986) did find that “task variety was stronger for
performance related outcomes than for worker satisfaction” as opposed to previous studies.
More recently, Hannif and Vo (2011) used three interrelated elements of the job characteristic
model in their study of call centre job functions and the quality of work life. Hannif and Vo
(2011) found that the employees at these call centres found their job content interesting to a
certain extent. Also of note was the fact that one member of the sample company group stated
that their exposure to people in the community, the variations in customer requests, and
knowing that they were providing a good service was what made the job content interesting
and challenging (Hannif & Vo, 2011).
88
4.6.6 Action Regulation Theory and Task Specific Motivation
According to Hacker (1994, p.92), the action theory uses “the concept of goals and emphasizes
the mechanisms that keep people effectively focused on goal-directed action”. According to
this author, the theory includes “the concept of decision latitude, which it equates with
autonomy”, which then suggests that “maximal motivation and action result when there is
considerable decision latitude allowing workers to set their own goals”. Frese (2001) suggested
that optimal performance is the result of a combination of control over one's behaviour and the
optimal complexity of the task, without unnecessary intricacies. Frese (2001) subsequently
designed a model to lead to personal initiative - which is essentially a single motivation variable
that is then used to predict work outcomes, by including a multitude of skill, personality factors,
and environmental support.
Kanfer (1991, p.135)’s task specific motivation model “uses the interaction of motivation and
individual differences in abilities” as the main foundation for predicting work performance.
According to this author, “motivation is characterized in terms of two cognitive resource
allocation processes known as distal and proximal”. Distal factors, according to this author,
“concern mechanisms, such as the utility to the person of doing the task and the perceived
instrumentality of expending effort for effective performance”. When the target activities are
“relatively complex and require sustained effort”, proximal factors such as “self-monitoring
and self-regulation are critical for performance and competence development” (Kanfer, 1991,
p.135).
4.6.7 Self-Determination Theory
According to Deci (1971, p.105), intrinsic motivation has demonstrated that “extrinsic rewards
can have a negative effect on intrinsic motivation under certain conditions”. According to this
author, extrinsic rewards can affect intrinsic motivation in two ways. Firstly, if there is a change
in the “perceived locus of causality” i.e. when a person is intrinsically motivated, the locus of
causality is within themselves. However, when external rewards are made contingent on
behaviour and the individual begins to perceive that he or she is engaging in the activity for
these rewards, then the “perceived locus of causality shifts from within the individual to the
extrinsic reward, resulting in decreased intrinsic motivation” (Deci, 1975, p.105). Secondly,
the author suggested that when people are intrinsically motivated to perform activities that
make them feel self-determining and competent, the reward or feedback can negatively affect
“intrinsic motivation by negatively affecting feelings of competence or self-determination”.
89
According to Ryan and Deci (2000, p.68), the self-determination theory explores “the natural
growth tendencies of people and the essential psychological needs that are the basis for their
self-motivation and personality integration”. The self-determination theory also focuses on
those conditions that foster these positive processes (Ryan & Deci, 2000). According to these
authors, “intentional human behaviour is described by two processes entailing intrinsic
motivation and internalisation”. Intrinsic motivation, according to these authors, “refers to the
doing of an activity for its inherent satisfactions rather than for some separable consequences”.
These authors postulated that “intrinsic motivation is engendered when people are in conditions
that support three innate psychological needs, namely, the need for self-determination - the
need to initiate and regulate one’s own actions, competence - the need to produce behavioural
outcomes and to understand production of these behavioural outcomes, and relatedness - the
need to have satisfactory relationships with others and with the social order in general”.
Gagné and Deci (2005, p.334) suggested that fundamental to the self-determination theory is
the “distinction between autonomous motivation and controlled motivation”. According to
these authors, “autonomy involves acting with a sense of volition and having the experience of
choice”, whilst autonomy means “endorsing one's actions at the highest level of reflection”.
These authors further suggested that “intrinsic motivation is an example of autonomous
motivation; while in contrast, being controlled involves acting with a sense of pressure, a sense
of having to engage in the actions”. The self-determination theory postulates that “autonomous
and controlled motivations” differ in terms of both their “underlying regulatory processes and
their accompanying experiences”, and it further suggests that “behaviours can be characterized
in terms of the degree to which they are autonomous versus controlled” (Gagné & Deci, 2005,
p.334).
The self-determination theory, as opposed to other theories, defines needs differently. Most
organisational theories see needs as individual differences. However, according to Ryan,
Sheldon, Kasser, and Deci (1996), needs are seen as nutriments that are crucial for optimum
human development and integrity. Thus, according to these authors, “the self-determination
theory focuses on the consequences of the extent to which individuals are able to satisfy the
needs within social environments, and not on the consequences of the strength of those needs
for different individuals” (Ryan et al., 1996, p.9-12). A study by Reis, Sheldon, Gable, Roscoe,
and Ryan (2000) has supported this perspective. For example, in their study of satisfaction and
the three basic psychological needs in people's ongoing lives, Reis et al. (2000, p.429-431)
90
“found first that trait measures of autonomy, competence, and relatedness, as well as aggregates
of the daily measures of autonomy, competence, and relatedness; all made independent
contributions to well-being indices”. This, according to these authors, “confirmed the relations
at the between-person level”. However, after between-person variance was removed, these
authors found that “the daily fluctuations in satisfaction of the three needs independently
predicted daily fluctuations in well-being”. Therefore, according to these authors, the study
“showed an association between need satisfaction and well-being at the within-person as well
as between-person levels of analysis, with independent contributions being made by
satisfaction of each basic need”.
The self-determination theory has been successfully linked to positive work outcomes. For
example, Deci, Connell and Ryan (1989, p.585) found that “managerial autonomy support was
associated with employees' being more satisfied with their jobs, having a higher level of trust
in corporate management, and displaying other positive work-related attitudes”. Deci et al.
(1989, p.582) found that “the level of managers' autonomy support increased in the intervention
sites relative to the control group sites and, even more importantly, that these changes radiated
to their subordinates who reported increases in perceptions of the quality of supervision, trust
in the organisation, and job-related satisfaction”. A study by Baard, Deci and Ryan (2004,
p.2061), suggested that “performance on the job and psychological adjustment are influenced
by satisfaction of people’s intrinsic needs for competence, autonomy, and relatedness on the
job”. According to these authors, “these opportunities for intrinsic need satisfaction are
influenced by managers being perceived as autonomy-supportive, and by subordinates as
autonomous causality orientation”.
For the purpose of this study, the researcher used the self-determination theory to determine
the impact of motivation on performance. Firstly, according to Ryan and Deci (2000), the Self-
Determination Theory proposes that people’s actions are motivated by three core needs,
namely, the need for autonomy, the need for competence and the need for relatedness. Ryan
and Deci (2000, p.69) suggested that if an “individual’s experience of autonomy, competence,
and relatedness are supported”, then this could lead to “the most volitional and high quality
forms of motivation and engagement for activities, including enhanced performance,
persistence, and creativity”. However, according to these authors, if any of these three
psychological needs are not supported or if they are “thwarted within a social context, this will
have a robust detrimental impact on wellness in that setting”. Within Retek, these three needs
91
are supported through (1) engaging employees in their tasks, (2) linking rewards and
recognition to the quality of their performances, and (3) by matching the values and needs of
the employee to the values and needs of the organisation. By fulfilling these needs, the
researcher postulates that employees will be motivated to improve their individual
performance, and hence increase organisational performance.
The theories highlighted above have been developed to add value to organisations in terms of
improving employee performance, as well as organisation performance. The paragraphs below
highlight some of the important implications of motivation on certain factors.
4.7 CONSEQUENCES OF MOTIVATION
There are several consequences of motivation in the organisational setting. Some of these
consequences are discussed below.
4.7.1 Motivation and Performance
One of the most important issues regarding work motivation is whether motivation impacts on
performance. Early research by Vroom (1964), Porter and Lawler (1968), and Campbell and
Pritchard (1976) all investigated this relationship. For example, Vroom (1964) suggested the
equation performance = ability x motivation, while Campbell and Pritchard (1976) expanded
that definition to “performance = f, with f representing aptitude level x skill level x
understanding of the task x choice to expend effort x choice of degree of effort x choice to
persist x facilitating and inhibiting conditions not under the control of the individual”. Both
Vroom (1964) and Campbell and Pritchard (1976) suggested that performance is caused by at
least four and maybe more factors, including role expectations, working in an environment in
which intended actions can be translated into behaviour, having the ability to do what is
required, and being motivated to do what is required.
With regard to enhancing motivation, Latham and Pinder (2005) looked at issues related to
work motivation over the last three decades. Latham and Pinder (2005, p.486) suggested that
the “ability to predict, understand, and influence motivation in the workplace was a result of
looking at the multitude of aspects that influence motivation as a whole, rather than just a few
characteristics”. These authors proposed that the “effects of national culture, characteristics of
92
the job itself, and the fit between the person and the organisation specifically influence
motivation and ultimately job performance” (Latham and Pinder, 2005, p.486).
The self-determination theory has been shown to impact on performance. For example, both
Ilardi, Leone, Kasser and Ryan (1993, p.1789)’s “study of employees with monotonous jobs in
a shoe factory” and Shirom, Westman, and Melamed (1999, p.1077)’s “study of blue-collar
workers with mundane jobs found that autonomous motivation was associated with greater job
satisfaction and well-being”. Studies by these authors implied that “autonomous motivation
was preferable in organisations, because even with dull, boring jobs, there is an advantage to
autonomous motivation in terms of job satisfaction and well-being, which was likely to yield
better attendance and lower turnover”.
Nawab, Bhatti and Shafi (2011, p.1209) found a “significant relationship between different
motivation factors and their effects on the performance and efficiency of employees”. Using a
qualitative methodology, Nawab et al. (2011) found that motivation factors increased and
stimulated the working performance of an organisation’s employees through the use of a
reward system and the organisation’s environment and appraisal system.
Springer (2011, p.29) found a “positive relationship between job performance and job
motivation” among bank employees. Based on his study, Springer (2011, p.39-40) suggested
“several recommendations for using motivational theories to increase performance, some of
these include:
1. Using Maslow's Hierarchy of Needs theory to for fulfilling employees' lower level
needs to motivate them and help them seek the next level. Lower level needs could
include wages and benefits and higher-level needs being job-security, teamwork, rank,
and personal/ professional goal attainment
2. Using the Equity Theory, where managers can uses several steps as a basis for
motivation, including conducting periodic job satisfaction surveys, providing training
to supervisors and managers, and allowing employees to grade their superiors
3. Using intrinsic motivation where managers can create an environment that helps
employees motivate themselves”.
93
Motivation plays an important role for both employees and employers. Motivated employees
can positively contribute to the organisation’s success, while simultaneously improving their
own performance. The positive relationship between motivation and performance can also
transcend to an employee’s career success. This relationship is discussed in more detail below.
4.7.2 Motivation and Career Success
Career success may be defined as the “positive psychological or work related outcomes or
achievement one has to accumulate as a result of ones work experiences” (Judge, Cable,
Boudreau & Bretz, 1995, p.486). Ali, Shaharudin and Anuar (2012, p.36) suggested that career
success can be defined in terms of objective and subjective dimensions. According to these
authors, “objective career success includes observable career achievement which can be
measured, whilst subjective career success includes an individual’s feels of accomplishment
and satisfaction with their careers”.
Wayne et al. (1999, p.592) have suggested that three key variables seem to capture the
motivational component that is important to career success under a contest-mobility norm
system. According to these authors, these three variables of hours worked per week, ambition
or desire for upward mobility, and career planning will positively predict salary progression
and will be related to the assessment of promotability. In their study of motivation and career
success, these authors found that two of the motivational factors were related to career
outcomes i.e. the desire for mobility was positively related to salary progression, but
“negatively related to career satisfaction, while career planning was significantly related to
career satisfaction”.
Quigley and Tymon (2006, p.528) believed that while extrinsic motivation played a part in
career success, they focused on the importance of intrinsic motivation as a “necessary
antecedent to an individual’s subjective sense of career success”. Quigley and Tymon (2006,
p.534) suggested that “individuals will feel that they have managed their own career
successfully when they experience a high degree of intrinsic motivation”, and therefore,
proposed that “feelings of meaningfulness, competence, choice, and progress will result in an
individual’s positive assessment of engaging in effective career self-management”. According
to these authors, “intrinsic motivation could be used as a guiding mechanism for personal career
development” by involving individuals into “actively managing their work life to increase the
94
likelihood that they will experience the feelings of meaningfulness, choice, competence, and
progress, and ultimately career success”.
4.7.3 Motivation and Satisfaction
The relationship between motivation and satisfaction has always intrigued researchers over the
years. Taylor (1911), the founder of "scientific management", was regarded as a forerunner in
supporting the use of scientifically designed incentive systems as a method to motivate
employees.
Locke and Latham (1990b, p.240) mention that “three problems initially prevented the
development of an integrated model of work motivation and satisfaction”. The first was that
there was no “adequate conceptual framework that existed for understanding and explaining
the motivation to work”; secondly, there was “no clear framework for understanding job
satisfaction”; and finally, there was “the problem of how to tie motivation and satisfaction
together” (Locke & Latham, 1990b, p.240-241).
However, recently some research has been conducted that has addressed those concerns. For
example, Pearson (1992, p.934) showed that “motivation had a significant effect on job
satisfaction and work practices in the field”. Pearson (1992, p.905) conducted a “two-year
longitudinal study of semi-autonomous versus non-autonomous work groups in a unionized
engineering workshop”. Pearson (1992) found that at the end of the study there was a
significant increase in job motivation of the semi-autonomous work groups in relation to job
satisfaction than for the non-autonomous work groups. In a study of medical and nursing staff,
Kontodimopoulos, Lambrou and Niakas (2010, p.2) also “found a positive relationship
between motivation and job satisfaction”. Using four specific motivation factors, namely, job
attributes, remuneration, co-workers and achievements, Kontodimopoulos et al. (2010, p.7)
found that “achievement was the main motivator in both the doctor and nurse subgroups”, and
that remuneration, co-workers and job attributes also ranked highly in terms of motivating
people.
A more recent study by Batey, Booth, Furnham and Lipman (2011) provided further evidence
for the strong relationships between personality and motivation. Batey et al. (2011) looked at
the Big Five Theory in relation to three motivational orientations i.e. status striving
motivations, communion striving motivations, and accomplishment striving motivations.
These authors “found that there was a direct and significant positive relationship” between
95
Extraversion and Status striving, Agreeableness and Communion striving and
Conscientiousness and Accomplishment striving. According to these authors, striving for status
would be aided by assertiveness in helping individuals accept responsibilities, making
themselves visible to those higher in the organisational hierarchy and putting themselves ahead
of others; agreeableness suggested a desire to get along with co-workers which would be driven
by a desire to put the needs of others before the self, a tendency to comply before confrontation
and preference for considering human issues before rational decisions based on cold logic; and
accomplishment striving motivational orientations would be predominantly concerned with
completing and finishing tasks.
4.7.4 Motivation and Values
Motivation plays an important role in affecting a person’s values. According to Michaelson
(2005), motivational efforts can exert control over individual moral autonomy, which, among
other things, involves the manipulation of values that motivate individuals to work for
organisational ends. Michaelson (2005) suggested that effective work motivation includes
ascertaining what is valued by the individual worker so that motivation can leverage it where
possible.
Early research on the effect of values indicated that “values play a crucial role in human
motivation and individual values can create problems of achievement and motivation”
(Mankoff, 1974, p.27). Mankoff (1974, p.27) suggested that the “most promising path to
increase the level of motivation and achievements of an individual is by creating a change in
his value system”. Brown (1976, p.15) similarly believed that “values are the most useful
concept in determining motivated behaviour”. Brown (1976, p.15) suggested that “the
complete exploration of the relationship between values and motivation will ultimately
improve the quality of working relationship of employees and managers and thereby the
personal work satisfaction of each”.
Shamir (1991) also mentioned the ability of motivational theories to downplay the role of
values and moral obligations. Shamir (1991) rejected calculative, rational and instrumental
considerations as the only source of motivation, and proposed that values and identify, as two
significant sources of motivation. Shamir (1991, p.411-414)’s theory “was built on five
assumptions:
96
1. Humans not only have the propensity to pursue a goal but also the propensity to express
their feeling, attitudes and self-identities
2. Humans are motivated to maintain and elevate both their self-esteem and self-worth
3. Humans are motivated to maintain and increase their sense of self-efficiency
4. The self-concept is composed of values and identity
5. Behaviours based on self-concept are not always guided by a clear expectation of
immediate and specific goals; they are guided by probability and faith”.
According to Shamir (1991), individuals feel self-worth when their behaviours are consistent
with their values.
4.7.5 Motivation and Personality
According to Wright (2004), many managers think that personality plays a significant role in
employee performance motivation. Research by Barrick, Mount, and Strauss (1993) and Judge
and Ilies (2002) have supported this hypothesis. For example, Barrick et al. (1993, p.715)
“found strong evidence that personality had an impact on motivational constructs”, which in
turn, “related to performance”. Barrick et al. (1993, p.715) “found that conscientiousness was
related to the tendency to set and be committed to goals, and that these constructs partially
mediated the relationship between conscientiousness and performance (sales volume and
performance ratings)”. In their meta-analysis study of the Big Five theory and motivation,
Judge and Ilies (2002, p.797) also found a strong correlation with various measures of
motivation. These authors suggested that “the Big Five traits are important drivers of employee
motivation”; with neuroticism and conscientiousness being the most strongly correlated with
each of three approaches to measuring employee motivation. These authors suggested that
employees who are low in Neuroticism and high in Conscientiousness might have an added
performance edge in many jobs. This, according to these authors, had practical implications for
selection, placement, training, and development, which potentially have consequences.
Furnham (1997) suggested that due to their social nature, extraverts may be highly motivated
by intrinsic factors. These intrinsic factors included aspects such as recognition and positive
feedback (Furnham, 1997). A recent study by Furnham et al. (2009, p.776) found that “overall
motivation, as well as both intrinsic and extrinsic motivation” was correlated to job satisfaction
97
which was also significantly associated with conscientiousness. The possible reasons for this,
according to these authors, was that “because of their attention to detail, individuals high in
conscientiousness are likely to be rewarded both extrinsically and intrinsically”. This, these
authors suggested “would fulfil both the ‘hygiene’ and ‘motivators’ pre-requisites for job
satisfaction”.
4.7.6 Motivation and Different Cultures
Motivation may be perceived differently in different countries and societies. A motivation
strategy that is effective in one country or society may have a different effect in another country
or society. Sagie, Elizur and Yamauchi (1996) referred to two different types of societies i.e.
individualist and collectivistic societies. According to Earley (1993), an individualist society
conceives achievement as personal success and excellence; either coping personally with
challenges or providing personal or unique answers to problems. In contrast, collectivistic
societies emphasize membership within groups or communities, stress communal goals, and
consider group welfare over one's own individual welfare (Earley, 1993). For example, a study
in the early 1990’s by Silverthorne (1992, p.1631) looked at “comparing supervisors’ and
subordinates’ rankings of ten motivational job factors in the Russia, USA and Taiwan”. In his
study, this author found significant correlations between employee rankings and manager
rankings in the United States and Taiwan samples”. However, in the Russian sample, the author
found that “managers’ rankings were not significantly correlated with the rankings of their
subordinates”. Silverthorne (1992, p1638) suggested that managers in Russia “have little idea
about what their subordinates’ value, whereas in the U.S. and Taiwan, supervisors have a
stronger understanding of subordinate motivation”.
An interesting issue related to cross-cultural motivation is whether intrinsic or extrinsic
motivation will be more effective in different countries. Both cultural factors (Hofstede, 1991)
and socio-economic factors (Veenhoven & Ehrhardt, 1995; Inglehart, 1997) seem to influence
this. From a cultural perspective, Hofstede (1991) suggested that culture influences the
emphasis people place on higher needs based on culturally inherited traits. This author
observed that “in individualistic cultures people tend to be self-reliant, be self-motivated, and
place more value on individual interests”, whereas “in collectivistic countries, higher needs,
such as self-actualization, often give way to lower needs, such as economic security and social
affiliation”. According to Hofstede (1991), greater emphasis is placed on extrinsic aspects of
an employees’ job in collectivistic countries, as oppose to those in individualistic countries.
98
The need-gratification theory of well-being, which explores the socio-economic perspective,
also “postulates that higher needs become salient as lower needs are gratified” (Veenhoven &
Ehthardt, 1995, p.37). These authors suggested that “lower needs are less potent for predicting
happiness in rich countries than in poor countries”. According to Inglehart (1997), there is a
difference in the way workers of richer and poorer countries attach value to the intrinsic aspects
of work. For example, according to these authors, more value is attached to the intrinsic aspects
of workers in richer countries as “they have taken survival for granted”. However, according
to this author, workers in poorer countries may be “motivated more by extrinsic rewards,
because the lower needs are still more salient than the higher needs”.
A study conducted by Huang and Van de Vliert (2003, p.159) found that “intrinsic job
characteristics tend to produce motivating satisfaction in countries with good governmental
social welfare programmes irrespective of the degree of power distance, while they do not tend
to work this way in countries with poor governmental social welfare programmes as well as a
large power distance culture”. According to these authors, there was an impact on cross-
national variation in work motivation by socio-economic and cultural approaches. These
authors suggested that in individualistic societies “people are more likely to be socialized to
focus on intrinsic aspects of their jobs, and tend to attach more value to high-order needs, such
as self-actualization, than people in collectivistic countries”.
4.8 CHAPTER SUMMARY
This chapter examined the concept of motivation. The study of motivation has given rise to
numerous theories of motivation, including the focus on individual needs and differences by
Maslow (1943), Herzberg et al. (1959) and McClelland (1961); theories related to behavioural
choices by Vroom (1964), Locke and Latham (2002) and Adam (1963); and a focus on
cognitive motivational theories by Bandura (1982), Weiner (1985) and Deci and Ryan (1985).
Deci and Ryan’s (1985) self-determination theory formed the theoretical background of this
study.
Studies have indicated that motivation significantly contributes to employee and organisation
performance. These contributions include the positive impact of motivation on performance,

99
career success, and satisfaction, as well as the impact of motivation on personality, values and
culture. The overall research indicates that motivation is a very powerful tool in enabling
employees to improve and increase their performance, while simultaneously increasing the
performance of organisations.
The next chapter focuses on the research methodology that was used to achieve this research
100
CHAPTER FIVE
RESEARCH METHODOLOGY
5.1 INTRODUCTION
This chapter outlines the research methodology followed in the current study. Also discussed
in this chapter are the research methodology and method, research setting, research design,
sampling method, data collection method, the measuring instrument and its properties, and data
analysis methods. This study consists of two parts, part 1 being the literature review (existing
scientific knowledge on this subject) and part 2 being the empirical study (applying both
quantitative and qualitative measures to reach the research objectives.
5.1.2 Research Setting
The mixed method approach involved store managers working for one of the biggest retailers
in South Africa. The retailer in this study is referred to as Retek. Examples of Retek’s core
business include the sale of men, women, children and baby apparel. Their business is targeted
towards the middle to lower income customers. Store managers at Retek are set sales targets at
the beginning of each financial year, and are expected to meet their daily targets in line with
their year-end target. Store managers are also expected to manage their daily costs in line with
set budgets. Retek previously used a performance management system designed internally by
the Human Resource Department. The BSC was introduced at the beginning of the financial
year as the new performance management system.
5.2 RESEARCH DESIGN
The study attempts to adequately address the research questions by using a quasi-experimental
time series design. The researcher aimed to manipulate events by initiating various training,
learning and coaching programmes to assist employees in improving their individual key
performance indicators in the Balanced Scorecard over three month periods. The quasi-
experimental time series study was conducted over a 12 month period: from 01 April 2012 to
31 March 2013. The rationale for using this design was that a quasi-experimental design
101
allowed the study to explore the problem precluding the use of procedures required by a true
experimental design.
5.2.1 Sequential explanatory Mixed Methods
According to Hanson, Creswell, Plano Clark, Petska and Creswell (2005, p.228), there are “six
primary types” of mixed methods research designs: “three sequential (explanatory, exploratory,
and transformative) and three concurrent (triangulation, nested, and transformative)”. These
six types vary according to their “use of an explicit theoretical/advocacy lens, approach to
implementation, priority given to the quantitative and qualitative data, stage at which the data
are analysed, and integrated and procedural notations” (Hanson et al., 2005, p.228).
For the purpose of this study, the researcher used a sequential explanatory design. The rationale
for choosing this design is detailed in the steps below:
Step 1
Firstly, the researcher did not use an explicit theoretical lens, hence the choice of a sequential
explanatory design. An “explicit theoretical lens refers to the philosophical basis, or paradigm
that underlies a researcher’s study and subsequent methodological choices” (Hanson et al.,
2005, p.226).
Step 2
The choice of how the data was collected and analysed influenced the choice of the mixed
method design. The researcher focused on the quantitative data, hence priority was given to the
quantitative data and qualitative data was used primarily to supplement the quantitative data.
For example, the researcher collected quantitative data related to the Balanced Scorecard,
Performance and Motivation, and then confirmed and/or refuted that data with the data from
the interviews.
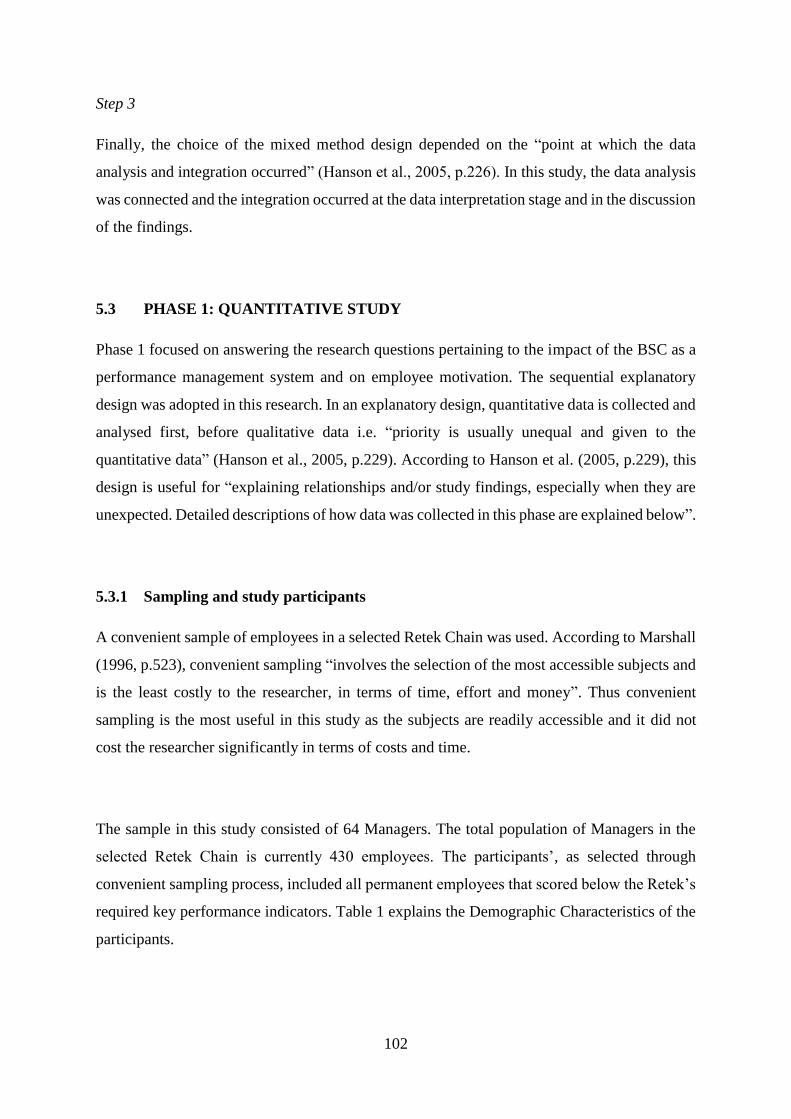
102
Step 3
Finally, the choice of the mixed method design depended on the “point at which the data
analysis and integration occurred” (Hanson et al., 2005, p.226). In this study, the data analysis
was connected and the integration occurred at the data interpretation stage and in the discussion
of the findings.
5.3 PHASE 1: QUANTITATIVE STUDY
Phase 1 focused on answering the research questions pertaining to the impact of the BSC as a
performance management system and on employee motivation. The sequential explanatory
design was adopted in this research. In an explanatory design, quantitative data is collected and
analysed first, before qualitative data i.e. “priority is usually unequal and given to the
quantitative data” (Hanson et al., 2005, p.229). According to Hanson et al. (2005, p.229), this
design is useful for “explaining relationships and/or study findings, especially when they are
unexpected. Detailed descriptions of how data was collected in this phase are explained below”.
5.3.1 Sampling and study participants
A convenient sample of employees in a selected Retek Chain was used. According to Marshall
(1996, p.523), convenient sampling “involves the selection of the most accessible subjects and
is the least costly to the researcher, in terms of time, effort and money”. Thus convenient
sampling is the most useful in this study as the subjects are readily accessible and it did not
cost the researcher significantly in terms of costs and time.
The sample in this study consisted of 64 Managers. The total population of Managers in the
selected Retek Chain is currently 430 employees. The participants’, as selected through
convenient sampling process, included all permanent employees that scored below the Retek’s
required key performance indicators. Table 1 explains the Demographic Characteristics of the
participants.
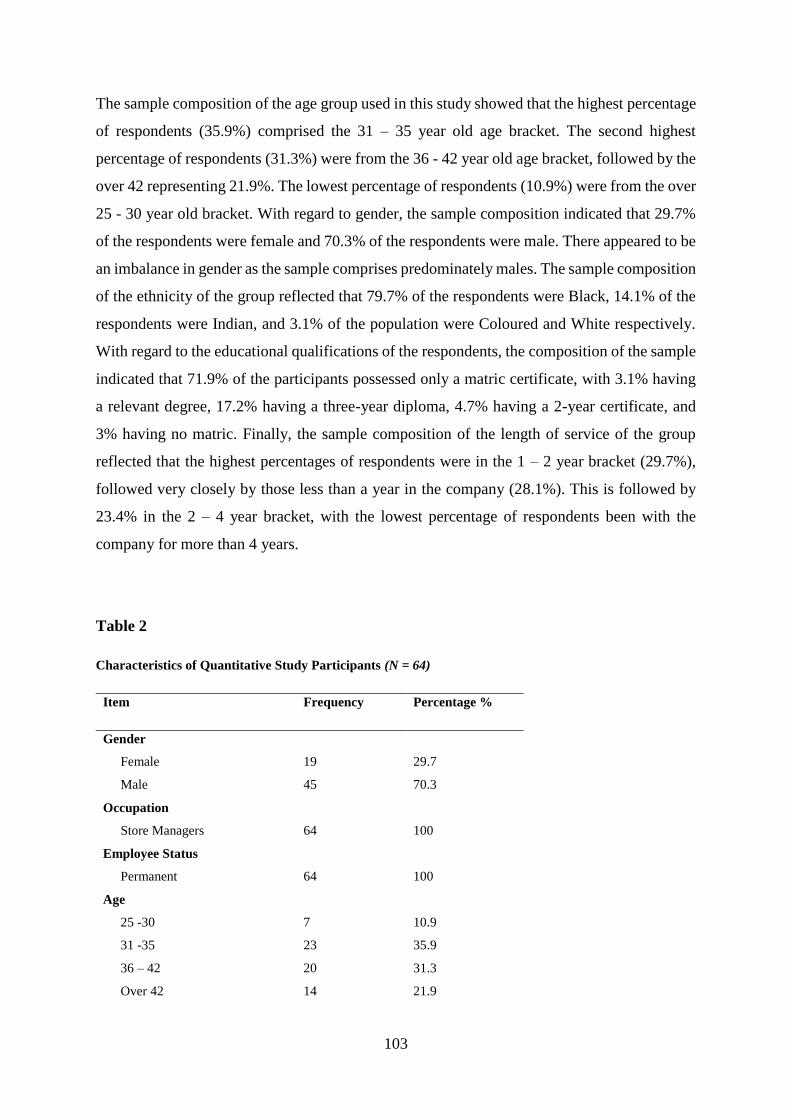
103
The sample composition of the age group used in this study showed that the highest percentage
of respondents (35.9%) comprised the 31 – 35 year old age bracket. The second highest
percentage of respondents (31.3%) were from the 36 - 42 year old age bracket, followed by the
over 42 representing 21.9%. The lowest percentage of respondents (10.9%) were from the over
25 - 30 year old bracket. With regard to gender, the sample composition indicated that 29.7%
of the respondents were female and 70.3% of the respondents were male. There appeared to be
an imbalance in gender as the sample comprises predominately males. The sample composition
of the ethnicity of the group reflected that 79.7% of the respondents were Black, 14.1% of the
respondents were Indian, and 3.1% of the population were Coloured and White respectively.
With regard to the educational qualifications of the respondents, the composition of the sample
indicated that 71.9% of the participants possessed only a matric certificate, with 3.1% having
a relevant degree, 17.2% having a three-year diploma, 4.7% having a 2-year certificate, and
3% having no matric. Finally, the sample composition of the length of service of the group
reflected that the highest percentages of respondents were in the 1 – 2 year bracket (29.7%),
followed very closely by those less than a year in the company (28.1%). This is followed by
23.4% in the 2 – 4 year bracket, with the lowest percentage of respondents been with the
company for more than 4 years.
Table 2
Characteristics of Quantitative Study Participants (N = 64)
Item Frequency Percentage %
Gender
Female 19 29.7
Male 45 70.3
Occupation
Store Managers 64 100
Employee Status
Permanent 64 100
Age
25 -30 7 10.9
31 -35 23 35.9
36 – 42 20 31.3
Over 42 14 21.9
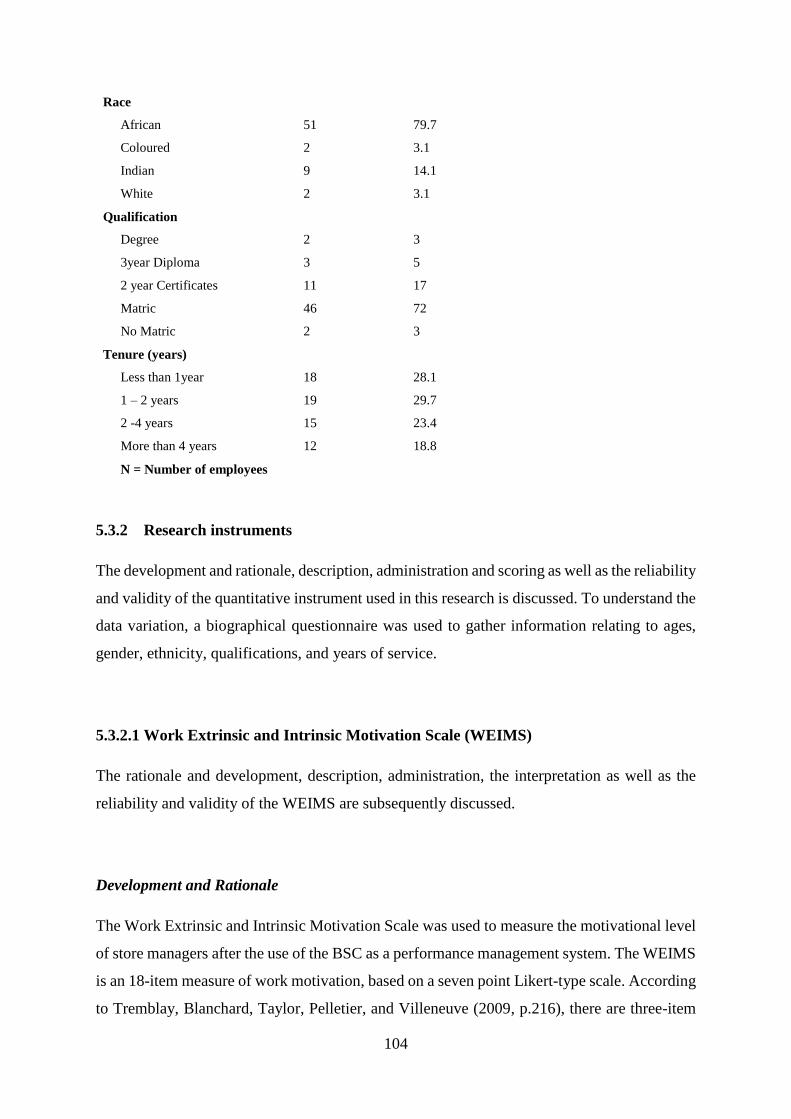
104
Race
African 51 79.7
Coloured 2 3.1
Indian 9 14.1
White 2 3.1
Qualification
Degree 2 3
3year Diploma 3 5
2 year Certificates 11 17
Matric 46 72
No Matric 2 3
Tenure (years)
Less than 1year 18 28.1
1 – 2 years 19 29.7
2 -4 years 15 23.4
More than 4 years 12 18.8
N = Number of employees
5.3.2 Research instruments
The development and rationale, description, administration and scoring as well as the reliability
and validity of the quantitative instrument used in this research is discussed. To understand the
data variation, a biographical questionnaire was used to gather information relating to ages,
gender, ethnicity, qualifications, and years of service.
5.3.2.1 Work Extrinsic and Intrinsic Motivation Scale (WEIMS)
The rationale and development, description, administration, the interpretation as well as the
reliability and validity of the WEIMS are subsequently discussed.
Development and Rationale
The Work Extrinsic and Intrinsic Motivation Scale was used to measure the motivational level
of store managers after the use of the BSC as a performance management system. The WEIMS
is an 18-item measure of work motivation, based on a seven point Likert-type scale. According
to Tremblay, Blanchard, Taylor, Pelletier, and Villeneuve (2009, p.216), there are three-item
105
six subscales that comprise the WEIMS, and these correspond to the “six types of motivation,
namely intrinsic motivation, integrated, identified, introjected, external regulations, and
amotivation, hypothesised by the self-determination theory”. “A Likert-type scale is used
ranging from 1 (does not correspond at all) to 7 (corresponds exactly)”, where respondents are
requested to indicate the “extent to which these items represent the reasons they are presently
involved in their work” (Tremblay et al., 2009, p.216).
Description of the WEIMS
The WEIMS (Tremblay et al., 2009, p.226) consists of 18 items, where participants have a
choice according to a 7-point scale. Points 1 and 7 indicate the extremes of the scale, while
point 5 indicates that the participant is uncertain. The WEIMS is divided into six subscales,
namely: “Intrinsic motivation (3 items)” (e.g. “Because I derive more pleasure from learning
new things”), “Integrated regulation (3 items)” (e.g. “Because it has become a fundamental
part of whom I am”), “Identified regulation (3 items)” (e.g. “Because I choose this type of
work to attain my career goals”), “Introjected regulation (3 items)” (e.g. “Because I want to
succeed in this job, if not I would be very ashamed of myself”), “External regulation (3 items)”
(e.g. “Because it allows me to earn money”) and “Amotivation (3 items)” (e.g. “I don’t know
why, we are provided with unrealistic working conditions”.)
The total score of the six different subsets provides an indication of the participant’s level of
motivation as measured by the three items. The use of a single score, according to Tremblay et
al. (2009, p.216), can also be seen as useful, especially when researchers want to “determine
which individuals exhibit either a self-determined or a non-self-determined motivational
profile”. These authors suggested that, based on a specific formula, “negative score indicates a
non-self-determined profile and a positive score indicates a self-determined profile”.
To determine the reliability of the WEIMS, Tremblay et al. (2009, p.228) conducted a
Cronbach Alpha test, which indicated that the “internal consistency of the six subscales” were
fairly reliable. In addition, Tremblay et al. (2009, p.221) “conducted a series of regression
analyses which revealed that the WEIMS had construct, content, and criterion validity for
106
organisational settings”. According to these authors, “the WEIMS factorial structure was also
invariant across samples and its quasi-simplex pattern and relationships with psychological
correlates further supported the self-determination continuum”. Overall, according to these
authors, “their findings provided evidence for the applicability as well as the reliability and
validity of the WEIMS in organisational settings”.
5.3.3 Procedure
Firstly, permission to conduct the research study was obtained from the participating
organisation. The researcher approached the Group Human Resource (HR) Executive at Retek
to discuss the research project in detail. The Group HR Executive approved the research, and
then proposed the research study to the Group Executive for Business Operations. Approval
was obtained by the Group Executive for Business Operations, and a research roll-out strategy
was designed in collaboration with the Heads of HR and Business Operations. A signed
approval from the organisation was issued to the researcher to continue with the study.
Secondly, the researcher called each participant to present the research topic. The researcher
then explained in detail the purpose of the research and the potential impact of the study to
each participating employee. The researcher reiterated the issue of confidentiality to each
participant, and further explained the possible value the study may have to the organisation.
Participation in this study was declared voluntary and the participants had an option to
withdraw at any time should they have wished to do so. The WEIMS questionnaire was emailed
to each participant, with an attached briefing introduction letter that informed the participants
of their right to withdraw from the research, as well as the issue of confidentiality (see Appendix
A).
5.3.4 Ethical aspects
The researcher complied with all the necessary steps to ensure that the participants in the study
were treated in a fair and ethical way. Participation in the study was voluntary, and no employee
was forced to participate. The researcher ensured that the rationale and objectives of the study
was discussed with all participating employees prior to the onset of the study. Employees were
given the opportunity to ask questions, make statements and discuss the project before
considering participation. Participants were given the opportunity to decline completing the
107
Work Extrinsic and Intrinsic Work Motivation Questionnaire at any time during the process.
Employees were also given the opportunity to decline the invitation to be interviewed.
Confidentiality was assured and maintained at all stages during the research process.
In addition, an application to the University of KwaZulu-Natal’s ethics committee was
submitted and approved for continuing with this research project. Furthermore, permission was
sought and approval obtained from the organisations’ Group Human Resource Executive and
Business Operations Executive (see Appendix F).
5.3.5 Research Data Collection
Data for the BSC, namely financial, internal business processes, customer services and learning
and growth, was obtained from Retek’s monthly profit and loss statements (P&L), as well as
from business, human resource and customer service reports. The information was produced
on an Excel spreadsheet, and statistically processed through SPSS 21 program (IBM, 2012)
where conclusions were then drawn from the results. The data set will be stored for a period of
5 years at the School of Applied Human Sciences, University of KwaZulu-Natal, Howard
College, Durban, South Africa.
The steps outlining how the quasi-experimental time series was conducted for this particular
research is outlined below:
Step 1:
The researcher recorded the Balanced Score Card scores for each of the participant. Based on
these scores the researcher initiated various training and learning performance initiatives, with
the assistance of the human resource department, to assist the participant in improving his/her
Balanced Scorecard score.
108
Step 2:
At the end of the first three months, the researcher recorded the new Balanced Scorecard scores.
Where there was no improvement in the score, the researcher, with the assistance of the human
resource department, initiated more intensive performance management initiatives, such as
coaching and mentoring, to assist the participant. Where there were improvements, the
researcher reinforced these improvements through rewards and recognition.
Step 3:
The exact process continued every three months until the end of the research period.
5.3.6 Data collection
Data pertaining to the BSC was obtained from the organisations ‘internal data management
system’. This system is regularly audited, both internally and externally to ensure data integrity.
Information from this ‘data management system’ is used for all Retek reporting, including
general annual reports.
Organisational Performance
Trading Store Profit
The rationale for using the Trading Store Profit to measure performance was that the Trading
Store Profit data provides a pure figure on profit encompassing growth, sales and expenses.
This measure was derived from the monthly Trading Store Profit document for the Group as
per the Targets set at the beginning of the financial year. This information could be collated
per store as well as per region/division/chain and group. This information consists of the stores
total profit, taking into account factors such as sales, expenses, losses. Trading store profit
represents the actual profit a store makes after deducting all its expenses.
109
Employee Performance
Performance Agreement
The employee’s individual performance was measured using the employee’s performance
agreement. The employee and his/her line manager discussed the goals and expectations of the
performance agreement prior to the start of the financial year. The signing of the performance
agreement by the employee, was an acknowledgment and acceptance by the employee of their
goals and expectations for that specific financial year. The performance agreement information
was provided by the Human Resource Department.
i. Balanced Score Card
Financial perspective: sales growth and gross profit margin
This measure was derived from the monthly Profit and Loss as per the Targets set at the
beginning of the financial year. At the beginning of each year, each store is set specific sales
targets that they are expected to meet. The profit and loss statements are calculated at the end
of each month to show the store their progress towards their respective targets. It also indicates
their expenses for the month relating to operating cost, staffing costs, and other ad hoc
expenses.
Internal business processes perspective: inventory loss, manageable expenses, and stock
integrity
The stores internal processes consist of a store managing their inventory loss, manageable
expenses, and their data integrity. From an inventory loss perspective, data was gathered from
the profit and loss (P&L) data and was calculated as ‘actual inventory loss’ divided by ‘actual
sales’ for the period. Inventory loss refers to the products that are stolen from a store. Data on
inventory loss was provided by the department that manages the inventory loss for the
company. Manageable Expenses refers to the normal day to day running costs of a particular
store. Examples of manageable expenses include printing, electricity, and so on. Manageable
expenses was identified from the P&L and was calculated as ‘actual manageable expenses’
divided by ‘budgeted manageable expenses’. Stock Integrity - stock integrity refers to issues
where the stock on hand in the stores does not match the stock on the system. Stock integrity
110
scores were calculated whenever a stock take had been completed. This information is
automatically calculated and uploaded onto the stock system.
Learning and growth perspective: training and development
The organisation in the study conducted a comprehensive training programme focused on
upskilling those managers that were underperforming over a one year period. This training was
split into four quarters, and consisted of technical training and management skills. Assessments
were carried out after each session, and this information was consolidated by the Human
Resource Department. Feedback was provided to each manager highlighting certain
opportunity areas.
Customer perspective: customer service
The organisation makes use of an external service provider to assess its customer service in
each store. The service provider employs people to visit various stores as customers, and then
requests the individual to complete a customer service checklist on customer service. This is
referred to as the ‘The Mystery Shopper’. These scores were used to determine the customer
service factor for each store.
5.3.7 Quantitative Data Analysis
The research methodology consisted of both quantitative and qualitative data analysis in phase
1 and 2 respectively. In phase 1, the quantitative analysis consisted of (1) data collection and
(2) statistical analysis using specific statistical techniques. All statistical analyses are presented
in the next chapter using tabular and graphical representations.
The Key Performance Indicator (KPI) data for each Store Manager was compared to the KPI
data of the previous three months. This data was then compared to the Stores Trading Profit
for that period. Where KPI scores were below the standard required, HR Managers and
Regional Operational Managers implemented various learning initiatives to address these
111
concerns. The researcher then analysed the KPI scores for each Store Manager for the following
three months to determine whether there were improvements in Performance. The researcher
then determined, by analysing the Store Trading Profit figures, whether those improvements
translated into an improvement in the Stores Organisational Performance. The researcher
continued this process for the next three months in order to fully analyse the impact of the BSC
as a performance management system.
5.3.8 Statistical Analysis Process
The statistical analysis was carried out using the SPSS 21 program (IBM, 2012). The
organisational and employee performance data, as well as the BSC data, was uploaded onto the
SPSS 21 (IBM, 2012) programmed for statistical processing and interpretation in line with the
research questions. The next step in the statistical process was to determine the reliability of
the WEIMS using Cronbach Alpha. The ANOVA was then used to determine the relationship
between the BSC, individual performance, and organisational performance. Statistical
regressions were carried out to determine whether BSC predicted motivation. According to
Sekaran (2000, p.404) “analysis of variance (ANOVA) is used to indicate whether or not there
are significant mean differences between more than two groups”. The results of ANOVA
indicate whether or not means of various groups are significantly different from one another
(Sekaran, 2000).
5.4 PHASE 2: QUALITATIVE STUDY
The qualitative methodology followed in phase 2, consisted of conducting semi-structured
interviews, using an interview schedule. The semi-structured interview related specifically to
the research questions, and consisted of questions pertaining to the impact of the BSC as a
performance management system and on employee motivation. This approach was adopted in
order to supplement the research study. These interviews were conducted on a sample of the
population i.e. a sample was taken from the population of Retek. The semi-structured
interviews were used to obtain data on the success of the BSC and the motivational effects of
the BSC. Detailed descriptions of how data was collected in this phase are explained below.
112
5.4.1 Sampling and study participants
The sample only included 10 Store Managers as they are solely responsible for Store
Performance. Samples sizes for the interviews were chosen for each population/chain as per
Sekaran’s (2002) population to sample size tables. A non-probability sampling procedure was
used for the qualitative study. According to Sekaran (2002), non-probability samples can be
divided into convenience sampling, quota sampling and purposive sampling. For the purpose
of this study, a convenience sampling was used due to the fact that the participants were
conveniently available, and it was cost effective and less time consuming. The semi-structured
interview questions addressed the five conditions that Kaplan and Norton (2001) suggested
must first be met for the BSC to be successful.
The sample composition of the age group used in this study (refer to Table 2) showed that the
highest percentage of respondents (50%) comprised the 31 – 35 year old age bracket. The
second highest percentage of respondents (40%) were those over 42. The lowest percentage of
respondents (10%) was 36 - 42 year old. With regard to gender, the sample composition
indicated that 50% of the respondents were female and 50% of the respondents were male.
There was a balance in gender as the sample composes equally of male and female participants.
The sample composition of the ethnicity of the group reflected that 40% of the respondents
were Black, 30% of the respondents were Indian, 20% of the population were Coloured, and
10% were White. With regard to the educational qualifications of the respondents, the
composition of the sample indicated that 50% of the participants possessed only a matric
certificate, with 30% having a relevant diploma, and 20% having no matric. Finally, the sample
composition of the length of service of the group reflected that the highest percentages of
respondents were in the 1 – 2 year bracket (50%), followed very closely by those in the 2 – 4
year bracket (30%), with the lowest percentage of respondents been with the company less than
1 year (10%) and for more than 4 years (10) respectively.
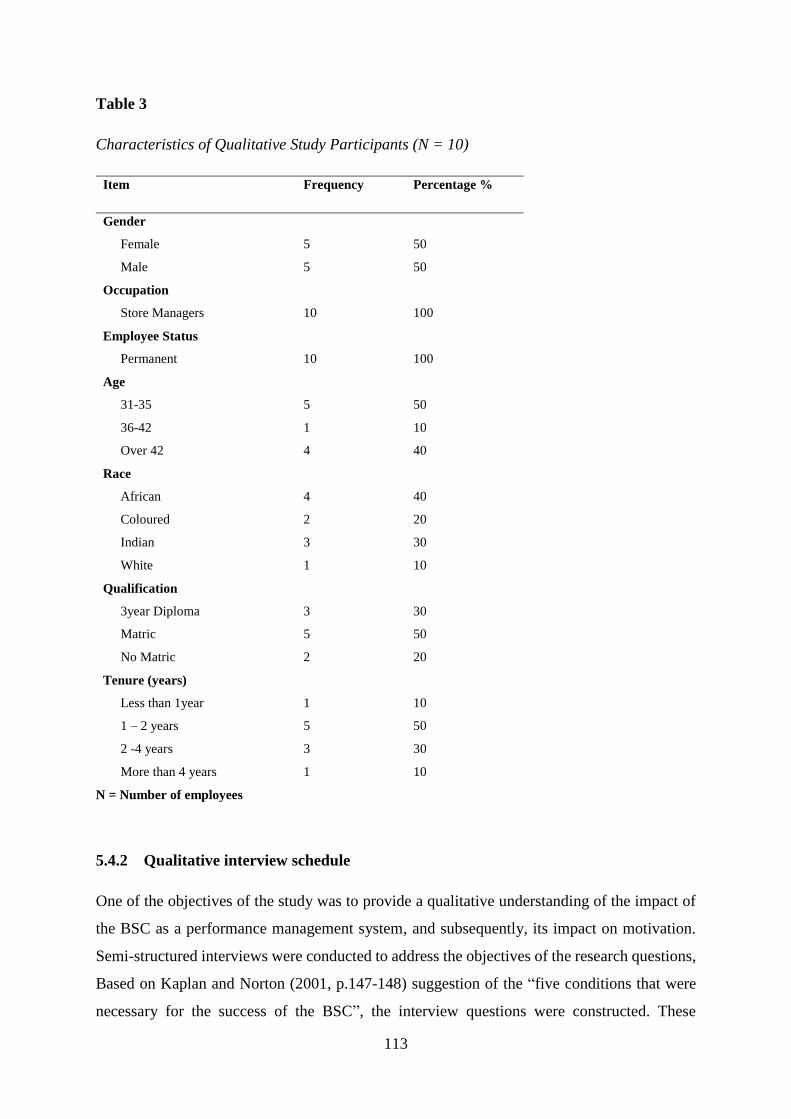
113
Table 3
Characteristics of Qualitative Study Participants (N = 10)
Item Frequency Percentage %
Gender
Female 5 50
Male 5 50
Occupation
Store Managers 10 100
Employee Status
Permanent 10 100
Age
31-35 5 50
36-42 1 10
Over 42 4 40
Race
African 4 40
Coloured 2 20
Indian 3 30
White 1 10
Qualification
3year Diploma 3 30
Matric 5 50
No Matric 2 20
Tenure (years)
Less than 1year 1 10
1 – 2 years 5 50
2 -4 years 3 30
More than 4 years 1 10
N = Number of employees
5.4.2 Qualitative interview schedule
One of the objectives of the study was to provide a qualitative understanding of the impact of
the BSC as a performance management system, and subsequently, its impact on motivation.
Semi-structured interviews were conducted to address the objectives of the research questions,
Based on Kaplan and Norton (2001, p.147-148) suggestion of the “five conditions that were
necessary for the success of the BSC”, the interview questions were constructed. These
114
questions focused on the influence of upper management on BSC at the workplace, its role in
strategic management among others. Some of the specific questions asked include to what
extent does your Division communicate its strategic objectives within the organisation? How
important was the BSC framework for developing your strategic map? and, How do you ensure
that your employees are aware of their role in achieving their objectives in relation to the BSC?
These questions were used served as a guide and probing questions were asked to seek further
clarification where necessary.
5.4.3 Data Collection Procedure
An interview schedule was used for the qualitative study. Face to face interviews were
conducted on all participants by the researcher. The participants indicated that their language
of preference for the interviews was English. Interviews were conducted in the organisations
regional offices to ensure confidentiality of the process. These offices were closed rooms, and
were used by the recruitment department to interview senior managers. The researcher ensured
that the room was comfortable for the participant and conducive to the interview process. The
interview process was between 20 to 30 minutes, with the shortest been 15 minutes and the
longest been 30 minutes. Open ended questions were asked to the participants to allow for the
exploration of emerging themes.
The participants signed a consent form indicating that their participation was voluntary. The
participants were not provided or promised any incentives to take part in the study. The
participants consented to the researcher taking notes, but indicated that they were not
comfortable with the researcher taping the conversations.
5.4.4 Qualitative Data Analysis
The researcher used a Thematic Approach to code the qualitative data. The interview responses
were analysed thematically in order to identify any emerging themes from the participant’s
responses. According to Braun and Clarke (2006, p.79), a “thematic analysis can be described
as a process of identifying, analysing, and reporting patterns within data”. Braun and Clarke
(2006, p.78) suggested that “this process minimally organises and describes a data set in rich
115
detail”. According to Boyatzis (1998, p.1), the “thematic coding process encompassed
identifying an important moment and encoding it prior to a process of interpretation”. This
author defined a “good code” as one that captures “the qualitative richness of the phenomenon,
and a theme as ‘a pattern in the information that at minimum describes and organises the
possible observations and at maximum interprets aspects of the phenomenon”.
The thematic process, according to Braun and Clarke (2006, 87-93) can comprise six phases,
namely, “familiarising yourself with the data, generating initial codes, searching for themes,
reviewing themes, defining and naming themes, and producing the report”. In this study, the
responses around the implementation of the BSC, and its impact on motivation were written
down carefully and precise. The notes were carefully read several times over before certain
viewpoints and ideas were highlighted. The notes then gave rise to specific ideas, before initial
codes from the data was produced. The data was collated to each code in a very organised and
systematic process. Once the coding was collated and complete, the researcher looked for
potential themes. The researcher initially found several potential themes, and then analysed
and compared them to each other. The researcher then looked for central themes from the
potential themes, and carefully reviewed the themes to ensure that there was a recognisable
differentiator between each theme. A thematic map of the analysis was then created. The codes
data was reviewed and validated once again, before the themes were refined to determine their
core aspects and to create an overarching story of the analysis. Finally, a report was created to
highlight the themes in a coherent and logical manner so as to help supplement the research
study.
5.5 CHAPTER SUMMARY
This chapter provides an overview of the intended approach to this investigation. The research
methodology discussed focused on the research settings, research design, participants,
measuring instruments, research procedures, data analysis and ethical considerations. The
following chapter focuses on the presentation of the results from the empirical study.
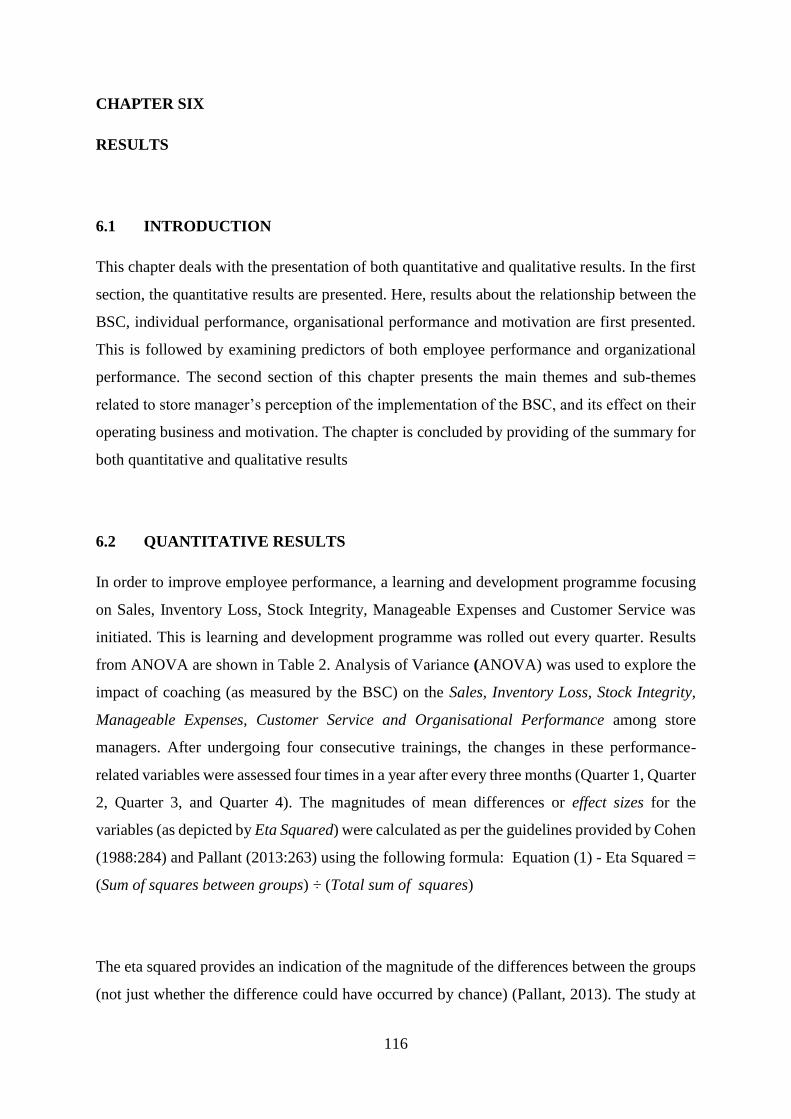
116
CHAPTER SIX
RESULTS
6.1 INTRODUCTION
This chapter deals with the presentation of both quantitative and qualitative results. In the first
section, the quantitative results are presented. Here, results about the relationship between the
BSC, individual performance, organisational performance and motivation are first presented.
This is followed by examining predictors of both employee performance and organizational
performance. The second section of this chapter presents the main themes and sub-themes
related to store manager’s perception of the implementation of the BSC, and its effect on their
operating business and motivation. The chapter is concluded by providing of the summary for
both quantitative and qualitative results
6.2 QUANTITATIVE RESULTS
In order to improve employee performance, a learning and development programme focusing
on Sales, Inventory Loss, Stock Integrity, Manageable Expenses and Customer Service was
initiated. This is learning and development programme was rolled out every quarter. Results
from ANOVA are shown in Table 2. Analysis of Variance (ANOVA) was used to explore the
impact of coaching (as measured by the BSC) on the Sales, Inventory Loss, Stock Integrity,
Manageable Expenses, Customer Service and Organisational Performance among store
managers. After undergoing four consecutive trainings, the changes in these performance-
related variables were assessed four times in a year after every three months (Quarter 1, Quarter
2, Quarter 3, and Quarter 4). The magnitudes of mean differences or effect sizes for the
variables (as depicted by Eta Squared) were calculated as per the guidelines provided by Cohen
(1988:284) and Pallant (2013:263) using the following formula: Equation (1) - Eta Squared =
(Sum of squares between groups) ÷ (Total sum of squares)
The eta squared provides an indication of the magnitude of the differences between the groups
(not just whether the difference could have occurred by chance) (Pallant, 2013). The study at
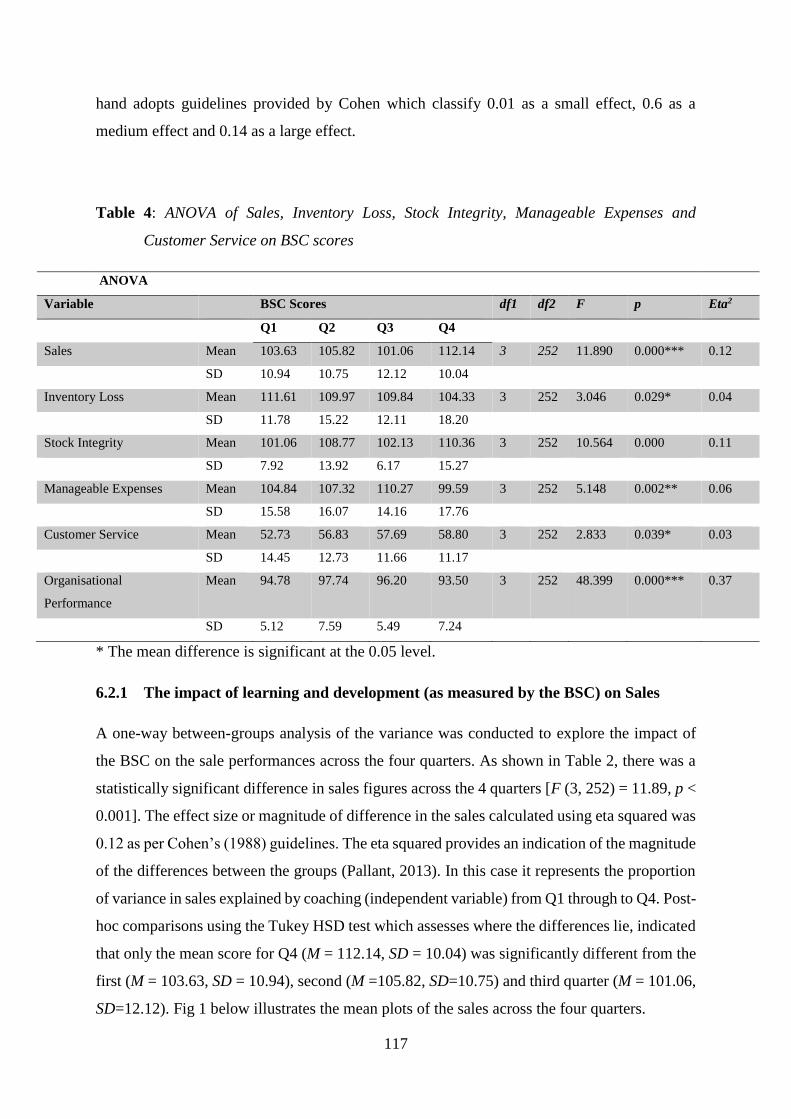
117
hand adopts guidelines provided by Cohen which classify 0.01 as a small effect, 0.6 as a
medium effect and 0.14 as a large effect.
Table 4: ANOVA of Sales, Inventory Loss, Stock Integrity, Manageable Expenses and
Customer Service on BSC scores
ANOVA
Variable BSC Scores df1 df2 F p Eta2
Q1 Q2 Q3 Q4
Sales Mean 103.63 105.82 101.06 112.14 3 252 11.890 0.000*** 0.12
SD 10.94 10.75 12.12 10.04
Inventory Loss Mean 111.61 109.97 109.84 104.33 3 252 3.046 0.029* 0.04
SD 11.78 15.22 12.11 18.20
Stock Integrity Mean 101.06 108.77 102.13 110.36 3 252 10.564 0.000 0.11
SD 7.92 13.92 6.17 15.27
Manageable Expenses Mean 104.84 107.32 110.27 99.59 3 252 5.148 0.002** 0.06
SD 15.58 16.07 14.16 17.76
Customer Service Mean 52.73 56.83 57.69 58.80 3 252 2.833 0.039* 0.03
SD 14.45 12.73 11.66 11.17
Organisational
Performance
Mean 94.78 97.74 96.20 93.50 3 252 48.399 0.000*** 0.37
SD 5.12 7.59 5.49 7.24
* The mean difference is significant at the 0.05 level.
6.2.1 The impact of learning and development (as measured by the BSC) on Sales
A one-way between-groups analysis of the variance was conducted to explore the impact of
the BSC on the sale performances across the four quarters. As shown in Table 2, there was a
statistically significant difference in sales figures across the 4 quarters [F (3, 252) = 11.89, p <
0.001]. The effect size or magnitude of difference in the sales calculated using eta squared was
0.12 as per Cohen’s (1988) guidelines. The eta squared provides an indication of the magnitude
of the differences between the groups (Pallant, 2013). In this case it represents the proportion
of variance in sales explained by coaching (independent variable) from Q1 through to Q4. Post-
hoc comparisons using the Tukey HSD test which assesses where the differences lie, indicated
that only the mean score for Q4 (M = 112.14, SD = 10.04) was significantly different from the
first (M = 103.63, SD = 10.94), second (M =105.82, SD=10.75) and third quarter (M = 101.06,
SD=12.12). Fig 1 below illustrates the mean plots of the sales across the four quarters.
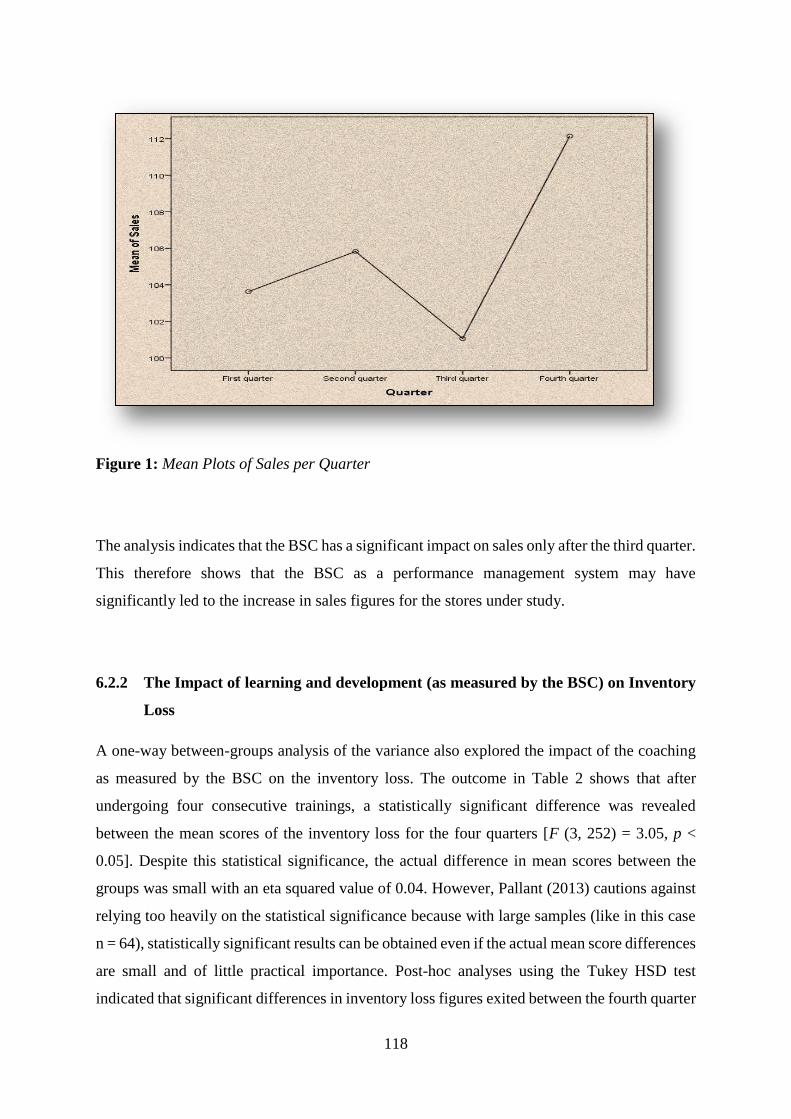
118
Figure 1: Mean Plots of Sales per Quarter
The analysis indicates that the BSC has a significant impact on sales only after the third quarter.
This therefore shows that the BSC as a performance management system may have
significantly led to the increase in sales figures for the stores under study.
6.2.2 The Impact of learning and development (as measured by the BSC) on Inventory
Loss
A one-way between-groups analysis of the variance also explored the impact of the coaching
as measured by the BSC on the inventory loss. The outcome in Table 2 shows that after
undergoing four consecutive trainings, a statistically significant difference was revealed
between the mean scores of the inventory loss for the four quarters [F (3, 252) = 3.05, p <
0.05]. Despite this statistical significance, the actual difference in mean scores between the
groups was small with an eta squared value of 0.04. However, Pallant (2013) cautions against
relying too heavily on the statistical significance because with large samples (like in this case
n = 64), statistically significant results can be obtained even if the actual mean score differences
are small and of little practical importance. Post-hoc analyses using the Tukey HSD test
indicated that significant differences in inventory loss figures exited between the fourth quarter
119
(M = 104.33, SD = 18.20) and the first quarter (M = 111.61, SD = 11.78). Further, the mean
plots of the inventory loss for the four quarters are diagrammatically shown in Fig 2.
Figure 2: Mean plots of Inventory Loss per Quarter
Fig 2 shows a significant drop in inventory loss i.e. merchandise for possible sales been
misplaced or stolen which indicates that using the BSC as a performance management system
had a gradual and significant impact on inventory loss throughout the period of assessment
with a sharp drop after the third quarter.
6.2.3 The Impact of the learning and development (as measured by the BSC) on
Manageable Expenses
Further between-groups analysis of the variance conducted to explore the impact of the BSC
as a performance management system on the manageable expenses show in Table 2 that
statistically significant differences (medium practical effect; 0.06) exist between the mean
scores of manageable expenses [F (3, 252) = 5.148, p < 0.01]. The Post-hoc revealed that the
mean manageable expenses scores of Q4 (M = 99.59, SD = 17.76) were significantly different
from Q2 (M = 107.32, SD = 16.07) and Q3 (M = 110.27, SD = 12.11). Fig 3 below further

120
illustrates the differences between the scores of manageable expenses across the assessment
period.
Figure 3: Mean plots of Manageable Expenses per Quarter
The analysis indicates that the BSC as a performance management system has a significant
impact on manageable expenses only after the quarter session. The significant drop in
Manageable Expenses is an indication that a manager is managing their expenses well as
manageable expenses affect stores profitability.
6.2.4 The Impact of the learning and development (as measured by the BSC) on Stock
Integrity
After undergoing four consecutive trainings, respondents were assessed on stock integrity
across four quarters of the year. The results from a one-way between-groups analysis of the
variance revealed that a practically and statistically significant differences (larger effect; 0.11)
were found between the mean scores of Stock Integrity [F (3, 252) = 10.57, p < 0.001] (see
Table 2). The Post-hoc comparisons using the Tukey HSD test indicated that the mean score
for Stock Integrity in the fourth quarter (M = 110.36, SD = 15.267) was significantly different
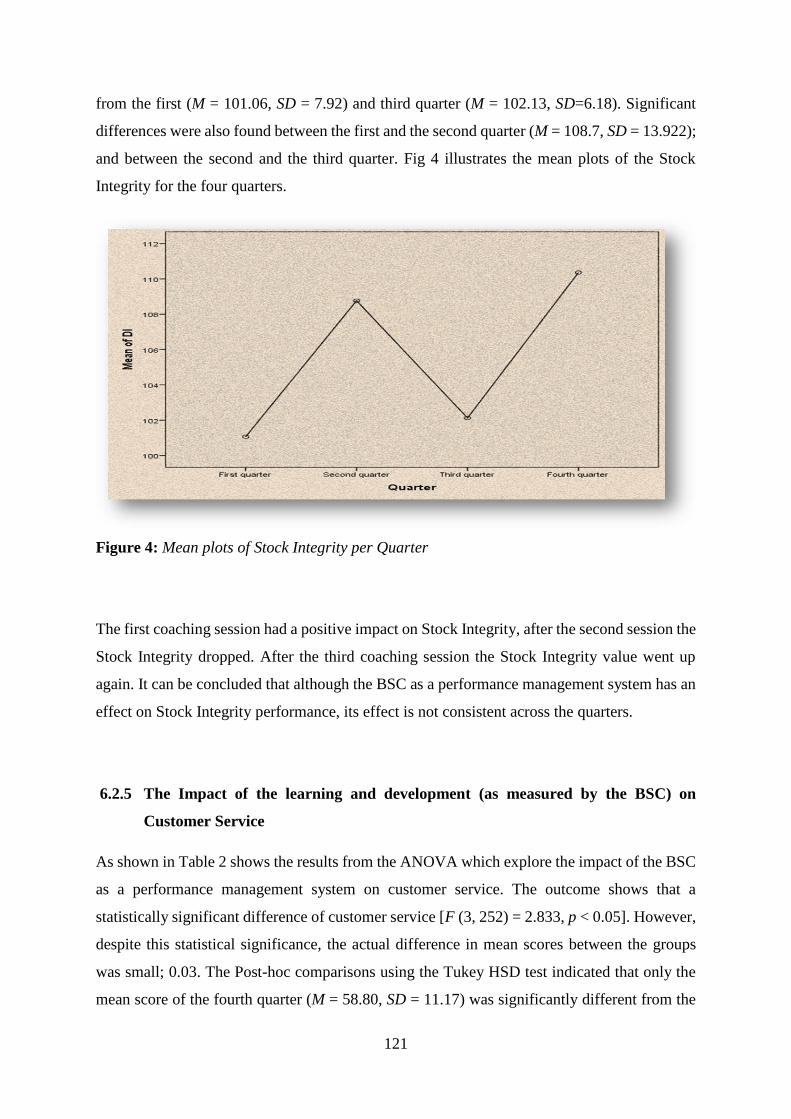
121
from the first (M = 101.06, SD = 7.92) and third quarter (M = 102.13, SD=6.18). Significant
differences were also found between the first and the second quarter (M = 108.7, SD = 13.922);
and between the second and the third quarter. Fig 4 illustrates the mean plots of the Stock
Integrity for the four quarters.
Figure 4: Mean plots of Stock Integrity per Quarter
The first coaching session had a positive impact on Stock Integrity, after the second session the
Stock Integrity dropped. After the third coaching session the Stock Integrity value went up
again. It can be concluded that although the BSC as a performance management system has an
effect on Stock Integrity performance, its effect is not consistent across the quarters.
6.2.5 The Impact of the learning and development (as measured by the BSC) on
Customer Service
As shown in Table 2 shows the results from the ANOVA which explore the impact of the BSC
as a performance management system on customer service. The outcome shows that a
statistically significant difference of customer service [F (3, 252) = 2.833, p < 0.05]. However,
despite this statistical significance, the actual difference in mean scores between the groups
was small; 0.03. The Post-hoc comparisons using the Tukey HSD test indicated that only the
mean score of the fourth quarter (M = 58.80, SD = 11.17) was significantly different from the
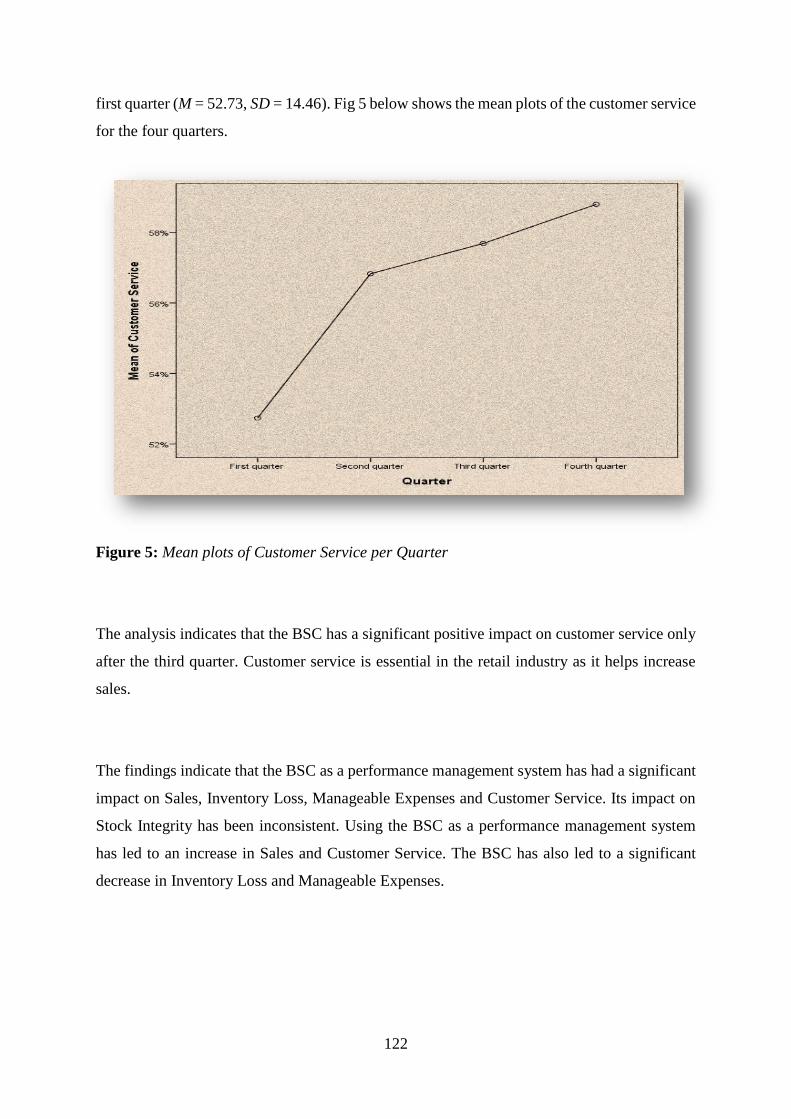
122
first quarter (M = 52.73, SD = 14.46). Fig 5 below shows the mean plots of the customer service
for the four quarters.
Figure 5: Mean plots of Customer Service per Quarter
The analysis indicates that the BSC has a significant positive impact on customer service only
after the third quarter. Customer service is essential in the retail industry as it helps increase
sales.
The findings indicate that the BSC as a performance management system has had a significant
impact on Sales, Inventory Loss, Manageable Expenses and Customer Service. Its impact on
Stock Integrity has been inconsistent. Using the BSC as a performance management system
has led to an increase in Sales and Customer Service. The BSC has also led to a significant
decrease in Inventory Loss and Manageable Expenses.
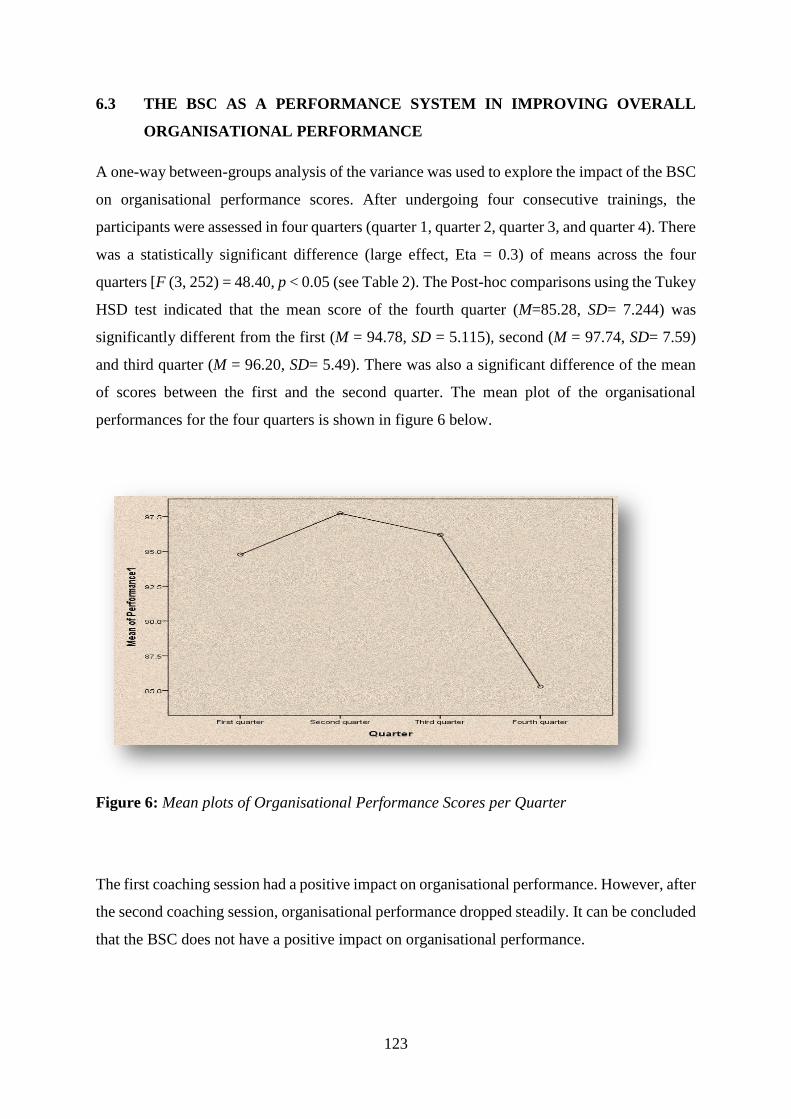
123
6.3 THE BSC AS A PERFORMANCE SYSTEM IN IMPROVING OVERALL
ORGANISATIONAL PERFORMANCE
A one-way between-groups analysis of the variance was used to explore the impact of the BSC
on organisational performance scores. After undergoing four consecutive trainings, the
participants were assessed in four quarters (quarter 1, quarter 2, quarter 3, and quarter 4). There
was a statistically significant difference (large effect, Eta = 0.3) of means across the four
quarters [F (3, 252) = 48.40, p < 0.05 (see Table 2). The Post-hoc comparisons using the Tukey
HSD test indicated that the mean score of the fourth quarter (M=85.28, SD= 7.244) was
significantly different from the first (M = 94.78, SD = 5.115), second (M = 97.74, SD= 7.59)
and third quarter (M = 96.20, SD= 5.49). There was also a significant difference of the mean
of scores between the first and the second quarter. The mean plot of the organisational
performances for the four quarters is shown in figure 6 below.
Figure 6: Mean plots of Organisational Performance Scores per Quarter
The first coaching session had a positive impact on organisational performance. However, after
the second coaching session, organisational performance dropped steadily. It can be concluded
that the BSC does not have a positive impact on organisational performance.
124
The final analysis indicates that although the BSC has led to an increase in an employee’s KPI
performance, this performance did not translate to an increase in the organisations
performance. While Organisational Performance is significantly affected by Sales, Inventory
Loss and Manageable Expenses, as well as Customer Service and Stock Integrity, there are
other factors that seem to have a more profound impact on organisational performance than
these KPI’s alone.
Factors that can affect Organisational Performance include the company’s trading margins.
Trading Margins refer to the difference between the sales of the goods and costs of selling of
the goods been sold. If the trading margin of the sales and cost of sales of foods been sold is
too low, then a company is most likely to have a low Organisational Performance. Another
important factor affecting Organisational Performance is cash and credit sales. Most retailer,
like Retek, have a strong focus on credit on top of their retailing business. However, while this
can lead to an increase in Organisational Performance, it also comes with the risk of bad debts
i.e. customers who cannot pay their accounts. Therefore, even though Retek has increase Sales
and decreased Inventory Loss and Manageable Expenses, other factors may have impacted on
Organisational Performance such as Credit Sales and Trading Margins.
6.4. THE BSC EFFECTIVENESS IN CREATING INTRINSIC MOTIVATION
6.4.1 Predicting motivation from year end BSC
According to table 3, the BSC does not predict the employee motivation because F= .936 and
p value = .337 which is greater than .05.
6.4.2 Predicting employee performance from BSC and motivation
According to table 2.7% of the variance of the dependent variable is explained by employee
motivation and BSC. Table 20 indicates that the proposed model is not valid because F = .848
and p value =.433 >.05. This means that BSC and motivation are not predicting employee
performance.
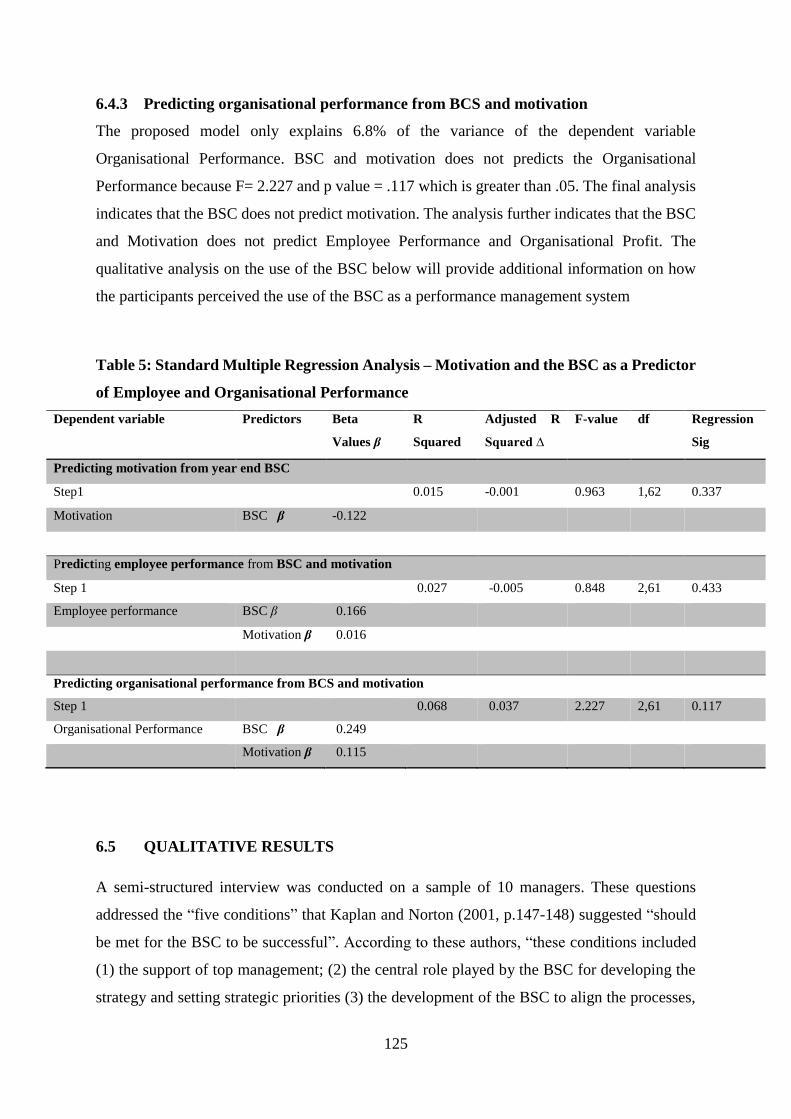
125
6.4.3 Predicting organisational performance from BCS and motivation
The proposed model only explains 6.8% of the variance of the dependent variable
Organisational Performance. BSC and motivation does not predicts the Organisational
Performance because F= 2.227 and p value = .117 which is greater than .05. The final analysis
indicates that the BSC does not predict motivation. The analysis further indicates that the BSC
and Motivation does not predict Employee Performance and Organisational Profit. The
qualitative analysis on the use of the BSC below will provide additional information on how
the participants perceived the use of the BSC as a performance management system
Table 5: Standard Multiple Regression Analysis – Motivation and the BSC as a Predictor
of Employee and Organisational Performance
Dependent variable Predictors Beta
Values β
R
Squared
Adjusted R
Squared ∆
F-value df Regression
Sig
Predicting motivation from year end BSC
Step1 0.015 -0.001 0.963 1,62 0.337
Motivation BSC β -0.122
Predicting employee performance from BSC and motivation
Step 1 0.027 -0.005 0.848 2,61 0.433
Employee performance BSC β 0.166
Motivation β 0.016
Predicting organisational performance from BCS and motivation
Step 1 0.068 0.037 2.227 2,61 0.117
Organisational Performance BSC β 0.249
Motivation β 0.115
6.5 QUALITATIVE RESULTS
A semi-structured interview was conducted on a sample of 10 managers. These questions
addressed the “five conditions” that Kaplan and Norton (2001, p.147-148) suggested “should
be met for the BSC to be successful”. According to these authors, “these conditions included
(1) the support of top management; (2) the central role played by the BSC for developing the
strategy and setting strategic priorities (3) the development of the BSC to align the processes,
126
the services and the competencies of the organisation; (4) the degree of implication of everyone
in the development of the BSC; and (5) the extent to which the BSC influences management
practices, processes and systems on a continuous basis”.
The semi-structured interviews which were analysed thematically resulted in the emergence of
several themes (Table 4). These themes pertained to the Store Managers perception of the
implementation of the BSC, and its effect on their operating business and motivation. The
themes included managerial support, communication, strategic alignment to employee and
organisational goals, influence on management practices, and the impact on work motivation.
These themes also led to the emergence of several sub-themes including support from business
management and HR management; the importance of communication plans and how it is
cascaded to all employees; the alignments of the BSC KPI’s to the organisational goals, the
effect of the BSC on store profitability, the influence of the BSC on improving efficiencies in
management practices, and the managers buy-in; its effect on work motivation, alignment to
rewards, and its impact on staff. The statements from the interviewees represent verbatim
responses that were given by the ten employees during the semi-structured interviews.
According to Mullins (2007), people see things different ways, and have their own unique
image or picture of how they see the world. This process according to Mullins (2007), is
complex and dynamic. Using semi-structured interviews, this study aims to understand whether
the implementation of the BSC impacted on a store manager’s way of working, and their
motivation levels. The semi-structured interviews provided rich data in terms of how the
managers perceived the BSC implementation. Managers also expressed different views on how
the BSC influenced their motivational levels. By integrating their views, it became evident that
most of the store managers perceived the BSC as a positive influence on their way of working,
and their motivational levels. The views of the store managers and the related themes and sub-
themes are discussed below.
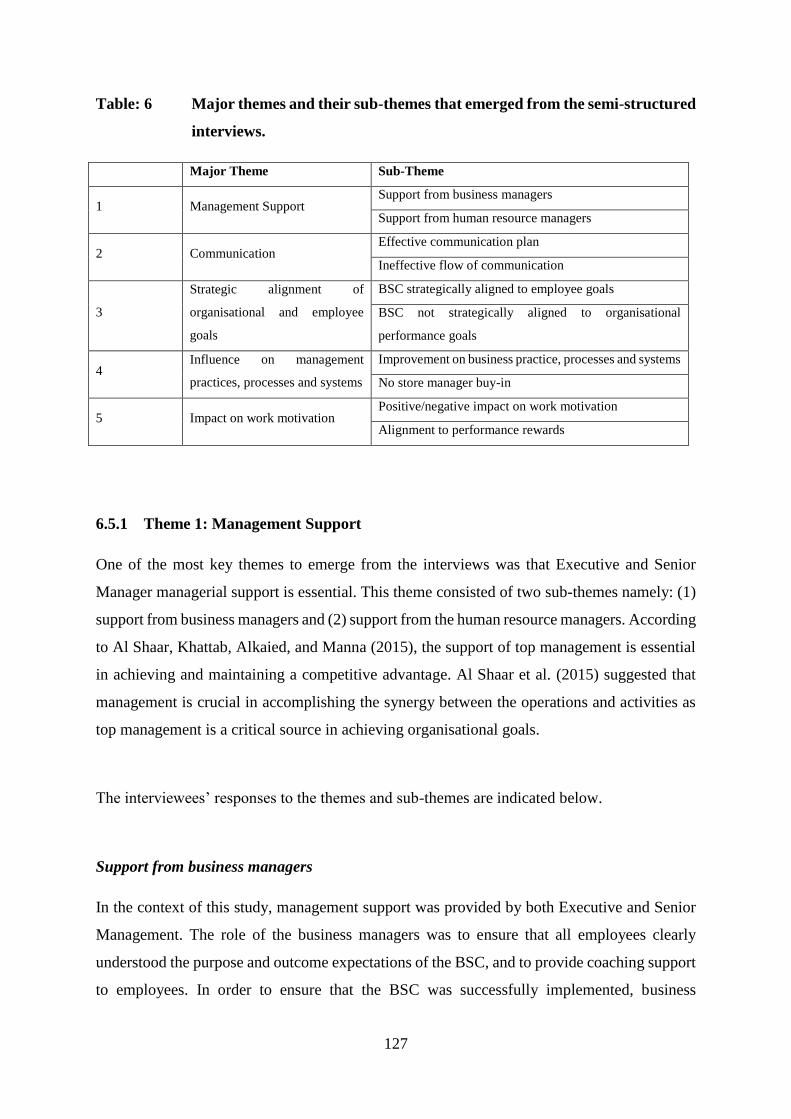
127
Table: 6 Major themes and their sub-themes that emerged from the semi-structured
interviews.
Major Theme Sub-Theme
1 Management Support Support from business managers
Support from human resource managers
2 Communication Effective communication plan
Ineffective flow of communication
3
Strategic alignment of
organisational and employee
goals
BSC strategically aligned to employee goals
BSC not strategically aligned to organisational
performance goals
4 Influence on management
practices, processes and systems
Improvement on business practice, processes and systems
No store manager buy-in
5 Impact on work motivation Positive/negative impact on work motivation
Alignment to performance rewards
6.5.1 Theme 1: Management Support
One of the most key themes to emerge from the interviews was that Executive and Senior
Manager managerial support is essential. This theme consisted of two sub-themes namely: (1)
support from business managers and (2) support from the human resource managers. According
to Al Shaar, Khattab, Alkaied, and Manna (2015), the support of top management is essential
in achieving and maintaining a competitive advantage. Al Shaar et al. (2015) suggested that
management is crucial in accomplishing the synergy between the operations and activities as
top management is a critical source in achieving organisational goals.
The interviewees’ responses to the themes and sub-themes are indicated below.
Support from business managers
In the context of this study, management support was provided by both Executive and Senior
Management. The role of the business managers was to ensure that all employees clearly
understood the purpose and outcome expectations of the BSC, and to provide coaching support
to employees. In order to ensure that the BSC was successfully implemented, business
128
managers were tasked with the responsibility of holding BSC workshops and regular monthly
meeting with their staff. The purpose of these workshops and meetings was to address any
issues and concerns related to the BSC implementation in the business.
The majority of the respondents were in agreement that they received good support from their
senior managers. This was evident by; amongst other, the respondents direct line managers
making themselves available for meetings, clearly explaining the purpose and outcomes of the
BSC, communicating the significance of the BSC as a performance management system.
“My direct manager provides my staff and me with constant support. She has clearly outlined
the objectives and purpose of the BSC for performance management. (Interview 2)”.
“I have a great manager. From the time the BSC was implemented she was there for us,
explaining and reiterating the purpose and expectations. If it wasn’t for her support, we would
all be lost. (Interview 7)”.
Both Interviewee 2 and 7 clearly felt that their business managers provided them with good
management support. As highlighted by Kaplan and Norton (2001, p.147), “top management
support is important for the successful implementation of the BSC”. The positive responses
from both interviewees seem to indicate that some managers took accountability and
responsibility for ensuring that their staff was fully informed of the purpose and objectives of
the BSC. This, in turn, resulted in the managers feeling comfortable with the implementation
of the BSC. Management support is imperative for the BSC to be properly implemented. Top
and seniors managers need to ensure that the purpose and objectives of the BSC are clearly
outlines, and that the organisations expectations are understood by all employees.
129
Support from the human resource managers
In addition to the support from managers, some of the respondents highlighted the importance
the human resource department played in the implementation of the BSC. They indicated that
the human resource department played a critical role in explaining and integrating the BSC into
the business.
“My Human Resource (HR) Manager has been amazing in helping us translate the BSC to all
levels of the staff. She has had a hands-on approach, and works well with our direct managers
to ensure the successful implementation of the BSC in the division. (Interview 5)”.
The above narrative highlighted the role of the HR department. It appears that the HR
department played a critical role in facilitating the BSC implementation process. It seems that
the role of the HR department was not only to support staff from a business and performance
perspective, but to focus more specifically on the store managers’ individual needs. While
business managers have a critical role to play, the ‘hands on’ approach by the HR department
can also ensure that the BSC will be successfully implemented. The HR department adds a
‘peoples approach’, that is, an approach that focuses on the capabilities of the individual, and
not only on their performance goals. It appears the support from both business and HR will
better enable the BSC implementation process.
Although most of the store managers felt that their managers and human resource managers
adequately supported them throughout the implementation of the BSC, some indicated that
they received very little support, or no support.
“Although my Executive supported us, my Senior Managers failed to provide sufficient support
as they were too busy with other stuff. (Interview 1)”.
130
“Our senior management was only focused on sales and nothing else. They provided me with
no support at all, and did not even explain the purpose and objective of the BSC when it was
introduced. What disappointed me the most was that when I met my colleagues at our monthly
regional and divisional meetings, they spoke in great detail of the support their managers were
giving them (Interview 6).”
While the mandate to the executive and senior managers was to provide sufficient support to
all employees, it was evident from some of the interviewees that this was not the case. For
example, both interviewees 1 and 6 felt that their managers did not provide them with good
support. The lack of support may have resulted in the purpose and objective of the BSC not
been clearly understood and accepted. This, in turn, may have resulted in managers not
knowing what the BSC expectations and outcomes may be. Therefore, it’s important that
management support is consistent throughout the organisation, and relevant steps must be taken
to upskill managers prior to the implementation of the BSC.
From the above narratives, it seems that the support from senior management was not
consistent. For some of the store managers, they received very good support from both their
senior managers and human resource managers. However, some of the store managers felt that
the support was inadequate, or none at all. A key strategic imperative employed by the
organisation was to ensure that senior managers adequately provide guidance and support to
their store managers. The human resource department was also contracted to facilitate this
process, as well as to roll out workshops to properly explain the purpose and outcomes of the
BSC. In order to mitigate this concern, top management and senior executives will need to
reiterate and drive this imperative consistently with all their senior managers.
6.5.2 Theme 2: Communication
All the interviewees express different views on how the BSC is communicated to them.
According to Tennyson and Ray (2005), an effective communication plan must focus on
organisational goals and not just communication goals. These authors believed that a
communication plan that depends on communication goals seem to promote
communication programs, and don’t essentially support the organisations goals. According to
these authors, an effective communication plan must begin with organisational goals, which

131
will ensure that the communication activities will support the overall goals and objectives of
the organisation.
The sub-themes for the communication themes are (1) the need for a communication plan and
(2) the communication plan must be distributed equally to all levels within the organisation.
The interviewees’ responses to the themes and sub-themes are indicated below
Effective communication plan
Kaplan and Norton (1991) highlighted the need for a good communication plan for the BSC to
be successfully implemented. An effective communication plan clearly defines the objectives
and purpose of the BSC, as well as the organisational expectations. Most of the interviewees
indicated that they felt that the BSC communication plan was comprehensive, and clearly
outlined the objectives, purpose and expectation of the organisation. However, some
respondents highlighted certain concerns around the way certain executive and senior managers
executed the BSC communication plan.
The majority of the respondents indicated that the BSC communication plan was good, and
clearly explained the purpose, expectations and outcomes of the BSC implementations. This
was evident by; amongst others, the communication plan was good and feedback was received
regularly, the communication plan was comprehensive and shared with all employees, and staff
was kept well-informed constantly.
“The communication plan was solid and continuous. We received communication almost every
week on the purpose and outcomes expected from the BSC. The communication team did a
great job. (Interview 2)”.
“My hat off to the HR Communication team. They did a fantastic job of ensuring that all my
staff clearly understood the purpose of the BSC. (Interview 9)”.
132
Ineffective flow of communication
The effective flow of communication to all levels in the organisation is very important. In this
study, the organisation designed a communication plan that attempted to reach all employees
at the different levels. The communication mediums consisted workshops, meetings, corporate
mails, and many others. While the organisation was confident that their BSC communication
plan was effective, many of the respondents felt that the flow of communication was not very
good. According to Biggart, Burney, Flanagan and Harden (2010), management should create
a common feedback process for communicating that cascades across all levels of the
organisation, and should ensure that all employees are well versed regarding the relation
between the organisations strategy and the BSC. This ensures that the same message is
communicated equally to all employees, and that the necessary steps are taken to ensure that
the BSC message is understood by all.
In addition, they felt that the tone and level of the communication plan was not user-friendly
to staff at the middle and lower levels. This was evident, amongst other by the lack of feedback
regarding concerns and issues, no consistency amongst senior managers in explaining the BSC
to staff, the use of electronic means of communications, non-management staff not
understanding the BSC because it was delivered at a high-level. These are illustrated by the
narratives below:
“I think the way we went about communicating the BSC purpose and strategy was very poor.
It led to lots of issues and concerns from myself, and my staff. No one communicated how it
would benefit us, which for me is imperative. (Interview 1)”.
“I liked the communication plan in helping us understand the BSC strategy. However, I feel
that more thought should have went into how our staff on the floor will understand the BSC.
It’s very high level, and most people will not get it. (Interview 8)”.
133
“The communication was very poor. Emails and corporate mails add little or no value when it
comes to understanding such an important initiative. Our managers should have, and could
have done better. (Interview 10)”.
Interviewees 1, 8 and 10 expressed very strong views around the way the BSC communication
plan was implemented. It appeared that the BSC communication plan did not properly explain
how employees could benefit from its implementation. There was also a concern around the
fact that non-management did not fully understand the objectives and purpose of the BSC.
Managers felt that the level at which the BSC was explained was not easily understood by their
staff. Finally, while the use of electron communication enabled executive and senior managers
to reach all staff, this was not preceded by a proper one-on-one or verbal discussion. In order
for the BSC to be properly understood and implemented, there needed to be a detailed
understanding of its purpose and objectives through workshops and meetings, as opposed to
electronic mediums only.
From the above narratives, it appears that although the organisation designed a comprehensive
BSC communication plan, the delivery of the plan by some senior managers was not good. In
addition, it appears that the level at which the plan was designed was not suitable to non-
management employees. While, many of the managers were complementary of the
communication plan, the inconsistency at which it was rolled out is a concern. To mitigate this
risk, the BSC communication plan must be designed to ensure an understanding at all levels of
the organisation, must be delivered consistently by all relevant stakeholders, and must clearly
and concisely ensure an understanding of the purpose, expectations, and outcomes required by
the BSC.
6.5.3 Theme 3: Strategic alignment to organisational and employee goals
The interviewees express different perspectives on the strategic impact and alignment of the
BSC on the organisation’s performance goals and their own goals. According to Kaplan and
Norton (2001, p.147), “the strategic alignment of the organisation to the strategy is imperative
for the BSC to be successfully implemented”. This ensures that the employee’s goals are
aligned to the organisational goals, which in turn, are aligned to the BSC KPI’s.
134
The sub-themes for the strategic alignment to organisational and employee goals are (1) the
BSC is aligned to the employee goals and (2) the BSC is not aligned to the organisational goals.
The interviewees’ responses to the themes and sub-themes are indicated below.
BSC strategically aligned to employee goals
It order to manage the performance of the employees using the BSC, it is essential that the BSC
KPI’s are aligned to the employee goals. This is important as the goals that managers are
performance manages on, must be the same goals in their performance agreements and in the
BSC KPI’s. There was a general agreement amongst most of the respondents that the BSC is
strategically aligned to their employee goals. The store managers’ main goal is to sell more
products and services to increase their sales, and since their sales target formed part of the BSC
key performance indicators (KPI’s), they felt that there was a strategic alignment between their
goals and the BSC. This was evident, amongst others by, a clear alignment between
performance goals and the BSC’s KPI’s and the alignment to the sales targets.
‘The BSC is incredible in that we finally getting measured on things that impact in our store.
Our only interest is in increasing the sales of our store, and if we increase the sales, we make
more money for the organisation. (Interview 6)”.
‘Our business is driven by sales and costs. Therefore, if the performance indicates measure
sales and costs, then something is right. There is clear alignment, as increased sales lead to
increase profitability. (Interview 8)”
“The BSC helped me focus on the internal processes of the store. The alignment to costs, and
its impact on the overall performance of my store was surprising. I’m really happy we have a
strategy that measures our business holistically. (Interview 9)”.
135
It is clear from the responses that the BSC KPI’s were aligned to the employees’ goals. This
ensured that the training programmes that the employees were performance managed on in
terms of the BSC, aligned to their performance goals. Therefore, any improvement in their BSC
score, resulted in an improved in their individual performance score.
BSC not strategically aligned to organisational goals
It was interesting to note that although the BSC seemed to align to employee goals, some of
the respondents felt that there was no alignment of the BSC to the organisational performance
goals. This alignment is critical to the business as De Geuser, Mooraj and Oyon (2009, p.93)
found that “when the BSC is used to align resources to the strategic objectives, it apparently
leads to positive organisational performance”. Conversely, Decoene and Bruggeman (2006,
p.429) found that the lack of strategic alignment negatively impacted managers' intrinsic
motivation to improve organisational performance.
The organisational performance goals determine the profitability of the store. The stores
profitability contribute to the overall profitability of the organisation. The feeling that the
organisational goals were not aligned to the BSC was a concern. The reason been that any
improvement in the BSC KPI’s would not have a significant impact on the stores profitability,
and ultimately the organisations profitability.
‘My manager showed me how the BSC KPI’s relate to my goals. She also tried to explain how
it would increase my store’s trading profit. We spent an hour discussing this, but I still did not
see the alignment. Honestly, I don’t think there is an alignment. (Interview 8).”
“There is no alignment between the KPI’s and my store making money. Sure sales is there, but
profitability of the store goes beyond sales. We talking profit margins. I can sell all my
products, but if the profit margins are low, what’s the point. Furthermore, I don’t see how the
BSC to linked to our organisational goals. To be honest, I have seen no improvement in my
136
trading profit. Maybe if management spoke to us before rolling out the BSC, we could have
advised them of this’ (Interview 4).”
From the above narratives, it seems that the BSC is strategically aligned to the employee goals,
but there is a feeling that it does align to the organisational performance goals. In order for the
BSC to be effective, the BSC KPI’s must align to the employee goals, which in turn must align
to the organisational performance goals. This ensures that an employees’ performance is
directly linked to the performance of the organisation. In other words, if the employee performs
well, then ideally the organisation should perform well. Therefore, it is important for the
organisation to ensure that an employee’s performance agreement correctly reflects what the
organisations expectations are, and that the performance measures that are put in place, align
to these expectations.
6.5.4 Theme 4: Influence on management practices, processes and systems
The interviewees have different views on the influence of the BSC on management practices,
processes and systems. De Geuser et al. (2009) found that the BSC improved the integration of
management processes. Management processes become effective when they are seamless and
less complicated.
The sub-themes for the influence on management practices, processes and systems are (1)
impact on improving internal business processes and procedures and (2) store manager buy-in.
The interviewees’ responses to the themes and sub-themes are indicated below
Improvement on business practice, processes and systems
The BSC’s focus on internal business processes enables the organisation to adequately assess
the customers’ requirements (Johnson & Scholes, 2002). According to Ba-Abaad (2009, p.40-
41), the internal business process “focuses on all the activities and key processes required in
order for the company to excel at providing the value expected by the customers, both
productively and efficiently”. The BSC KPI’s of inventory loss, stock integrity and manageable
137
expenses related to the organisation focusing its efforts on improving its internal business
processes.
There was a mixed response from the participants regarding whether the BSC improved their
business practices and processes. It seemed evident that some of the managers felt that the BSC
added tremendous value to the way they worked. One of the purposes of the BSC is to improve
internal business processes, and the some of the responses seemed to indicate this; amongst
others, business practices and processes are managed effectively and efficiently, ways of
working has improved, training is more focused on opportunity areas.
“The BSC helped me change the way I use to work. I didn’t focus on our processes as I believed
those were not in my control. However, after seeing my results on customer service, inventory
loss and stock integrity, I realised that I had the power to change this. I got my staff on-board,
and together we reviewed our action plans and checklists. The results were excellent.
(Interview 2)”.
“My biggest issues was stock loss. I did well on sales, but could not control stock loss. The
BSC has helped me improve my processes and practice so that I can now effectively manage
these issues. My way of working has improved substantially. (Interview 5)”.
The narratives above clearly indicate that some of the respondents had a favourable view on
how the BSC enabled them to improve their internal business processes. The improvement in
inventory loss and stock integrity not only decreases operational costs, but also ensure that
there is sufficient stock in the store for customers. This ensures that the needs of the customer
is met, which ultimately leads to an increase in sales, and in turn an increase in the store
profitability.
138
No store manager buy-in
It order for the BSC to be successful, there needed to be manager buy-in. As highlighted above,
many of the manager did not fully understand the purpose and objective of the BSC due to a
lack of management support, and a perceived poor communication plan. This may have
resulted in managers not ‘buying in’ to the BSC process. This issue can be mitigated by senior
managers playing an active role in clearly discussion and ensuring an understanding of the BSC
objectives, purpose and expectations, as well as the organisation implementing a proper
communication plan.
As indicated, some of the participants did not seem to buy-in to the BSC process. This was
evident; amongst other by, training on KPI’s are unnecessary, there’s a preference to the ‘old
way of working’, the view that the BSC was tedious and unnecessary. The feeling among these
managers was that the store is their responsibility, and therefore they know what works and
what doesn’t. From an organisational perspective, this is a serious concern. In order for the
BSC, or any management process to work, it is essential to get employee buy-in. Employee
buy-in can determine the success or failure of a process, and hence a management support, a
good communication plan, and employee participation is critical.
“All this coaching and training on KPI’s is unnecessary. Employees will perform well if the
manager drives a performance driven environment. For me, this is just additional paper work.
“(Interview 1)”.
“The sales for the store is my responsibility, and I prefer using measures that has worked for
me. I have constantly met my sales target, so why must I change the way I work. The BSC may
work for other stores, and that is great. However, I believe that if it’s not broken, don’t try to
fix it. I’m happy with the way I manage my people and business. (Interview 10)”.
The above narratives seems to indicate that the BSC added some value to improving the
business internal processes of the managers. Managers indicated improvements in their ways
139
of working, as well as improvements in their targets. However, there was a feeling that the
implementations of the BSC was unnecessary and that the focus on KPI’s was tedious. There
was also a concern regarding manager’s buy-in into the BSC implementation. This is a concern
as the store managers drive the process. If they don’t support the process, then the process will
most likely fail. It should be the responsibility of top and senior management to ensure that all
employees have a clear understanding of the BSC strategy, and how it links to the business
strategy.
6.5.5 Theme 5: Impact on work motivation
The store managers express varied feelings with regard to the impact of the BSC on their
motivational levels. Employee motivation is very important in organisations, as studies have
shown motivation positively influences job satisfaction, career success and performance
(Furnham, Eracleous & Camorro-Premuzic, 2009, and Wayne, Liden, Kraimer, & Graf, 1999).
With regard to the positive impact of motivation and the BSC, research by Malina and Selto
(2001) and Decoene and Bruggeman (2006) indicate that motivation plays a significant role in
the BSC setting. These authors suggest that the BSC can lead to an increase in the motivational
levels of employees.
The sub-themes for the impact on work motivation are (1) the positive and/or negative impact
on work motivation (2) the alignment to performance rewards. The interviewees’ responses to
the themes and sub-themes are indicated below
Positive and/or negative impact on work motivation
The BSC can either have a positive or negative impact on motivation. For example, Malina and
Selto (2001) found that the BSC had a positive impact on organisational outcomes by creating
positive motivation. According to Malina and Selto (2001, p.53), the BSC “induced managers
to exert more effort in assisting employees who needed to achieve organisational objectives”.
Conversely, Decoene and Bruggeman (2006, p.444) found that the “lack of strategic alignment
negatively impacted managers' intrinsic motivation to improve organisational performance”.
According to these authors, the lack of strategic cascading led to middle-level managers
perceiving that their performance measures was uncontrollable.
140
There was a mixed reaction to the effects of the BSC on work motivation. This was evident;
amongst other, by the feeling that the BSC made the work more seamless and added value,
staff seemed to feel motivated by working towards actual goals that impacted on the stress, and
sales increased and costs decreased.
“I personally feel the BSC has added value to my store. My sales figures are good, and I
attribute that to me focussing on the customer experience aspect. The way we managing our
expenses and inventory loss is much more seamless. My staff seem to be happy as the focus and
direction is right. Overall, I feel more motivated. (Interview 3)”
“The BSC has had a positive impact on me and my staff. Our sales are good, our expenses less.
Overall, it’s easy to say that any process that has a positive impact on the store, will have a
positive impact on staff morale and performance. (Interview 9)”.
The narratives from Interviewee 3 and 9 clearly indicate that the BSC seemed to have a positive
effect on their motivational levels. This seems to be influenced by the perceived value the
implementation of the BSC has had on their sales and costs. The managers also indicated that
the BSC has had a positive impact on the staff’s morale and performance. This, in turn, has
resulted in an increase in motivational levels. Both these managers previously indicated that
they experienced good support from management, and that the communication plan was
implemented properly. It could be inferred that good management support and a proper
communication plan could lead to an increase in motivational levels.
However, some of the managers did not feel the BSC motivated them. The feeling from them
was that the BSC served no purpose and only added more tasks to their workloads.
“The BSC serves no purpose to me. Actually, it demotivates me. (Interview 1)”
141
“The BSC has only added more work to my daily commitments. Since its implementation my
workload has almost tripled, this is very discouraging. (Interview 4)”.
Both these interviewees expressed negative feelings towards the BSC. They clearly felt that
the BSC did not motivate them, and it appeared that the BSC added no value to their ways of
working. Interviewee 1 and 4 similarly expressed their dissatisfaction with the way
management supported them, as well as with the BSC communication plan. Therefore, one can
postulate that a proper communication plan and good support from management may increase
motivational levels.
Alignment to performance rewards
Decoene and Bruggeman (2006. P.445) suggested that a BSC based compensation plan will
motivate employees if meaningful rewards are linked to performance measures that they can
influence. Similarly, it was noted by some managers who did indicate that the BSC motivated
them, that the BSC should also be aligned to rewards so as to increase motivation. These
managers felt that the organisation may get better buy-in from employees if this was done.
Another suggestions was linking the BSC to recognition programmes to increase rewards.
“While the BSC has increased my motivational levels. Why is it not linked to rewards. I’m not
a money person, but many managers may be. Why not link it to monetary rewards and see the
effect. Personally, I think you would get better buy-in. (Interview 2)”.
“Money and recognition is important. I am motivated because of the way I’ve improved my
store. However, I think the company needs to think big, if you want greater sales, you need to
offer rewards. If not rewards, maybe some form of recognition program. (Interview 6)”.
The narratives according to the store managers seem to indicate that the BSC does improve
motivation. It has resulted in them working more seamlessly, and it has also impacted
positively on their sales and costs. The feeling amongst a few managers is that some form of
142
reward and recognition programme should be used to incentive managers, which may lead to
a greater increase in motivation. However, it was noted that some managers did not feel
motivated by the BSC. They felt it added no purpose to their work, and merely increased their
tasks and responsibilities.
6.6 CHAPTER SUMMARY
The statistical analysis indicates that the BSC has a significant impact on an employee’s
individual performance. The ANOVA shows that using the BSC as a performance management
system leads to increases in Sales and Customer Service, and a decrease in Inventory Loss,
Stock Integrity and Manageable Expenses. However, the researcher found no significant
relation between the BSC and Organisational Performance. This implied that although
employees increased their performance, their Organisational Performance did not increase.
Furthermore, the statistical analysis also indicated that the BSC does not lead to an increase in
Intrinsic Motivation. The qualitative analysis examining the impact of the BSC on the
participants resulted in the emergence of several themes and sub-themes. These themes
included management support, communication, the strategic alignment of the BSC to employee
and organisational goals, influence on business practices, processes and systems and impact on
work motivation. The themes of management support and communication generated the most
positive feelings. However, while most managers felt that the BSC aligned to their employee
goals, there was a general feeling that the BSC did not align to the organisational goals. The
managers had mixed feeling around the central and sub-themes of influencing business
processes and motivation.
The discussion of the results and the presentation of the themes will be discussed in Chapter
Seven that follows.
143
CHAPTER SEVEN
DISCUSSION
7.1 INTRODUCTION
The purpose of this study is to determine whether the Balanced Scorecard (BSC), as a
performance management system is effective in increasing employee and organisation
performance, as well as whether the BSC results in an increase in intrinsic motivation based
on the self-determination theory. This chapter presents the findings of the study, and an
examination and discussion on the quantitative and qualitative results in reference to literature
and theoretical framework. The first section of this chapter focuses on the impact of the BSC
on employee performance. This is then followed by a discussion on the impact of the BSC on
organisational performance. Finally, the impact of the BSC on motivation, and the impact of
the BCS and motivation on employee and organisational goals are examined.
7.2 BALANCED SCORECARD AND EMPLOYEE PERFORMANCE
The quantitative results indicated that BSC has a significant impact on sales, inventory loss,
manageable expenses and customer service. Although the BSC also has an effect on stock
integrity, its effect is inconsistent across the four quarters. The analysis indicates that as a result
of using the BSC as a performance management system, there is an increase in the sales and
customer service in the stores, and a decrease in inventory loss and manageable expenses. The
qualitative analysis also indicates that the successful implementation of the BSC had a positive
relationship on employee performance. Using a thematic analysis process, the findings indicate
that support from management and a proper communication plan led to managers improving
their business practices, processes and systems. These business practices, processes and
systems have a direct impact on sales, inventory loss, manageable expenses, customer service
and stock integrity.
The BSC was used to manage performance across five key performance indicators (KPI’s),
namely sales, inventory loss, manageable expenses, customer service and stock integrity. The
144
ANOVA was used to determine the statistical relationship between these KPI’s and the BSC,
while the qualitative study examined the impact of the BSC implementation on the store
managers business practices, processes and systems.
7.2.1 Sales
A one-way between-groups analysis of the variance indicated that is a statistically significant
difference in sales, where the BSC has a significant impact on sales after the third quarter. Sales
is considered an important key performance indicator (KPI) in the retail industry as the increase
and decrease of sales figures indicate how well a store is performing. According to Ton and
Raman (2010), higher sales is typically associated with inventory levels and product variety.
When product variety increases, the likelihood that the store will have the products the buyer
wants increases, and when inventory levels increase, the service level of that product increases
(Ton & Raman, 2010). By using the BSC to performance manage the sales KPI, the
organisation saw an increase in sales for the duration of the study.
Managers at Retek are given set sales targets at the beginning of each financial year, and are
expected to meet their daily targets in line with their year-end target. According to Awasthi
(2012), the aim of any retail organisation is to achieve its target sales and retain loyal customers.
A significant percentage of the learning and development programmes in Retek is centred on
the sales aspects, and the various sales strategies that can assist managers and staff in increasing
their sales. These strategies include how to effectively make a sale, product knowledge, how
to interact with customers, and so on. Awasthi (2012) suggested that a salesperson serves a
dual purpose, that is, they help drive sales through their selling of the products and services,
and also channels customer feedback into important activities, such as product design and
customer service. These roles, according to Awasthi (2012), are pivotal to an organisation’s
growth.
Through the use of the BSC, sales development areas were identified, and these were addressed
through the various training and development initiatives. In their study of sales force training
among retailers in the US, Tan and Newman (2013) suggested retailers are viewing retail
145
selling skills as essential to their success, and as such, sales training has become necessary and
essential for sales personnel to become successful in their jobs. Tan and Newman (2013)
suggested that in order for managers to effectively increase their sales, they need to efficiently
design their programmes by, for example, ensuring that objectives sales evaluations take place
and ensuring proper planning of the sales programmes and so on. The store managers were
successful with their performance management on sales, and this resulted in a significant
increase in their sales as a result of using the BSC as a performance management system.
7.2.2 Inventory Loss
The findings further showed a statistically significant difference of inventory where there is a
gradual and significant impact on inventory loss throughout the period of assessment with a
sharp drop after the third quarter. In the retail industry, inventory loss refers to a loss of stock
that is less than what is in the organisation’s database. For example, in Retek, this refers to any
stock in the store that is less that what the company system is indicating. Inventory Loss can
occur as a result of theft by employees and customers, or as a result of a data integrity issues
with the stock analysis system used by a company. The current unemployment situation is
South Africa also contributes to an increase in theft. Unemployment forces people to steal to
meet a variety of basic needs. According to Shuffler (2008), an increase in unemployment and
the price of goods intensifies the temptation to steal.
Inventory Loss significantly impacts on a store’s costs as the store is ultimately responsible for
the sale of goods. The costs of the goods that results from inventory loss is allocated to the
store’s overall costs. In addition, inventory loss prevents the store from selling the goods, which
ultimately impacts on the store’s sales. According to Jones (2008), people stealing from a store
can have severe consequences. These include, according to Jones (2008), an impact on a store’s
bottom line, and safety concerns.
Managers at Retek are set inventory loss targets at the beginning of each financial year in order
to enable them to manage their inventory loss. In addition, disciplinary measures are put in
place to ensure that the managers abide by the inventory loss protocols. Learning and
146
development plays a critical role in enabling managers to identify and minimise inventory loss,
as well as to develop action plans to help staff identify ways to stop theft and other risks. At
Retek training managers were upskilled on the effective use of current technology to combat
inventory loss, and adherence to the inventory loss protocols. The managers were then assessed
on these skills, and were asked to develop action plans in line with their current situation, and
to collaborate with their staff to effectively drive these action plans. According to Bennett
(2014), the use of technology, a good management policy, and working with employees are
some of the measures companies can use to minimise inventory loss. Bennett (2014) further
suggested that in order to control external theft, employers should focus on educating and
creating awareness with their employees on good customer service and signs of potential loss
respectively. This, according to Bennett (2014), requires training and development, as well as
the establishment of good procedures.
Through the use of the BSC, inventory loss development areas were identified. Managers were
thus successfully performance managed on their inventory loss results, and action plans were
developed and implemented. This resulted in a significant decrease in inventory loss as a result
of the use of the BSC as a performance management system.
7.2.3 Manageable Expenses
A one-way between-groups analysis of the variance indicated that there were significant
differences of mean of manageable expenses at the [F (3, 252) = 5.148, p < 0.01] (see Table
3), where there is a significant impact on manageable expenses only after the third quarter
session. There are two types of expenses incurred in a store specific to Retek. The first refers
to unmanageable expenses, which are expenses that are beyond the control of a store manager.
These include items such as rent, electricity and water. Other expenses at Retek refer to the
expenses in the store that are under the manager’s control. These may refer to telephone costs,
printing, commissions, overtime, and casual wages. At Retek, manageable expenses are very
important because even if a store does not meet its sales target, it can still be profitable if it can
manage its bottom line costs. For example, according to Karr (2009), Belk Inc. a private
department store company in the U.S, effectively managed their expenses even though their
sales dropped, and was still able to boost profits in their 2nd quarter. According to their CEO,
147
this was achieved by managing expenses and stock levels in keeping with sales trends, and
providing excellent customer service (Karr, 2009).
Manageable expenses form part of a manager’s KPI because these expenses can be managed
either responsibly or irresponsibly. The BSC was used to identify certain opportunity areas in
the way managers control their expenses. Managers were exposed to training programmes
aimed at financial and business acumen in order to enable them to understand their business,
and the ways to manage their expenses. As a result, specific action plans were developed and
implemented. The result was that most of the managers that were performance managed on
manageable expenses, decreased their expenses significantly.
An example of an opportunity area identified included the use of IT service providers to address
general IT problems, and the use of electricity. Store managers were given the leeway to choose
private IT consultants to address certain issues in their store, and were not aware of the
significant costs associated with using consultants. As a result of the training, managers started
becoming more prudent and started negotiating better rates from their service providers.
Managers also became aware of the high energy usage of their stores. They began managing
their energy usage more efficiently by turning off lights in certain areas during low peak
periods, and stopping their escalators in the early parts of the morning, and later in the evenings
when the store was not so busy. According to Amato-McCoy (2008), new technology has
resulted in retailers experiencing high operating expenses. These costs are related to, but are
limited to, an increase in power consumption and increases in staff for remote and on-site
reactive support (Amato-McCoy, 2008).
7.2.4 Stock Integrity
A one-way between-groups analysis of the variance was conducted to explore the impact of
the BSC on the Stock Integrity. Although the analysis showed a significant difference in Stock
Integrity [F (3, 252) = 10.57, p < 0.001] (see Table 3). However, its effect is not consistent
across the quarters. The integrity and control of stock in the store and in the distribution centres
is very important in the retail industry. According to Callahan (2015) an efficient inventory
148
control process does not come automatically. At Retek, stock integrity refers to the
merchandise that is in the store versus the merchandise that the inventory system actually
shows. If, for example, the inventory system shows that the store has two pairs of shoes, and
the store actually only has one, this will become an issue if a customer wants to purchase both
pairs. This may result in the customer leaving the store without purchasing any items, and more
importantly the customer not returning to the store. According to Merritt (2016), a lack of stock
can not only cost you money from sales, but can also lead to customers seeking their business
elsewhere where their needs can be satisfied. An inventory control system that is effectual,
according to Merritt (2016), will be able to forecast stock based on sales activity by taking into
consideration how much product is in stock.
Stock integrity is an import KPI in the BSC because it enables store managers to control their
inventory loss. According to Barnes (2015) the correct optimisation of inventory can lead to
the reduction of out-of-stock products, increase customer fulfilment, decrease costs and
maintain gross profit margins. Barnes further suggested that in order to optimise inventory,
retailers must take their particular customers’ needs into consideration so as to determine what
is most important to customers; these could include product availability, and even price. If
managers know how much stock they should have in their store, they can determine product
availability easily, and better manage their staff accordingly. For example, they can be a greater
security focus on high price items to reduce theft. In addition, where the demand for certain
products increase, managers can request delivery of those products in advance as opposed to
been reactive to customers’ requests. The BSC was used to identify certain opportunities for
managers to better manage their stock on hand, as well as to ensure that they had product
availability. Managers were trained extensively on the inventory management system, and were
requested to create action plans to mitigate the issue of inventory integrity. However, the study
indicated that the training on stock integrity did not result in an improvement in stock integrity.
The results of the study showed that the effects of the BSC on stock integrity was inconsistent.
7.2.5 Customer Service
A one-way between-groups analysis of the variance indicated that there was a significant
difference of customer service [F (3, 252) = 2.833, p < 0.05] (see Table 3), where there is
149
significant positive impact on customer service only after the third quarter. Customer service
plays a role in the retail industry. The underlying philosophy at Retek is to attract, delight and
retain customers through its exceptional products and customer service. The retention of
customers was very important to Retek. The belief embedded in the culture of the organisation
was that if customers are excited by the products and services provided, then they will return
to the store. According to McGregor (2014), many retailers are so focused on bringing in new
customers, that they neglect their current customers. McGregor (2014) believed that this was a
major failing for retailers as it would be easier for retailer to sell their products to an existing
customer base than to entice new customers.
Retek contracts an external service provider to measure its customer service delivery. This
service provider randomly conducts an assessments of the store’s customer friendliness and
service every quarter through the use of a ‘mystery shopper’. A ‘mystery shopper’ is a person
that enters a store as a customer, and assess the service given to him or her. The mystery
shopper assessment focused on the sales competency of the store manager, as well as the overall
look of the store. According to Daniels (2008), the way a store manages their customer’s
emotions and perceptions in their store is as imperative to retail differentiation and revenue
growth as any other facet of their supply chain. Daniels (2008) believed that store managers
played a pivotal role in creating a customer experience, and therefore it was important that they
were engaged and excited about encouraging the customer experience.
Customer service is one of the main KPI’s used to performance manage the store managers.
The BSC ranked all the managers according to their customer service scores, and various
customer service programmes were initiated to assist managers in improving their overall
customer service delivery. Managers were provided training on staff friendliness, product
knowledge, promotions, store house-keeping, store layouts and overall customer service
principles. According to Awasthi (2012), customers are more likely to spend more time in a
store and thus buy more merchandise, if the store layout is customer friendly. This resulted in
store managers being upskilled, and thus increasing their overall customer service ratings.
The one-way between-groups analysis of the variance for sales, inventory loss, and other
expense and customer service showed a significant difference between these variables and the

150
BSC. Therefore, we can conclude that the answer to research question 1 has been answered i.e.
the use of the BSC as a performance management system leads to an increase in employee
performance. It must be noted that the impact of stock integrity was not consistent across all
quarters.
The qualitative findings indicate that most of the managers felt that BSC was successfully
implemented in the organisation. According to Kaplan and Norton (2001, p.147-148), there
are five conditions that need to be met for the BSC to be successful, “namely, (1) the support
of top management; (2) the central role played by the BSC for developing the strategy and
setting strategic priorities (3) the development of the BSC to align the processes, the services
and the competencies of the organisation; (4) the degree of implication of everyone in the
development of the BSC; and (5) the extent to which the BSC influences management
practices, processes and systems on a continuous basis”. The interviewees in the study
highlighted management support and a proper communication plan as key influencers in
helping them improve their business processes, practices and systems. Therefore, we can
postulate that the successful implementation of the BSC led to an increase in sales and customer
service, and a decrease in inventory loss and manageable expenses.
One of the most prominent themes to emerge from the interviews is that Managerial Support
is essential. This support not only extended to the store managers’ direct line managers, but
also to the support from executive managers and the human resource departments. Store
managers indicated that they were provided with constant support regarding the purpose and
objectives of the BSC. Many highlighted the positive role their direct managers played driving
the BSC in their businesses, especially highlighting the role of the human resource department,
who played a critical role in ensuring the successful implementation of the BSC. The
management at Retek had a clear strategy regarding the implementation of the BSC. It ensured
that all senior managers had a clear and precise understanding of the purpose and outcomes
expected of the BSC. This was done through numerous workshops held over a three month
period across the country. At these workshops, an understanding of the purpose BSC was
discussed, and managers were encouraged to voice their opinions and concerns regarding the
BSC. The focus of the workshops was also to highlight the alignment of the BSC to their
personal goals, and to create a clear understanding of the importance of the five KPI’s that

151
would form the BSC, namely sales, inventory loss, manageable expenses, customer service and
stock integrity. However, these workshops only included senior managers, who were then
given the responsibility to cascade the purpose and objectives of the BSC to their direct reports,
namely the store managers. Hence, there was some inconsistency in the way the purpose and
objectives of the BSC was cascaded to the store managers in the study. The qualitative analysis
indicates that there was a better ‘buy-in’ of the BSC by those managers who felt that their
senior managers properly explained the role and purpose of the BSC in their business. And this
translated into those managers improving their business practices, processes and systems,
which has a direct impact on sales, inventory loss, manageable expenses, customer service and
stock integrity.
Another prominent theme to emerge from the qualitative analysis was the impact of the
communication plan, which had a positive impact on the implementation of the BSC. The
participants interviewed indicated that many of the store managers felt that they received good
communication from the organisation prior to the implementation of the BSC. These managers
indicated that the organisation had a very comprehensive communication plan, which resulted
in the BSC been properly cascaded to them by their managers. The constant feedback sessions
with their direct managers was also highlighted, where managers felt that certain issues or
concerns regarding the BSC implementation and purpose were properly dealt with at these
sessions. Prior to the implementation of the BSC, the top management at Retek tasked the
human resource department to design a comprehensive communication plan. The purpose of
the communication plan was to ensure that all employees at Edcon, regardless of seniority and
position, were provided with the purpose and objectives of the BSC. Various mediums were
used to deliver the communication plan, with the senior managers playing a critical role in
cascading the plan to their reports. The qualitative analysis indicates that most of the managers
who felt that the BSC improved their business practices, processes and systems, were also
complementary of the organisations communication plan. These managers highlighted the
importance of the communication plan, and felt that the continuous communication around the
purpose and expectations of the BSC to their employees contributed to them improving their
business processes, practices and systems.
152
The qualitative study also revealed that the BSC KPI’s were aligned to their employee goals.
However, it was noted that there was an inconsistent alignment of the BSC to the organisational
goals. This will be discussed in the next section. The interviews indicated that the store
manager’s main goals were to increase sales and decrease costs. The BSC’s five KPI’s were
aligned to these goals, with sales and customer service focused on increasing sales, and
inventory loss, manageable costs and stock integrity focused on decreasing costs. The
managers indicated that by focusing on only five KPI’s, as opposed to numerous irrelevant
performance indicators, their staff had more time and desire to drive sales and reduce costs.
The managers also felt that the BSC provided them with a holistic view of their business
through its focus on the financial and non-financial aspects of the store. This resulted, as
indicated by the quantitative findings, in an increase in sales and customer service and a
decrease in inventory loss and manageable expenses.
Finally, the qualitative findings once again correlates to the quantitative results that the BSC
has a positive impact on employee performance by indicating that the BSC positively
influences business practices, processes and systems. As indicated previously, business
practices, processes and systems directly impacts on sales, inventory loss, manageable
expenses, customer service and stock integrity. The interviews reveals that many of the store
managers felt that the BSC was effective in improving the effectiveness and efficiency in the
way they worked. The interviewees revealed that by focusing on the BSC KPI’s, they were
able to identify certain opportunity areas to improve customer service and thus sales. The BSC
also assisted them in changing some of the controls they had in place for inventory loss and
stock integrity. The managers felt that the metrics provided by the BSC KPI’s on a weekly
basis, gave them direction to better focus their staff on the areas they were underperforming,
and thus enabled them to provide more focused and meaningful training initiatives.
The qualitative findings support the quantitative finding by indicating that the successful
implementation of the BSC, through management support, a proper communication plan and
the strategic alignment of the BSC to the employee goals, led to managers improving their
business practices, processes and systems.

153
7.3 THE BALANCED SCORECARD AND ORGANISATIONAL PERFORMANCE
The quantitative analysis did not reveal any significant difference in mean scores on the
organisation’s performance for the four quarters, an indication that the BSC does not have a
significant direct effect on the organisation performance. In Retek, organisation performance
refers to the trading profit of the store. The analysis indicates that although employee
performance in sales, inventory loss, manageable expenses and customer service improved,
this had little impact on the overall store profitability. The qualitative findings similarly
indicate that some of the store managers did not see the alignment between the BSC and
business strategy that encompassed the organisational goals. While sales and the management
of store costs were part of the business strategy, there were two other strategic imperatives that
was just as important, namely profit margins and credit and sales. It was highlighted in the
interviews that while the BSC improved employee performance in terms of increasing sales
and decreasing costs, it did not take into consideration other KPI’s that directly impact of the
organisational performance of the store (as measured by trading profit). Managers highlighted
‘low gross profit margin’ and the impact of ‘cash and credit sales’ as important KPI’s that
impact on their stores profitability.
7.3.1 Gross Profit Margins
According to Darlington (2011, p.83), gross profit margin is the “difference between the actual
cost of a product” from manufacturers and the price of selling such product. Zaczkiewick
(2015) similarly defined gross profit margin as the difference between total sales or revenue
and the retailers cost of goods sold and/or other related costs. Monosoff (2006) suggested that
there are two types of gross margins, namely high end and low end. A major factor influencing
retail high end gross is production costs, that is, “the retailer's margin expectations and the
market price at which the product sells”. The low end gross margins refer to company costs
such as “salaries, rent, marketing and other operating costs that must be covered by the gross
margin earned by the sales” (Monosoff, 2006). According to Zaczkiewick (2015), the gross
margin measure is the most effective way to determine the strength of a business.
At Retek, gross profit margin has steadily dropped over the last few years. One of the reasons
for this was that the profit margins for some of its men’s, women, children and baby apparel
154
was low. Retek, although a major retailer in South Africa, has very strong competition from
other retailers in terms of products and price. In addition, its diversification from apparel to
other non-core products may have adversely affected its margins. Its volumes purchases for its
non-core products is not as high as some of its competitors, and thus the negotiation power
with certain suppliers is limited. Another reason is the frequency of mark-ups and promotions.
Promotions and mark-ups can have a significant impact of Gross Profit Margin. According to
Darlington (2011), owners and managers do not fully understand the impact that reducing the
price of a product can have on the bottom line. Reducing the selling price of a product affects
profitability as the store now has to sell a product cheaper. According to Darlington (2011),
people involved in the sales process should be upskilled on the importance of Gross Profit
Margins on their business. One way, according to Darlington (2011), is the use of monthly
reports reflecting what the sales and GP margins are, so that staff is aware of how the
percentage discounts given away, affect their jobs.
The issue of low margins is not only specific to South Africa retailers alone. In India, for
example, retailers have negotiated with global manufacturers such as LG, Samsung and Nokia
among others for better manufacturing margins (Vijayraghavan, 2011). These are brands that
are very popular in South Africa, and are part of Retek’s business as well. According to
Vijayraghavan (2011), one of the main reasons cited by retailers were rising operating costs on
business such as rent, employee costs. In the US for example, clothing retailers also experience
issues with low margins that impact on their profitability. A recent analysis of 18 retailers in
the US, showed that 11 of the companies suffered decreased margins due to a combination of
heavy markdowns, low sales and logistic costs (Zaczkiewick, 2015).
Even if retailers manage their Gross Profit Margins effectively, they still need to take it a step
further by managing trading margins. According to Theobald (2015), although retailers may
increase their gross profit margins, if they do not manage their trading margins, then it impacts
on their profitability. For example, in comparing two similar food retailers in South Africa,
Theobald (2015) found that while one improved its gross profit margin from 16.6% to 17.5%
over the year, its overheads increased significantly relative to sales. On the other hand, the
other retailer showed a fairly slight increase in its gross profit margins from 20.1% to 20.8%,
but it managed to decrease its overheads, which ultimately resulted in it being more profitable.
155
Therefore, as indicated by the results of the analysis, an increase in sales does not mean an
increase in profitability.
In this study, the store managers felt that although they had control over sales and store costs,
they had no control over the gross profit margins as this was the responsibility of the
merchandise team. The merchandise team negotiated with the suppliers regarding the costs of
the products, and based on these negotiations, dictated the price the products should sell for.
There was no meaningful collaboration between the merchandise teams that purchase the
products and the store managers who sell the products. Therefore, it was highly possible that
the gross profit margins for purchasing products from suppliers versus selling the products to
consumers could be very low, or vice versa. A high gross profit margin is most desirable as a
low gross profit margins would result in managers needing to significantly increase the sales
of that product to make a profit. The qualitative finding indicated that store managers had no
control over gross profit margins, or were advised on the whether certain products have a high
or low profit margins. The implications for this was that store managers did not know which
products they should place their focus on to increase sales so as to increase organisational
profitability. From the above discussion, it can therefore be inferred that gross profit margin
and trading margins may have affected the profitability of Retek even though its store managers
improved their individual performance.
7.3.2 Credit and Sales
The Retek business is made up of both cash and credit sales. Credit sales pose the greatest risk
to the business’s profitability as customers may not pay their accounts due to a variety of
reasons. In order to mitigate this risk, Retek changed their credit business model to become
increasingly stringent. The aim of the new credit model was to curb the severity of bad debt
that Retek was facing due to the economic instability. While the new criteria assisted in curbing
the amount of bad debts, Retek still experienced the issue of customers not paying their
accounts. However, the impact of bad debt on credit sales did not form part of the store
managers’ individual performance, but reflected on the organisational performance (as
measured by the trading profit). In other words, store managers were encouraged to open as
many new accounts as possible to increase their sales, and if any these new accounts resulted
156
in bad debts, the store manager was not held accountable nor did it affect their sales figures
negatively. This misalignment could be another reason why an increase in employee
performance many not lead to an increase in organisational performance. This misalignment
was highlighted by some of the managers interviewed who felt that there was no or little
alignment of the BSC to the organisations strategy. These managers felt that the BSC KPI’s
measuring their performance was not directly linked to the profitability of the store.
In order to mitigate this risk, this impact of credit sales should form part of the store managers
KPI’s. While the organisation may have an effective credit management policy, the store
manager must be responsible for properly validating the details of people opening new accounts
to curb the risk of bad debts. Although this may seem difficult, it is possible. For example, in
comparing two credit retailers in South Africa, Theobald (2015) found that the ability of one
retailer to manage its bad debts effectively resulted in it writing of R700m is bad debts, as
opposed to the other retailer that wrote off R2.9bn. It is a very difficult scenario to manage as
on one side one want’s to increase sales through less stringent measures on giving credit, but
on the other hand one has to manage the risk of bad debts, as this ultimately affects profitability.
According to Theobald (2015), serious tension is created when both functions operate together,
with the retailing side demanding loose credit granting criteria, and finance overlooking spikes
in bad debt.
Magwaza (2014) similarly highlighted another fashion retailer that through its focus on its
credit risk management practices, increased its credit sales by 5.7 percent. According to its
CEO, its strategy of tighter credit scorecards, and checking up on credit bureau information on
a monthly basis as opposed to quarterly, has resulted in the number of new credit accounts
dropping by 10 percent. According to Magwaza (2014), the retailer’s gross margin in all
categories was maintained while the operating margin from continuing operations reduced
from 18.7 percent to 17.9 percent due to tight credit market conditions. Therefore, while an
increase in credit sales may create an impression that the stores sales are good, the potential
bad debts accompanying those credit sales negate the sales figures. A good credit management
policy and the ability of store managers to drive the process will ensure that there is a better
alignment between credit sales and actual sales.
157
7.4 THE BALANCE SCORECARD (BSC) AND INTRINSIC MOTIVATION
In the quantitative study, we found that the BSC and motivation did not have any predictive
power for both employee performance and organisational performance. However, the
qualitative findings indicated that most of the store managers felt that the BCS had a positive
impact on their motivation levels. This was attributed to the positive impact the BSC had on
the effectiveness and efficiencies in the way they were working. Some felt motivated because
the BSC added value to their job, and contributed to their staff been more happy and productive.
Others indicated that their stores are now performing optimally, and this has created a positive
atmosphere in the store. The qualitative finding also show that some of the managers that
experienced good management support and communication, tended to see the alignment of the
BSC into their performance goals, and also integrated the BSC into their management practices
and processes. This, in turn, also affected how the managers were motivated. When three or
more of these factors were positive, the effect was positive on motivation. However, those
managers who felt that management support and communication was lacking, showed a
decrease in their motivational levels, or felt indifferent.
However, there were some store managers who were not motivated, and the reasons are
consistent with Ryan and Deci’s (2000) self-determination theory. According to Ryan and Deci
(2000, p.68), people’s actions are “driven by three core needs i.e. the need for autonomy, the
need for competence and the need for relatedness”. These authors suggested that if “an
individual’s experience of autonomy, competence, and relatedness are supported”, then this
could lead to the “most volitional and high quality forms of motivation and engagement for
activities, including enhanced performance, persistence, and creativity”. In order to facilitate
this, these authors suggested three needs that needs to be fulfilled to facilitate intrinsic
motivation, namely, engaging employees in their tasks, linking rewards and recognition to the
quality of their performances, and matching the values and needs of the employee to the values
and needs of the organisation. At Retek, employee needs were not taken into consideration
prior to the implementation of the BSC. Firstly, the BSC was seen as a strategic objective to
increase employee performance, which in turn would increase organisational performance.
Although Retek invested time and effort in communicating and implementing the plan, very
little effort was invested in engaging with the store managers. All major decisions regarding
the BSC was made at a top management and board level, with no engagement made with senior
and middle management. Secondly, the BSC was not linked to any reward or recognition
158
system. Those store managers who performed exceptionally through the implementation of the
BSC, did not receive any form of reward or recognition. And finally, Retek did not match the
values and needs of the employee to the values and needs of the organisation. This was
unfortunate, as one of Retek’s organisational values concern high performance, which could
have been incorporated in the communication plan during the implementation of the BSC
Therefore, one can postulate based on the qualitative data that if Retek was consistent in the
way they communicated the BSC, and if their Top and Senior Managers properly
communicated and consulted with all other levels of their management and non-management,
then the likelihood that store managers would feel motivated would be higher. In addition to
this, the qualitative study also indicated that managers are motivated by good management
support and a proper communication plan. If these are present, then managers are more likely
to integrate the BSC into the way they work, and it may lead to an increase in motivational
levels.
7.5 CHAPTER SUMMARY
This chapter discusses the results of the quantitative study and qualitative study, as well as the
integration of both. The results of the quantitative study indicates that the BSC has a significant
impact on employee performance, but no impact on organisational performance. It also
indicates that the BSC does not predict motivation. The results of the qualitative study indicates
that if certain conditions are met, then the BSC does have an impact on business processes,
practices and systems. The qualitative study also indicated that the BSC did increase the
motivational levels of some store managers. The recommendations for the study will be
outlined in the next chapter.
159
CHAPTER EIGHT
RECOMMENDATIONS, LIMITATIONS AND CONCLUSIONS
8.1 INTRODUCTION
The study examined the effect of the Balanced Scorecard (BSC) as a Performance Management
System on Performance and Motivation in the Retail Industry. The study aimed to determine
whether the BSC will lead to an increase in employee performance, and subsequently an
increase in organisational performance. Using Ryan and Deci (2000)’s self-determination
theory as a conceptual framework, the study further intended to determine whether the BSC
would lead to an increase in intrinsic motivation. In this chapter the conclusions are drawn
from the study. The empirical finding from both the quantitative analysis and qualitative are
also included. Recommendations and implications to the organisation will also be made.
Finally, the limitations of the study will be discussed, as well as opportunities for future
research.
8.2 RECOMMENDATION TO THE ORGANISATION
The business world is in constant flux. Changes in the social, economic and political
environment, as well as new innovations in technology, nature of work and the social trends
have necessitated the need for organisation’s to adapt and change. In order to ensure an
organisations competitive advantage, organisations need their people to drive these changes.
Whilst the organisation in the current study has a performance management system, the
question arose around the value of that system, that is, are the employee performance goals
aligned to the organisational goals. The BSC has successfully been used to drive employee
performance, and hence organisation performance. It has also resulted in an increase in
employee motivation. The BSC was first “conceptualised by Kaplan and Norton (1992)” and
has successfully evolved from performance measurement, performance management, to
eventually becoming a “globally recognised best practice for strategic management” currently
(Johnson, Beiman & Collaborative, 2007, p.5).
160
The statistical analysis indicated that the BSC successfully resulted in an increase in sales and
customer service, and a decrease in inventory loss and manageable expenses. This, in turn, led
to an increase in the store managers overall employee performance. However, the BSC did not
lead to an increase in organisational performance. This was indicative of a misalignment of the
BSC and organisational strategy. Some of the store managers interviewed also indicated that
there was a misalignment of the BSC KPI’s and their performance goals. Other factors such as
gross profit margin, and credit sales were also highlighted as possible reasons why the increase
in employee performance did not lead to an increase in organisational performance.
The BSC also did not lead to an increase in intrinsic motivation. The quantitative analysis
indicated that there was some inconsistencies in the way the BSC was implemented and
cascaded into the organisation. Many of the store managers who felt that the BSC
communication plan, and support of top and senior management was good, also felt motivated.
This, in turn, led to some of them successfully changing the way their store and staff operated.
Others, who felt that the BSC communication plan and their top and senior manager’s support
was inadequate, were indifferent motivationally or felt a decrease in motivation. Decoene and
Bruggeman (2006, p.444-445) similarly found that the “lack of strategic alignment negatively
impacted managers' intrinsic motivation to improve organisational performance”. According
to these authors, this was the direct result of a lack of cascading which led middle-level
manufacturing managers to perceive that “their performance measures in the manufacturing-
level BSC were uncontrollable”. In addition, these authors suggested that in order to “create
positive motivation for higher levels of organisational performance, corporate and
manufacturing objectives and managers, the BSC must be strategically aligned i.e. top
management must be actively involved in a BSC design and implementation process”. Also,
according to these authors, it is the responsibility of managers to ensure that instructions on
how to achieve performance objectives are cascaded to employees during the cascading
process; this will empower managers and improve organisational performance.
8.2.1 Align the BSC to the Organisational Strategy
It is imperative that the BSC perspectives and KPI’s are aligned to the organisation’s strategy.
As shown in this study, the increase in employee performance did not lead to an increase in
161
organisational performance. According to Behrouzi, Shaharoun, and Ma’aram (2014), the
choosing of the BSC perspectives is dependent on what is best to achieve an organisation’s
strategy. These authors conducted an analysis of the BSC perspectives and KPI’s, and
suggested that organisations should choose fewer KPI’s, but most importantly, ensure that the
KPI’s selected are customized to encompass all strategies. Too few KPI’s may not measure the
organisation performance or reflect all strategies, while too many KPI’s may lead to complexity
and a cost to measurement, analyse and interpretation processes (Behrouzi. et al., 2014).
The alignment of the BSC to the organisational strategy may also lead to an increase in
motivation. Decoene and Bruggeman (2006, p.444-445) suggested that in order to “create
positive motivation for higher levels of organisational performance, corporate and
manufacturing objectives and managers, the BSC must be strategically aligned” i.e. senior
management has an important role to play in the BSC design and implementation process. As
indicated by the qualitative analysis, some of the managers felt that there was no alignment
between the BSC KPI’s and the organisation’s goals. This, in turn, affected some of their
motivational levels adversely.
This study indicated that the BSC did in fact increase employee performance. However there
was no impact on organisational performance and motivation due to a lack of strategic
alignment between the BSC KPI’s and the organisational strategy. The qualitative phase
offered a comprehensive perspective on the implementation of the BSC, and how it was
perceived to improve business processes, practices and systems, as well as its perceived impact
on motivation. The qualitative findings indicated that even though the quantitative finding
showed that there was no relationship between the BSC and motivation, some of the managers
did feel motivated by the use of the BSC. A deeper analysis into the qualitative finding showed
that managers were more motivated when they felt that their goals aligned to the BSC KPI’s,
when they received good management support and when the BSC communication plan was
good. This is turn, resulted in many of them improving their business processes, practices and
systems.
As indicated above, a key finding in the study was the misalignment of the BSC KPI’s to the
organisation’s performance (as measured by the trading profit). Two business imperatives were
162
highlighted as important KPI’s that needed to be included in the BSC, namely gross profit
margins and credit sales. The study clearly highlights the need for top and senior management
to ensure that the performance indicators of employees drive the performance indicators of the
organisation. Any misalignment creates a false perception that if the employee performs well,
then the organisation automatically performs well.
8.2.2 Ensure Top and Senior Management Support
In order for the BSC to be effective in any organisation, it needs the support of its most senior
managers. Weir, d’Entremont, Stalker, Kurji and Robinson (2009) suggested that the
involvement of management and front line managers are important for the implementation of
the BSC. According to Weir et al. (2009), this involvement may increase the likelihood of
understanding, uptake and sustainability with regard to the BSC. Northcott and Taulapapa
(2012) similarly highlighted the lack of top management support as a concern. In the study
examining the use of the BSC as a performance management tool, these authors suggested that
top management support is essential for promoting the BSC, providing resources to sustain it,
as well as to encourage employees to engage with it.
As indicated by the qualitative data, some of the managers did not feel that top and senior
managers played a crucial role in the implementation of the BSC. This, in turn, affected some
of their motivational levels. Chi and Hung (2011) also highlighted the supportive importance
of top management. For example, these authors found that top management support was
reinforced by the fact that the General Manager (GM) in their study showed a clear
commitment to the implementation of the BSC by attending in person the BSC implementation
and instruction meetings (Chi & Hung, 2011). While the support from top and senior managers
were evident in some of the responses in the qualitative analysis, it was not consistent. As
highlighted by Kaplan and Norton (2001, p.147), top management support is “a critical factor
in the successful implementation of the BSC”. A recommendation to the organisation is that
their senior and top managers prioritise the importance of supporting their employees in
understanding and delivering on the BSC objectives. This support can only enhance the
effectiveness of the BSC in the organisation. It will create better buy-in into the process, and
more importantly into the business strategy.
163
8.2.3 Formulate a Comprehensive BSC Communication Plan
The way the BSC is communicated to the organisation is critical to its success. The BSC
communication plan plays a vital role in ensuring that the same message is cascaded down to
all employees. A study by Chi and Hung (2011) highlighted the importance of a proper BSC
communication plan. According to these authors, one of the reasons why the BSC was
successful was the organisation’s BSC communication plan. According to Chi and Hung
(2011), the BSC was properly implemented in the organisation by engaging with BSC
consultants prior to the BSC implementation. These consultants prepared the BSC
implementation plan through an analysis of the organisation in line with strategy guidelines,
maps and targets, as well as performance evaluation and the reward system (Chi & Hung,
2011). The organisation also focused on communication and feedback regard the BSC.
According to these authors, the company’s GM and Deputy GM held regular meetings
describing the company’s vision and strategy, and the criteria for targets to ensure that the
employees fully understood and supported the BSC system and its implementation.
Furthermore, feedback on the implementation and execution of the BSC was discussed at all
levels as a core issue, and employees were given the opportunity to express their concerns to
their management or the Deputy GM.
Organisations must be also be cognizance of the fact that different levels of management will
perceive the BSC differently. This was evident in the qualitative data, which revealed that some
managers felt that the BSC was not easily explainable to non-management. According to
Biggart, Burney, Flanagan and Harden (2010), the management level at which managers lie in
the organisation affect their perceptions of the BSC. For example, lower level employees
perceive aspects, such as results and accuracy as most important, while senior managers place
a higher value on financial benefit and performance measures (Biggart et al., 2010). Therefore,
the BSC communication plan needs to address all employees in the organisation, regardless of
management level. These authors suggested that top or executive management should create a
common feedback process for communicating that cascades across all levels of the
organisation, and should ensure that all employees are well versed regarding the relation
between the organisations strategy and the BSC.
164
As shown by the qualitative findings, not all the managers felt that the BSC communication
plan was good. A significant shortcoming related to the level of the communication plan, in
other words, the communication plan was too high level and was not user-friendly to non-
managers. One recommendation to the organisation will be to ensure that the BSC
communication plan adequately addresses the purpose, expectation, outcomes and
timelines/targets to both management and non-management, at an adequate an easily
understandable level.
8.2.4 Ensure a Quick and Efficient Relationship between the Financial and Non-
Financial Perspectives
Retail is a fast paced industry. Managers are aware of their sales figures on an hourly basis. In
order to align the financial perspective and non-financial perspectives, activities and reporting
related to the non-financial perspectives need to be quick and efficient. According to Biggart
et al. (2010, p.11), the primary financial measurement for managers is “sales data, and the use
of non-financial measures generally delays the reporting results relative to the sales-based
financial measures”. These authors suggested that organisations may mitigate this concern by
increasing the speed at which non-financial reports are produced.
In this study, for example, customer service data could only be provided on a quarterly basis
as the ‘mystery shopper’ initiative only happened four times a year. Thus, managers were only
made aware every quarter in terms of how their store is perceived from a customer perspective.
Inventory audits is another example, as these were also conducted every quarter. Regular
inventory audits would give managers a clearer indication of their opportunity areas, and thus
more time to put together proper action plans. However, one of the reasons why inventory
audits and customer surveys are not done regularly relates to the costs of these initiatives.
Biggart et al. (2010) also suggested that organisations also need to be cognizant of the costs
associated with increasing the frequency of non-financial activities as the costs may be greater
than the savings.
165
Retek has invested well in certain data reporting technologies. However, these technologies are
underutilised. Feedback on inventory loss, stock integrity, sales, customer service and
manageable expenses are provided on a monthly basis. For the BSC to be most effective, this
feedback needs to be provided weekly, and in some cases even daily, to ensure that managers
are proactive in addressing opportunity areas.
8.3 RECOMMENDATIONS FOR FUTURE RESEARCH
This study only looked at one retailer whose core business was apparel. Therefore the results
cannot be generalised to the entire retail industry of South Africa. It is recommended that future
research on this study should look at multiple retailers, where the core business focuses beyond
apparel. A further recommendation would be to examine the impact of the BSC in other
industry and business settings. The use of the BSC is not prevalent in most South African
organisations, therefore a study of its perceived usefulness in other industries may prove
interesting. The qualitative data provided very rich and useful information. Therefore, an
important recommendation for future research would be to include a larger sample group for
the semi-structured interviews. This would allow more employees and opportunity to give their
views and opinions around the implementation and usefulness of the BSC.
8.4 CONTRIBUTION OF THE STUDY TO ORGANISATIONAL PRACTICE
The findings of this study contribute to the body of existing knowledge in the BSC field, as
well as in the field of performance management and motivation. The results of the study
indicates that the BSC as a performance management system positively influences employee
performance. However, the study also reinforces the importance of aligning the BSC to the
organisational strategy, as the increase in employee performance did not lead to an increase in
organisational performance.
The impact of the BSC on motivation is also significant. Whilst the quantitative analysis
showed no significant relations, the qualitative data suggested otherwise. The motivation of
employees is very important to organisations and managers. Organisations are constantly
looking for ways to improve their employees’ performances. Talent management has become
an essential strategy for HR department for attracting, retaining, developing and performance
managing staff. Employee motivation forms an integral part of these strategies. According to
166
Buchner (2007), managers will benefit from understanding how the leading theories in
motivation align to performance management. However, according to Buchner (2007),
organisational psychologists need to increase their focus on the motivational and
developmental aspects of performance management. Buchner (2007) suggested that these
professionals should try to understand the performance management system as it is, how it
works, and how well the critical elements are supported.
8.5 CONTRIBUTIONS TO ACADEMIC KNOWLEDGE
One of the strengths of this doctoral dissertation is the use of an exploratory mixed-method
approach. An exploratory mixed method approach is the combination of both qualitative and
quantitative methods. According to Johnson and Onwuegbuzie (2004, p.17), “mixed methods
research is defined as the class of research where a researcher mixes or combines quantitative
and qualitative research techniques, methods, approaches, concepts or language into a single
study”. The use of the mixed method approach in this study provided the researcher with a
better integration of the impact of the BSC on employee and organisational performance and
motivation. This integration led to a better understanding of the research problem than using
either the quantitative or qualitative method alone.
While quantitative and qualitative research are important and useful, “the goal of mixed
methods research is not to replace either of these approaches but rather to draw from the
strengths and minimise the weaknesses of both in single research studies and across studies”
(Johnson & Onwuegbuzie, 2004, p.18). The use of the mixed method approach also mitigated
the weakness of both the quantitative and qualitative analysis. For example, the qualitative
finding indicated that some of the managers were motivated by the BSC, while the quantitative
study indicated that the BSC had no impact on motivation. Similarly, while the qualitative
analysis indicated that some of the managers felt that the BSC impacted on organisational
performance, the quantitative finding indicated that the BSC had no impact on organisational
performance. The integration of both the quantitative and qualitative findings provided the
researcher with a more comprehensive understanding of the research problem.

167
8.6 LIMITATIONS OF THE STUDY
The following limitations must be considered in conjunction with the finding. Firstly, the
results of the study are reliant on the data that was collected. Although the BSC, performance
and organisational data was extrapolated from an automated system that is calibrated on a
monthly basis, there is still a possibility of stock integrity concerns. Secondly, the results of
this study are also reliant on the motivational instrument, as well as the theory upon which the
WEIMS is based. The results of the study are also dependent on the truthful way the
respondents answered the questionnaire. Thirdly, the sample used in the study was selected
from only one retailer in South Africa. Therefore, the results may not be considered as
representative of the entire retail industry in South Africa. However, despite the fact that only
one retailer was used in this study, the findings may prove useful for guiding future research.
Fourthly, although the sample is representative of the biographical demographics, gender and
other elements within the organisation, it may not be representative of the biographical
elements in other retailers or industries within the South African workforce to which the finding
are generalised. Finally, although the store managers interviewed in the study were assured of
the confidentially of their responses, there is still the likelihood that they may not have
answered the questions truthfully. In addition, their responses to the impact of the BSC may
have been based on their bias perception to the implementation of a new performance
management system.
8.7 PHILOSOPHY TOWARDS THE STUDY
The greatest challenge in my career is the ability to integrate the theoretical knowledge I’ve
learnt at university into practical work experiences. Education provides us with the foundation
to think differently, to research new ideas and theories, and most importantly to strive for
excellence. However, in the workplace, we often apply unrealistic or impractical solutions that
we’ve read in a textbook to real work problems or difficult work situations. Therefore, instead
of using our knowledge to shape business processes towards employee and organisational
excellence, we become a hindrance to business, and lose credibility. My philosophy is to use
my academic knowledge, through researching best-practices and bench-marking performance,
to design and develop processes and systems that will enable the organisation to identify,
develop and manage future leaders. These leaders in turn must have the capability to empower,
motivate and engage their staff towards optimal organisation performance and success.
168
This study provided me with the opportunity to integrate academic knowledge in the corporate
setting, by investigating the impact of a performance management system i.e. the balanced
scorecard on actual employee and organisational performance, as well as on motivation. Both
these concepts i.e. performance and motivation, are the cornerstone of organisational success.
Motivation can drive employee performance, and employee performance can lead to
organisational profitability. This study provides a ‘burning platform’ for organisations to re-
evaluate their current performance management systems, and the way it aligns employee
performance to organisational performance. In addition, it creates awareness around the impact
of performance systems on employee motivation, especially on how it’s implemented and
communicated by senior managers. For me, this study adds value to organisations as it is
conducted with practical organisational and managerial implications in mind.
8.8 CONCLUSION
This chapter focused on the recommendations of the study to the organisation, as well as
recommendations for future research. This was followed by the contribution of this doctoral
thesis to organisational practice and academic knowledge. Finally, the limitations of the
limitations of the study was also presented, as these limitations may have affected the results
of the study.
In conclusion, this doctoral thesis investigated: (1) the impact of the BSC on employee
performance, (2) the impact of the BSC on organisational performance, and finally (3) the
impact of the BSC on motivation. A mixed method approach was used, where a quantitative
study was conducted to investigate the effect of the BSC as a performance management system,
and its effect on motivation. This was followed by a qualitative approach that examined
managers’ perceptions on the implementation of the BSC, and its effect on their operating
business and motivation.
The quantitative analysis indicated that the use of the BSC as a performance management
system had a significant impact on Sales, Inventory Loss, Manageable Expenses and Customer
Service. Its impact on Stock Integrity was inconsistent. The results showed that the BSC as a
performance management system led to an increase in Sales and Customer Service, and a
significant decrease in Inventory Loss and Manageable Expenses. Furthermore, the
quantitative analysis also indicated that the BSC did not have a significant impact on
169
organisational performance. While organisational performance is significantly affected by
sales, inventory loss and manageable expenses, customer services and stock integrity, it appears
that it also affected by other factors that are not included in an employee’s KPI’s. Finally, the
quantitative finding indicated that the BSC did not have a significant impact on motivation.
The qualitative approach consisted of semi-structured interviews that was conducted on a
sample of the participants. These interviews provided the study with rich and valuable data.
The qualitative analysis led to the emergence of several themes central to the study, namely,
management support, communication, strategic alignment to employee and organisational
goals, influence on business practices, processes and systems, and finally motivation. The
qualitative analysis indicated that there was no consistency in the way the BSC was supported
my management and communicated. The participants in the interviews also has different views
on the strategic alignment of the BSC key performance indicators (KPI’s) to their current
performance goals, and how the BSC influenced their way of working. Most importantly, the
interviewee’s perceived the impact of the BSC on their motivational levels differently. Some
felt their motivational levels increased, other felt the BSC decreased their motivational levels,
while some felt indifferent to the impact of the BSC to their motivational levels.
Finally, recommendations to the organisation were made, including ensuring that the BSC is
strategic aligned to employee and organisational goals, that there is good management support
and a proper BSC communication plan, and lastly that there is a quick and efficient relationship
between the financial and non-financial perspectives.
170
REFERENCES
Adams, J. S. (1963). Towards an understanding of inequity. The Journal of Abnormal and
Social Psychology, 67(5), 422.
Adams, J. S. (1965). Inequity in social exchange. Advances in experimental social
psychology, 2, 267-299.
Alfirević, N., Pavičić, J., Adžić, B., Šimurina, J., & Bratić, V. (2005). The balanced scorecard
(BSC) approach to performance of a non-profit organization in the transition
environment: The case of the commercial trade union of Croatia (CTU). In the Sixth
International Conference" Enterprise in Transition". Hrvatska znanstvena bibliografija
i MZOS-Svibor.Amabile, DeJong and Lepper (1976).
Al Shaar, E. M., Khattab, S. A., Alkaied, R. N., & Manna, A. Q. (2015). The effect of top
management support on innovation: The mediating role of synergy between
organizational structure and information technology. International Review of
Management and Business Research, 4(2), 499.
Ali, S.M., Shaharudin. M.R., & Anuar, A. (2012). The association between job positions, work
experience and career satisfaction: The case of Malaysian’s academic staff. Asian
Social Science, 8(10), 35-44.
Amato-McCoy, D. M. (2008). The holistic customer experience. Chain Store Age Magazine,
84(5), 118.
Ana-Maria, G., Constantin, B., & Cătălina. R. (2009). The strategic performance
management process. Annals of Faculty of Economics, 4(1), 276-279.
Anthony, R.N. (1965). Planning and control systems: A framework for analysis. Boston: MA.
Armstrong, M., &, A. Baron. (1998). Performance management handbook. London: IPM.
Atkinson, C, A., & Shaw, S. (2008). Managing performance. In Lucas, R Lupton, B and
Mathieson, H. (Eds.), Human Resource Management in an International Context.
London CIPD publishers.
171
Atkinson, J. W. (1957). Motivational determinants of risk-taking behavior. Psychological
review, 64.
Atkinson, J. W. (1964). An introduction to motivation. Princeton, NJ: Van Nostrand.
Awasthi, S. (2012). Analyzing the effectiveness of customer relationships in increasing the
sales volumes with special reference on organized retail stores in Indore City.
International Journal of Retailing & Rural Business Perspectives, 1(1), 102-109.
Ayers, H. (1995). Perspectives on behaviour: A practical guide to effective interventions.
London: David Fulton.
Ba-Abaad, K. M. (2009). Review of the literature of balanced scorecard and performance
measurement: The case of healthcare organizations. Business e-Bulletin, 1(1), 33-47.
Baard, P. P., Deci, E. L., & Ryan, R. M. (2004). Intrinsic Need Satisfaction: A Motivational
Basis of Performance and Weil‐Being in Two Work Settings1. Journal of Applied
Social Psychology, 34(10), 2045-2068.
Bach, N., Calais, P., & Calais, M. (2001). Marketing residential grid-connected PV systems
using a Balanced Scorecard as a marketing tool. Renewable Energy, 22(1), 211-216.
Bandura, A. (1982). Self-efficacy mechanism in human agency. American psychologist, 37(2),
122.
Bandura, A. (1986). Social foundations of thought and action: A social cognitive theory.
Englewood Cliffs, NJ: Prentice-Hall, Inc.
Banker, R. D., Chang, H., & Pizzini, M. J. (2004). The balanced scorecard: Judgmental effects
of performance measures linked to strategy. The Accounting Review, 79(1), 1-23.
Barnes, J. (2015). Three keys to inventory optimization. Journal of Commerce, 21: 22.
Barrick, M. R., Mount, M. K., & Strauss, J. P. (1993). Conscientiousness and performance of
sales representatives: Test of the mediating effects of goal setting. Journal of Applied
Psychology, 78(5), 715.
Batey, M., Booth, T., Furnham, A. F., & Lipman, H. (2011). The relationship between
personality and motivation: Is there a General Factor of Motivation? Individual
Differences Research, 9: 115-125.
172
Beer, M., & Ruh, R. A. (1976). Employee growth through performance management. Harvard
Business Review, 54(4), 59-66.
Behrouzi, F., Shaharoun, A. M., & Ma'aram, A. (2014). Applications of the balanced scorecard
for strategic management and performance measurement in the health
sector. Australian Health Review, 38(2), 208-217.
Bennett, D. (2014). Managing Loss Prevention. Retrieved from
http://www.cstoredecisions.com/2014/08/06/managing-loss-prevention/#.
Biggart, T. B., Burney, L. L., Flanagan, R., & Harden, J. W. (2010). Is a balanced scorecard
useful in a competitive retail environment? Management Accounting Quarterly, 12(1),
1.
Borman, W. C., & Motowidlo, S. M. (1993). Expanding the criterion domain to include
elements of contextual performance. In Schmitt, N. and Borman, W.C. and Associates.
(Eds.), Personnel Selection in Organizations. 35-70.
Boyatzis, R. E. (1998). Thematic analysis and code development: Transforming qualitative
information. London: Sage Publications.
Braun, V., & Clarke, V. (2006). Using thematic analysis in psychology. Qualitative research
in psychology, 3(2), 77-101.
Brown, M. A. (1976). Values - a necessary but neglected ingredient of motivation on the
job. Academy of Management Review, 1(4), 15-23.
Buchner, T.W. (2007). Performance management theory: A look from the performer's
perspective with implications for HRD. Human Resource Development International,
10(1), 59-73.
Bukh, P. N., & Malmi, T. (2005). Re-examining the cause-and-effect principle of the balanced
scorecard. Accounting in Scandinavia - The northern lights, January: 87-113.
Butler, A., Letza, S. R., & Neale, B. (1997). Linking the balanced scorecard to strategy. Long
range planning, 30(2), 242-153.
173
Callahan, J. (2015). Thinking through shrink and other issues: With some inventiveness,
c-stores can develop ways to manage their inventory. Convenience Store Decisions,
August: 18.
Cameron. P. (2002). “The Balancing Act”. CMA Management, 28- 31.
Campbell, J. P. & Pritchard. RD (1976). Motivation theory in industrial and organizational
psychology. In M.D. Dunnette (Eds.), Handbook of Industrial & Organizational
Psychology, 63-130. Chicago: Rand McNally.
Campbell, J. P., McCloy, R. A., Oppler, S. H., & Sager, C. E. (1993). Personnel selection in
organizations. In N. Schmitt, and W.C. Borman, and Associates. (Eds.), Personnel
selection in organizations, 35-70.
Cardos, I. R., & Pete, S. (2011). Activity-based costing (ABC) and activity-based management
(ABM) implementation - Is this the solution for organizations to gain profitability?
Romanian Journal of Economics, 32(41): 151-168.
Casey, R.J. & Robbins, J. (2010). The Hackman’s and Oldman’s job characteristics model:
Implication from four industries. International Journal of Business and Public
Administration, 7(2), 76-90.
Cederblom, D., & Pemerl, D. E. (2002). From performance appraisal to performance
management: One agency's experience. Public Personnel Management, 31(2), 131-
140.
Chang, R. and Young, P. (1995). Measuring organisational improvement impact. London:
Kogan Page.
Cherniss, C., & Kane, J. S. (1987). Public sector professionals: Job characteristics, satisfaction,
and aspirations for intrinsic fulfilment through work. Human Relations, 40(3), 125-136.
Chi, D. J., & Hung, H. F. (2011). Is the balanced scorecard really helpful for improving
performance? Evidence from software companies in China and Taiwan. African
Journal of business management, 5(1), 224-239.
174
Chiang, C. Y., & Lin, B. (2009). An integration of balanced scorecards and data envelopment
analysis for firm's benchmarking management. Total Quality Management, 20(11),
1153-1172.
Chien, M. H. (2004). A study to improve organizational performance: A view from
SHRM. Journal of American Academy of Business, 4(1/2), 289-291.
Chu, H. L., Wang, C. C., & Dai, Y. T. (2009). A study of a nursing department performance
measurement system: using the balanced scorecard and the analytic hierarchy
process. Nursing Economics, 27(6), 401.
Çınar, O., Bektaş, Ç., & Aslan, I. (2011). A motivation study on the effectiveness of intrinsic
and extrinsic factors. Economics and management, 16, 690-695.
Cobbold, I. (2001). Implementing the balanced scorecard - Lessons and insights from a
financial services firm. Balanced scorecard case study - Arran Ltd. 2GC Research
Paper, 2GC Limited.
Cochran, D., Campinas, J.D., Lobo, C., & Lima, P. (2001). Using axiomatic design to support
the development of a balanced scorecard. International Journal of Business
Performance Management, 3(2/3/4): 154-166.
Cohen, J. (1988). Statistical Power Analysis for the Behavioral Sciences. (2nd edition).
Hillsdale, New Jersey: Lawrence Erlbaum.
Cokins, G. (2005). Performance management: Making it work: The promise and perils of the
balanced scorecard. DM Review Online, August, 1034304 - 1
Cooper, R., & Kaplan, R. S. (1992). Activity-based systems: Measuring the costs of resource
usage. Accounting Horizons, 6(3), 1-13.
Cravens, K. S., Oliver, E. G., & Stewart, J. S. (2010). Can a positive approach to performance
evaluation help accomplish your goals? Business Horizons, 53(3), 269-279.
Daniels, S. (2008). The human component. Retail Merchandiser, 48(6): 25.
Darlington, H. (2011). Understanding Gross Profit Margin. Supply House Times; 54(9), 80-84.
175
De Geuser, F., Mooraj, S., & Oyon, D. (2009). Does the balanced scorecard add value?
Empirical evidence on its effect on performance. European Accounting Review, 18(1),
93-122.
Deci, E. L. (1971). Effects of externally mediated rewards on intrinsic motivation. Journal of
Personality and Social Psychology, 18(1), 105.
Deci, E.L. (1975). Intrinsic Motivation. New York, NY: Plenum
Deci, E. L., Connell, J. P., & Ryan, R. M. (1989). Self-determination in a work
organization. Journal of Applied Psychology, 74(4), 580.
Deci, E. L., Koestner, R., & Ryan, R. M. (1999). A meta-analytic review of experiments
examining the effects of extrinsic rewards on intrinsic motivation. Psychological
bulletin, 125(6), 627.
Deci, E. L., Koestner, R., & Ryan, R. M. (2001). Extrinsic rewards and intrinsic motivation in
education: Reconsidered once again. Review of Educational Research, 71(1), 1-27.
Deci, E. L., & Ryan, R. M. (1985). Intrinsic motivation and self-determination in human
behavior. Berlin: Springer Science & Business Media.
Decoene, V., & Bruggeman, W. (2006). Strategic alignment and middle-level managers'
motivation in a balanced scorecard setting. International Journal of Operations &
Production Management, 26(4), 429-448.
DeNisi, A. S., & Pritchard, R. D. (2006). Performance appraisal, performance management and
improving individual performance: A motivational framework. Management and
Organization Review, 2(2), 253-277.
Dessler, G. (1986). Organization theory: Integrating structure and behavior. Englewood
Cliffs, NJ: Prentice Hall.
Dessler, G. (2005), Human Resource Management, Boston: Pearson.
DeVaro, J., Li, R., & Brookshire, D. (2007). Analysing the job characteristics model: New
support from a cross-section of establishments. The International Journal of Human
Resource Management, 18(6), 986-1003.
Drucker, P. (1954). The principles of management. New York.
176
Drucker, P. F. (1998). The discipline of innovation. Harvard business review, 76(6), 149-157.
Dumitrescu, L., & Fuciu, M. (2009). Balanced scorecard – a new tool for strategic
management. Scientific Bulletin - Nicolae Balcescu Land Forces Academy, 14(2), 37.
Earley, P. C. (1993). East meets West meets Mideast: Further explorations of collectivistic and
individualistic work groups. Academy of Management Journal, 36(2), 319-348.
Eccles, R. (1991). The performance measurement manifesto. Harvard Business Review,
January-February, 131-137.
Edis, M. (1995). Performance Management and Appraisal in Health Services. London: Kogan
Page.
Eker, M., & Eker, S. (2009). An empirical analysis of the association between the
organizational culture and performance measurement systems in the Turkish
manufacturing sector. Journal of Economic and Social Research, 11(2), 43-76.
Ellemers, N., De Gilder, D., & Haslam, S. A. (2004). Motivating individuals and groups at
work: A social identity perspective on leadership and group performance. Academy of
Management Review, 29(3), 459-478.
Fitzgerald, L., & Moon, P. (1996). Performance measurement in service industries: making it
work. Chartered Institute of Management Accountants (CIMA), 53(3), 110.
Fletcher, H. D., & Smith, D. B. (2004). Managing for value: Developing a performance
measurement system integrating economic value added and the balanced scorecard in
strategic planning. Journal of Business Strategies, 21(1), 1.
Frese, M. (2001). Personal initiative (PI): The theoretical concept and empirical findings. In
M. Erez, U. Kleinbeck., and H. Thierry. (Eds.), Work motivation in the context of a
globalizing economy. NJ: Erlbaum.
Fudge, R. S., & Schlacter, J. L. (1999). Motivating employees to act ethically: An expectancy
theory approach. Journal of Business Ethics, 18(3), 295-304.
Furnham, A. (1997). The Psychology of Behaviour at Work: The Individual in the
Organization. Hove: Psychology Press.
177
Furnham, A., Eracleous, A., & Chamorro-Premuzic, T. (2009). Personality, motivation and job
satisfaction: Herzberg meets the Big Five. Journal of Managerial Psychology, 24(8),
765-779.
Gagné, M., & Deci, E. L. (2005). Self-determination theory and work motivation. Journal of
Organizational behavior, 26(4), 331-362.
Garr, S. (2010). Using a coaching & development performance management model while still
rewarding differentiated performance. S.l.: Bersin & Associates.
Garvin, D. A. (1993). Manufacturing strategic planning. California Management
Review, 35(4), 85.
Gatenby, M., Rees, C., Soane, E., & Truss, C. (2009). Employee engagement in context.
London: Chartered Institute of Personnel and Development.
Goh, F.A. and Anderson, M.C. (2007). Driving business value from performance management
at Caterpillar. Organization Development Journal, 25(2), 219.
Greenberg, J. (2000). Promote procedural justice to enhance acceptance of work
outcomes. Handbook of Principles of Organizational Behavior, 181, 195.
Griffin, M. A., Neal, A., & Parker, S. K. (2007). A new model of work role performance:
Positive behavior in uncertain and interdependent contexts. Academy of Management
Journal, 50(2), 327-347.
Grigore, A., Bagu, C., & Radu, C. (2009). The strategic performance management system.
Annals of Faculty of Economics, 4, 276-79.
Gruman, J. A., & Saks, A. M. (2011). Performance management and employee
engagement. Human Resource Management Review, 21(2), 123-136.
Hacker, W. (1994). Action regulation theory and occupational psychology: review of German
empirical research since 1987. German Journal of Psychology, 18, 91–120.
Hackman, J. R., & Oldham, G. R. (1975). Development of the job diagnostic survey. Journal
of Applied psychology, 60(2), 159.
Hackman, J. R., & Oldham, G. R. (1980). Work redesign. Reading, Mass: Addison-Wesley
178
Hannif, Z., & Vo, A. (2011). Workplace relationships and perceptions of job quality: What
does it matter? International Review of Business Research Papers, 7(1), 16-25.
Hanson, W. E., Creswell, J. W., Clark, V. L. P., Petska, K. S., & Creswell, J. D. (2005). Mixed
methods research designs in counselling psychology. Journal of Counselling
Psychology, 52(2), 224.
Harpaz, I. (1990). The importance of work goals: An international perspective. Journal of
International Business Studies, 75-93.
Harrison, D. A., & Shaffer, M. A. (2005). Mapping the criterion space for expatriate success:
task-and relationship-based performance, effort and adaptation. The International
Journal of Human Resource Management, 16(8), 1454-1474.
Heinrich, C. J., & Marschke, G. (2010). Incentives and their dynamics in public sector
performance management systems. Journal of Policy Analysis and
Management, 29(1), 183.
Heneman, R.L. (1990). Merit pay research. In K.M. Rowland and G.R. Ferris. (Eds.), Research
in Personnel and Human Resources Management. Greenwich, CT: JAI Press.
Herzberg, F., Mauser, B., & Snyderman, B. B. (1959). The motivation to work. New York:
Wiley.
Heskett, J., W. E. Sasser Jr., and L. Schlesinger. (1997). The service profit chain: How leading
companies link profit and growth to loyalty, satisfaction, and value. New York: Free
Press.
Hofstede, G. (1991). Cultures and organisations-software of the mind: intercultural
cooperation and its importance for survival. New York: McGraw-Hill.
Hopf, R. H., Pratsch, L. W., Executive, P., Welch, R. A., Denett, P. A., Litman, D. J., & Tychan,
T. J. (2008). Guide to a balanced scorecard performance management
methodology. Washington, DC: USA Department of Energy.
Hoque, Z., & James, W. (2000). Linking balanced scorecard measures to size and market
factors: impact on organizational performance. Journal of Management Accounting
Research, 12(1), 1-17.
179
Huang, X., & Van De Vliert, E. (2003). Where intrinsic job satisfaction fails to work: National
moderators of intrinsic motivation. Journal of Organizational Behavior, 24(2), 159
-179.
Hughes, S. B., & Gjerde, K.A.P. (2003). Do different cost systems make a difference?
Management Accounting Quarterly, 5(1), 45-55, 66.
Hull, C. L. (1943). Principles of behavior: An introduction to behavior theory. New York: D.
Appleton-Century Company, Incorporated.
IBM Corporation. (2012). IBM SPSS Statistics 21. IBM Corporation, Armonk, NY: IBM
Igun, S. N. (2008). Extrinsic motivation as correlates of work attitude of the Nigerian Police
for: Implications for counselling. Education, 129(2), 274.
Ilardi, B. C., Leone, D., Kasser, T., & Ryan, R. M. (1993). Employee and supervisor ratings of
motivation: Main effects and discrepancies associated with job satisfaction and
adjustment in a factory setting. Journal of Applied Social Psychology, 23(21), 1789
-1805.
Inglehart, R. (1997). Modernization and postmodernization: Cultural, economic, and political
change in 43 societies (Vol. 19). Princeton, NJ: Princeton University Press.
Isaac, R. G., Zerbe, W. J., & Pitt, D. C. (2001). Leadership and motivation: The effective
application of expectancy theory. Journal of Managerial Issues, 212-226.
Jackson, L. A., & Qu, H. (2008). A Conceptual Framework for Managing Lodging Brands: A
Balanced‐Scorecard Approach. Journal of Quality Assurance in Hospitality &
Tourism, 9(2), 108-134.
Jehn, K. A., & Bezrukova, K. (2004). A field study of group diversity, workgroup context, and
performance. Journal of Organizational Behavior, 25(6), 703-729.
Johnson, C. C., Beiman, I., & Collaborative, S. (2007). Balanced Scorecard in Developed and
Transitional Economies. Balanced Scorecard for State-Owned Enterprises, 15-28.
Johnson, G. & Scholes, K. (2002). Exploring Corporate Strategy. (Sixth edition).
Financial Times Prentice Hall/Pearson Education, Edinburgh Gate.
180
Johnson, R. B., & Onwuegbuzie, A. J. (2004). Mixed methods research: A research paradigm
whose time has come. Educational Researcher, 33(7), 14-26.
Jones, J. (2008). Prevent and prevail. Dance Retailer News. 7(6): 30-31.
Judge, T. A., Cable, D.M., Boudreau, J.W., & Bretz, R. D. (1995). An empirical study of the
predictors of executive career success. Personnel Psychology, 48(3), 485-519.
Judge, T. A., & Ilies, R. (2002). Relationship of personality to performance motivation: a
meta-analytic review. Journal of Applied Psychology, 87(4), 797.
Kahn, L. M., & Sherer, P. D. (1990). Contingent pay and managerial performance. Industrial
& Labor Relations Review, 43(3), 107-120.
Kandula, S. R. (2006). Performance Management: Strategies, Interventions, Drivers. S.l.: PHI
Learning Pvt: Ltd.
Kanfer, R. (1991). Motivational theory and organizational/industrial psychology. In M.D.
Dunnette (Eds.), Handbook of Industrial & Organizational Psychology, 75-170.
Chicago: Rand McNally.
Kanji, G. K., & e Sá, M.P. (2002). Kanji's business scorecard. Total Quality
Management, 13(1), 13-27.
Kaplan, R. & Norton, D.P. (1992). The balanced scorecard – measures that drive performance.
Harvard Business Review, 70(1): 71-79.
Kaplan, R.S. & Norton, D.P. (1993). Putting the balanced scorecard to work. Harvard Business
Review, 71(5): 134 - 147.
Kaplan, R.S. & Norton, D.P. (1996a). Using the balanced scorecard as a strategic management
system. Harvard Business Review, 74(1): 75-85.
Kaplan, R.S. & Norton, D.P. (1996b). Linking the balanced scorecard to strategy. California
Management Review, 39(53-79).
Kaplan, R.S. & Norton, D.P. (2001). Transforming the balanced scorecard from performance
measurement to strategic management: Part 11. Accounting Horizons, 15(1), 87-104.
Karr, A. J. (2009). Belks profits double in quarter. Women’s Wear Daily (WWD), 202 (43): 11
181
Katzell, R. A., & Thompson, D. E. (1990). Work motivation: Theory and practice. American
Psychologist, 45(2), 144.
Ke, W., & Zhang, P. (2010). The effects of extrinsic motivations and satisfaction in open source
software development. Journal of the Association for Information Systems, 11(12),
784-808.
Kim, J., & Hatcher, C. A. (2008). Regulating roles of the use of the balanced scorecard in
shaping corporate identities. In Power and Place: Refereed Proceedings of the
Australian and New Zealand Communication Association Conference. Massey
University.
Kocakülâh, M. C., & Austill, A. D. (2007). Balanced scorecard application in the health care
industry: a case study. Journal of Health Care Finance, 34(1), 72-99.
Kock, R., Roodt, G., & Veldsman, T. H. (2002). The alignment between effective people
management, business strategy and organisational performance in the banking and
insurance sector. SA Journal of Industrial Psychology, 28(3), p-83.
Kontodimopoulos, N., Lambrou, P., & Niakas, D. (2010). Motivation and job satisfaction
among medical and nursing staff in a Cyprus public general hospital. Human Resource
Health, 8, 26.
Kovach, K. A. (1987). What motivates employees? Workers and supervisors give different
answers. Business Horizons, 30(5), 58-65.
Kraus, K., & Lind, J. (2010). The impact of the corporate balanced scorecard on corporate
control - A research note. Management Accounting Research, 21(4), 265-277.
Kuvaas, B. (2006). Work performance, affective commitment, and work motivation: the roles
of pay administration and pay level. Journal of Organizational Behavior, 27(3), 365-
385.
Laitinen, E. K. (1996). Framework for small business performance measurement— Towards
integrated PM systems. Proceedings of the University of Vaasa. Research Papers 210.
Business Administration, Accounting and Finance.
Laitinen, E. K. (2004). Towards a microeconomic approach of the balanced
scorecard. Managerial Finance, 30(6), 1-27.
182
Lambert, S. J. (1991). The combined effects of job and family characteristics on the job
satisfaction, job involvement, and intrinsic motivation of men and women
workers. Journal of Organizational Behavior, 12(4), 341-363.
Latham, G. P., Almost, J., Mann, S., & Moore, C. (2005). New developments in performance
management. Organizational Dynamics, 34(1), 77-87.
Latham, G. P., & Pinder, C. C. (2005). Work motivation theory and research at the dawn of the
twenty-first century. Annual Review Psychology, 56, 485-516.
Lawler III, E. E. (1990). Strategic pay: Aligning organizational strategies and pay systems.
San Francisco: Jossey-Bass.
Lawler, E. E., Hackman, J. R., & Kaufman, S. (1973). Effects of Job Redesign: A Field
Experiment1. Journal of Applied Social Psychology, 3(1), 49-62.
Lemieux-Charles, L., McGuire, W., Champagne, F., Barnsley, J., Cole, D., & Sicotte, C.
(2003). The use of multilevel performance indicators in managing performance in
health care organizations. Management Decision, 41(8), 760-770.
Lepper, M. R., & Greene, D. (1975). Turning play into work: Effects of adult surveillance and
extrinsic rewards on children's intrinsic motivation. Journal of Personality and Social
Psychology, 31(3), 479.
Levensaler, L. (2008). The essential guide to employee performance management systems. S.l.:
Bersin and Associates Survey.
Lewin, K. (1935). A dynamic theory of personality. New York, McGraw-Hill.
Lewis, R. W. (1955). Measuring, reporting and appraising results of operations with reference
to goals, plans and budgets, planning, managing and measuring the business: A case
study of management planning and control at General Electric Company. New York:
Controllership Foundation.
Lindner, J. R. (1998). Understanding employee motivation. Journal of Extension, 36(3), 1-8.
Ling Sim, K., & Chye Koh, H. (2001). Balanced scorecard: a rising trend in strategic
performance measurement. Measuring Business Excellence, 5(2), 18-27.
183
Locke, E. A. (1978). The ubiquity of the technique of goal setting in theories of and approaches
to employee motivation. Academy of Management Review, 3(3), 594-601.
Locke, E.A. & Latham, G.P. (1979). Goal setting: A motivational technique that works.
Organizational Dynamics, 8(2), 68-80.
Locke, E.A. & Latham, G.P. (1984). Goal setting: A motivational technique that works.
Englewood Cliffs N.J: Prentice- Hall.
Locke, E.A. & Latham, G.P. (1990a). A theory of goal setting and task performance.
Englewood Cliffs N.J: Prentice- Hall.
Locke, E.A. & Latham, G.P. (1990b). Work motivation and satisfaction: Light at the end of the
tunnel. Psychological Science, 1(4): 240-246.
Locke, E. A., & Latham, G. P. (2002). Building a practically useful theory of goal setting and
task motivation: A 35-year odyssey. American Psychologist, 57(9), 705.
Locke, E. A., & Latham, G. P. (2004). What should we do about motivation theory? Six
recommendations for the twenty-first century. Academy of Management Review, 29(3),
388-403.
Locke, E. A., & Latham, G. P. (2006). New directions in goal-setting. Current directions in
Organizational Science, 15(5), 265-268.
Lohman, C., Fortuin, L., & Wouters, M. (2004). Designing a performance measurement
system: A case study. European Journal of Operational Research, 156(2), 267-286.
London, M. (1983). Toward a theory of career motivation. Academy of management
review, 8(4), 620-630.
Lunenburg, F. C. (2011). Self-efficacy in the workplace: Implications for motivation and
performance. International Journal of Management, Business, and
Administration, 14(1), 1-6.
Luthans, F., Youssef, C. M., & Avolio, B. J. (2007). Psychological capital. New York, NY:
Oxford University Press.
Lynch, R. & Cross, K. (1991). Measure up! Yardsticks for continuous improvement, Oxford:
Blackwell.
184
Macey, W. H., Schneider, B., Barbera, K.M., & Young, S.A. (2009). Employee Engagement:
Tools for Analysis, Practice, and Competitive Advantage. West Sussex, UK: Wiley
-Blackwell.
Magwaza, N. (2014). Foschini grows cash sales to beat storm. Retrieved from
http://www.iol.co.za/business/news/foschini-grows-cash-sales-to-beat-storm-
1.1696060.
Maisel, L. S. (1992). Performance measurement: the balanced scorecard approach. Journal of
cost management, 6(2), 47-52.
Malina, M. A., & Selto, F. H. (2001). Communicating and controlling strategy: an empirical
study of the effectiveness of the balanced scorecard. Journal of Management
Accounting Research, 13(1), 47-90.
Malmi, T. (2001). Balanced scorecards in Finnish companies: a research note. Management
Accounting Research, 12(2), 207-220.
Mankoff, A. W. (1974). Values-not attitudes-are the real key to motivation. Management
Review, 63(12), 23-29.
Marr, B. (2009). Delivering success: How Tesco is managing, measuring and maximising its
performance. Management Case Study. London: The Advanced Performance Institute.
Marshall, M.N. (1996). Sampling for qualitative research. Family Practice, 13(6), 522-525.
Martinsons, M., Davison, R., & Tse, D. (1999). The balanced scorecard: a foundation for the
strategic management of information systems. Decision support systems, 25(1), 71-88.
Maslow, A. H. (1943). A theory of human motivation. Psychological review, 50(4), 370.
Mathis, R., & Jackson, J. (2000). Job Analysis and the Changing Nature of Jobs. In: Human
Resource Management. Cincinnati, OH: South-Western College Publishing.
McClelland, D. C. (1961). The achieving society. Princeton, NJ: Van Nostrand.
McGregor, D. M. (1957). The human side of enterprise. Management Review, November.
McGregor, D. (1960). The human side of enterprise. New York, 21, 166.
185
McGregor. L. (2014). Keep ‘em coming? Earnshaw Magazine, January. Retrieved from
http://www.earnshaws.com/2014/01/shop-class/keep-em-coming.
McNair, C. J., Lynch, R. L., & Cross, K. F. (1990). Do financial and nonfinancial performance
measures have to agree? Strategic Finance, 72(5), 28.
Merritt, C. (2016). Why Is Inventory Control Important? Retrieved from
http://smallbusiness.chron.com/inventory-control-important-74237.html.
Michaelson, C. (2005). Meaningful motivation for work motivation theory. Academy of
Management Review, 30(2), 235-238
Mitchell, T. R. (1982). Motivation: New directions for theory, research, and practice. Academy
of management review, 7(1), 80-88.
Mitchell, T. R. (1997). Matching motivational strategies with organizational
contexts. Research in Organizational Behavior, 19, 57-150.
Mondy, R. W., Noe, R., & Premeaux, S. R. (2002). Type Z organization: Stability in the midst
of mobility. Human Resource Management, 308.
Monosoff, T. (2006). Demystifying profit margins and mark-ups. Retrieved from
http://www.entrepreneur.com/article/170964.
Mooraj, S., Oyon, D., & Hostettler, D. (1999). The balanced scorecard: a necessary good or an
unnecessary evil? European Management Journal, 17(5), 481-491.
Motowildo, S. J., Borman, W. C., & Schmit, M. J. (1997). A theory of individual differences
in task and contextual performance. Human performance, 10(2), 71-83.
Muchinsky, P. M. (2003). Psychology: Applied to work. Belmont, CA: Wadsworth/Thomson
Learning.
Mullins, L. J. (2007). Management and organisational behaviour. Englewood Cliffs, NJ:
Pearson Education.
Naves, P. M. (2002). Benchmarking Eskom’s Human Resource Practices impacting on
organisational performance. Doctoral dissertation, Rand Afrikaans University.
186
Nawab, S., Bhatti, K. K., & Shafi, K. (2011). Effect of motivation on employees’ performance.
Interdisciplinary Journal of Contemporary Research in Business, 3(3), 1209-1216.
Neary, D. B. (2002). Creating a company‐wide, on‐line, performance management system: A
case study at TRW Inc. Human Resource Management, 41(4), 491-498.
Neely, A., & Adams, C. (2000). Perspectives on performance: the performance prism. Focus
Magazine for the Performance Management Professional, August (4).
Nielsen, S., and Nielsen, E.H. (2008). System dynamics modelling for a balanced scorecard.
Management Research News, 31(3), 169-188.
Niven, P. R. (2006). Balanced scorecard: Step-by-step for government and non-profit
agencies. New York: John Wiley & Sons.
Norreklit, H. (2000). The balance on the balanced scorecard a critical analysis of some of its
assumptions. Management Accounting Research, 11(1), 65-88.
Northcott, D., & Ma'amora Taulapapa, T. (2012). Using the balanced scorecard to manage
performance in public sector organizations: Issues and challenges. International
Journal of Public Sector Management, 25(3), 166-191.
Norton, D.P. and Daum, J.D. (1999). Translating strategy into action: the balanced scorecard.
Strategic Enterprise Management, May, 1-45.
O’ Leonard (2009). Talent management factbook: Best practices and benchmarks in talent
management. S.l. :Bersin & Associates, July.
Oakland, J. S. (1993). Total quality management: the route to improving performance. (2nd
edition). Oxford: Butterworth Heinemann.
Otley, D. (1999). Performance management: a framework for management control systems
research. Management accounting research, 10(4), 363-382.
Owens, R. (1987). Organizational behavior in education, Englewood Cliffs, NJ: Prentice-Hall.
Pallant, J. (2013). SPSS survival manual. McGraw-Hill Education (UK).
Pearce, J. L., Stevenson, W. B., & Perry, J. L. (1985). Managerial compensation based on
organizational performance: A time series analysis of the effects of merit pay. Academy
of Management Journal, 28(2), 261-278.
187
Pearson, C. A. (1992). Autonomous workgroups: An evaluation at an industrial site. Human
Relations, 45(9), 905-936.
Perry, J. L., & Porter, L. W. (1982). Factors affecting the context for motivation in public
organizations. Academy of Management Review, 7(1), 89-98.
Porter, L. W., & Lawler, E. E. (1968). Managerial attitudes and performance. New York:
American Foundation for Management Research, Inc.
Porter, L. W., & Miles, R. E. (1974). Motivation and management. Contemporary
Management: Issues and viewpoints, 545-570.
Pulakos, E. D., Arad, S., Donovan, M. A., & Plamondon, K. E. (2000). Adaptability in the
workplace: development of a taxonomy of adaptive performance. Journal of Applied
Psychology, 85(4), 612.
Quigley, N. R., & Tymon Jr, W. G. (2006). Toward an integrated model of intrinsic motivation
and career self-management. Career Development International, 11(6), 522-543.
Rabey, G. P. (2001). Motivation is response. Industrial and Commercial Training, 33(1), 26
-28.
Rademan, D. J., & Vos, H. D. (2001). Performance appraisals in the public sector: are they
accurate and fair? SA Journal of Industrial Psychology, 27(1), p-54.
Reis, H. T., Sheldon, K. M., Gable, S. L., Roscoe, J., & Ryan, R. M. (2000). Daily well-being:
The role of autonomy, competence, and relatedness. Personality and Social Psychology
Bulletin, 26(4), 419-435.
Republic of South Africa (1995). The Labour Relations Act of 1995. Durban: Butterworths
Publishers.
Rigby, D. (2005). Management tools 2005. New York: Bain & Company.
Rigby, D. (2007). Management tools 2007. New York: Bain & Company.
Rillo, M. (2004). Limitations of balanced scorecard: Proceedings of the 2nd scientific and
educational conference, Business Administration. Business in a Globalizing Economy.
Parnu, January: 155-161
188
Robbins, S.P. (1993). Organizational Behavior: Concepts, Controversies, and Applications.
6th (Ed). New York: Prentice Hall.
Rogers, S. (1990). Performance management in local government. London: Longman.
Rotter, J. B. (1954). Social learning and clinical psychology. Englewood Cliffs, NJ: Prentice
Hall
Rucci, A. J., Kim, S. P., & Quinn, R. T. (1998). The employee – customer-profit chain at Sears.
Harvard Business Review, 76: 83–97
Ryan, R. M., & Deci, E. L. (2000). Self-determination theory and the facilitation of intrinsic
motivation, social development, and well-being. American psychologist, 55(1), 68.
Ryan, R. M., Sheldon, K. M., Kasser, T., & Deci, E. L. (1996). All goals are not created equal:
An organismic perspective on the nature of goals and their regulation. In P. M.
Gollwitzer & J. A. Bargh. (Eds.), The psychology of action: Linking cognition and
motivation to behaviour. New York: Guilford.
Sagie, A., Elizur, D., & Yamauchi, H. (1996). The structure and strength of achievement
motivation: A cross‐cultural comparison. Journal of Organizational Behavior, 17(5),
431-444.
Saxena, D. (2010). Performance Management System. Global Journal of Management and
Business Research, 10(5).
Schein, E. H. (1985). Organisational culture and leadership: A dynamic view. San Francisco:
Jossey-Bass.
Schaufeli, W.B. & Salanova, M. (2007). Work engagement: An emerging psychological
concept and its implications for organizations. In S.W. Gilliland, D.D. Steiner & D.P.
Skarlicki (Eds.), Research in social issues in management: Vol. 5. Managing social and
ethical issues in organizations. Greenwich, CT: Information Age Pubmications.
Schöneborn, F. (2003). Linking the Balanced Scorecard to Systems Dynamics: Revised Version
of a Paper Presented for the 21st International System Dynamics Conference. New
York City, July 20-24.
189
Scott, W. G., & Hart, D. K. (1979). Organizational America: Can individual freedom survive
within the security it promises. Boston, MA: Houghton Mifflin.
Sekaran, U. (2002). Research methods for business: a skill-building approach. New York:
Wiley.
Shalley, C. E., & Oldham, G. R. (1985). Effects of goal difficulty and expected external
evaluation on intrinsic motivation: A laboratory study. Academy of Management
Journal, 28(3), 628-640.
Shalley, C. E., Oldham, G. R., & Porac, J. F. (1987). Effects of goal difficulty, goal-setting
method, and expected external evaluation on intrinsic motivation. Academy of
Management Journal, 30(3), 553-563.
Shamir, B. (1991). Meaning, self and motivation in organizations. Organization Studies, 12(3),
405-424.
Shamsi, A. F. (2010). Performance management techniques and approaches for effective
organizational development process-gainsays and effectuations. Journal of Business
Strategies, 4(2), 78
Sharma, A. (2009). Implementing balance scorecard for performance measurement. ICFAI
Journal of Business Strategy, 6(1), 7-16.
Shieh, C. J. (2008). Effect of corporate compensation design on organizational
performance. Social Behavior and Personality: an international journal, 36(6), 827
-840.
Shirom, A., Westman, M., & Melamed, S. (1999). The effects of pay systems on blue-collar
employees' emotional distress: The mediating effects of objective and subjective work
monotony. Human Relations, 52(8), 1077-1097.
Shuffler, J. (2008). The 5-Finger Discount gets bigger. Oregon Business Magazine, 31(8): 14.
Silverthorne, C. P. (1992). Work motivation in the United States, Russia, and the Republic of
China (Taiwan): A comparison. Journal of Applied Social Psychology, 22(20), 1631
-1639.
190
Simon, H. A., Guetzkow, H., Kozmetsky, G., & Tyndall, G. (1954). Centralization
vs. Decentralization in Organizing the Controller’s Department, New York:
Controllership Foundation Inc.
Simons, R. (1995). Levers of Control. Boston: Harvard Business School Press.
Skidmore, S. (1994). Introducing Systems Analysis. Manchester: NCC-Blackwell.
Skinner, B. F. (1979). The shaping of a behaviorist. New York: Alfred A. Knopf
Sobotka, M., & Platts, K. W. (2010). Managing without measuring: a study of an electricity
distribution company. Measuring Business Excellence, 14(1), 28-42.
Springer, G. J. (2011). A study of job motivation, satisfaction, and performance among bank
employees. Journal of Global Business Issues, 5(1), 29-42.
Srinivasa Rao, D. A. (2007). Effectiveness of performance management systems: an empirical
study in Indian companies. The International Journal of Human Resource
Management, 18(10), 1812-1840.
Steers, R. M., & Porter, L. W. (1983). Employee commitment to organizations. Motivation and
Work Behavior, 99, 441-451.
Stern Stewart & Co. (1991). The Quest for Value. The EVA Management Guide. New York:
Harper Business
Stewart, G.B. (1994). EVA: Fact and Fantasy. Journal of Applied Corporate Finance, 7(2):
71- 84.
Stivers, B. P., & Joyce, T. (2000). Building a balanced performance management system. SAM
Advanced Management Journal, 65(2), 22.
Tan, K., & Newman, E. (2013). The evaluation of sales force training in retail
organizations: A test of Kirkpatrick's four-level model. International Journal of
Management, 30(2), 692.
Tayler, W. B. (2010). The balanced scorecard as a strategy-evaluation tool: The effects of
implementation involvement and a causal-chain focus. The Accounting Review, 85(3),
1095-1117.
191
Taylor Frederick, W. (1911). The principles of scientific management. New York: Harper.
Tennyson, P. A., & Ray, K. (2005). Creating a strategic communication plan that gathers no
dust. Journal of American Water Works Association, 97(1), 48-57.
Thau, B. (2015). A look at the retail model of the future. Retrieved from
http://www.forbes/sites/barbarathau/2015/02/10/a-llok-at-the-retail-model-model-of-
the future/#4ab5a98a17e8.
Theobald, S. (2015). Which is SA’s most profitable retailer? Retrieved from
http://today.moneyweb.co.za/article?id=436369#.VqMn25p96M8.
Ton, Z., & Raman, A. (2010). The effect of product variety and inventory levels on retail store
sales: A longitudinal study. Production and Operations Management, 19(5), 546-560.
Tremblay, M. A., Blanchard, C. M., Taylor, S., Pelletier, L. G., & Villeneuve, M. (2009). Work
extrinsic and intrinsic motivation scale: Its value for organizational psychology
research. Canadian Journal of Behavioural Science/Revue, 41(4), 213.
Tuomela, T. S. (2005). The interplay of different levers of control: A case study of introducing
a new performance measurement system. Management Accounting Research, 16(3),
293-320.
Vallerand, R. J. (1997). Toward a hierarchical model of intrinsic and extrinsic motivation.
Advances in Experimental Social Psychology, 29, 271–360
van Riel, C. B., & Balmer, J. M. (1997). Corporate identity: the concept, its measurement and
management. European Journal of Marketing, 31(5/6), 340-355.
Veenhoven, R., & Ehrhardt, J. (1995). The cross-national pattern of happiness: Test of
predictions implied in three theories of happiness. Social Indicators Research, 34(1),
33-68.
Vermaak, F. S. N., & Cronje, C. J. (2004). The balanced scorecard as a potential instrument
for supporting planning and improvement in accounting education: comparative survey
findings. South African Journal of Economic and Management Sciences, 7(30): 480
-491.
192
Vijayraghavan. K. (2011). Modern retail chains led by Croma on warpath with durable makers
over margins. Retrieved from http://articles.economictimes.indiatimes.com/2011-03
-11/news/28680388_1_retail-chains-modern-retailers-demand-for-higher-margins.
Viswesvaran, C., & Ones, D.S. (2005). Job performance: Assessment issues in personnel
selection. In A. Evers, N. Anderson, & O. Voskuijl. (Eds.), The Blackwell handbook of
personnel selection. United Kingdom: Blackwell.
Vroom, V. H. (1964). Work and motivation. New York: Wiley.
Wayne, S. J., Liden, R. C., Kraimer, M. L., & Graf, I. K. (1999). The role of human capital,
motivation and supervisor sponsorship in predicting career success. Journal of
Organizational Behavior, 20(5), 577-595.
Weiner, B. (1985). An attributional theory of achievement motivation and
emotion. Psychological Review, 92(4), 548.
Weir, E., d'Entremont, N., Stalker, S., Kurji, K., & Robinson, V. (2009). Applying the balanced
scorecard to local public health performance measurement: deliberations and
decisions. BMC Public Health, 9(1), 127.
West, L., Quazi, A. & Davies, D. (2009). The balanced scorecard as a framework for
performance management in the non-profit sector: Conference Paper E1. Australia
New Zealand Marketing Academy, 30 November – 02 December.
Williams, G. C., Saizow, R. B., & Ryan, R. M. (1999). The importance of self-determination
theory for medical education. Academic Medicine, 74(9), 992-5.
Witcher, B. J., & Chau, V. S. (2008). Contrasting use of the balanced scorecard: case studies
at two UK companies. Strategic Change, 17, 101-14.
Worthington, A. C., & West, T. (2001). Economic value-added: A review of the theoretical
and empirical literature. Asian Review of Accounting, 9(1), 67-86.
Wright, B. E. (2004). The role of work context in work motivation: A public sector application
of goal and social cognitive theories. Journal of Public Administration Research and
Theory, 14(1), 59-78.
193
Yek, T. M., Penney, D., & Seow, A. C. (2007). Using balanced scorecard (BSC) to improve
quality and performance of vocational education and training (VET): A case study in
Singapore. In AARE 2007 International Educational Research Conference (p.1-25)
Young. P.T. (1950). Motivation. In W.S. Monroe. (Ed.), Encyclopaedia of educational
research. New York: McMillan.
Zaczkiewick. A. (2015). Port woes, markdowns erode margins. Women’s Wear Daily
(WWD), 209 (64): 8.
Zuckerman, M., Porac, J., Lathin, D., Smith, R., & Deci, E. L. (1978). On the importance of
self-determination for intrinsically motivated behavior. Personality and Social
Psychology Bulletin, 4: 443–446.
194
APPENDICES
APPENDIX A – ETHICAL CLEARANCE TO CONDUCT THE STUDY
195
APPENDIX B - CONSENT FORM TO PARTICIPANTS
UNIVERSITY OF KWAZULU-NATAL
SCHOOL OF PSYCHOLOGY
Doctorial in Administration (Industrial Psychology) Research Project
Researcher: Nolan R. Shadrach (082 9263679)
Supervisor: Professor Buitendach (031 260 2407)
CONSENT
I……………………………………………………………. (Full names of participant) hereby
confirm that I understand the contents of this document and the nature of the research project,
and I consent to participating in the research project conducted by Nolan R. Shadrach (PHD
student at UKZN).
I understand that my participation is voluntary and that I can withdraw at any stage of the
project without being penalized or disadvantaged in any way. I understand that any data that
the researcher extracts from the research study for use in reports or published findings will not,
under any circumstances, contain names or identifying characteristics.
Signature of Participate: _________________________________
Date: _____________________
196
APPENDIX C – INTRODUCTION LETTER TO PARTICIPANTS DESCRIBING THE
PURPOSE OF THE RESEARCH STUDY
UNIVERSITY OF KWAZULU-NATAL
SCHOOL OF PSYCHOLOGY
Doctorial in Administration (Industrial Psychology) Research Project
Researcher: Nolan R. Shadrach (082 9263679)
Supervisor: Professor Buitendach (031 260 2407)
Title of Research Study
The Effect of the Balanced Scorecard on Performance and Motivation in the Retail
Industry.
Purpose of the Research Study
The purpose of this questionnaire is to ascertain what motivates you in the work environment
using the Work Extrinsic and Intrinsic Motivation Scale (WEIMS). The information and ratings
you provide us will go a long way in helping us identifying whether the Balanced Scorecard
used in the organisation leads to motivation. The questionnaire should only take 15-20 minutes
to complete. In this questionnaire, please indicate to what extent each of the following items
corresponds to the reasons why you are presently involved in your work. Work as rapidly as
you can. If you wish to make a comment please write it directly on the booklet itself. Make
sure not to skip any questions.
Thank you for participating!

197
APPENDIX D: BIOGRAPHICAL DETAILS OF PARTICIPATES
BIOGRAPHICAL INFO:
NAME
SURNAME
OCCUPATION
MARK WITH X (where applicable)
EMPLOYEE STATUS
Permanent Contract
AGE
Under 25 25 -30 31 -35 36 – 42
Over 42
GENDER
Male Female
RACE
African Coloured Indian White
QUALIFICATION
No Matric Matric 2-year
certificate
3-year
diploma
Degree/Post Degree
TENURE (LENGTH OF SERVICE)
Less than
1year 1 – 2 years 2 -4 years
More
than 4
years
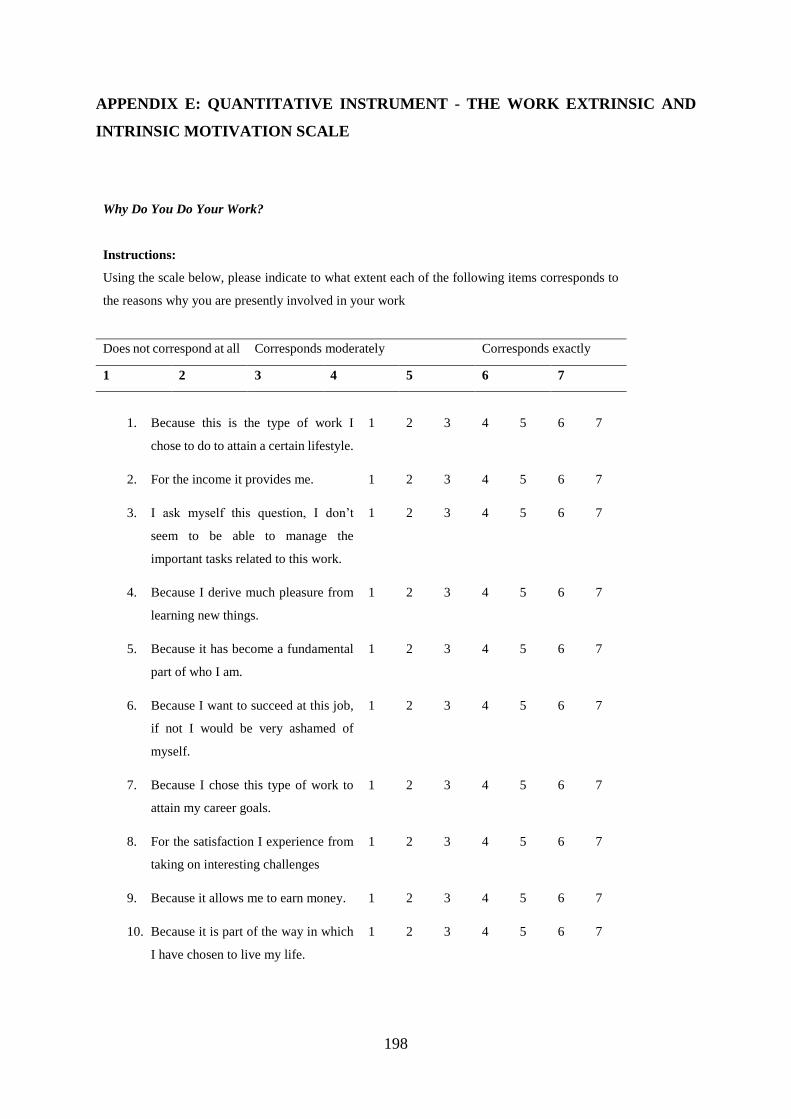
198
APPENDIX E: QUANTITATIVE INSTRUMENT - THE WORK EXTRINSIC AND
INTRINSIC MOTIVATION SCALE
Why Do You Do Your Work?
Instructions:
Using the scale below, please indicate to what extent each of the following items corresponds to
the reasons why you are presently involved in your work
Does not correspond at all Corresponds moderately Corresponds exactly
1 2 3 4 5 6 7
1. Because this is the type of work I
chose to do to attain a certain lifestyle.
1 2 3 4 5 6 7
2. For the income it provides me. 1 2 3 4 5 6 7
3. I ask myself this question, I don’t
seem to be able to manage the
important tasks related to this work.
1 2 3 4 5 6 7
4. Because I derive much pleasure from
learning new things.
1 2 3 4 5 6 7
5. Because it has become a fundamental
part of who I am.
1 2 3 4 5 6 7
6. Because I want to succeed at this job,
if not I would be very ashamed of
myself.
1 2 3 4 5 6 7
7. Because I chose this type of work to
attain my career goals.
1 2 3 4 5 6 7
8. For the satisfaction I experience from
taking on interesting challenges
1 2 3 4 5 6 7
9. Because it allows me to earn money. 1 2 3 4 5 6 7
10. Because it is part of the way in which
I have chosen to live my life.
1 2 3 4 5 6 7
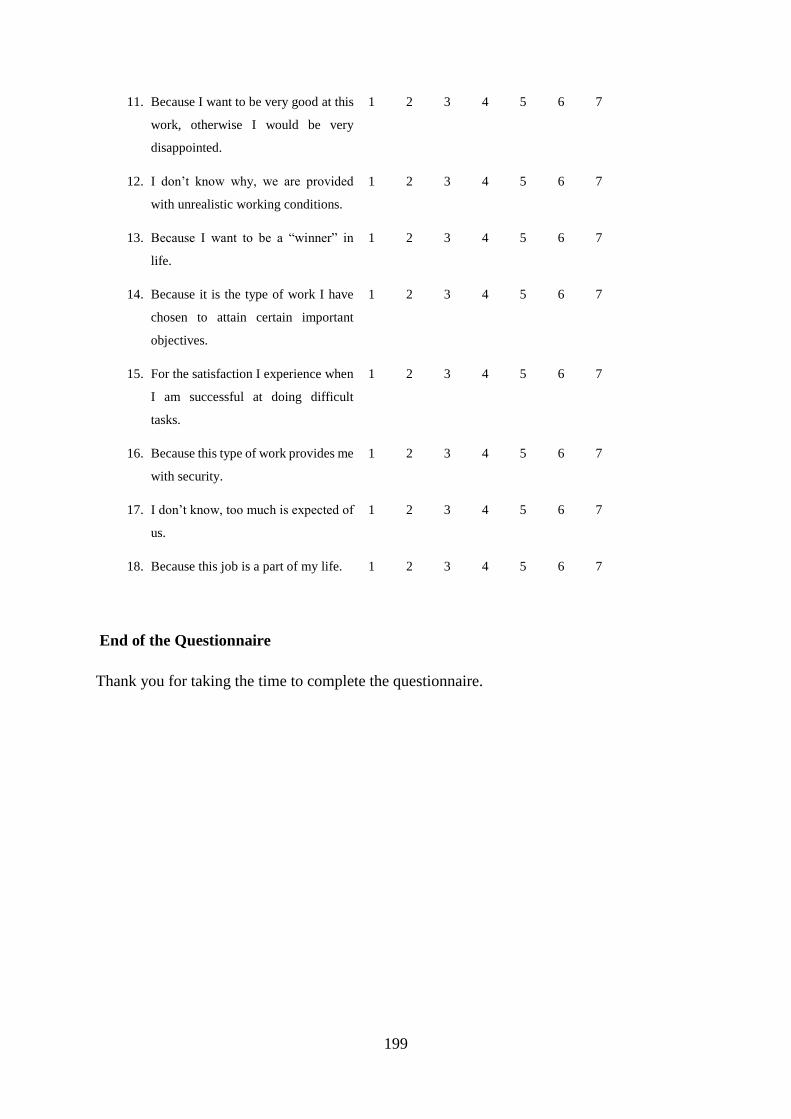
199
11. Because I want to be very good at this
work, otherwise I would be very
disappointed.
1 2 3 4 5 6 7
12. I don’t know why, we are provided
with unrealistic working conditions.
1 2 3 4 5 6 7
13. Because I want to be a “winner” in
life.
1 2 3 4 5 6 7
14. Because it is the type of work I have
chosen to attain certain important
objectives.
1 2 3 4 5 6 7
15. For the satisfaction I experience when
I am successful at doing difficult
tasks.
1 2 3 4 5 6 7
16. Because this type of work provides me
with security.
1 2 3 4 5 6 7
17. I don’t know, too much is expected of
us.
1 2 3 4 5 6 7
18. Because this job is a part of my life. 1 2 3 4 5 6 7
End of the Questionnaire
Thank you for taking the time to complete the questionnaire.
200
APPENDIX F: QUALITATIVE INSTRUMENT - INTERVIEW SCHEDULE
Interview
Schedule
The Study of the Impact of the Balanced
Scorecard on Performance and
Motivation in the Retail Industry
Nolan R. Shadrach

201
INTERVIEW SCHEDULE
(It should be noted that this is only a guideline but that the discussion will determine the
sequence of probing and emergence of issues investigated)
1. To what extent do you feel that the BSC has been supported by Upper Management?
___________________________________________________________________________
___________________________________________________________________________
___________________________________________________________________________
__________________________________________________
2. How important was the BSC framework for developing your strategic map?
___________________________________________________________________________
___________________________________________________________________________
___________________________________________________________________________
___________________________________________________
3. To what extent has the development of the BSC influenced you to restructure your
department?
___________________________________________________________________________
___________________________________________________________________________
___________________________________________________________________________
___________________________________________________
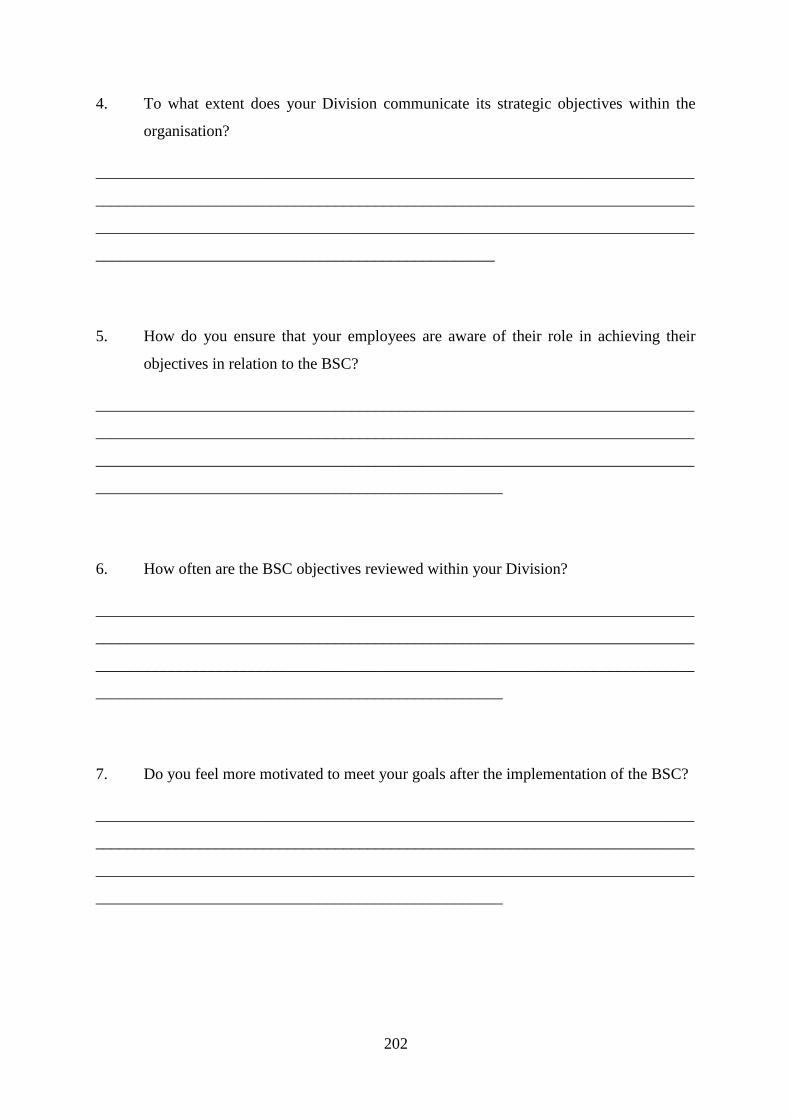
202
4. To what extent does your Division communicate its strategic objectives within the
organisation?
___________________________________________________________________________
___________________________________________________________________________
___________________________________________________________________________
__________________________________________________
5. How do you ensure that your employees are aware of their role in achieving their
objectives in relation to the BSC?
___________________________________________________________________________
___________________________________________________________________________
___________________________________________________________________________
___________________________________________________
6. How often are the BSC objectives reviewed within your Division?
___________________________________________________________________________
___________________________________________________________________________
___________________________________________________________________________
___________________________________________________
7. Do you feel more motivated to meet your goals after the implementation of the BSC?
___________________________________________________________________________
___________________________________________________________________________
___________________________________________________________________________
___________________________________________________

203
8. If yes, what aspects of the BSC are major sources of your motivation?
___________________________________________________________________________
___________________________________________________________________________
___________________________________________________________________________
___________________________________________________
9. If no, what aspects of the BSC are major sources of your reduced motivation or
frustration?
___________________________________________________________________________
___________________________________________________________________________
___________________________________________________________________________
___________________________________________________
204
APPENDIX G: CONFIRMATION OF LANGUAGE EDITING
Confirmation of proofreading and editing.
This serves to confirm that I have proofread this thesis and made relevant corrections and
recommendations.
I have been proofreading Masters and Doctoral theses for the past 10 years for the following
institutions: University of the Witwatersrand; GIBS; University of Cape Town; Milpark;
Mancosa; University of KwaZulu-Natal, University of Johannesburg.
I have also undertaken proofreading for companies, institutions and non-governmental
organisations.
Jennifer Croll
BA (Wits); H.Dip.Lib. (UCT); B.Tech (LIS), B.Inf.Sc. (Hons) (Unisa); MM (Research), MM
(Strategic Marketing) (Wits).
Ph.D. candidate.