Embed Size (px)
Citation preview
I.J.E.M.S., VOL.2 (4) 2011: 233-245 ISSN 2229-600X
233
A STUDY ON THE IMPACT OF COALWASHERY EFFLUENTS ALONGDAMODAR RIVER STRETCH IN DHANBAD DISTRICT,
JHARKHAND, INDIA
1Sundararajan M. , 2Mohan Anand1Principal Scientist, CIMFR, Dhanbad - 826001, India
2Assistant Professor, NSHM Business School, Durgapur-713212, India
ABSTRACTAn appropriate pollutant species transport model has been applied for the prediction of water quality parameters along theDamodar river stretch. This paper addresses the incorporation of various influencing parameters in water quality dispersionphenomena such as velocity variation over the cross section, variation in river dimension and settleable bio-flocculatedparticulate parameters. A computer aided model has been developed and applied to compute accurate and rational flow rateas the flow rate is one of the most important parameter for accurate water quality prediction. As most of the existingmodels assume the river as one dimensional while predicting water qualities, the application of such models in wide riverscan’t return the accurate results, which may not reliable for devising suitable mitigative measures. The river Damodar isconsiderably wide and many tributaries carry the effluents of different industries such as coal mines, coal washeries, cokeplants and townships with various types of pollutants, which have different characteristics in nature to degrade the riverecosystem. The present study has been conducted to simulate water quality along the stretches of Damodar river inDhanbad district during winter season. The velocity variation over the cross section, changes in river dimension, the impactof river course, and the percentage and the settling velocity of particulate maters duly incorporated in the present model. Ithas been observed that the model is effective and economic to study the water quality dispersion along the river stretcheswith 3 to 7% of error compare to the analyzed data. Non-conservative water quality parameters such as Total SuspendedSolids (TSS), Total Dissolved Solids (TDS), Biological Oxygen Demand (BOD), Dissolved Oxygen (DO) and ChemicalOxygen Demand (COD) have been predicted in order to study the dispersion phenomena of the river stretch blended withwashery effluents. The present study may be useful for decision makers, industrialists and environmentalists to devisesuitable Environmental Management Plan and to design appropriate meditative measures
Keywords – Stream velocity distributive function, accurate river flow computation model, river quality dispersion modelling.
INTRODUCTIONThe river water is used for various purpose such asdrinking without treatment, bathing, non-contactrecreational uses, public water supplies, industrial,agricultural, aqua-culture and wild life propagation,navigation and waste receiving etc. The qualityrequirements of water for various beneficial uses would bedifferent. A good river quality management programshould ensure the quality of water at each and every pointthroughout the river stretch. Water quality is maintained ata level appropriate for the intended use requiring thehighest quality of water. To know the suitability of theriver water for intended beneficial uses, it is most desiredthat an accurate and rational assessment of river qualityshould be made after the confluence point of wastewatereffluent outfalls into the river. Therefore it is very muchwarranted to develop appropriate prediction model.Though the development of mathematical model was inprogress in different areas of sciences, the research basedon simulation was very much limited due to lack of fastcomputational facilities [1]. A revolution came threedecades ago in modeling and simulation when the supercomputers were invented [2]. Particularly, there was asudden change in the tread of number of models developedin water and air environments [3-7]. Though muchattention has been paid to simulate the suitable flow sheets
for preparing the coals for the indented use on the basis ofthe characterization of the coal received from the nearbymines in order to increase the production of coal to meetthe fast growing demand of the energy of the world,unfortunately less focus has been made for simulating theenvironmental impact of coal preparation plants on theenvironment [1]. In the present study, appropriatemathematical models have been developed on the basis ofthe governing equation derived out of the initial andboundary conditions of the problems. Further, using themodels, simulation of water has been done in and aroundthe coal washery complexes situated at the bank ofDamodar river stretch. The river water is being utilized forvarious purposes such as drinking, bathing, agriculture andindustrial use. Most of the Industries are responsible forpolluting the environment, particularly the nearby riversystems by continuous discharge of the industrialeffluents. Such Industries are always located on or nearbythe bank of rivers [8, 9]. Therefore, it is very muchwarranted that a study on the dispersion characteristics ofpollutant species along multi wastewater-outfall riversystem has to be considered in order to develop anindigenous and effective algorithm for water qualityprediction, which would lead for designing suitablepredictive system for better river quality managementusing appropriate mathematical models for simulating the
A Study On The Impact Of Coalwashery Effluents Along Damodar River Stretch In Dhanbad District, Jharkhand, India
234
water quality along the river stretches. Most of the existingsoftware has many limitations. These models have beendeveloped with many assumptions with the aim tosimplify the governing equations into the standard form ofdifferential equations, which can easily be solved throughanalytical methods. These models assume the velocityover the cross section of the river system as constant. Theassumption of constant velocity over the cross sectionwould cause significant error in the measure of flow rateand the predicted water quality data would possess a lessaccuracy [10]. Therefore, a study has been carried out forpredicting non-conservative parameters along the multi-industrial-wastewater-outfall river stretch using a basicStreeter and Phelps model [11-13], which has been furtherimproved by incorporating the ratio of settleable bio-flocculated particulate matters and later it was furtherimproved duly incorporating velocity variation over thecross section of the river system and river dimensionalvariations adopting various steps, techniques and tools ofsystem analysis [14]. In this research paper, an appropriatemethod of predicting surface water quality using varioussteps, techniques and tools of system analysis have beenpresented along with a case study carried out forpredicting water quality along the multi-outfall-riverstretches of Damodar river, starting from Mahudacoalwashery to the confluence point of Govai nadi andDamodar River in Dhanbad District of Jharkhand State.
MATERIAL AND METHODS
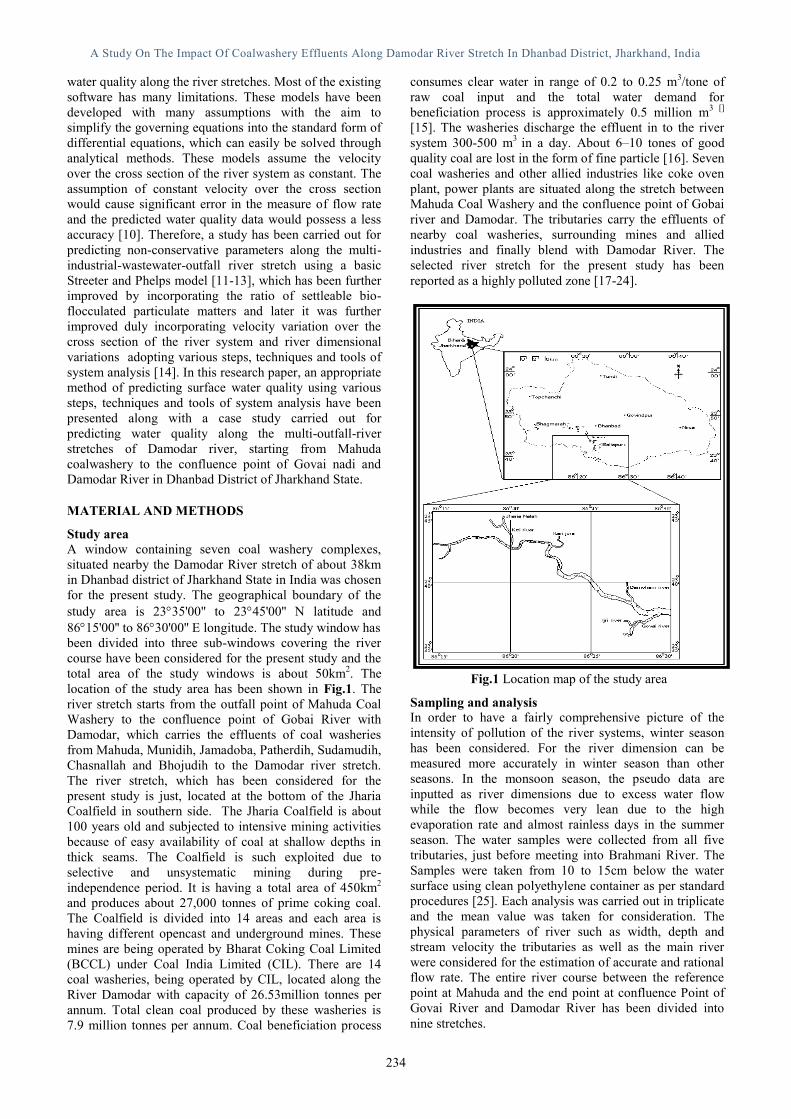
Study areaA window containing seven coal washery complexes,situated nearby the Damodar River stretch of about 38kmin Dhanbad district of Jharkhand State in India was chosenfor the present study. The geographical boundary of thestudy area is 2335'00'' to 2345'00'' N latitude and8615'00'' to 8630'00'' E longitude. The study window hasbeen divided into three sub-windows covering the rivercourse have been considered for the present study and thetotal area of the study windows is about 50km2. Thelocation of the study area has been shown in Fig.1. Theriver stretch starts from the outfall point of Mahuda CoalWashery to the confluence point of Gobai River withDamodar, which carries the effluents of coal washeriesfrom Mahuda, Munidih, Jamadoba, Patherdih, Sudamudih,Chasnallah and Bhojudih to the Damodar river stretch.The river stretch, which has been considered for thepresent study is just, located at the bottom of the JhariaCoalfield in southern side. The Jharia Coalfield is about100 years old and subjected to intensive mining activitiesbecause of easy availability of coal at shallow depths inthick seams. The Coalfield is such exploited due toselective and unsystematic mining during pre-independence period. It is having a total area of 450km2
and produces about 27,000 tonnes of prime coking coal.The Coalfield is divided into 14 areas and each area ishaving different opencast and underground mines. Thesemines are being operated by Bharat Coking Coal Limited(BCCL) under Coal India Limited (CIL). There are 14coal washeries, being operated by CIL, located along theRiver Damodar with capacity of 26.53million tonnes perannum. Total clean coal produced by these washeries is7.9 million tonnes per annum. Coal beneficiation process
consumes clear water in range of 0.2 to 0.25 m3/tone ofraw coal input and the total water demand forbeneficiation process is approximately 0.5 million m3 []
[15]. The washeries discharge the effluent in to the riversystem 300-500 m3 in a day. About 6–10 tones of goodquality coal are lost in the form of fine particle [16]. Sevencoal washeries and other allied industries like coke ovenplant, power plants are situated along the stretch betweenMahuda Coal Washery and the confluence point of Gobairiver and Damodar. The tributaries carry the effluents ofnearby coal washeries, surrounding mines and alliedindustries and finally blend with Damodar River. Theselected river stretch for the present study has beenreported as a highly polluted zone [17-24].
Fig.1 Location map of the study area
Sampling and analysisIn order to have a fairly comprehensive picture of theintensity of pollution of the river systems, winter seasonhas been considered. For the river dimension can bemeasured more accurately in winter season than otherseasons. In the monsoon season, the pseudo data areinputted as river dimensions due to excess water flowwhile the flow becomes very lean due to the highevaporation rate and almost rainless days in the summerseason. The water samples were collected from all fivetributaries, just before meeting into Brahmani River. TheSamples were taken from 10 to 15cm below the watersurface using clean polyethylene container as per standardprocedures [25]. Each analysis was carried out in triplicateand the mean value was taken for consideration. Thephysical parameters of river such as width, depth andstream velocity the tributaries as well as the main riverwere considered for the estimation of accurate and rationalflow rate. The entire river course between the referencepoint at Mahuda and the end point at confluence Point ofGovai River and Damodar River has been divided intonine stretches.
I.J.E.M.S., VOL.2 (4) 2011: 233-245 ISSN 2229-600X
235
Water Quality Dispersion ModelingThe climate condition of the study area does not varydramatically during winter. Therefore, the effect of solarradiation is assumed to be negligible in this area. Thequality of water is significantly controlled by the riverwater flow as well as varying nature of river dimensionssuch as river width, depth and river course, whichconsiderably alter the stream velocity. As a result, thedispersion scenario of water pollutants significantly varyalong the river stretches. Further, the Damodar River hasmany tributaries, which carry the pollutants and toxicelements from different sources such as coal mines,coalwasheries and townships. The selected modelincorporates the velocity variation over the cross sectionof the river, dimensions of the river stretches such aswidth, depth and river course in term of stream velocity asimpacts flow augmentation [14]. It also takes into accountthe physiochemical characteristics of tributaries that blendwith the main river.
The model has been developed based on fundamentaltruth that the concentration of the non-conservative waterquality parameter at time‘t’ is directly proportional to therate of change in the initial concentration. The measure ofBOD contributed by bio-flocculated particulate mattershas been accounted suitable numerical method in thisstudy. The model has been derived taking the settlingvelocity of the settleable bio-flocculated particulate matter.The flow rate is one of the most important inputparameters in river quality prediction. An appropriatecomputer aided model based on the velocity distributionmodel has been chosen for computing accurate andrational flow rates in order to avoid error in prediction.
The velocity distributive function in the cross sectionof the water flow region in laminar flow condition hasbeen derived as
21mVy)V(x,
oax
Dy
(1)
In case of the river whose cross section is non-symmetricsubject to depth axis, which defined to be the length ofline joining vertically a point on the top most layer whosesteam velocity is maximum and a point at the bottom ofthe river, where the river depth is maximum, the velocityof the stream flow may be assumed by the followingfunction:
oax0if
2
oax
Dy1mV
0obif2
obx
Dy1mV
y)V(x,
x
(2)
If u (x,y) is the average stream velocity of the finiteelement whose center is (x,y), then the flow rate of river orstream can be computed as follows:
D
ystepy/2y
ya
xstep0x
y).xδ(y)(x,u2Q
(3)
In case of non-symmetric cross sectional river system withthe extremities of top layer width (ao, 0) and (bo, 0), theflowrate can be computed as follows:
The flow rates of the river in the positive and negativedirection of width axis have respectively been computedusing the following Equations (4) and (5).
o
ya0if
D
ystepy/2y
a
0y).xδ(),(Q
ya
xstepx
yxu
(4)
0bifD
ystep2/y
b
0y).xδ(),(Q o
y-
yby
xstepx
yxu
(5)
where values ay corresponding to its depth y is estimatedusing ao (1-y/D)1/2. Similarly, values by corresponding toits depth y is estimated using bo (1-y/D)1/2. Thus, the totalflow rate of the stream over the non-symmetric crosssectional river system can be obtained as Q=Q++Q-. Whenthe layer thickness x is tending to zero, Q tends toaccurate. Using least square method, the equation of rightfit for the plots different layer thickness and itscorresponding computed flow rates was derived and theaccurate flow rate was computed while layer thicknessequal to zero using limit in order to avoid prediction errorin the water quality.
The extent to which a stream can be approximated bya one or two-dimensional model also influences how welldispersion coefficients can be estimated. Furthermore, thedegree of averaging in space and time in solving thedispersive equation can influence the magnitude of thedispersion coefficient shown by calibration. In some cases,numerical dispersion can be comparable, to actualdispersion. When this occurs, the dispersion is specified aszero, or better still as the difference between the actual and
A Study On The Impact Of Coalwashery Effluents Along Damodar River Stretch In Dhanbad District, Jharkhand, India
236
the numerical dispersion. Dispersion coefficients can beestimated for every river and such estimation may quantifythe ability of the river to assimilate waste. Later dispersionstudies were conducted to show that dispersion was not animportant part of the steady-state waste assimilatecapacity. More recently, interest seems to have returned tothe dispersive capability of a stream as concern haveheightened regarding the mixing of hazardous waste spillsand as efforts have intensified in the modelling of dynamicwater quality conditions. The dispersion coefficient (k) forthe river can be estimated using the followingmathematical formula:
1 t-2
2-2
2
212
tttuk
(6)
where u is average stream velocity, t1 and t2 are the meantimes of passage for the dye cloud to move past stations 1and 2, and 2
t1 and 2t2 are the variance of the time versus
concentration curves.The fraction of settleable BOD component contributes
while it is transported along the river stretch up to somedistance depending upon the settling velocity of thesettleable components in dynamic condition. If the settlingvelocity is significantly less, then the distance along thedownstream stretch will be increasing. Bhargava hasattempted to incorporate the contribution of settleableBOD component in order to predict the concentration ofpart of BOD concentration, Cs with respect to the fractionof settleable BOD component, p.
D v1 s
twhent
Dsv
opCsC (7)
where vs is the settling velocity of the component, Co is theinitial concentration, D is the average, depth of the riverand t is the time travelled by the components along theriver stretch in the downstream. Further, in 1989,Bhargava has also derived the other component of BODprediction, resulted by the non-settleable BOD componentas follows:
kt-e)1( oCpnsC (8)
The above Equations (7) and (8) are added up to get thecombined effect of settleable as well as non-settleableBOD components in BOD prediction along the riverstretch. In the above attempt, the influence of streamvelocity on the settling velocity of the setteable particulatematter in dynamic river system has not been accounted.The model has been further improved by modifying as a3D model, taking the variation of velocity and depth overthe cross section of river system as follows.
Bhargava [26] has derived a prediction model tosimulate the water quality along the river stretch assumingthe river stretch as one-dimensional and the depth andwidth of the river are constant. This model can be easilymodified as a three-dimensional if the cross section of theriver is divided into finite number of volumetric element inorder. By using the velocity distributive function, thevelocity of each volumetric element can be predicted.Since the length of each stretch is known, the varying timelength taken by each volumetric element to travel theconstant length of the stretch can be computed. Here it canbe noted that the number of elements over the crosssection will be constant for each stretch of the river. It isassumed that the dimensions of the volumetric elementcorresponding to either width or depth axis increases whenthere is an increase in the respective dimensions of widthor depth. In this case, it is necessary to assess the flow rateof water passing the cross section of each volumetricelement. Since such tasks involve number of calculationsand incorporation of depth and width variation ofstretches, the river stretch can be sufficiently divided intofinite number of segments. However, the computerprogram has to be designed to incorporate all the datarelated to the river dimensions as well as the in-taking anddischarging rate of water and effluent and the physico-chemical characteristics of the effluent of the point sourcemixing with the main river system. If there is no suchsource, except the river dimensions all other parameterscan be taken as zero.
The 3D-water quality prediction model for predictingthe non-conservative parameters, whose initialconcentration and maximum stream velocity just after thecritical mixing distance are co and vo respectively at thelocation x=0, y=0, z=0 has been derived adding theEquations (7) and (8) in order to have the combined effectof settleable and non-setteable particulate matters. Thus,the three-dimensional water quality prediction model maybe obtained duly incorporating the effect of settlingvelocity of settleable bio-flocculated particulate matters asfollows [14]:
z)y,v(x,kz-
e),,()1(),,()(
1),,(),,(22
2
),,(' '
o
o
oo
zyxvks
o
o
vzyxvcp
zyxvz
xaaD
evv
zyxvcpzyxC (9)
where C(x,y,z) is the concentration of the non-conservative parameter in the water transported throughthe volumetric element whose centre is the point P(x,y,z)and the velocity is v(x,y,z). p is the fraction of the bio-flocculated particulate matters, v’s is its settling velocity in
static condition of the river, D is the maximum depth ofthe river over the width but average over the length of thestretch, k is the dispersion coefficient of the pollutantspecies and k’ is the dispersability coefficient of thesettleable bio-flocculated particulate matters. First, the
I.J.E.M.S., VOL.2 (4) 2011: 233-245 ISSN 2229-600X
237
computer program input the data related to the referencepoint of the river. Successively, the subroutine starts for ntimes where n is the number of outfalls considered for theprediction studies and the program inputs the dimensionsof the river and the physico-chemical parameters related torespective outfalls for the respective number ofsubroutines in order to predict the concentration of thewater quality along the successive stretches.
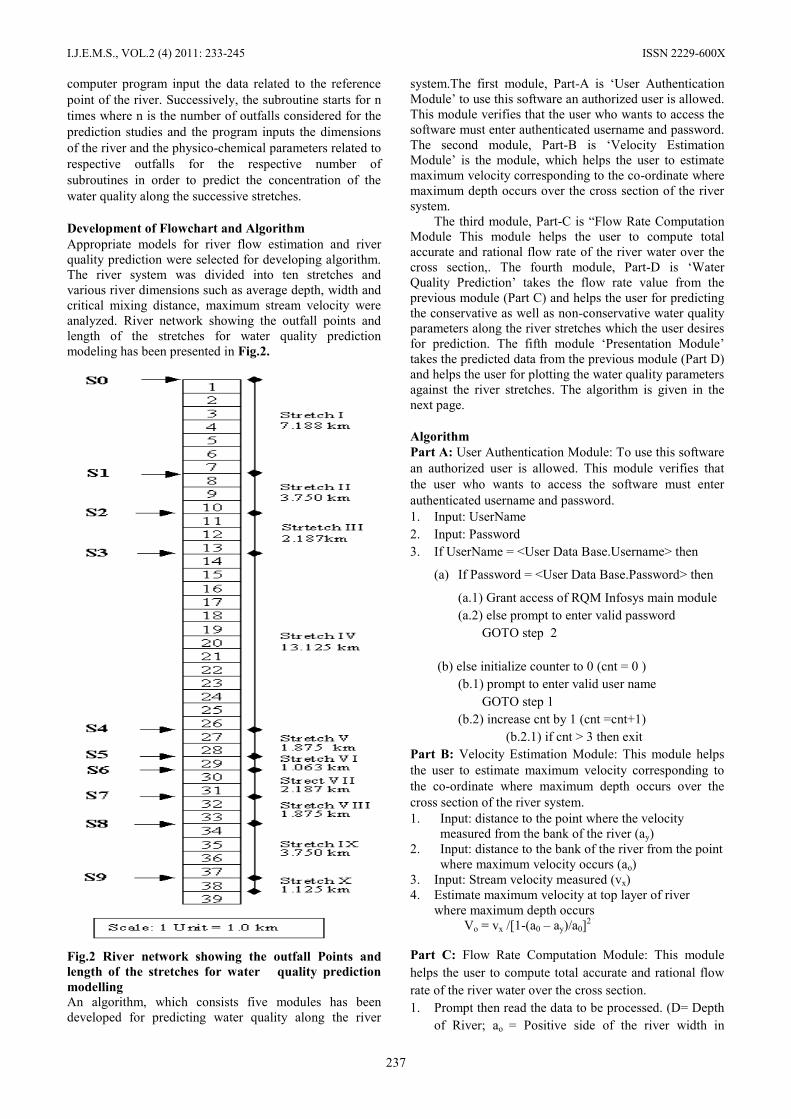
Development of Flowchart and AlgorithmAppropriate models for river flow estimation and riverquality prediction were selected for developing algorithm.The river system was divided into ten stretches andvarious river dimensions such as average depth, width andcritical mixing distance, maximum stream velocity wereanalyzed. River network showing the outfall points andlength of the stretches for water quality predictionmodeling has been presented in Fig.2.
Fig.2 River network showing the outfall Points andlength of the stretches for water quality predictionmodellingAn algorithm, which consists five modules has beendeveloped for predicting water quality along the river
system.The first module, Part-A is ‘User AuthenticationModule’ to use this software an authorized user is allowed.This module verifies that the user who wants to access thesoftware must enter authenticated username and password.The second module, Part-B is ‘Velocity EstimationModule’ is the module, which helps the user to estimatemaximum velocity corresponding to the co-ordinate wheremaximum depth occurs over the cross section of the riversystem.
The third module, Part-C is “Flow Rate ComputationModule This module helps the user to compute totalaccurate and rational flow rate of the river water over thecross section,. The fourth module, Part-D is ‘WaterQuality Prediction’ takes the flow rate value from theprevious module (Part C) and helps the user for predictingthe conservative as well as non-conservative water qualityparameters along the river stretches which the user desiresfor prediction. The fifth module ‘Presentation Module’takes the predicted data from the previous module (Part D)and helps the user for plotting the water quality parametersagainst the river stretches. The algorithm is given in thenext page.
AlgorithmPart A: User Authentication Module: To use this softwarean authorized user is allowed. This module verifies thatthe user who wants to access the software must enterauthenticated username and password.1. Input: UserName2. Input: Password3. If UserName = <User Data Base.Username> then
(a) If Password = <User Data Base.Password> then
(a.1) Grant access of RQM Infosys main module(a.2) else prompt to enter valid password
GOTO step 2
(b) else initialize counter to 0 (cnt = 0 )(b.1) prompt to enter valid user name
GOTO step 1(b.2) increase cnt by 1 (cnt =cnt+1)
(b.2.1) if cnt > 3 then exitPart B: Velocity Estimation Module: This module helpsthe user to estimate maximum velocity corresponding tothe co-ordinate where maximum depth occurs over thecross section of the river system.1. Input: distance to the point where the velocity
measured from the bank of the river (ay)2. Input: distance to the bank of the river from the point
where maximum velocity occurs (ao)3. Input: Stream velocity measured (vx)4. Estimate maximum velocity at top layer of river
where maximum depth occursVo = vx /[1-(a0 – ay)/a0]2
Part C: Flow Rate Computation Module: This modulehelps the user to compute total accurate and rational flowrate of the river water over the cross section.1. Prompt then read the data to be processed. (D= Depth
of River; ao = Positive side of the river width in
A Study On The Impact Of Coalwashery Effluents Along Damodar River Stretch In Dhanbad District, Jharkhand, India
238
respect of x axis; bo = Negative side of the river widthin respect of x axis; Vm = Maximum Velocity at toplayer of river)
2. Divide the cross sectional area in the positivedirection of x-axis into finite number of small distinctsquare elements with dimensions x, y.The number of partitions in the width of surface layeris (n = (ao – bo ) / x)
The number of layers with thickness y in the crosssection is (m = D / y)
3. Initialize counter to 0 (y=0; x=0; F=0)4. While (y <= m) do
a. Calculate ay = |± a0(1-y/D)½|
b. While (x <= ay) do
(b.1) Calculate the Average velocity of cross sectional area
for layer between the depth
D =(m-1) y and D = my.
(b.1.1) At left-top corner point:
v(x, y)= [vm(0,0)(1-y/D)-(x/ay)2]
(b.1.2) At right-top corner point:
v(x+x, y)= [vm(0,0)(1-y/D)-((x+x)/ay)2]
(b.1.3) At left-bottom corner point:
v(x, y-y)= [vm(0,0)(1-(y-y)/D)-(x/ay)2]
(b.1.4) At right-bottom corner point:
v(x+x, y-y)= [vm(0,0)(1-(y-y)/D)-((x+x)/ay)2]
(b.1.5) Calculate Average Velocity
v=[v(x,y)+v(x+x,y)+v(x,y-y)+v(x+x,y-y)]/4
(b.2) Calculate Average Flow rate: f= v* x*y and add it to
the previous flow rate
(F = F + f) and save the calculated data.
(b.3) increment x by x GOTO step 4b5. Increment y by y GOTO step 4.6. Computation of Coss Sectional Area:
(6.1) comp1=D(ao – bo)(6.2) comp2= D(ao + bo) *(ao
2 –bo2) / 2ao bo
(6.3) comp3= D*(ao3 –bo
3) / 3ao bo
(6.4) CSA= comp1 -comp2 + comp37. If a0 = bo then
(7.1) Total Flow rate of cross section of river Q= 2*FGOTO step 8(7.2) Else, Q1=F and repeat the step 4 set ay = by = |±b0(1-y/D)½| , Q=Q1+F
Part D. Water Quality Prediction: This module takes theflow rate value from the previous module (Part C) andhelps the user for predicting the conservative as well asnon-conservative water quality parameters along the riverstretches which the user desires.1. Input: Length of a unit distance (in meter); u
2. Input: Maximum Velocity at Ref. Point; Part-A .Step5 . vo
3. Input: Upstream river flow at Ref. Point; Part C.Step7 . Q:
4. Input: Cross Sectional Area at Ref. Point; Part C.Step(6.4).CSA
5. Input: No. of outfalls; n6. Input: Upto what distance you would like to predict
the water quality from the last outfall point; x dist7. Initialze counter to 0 (i=0;d=0)8. While (i <= n) do
(8.1) Input: Code of the outfall station; S$(i)(8.2) Enter River Dimensions for (i+1)th Stretch:
(8.2.1) Input: right x-coordinate; a(i)(8.2.1) Input: left x-coordinate; b(i)(8.2.1) Input: maximum average depth; D(i)
(8.3) Input: Distance to the previous outfall; x(i)(8.4) Assign z(i) = x(i): d = d + z(i)(8.5) Input: Critical mixing distance; m(i)(8.6) Input: Percentage of settle able bio-flocculated
particulate matters; bfp(i)(8.7) Input: Setteling velocity of settle able bio-
flocculated particulate matters; sv(i)(8.8) Input: Setteling coeficient of settle able bio-
flocculated particulate matters; sc(i)(8.9) Input: Dispersion coeficient of water quality
parameter; k(i)(8.10) Input: Quantity of water pumped out from
river; w(i)Input : Effluent discharging rate; q(i)
(8.11) Input: Concentration of the parameter in theriver water just before outfall point (i+1);cr(i)
(8.12) Input: Concentration of the parameter in theoutfall just before the mixing point; ce(i)
(8.13) If i = 0 then calculate; p(i) = Q – w(i)Else r(i)=p(i)+q(i)
(8.14) else p(i) = r(i-1) - w(i)(8.15) Assign r(i) = p(i) + q(i); Q(i) = r(i)(8.16) Calculate the concentration of the parameter
just after the critical mixing point;c(i) = [p(i)*cr(i)+q(i)*ce(i)]/ [p(i) +q(i)]
(8.17) Computation of Coss Sectional Area:(8.17.1) comp1=D(a(i) – b(i))(8.17.2) comp2= D(a(i) + b(i)) *(a(i)2 –b(i)2) /
2a(i) b(i)(8.17.3) comp3= D*(a(i)3 –b(i)3) / 3a(i) b(i)(8.17.4) CSA(i)= comp1 - comp2 + comp3
(8.18) Computation of River Velocity at (i+1)th
Stretch(8.17.1) rv(i) = (CSA/CSA(i)) *(Q(i)/Q)* vo
(8.19) Assign: Q = Q(i)(8.20) Increment i= i + 1
9. Input “Which stretch you would like to predict?”;stretch
I.J.E.M.S., VOL.2 (4) 2011: 233-245 ISSN 2229-600X
239
10. Input stream type: x, y11. Initialize counter to 0(i=0; j=0; z=0)12. While z <= z(stretch)) do
(12.1) Compute Section-A(12.2) Assign: z = CINT(z(stretch - 1) + i)(12.3) Calculate: if x>=0, then v(x,y,z)=rv(i)*[(1-
y/D(i)) – (x/a(i))2] Goto Step (12.5)(12.4) Else: v(x, y, z) = rv(i)*[(1-y/D(i)) – (x/b(i))2](12.5) Comp1= sv(i)*(1/exp(sc(i))*v(x, y, z)) / D(i)(12.6) Comp2 = z / v(x,y,z)(12.7) Compute: c(z) = [bfp(i)*c(i)*v(x,y,z) /
rv(i)]*(1-comp1*comp2)(12.8) Store z*u, c(z)(12.9) Increment i = i + 1: z = z+1
13. Input “Whether you would like to continue prediction(Y/N)?”; Ans$(13.1) Verify: If Ans$ = “y” or “Y” then Goto Step 9 Else
Step (13.2)(13.2) Verify: If Ans$ = “n’ or “N”, then Goto Step (13.4)(13.3) Else “Syntax error!, please enter again”; Goto Step
13(13.4) Display “Successfully Prediction has been
completed!Part E. Presentation Module: This module takes thepredicted data from the previous module (Part D) andhelps the user for plotting the water quality parametersagainst the river stretches.
(1) Input: z*u, c(z) from stored data(2) Draw x coordinate with context of z*u(3) Draw y coordinate with context of c(z)(4) While not EOF z*u do
(4.1) x= stored data field Z*u(4.2) y = stored data field c(z)(4.2) draw line with pixel coordinates of x and y
Input ParametersThe average concentration of water quality at the referencepoint and the effluent quality of the coal washeries alongwith the water quality of tributaries that carry the effluentsof coal washery and thermal power station were studied.The average values of physico-chemical parameters of thesamples drawn from the river, streams and industrialeffluents have been presented in Table-1.
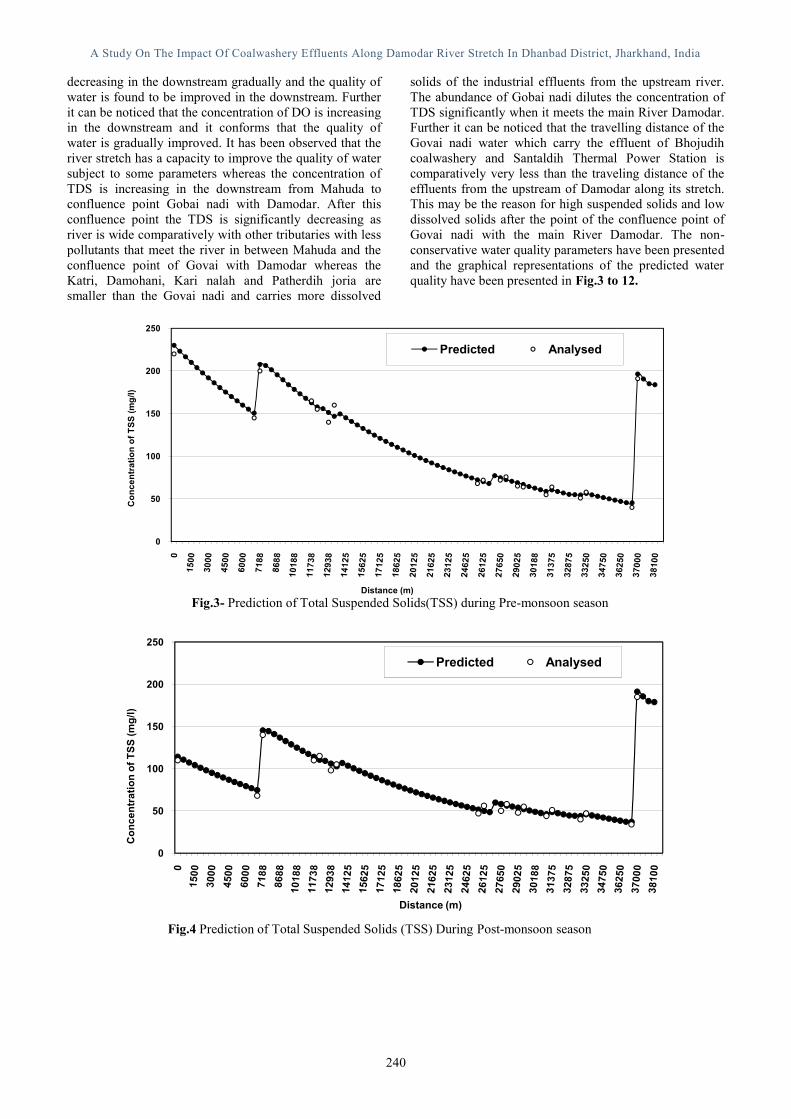
These values are used as input parameters to themodel. Further, the point to point water quality predictionalong the river stretches from Mahuda to the confluencepoint of Gobai nadi with Damodar river using the presentmodel with the average initial stream velocity 0.3013 m/sand 0.43571 m/s at the reference point for both pre-monsoon and post monsoon season respectively for non-conservative parameters Total Suspended Solids (TSS),Total Dissolved Solids (TDS), Dissolved Oxygen (DO),Biological Oxygen Demand (BOD) and Chemical OxygenDemand (COD).
Table-1 Concentration of water quality in Damodar River, Coal Washeries and Other Industrial and Tributaries
RESULTS AND DISCUSSIONSIt has been found that the concentrations of TSS and TDSin pre-monsoon are lower than the post monsoon season.
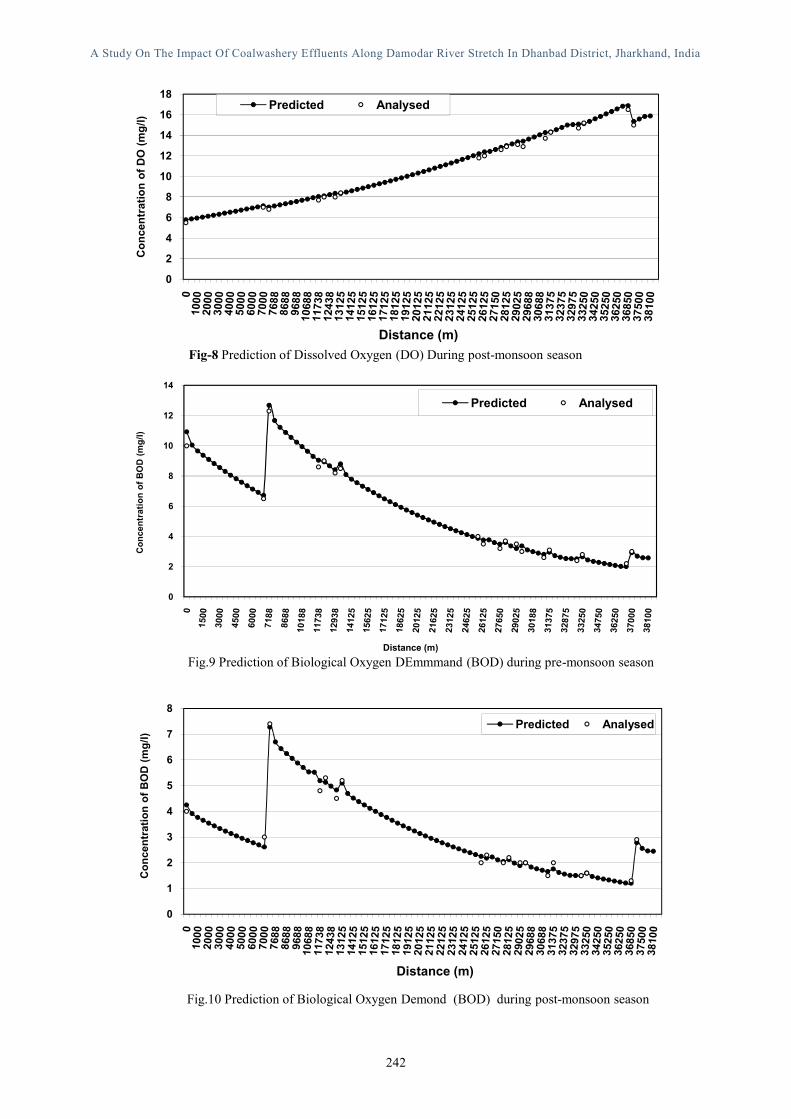
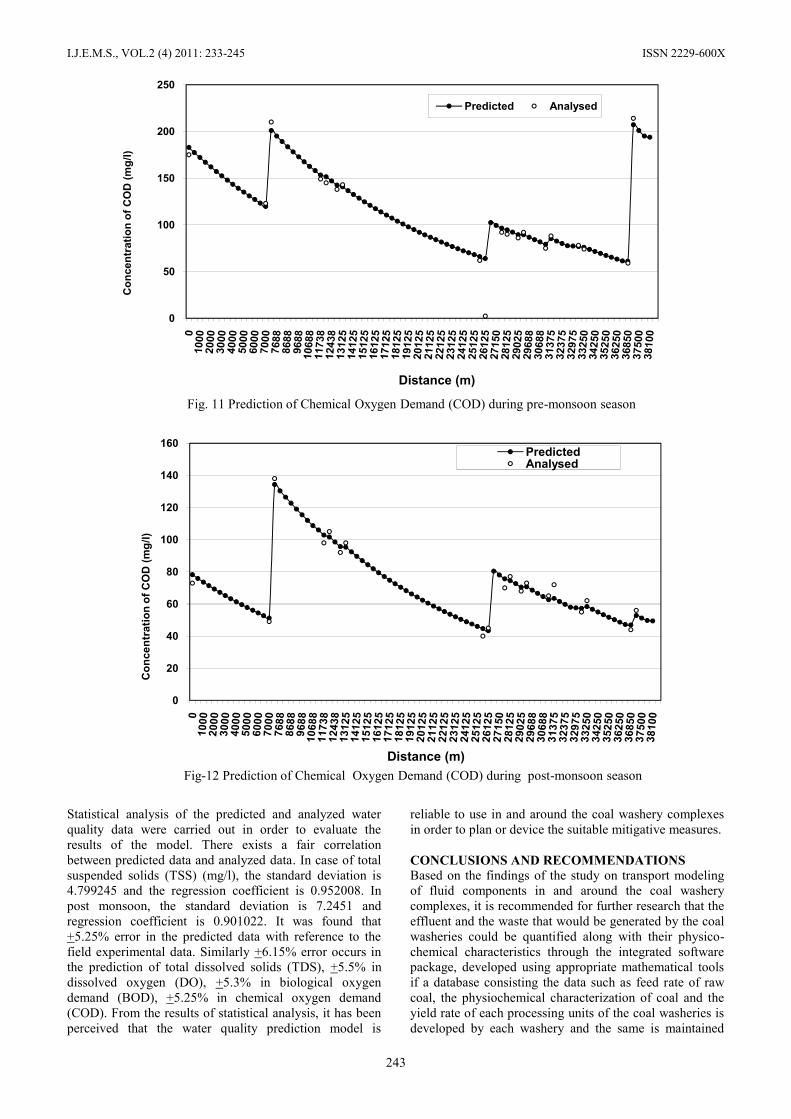
This may be due to increased turbidity of water caused bysoil erosion and surface wash out, which occurs in therainy season. The concentration of BOD and COD
Sour
ceC
ode
Sources DischargedThrough:
Concentration Of Non-Conservative Parameters (Mg/L)
TSS TDS DO BOD COD
A B A B A B A B A B
R Damodar River (Upstreamsource) Damodar 114 230 263 245 5.58 5.78 10.92 4.25 182.5 78
S0 Mahuda Washery Directly 1273 1148 303 378 3.37 4.42 7.23 12.98 3598 2605
S1 Loyabad Coke PlantLoyabad PHLoyabad Township
KatriRiver 238 333 260 303 5.975 6.65 19.95 16.9 308 313
S2Moonidih Washery Directly 1208 1478 337 373 3.90 3.48 4.45 14.43 3675 7286
S3 Jamadoba WasheryJamadoba Ph-1&3Jamadoba Township
Jitpur Jore 374 418 285 313 5.75 5.63 6.22 6.25 126 136
S4 Patherdih WasheryPatherdih Township
PatherdihJore 643 630 392 429 4.63 5.15 6.63 5.88 1933 1981
S5Sudamudih Washery Directly 1789 1534 563 414 3.38 4.43 7.23 12.98 3967 7507
S6 Chasnallah Washery Directly 1458 1594 362 400 3.90 3.48 4.45 14.43 3675 7310
S7 FCI Sindri (outfall No.1)P&D Sindri and SindriTownship
Directly 889 1226 423 497 6.40 5.90 3.85 9.88 1876 851
S8 FCI Sindri (outfall No.2) DamohaniRiver 589 643 355 187 4.60 5.90 5.55 7.23 76 476
S9 Bhojudih WasherySantaldih TPSBhojudih Township
GovaiRiver 558 657 423 326 6.58 10.52 4.85 7.38 555 72
A Study On The Impact Of Coalwashery Effluents Along Damodar River Stretch In Dhanbad District, Jharkhand, India
240
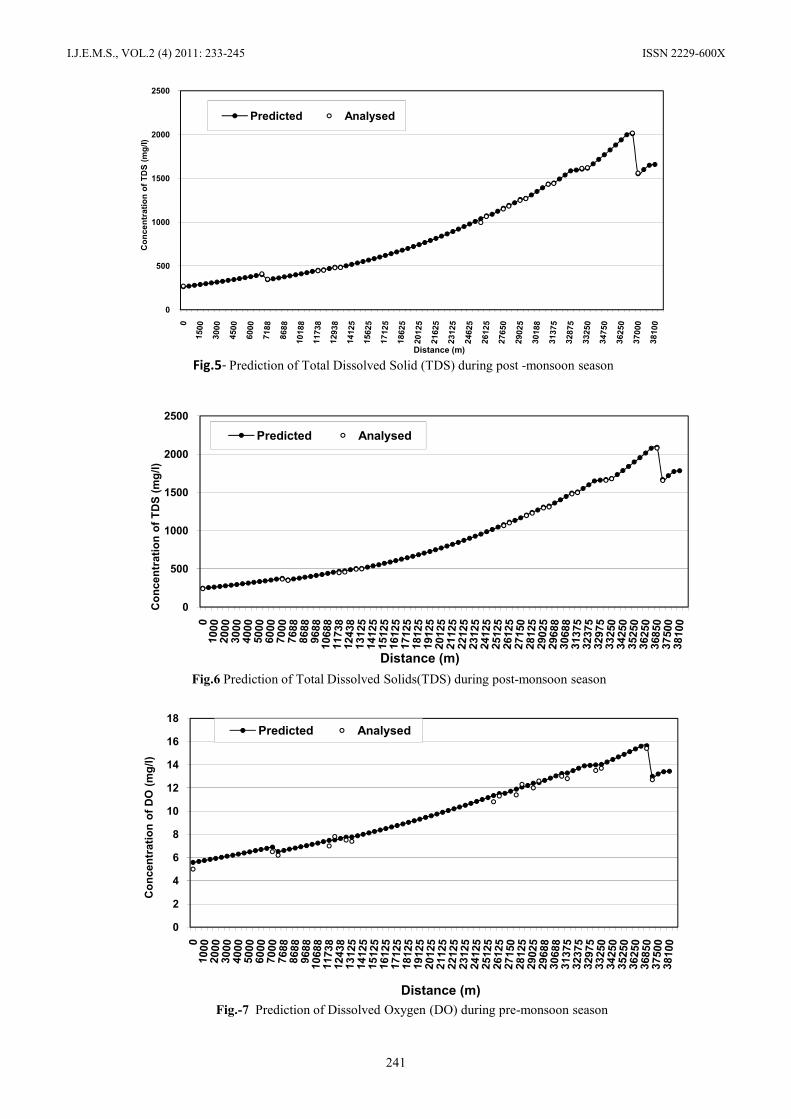
decreasing in the downstream gradually and the quality ofwater is found to be improved in the downstream. Furtherit can be noticed that the concentration of DO is increasingin the downstream and it conforms that the quality ofwater is gradually improved. It has been observed that theriver stretch has a capacity to improve the quality of watersubject to some parameters whereas the concentration ofTDS is increasing in the downstream from Mahuda toconfluence point Gobai nadi with Damodar. After thisconfluence point the TDS is significantly decreasing asriver is wide comparatively with other tributaries with lesspollutants that meet the river in between Mahuda and theconfluence point of Govai with Damodar whereas theKatri, Damohani, Kari nalah and Patherdih joria aresmaller than the Govai nadi and carries more dissolved
solids of the industrial effluents from the upstream river.The abundance of Gobai nadi dilutes the concentration ofTDS significantly when it meets the main River Damodar.Further it can be noticed that the travelling distance of theGovai nadi water which carry the effluent of Bhojudihcoalwashery and Santaldih Thermal Power Station iscomparatively very less than the traveling distance of theeffluents from the upstream of Damodar along its stretch.This may be the reason for high suspended solids and lowdissolved solids after the point of the confluence point ofGovai nadi with the main River Damodar. The non-conservative water quality parameters have been presentedand the graphical representations of the predicted waterquality have been presented in Fig.3 to 12.
0
50
100
150
200
250
Con
cent
ratio
n of
TSS
(mg/
l)
Distance (m)
Predicted Analysed
Fig.4 Prediction of Total Suspended Solids (TSS) During Post-monsoon season
0
50
100
150
200
250
Con
cent
ratio
n of
TSS
(mg/
l)
Distance (m)
Predicted Analysed
Fig.3- Prediction of Total Suspended Solids(TSS) during Pre-monsoon season
I.J.E.M.S., VOL.2 (4) 2011: 233-245 ISSN 2229-600X
241
0
500
1000
1500
2000
2500
Con
cent
ratio
n of
TD
S (m
g/l)
Distance (m)
Predicted Analysed
Fig.5- Prediction of Total Dissolved Solid (TDS) during post -monsoon season
0
500
1000
1500
2000
2500
Con
cent
ratio
n of
TD
S (m
g/l)
Distance (m)
Predicted Analysed
Fig.6 Prediction of Total Dissolved Solids(TDS) during post-monsoon season
0
2
4
6
8
10
12
14
16
18
Con
cent
ratio
n of
DO
(mg/
l)
Distance (m)
Predicted Analysed
Fig.-7 Prediction of Dissolved Oxygen (DO) during pre-monsoon season
A Study On The Impact Of Coalwashery Effluents Along Damodar River Stretch In Dhanbad District, Jharkhand, India
242
0
2
4
6
8
10
12
14
16
18
Con
cent
ratio
n of
DO
(mg/
l)
Distance (m)
Predicted Analysed
Fig-8 Prediction of Dissolved Oxygen (DO) During post-monsoon season
0
2
4
6
8
10
12
14
Con
cent
ratio
n of
BO
D (m
g/l)
Distance (m)
Predicted Analysed
Fig.9 Prediction of Biological Oxygen DEmmmand (BOD) during pre-monsoon season
0
1
2
3
4
5
6
7
8
Con
cent
ratio
n of
BO
D (m
g/l)
Distance (m)
Predicted Analysed
Fig.10 Prediction of Biological Oxygen Demond (BOD) during post-monsoon season
I.J.E.M.S., VOL.2 (4) 2011: 233-245 ISSN 2229-600X
243
Statistical analysis of the predicted and analyzed waterquality data were carried out in order to evaluate theresults of the model. There exists a fair correlationbetween predicted data and analyzed data. In case of totalsuspended solids (TSS) (mg/l), the standard deviation is4.799245 and the regression coefficient is 0.952008. Inpost monsoon, the standard deviation is 7.2451 andregression coefficient is 0.901022. It was found that+5.25% error in the predicted data with reference to thefield experimental data. Similarly +6.15% error occurs inthe prediction of total dissolved solids (TDS), +5.5% indissolved oxygen (DO), +5.3% in biological oxygendemand (BOD), +5.25% in chemical oxygen demand(COD). From the results of statistical analysis, it has beenperceived that the water quality prediction model is
reliable to use in and around the coal washery complexesin order to plan or device the suitable mitigative measures.
CONCLUSIONS AND RECOMMENDATIONSBased on the findings of the study on transport modelingof fluid components in and around the coal washerycomplexes, it is recommended for further research that theeffluent and the waste that would be generated by the coalwasheries could be quantified along with their physico-chemical characteristics through the integrated softwarepackage, developed using appropriate mathematical toolsif a database consisting the data such as feed rate of rawcoal, the physiochemical characterization of coal and theyield rate of each processing units of the coal washeries isdeveloped by each washery and the same is maintained
0
50
100
150
200
250
Con
cent
ratio
n of
CO
D (m
g/l)
Distance (m)
Predicted Analysed
Fig. 11 Prediction of Chemical Oxygen Demand (COD) during pre-monsoon season
0
20
40
60
80
100
120
140
160
Con
cent
ratio
n of
CO
D (m
g/l)
Distance (m)
PredictedAnalysed
Fig-12 Prediction of Chemical Oxygen Demand (COD) during post-monsoon season
A Study On The Impact Of Coalwashery Effluents Along Damodar River Stretch In Dhanbad District, Jharkhand, India
244
every year,. Such a software package may be useful formore effective water quality prediction in order tosimulate the environmental parameters, which would bemore cost effective as the simulation starts from thefeeding of raw coals to the prediction of pollutantsavoiding sampling and laboratory analysis. This would bea very useful information system for the coal washeries inorder to visualize at the contribution of each processingunit during the operation of the plant. The effect of heatbalance, reaeration coefficient, solar radiation andconduction may also be considered for the water qualityprediction studies if appropriate mathematical models areincorporated in the present software. The mathematicalmodels developed from the present study are common tofind the solution for river water quality issues. If themodels used in the present software would be applied insome other areas and subsequently validated, this could beused as generalized computer model so that it can beapplied for any river system, environmentally degraded byany type of industries.
ACKNOWLEDGEMENTThis is the outcome of the research work carried out forthe award of Ph.D by Anand Mohan, who is the Part-timeCategory-‘C’ National Research Scholar of M.S.University, Tirunelveli, Tamil Nadu. The authors aregrateful to the Director, Central Institute of Mining andFuel Research, Dhanbad for his constant encouragementsduring their research work and providing necessaryinfrastructural support during the study. The authors arealso thankful to Sri. G.P. Rajak, Chemist for extending hiskind help and valuable support during the period ofsampling and analysis of the water and effluent samples.
REFERENCES[1] Krenkel, P. A. and Novotny, V., (1980) Water Quality
Management. Academic Press, New York.
[2] Grenney, W. T. and Kraszewski, A. K. (1981)Description and Application of the Stream Simulationand Assessment Model: Version IV (SSAM IV )Instream Flow Information Paper, Fish and WildlifeService, Fort Collins, CO, Cooperative Instream FlowService Group.
[3] Chao, A. C., Chang, D. S., Smallwood, C., Jr., andGaller, W. S., (1987) Effect of temperature on oxygentransfer – laboratory studies, J. Environ. Eng.,American Society of Civil Engineers, 113(5), 1089.
[4] Daniil, E. I., and Gulliver, J. S., (1988) Temperaturedependence of the liquid film coefficient for gastransfer, J. Environ, Eng., American Society of CivilEngineers, 114(5), 1224.
[5] Rathbun, R. E., (1977) Reaeration coefficients ofstreams – state-of the-art, J. Hydraulic. Div.,American Society of Civil Engineers, 103(HY4), 409.
[6] Mackay, D. and Shiu, W. Y., (1984) PhysicalChemical Phenomena and molecular properties, inGas Transfer at Water Surfaces, Brutsaert W. andJirka, G. H., Eds., D. Reidel, Boston, 3.
[7] Thibodeaux, L. J., (1979) Chemodynamics:Environmental Movement of Chemicals in Air Water,and Soil, John Wiley and Sons, New York.
[8] Chapra, S. (1997). Surface water quality modelling.New York: McGraw-Hill.
[9] Ghose, M. K. (1999). Sustainable supplies of waterfor coal washeries in India. The Science of the TotalEnvironment, 229(3), 217-225.
[10] Kenneth, H. R. (1999).Water quality prediction andprobability network Models. Can. J. Fish. Aquat. Sci.56, 1150–1158.
[11] Najah, A., Elshafie, A., Karim, A.O., & Jaffar, O.(2009). Prediction of Johor River Water QualityParameters Using Artificial Neural Networks.European Journal of Scientific Research, 28 (3), 422-435
[12] Streeter, M.W and Phelps, E.E. (1925) A Study of thepollution and Natural Purification of the Ohio River,U.S.Public Health Service Eulletin, pp.146.
[13] Sharma, D., & Singh, R.K. (2009). DO-BODmodeling of River Yamuna for national capitalterritory, India using STREAM II, a 2D water qualitymodel, Environmental Monitoring Assessment, 159,231–240.
[14] Mohan, A. & Sundararajan, M. (2010). AlgorithmDevelopment for Water Quality Prediction Systemalong Industrial Outfall River Stretch Using Modelingand Computer Simulation. International Journal ofEngineering Science and Technology, 2(11), 6204-08.
[15] Banerjee, S.P. and Gurdeep Singh (1992) PollutionProfiles of CCWO Coal Washeries, UnpublishedReports.
[16] Ghose, M.K. and Kumar, A. (1993) Impact of SurfaceWater due to Discharge of Coal Washery Effluent andDispersion Profile of Pollutants in Damodar River,Asian Environment, pp.32-40.
[17]Baliga, B.P. and Shekhar, S. (1990) Water QualityAssessment in Coal Mining & Related Operation inDamodar Valley, Workshop on Water QualityManagement for Damodar River System, pp.7-27.
[18] CMRI Report (1994) Carrying capacity of DamodarRiver Basin - Phase-I.
[19] Gurdeep Singh (1990) Status of Water Quality in aCoal Mining Environment – A Case Study in theJharia Coalfield, Bihar, Jl. Ind. Poll. Cont., vol.6,no.2, pp.69-76.
[20] Banerjee, S.P. and Gurdeep Singh (1993) Problem ofWater pollution in Mining Areas – Issues Related toIts Protection and Control, First National Seminar onEnvironmental policy Issues in Mineral Industry,Organized by the MGMI, June.
I.J.E.M.S., VOL.2 (4) 2011: 233-245 ISSN 2229-600X
245
[21] Gurdeep Singh, Ram, B. (1993) Pollution of DamodarRiver in Coal Belt of Dhanbad, Minetech, vol.10,no.1, pp.73-78.
[22] Gurdeep Singh and Ram, B. (1992) Status of WaterQuality in Mining Area – A Case Study in the JhariaCoalfield, Journal of Indian Pollution Control.
[23] Gurdeep Singh (1988) Impact of Coal Mining onWater Quality, International Journal of Mine Water,7(3), pp.49-59.
[24] Gurdeep Singh (1979) Status of Water Quality In aCoal Mining environment – A Case Study in theJharia Coalfield, Journal of Indian Pollution Control,6(2), pp.69-76.
[25] APHA, AWWA, and WEF (1998). Standard methodsfor the examination of water and wastewater (20th
ed.). Washington DC, USA.[26] Bhargava, D.S. (1989) Most Rapid BOD Assimilation
in Ganga and Yamuna. Journal of Environmentalengineering, 109(1), 194-196.