Embed Size (px)
Citation preview
A study on the fatigue life of spot welding under multi-axial loading conditions
*Young Man Kim1) and Yong Hwan Kim2)
1), 2) Chungnam National University, Daejeon 34134, Korea
ABSTRACT
In this paper, the fatigue performance of spot welding under various loading conditions was studied. For this purpose, directions of 90°, 60°, 30° and 0° in the surface were used and the maximum loads were calculated by initial tensile tests. The fatigue test of spot welding were carried out for about 80 specimens up to 2.0E06 cycles by deriving the stress amplitude for the number of cycles. Cross-tension specimens were used in this test to reflect fatigue life in various directions, and the same width, thickness, and nugget diameter were used to account for the same geometrical factors. The data obtained from the high cycle fatigue test of spot welding was converted to the σ-N curves through the correlated finite element method for the linear section and the fatigue characteristics of spot welding under various directions were shown. To understand this result, the statistical analysis regarding damages of the load conditions and lifetime for each direction was carried out. 1. INTRODUCTION
Spot welding is the process of connecting metal sheets and has been widely used in automotive industry up to recently. Generally, there are more than 3,000 spot welds which are about 90% of the connections used in automotive body assemblies. Spot welding using an automated process can be expected to have dimensional accuracy, high speed and low cost that have many technical and economic advantages. The reliability of spot welding is one of the major considerations in order to design mechanical components focused on the robustness and durability. Because about 80% of fatigue failures of vehicle components occurs around spot welding in Di Fant-Jaeckels (2001). For this reason, many researchers are concerned about a variety of geometrical, metallurgical and mechanical factors which have an effect on the fatigue life in Rathbun (2003)
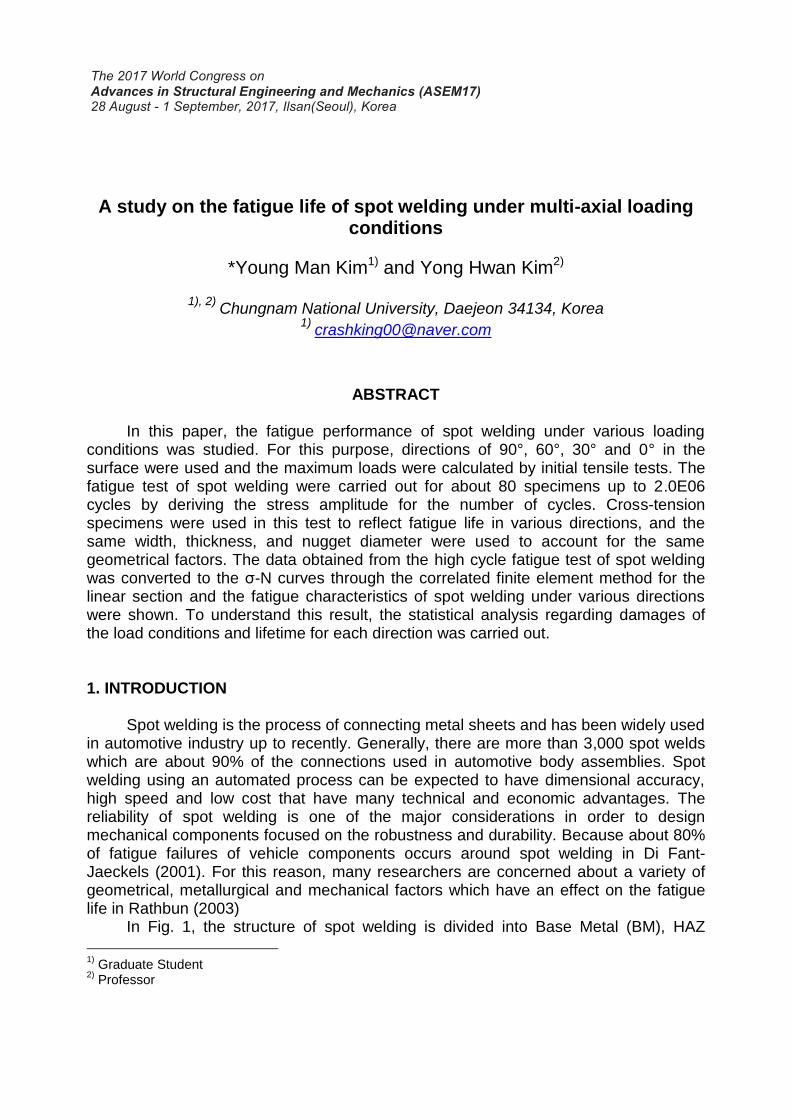
In Fig. 1, the structure of spot welding is divided into Base Metal (BM), HAZ
1)
Graduate Student 2)
Professor
(Heated Affected Zone) and weld nugget. Vural M. (2004) mentions that Vicker’s hardness (HV), the basic property of spot welding, increases to the nugget area gradually. This phenomenon occurs for melting the metal sheets at high temperature and pressure for a short time and changing the phase on account of temperature difference around spot welding in Jong (2011). Due to the structural characteristics of spot welding, there is fatigue failure such as cracks and failures in HAZ under cyclic loading in Wang (2006) and Al-Mukhtar (2013). Otherwise, the endurance limit (Se) of spot welding is reduced by approximately 50% in Gao (2001). Fatigue test that spends a lot of time and cost has many difficulties in clarifying influence factors definitely. And it is time and cost. Eratas (2008) and Akkaşa (2016) to influence factors of spot welding on fatigue analysis are mainly determined by geometric factors such as the nugget diameter and thickness of base materials.
Fig. 1 Structural cross-section of spot welding
In this study, it was studied for the fatigue performance of spot welding under
various loading directions. For this purpose, four directions of 90°, 60°, 30°and 0° from the surface were used and the maximum fracture loads were calculated by initial tensile tests to generate cyclic loading. The fatigue test of spot welding was carried out with about 80 specimens, Cross-tension type in ZHANG (1999), to do High Cycle Fatigue deriving the force amplitude against the cycles to failure. The same width, thickness and nugget diameter were used to minimize the effect of geometrical factors in Yeb (2012) and Baek (2010). The data obtained through the fatigue test of spot welding was converted to σ-N curves by Finite Element Method and used as data for fatigue analysis in Sohn (2000). Damages of each direction on the cycles to failure were calculated and the statistical analysis was carried out. Influence factors of fatigue life were considered for spot welding such as the mean stress and statistical factor. 2. Experimental procedure for Spot weld 2.1 Test specimens and equipment
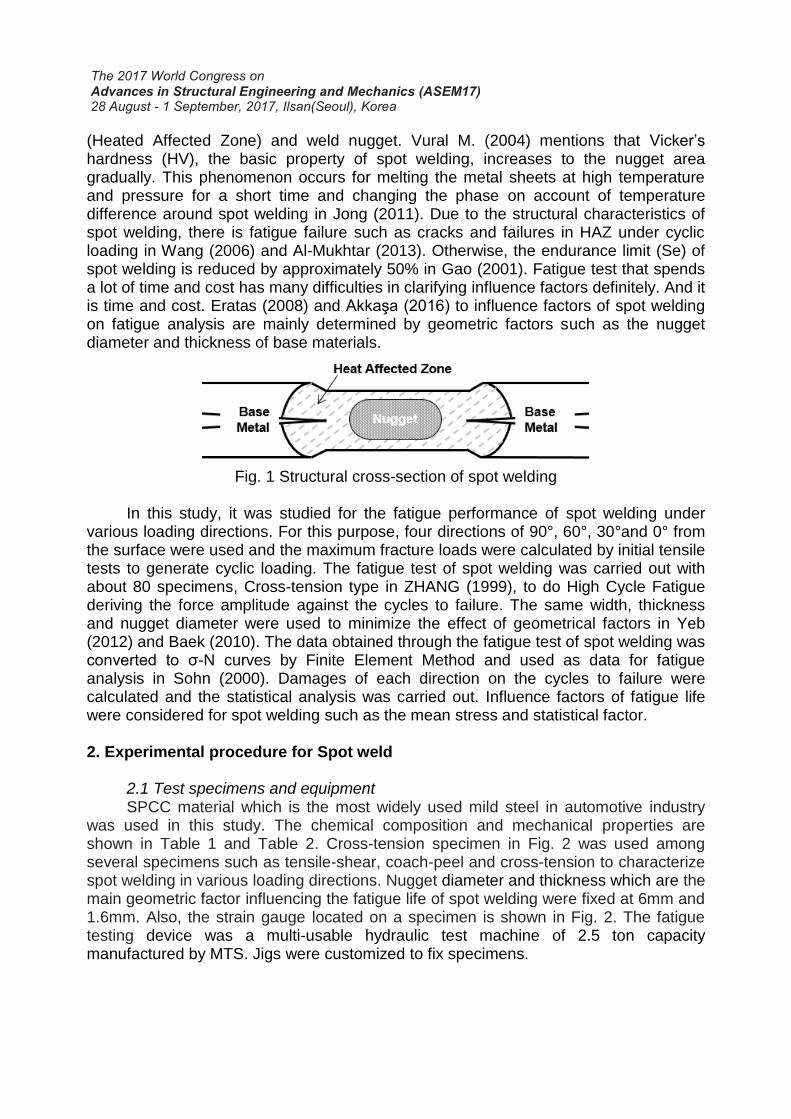
SPCC material which is the most widely used mild steel in automotive industry was used in this study. The chemical composition and mechanical properties are shown in Table 1 and Table 2. Cross-tension specimen in Fig. 2 was used among several specimens such as tensile-shear, coach-peel and cross-tension to characterize spot welding in various loading directions. Nugget diameter and thickness which are the main geometric factor influencing the fatigue life of spot welding were fixed at 6mm and 1.6mm. Also, the strain gauge located on a specimen is shown in Fig. 2. The fatigue testing device was a multi-usable hydraulic test machine of 2.5 ton capacity manufactured by MTS. Jigs were customized to fix specimens.
Material C Si Mn P S
SPCC 0.043 0.002 0.3 0.004 0.008
Table 1 Chemical composition of material
Material Yield stress
(MPa) Tensile stress
(MPa) Elongation
(%)
SPCC ≥215 ≥330 ≥45
Table 2 Mechanical properties of material
Fig. 2 Cross-tension specimen of spot welding and location of strain gage
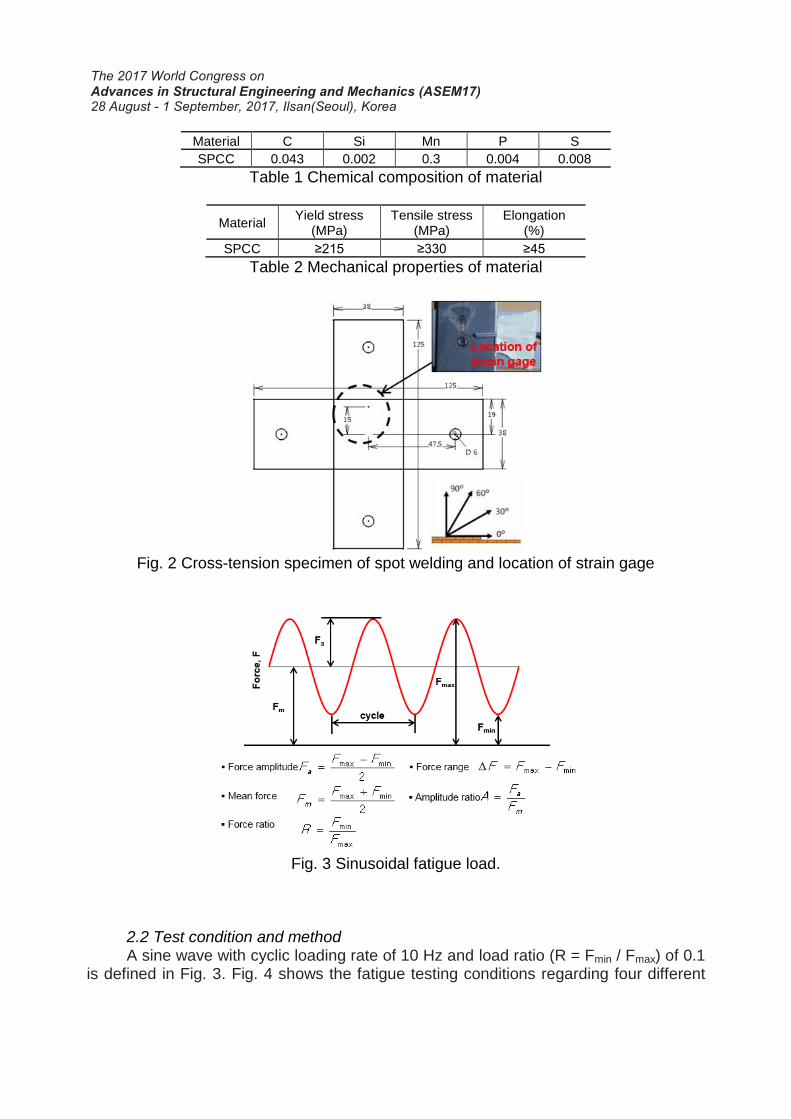
Fig. 3 Sinusoidal fatigue load.
2.2 Test condition and method A sine wave with cyclic loading rate of 10 Hz and load ratio (R = Fmin / Fmax) of 0.1
is defined in Fig. 3. Fig. 4 shows the fatigue testing conditions regarding four different
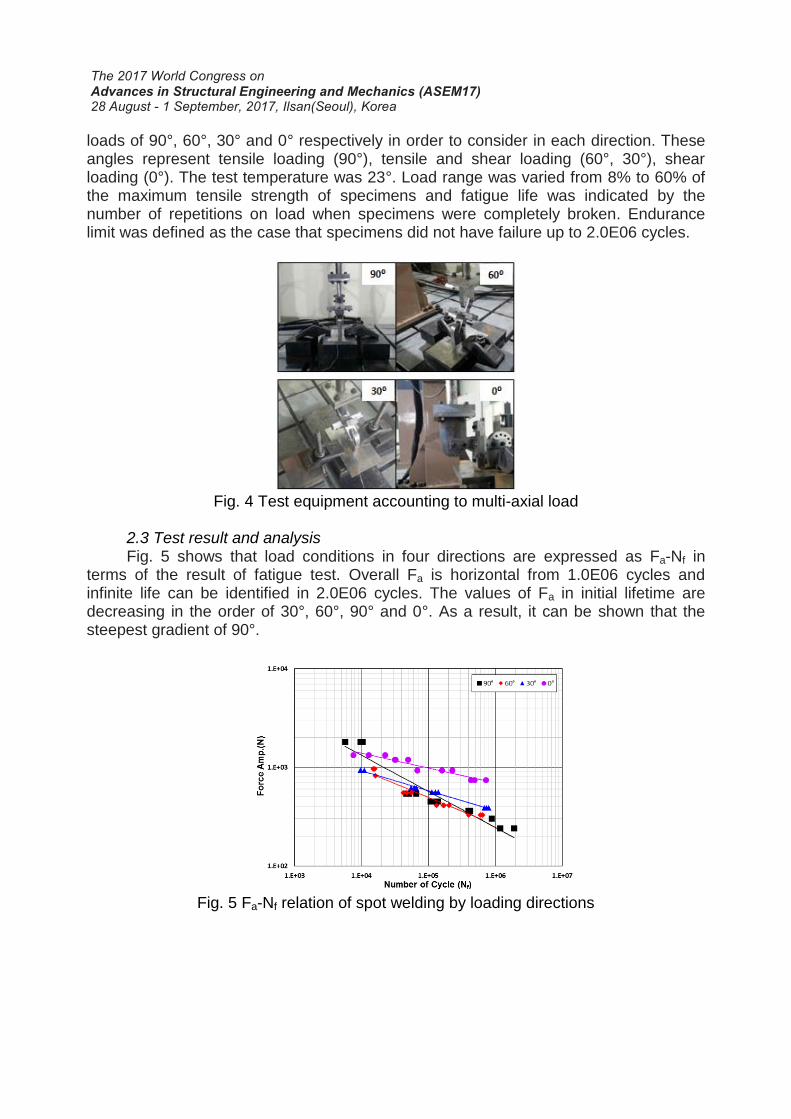
loads of 90°, 60°, 30° and 0° respectively in order to consider in each direction. These angles represent tensile loading (90°), tensile and shear loading (60°, 30°), shear loading (0°). The test temperature was 23°. Load range was varied from 8% to 60% of the maximum tensile strength of specimens and fatigue life was indicated by the number of repetitions on load when specimens were completely broken. Endurance limit was defined as the case that specimens did not have failure up to 2.0E06 cycles.
Fig. 4 Test equipment accounting to multi-axial load
2.3 Test result and analysis Fig. 5 shows that load conditions in four directions are expressed as Fa-Nf in
terms of the result of fatigue test. Overall Fa is horizontal from 1.0E06 cycles and infinite life can be identified in 2.0E06 cycles. The values of Fa in initial lifetime are decreasing in the order of 30°, 60°, 90° and 0°. As a result, it can be shown that the steepest gradient of 90°.
Fig. 5 Fa-Nf relation of spot welding by loading directions
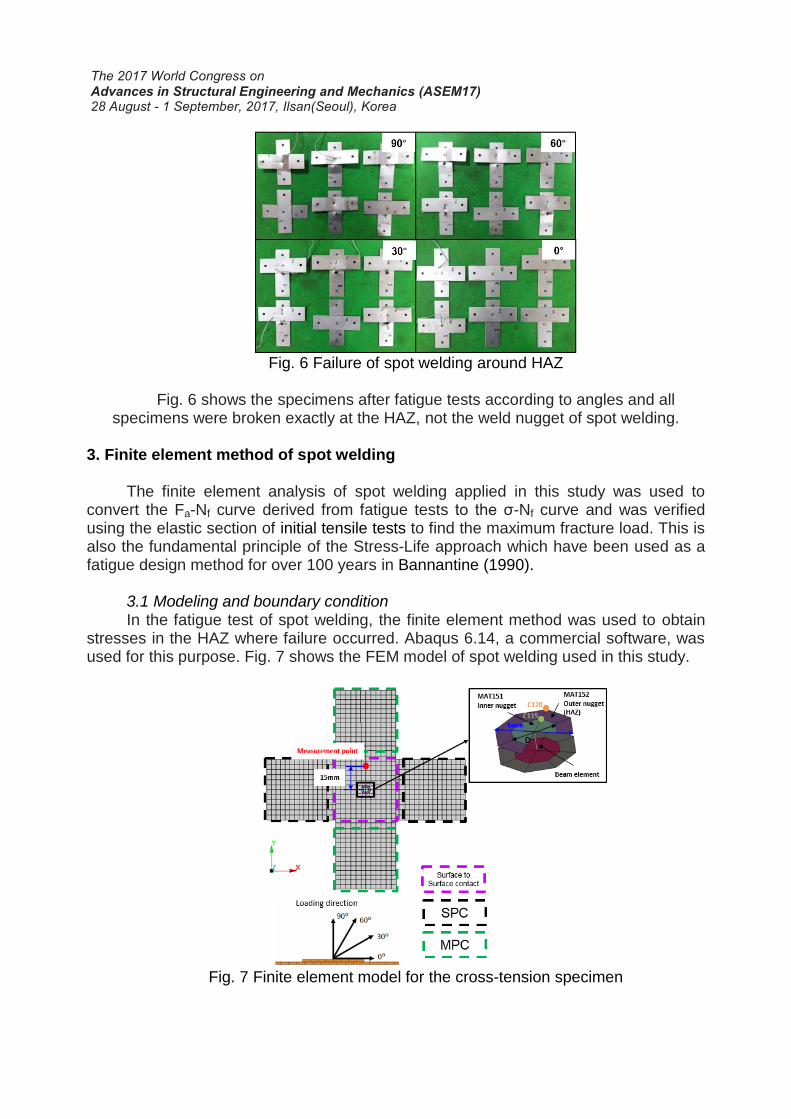
Fig. 6 Failure of spot welding around HAZ
Fig. 6 shows the specimens after fatigue tests according to angles and all
specimens were broken exactly at the HAZ, not the weld nugget of spot welding. 3. Finite element method of spot welding
The finite element analysis of spot welding applied in this study was used to convert the Fa-Nf curve derived from fatigue tests to the σ-Nf curve and was verified using the elastic section of initial tensile tests to find the maximum fracture load. This is also the fundamental principle of the Stress-Life approach which have been used as a fatigue design method for over 100 years in Bannantine (1990).
3.1 Modeling and boundary condition In the fatigue test of spot welding, the finite element method was used to obtain
stresses in the HAZ where failure occurred. Abaqus 6.14, a commercial software, was used for this purpose. Fig. 7 shows the FEM model of spot welding used in this study.
Fig. 7 Finite element model for the cross-tension specimen
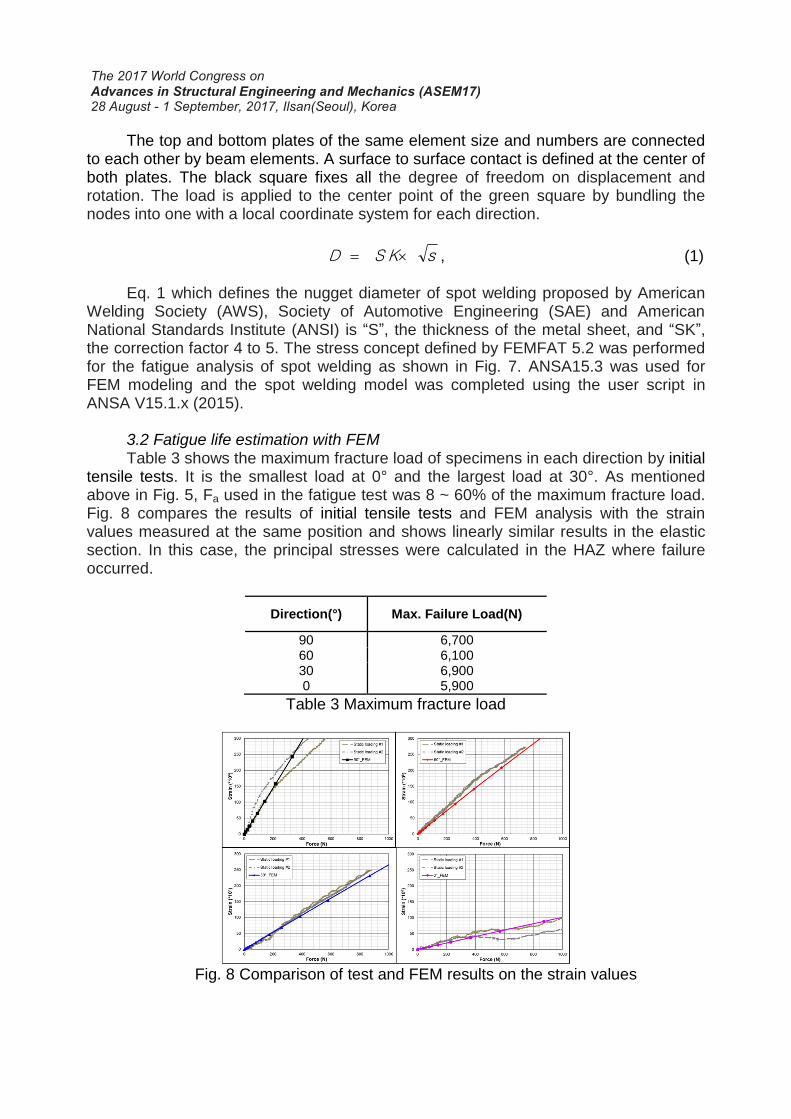
The top and bottom plates of the same element size and numbers are connected to each other by beam elements. A surface to surface contact is defined at the center of both plates. The black square fixes all the degree of freedom on displacement and rotation. The load is applied to the center point of the green square by bundling the nodes into one with a local coordinate system for each direction.
s S K D , (1)
Eq. 1 which defines the nugget diameter of spot welding proposed by American Welding Society (AWS), Society of Automotive Engineering (SAE) and American National Standards Institute (ANSI) is “S”, the thickness of the metal sheet, and “SK”, the correction factor 4 to 5. The stress concept defined by FEMFAT 5.2 was performed for the fatigue analysis of spot welding as shown in Fig. 7. ANSA15.3 was used for FEM modeling and the spot welding model was completed using the user script in ANSA V15.1.x (2015).
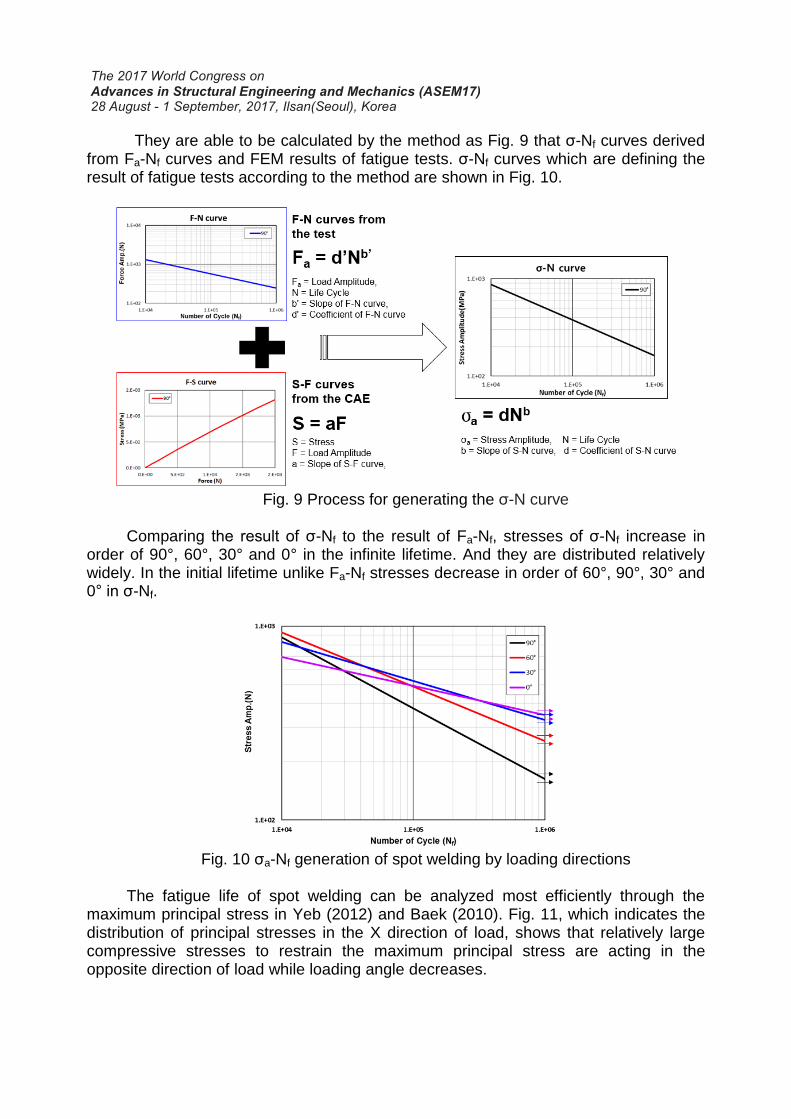
3.2 Fatigue life estimation with FEM Table 3 shows the maximum fracture load of specimens in each direction by initial
tensile tests. It is the smallest load at 0° and the largest load at 30°. As mentioned above in Fig. 5, Fa used in the fatigue test was 8 ~ 60% of the maximum fracture load. Fig. 8 compares the results of initial tensile tests and FEM analysis with the strain values measured at the same position and shows linearly similar results in the elastic section. In this case, the principal stresses were calculated in the HAZ where failure occurred.
Direction(°) Max. Failure Load(N)
90 6,700 60 6,100 30 6,900 0 5,900
Table 3 Maximum fracture load
Fig. 8 Comparison of test and FEM results on the strain values
They are able to be calculated by the method as Fig. 9 that σ-Nf curves derived from Fa-Nf curves and FEM results of fatigue tests. σ-Nf curves which are defining the result of fatigue tests according to the method are shown in Fig. 10.
Fig. 9 Process for generating the σ-N curve
Comparing the result of σ-Nf to the result of Fa-Nf, stresses of σ-Nf increase in
order of 90°, 60°, 30° and 0° in the infinite lifetime. And they are distributed relatively widely. In the initial lifetime unlike Fa-Nf stresses decrease in order of 60°, 90°, 30° and 0° in σ-Nf.
Fig. 10 σa-Nf generation of spot welding by loading directions
The fatigue life of spot welding can be analyzed most efficiently through the
maximum principal stress in Yeb (2012) and Baek (2010). Fig. 11, which indicates the distribution of principal stresses in the X direction of load, shows that relatively large compressive stresses to restrain the maximum principal stress are acting in the opposite direction of load while loading angle decreases.
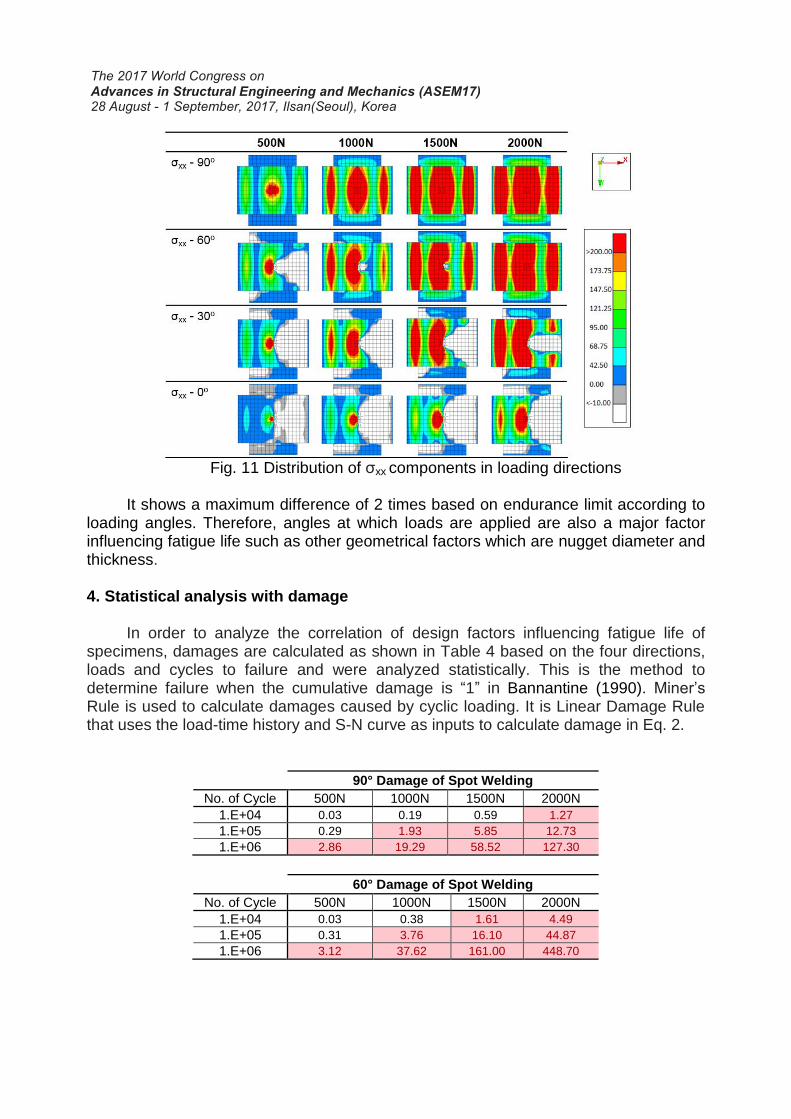
Fig. 11 Distribution of σxx components in loading directions
It shows a maximum difference of 2 times based on endurance limit according to
loading angles. Therefore, angles at which loads are applied are also a major factor influencing fatigue life such as other geometrical factors which are nugget diameter and thickness. 4. Statistical analysis with damage
In order to analyze the correlation of design factors influencing fatigue life of
specimens, damages are calculated as shown in Table 4 based on the four directions, loads and cycles to failure and were analyzed statistically. This is the method to determine failure when the cumulative damage is “1” in Bannantine (1990). Miner’s Rule is used to calculate damages caused by cyclic loading. It is Linear Damage Rule that uses the load-time history and S-N curve as inputs to calculate damage in Eq. 2.
90° Damage of Spot Welding
No. of Cycle 500N 1000N 1500N 2000N
1.E+04 0.03 0.19 0.59 1.27
1.E+05 0.29 1.93 5.85 12.73
1.E+06 2.86 19.29 58.52 127.30
60° Damage of Spot Welding
No. of Cycle 500N 1000N 1500N 2000N
1.E+04 0.03 0.38 1.61 4.49
1.E+05 0.31 3.76 16.10 44.87
1.E+06 3.12 37.62 161.00 448.70
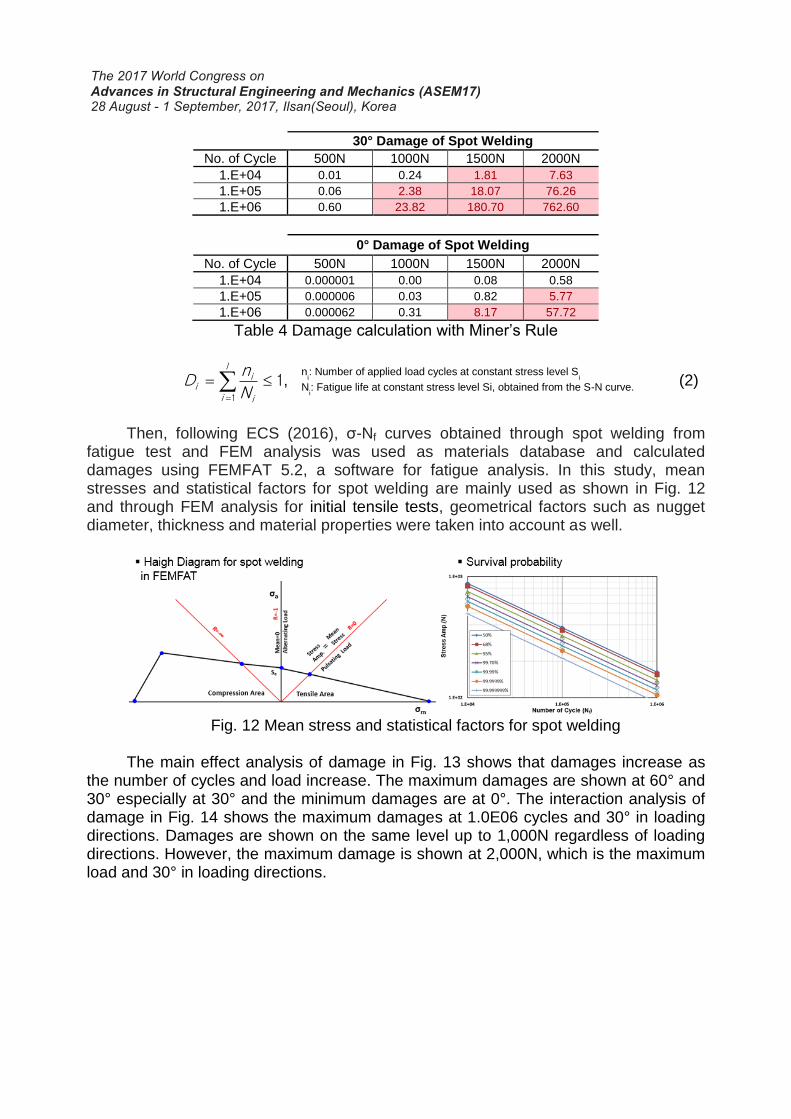
30° Damage of Spot Welding
No. of Cycle 500N 1000N 1500N 2000N
1.E+04 0.01 0.24 1.81 7.63
1.E+05 0.06 2.38 18.07 76.26
1.E+06 0.60 23.82 180.70 762.60
0° Damage of Spot Welding
No. of Cycle 500N 1000N 1500N 2000N
1.E+04 0.000001 0.00 0.08 0.58
1.E+05 0.000006 0.03 0.82 5.77
1.E+06 0.000062 0.31 8.17 57.72
Table 4 Damage calculation with Miner’s Rule
11
I
i i
ii N
nD , (2)
Then, following ECS (2016), σ-Nf curves obtained through spot welding from
fatigue test and FEM analysis was used as materials database and calculated damages using FEMFAT 5.2, a software for fatigue analysis. In this study, mean stresses and statistical factors for spot welding are mainly used as shown in Fig. 12 and through FEM analysis for initial tensile tests, geometrical factors such as nugget diameter, thickness and material properties were taken into account as well.
Fig. 12 Mean stress and statistical factors for spot welding
The main effect analysis of damage in Fig. 13 shows that damages increase as
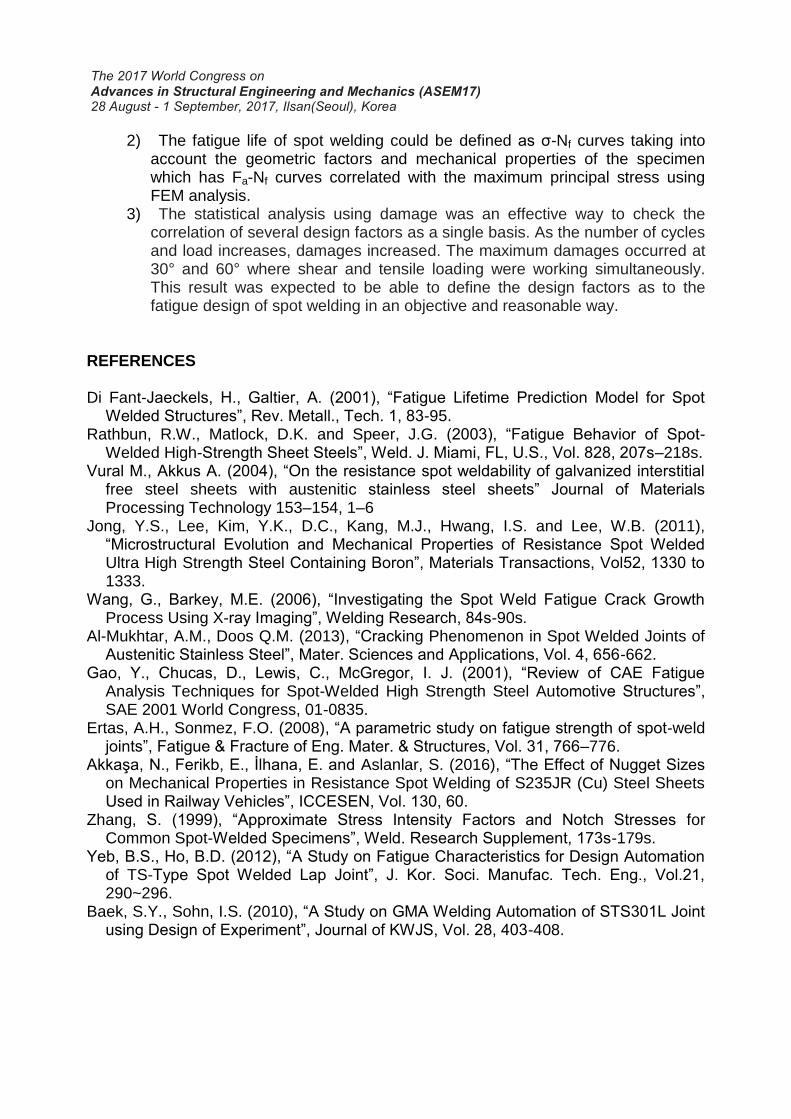
the number of cycles and load increase. The maximum damages are shown at 60° and 30° especially at 30° and the minimum damages are at 0°. The interaction analysis of damage in Fig. 14 shows the maximum damages at 1.0E06 cycles and 30° in loading directions. Damages are shown on the same level up to 1,000N regardless of loading directions. However, the maximum damage is shown at 2,000N, which is the maximum load and 30° in loading directions.
ni: Number of applied load cycles at constant stress level S
i
Ni: Fatigue life at constant stress level Si, obtained from the S-N curve.
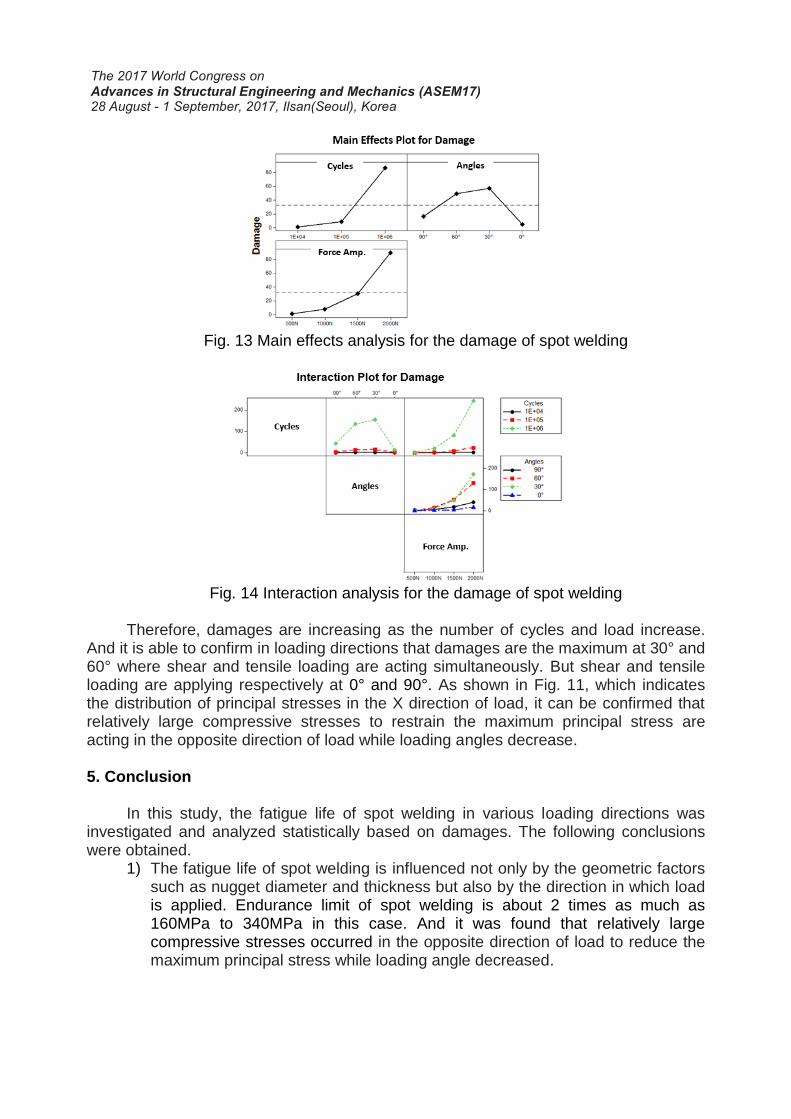
Fig. 13 Main effects analysis for the damage of spot welding
Fig. 14 Interaction analysis for the damage of spot welding
Therefore, damages are increasing as the number of cycles and load increase.
And it is able to confirm in loading directions that damages are the maximum at 30° and 60° where shear and tensile loading are acting simultaneously. But shear and tensile loading are applying respectively at 0° and 90°. As shown in Fig. 11, which indicates the distribution of principal stresses in the X direction of load, it can be confirmed that relatively large compressive stresses to restrain the maximum principal stress are acting in the opposite direction of load while loading angles decrease. 5. Conclusion
In this study, the fatigue life of spot welding in various loading directions was
investigated and analyzed statistically based on damages. The following conclusions were obtained.
1) The fatigue life of spot welding is influenced not only by the geometric factors such as nugget diameter and thickness but also by the direction in which load is applied. Endurance limit of spot welding is about 2 times as much as 160MPa to 340MPa in this case. And it was found that relatively large compressive stresses occurred in the opposite direction of load to reduce the maximum principal stress while loading angle decreased.
2) The fatigue life of spot welding could be defined as σ-Nf curves taking into account the geometric factors and mechanical properties of the specimen which has Fa-Nf curves correlated with the maximum principal stress using FEM analysis.
3) The statistical analysis using damage was an effective way to check the correlation of several design factors as a single basis. As the number of cycles and load increases, damages increased. The maximum damages occurred at 30° and 60° where shear and tensile loading were working simultaneously. This result was expected to be able to define the design factors as to the fatigue design of spot welding in an objective and reasonable way.
REFERENCES Di Fant-Jaeckels, H., Galtier, A. (2001), “Fatigue Lifetime Prediction Model for Spot
Welded Structures”, Rev. Metall., Tech. 1, 83-95. Rathbun, R.W., Matlock, D.K. and Speer, J.G. (2003), “Fatigue Behavior of Spot-
Welded High-Strength Sheet Steels”, Weld. J. Miami, FL, U.S., Vol. 828, 207s–218s. Vural M., Akkus A. (2004), “On the resistance spot weldability of galvanized interstitial
free steel sheets with austenitic stainless steel sheets” Journal of Materials Processing Technology 153–154, 1–6
Jong, Y.S., Lee, Kim, Y.K., D.C., Kang, M.J., Hwang, I.S. and Lee, W.B. (2011), “Microstructural Evolution and Mechanical Properties of Resistance Spot Welded Ultra High Strength Steel Containing Boron”, Materials Transactions, Vol52, 1330 to 1333.
Wang, G., Barkey, M.E. (2006), “Investigating the Spot Weld Fatigue Crack Growth Process Using X-ray Imaging”, Welding Research, 84s-90s.
Al-Mukhtar, A.M., Doos Q.M. (2013), “Cracking Phenomenon in Spot Welded Joints of Austenitic Stainless Steel”, Mater. Sciences and Applications, Vol. 4, 656-662.
Gao, Y., Chucas, D., Lewis, C., McGregor, I. J. (2001), “Review of CAE Fatigue Analysis Techniques for Spot-Welded High Strength Steel Automotive Structures”, SAE 2001 World Congress, 01-0835.
Ertas, A.H., Sonmez, F.O. (2008), “A parametric study on fatigue strength of spot-weld joints”, Fatigue & Fracture of Eng. Mater. & Structures, Vol. 31, 766–776.
Akkaşa, N., Ferikb, E., İlhana, E. and Aslanlar, S. (2016), “The Effect of Nugget Sizes on Mechanical Properties in Resistance Spot Welding of S235JR (Cu) Steel Sheets Used in Railway Vehicles”, ICCESEN, Vol. 130, 60.
Zhang, S. (1999), “Approximate Stress Intensity Factors and Notch Stresses for Common Spot-Welded Specimens”, Weld. Research Supplement, 173s-179s.
Yeb, B.S., Ho, B.D. (2012), “A Study on Fatigue Characteristics for Design Automation of TS-Type Spot Welded Lap Joint”, J. Kor. Soci. Manufac. Tech. Eng., Vol.21, 290~296.
Baek, S.Y., Sohn, I.S. (2010), “A Study on GMA Welding Automation of STS301L Joint using Design of Experiment”, Journal of KWJS, Vol. 28, 403-408.

Sohn, I.S., Bae, D.H. (2000), “A study on the Fatigue Life Prediction Method of the Spot-welded Lap Joint”, Seoul 2000 FISITA World Automotive Congress, F2000A017.
Bannantine, J.A., Comer, J.J. and Handrock, J.L. (1990), Fundamentals of Metal Fatigue Analysis, Prentice-Hall, Englewood Cliffs, NJ.
ECS Steyr. FemFat5.2 (2016), Theory Manual. St. Valentin. ANSA V15.1.x (2015), User’s Guide, BETA CAE Systems S.A.