Embed Size (px)
Citation preview

Available online at www.sciencedirect.com
+ MODEL
ScienceDirectPublishing Services by Elsevier
International Journal of Naval Architecture and Ocean Engineering xx (2017) 1e9http://www.journals.elsevier.com/international-journal-of-naval-architecture-and-ocean-engineering/
A study on multi-objective optimal design of derrick structure: Case study
Jae-chul Lee a, Ji-ho Jeong b, Philip Wilson c, Soon-sup Lee a, Tak-kee Lee a, Jong-Hyun Lee a,Sung-chul Shin d,*
a Department of Ocean System Engineering, Gyeongsang National University, South Koreab Korea Marine Equipment Research Institute, Energy & Marine Research Division, South Korea
c Faculty of Engineering and the Environment, University of Southampton, Southampton, UKd Department of Naval Architecture and Ocean Engineering, Pusan National University, South Korea
Received 9 January 2017; revised 5 September 2017; accepted 25 September 2017
Available online ▪ ▪ ▪
Abstract
Engineering system problems consist of multi-objective optimisation and the performance analysis is generally time consuming. To optimisethe system concerning its performance, many researchers perform the optimisation using an approximation model. The Response SurfaceMethod (RSM) is usually used to predict the system performance in many research fields, but it shows prediction errors for highly nonlinearproblems. To create an appropriate metamodel for marine systems, Lee (2015) compares the prediction accuracy of the approximation model,and multi-objective optimal design framework is proposed based on a confirmed approximation model. The proposed framework is composed ofthree parts: definition of geometry, generation of approximation model, and optimisation.
The major objective of this paper is to confirm the applicability/usability of the proposed optimal design framework and evaluate theprediction accuracy based on sensitivity analysis. We have evaluated the proposed framework applicability in derrick structure optimisationconsidering its structural performance.Copyright © 2017 Society of Naval Architects of Korea. Production and hosting by Elsevier B.V. This is an open access article under theCC BY-NC-ND license (http://creativecommons.org/licenses/by-nc-nd/4.0/).
Keywords: Multi-objective optimal design framework; Sensitivity analysis; Back-Propagation Neural Network (BPNN); Neuro-Response Surface Method
(NRSM); Non-dominated Sorting Genetic Algorithm-II (NSGA-II); Derrick structure
1. Introduction
The optimal design of engineering systems is considered asa multi-objective optimisation problem, and the geometry ofengineering systems severely affects its performance. For thisreason, determining an optimal geometry is one of the chal-lenging problems in the initial design stage. In recent years,system optimisation based on the performance using thecommercial code is a method that was employed for engi-neering design problems (Ko et al., 2013; Jung et al., 2012).
The essence of optimisation design process is the perfor-mance analysis/evaluation according to the geometry
* Corresponding author.
E-mail address: [email protected] (S.-c. Shin).
Peer review under responsibility of Society of Naval Architects of Korea.
Please cite this article in press as: Lee, Jae-chul, et al., A study on multi-objective
Architecture and Ocean Engineering (2017), https://doi.org/10.1016/j.ijnaoe.2017
https://doi.org/10.1016/j.ijnaoe.2017.09.011
p2092-6782 e2092-6790/Copyright © 2017 Society of Naval Architects of Korea. P
CC BY-NC-ND license (http://creativecommons.org/licenses/by-nc-nd/4.0/).
modification. Generally, the performance analysis of thecomplex engineering system such as marine, aerospace, ma-chinery system … etc. is time-consuming. To reduce theperformance calculation time, many researchers try to predictthe performance using approximation models (also known asresponse surfaces, or metamodels). These approximationmodels represent the relationship between inputs (designvariables) and outputs (system's performance) (Hong et al.,2000; Mayers and Montgomery, 1995; Li et al., 2012). How-ever, Response Surface Method (RSM) produces some errorsin highly nonlinear problems (Sankaya and Gullu, 2014;Salman, 2014; Kahraman, 2009).
The optimal design problems of a marine system based onits performance involve highly nonlinear components, such asstructural, hydrodynamic, vibration performances, etc.
optimal design of derrick structure: Case study, International Journal of Naval
.09.011
roduction and hosting by Elsevier B.V. This is an open access article under the

2 J.-c. Lee et al. / International Journal of Naval Architecture and Ocean Engineering xx (2017) 1e9
+ MODEL
Many researchers tried to optimise the hull form using theparametric design method. Zhang (2008) researched hull formdesign using the parametric approach. They employed theNon-Uniform Rational B-Spline (NURBS) method torepresent the hull form. Grigoropoulos and Chalkias (2010)tried to optimise the hull form in calm and rough waterbased on the parametric design method. Lee and Choi (2009)tried to optimise the hull form in terms of hydrodynamicperformance using the form parametric design method. Parket al. (2015) tried to optimise hull form of SUEZMAX usingoptimisation techniques. The parametric design method forgeometry representation is a useful technique for geometryoptimisation based on performance.
Up to now, many relevant papers about optimisation basedon system performance have been published. To predict thesystem performance, Shin (2007) employed the neuro-fuzzyalgorithm to predict the wake distribution, Xu (2011) pre-dicted the maritime safety using the Artificial Neural Network(ANN), and Lee et al. (2014a) tried the prediction for addedresistance in waves using the Genetic Programming (GP). Tooptimise the shape based on performance, Kim et al. (2007)developed a framework to optimise the stern form based onCFD, Halder et al. (2017) studied multi-objective optimisationof blade sweep for a Wells turbine using CFD simulation, Yuet al. (2017) studied optimisation for bow hull form of a66,000 DWT bulk carrier using the Particle Swarm Optimi-zation (PSO) algorithm, and Chen et al. (2016) tried to opti-mise the hull form (10000TEU container ship) using CFDmethod. In the shape optimisation research, generally, CFDanalysis was just a means of checking the performance of adesign process, and it is very time-consuming. Therefore,optimisation becomes difficult/impossible using CFD toolsbecause we need to check the system performances for a largenumber of alternative design cases. To examine alternativedesign cases and minimise the performance analysis time, amulti-objective optimal design framework that includes per-formance prediction and an optimisation process is essential.
To create an appropriate approximation model for marinesystem, Lee (2015) compares the prediction accuracy of theresponse surface generated by the RSM, the kriging methodand the ANN method using two NLP problems and one userdefine problem, and subsequently proposes a multi-objectiveoptimal design framework comprising two principal phases:
(1st Phase)
To predict the system performance, generate the responsesurface using the Artificial Neural Network (ANN) that isconsidered as a Neuro-Response Surface Method (NRSM) inthe proposed framework.
(2nd Phase)
Optimise the system geometry in the generated responsesurface using NSGA- II.
Please cite this article in press as: Lee, Jae-chul, et al., A study on multi-objective
Architecture and Ocean Engineering (2017), https://doi.org/10.1016/j.ijnaoe.2017
By means of a case study of constraint optimisation prob-lem, the effectiveness of the proposed optimal design meth-odology is verified in view of structural performances (Leeet al., 2016).
The remainder of this paper is organized as follows.Chapter 2 presents an optimal design framework based on theNeuro-Response Surface Method (NRSM), and Chapter 3presents an example of derrick system optimisation problemconsidering its structure performance (Lee et al., 2016).Finally, Chapter 4 explains the conclusion and future researchplan.
2. Framework for optimum design based on NRSM
The proposed optimal design framework includes geometryrepresentation, performance prediction, and optimisation.Fig. 1 illustrates the framework which is composed of threeprocesses (Lee et al., 2014b):
(1st process: Definition of the geometry)
The framework defines the geometry of the structure usingparameterisation. An orthogonal array table (Ross, 1996) isused to systematically generate design alternatives. The sys-tem performance prediction is more accurate when the rangeof design variables includes all possible design alternatives.
To check the interaction between the variables and theresponse, the generated design alternatives are divided intotwo sets:
Training data: used to generate the response surface andcheck the learning accuracy.
Test data: used to check the prediction accuracy.
(2nd process: Generation of response surface using NRSM)
The Multi-Layer Perceptron (MLP) is used to generate theresponse surface. It has three layers: an input layer, a hiddenlayer, and an output layer. The back-propagation algorithm(Robert, 1989) is used to train the neural network. The pre-diction accuracy of generated response surface is veryimportant because the optimisation process is conducted on it.In order to construct the appropriate response surface, the beststructure and the best number of learning cycles for the neuralnetwork are prepared and the prediction accuracy of thegenerated response surface is checked using Test data (1stprocess). Through this process, we can make an appropriateANN structure for our problem. After generating the responsesurface, the performance of various design alternatives can bepredicted easily and quickly.
(3rd process: Optimisation)
The optimisation process is conducted to generate theresponse surface. The NSGA-II (Deb, 2002) is used as a multi-objective optimisation algorithm.
optimal design of derrick structure: Case study, International Journal of Naval
.09.011
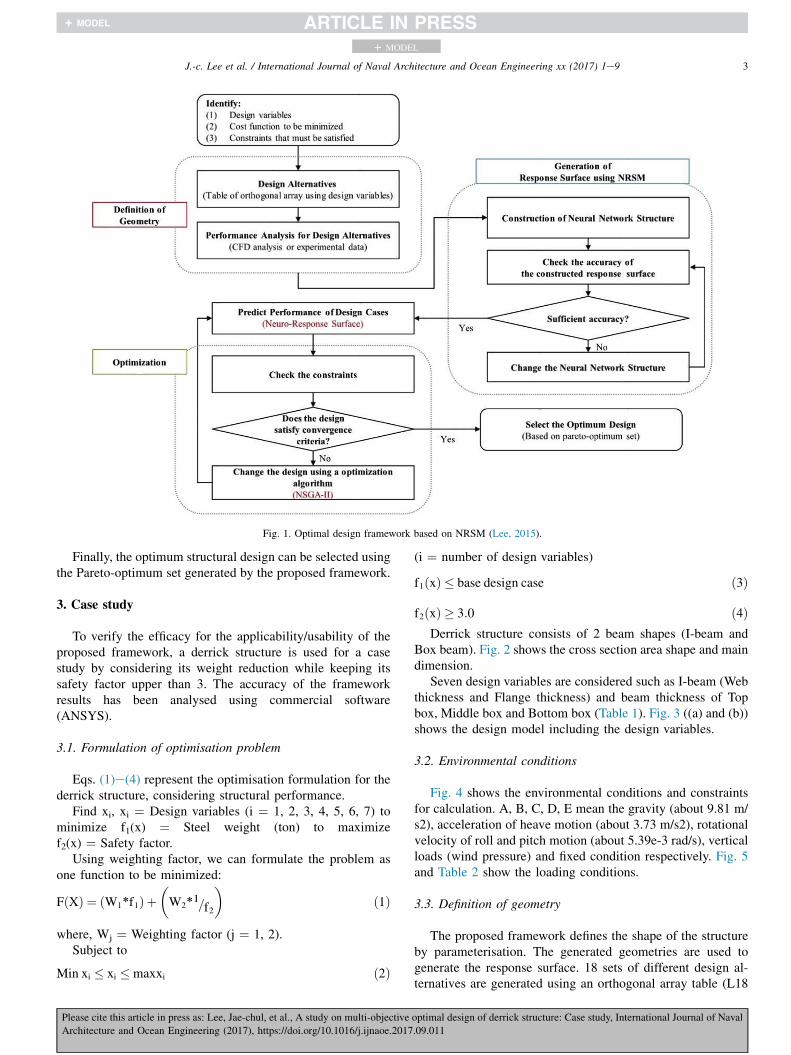
Fig. 1. Optimal design framework based on NRSM (Lee, 2015).
3J.-c. Lee et al. / International Journal of Naval Architecture and Ocean Engineering xx (2017) 1e9
+ MODEL
Finally, the optimum structural design can be selected usingthe Pareto-optimum set generated by the proposed framework.
3. Case study
To verify the efficacy for the applicability/usability of theproposed framework, a derrick structure is used for a casestudy by considering its weight reduction while keeping itssafety factor upper than 3. The accuracy of the frameworkresults has been analysed using commercial software(ANSYS).
3.1. Formulation of optimisation problem
Eqs. (1)e(4) represent the optimisation formulation for thederrick structure, considering structural performance.
Find xi, xi ¼ Design variables (i ¼ 1, 2, 3, 4, 5, 6, 7) tominimize f1(x) ¼ Steel weight (ton) to maximizef2(x) ¼ Safety factor.
Using weighting factor, we can formulate the problem asone function to be minimized:
FðXÞ ¼ ðW1*f1Þ þ�W2*1=f2
�ð1Þ
where, Wj ¼ Weighting factor (j ¼ 1, 2).Subject to
Min xi � xi �maxxi ð2Þ
Please cite this article in press as: Lee, Jae-chul, et al., A study on multi-objective
Architecture and Ocean Engineering (2017), https://doi.org/10.1016/j.ijnaoe.2017
(i ¼ number of design variables)
f1ðxÞ � base design case ð3Þ
f2ðxÞ � 3:0 ð4ÞDerrick structure consists of 2 beam shapes (I-beam and
Box beam). Fig. 2 shows the cross section area shape and maindimension.
Seven design variables are considered such as I-beam (Webthickness and Flange thickness) and beam thickness of Topbox, Middle box and Bottom box (Table 1). Fig. 3 ((a) and (b))shows the design model including the design variables.
3.2. Environmental conditions
Fig. 4 shows the environmental conditions and constraintsfor calculation. A, B, C, D, E mean the gravity (about 9.81 m/s2), acceleration of heave motion (about 3.73 m/s2), rotationalvelocity of roll and pitch motion (about 5.39e-3 rad/s), verticalloads (wind pressure) and fixed condition respectively. Fig. 5and Table 2 show the loading conditions.
3.3. Definition of geometry
The proposed framework defines the shape of the structureby parameterisation. The generated geometries are used togenerate the response surface. 18 sets of different design al-ternatives are generated using an orthogonal array table (L18
optimal design of derrick structure: Case study, International Journal of Naval
.09.011
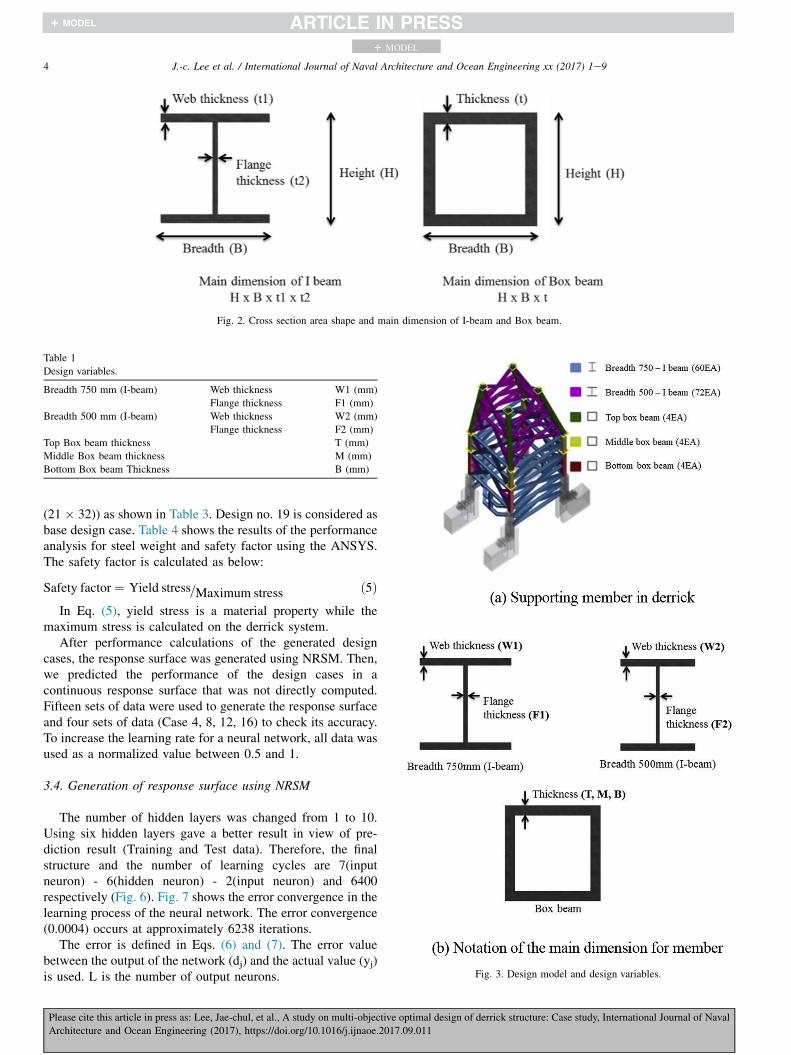
Fig. 2. Cross section area shape and main dimension of I-beam and Box beam.
Table 1
Design variables.
Breadth 750 mm (I-beam) Web thickness W1 (mm)
Flange thickness F1 (mm)
Breadth 500 mm (I-beam) Web thickness W2 (mm)
Flange thickness F2 (mm)
Top Box beam thickness T (mm)
Middle Box beam thickness M (mm)
Bottom Box beam Thickness B (mm)
4 J.-c. Lee et al. / International Journal of Naval Architecture and Ocean Engineering xx (2017) 1e9
+ MODEL
(21 � 32)) as shown in Table 3. Design no. 19 is considered asbase design case. Table 4 shows the results of the performanceanalysis for steel weight and safety factor using the ANSYS.The safety factor is calculated as below:
Safety factor ¼ Yield stress=Maximum stress ð5ÞIn Eq. (5), yield stress is a material property while the
maximum stress is calculated on the derrick system.After performance calculations of the generated design
cases, the response surface was generated using NRSM. Then,we predicted the performance of the design cases in acontinuous response surface that was not directly computed.Fifteen sets of data were used to generate the response surfaceand four sets of data (Case 4, 8, 12, 16) to check its accuracy.To increase the learning rate for a neural network, all data wasused as a normalized value between 0.5 and 1.
3.4. Generation of response surface using NRSM
Fig. 3. Design model and design variables.
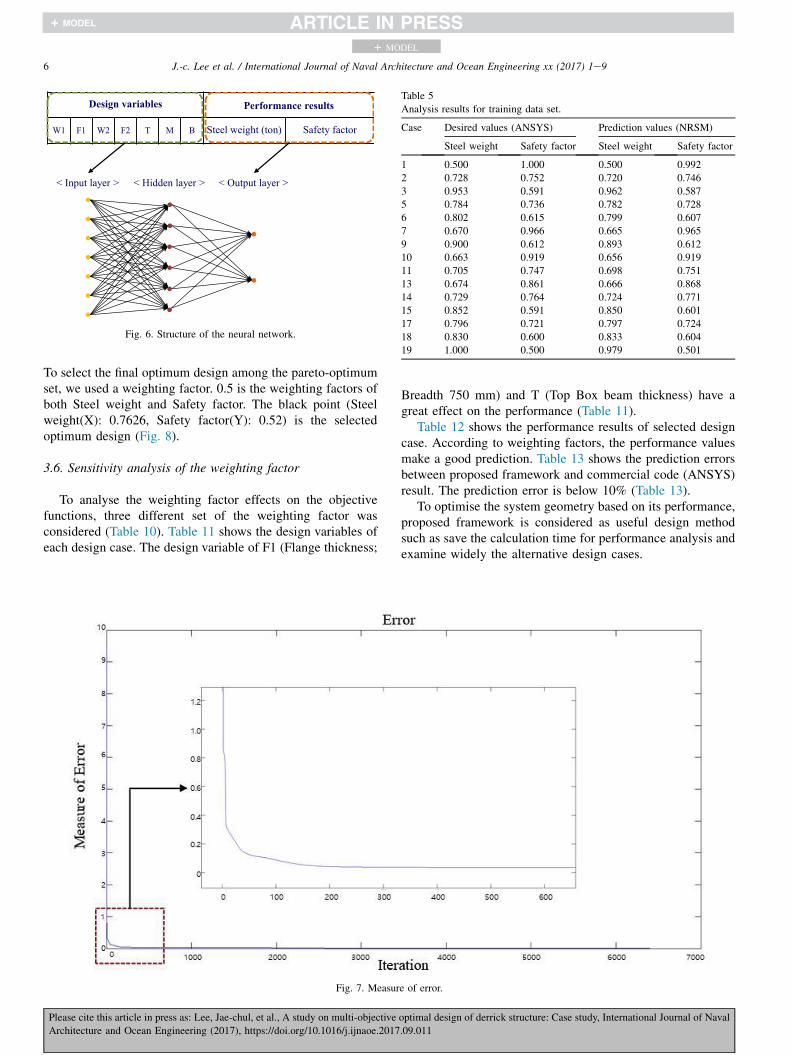
The number of hidden layers was changed from 1 to 10.Using six hidden layers gave a better result in view of pre-diction result (Training and Test data). Therefore, the finalstructure and the number of learning cycles are 7(inputneuron) - 6(hidden neuron) - 2(input neuron) and 6400respectively (Fig. 6). Fig. 7 shows the error convergence in thelearning process of the neural network. The error convergence(0.0004) occurs at approximately 6238 iterations.
The error is defined in Eqs. (6) and (7). The error valuebetween the output of the network (dj) and the actual value (yj)is used. L is the number of output neurons.
Please cite this article in press as: Lee, Jae-chul, et al., A study on multi-objective optimal design of derrick structure: Case study, International Journal of Naval
Architecture and Ocean Engineering (2017), https://doi.org/10.1016/j.ijnaoe.2017.09.011
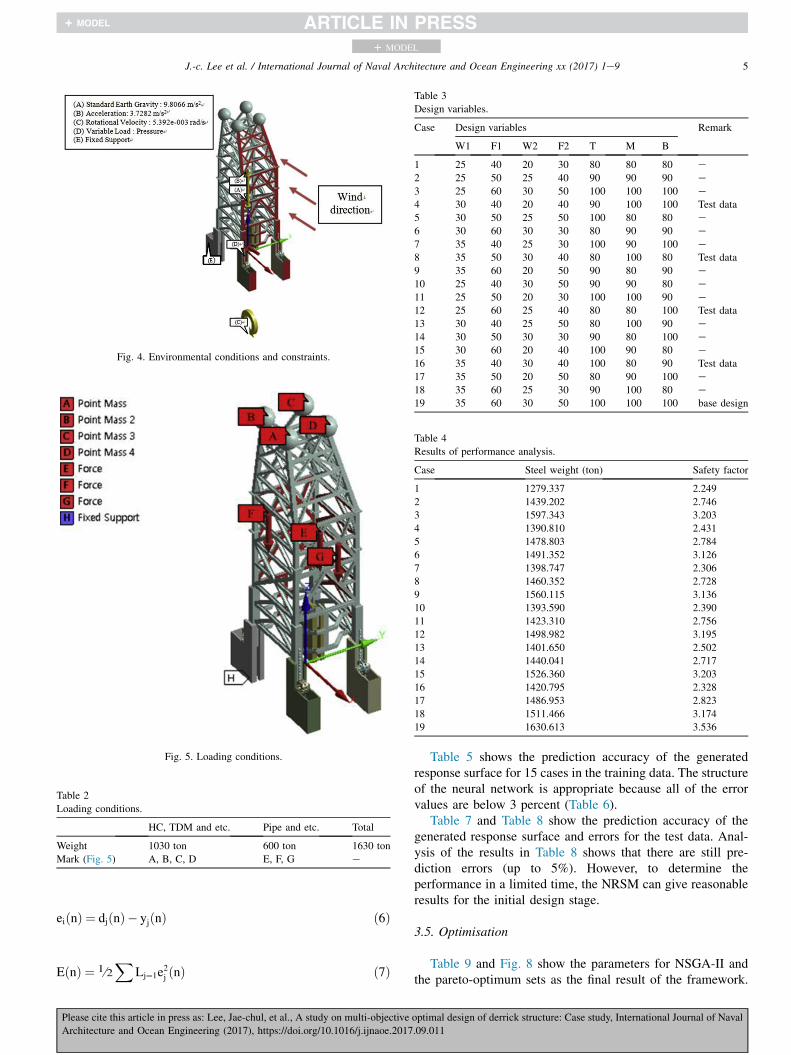
Fig. 4. Environmental conditions and constraints.
Fig. 5. Loading conditions.
Table 2
Loading conditions.
HC, TDM and etc. Pipe and etc. Total
Weight 1030 ton 600 ton 1630 ton
Mark (Fig. 5) A, B, C, D E, F, G e
Table 3
Design variables.
Case Design variables Remark
W1 F1 W2 F2 T M B
1 25 40 20 30 80 80 80 e
2 25 50 25 40 90 90 90 e
3 25 60 30 50 100 100 100 e4 30 40 20 40 90 100 100 Test data
5 30 50 25 50 100 80 80 e
6 30 60 30 30 80 90 90 e
7 35 40 25 30 100 90 100 e8 35 50 30 40 80 100 80 Test data
9 35 60 20 50 90 80 90 e
10 25 40 30 50 90 90 80 e
11 25 50 20 30 100 100 90 e12 25 60 25 40 80 80 100 Test data
13 30 40 25 50 80 100 90 e
14 30 50 30 30 90 80 100 e15 30 60 20 40 100 90 80 e
16 35 40 30 40 100 80 90 Test data
17 35 50 20 50 80 90 100 e
18 35 60 25 30 90 100 80 e19 35 60 30 50 100 100 100 base design
Table 4
Results of performance analysis.
Case Steel weight (ton) Safety factor
1 1279.337 2.249
2 1439.202 2.746
3 1597.343 3.203
4 1390.810 2.431
5 1478.803 2.784
6 1491.352 3.126
7 1398.747 2.306
8 1460.352 2.728
9 1560.115 3.136
10 1393.590 2.390
11 1423.310 2.756
12 1498.982 3.195
13 1401.650 2.502
14 1440.041 2.717
15 1526.360 3.203
16 1420.795 2.328
17 1486.953 2.823
18 1511.466 3.174
19 1630.613 3.536
5J.-c. Lee et al. / International Journal of Naval Architecture and Ocean Engineering xx (2017) 1e9
+ MODEL
eiðnÞ ¼ djðnÞ � yjðnÞ ð6Þ
EðnÞ ¼ 1 =
2X
Lj¼1e2j ðnÞ ð7Þ
Please cite this article in press as: Lee, Jae-chul, et al., A study on multi-objective
Architecture and Ocean Engineering (2017), https://doi.org/10.1016/j.ijnaoe.2017
Table 5 shows the prediction accuracy of the generatedresponse surface for 15 cases in the training data. The structureof the neural network is appropriate because all of the errorvalues are below 3 percent (Table 6).
Table 7 and Table 8 show the prediction accuracy of thegenerated response surface and errors for the test data. Anal-ysis of the results in Table 8 shows that there are still pre-diction errors (up to 5%). However, to determine theperformance in a limited time, the NRSM can give reasonableresults for the initial design stage.
3.5. Optimisation
Table 9 and Fig. 8 show the parameters for NSGA-II andthe pareto-optimum sets as the final result of the framework.
optimal design of derrick structure: Case study, International Journal of Naval
.09.011
< Input layer > < Hidden layer > < Output layer >
Design variables Performance results
W1 F1 W2 F2 T M B Steel weight (ton) Safety factor
Fig. 6. Structure of the neural network.
Table 5
Analysis results for training data set.
Case Desired values (ANSYS) Prediction values (NRSM)
Steel weight Safety factor Steel weight Safety factor
1 0.500 1.000 0.500 0.992
2 0.728 0.752 0.720 0.746
3 0.953 0.591 0.962 0.587
5 0.784 0.736 0.782 0.728
6 0.802 0.615 0.799 0.607
7 0.670 0.966 0.665 0.965
9 0.900 0.612 0.893 0.612
10 0.663 0.919 0.656 0.919
11 0.705 0.747 0.698 0.751
13 0.674 0.861 0.666 0.868
14 0.729 0.764 0.724 0.771
15 0.852 0.591 0.850 0.601
17 0.796 0.721 0.797 0.724
18 0.830 0.600 0.833 0.604
19 1.000 0.500 0.979 0.501
6 J.-c. Lee et al. / International Journal of Naval Architecture and Ocean Engineering xx (2017) 1e9
+ MODEL
To select the final optimum design among the pareto-optimumset, we used a weighting factor. 0.5 is the weighting factors ofboth Steel weight and Safety factor. The black point (Steelweight(X): 0.7626, Safety factor(Y): 0.52) is the selectedoptimum design (Fig. 8).
3.6. Sensitivity analysis of the weighting factor
To analyse the weighting factor effects on the objectivefunctions, three different set of the weighting factor wasconsidered (Table 10). Table 11 shows the design variables ofeach design case. The design variable of F1 (Flange thickness;
Fig. 7. Measur
Please cite this article in press as: Lee, Jae-chul, et al., A study on multi-objective
Architecture and Ocean Engineering (2017), https://doi.org/10.1016/j.ijnaoe.2017
Breadth 750 mm) and T (Top Box beam thickness) have agreat effect on the performance (Table 11).
Table 12 shows the performance results of selected designcase. According to weighting factors, the performance valuesmake a good prediction. Table 13 shows the prediction errorsbetween proposed framework and commercial code (ANSYS)result. The prediction error is below 10% (Table 13).
To optimise the system geometry based on its performance,proposed framework is considered as useful design methodsuch as save the calculation time for performance analysis andexamine widely the alternative design cases.
e of error.
optimal design of derrick structure: Case study, International Journal of Naval
.09.011

Table 6
Error of training data set.
Case Error (%) ¼ [(Desired value�Prediction
values)/Desired values] � 100
Steel weight (ton) Safety factor
1 0.1% 0.8%
2 1.0% 0.7%
3 1.0% 0.7%
5 0.3% 1.0%
6 0.4% 1.3%
7 0.7% 0.2%
9 0.7% 0.0%
10 0.9% 0.0%
11 1.0% 0.4%
13 1.2% 0.8%
14 0.6% 0.9%
15 0.2% 1.8%
17 0.2% 0.5%
18 0.3% 0.7%
19 2.1% 0.1%
Table 7
Analysis results for test data set.
Case Desired values (ANSYS) Prediction values (NRSM)
Steel weight Safety factor Steel weight Safety factor
4 0.659 0.897 0.658 0.924
8 0.758 0.759 0.751 0.721
12 0.813 0.593 0.806 0.616
16 0.701 0.953 0.688 0.930
Table 8
The error of test data set.
Case Error (%) ¼ [(Desired value�Prediction values)/Desired values] � 100
Steel weight (ton) Safety factor
4 0.2% 3.0%
8 0.8% 5.0%
12 0.8% 3.8%
16 1.9% 2.4%
Table 9
NSGA-II parameter.
Parameter Value
Population size 100
Generation 1000
Crossover 30%
Mutation 2%
7J.-c. Lee et al. / International Journal of Naval Architecture and Ocean Engineering xx (2017) 1e9
+ MODEL
3.7. Analysis of optimum design
The improvement in standards of performance evaluationwas analysed, as shown in Table 14, where all criteria for theoptimum design case (Set 1) are satisfied such as steel weightthat decreased about 10% comparing with base design caseand safety factor that increased about 3.8% comparing withthe required safety factor.
Please cite this article in press as: Lee, Jae-chul, et al., A study on multi-objective
Architecture and Ocean Engineering (2017), https://doi.org/10.1016/j.ijnaoe.2017
Fig. 9 shows the result of structure analysis. The maximumstress is 1.1238e2 (MPa).
3.8. Discussion
The effectiveness of the proposed framework throughmulti-objective optimisation problem was confirmed by aderrick weight minimisation while considering a given safetyfactor: more than 3.
In the initial design stage, the shape of various design al-ternatives considering their performances can be checked in areduced analysis time using the proposed framework. Weconsidered that optimal design framework presents the startingdesign point and save the time for optimal design usingexisting experimental or calculation data based on commercialcodes in the initial design stage. However, the proposedframework shows some errors for extrapolation design prob-lems. To increase the prediction accuracy of extrapolationdesign alternatives, we can add some experimental or calcu-lation data using commercial codes into pre-existing data, orset the range of design variables including all possible designalternatives in the proposed framework (1st stage: generationof geometry).
4. Conclusion
The major objective of this research is to confirm theapplicability/usability regarding multi-objective problems.The proposed framework is composed of three parts: definitionof geometry, generation of an appropriate metamodel, andoptimisation process. To reduce the time for performanceprediction and minimize the prediction errors, the metamodelis generated based on the backpropagation neural network(BPN). The optimisation process is done for the generatedmetamodel by Non-dominated Sorting Genetic Algorithm-II(NSGA-II). The detailed results are as follows.
I. Through a case study on the optimal structure of aderrick, we confirmed the applicability/usability of theproposed framework for multi-objective NAOE optimi-sation problems.
II. Through sensitivity analysis of the weighting factor, wecan check the prediction accuracy of structureperformance.
III. The proposed framework is considered as a useful en-gineering system optimisation design tool in the initialdesign stage:- Save the performance analysis time in the optimisa-tion process
- Widely check the alternative design cases.
Evaluations of the appropriate approximation model foreach problem and their application to various optimisationproblems considering actual design constraints will be con-ducted in future work.
optimal design of derrick structure: Case study, International Journal of Naval
.09.011

Fig. 8. Pareto-optimum set.
Table 10
Weighting factor effects.
Objective function Weighting factor
Set 1 Set 2 Set 3
Steel weight (ton) 0.5 0.7 0.4
Safety factor 0.5 0.3 0.6
Table 11
Design variables for optimum design cases.
Design variables for optimum design case
No. W1 F1 W2 F2 T M B
1 25 58.277 20 30 100 100 80
2 25 57.296 20 30 80 99.996 80
3 25 58.151 20 30 100 100 80
Table 12
Analysis of results between desired value and prediction value.
No. Results based on NRSM framework Results for ANSYS calculation
Steel weight (ton) Safety factor Steel weight (ton) Safety factor
1 1463.848 3.457 1472.944 3.114
2 1404.157 3.000 1426.711 3.076
3 1462.664 3.446 1472.045 3.106
Table 13
Prediction error.
Prediction error [(NRSM Framework�ANSYS Calculation)/NRSM
Framework]
No. of Set Steel
weight (ton)
Safety factor
1 0.62% 9.92%
2 1.60% 2.53%
3 0.64% 9.87%
Table 14
Improvement of performance evaluation criteria.
Improvement (%) ¼ [(Base model�Optimisation model)/Base
model] � 100
Steel weight (ton) Safety factor
(Upper than 3.0)
10% (Decrease) 3.8% (Increase)
8 J.-c. Lee et al. / International Journal of Naval Architecture and Ocean Engineering xx (2017) 1e9
+ MODEL
Please cite this article in press as: Lee, Jae-chul, et al., A study on multi-objective optimal design of derrick structure: Case study, International Journal of Naval
Architecture and Ocean Engineering (2017), https://doi.org/10.1016/j.ijnaoe.2017.09.011

Fig. 9. Structure analysis of optimum design.
9J.-c. Lee et al. / International Journal of Naval Architecture and Ocean Engineering xx (2017) 1e9
+ MODEL
Acknowledgment
This work was supported by the 'Software ConvergenceTechnology Development Program', through the Ministry ofScience and ICT (S0503-17-1001) and the National ResearchFoundation of Korea (NRF) grant funded by the Korea gov-ernment (MSIT) through GCRC-SOP (No. 2011-0030013).
References
Chen, J., Wei, J., Jiang, W., 2016. Optimization of a twin-skeg container vessel
by parametric design and CFD simulations. Int. J. Nav. Archit. Ocean. Eng.
8 (5), 446e474.Deb, K., 2002. A fast and elitist multiobjective genetic algorithm: NSGA-II.
IEEE TRAN. E. C 6 (2), 182e197.
Grigoropoulos, G.J., Chalkias, D.S., 2010. Hull-form optimisation in calm and
rough water. Computer-Aided Des. 42, 977e984.Halder, P., Rhee, S.H., Samad, A., 2017. Numerical optimization of Wells
turbine for wave energy extraction. Int. J. Nav. Archit. Ocean. Eng. 1 (9),
11e24.Hong, K.J., Jeon, K.K., Cho, Y.S., Choi, D.H., Lee, S.J., 2000. A study on the
construction of response surfaces for design optimization. Trans. Korea
Soc. Mech. Eng. A 24 (6), 1408e1418.
Jung, S.P., Kim, Y.G., Park, T.W., 2012. A study on thermal characteristic
analysis and shape optimization of a ventilated disc. Int. J. Precis. Eng.
Manuf. 13 (1), 57e63.
Please cite this article in press as: Lee, Jae-chul, et al., A study on multi-objective
Architecture and Ocean Engineering (2017), https://doi.org/10.1016/j.ijnaoe.2017
Kahraman, F., 2009. The use of response surface methodology for prediction
and analysis of surface roughness of AISI 4140 steel. Mater. Technol.
MTAEC9 43 (5), 267e270.
Kim, H.J., Chun, H.H., Choi, H.J., 2007. Development of CFD based stern
form optimization method. J. Soc. Nav. Archit. Korea 44 (6), 564e571.Ko,D.H.,Ko,D.C., Lim,H.J., Lee, J.M.,Kim,B.M., 2013. FE-simulation coupled
with CFD analysis for prediction of residual stresses relieved by cryogenic
heat treatment of Al6061 tube. Int. J. Precis. Eng. Manuf. 14 (8), 1301e1309.Lee, J.C., Jeong, J.H., Shin, S.C., 2014a. A study on prediction method for
added resistance in waves using the genetic programming. In: Proceedings
of the Annual Autumn Conference. SNAK, pp. 482e490.
Lee, S.S., Lee, J.C., Shin, S.C., Kim, S.Y., Yoon, H.S., 2014b. A study on
optimization of ship hull form based on neuro-response surface method
(NRSM). J. Mar. Sci. Technol. 22 (6), 746e753.
Lee, J.C., 2015. Application of Multi-objective Optimization for Marine
Systems Using NRSM. Thesis for the degree of Doctor of Philosophy.
Pusan National University.
Lee, J.C., Jeong, J.H., Kharoufi, H., Shin, S.C., 2016. A study on a multi-
objective optimization method based on neuro-response surface method
(NRSM), 2016. Int. Conf. Des. Eng. Sci. (ICDES) 52. https://doi.org/
10.1051/matecconf/20165202002.
Lee, Y.S., Choi, Y.B., 2009. Hull form optimisation based on form parameter
design. J. Soc. Nav. Archit. Korea 46 (6), 562e568.Li, Z.Z., Cheng, T.H., Xuan, D.J., Ren, M., Shen, G.Y., Shen, Y.D., 2012.
Optimal design for cooling system of batteries using DOE and RSM. Int. J.
Precis. Eng. Manuf. 13 (9), 1641e1645.
Mayers, R.H., Montgomery, D.C., 1995. Response Surface Methodology eProcess and Product Optimization Using Designed Experiments. John
Wiley & Sons.
Park, J.H., Choi, J.E., Chun, H.H., 2015. Hull-form optimisation of KSUEZ-
MAX to enhance resistance performance. Int. J. Nav. Archit. Ocean. Eng.
7, 100e114.
Robert, H.N., 1989. Theory of the back-propagation neural network. IJCNN 1,
593e605.Ross, P.J., 1996. Taguchi Techniques for Quality Engineering 2nd. McGraw-
Hill.
Salman, J.M., 2014. Optimization of preparation conditions for activated
carbon from palm oil fronds using response surface methodology on
removal of pesticides from aqueous solution. Arab. J. Chem. 7 (1),
101e106.
Sankaya, M., Gullu, A., 2014. Taguchi design and response surface method-
ology based analysis of machining parameters in CNC turning under
MQL. J. Clean. Prod. 65, 604e616.
Shin, S.C., 2007. A study on prediction of wake distribution by neuro-fuzzy
system. Int. J. Fuzzy Log. Intell. Syst. 17 (2), 154e159.Xu, J.H., 2011. Application of artificial neural network (ANN) for prediction
of maritime safety. Inf. Manag. Eng. Commun. Comput. Inf. Sci. 236,
34e38.
Yu, J.W., Lee, C.M., Lee, I.W., Choi, J.E., 2017. Bow hull-form optimization
in waves of a 66,000 DWT bulk carrier. Int. J. Nav. Archit. Ocean. Eng.
1e10. ISSN 2092-6782.
Zhang, P., 2008. Parametric approach to design of hull forms.
J. Hydrodynamics 20 (6), 804e810.
optimal design of derrick structure: Case study, International Journal of Naval
.09.011


![Research on Key Problems of Multi-objective …...suitable for solving multi-objective optimization problems, and from the birth of the multi-objective evolutionary algorithm [4]](https://img.pdfslide.us/doc/110x75/5fdea634eea5627aa25b2fca/research-on-key-problems-of-multi-objective-suitable-for-solving-multi-objective.jpg)