Embed Size (px)
Citation preview

Special Issue, February 2019 for National Conference On Technology Enabled Teaching And Learning In
Higher Education, School of Management Studies, VISTAS, Chennai, India
International Journal of Research in Engineering, IT and Social Sciences, ISSN 2250-0588 Page 275
http://indusedu.org
A Study on Investors Preference towards
Investment Avenues
Dr. J. Jamuna Rani (Asst.Professor, KCS Kasi Nadar College of Arts and Science, Chennai, Tamilnadu, India)
ABSTRACT
Now a day there is plenty of investment opportunities available in the market and one must
decide on the suitable among those investments. The person who deals with the investment
must be familiar with all the diverse investment opportunities to attain their goal. Moreover
the investment decision of the individuals to a great extent influenced by the benefits they
derived on a particular investment. This study aims to identify the relationship between the
demographic variable of the respondents and the investor’s choice among the investment
avenues. The sample size selected for this study was one hundred respondents and was
conveniently selected from the Chennai city. The structured questionnaires were used to
collect the data. The data collected through the questionnaire were analyzed using SPSS
version 21. The study found that among the various investment avenues the most preferred
type of investment by the investors of Chennai city is Land & building and gold.
Keywords: Investors, Investment avenues, Choice of investment, Investors preference
INTRODUCTION
Finance is the life blood for every organisation, it is not only important for the organisation it
is must for the survival of an individual. The management of finance is known as financial
management. One of the important functions of financial management is investment decision.
Special Issue, February 2019 for National Conference On Technology Enabled Teaching And Learning In
Higher Education, School of Management Studies, VISTAS, Chennai, India
International Journal of Research in Engineering, IT and Social Sciences, ISSN 2250-0588 Page 276
http://indusedu.org
Investment decision is nothing but the selection of type of assets in which the funds can be
invested in order to get maximum return out of it.
The economic development of the country also depends upon the investment of the nation.
Therefore Savings and Investments form an essential element of human life. Investment
refers to the employment of money with a plan to earn a productive return from it. In other
words, investment is a practice, where funds are being utilized with an expectation of making
more money. Among the investment alternatives, it is the responsibility of the investor to
make an analysis before choosing the investment avenue.
Investment means, an application of funds on assets with an intention to earn income or
capital appreciation. The two main factors that influence the investment decisions are time
and risk. An Investment is defined as “commitment of current financial resources in order to
achieve higher gains in the future”. An investor is a person who employs money in
investment products with the expectation of financial return in future.
There are wide-range of investment opportunities to the investors, which poses a challenging
questions like, why, where, how, how much and when to invest. Hence, an investment
involves difficult decision making process. The return on such investment depends on the
investor’s preference towards various investment avenues, his/her ability to take risk and also
on his/her demographic characteristics. Hence this study focused on the variables which
determine the investment avenues.
REVIEW OF LITERATURE
Rakesh H M, Dr. Nalina K B (2017) identified in their study, that the return expectations,
demographic profile, attitude of investor, risk perception plays a very important role in
financial markets.

Special Issue, February 2019 for National Conference On Technology Enabled Teaching And Learning In
Higher Education, School of Management Studies, VISTAS, Chennai, India
International Journal of Research in Engineering, IT and Social Sciences, ISSN 2250-0588 Page 277
http://indusedu.org
Sood, D., & Kaur (2015) found in their study that there is a relationship between the Annual
Savings and Age, Income, Sector wise Employment, Education of people at Chandigarh. It is
also identified that the most preferred investment options are LIC and bank deposits. Most
important factors which influence the investment decisions were high returns, tax benefit and
safety.
Agarwal, G., & Jain, M. (2013) found that if the investors have been provided more funds,
then they would like to invest in Real Estates because of its rapid growth. The study
concluded that the Real Estate is the most preferred investment avenue by the investors of
Mathura.
Bhushan, P., & Medury, Y. (2013) suggested that significant gender differences occur in the
investment preferences of health insurance, fixed deposits and the market investments of
employees.
Geetha, N., & Ramesh, M. (2011) in their study entitled “A study on people’s preferences in
Investment Behaviour” concluded that in Kurumbalur, the respondents are having medium
awareness about the various investment choices but they do not aware about the stock
market, equity, bonds and debentures.
Mittal, M., & Vyas, R. K. (2007) found that an individual investor prefers to invest in
financial products which gives risk free returns.
Research gap
Reviews of past researches indicate that returns expectation, demographic profile, attitude of
investor, risk perception plays a very important role in financial markets. Therefore, an
attempt has been made to study the most preferred form of investment by the investors’ to get
a better understanding and to identify the different investment avenues.
Special Issue, February 2019 for National Conference On Technology Enabled Teaching And Learning In
Higher Education, School of Management Studies, VISTAS, Chennai, India
International Journal of Research in Engineering, IT and Social Sciences, ISSN 2250-0588 Page 278
http://indusedu.org
OBJECTIVES OF THE STUDY
To ascertain the Investment Avenue preferred by the investors.
To identify whether demographic variables of the respondents influence the choice of
investment.
SCOPE OF THE STUDY
The empirical study attempts to know the profile of investors and analyze the characteristics of the
investors. The present study tried to identify the influence of demographic factors like gender, age,
occupation and income on investment choice. The study restricted to selected investment products.
RESEARCH METHODOLOGY
Sample size: The survey was carried out in Chennai city during the period from January to
march 2018.The data was collected from 100 respondents of Chennai city.
Sampling Technique: The study adopted convenience sampling method.
Data collection: The structured questionnaire helps to collect primary data and to interact
with the respondents. Beforehand a pilot test of the questionnaire was done with 30
respondents. Their opinions were incorporated in the final questionnaire.
Data Analysis Technique: The data collected was analysed using Statistical Package for the
Social Sciences (SPSS) version21. The statistical tool used in the study was chi-square test.
RESEARCH HYPOTHESES
H0: Age group of the investors do not influence the choice of investment avenues.
Special Issue, February 2019 for National Conference On Technology Enabled Teaching And Learning In
Higher Education, School of Management Studies, VISTAS, Chennai, India
International Journal of Research in Engineering, IT and Social Sciences, ISSN 2250-0588 Page 279
http://indusedu.org
H0: Gender difference of the respondents does not influence the choice of investment
avenues.
H0: Nature of occupation of the investors does not influence the choice of investment
avenues.
H0: Income of the investors does not influence the choice of investment avenues.
DATA ANALYSIS AND DISCUSSION
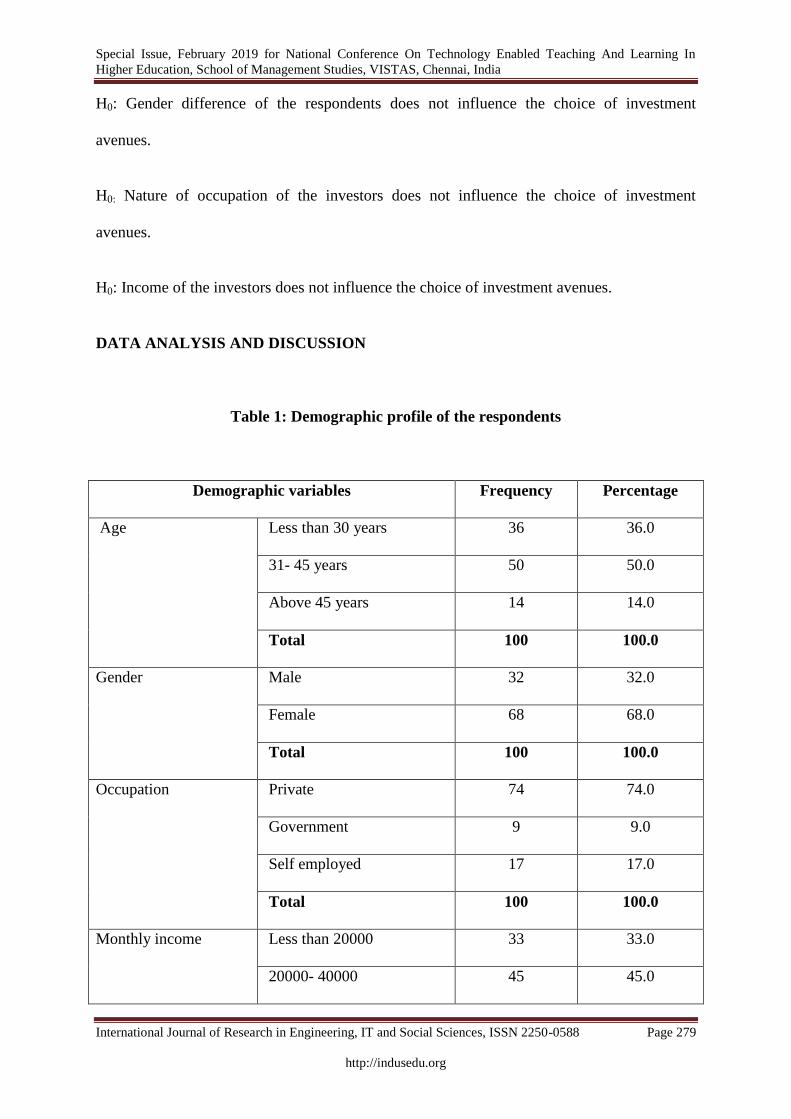
Table 1: Demographic profile of the respondents
Demographic variables Frequency Percentage
Age Less than 30 years 36 36.0
31- 45 years 50 50.0
Above 45 years 14 14.0
Total 100 100.0
Gender Male 32 32.0
Female 68 68.0
Total 100 100.0
Occupation Private 74 74.0
Government 9 9.0
Self employed 17 17.0
Total 100 100.0
Monthly income Less than 20000 33 33.0
20000- 40000 45 45.0
Special Issue, February 2019 for National Conference On Technology Enabled Teaching And Learning In
Higher Education, School of Management Studies, VISTAS, Chennai, India
International Journal of Research in Engineering, IT and Social Sciences, ISSN 2250-0588 Page 280
http://indusedu.org
40001-60000 9 9.0
Above 60000 13 13.0
Total 100 100.0
Source: Compiled by the researcher.
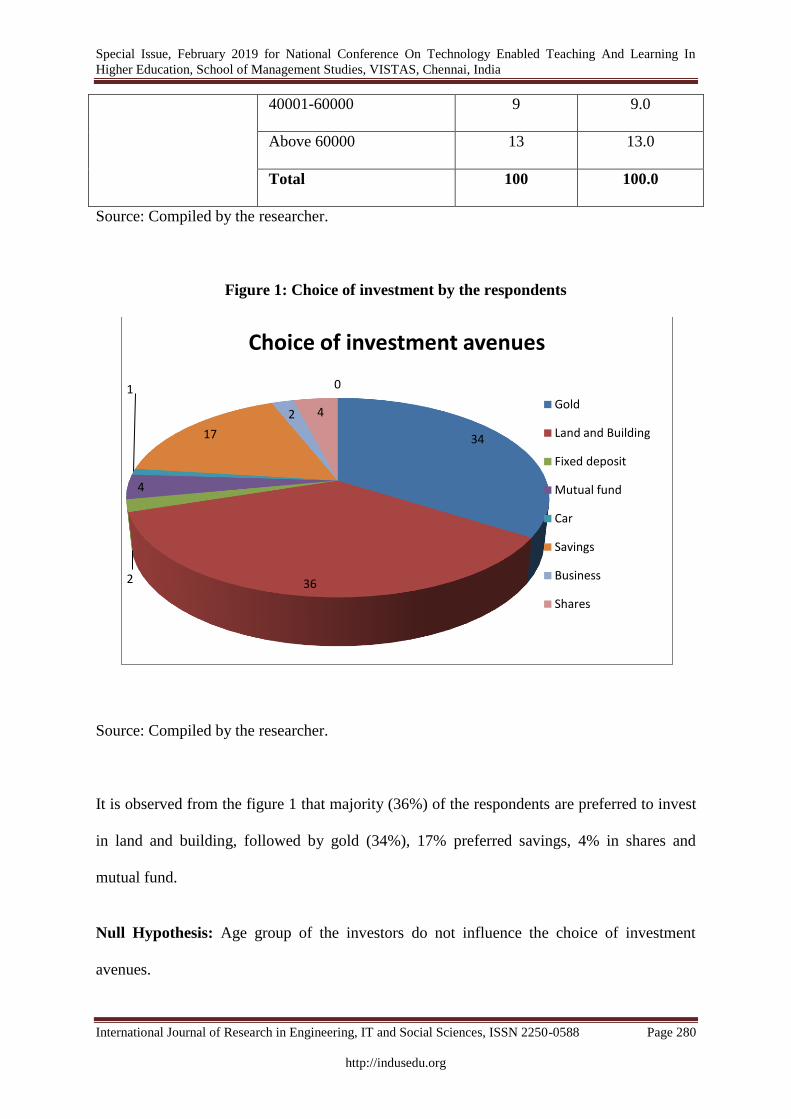
Figure 1: Choice of investment by the respondents
Source: Compiled by the researcher.
It is observed from the figure 1 that majority (36%) of the respondents are preferred to invest
in land and building, followed by gold (34%), 17% preferred savings, 4% in shares and
mutual fund.
Null Hypothesis: Age group of the investors do not influence the choice of investment
avenues.
34
36 2
4
1
17
2 4
0
Choice of investment avenues
Gold
Land and Building
Fixed deposit
Mutual fund
Car
Savings
Business
Shares
Special Issue, February 2019 for National Conference On Technology Enabled Teaching And Learning In
Higher Education, School of Management Studies, VISTAS, Chennai, India
International Journal of Research in Engineering, IT and Social Sciences, ISSN 2250-0588 Page 281
http://indusedu.org
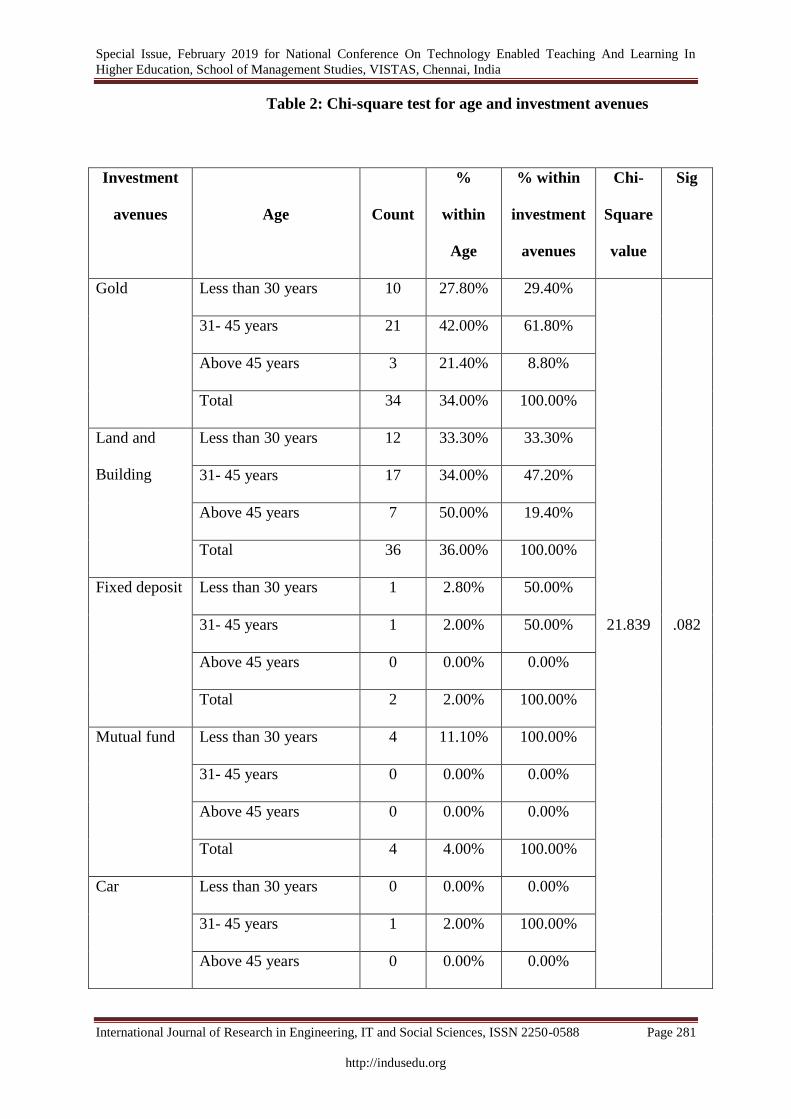
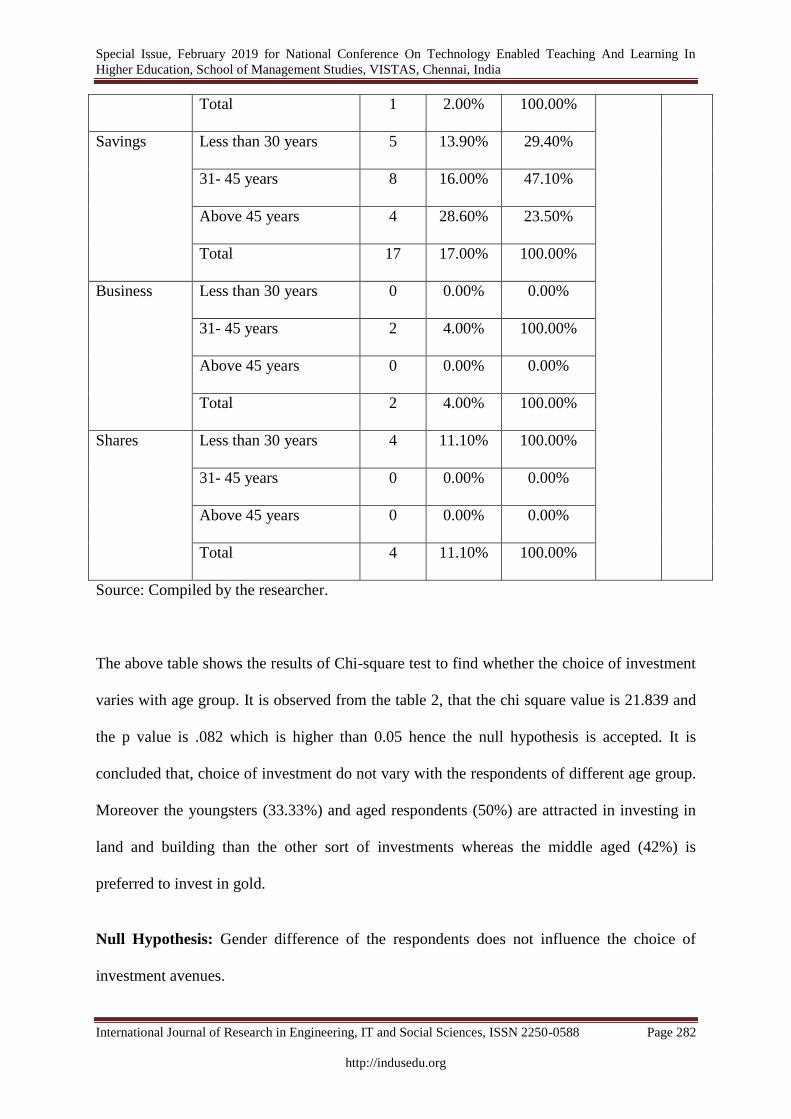
Table 2: Chi-square test for age and investment avenues
Investment
avenues Age Count
%
within
Age
% within
investment
avenues
Chi-
Square
value
Sig
Gold Less than 30 years 10 27.80% 29.40%
21.839 .082
31- 45 years 21 42.00% 61.80%
Above 45 years 3 21.40% 8.80%
Total 34 34.00% 100.00%
Land and
Building
Less than 30 years 12 33.30% 33.30%
31- 45 years 17 34.00% 47.20%
Above 45 years 7 50.00% 19.40%
Total 36 36.00% 100.00%
Fixed deposit Less than 30 years 1 2.80% 50.00%
31- 45 years 1 2.00% 50.00%
Above 45 years 0 0.00% 0.00%
Total 2 2.00% 100.00%
Mutual fund Less than 30 years 4 11.10% 100.00%
31- 45 years 0 0.00% 0.00%
Above 45 years 0 0.00% 0.00%
Total 4 4.00% 100.00%
Car Less than 30 years 0 0.00% 0.00%
31- 45 years 1 2.00% 100.00%
Above 45 years 0 0.00% 0.00%
Special Issue, February 2019 for National Conference On Technology Enabled Teaching And Learning In
Higher Education, School of Management Studies, VISTAS, Chennai, India
International Journal of Research in Engineering, IT and Social Sciences, ISSN 2250-0588 Page 282
http://indusedu.org
Total 1 2.00% 100.00%
Savings Less than 30 years 5 13.90% 29.40%
31- 45 years 8 16.00% 47.10%
Above 45 years 4 28.60% 23.50%
Total 17 17.00% 100.00%
Business Less than 30 years 0 0.00% 0.00%
31- 45 years 2 4.00% 100.00%
Above 45 years 0 0.00% 0.00%
Total 2 4.00% 100.00%
Shares Less than 30 years 4 11.10% 100.00%
31- 45 years 0 0.00% 0.00%
Above 45 years 0 0.00% 0.00%
Total 4 11.10% 100.00%
Source: Compiled by the researcher.
The above table shows the results of Chi-square test to find whether the choice of investment
varies with age group. It is observed from the table 2, that the chi square value is 21.839 and
the p value is .082 which is higher than 0.05 hence the null hypothesis is accepted. It is
concluded that, choice of investment do not vary with the respondents of different age group.
Moreover the youngsters (33.33%) and aged respondents (50%) are attracted in investing in
land and building than the other sort of investments whereas the middle aged (42%) is
preferred to invest in gold.
Null Hypothesis: Gender difference of the respondents does not influence the choice of
investment avenues.
Special Issue, February 2019 for National Conference On Technology Enabled Teaching And Learning In
Higher Education, School of Management Studies, VISTAS, Chennai, India
International Journal of Research in Engineering, IT and Social Sciences, ISSN 2250-0588 Page 283
http://indusedu.org
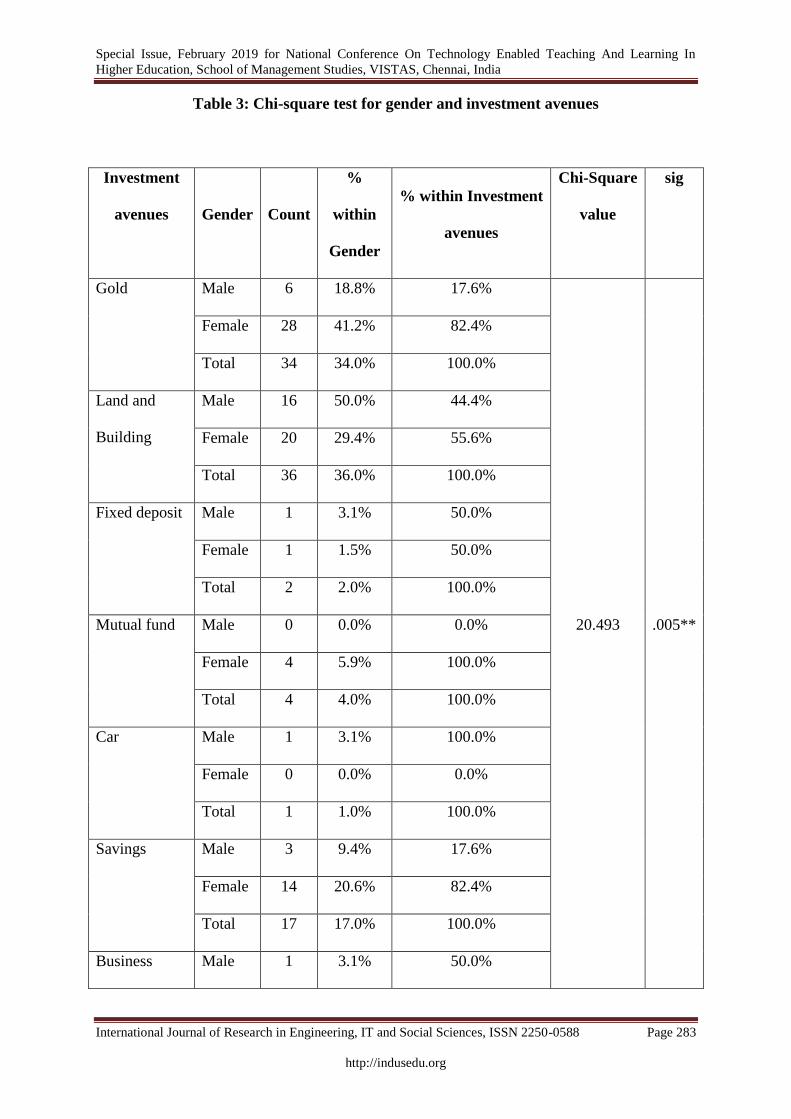
Table 3: Chi-square test for gender and investment avenues
Investment
avenues Gender Count
%
within
Gender
% within Investment
avenues
Chi-Square
value
sig
Gold Male 6 18.8% 17.6%
20.493 .005**
Female 28 41.2% 82.4%
Total 34 34.0% 100.0%
Land and
Building
Male 16 50.0% 44.4%
Female 20 29.4% 55.6%
Total 36 36.0% 100.0%
Fixed deposit Male 1 3.1% 50.0%
Female 1 1.5% 50.0%
Total 2 2.0% 100.0%
Mutual fund Male 0 0.0% 0.0%
Female 4 5.9% 100.0%
Total 4 4.0% 100.0%
Car Male 1 3.1% 100.0%
Female 0 0.0% 0.0%
Total 1 1.0% 100.0%
Savings Male 3 9.4% 17.6%
Female 14 20.6% 82.4%
Total 17 17.0% 100.0%
Business Male 1 3.1% 50.0%
Special Issue, February 2019 for National Conference On Technology Enabled Teaching And Learning In
Higher Education, School of Management Studies, VISTAS, Chennai, India
International Journal of Research in Engineering, IT and Social Sciences, ISSN 2250-0588 Page 284
http://indusedu.org
Female 1 1.5% 50.0%
Total 2 2.0% 100.0%
Shares Male 4 12.5% 100.0%
Female 0 0.0% 0.0%
Total 4 12.5% 100.0%
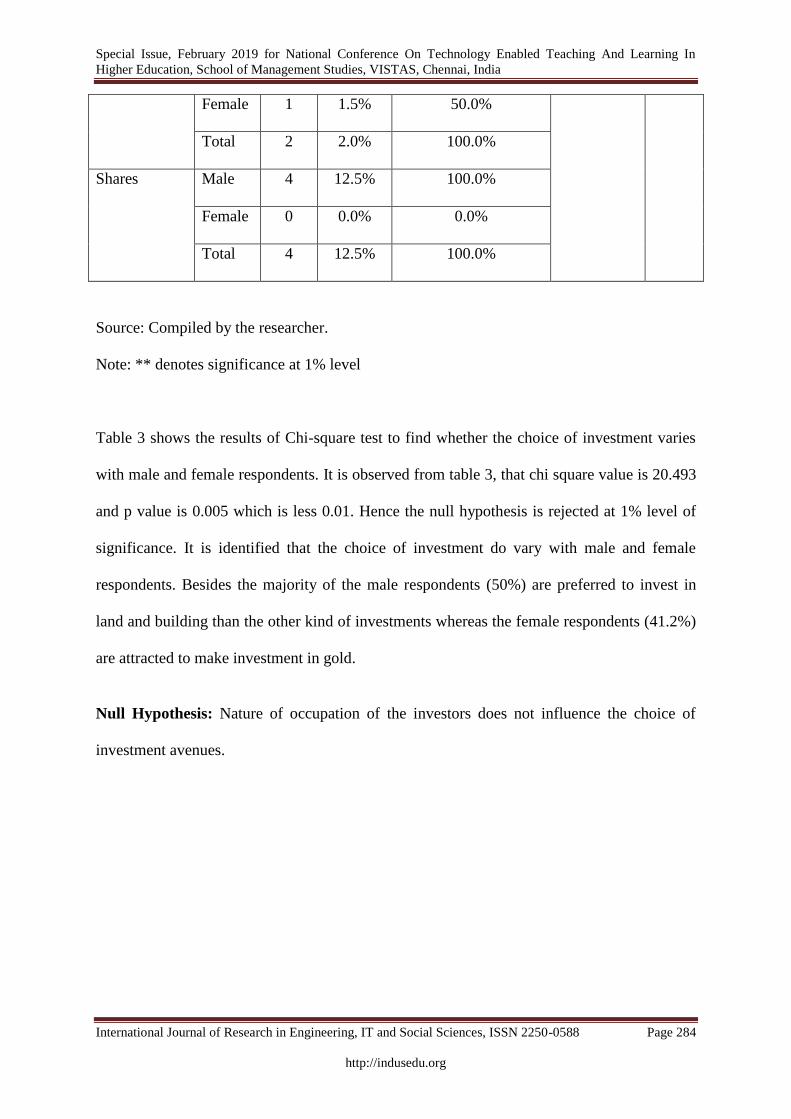
Source: Compiled by the researcher.
Note: ** denotes significance at 1% level
Table 3 shows the results of Chi-square test to find whether the choice of investment varies
with male and female respondents. It is observed from table 3, that chi square value is 20.493
and p value is 0.005 which is less 0.01. Hence the null hypothesis is rejected at 1% level of
significance. It is identified that the choice of investment do vary with male and female
respondents. Besides the majority of the male respondents (50%) are preferred to invest in
land and building than the other kind of investments whereas the female respondents (41.2%)
are attracted to make investment in gold.
Null Hypothesis: Nature of occupation of the investors does not influence the choice of
investment avenues.
Special Issue, February 2019 for National Conference On Technology Enabled Teaching And Learning In
Higher Education, School of Management Studies, VISTAS, Chennai, India
International Journal of Research in Engineering, IT and Social Sciences, ISSN 2250-0588 Page 285
http://indusedu.org
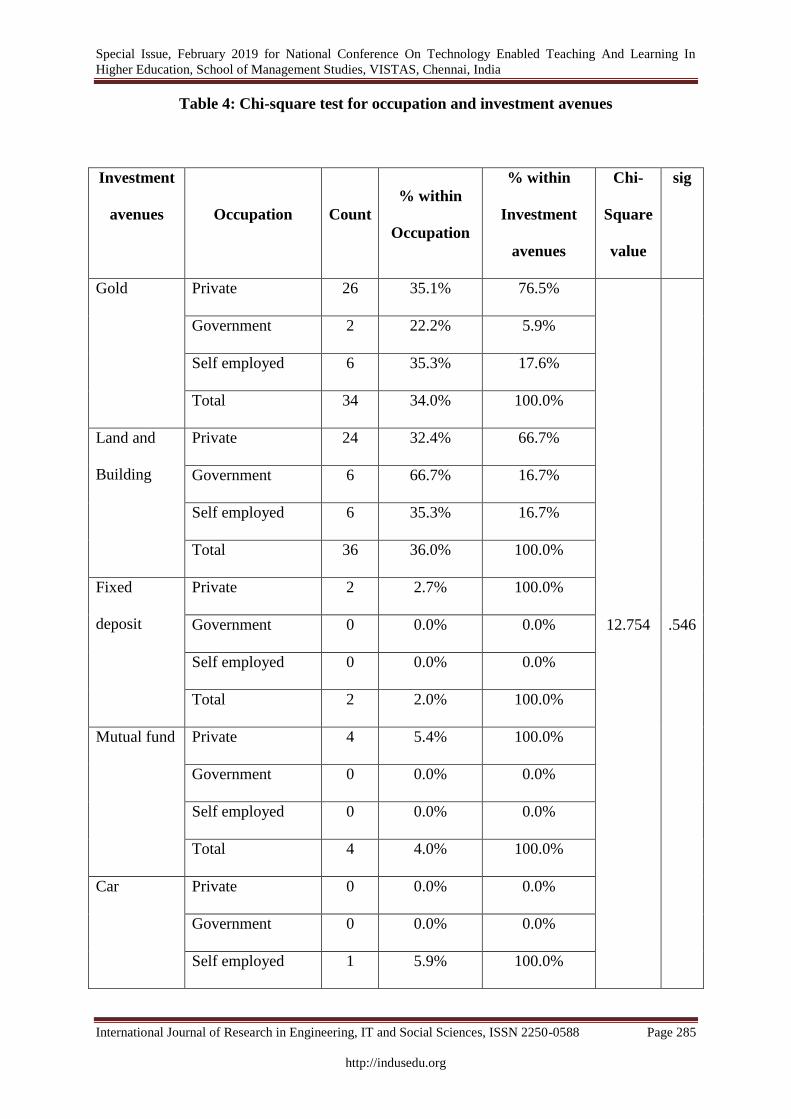
Table 4: Chi-square test for occupation and investment avenues
Investment
avenues Occupation Count
% within
Occupation
% within
Investment
avenues
Chi-
Square
value
sig
Gold Private 26 35.1% 76.5%
12.754 .546
Government 2 22.2% 5.9%
Self employed 6 35.3% 17.6%
Total 34 34.0% 100.0%
Land and
Building
Private 24 32.4% 66.7%
Government 6 66.7% 16.7%
Self employed 6 35.3% 16.7%
Total 36 36.0% 100.0%
Fixed
deposit
Private 2 2.7% 100.0%
Government 0 0.0% 0.0%
Self employed 0 0.0% 0.0%
Total 2 2.0% 100.0%
Mutual fund Private 4 5.4% 100.0%
Government 0 0.0% 0.0%
Self employed 0 0.0% 0.0%
Total 4 4.0% 100.0%
Car Private 0 0.0% 0.0%
Government 0 0.0% 0.0%
Self employed 1 5.9% 100.0%
Special Issue, February 2019 for National Conference On Technology Enabled Teaching And Learning In
Higher Education, School of Management Studies, VISTAS, Chennai, India
International Journal of Research in Engineering, IT and Social Sciences, ISSN 2250-0588 Page 286
http://indusedu.org
Total 1 1.0% 100.0%
Savings Private 12 16.2% 70.6%
Government 1 11.1% 5.9%
Self employed 4 23.5% 23.5%
Total 17 17.0% 100.0%
Business Private 2 2.7% 100.0%
Government 0 0.0% 0.0%
Self employed 0 0.0% 0.0%
Total 2 2.0% 100.0%
Shares Private 4 5.4% 100.0%
Government 0 0.0% 0.0%
Self employed 0 0.0% 0.0%
Total 4 4.0% 100.0%
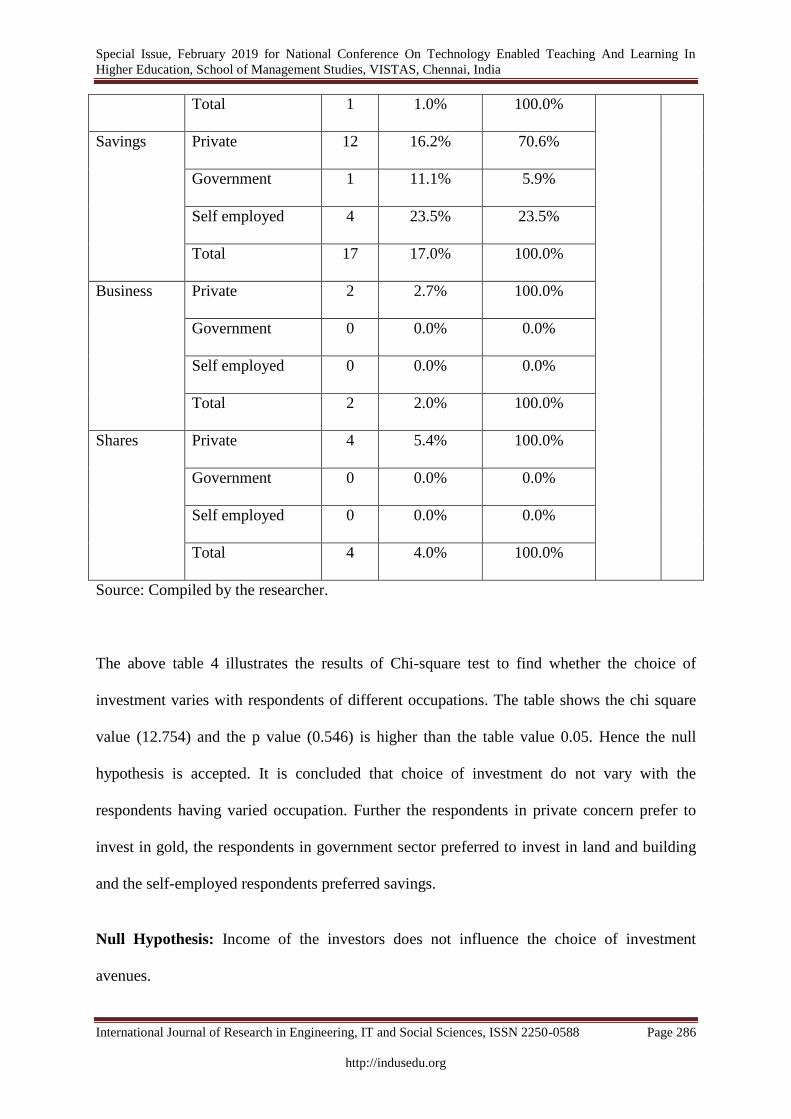
Source: Compiled by the researcher.
The above table 4 illustrates the results of Chi-square test to find whether the choice of
investment varies with respondents of different occupations. The table shows the chi square
value (12.754) and the p value (0.546) is higher than the table value 0.05. Hence the null
hypothesis is accepted. It is concluded that choice of investment do not vary with the
respondents having varied occupation. Further the respondents in private concern prefer to
invest in gold, the respondents in government sector preferred to invest in land and building
and the self-employed respondents preferred savings.
Null Hypothesis: Income of the investors does not influence the choice of investment
avenues.
Special Issue, February 2019 for National Conference On Technology Enabled Teaching And Learning In
Higher Education, School of Management Studies, VISTAS, Chennai, India
International Journal of Research in Engineering, IT and Social Sciences, ISSN 2250-0588 Page 287
http://indusedu.org
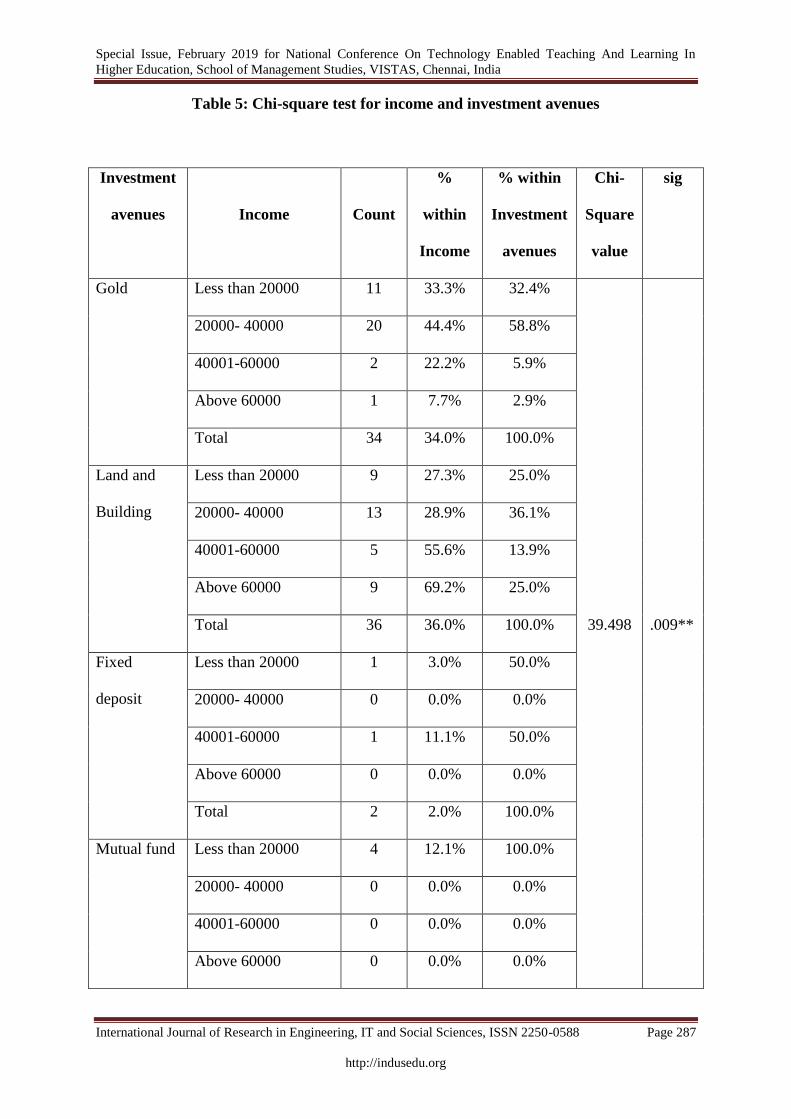
Table 5: Chi-square test for income and investment avenues
Investment
avenues Income Count
%
within
Income
% within
Investment
avenues
Chi-
Square
value
sig
Gold Less than 20000 11 33.3% 32.4%
39.498 .009**
20000- 40000 20 44.4% 58.8%
40001-60000 2 22.2% 5.9%
Above 60000 1 7.7% 2.9%
Total 34 34.0% 100.0%
Land and
Building
Less than 20000 9 27.3% 25.0%
20000- 40000 13 28.9% 36.1%
40001-60000 5 55.6% 13.9%
Above 60000 9 69.2% 25.0%
Total 36 36.0% 100.0%
Fixed
deposit
Less than 20000 1 3.0% 50.0%
20000- 40000 0 0.0% 0.0%
40001-60000 1 11.1% 50.0%
Above 60000 0 0.0% 0.0%
Total 2 2.0% 100.0%
Mutual fund Less than 20000 4 12.1% 100.0%
20000- 40000 0 0.0% 0.0%
40001-60000 0 0.0% 0.0%
Above 60000 0 0.0% 0.0%
Special Issue, February 2019 for National Conference On Technology Enabled Teaching And Learning In
Higher Education, School of Management Studies, VISTAS, Chennai, India
International Journal of Research in Engineering, IT and Social Sciences, ISSN 2250-0588 Page 288
http://indusedu.org
Total 4 4.0% 100.0%
Car Less than 20000 0 0.0% 0.0%
20000- 40000 0 0.0% 0.0%
40001-60000 1 11.1% 100.0%
Above 60000 0 0.0% 0.0%
Total 1 1.0% 100.0%
Savings Less than 20000 7 21.2% 41.2%
20000- 40000 8 17.8% 47.1%
40001-60000 0 0.0% 0.0%
Above 60000 2 15.4% 11.8%
Total 17 17.0% 100.0%
Business Less than 20000 1 3.0% 50.0%
20000- 40000 1 2.2% 50.0%
40001-60000 0 0.0% 0.0%
Above 60000 0 0.0% 0.0%
Total 2 2.0% 100.0%
Shares Less than 20000 0 0.0% 0.0%
20000- 40000 3 6.7% 75.0%
40001-60000 0 0.0% 0.0%
Above 60000 1 7.7% 25.0%
Total 4 4.0% 100.0%
Source: Compiled by the researcher.
Note: ** denotes significance at 1% level
Special Issue, February 2019 for National Conference On Technology Enabled Teaching And Learning In
Higher Education, School of Management Studies, VISTAS, Chennai, India
International Journal of Research in Engineering, IT and Social Sciences, ISSN 2250-0588 Page 289
http://indusedu.org
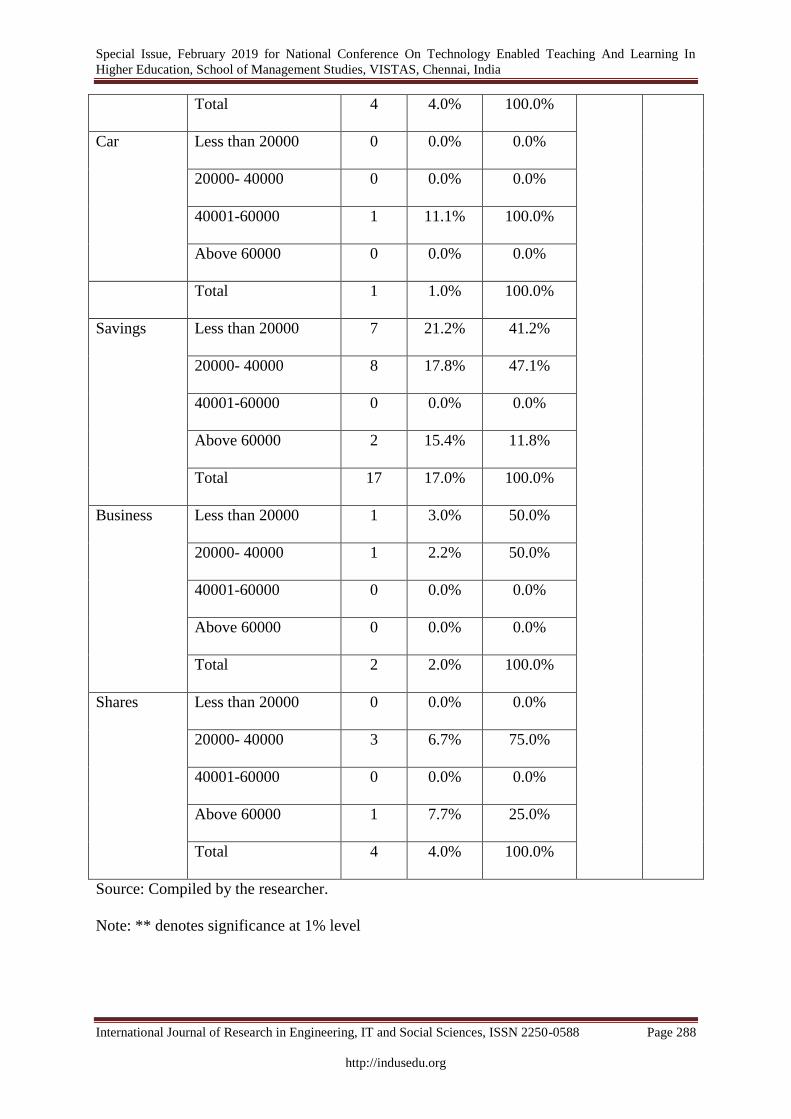
Table 5 portrays the Chi-square test results to find whether the choice of investment varies
with respondents of different income group. It is observed from the table 5 that chi square
value (39.498) and the p value (0.009) are less than the table value 0.01. Hence the null
hypothesis is rejected at 1% level of significance. The analysis proved that the choice of
investment do vary with respondents of different income group. Besides, the low income
group and Rs. 20000-40000 income groups preferred to invest in gold and 40000-60000 and
more than 60000 income group preferred to invest in land and buildings.
RESULTS AND DISCUSSION
The study ascertained that on the whole the respondents preferred to invest in land,
building and gold.
It is identified that majority of the youngsters and aged respondents intent to invest in
land and building and the middle aged respondents invest in gold.
It also found that the male preferred to invest in land and building whereas female is
attracted to buy gold.
The respondents working in private concern wish to invest in gold, the respondents in
government sector favoured to invest in land and building and the self-employed
respondents preferred savings.
Low income group desired to buy gold and high income group wished to invest in
land and building.
General awareness is to be created among all the age group people regards to varied
investment avenues.
Respondents who have less knowledge in investment must be properly guided to
make investment.
Special Issue, February 2019 for National Conference On Technology Enabled Teaching And Learning In
Higher Education, School of Management Studies, VISTAS, Chennai, India
International Journal of Research in Engineering, IT and Social Sciences, ISSN 2250-0588 Page 290
http://indusedu.org
Extra care and support is required to make investment and hence proper information
sharing by companies, periodic market assessment, and company quality is to be
informed to investors every now and then.
Investment in mutual fund is comparatively less and hence information is to be
provided to investors about the benefits of mutual funds investments.
CONCLUSION
From the above study the researcher concluded that the demographic variables namely gender
and income of the respondents plays a very important role in determining the choice of
investment. The other variables such as age and occupation do not influence the respondents’
choice towards the investment avenues. The researcher also found that even though there
exist plenty of investment avenues the majority of the investors preferred to invest either in
land and building or in gold, this shows their lack of knowledge and awareness with regards
to other investment avenues. Henceforth Investors must be educated to read and be aware of
market situation through magazines and news papers about the trends of investment.
REFERENCES
Agarwal, G., & Jain, M. (2013). Investor’s Preference towards Mutual Fund in
comparison to other Investment Avenues. Journal of Indian Research, 1(4), 115-131.
Bhushan, P., & Medury, Y. (2013). Gender differences in investment behaviour
among employees. Asian Journal of Research in Business Economics and
Management, 3(12), 147.
Geetha, N., & Ramesh, M. (2011). A study on people’s preferences in Investment
Behaviour. International Journal of Engineering and Management Research, 1(6), 1-
10.
Special Issue, February 2019 for National Conference On Technology Enabled Teaching And Learning In
Higher Education, School of Management Studies, VISTAS, Chennai, India
International Journal of Research in Engineering, IT and Social Sciences, ISSN 2250-0588 Page 291
http://indusedu.org
Mittal, M., & Vyas, R. K. (2007). Demographics and investment choice among Indian
investors. ICFAI Journal of Behavioural Finance, 4(2), 12-20.
Rakesh, H. M., & Nalina, K. B. (2017). Individual Investors’ Behaviour: A Review of
Indian Empirical Evidences. International Journal of Advancement In Engineering
Technology, Management and Applied Science (IJAETMAS), 5, 213-223.
Sood, D., & Kaur(2015), N. A Study of Saving and Investment Pattern of Salaried
Class People with Special Reference to Chandigarh (India). International Journal of
Research in Engineering, IT & Social Sciences, 5(2), 1-15.
Sultana, S. T. (2010). An empirical study of Indian individual investors’
behavior. Global journal of finance and management, 2(1), 19-33.
WEBSITES
shodhganga.inflibnet.ac.in
www.rajalakshmi.org
mujournal.mewaruniversity.in
oenb.at
gtuelibrary.edu.in
www.jitbm.com
pezzottaitejournals.net
www.zahiruddinarif.yolasite.com
www.health.gov.sk.ca
www.scribd.com
www.socialresearchfoundation.com
baadalsg.inflibnet.ac.in