Embed Size (px)
Citation preview

A Study on
INDIAN AIRLINE INDUSTRY
Management Research Project -I
Submitted
In the partial fulfillment of the Degree of
Master of Business Administration
Semester-III
By
Patel Dixit K. (12044311084) (F)
Patel Vimal V. (12044311117) (F)
Patel Vipul J. (12044311118) (F)
Parmar Jayesh V. (12044311060) (M)
Sandeep Paul (12044311145) (M)
Zaloriya Kalpesh S. (12044311163) (M)
Under the Guidance of:
Prof. (Dr.) Mahendra Sharma
Prof. & Head,
V. M. Patel Institute of Management.
&
Prof. Harsha Jariwala, Asst. Professor
Prof. Abhishek Parikh, Asst. Professor
V. M. Patel Institute of Management.
Submitted To:
V. M. Patel Institute of Management,
Ganpat University,
Kherva.
(November-2013)

CERTIFICATE BY THE GUIDE
This is to certify that the contents of this report entitled “A STUDY OF INDIAN AIRLINE
INDUSTRY by Patel Dixit K.(084), Patel Vimal V. (117), Patel Vipul J. (118), Parmar Jayesh V.
(060), Sandeep Paul (145), Zaloriya Kalpesh S. (163) submitted to V. M. Patel Institute of
Management for the Award of Master of Business Administration (MBA Semester -III) is original
research work carried out by them under my supervision.
This report has not been submitted either partly or fully to any other University or Institute for award
of any degree or diploma.
Date:
Place: Prof. (Dr.) Mahendra Sharma,
Professor & Head,
V. M. Patel Institute of Management,
Ganpat University.
Kherva.

CANDIDATE’S STATEMENT
We hereby declare that the work incorporated in this report entitled “A STUDY OF INDIAN
AIRLINE INDUSTRY” in partial fulfillment of the requirements for the award of Master of Business
Administration (Semester - III) is the outcome of original study undertaken by us and it has not been
submitted earlier to any other University or Institution for the award of any Degree or Diploma.
Date :
Place :
Patel Dixit K. (12044311084)
Patel Vimal V. (12044311117)
Patel Vipul J. (12044311118)
Parmar Jayesh V. (12044311060)
Sandeep Paul (12044311145)
Zaloriya Kalpesh S. (12044311163)

i
PREFACE
Industrial activity plays an important role in economic development of our country. The knowledge
of present market scenario is very much essential and keeping that in view, our college gave us a
very good opportunity of industrial interaction in terms of Management Research Project-I.
As a part of Our Academic requirement of MBA program, we have selected INDIAN AIRLINE
INDUSTRY as the industry to be analyzed under the subject named MRP-1. The reason to choose
Airline Industry is very obvious. One, that industry has very interesting history and background. It is
concerned with basic Infrastructure development as well as continuous changing advanced
technology. Secondly, it has opportunistic future and directly impact on economy. Industry has a
very rich area of analyzing. Through this kind of Industry Analysis we can have good exercise of
learning and also help us to understand current trend of industry with its all-possible dimensions.
The report covers all the landmark changes in Airline industry and competitive markets being driven
by globalization and Internet technology. It would also provide you the idea of analyzing, crafting,
formulating, evaluating, implementing and executing business strategies related to the Airline
Industry in today’s volatile markets.

ii
ACKNOWLEDGEMENT
We the students of Management at V.M.Patel Institute of Management, Ganpat University are very
much benefited from the help of many people during the evolution of this project.
We would like express our special gratitude to our respected Dr. Mahendra Sharma and Miss. Harsha
Jariwala and all concern persons who have provided us help through their information, guidance and
all kinds of support, which was required for preparation of this report. Without their help it would have
been difficult for us to complete our Management Research Project –I.
As always, we value your recommendations and thoughts about the report. Your comments regarding
coverage and contents will be most welcome, as will your calling our attention to specific errors,
deficiencies and oversights.
By:-
Patel Dixit K. (12044311084)
Patel Vimal V. (12044311117)
Patel Vipul J. (12044311118)
Parmar Jayesh V. (12044311060)
Sandeep Paul (12044311145)
Zaloriya Kalpesh S. (12044311163)
iii
EXECUTIVE SUMMARY
This report analyses the Indian Airline industry with specific regard to the area of passenger travel.
This analysis is performed with the aid of strategic management tools in order to analyse and then
draw up useful perceptions of the industry with the aim of identifying pertinent issues associated with
the current business situation in the sector for example, identifying the specific drivers for change in
the industry and the building possible future scenarios. An in depth overview of the situation of the
industry is first given. This is necessary in order to put the Indian aviation industry into perspective
and to enable the formulation of the factors associated with tools such as PESTEL, SWOT and even
Five Forces analysis. This in turn helps in formulating an accurate picture of key drivers and future
scenarios. In a nutshell, it emerges from the discussion that the market is growing and with vast
potential, thereby presenting conditions conducive to investment in such a market. However, it also
emerges that competition will be fierce and that ironically, even with such a large market, some
players in the industry will not survive unless they adopt strategies that will enable them compete in
both the short and long term. As well as financial analysis and forecasting of the industry.

INDEX
Preface………………………………………………………………………..………… I
Acknowledgement …………………………………………………………...………… II
Executive Summary …………………………………………………………………... III
Particular Page No.
Chapter 1 INTRODUCTION OF THE INDUSTRY 1-5
1.1 Introduction To Airline Industry 1
1.2 Airline Market Share On International Routes 2
1.3 Indian Domestic Airline Market Share 2
1.4 Average Passenger Load Factors On Domestic Routes 5
Chapter 2 MAJOR PLAYERS OF THE INDUSTRY 6-13
2.1 Top 3 Airline Companies In India 7
2.2 Jet Airways 8
2.3 Spice Jet 10
2.4 Kingfisher Airlines 12
Chapter 3 STRATEGIC ANALYSIS 14-42
3.1 Industry Dominant Economic Feature 15
3.2 Key Factor For Future Competitive Success 18
3.3 Porter's Five Forces Model 20
3.4 PEST Analysis 31
3.5 SWOT Analysis 35
3.6 Strategic Groups Mapping 41
Chapter 4 FINANCIAL ANALYSIS 45-64
4.1 Ratio Analysis 45
4.2 Trend Analysis 57
4.4 Common Size Balance Sheet 63
Chapter 5
Chapter 6
Chapter 7
Chapter 8
Chapter 9
BUSSINESS PLAN
FINDING AND RECOMMENDATION
CONCLUSION
BIBLIOGRAPHY
ANNEXURE
65-79
80-81
82-83
84-85
86-90

LIST OF TABLE
No. Particulars Page no.
2.1 Market Share 7
4.1 Current Ratio 47
4.2 Debt Equity Ratio 49
4.3 Debtors Turnover Ratio 51
4.4 Inventory Turnover Ratio 53
4.5 Interest Coverage Ratio 55
4.6 Net sales Trend 57
4.7 PAT Trend 59
4.8 Net Worth Trend 61
4.9 Balance Sheet 63
4.10 Profit & Loss A/C 64
LIST OF FIGURE
No. Particulars Page no.
1.1 Airline Market Share 3
1.2 Domestic Market Share 4
1.3 Passenger Load Factor 5
3.1 Strategic Group mapping 43
4.1 Current Ratio 47
4.2 Debt Equity Ratio 49
4.3 Debtors Turnover Ratio 51
4.4 Inventory Turnover Ratio 53
4.5 Interest Coverage Ratio 55
4.6 Net sales Trend 57
4.7 PAT Trend 59
4.8 Net Worth Trend 61

1 | P a g e
CHAPTER 1
INTRODUCTION

2 | P a g e
Introduction to Airline Industry
1.1 History
The airline was set up under the Air Corporations Act, 1953 with an initial capital of 32
million and started operations on 1 August 1953. It was established after legislation came into
force to nationalize the entire airline industry in India. Two new national airlines were to be
formed along the same lines as happened in the United Kingdom with British Overseas
Airways Corporation (BOAC) and British European Airways (BEA). Air India took over
international routes and Indian Airlines Corporation (IAC) took over the domestic and
regional routes. Eight pre-Independence domestic airlines, Deccan Airways, Airways India,
Bharat Airways, Himalayan Aviation, Kalinga Airlines, Indian National Airways and Air
Services of India and the Domestic wing of Air India, were merged to form the new domestic
national carrier Indian Airlines Corporation. International operations of Air India Ltd. was
taken over by the newly formed Air India International. Indian Airlines Corporation inherited
a fleet of 99 aircraft including 74 Douglas DC-3 Dakotas, 12 Vickers Vikings, 3 Douglas DC-
4s and various smaller types from the seven airlines that made it up.
Vickers Viscounts were introduced in 1957 with Fokker F27 Friendships being delivered from
1961. The 1960s also saw Hawker Snidely HS 748s, manufactured in India by Hindustan
Aeronautics Limited, join the fleet. The jet age began for IAC with the introduction of the
pure-jet Sud Aviation Caravels airliner in 1964, followed by Boeing 737-200s in the early
1970s. April 1976 saw the first three Airbus A300wide-body jets being introduced. The
regional airline, Vayudoot, which had been established in 1981, was later reintegrated. By
1990,Airbus A320-200s were introduced. The economic liberalization process initiated by the
Government of India in the early 1990s ended Indian Airlines' dominance of India's domestic
air transport industry. Indian Airlines faced tough competition from Jet Airways, Air
Sahara (now Jet Lite), East-West Airlines, Skyline NEPC, and ModiLuft. As of 2005, Indian
Airlines was the second largest airline in India after Jet Airways while Air Sahara controlled
17% of the Indian aviation industry.

3 | P a g e
1.2 Airline Market Share On International Routes To/From India: 2013
On the international front an important development was the fact that in FY2013 for the first
time a foreign carrier, Emirates, claimed the highest market share for traffic to/from India. Air
India, historically the market leader on international routes was impacted by the grounding of
its 787s for most of the last quarter.
Figure 1.1 Airline Market Share on International Routes
While India‟s second largest international carrier, Jet Airways, saw only a marginal increase in
traffic as it consolidated its network and dropped services to points such as New York JFK,
Milan, Johannesburg and Kuala Lumpur.
1.3 Indian Domestic Airline Market Share: FY2013 Vs FY2012
India‟s airlines posted a combined loss of USD1.65 billion in FY2013 (USD1.15 billion if
Kingfisher is excluded), down from approximately USD2.28 billion the previous year. More
than 40% of the loss was incurred in the last quarter alone, squandering the improved
performance posted during the first nine months of the year.
Kingfisher‟s exit from the Indian aviation sector was one of the most significant developments
for the market in FY2013. It highlighted the fragility of the sector when an airline that was the
largest in the country less than two years earlier and with an excellent reputation amongst
passengers, could fall from grace so swiftly.

4 | P a g e
But with it came a silver lining for the remaining carriers. As a result of the removal of
Kingfisher‟s seats, combined with modest capacity induction by other carriers, the
demand/supply dynamics in the market started to favor airlines for the first time since 2004.
This was reflected positively in the average fares which increased by 15-20% year-on-year.
India‟s airlines were showing signs of a steady recovery in financial performance during the
first three quarters of FY2013; however the fourth quarter spoilt the party. Aggressive
discounting during the traditionally weak period between January and March resulted in losses
of USD700 million during this quarter alone (close to USD500 million if Kingfisher is
excluded).
Figure 1.2 Indian Domestic Airline Market Share
The cost environment remained hostile throughout the year with the weakness of the Indian
rupee and continued high oil prices being the key challenges. Even though Brent Crude levels
softened towards the end of the year, the depreciation of the rupee meant that carriers did not
see any benefit from this.
Over the 12 months to 31-Mar-2013, with carriers moving to fill the space vacated by
Kingfisher, all airlines except Jet Konnect saw an increase in their domestic market share over
the previous year, but none more so than IndiGo which saw a 7ppt improvement.
5 | P a g e
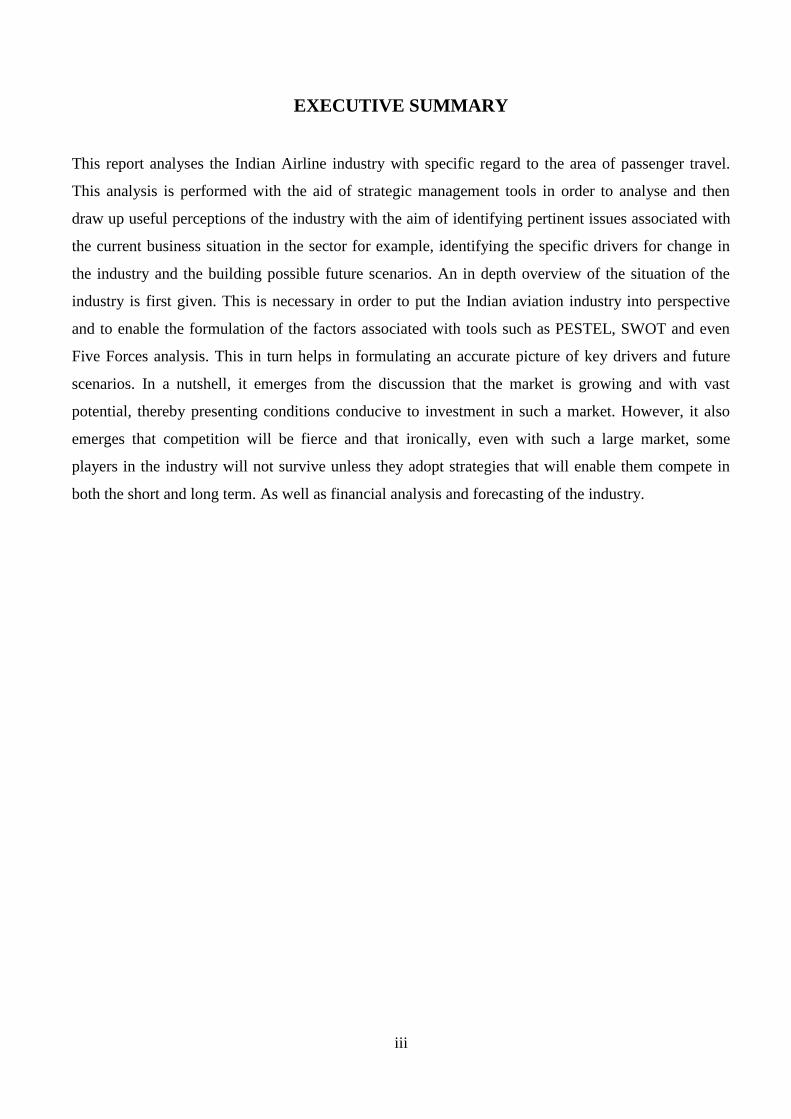
1.4 Average Passenger Load Factors On Domestic Routes: FY2013 Vs. FY2012
However, despite the moderation in capacity in the market, the steep increase in domestic
fares curtailed demand and meant that almost all carriers reported a slight decrease in average
passenger load factors during the year.
Figure 1.3 Average Passenger Load Factors on Domestic Routes
The sole exception to this was Air India which achieved a creditable 5ppt improvement to
69%, although it remained the lowest of all the carriers that are currently operating. However,
its load factors in economy class were much higher (as is the case for Jet Airways) with the
average being depressed by the relatively poor performance of business class on domestic
routes.
IndiGo was once again the stand-out performer achieving sustained load factors of above 80%
throughout the year.

6 | P a g e
CHAPTER 2
MAJOR PLAYERS

7 | P a g e
2.1 Top 3 Airline Companies In India
Table 2.1 Market Share of Airline Industry
Rank Company Name Company Logo Market Share
1 Jet Airways
20%
2 Spice Jet
18%
3 Kingfisher
3%

8 | P a g e
JET AIRWAYS
Jet Airways (India) Limited (JAIL) was incorporated in 1st April of the year 1992 as a private
company with limited liability and it commenced operations as an Air Taxi Operator in 5th
May of the year 1993 with a fleet of four leased Boeing 737 aircraft and also having ISO 9001
certification for its in-flight services. The Company became the first airline in India to operate
the Boeing 737-400 Aircraft in April of the year 1994 and it operates one of the youngest
aircraft fleets in the world today. The Company was granted the scheduled airline status in
14th January of the year 1995. Jet Airways became a deemed public company in 1st July of
the year 1996.
TYPE Public
PREDECESSOR Jet Airways(India) Limited
FOUNDED 1992
HEADQUARTERS Mumbai, India
KEY PEOPLE Naresh Goyal (CEO & MD)
NET INCOME Rs.17,724.65 Cr (2012-13)
EMPLOYEES 13.16 K(2012)
PARENT Tailwinds Limited
WEBSITE www.jetairways.com

9 | P a g e
Jet Airways was reconverted into a private company as at 19th January 2001. The Company
bagged the prestigious Air Transport World Award 2001 for Market Development and the
TTG Travel Award 2002 for Best Domestic Airline. In the year 2004, the company made tie
up with the South African Airways. During the year 2005, Jet Airways Limited has filed its
draft Red Herring Prospectus with the Securities and Exchange Board of India (SEBI) to enter
the capital market with its initial public offering for used to fund its international expansion
plans. Jet Airways became a public company in 28the December of the year 2004.
The Company launched its first inter-continental flight by linking Mumbai with London
Heathrow by a non-stop day flight in the month of May during the year 2005. Jet Airways
executed its purchase agreement with The Boeing Company, USA in the year 2005, also in the
identical period introduced an In-flight Safety Manual in Braille, signed a pact with Gulf Air
and the company won the Avaya Global Connect Customer Responsiveness Award. During
2005-2006, the company completed the construction of hangar complex with workshop and
allied facilities in Mumbai.
Jet Airways and Etihad Airways, the national carrier of the United Arab Emirates, had inked a
code share agreement in June of the year 2008 and reciprocal frequent flier partnership on the
New Delhi-Mumbai-Abu Dhabi sectors. In same June 2008, launched its daily Mumbai-
Shanghai-San Francisco flight, becoming the first Indian private carrier to operate to China.
The Company enhanced its network connectivity from Pune with the launch of its new direct
services to Hyderabad, Nagpur & Ahmedabad effective from July 15th 2008. During the same
month, Jet Airways got permission for fly to Dubai from Delhi and Mumbai.

10 | P a g e
SPICE JET
TYPE Public
PREDECESSOR Spice Jet Limited
FOUNDED 2005
HEADQUARTERS Gurgaon, India
KEY PEOPLE Kalanithi Maran (CEO & MD)
NET INCOME Rs.5805.14 Cr (2012-13)
EMPLOYEES 5.25 K (2012)
PARENT Sun Group
WEBSITE www.spicejet.com
SpiceJet Ltd is India's best low cost airline, delivering the lowest air fares with the highest
consumer value. The company operates 119 flights daily to 18 cities, namely Ahmedabad,
Bangalore, Bagdogra, Chennai, Coimbatore, Delhi, Guwahati, Goa, Hyderabad, Jammu,
Jaipur, Kochi, Kolkata, Mumbai, Pune, Srinagar, Varanasi and Visakhapatnam. Spicejet Ltd
was incorporated in the year 1984 with the name Genius Leasing Finance and Investment
Company Ltd. In the year 1993, the company ventured into domestic aviation operations under
technical partnership with Deutsche Lufthansa AG.

11 | P a g e
In the year 1994, the name of the company was changed from MG Express to ModiLuft Ltd.
In June 1994, the company entered into a management agreement with Lufthansa to manage
their entire Airline operations. The company suspended their Airline operations in the year
1996 after dissensions grew between Lufthansa and the company. During the year 2000-01,
the name of the company was changed from ModiLuft Ltd to Royal Airways Ltd.
The company started their commercial operations of domestic flight services on May 23, 2005
with three leased Boeing 737-800 aircraft. During the year 2004-05, they signed an agreement
with Boeing for acquiring 20 (737-800) aircrafts and in May 4, 2005, the company changed
the name of the company from Royal Airways Ltd to SpiceJet Ltd. In May 5, 2005, they
entered into a strategic tie up with Indian Oil Corporation Ltd. In November 2005, the
company launched their daily direct flights between Delhi and Kolkata. They also launched
their services to two new spice cities namely, Jammu and Srinagar.
In March 27, 2006, the company launched their first co-branded credit card with State Bank of
India in association with MasterCard International. During the year 2006-07, the company
inducted five new aircraft to their fleet taking the total fleet strength to eleven aircraft. They
started sale of food on board during the year. In August 17, 2006, the company launched
Spicejet Hotels, with the aim of providing a dedicated online Web hotel reservation services to
their customers. In October 2006, they launched new flights between Kolkata and Guwahati.
In January 2007, they introduced two new additional daily flights on the Bangalore - Mumbai
- Hyderabad routes.

12 | P a g e
KINGFISHER AIRLINES
Kingfisher Airlines Limited was an airline group based in India. Its head office is in Andheri
(East), Mumbai and Registered Office in UB City, Bangalore. Kingfisher Airlines, through its
parent company United Breweries Group, has a 50% stake in low-cost carrier Kingfisher Red.
The airline had been facing financial issues for many years. Until December 2011, Kingfisher
Airlines had the second largest share in India's domestic air travel market. However due to a
severe financial crisis faced by the airline at the beginning of 2012, it has the lowest market
share since April 2012.Kingfisher Airlines Ltd is the largest charter aviation company in India.
TYPE Public
PREDECESSOR Kingfisher Airlines Limited
FOUNDED 2004
HEADQUARTERS Mumbai, India
KEY PEOPLE Dr.Vijay Malaya (CEO & MD)
NET INCOME Rs 682.48 Cr (2012-13)
EMPLOYEES 2.85 K (2012)
PARENT Ub Group
WEBSITE www.flykingfisher.com

13 | P a g e
Their principal activity is to provide commercial passenger airline and private helicopter and
airplane chartering services in India. Their business unit Air Deccan, is India's low cost carrier.
Kingfisher Airlines Ltd was incorporated in June 15, 1995 as a private limited company with
the name Deccan Aviation. The company was promoted by G R Gobinath, K J Samuel and
Vishnu Singh Rawal. In January 2005, the company was converted into a public limited
company. In September 1997, the company opened their first base at Jakkur and launched
their first Helicopter. In June 1998, they opened their second base in Hyderabad and in
December 1998, they commenced offshore flying operations. In June 2001, the company
introduced first fixed wing aircraft and in November, they introduced the second fixed wing
aircraft. In August 2003, first Air Deccan flights take place on Bangalore to Hubli and
Bangalore to Mangalore. In December 2003, the company incorporated Deccan Aviation
(Lanka) Pvt Ltd, which is a joint venture company.
The company was established as a 52% subsidiary company to undertake helicopter services
and airline operations in Sri Lanka. In August 2004, they introduced first Airbus A 320. In
March 2005, Air Deccan, entered into tie up arrangement with Club HP. In June 27, 2005,
Deccan Aviation (Lanka) Pvt Ltd ceased to be a subsidiary consequent to the transfer of 4% of
their share to Srilanka nationals. In March 2007, they forayed into Air Cargo Business through
a wholly owned subsidiary. The company hived off Charter Services into a separate entity and
also transfers the Maintenance and Repair Facility into a separate entity.
The Airline business of Kingfisher Airlines Ltd merged with the company with effect from
April 1, 2008 and the name of the company was changed to Kingfisher Airlines Ltd. The
airline had shut down its operations when on 20 October 2012 the DGCA suspended its flying
license. The suspension had been due to failure to give an effective response to the show-cause
notice issued by DGCA. However, the airline had locked out its employees for several days
before this suspension. On 25 October 2012, the employees agreed to return to work. In
February 2013 the Indian government announced the withdrawal of both domestic and
international flight entitlements allocated to the airline.

14 | P a g e
CHAPTER 3
STRATEGIC ANALYSIS

15 | P a g e
3.1 INDUSTRY’S DOMINANT ECONOMIC FEATURES
Market Size:
The global airline industry consists of over 2000 airlines operating more than 23,000aircraft,
providing services to over 3700 airports. In the year 2009, the industry‟s revenue was
estimated to be $483 billion. Major services of this industry include domestic passenger flights
which accounts for about 30 percent of industry revenue, international passenger flights
contributing 25%, domestic cargo flights contributing 20%, international cargo flights which
account for about 10% and domestic commuter passenger flights contributing 10% of the
industry revenue. The U.S constitutes the largest airlines industry in the world, accounting for
about 49.8% of the global revenue. US airlines reported over $160 billion in total revenues,
with approximately 545,000 employees and operate over 11 million flight departures per year,
and carry one third of the world‟s total air traffic.
Growth Rate:
The global airlines industry grew by 6.3% in 2008 to reach a value of $467.4 billion. In2013,
the global airlines industry is forecast to have a value of $609.3 billion, an increase of
30.4%since 2008. The growth of world air travel has averaged approximately 5% per year
over the past 30 years, with substantial yearly variations due to changing economic conditions
and differences in economic growth in different regions of the world. The domestic segment
dominated in the global airline industry and accounted for 1.4 billion passengers in 2007,
equivalent to 66.5% of the industry's overall volume.
Number of Rivals:
The airline industry is characterized by the high competition that exists among the rival
airlines due to its low cost nature. Since the carriers are involved in a constant struggle to take
away the market share from each other, the rivalry is increased, as it is easy for buyers to
switch between the airlines companies, depending on price. The airlines are continually
competing against each other in terms of prices, technology, in-flight entertainment, customer
services and many more areas. The industry is fragmented into many small companies. The
key competitors in the industry include: American airlines, Delta, southwest, United airlines
etc. As in many mature industries, consolidation is a trend. Airline groupings may consist of
limited bilateral partnerships, long-term alliances, mergers, or takeovers. Due to the large

16 | P a g e
number of airline companies the industry is not going through a period of consolidation to a
smaller number of companies.
Scope of Competitive Rivalry:
Services of the industry can be segregated as domestic, regional, within the continent or travel
between continents. Large companies compete with other major companies on a national or
global scale. However, Small airlines can compete by serving local or regional routes.
Competitive rivalry is high and hence, the demand for air travel is inelastic because there are
many different airlines to choose from. Example: Southwest VS American airlines.
Number of Buyers:
The market demand is fragmented among many buyers. The important customer segments in
the industry include corporations, SME‟S and leisure travellers. The various airlines are
competing for the same customer, which also results in strengthening the buyer power.
Individuals wishing to travel have various options to choose from when selecting an airline but
price is usually the most important factor. Hence, the bargaining power of customers in the
airline industry is very high since they are price sensitive and search for the best deals
available.
The Degree of Product Differentiation:
The products and services of the rivals in the industry are less differentiated. The airline
companies mostly fly similar aircrafts and hence, have identical or near identical seating
configurations. Frequencies and timings are very similar with only a few airlines prepared to
allow their competitors with frequency advantage. The onboard products are also mostly
comparable, and do not have much change. In order to attract more customers there is severe
price competition within the industry, with airlines ruthlessly undercutting each other with fare
promotions. Hence the look alike products of rivals cause heightened price competition.
Product Innovation:
Innovation plays a major role in airlines‟ strategy, which focuses on Internet Protocol
technologies, end-to-end services to the desktop and airport integration. The airline industry is
characterized by having rapid product innovation and depending on the market conditions and
buyer demands certain products may have short life cycles in this industry. For example some
flights may have innovation in their in-flight products, and thus if it is unpopular with

17 | P a g e
passengers it has to be quickly withdrawn. Hence, there are opportunities to overtake key
rivals by being the first to market with next generation products.
Pace of Technological Change:
The airline industry is growing leaps and bounds because of the revolutionary advancement in
the techno world. It has completely changed the structure, form, and future of the industry in
all ways. Internet has given a huge thrust to the industry by heightening the comfort level
provided by art transport in various ways. The benefits offered include the availability of
cheap airfares through online booking; Travelers can also compare prices of different airlines
and then choose the best offered price. Carriers have been able to add more functionality,
especially in customer service areas ranging from check-in desks upwards. Furthermore, they
have also been able to integrate internal systems. Internet Technology has become recognized
as a major enabler for aviation to work effectively and safely, while achieving substantial cost
savings. Hence, industry members cannot operate without technological capabilities and thus
they need technology to compete and survive within the industry.
Supply/ Demand Conditions:
Intense competition within the industry leads to surplus of capacity in several markets. As a
result of surplus of capacity many airline companies get into the price war in order to attract
more customer demand. Hence, surplus of capacity may push prices down however; this
usually doesn‟t affect the profit margins. This is because the prices are lowered as a result of a
cut in the costs. The airline companies in the case of excess capacity, cut back on the cost in
the form of entertainment, meals etc
Vertical Integration:
Vertical integration maybe found in some of the companies in the airline industry. By
performing the traditional role of travel agents airlines achieve forward integration. Likewise
by performing the role of suppliers such as aircraft maintenance and in flight catering airlines
have backward integration. In this industry, some competitors operate in multiple stages

18 | P a g e
3.2 KEY SUCCESS FACTORS
Key success factors describe main parts of performance that are important for the firm to
achieve its objectives and mission. Top level management absolutely considers these factors
daring the setting overall goals. These key success factors give a widespread knowledge for
the entire company. Therefore, any action that the firm commences must make sure constantly
greater performance in these key parts if not the firm may not be competent to accomplish its
goals and theses may full to achieve its mission. In the service/ airline industry, predominantly
the capital-intensive, the key success factors are described below.
Strong Management:-
There must be strong management of everything that is advantages for the organization. The
airline has at all the time evaded, disdained and vogue everything that may increase costs and
makes difficult the basis travels plan. Management ranks are inclined, healthy compensated
and significantly productive.
Capable Workforce:-
Highly qualified and competence workforce is very essential in this industry or service
oriented industry. They must possess strong communication skills and soft spoken with
customers. There must be training programs focusing to enhance their abilities and skills and
these campiness must be customer focused and they cannot leave the organization and create
difference.
Service Promotion And In-Flight Service:-
The promotion in this industry is mainly targeted to enhance the based of loyal customers and
also focused to the regular high-revenue customer. The in-house service such as booking ease,
air crack type, aircraft seating space, class of service offerings must be at least industry coach
cabin that is slightly more specials. There are no assigned seats, no meals, just beverages and
Jencks. Therefore, simple service is a major critical success factor.
Non-Stop Flying:-
Destination from one point to anthers point should be nonstop. This activity minimizes the
time that planes take while reaching the destination and it allows airline more to be in the air,
it results in good image and increases passengers credibility.

19 | P a g e
Financial Management:-
Thriving management of this factor facilitates airline to regulate investment for growth. There
is accountability of the unit revenue to compute the profitability. Which is calculated by
revenues minus all the expenses divided by the total seats flown.
Efficient Management of Cost:-
Maximizing revenues by implying creative and competitive, pricing structure to attract all the
profitable segments and sustaining frequent and profitable customer base is most important
key success factor for this industry. Efficient management cost by focusing on the price
hedging during volatile periods and maintaining fuel procurement is an important factor.
Route System:-
An airline route organization is the most reliable factor. Where to fly and how frequently are
the success factors that must be harmonized to demand and simultaneously planned to increase
the aircraft utilization.

20 | P a g e
3.3 PORTER'S FIVE FORCES MODEL
One important component of industry and competitive analysis involves delving into the
industry‟s competitive process to discover what the main sources of competitive pressure are
and how strong each competitive force is. This analytical step is essential because managers
cannot devise a successful strategy without in-depth understanding of the industry‟s
competitive character.
Even though competitive pressures in various industries are never precisely the same, the
competitive process works similarly enough to use a common analytical framework in gauging
the nature and intensity of competitive forces.
Two things determine your company‟s profitability- the industry in which it competes and its
strategies position in the industry. Some industries have inherently low profit potential while
others are highly profitable. The most profitable companies have a strongest competitive
position in a profitable industry. The poorest companies have weak positions in weak
industries.
The following write-up is a view of the Indian airline industry from these five angles leading
to the expected changes in the coming years in the underlying structure of the Indian airline
industry.

21 | P a g e
Porters five force model

22 | P a g e
3.3.1. THREAT OF NEW ENTRANTS
Threat of new entrants is another major aspect of the five forces. This aspect has a low threat
for the airline industry. There are two aspects that do however raise the threat level. First, there
are extremely low switching costs. Second, there are no proprietary products or services
involved.
Even with these two aspects the industry still has a very low threat overall. Existing firms have
a large cost advantage. This industry requires a large amount of capital and without a strong
customer base there will be little to no profit in the first few years. Existing firms can and will
use their high capital to retaliate against newer firms with whatever means necessary such as
lowering prices and taking a loss.
Although there are low switching costs between brands, consumers tend to only chose well-
known names. Airline tickets are expensive so people don‟t want to give that money to firms
they don‟t trust. There is also a huge safety aspect involved and most consumers feel safer
with firms that have been around for a long period of time. This industry requires plane and
flying experience which also lowers the threat of entry. When firms decide to enter the market
they first have to become licensed which can take about a year. After that they are constantly
being regulated by several organizations such as the Federal Aviation Administration and the
Department of Transportation. The time and money spend to solely open an airline company is
enough to prevent most people from entering the industry.
Airport Slot Availability
The limited access to airport slots93 has long been a barrier to the European airline industry as
national airlines had access to the best slots in the major airport hubs94 and new entrants to the
market would only have little success as they would be given none or off-peak slot allocations
at the airports. In order to liberalise this market the European Commission introduced
legislation regulating the allocation of airport slots in the EU95. The reasons for this
legislation was the significant and consistent growth in air traffic in the EU and the delays and
other difficulties experienced in this increase of airport capacity. Creating more competition
was also an explicit objective for this regulation and two key aims were “to facilitate
competition and encouraging entrance into the EU market and to ensure that slots at congested
airports are allocated on the basis of neutral, transparent and non-discriminatory rules”

23 | P a g e
Predatory Pricing as a Barrier To Entry
The concept of predatory behaviour is based on incumbents in an industry squeeze out new
entrants by temporarily lowering their prices to match the new competitor or even introduce
prices below the levels of these new entrants, who often do not have enough capital to survive
such a price war, until they have been driven out of the market. After the new entrant has lost
this price war, the incumbent then increases its prices back to pre-competition levels. Within
the context of the airline industry allegations of predatory pricing is most often made when a
low fare carrier enters a market or specific route serviced by a full-service carrier prior to its
entry. The latter will then lower its prices attempting to cause the former to exit this market or
route.
Frequent-Flyer Programs
Frequent-flyer programs are marketing schemes by airlines giving customers a gift, usually
free travel, when they have conducted a certain amount of business with the airline. These
programs have made many customers, especially business travellers, prefer a certain airline or
airline alliance as they would receive bonus flights, free hotel accommodation or other free
gifts the scheme provides, although they may be able to buy a cheaper flight at another airline.
The reason has often been that the company pays for the flights but the individual employee
receives the bonus points. It has also been widely stated that purpose of the programs is to
offer commission on business purchases in the form of a gift to the agent, who does the buying
for the business. When the buyer places an unusually high value on the bonus relative to the
value he/she places on the marginal payments for the purchased travel, as results from this
principal/agent problem, the effectiveness of the frequent-flyer program increases.
Economies of Scale
Classic industrial studies109 have concluded that there are no significant economies of scale
with regards to the airline industry, when looking at the whole system. Even when looking at
the city-pair market economies of scale it was concluded that in a liberalised market it is
impossible to use the economies of scale that exists in theory. This would be to use larger
aircraft as studies have shown that the average cost per passenger is lower in a large aircraft
such as the Boeing 747-400 than in a smaller Boeing 737-400110 and it would therefore be
preferable to have larger aircraft serve a city-pair but with less frequency in order to increase
the load factor, but this is of course impossible as travellers on high passenger-volume city
pairs like London-Dublin demand high frequency, which in turn means that economies of

24 | P a g e
scale is no substantial barrier to entry. However, LFA´s like Ryan air has countered traditional
theory and have achieved economies of scale. Not by using larger aircraft, but through their
low cost structure they are able to sell tickets at lower prices, thereby stimulating demand and
increase their load factors, hence lowering their unit cost per passenger. This will be explored
further in the Ryan air case study later in this thesis.
Empirical Study On Barriers To Entry
Australia/New Zealand, Canada, USA and Europe on their perception on the effectiveness of
barriers to entry in the airline market. The study showed that managers of low fare airlines
perceived strategic barriers such as code sharing, superior service and hub-and-spoke systems
as significantly smaller barriers than other airlines, but found airport fees as a significantly
higher barrier to entry than other airlines. This is easy to understand as the airport fees amount
to a higher percentage of the total ticket price with low fare airlines as their prices are
generally lower and the airport fees are most often fixed, meaning the fee remain the same
regardless of whether the ticket price is €100 or €1000. Moreover, a strong cash position
and/or large firm size is also seen to weaken the effectiveness of strategic barriers such as
predatory pricing, code-sharing, brand name, customer segmentation and advertising. A recent
study was performed by doing a survey, where data was collected by airline managers
3.3.2. THREAT FROM SUBSTITUTES
This industry has a medium substitute risk level. There are substitutes in the airline industry.
Consumers can choose other form of transportation such as a car, bus, train, or boat to get to
their destination. There is however a cost to switch. Some means of transportation can be more
costly than a plane ticket. The main cost is time. Planes are by far the fastest form of
transportation available. Airlines surpass all other forms of transportation when it comes to
cost, convenience, and sometimes service. Consumers do sometimes choose other methods for
various reasons such as cost if they are not traveling very far which raises the risk.
Government policies affecting the attractiveness of alternative modes of travel or
communication affect the impact of substitutes on airlines. Cumbersome security procedures
on airports make air travel less attractive.

25 | P a g e
Alternative Modes of Transportation
Very little research has been done on the impact of automobiles, buses and business/corporate
aviation as an alternative mode of transport vis-à-vis scheduled air transport. Therefore I will
only make a few general comments with regards to them.
Bus Service
There is basically only one major bus service operator on a pan-European level that has
scheduled routes in a European network and that is Euro lines. It is not one entity though, as it
is comprised of 30 independent bus companies operating a network together.128 Pan-
European coach service is in my opinion only a substitute for air travel, when you travel short
distances and have little concern as to the time consumption or when purchasing a pass and
making many stops (travel a short distance numerous times). Senior management at leading
European low fare airlines such as Ryan air have argued that airlines cannot compete with
other modes of transport for journeys of less than approximately 400 km.129 The product
would target groups from the lower echelon of society such as students and shoestring
travellers. The advantage is that one may choose to travel on the same day as ticket prices are
usually flat through as season, unlike air travel where one may pay dearly for same day
travel130.
Automobiles
Regarding automobiles one must intuitively argue that the price of fuel is an important
determinant of its role as a valid substitute for air travel. The lower the fuel price is for your
automobile, the more likely you are to use it more, both for short- and long-distance travel. As
one knows from the US the use of the automobile for long journeys across states if fairly
common, but the price of fuel is also approximately 1/3 of the price in Europe, mainly due to
higher taxes in the latter. A recent paper discussing the automobile as a substitute for rail or air
travel also conclude that there is a group of potential passengers, that consider their
automobile as an alternative mode of transport and make their decision considering the
variable costs like fuel etc. of using the automobile.131 Given the high fuel prices in Europe,
although higher fuel prices in the airline industry has also led to a surcharge there, is putting a
limit on the automobile as a viable alternative for air transport in long-distance travel (more
than 400 km as was mentioned earlier as the lower limit for feasible competition between
airlines and alternative modes of transportation) combined with the longer time consumption
of using the latter mode of transport. Only when car-pooling can it be viable on a cost basis.

26 | P a g e
Rail service
More research has been conducted with respect to rail service as a substitute mode of
transportation with the introduction of the high-speed trains in Europe such as the TGV and
Euros tar. It can be argued132 that shorter average travel distances and competition from the
high-speed train services will mean that air route density in Europe will not reach US levels,
where the rail network is much less developed and has no high-speed trains apart from The
Acela Express that runs between Boston and Washington D.C. in the densely populated
Northeast Corridor. This service shares the problem of the Euro star in the UK part of its
network that the rail tracks.
3.3.3. RIVALRY AMONG COMPETITORS
The last area of the five forces is the rivalry among existing players. The rivalry in the airline
industry is very intense for many reasons. The industry is currently very stagnant. It seems to
be in the mature stage of the business cycle. The number of competitors stays the same in the
long run and it doesn‟t seem to be under or over capacitated. The fixed costs are extremely
high in this industry. This makes it hard to leave the industry because they are probably in
long term loan agreements in order to stay in business. The products involved or the planes are
highly complex which also heightens the competition.
Competition among major players is extremely intense in many aspects. Switching costs are
generally low, even though companies have tried to increase switching costs with the use of
"frequent yer" programs. Highly competitive industries generally earn low returns because the
cost of competition is high. This can spell disaster when times get tough in the economy.
Rivalry among existing firms in this industry has increased over the last 15 years as market
liberalisation has led to increased competition. The low fare airlines have been able to lower
the prices of airfares through their business models focusing on price leadership forcing full
service airlines to also lower their prices to avoid losing more market share.
Competitive rivalry in the Indian airline low industry can be can be split up in two parts:
Rivalry between low fare airlines and full service airlines creating subsidiaries or other
methods to compete with the prices offered by the former.
Internal rivalry between low fare airlines.
The issue of competition will not be explored more in-depth in this section as it will be
analysed more comprehensively in the competition analysis later in this thesis.

27 | P a g e
3.3.4. BARGAINING POWER OF SUPPLIER
Next we look at the bargaining power of the suppliers. In this case the major suppliers are the
airplane manufacturers. The top two manufacturers in the world currently are Boeing and
Airbus(Odell, Mark). In this industry the inputs are extremely standardized. Airline companies
only seem to differentiate with amenities. The planes are very similar. Currently some
manufacturers are trying to make their plans more eco-friendly.
Airline companies cannot easily switch suppliers. Most firms have long term contracts with
their suppliers. Planes are such high capital products that firms probably make long term loan
agreements and have more favourable credit terms when they don‟t switch companies. It is
difficult to enter into the plane manufacturing industry because of the capital needed to enter.
The amount of money and expertise needed to make even one plane is around 200 million
dollars. For this reason there are very few suppliers in the airline industry. Airline firms are the
only source of income for these manufacturers so their business is extremely important. Based
on these things the bargaining power of suppliers has a low threat as well.
Aircraft Manufacturers
Suppliers have a strong bargaining position if they are concentrated. This is, in particular, the
case for the aircraft manufacturers because only a few companies are producing aircraft. There
are effectively only two major global players in the aircraft business with regards to larger
aircraft and that is Boeing of the US and Airbus, which is a European consortium. Other
companies such as Bombardier of Canada are focusing on smaller regional aircraft and a
company such as Gulfstream focuses mainly on business jet aircraft.
Airlines cannot substitute aircraft by any other products and these are therefore an important
factor for the airlines, which strengthens the position of the aircraft manufacturers. However,
in the light of the recent downturn in air travel over the past few years demand for aircraft has
fallen dramatically making the bargaining position of the aircraft manufacturers in this
contract, suggestions that Boeing had been forced to give a 30% discount from the official list
price was not denied.
Labour
Airlines are dependent on their skilled employees, especially pilots and technical personnel.
Network airlines are particularly vulnerable to disruptions at their hubs, which increases the

28 | P a g e
power of unions at these locations. For other services, like station/ground services, general
administration, and marketing/distribution, outsourcing is an alternative that has been widely
used.
Unions tend to be local monopolies. In airlines there are usually different unions for different
types of staff, with each of them having the ability to disrupt operations. Union power and
regulation have led to a significant lack of downward flexibility in staffing levels and wages,
especially for legacy airlines. There are significant cost differences between new entrants,
companies in bankruptcy protection, and unionized incumbents, where high wages continue to
be paid relative to other industries, especially for employees with specialized skills like pilots.
Employees have traditionally been one of the groups most successful in capturing the value
created by the airline industry. They remain powerful where labor regulations and the hub-
spoke system given them critical leverage. Because union power often rises as companies
mature, the nature of labour relations also erodes industry structure by encouraging entry (and
bankruptcy) to avoid union-related costs, even if there is no other productivity advantage.
Airports
Many airports are local monopolies with limited competition from nearby secondary airports.
There is little entry by new airports, so the main check of the exploitation of market power is
through economic regulation or, to a lesser extent, competition policy (or potentially the licensing
policy if airport operations are put out on temporary license). The pricing power that the local
monopoly gives to an airport depends significantly on the potential traffic flows to which it
provides access.
Many airports have become more aggressive in their fee structures following privatization. But
many airports, especially in the US, continue to be used by local government to foster economic
development through subsidizing airlines‟ operations. On average airports do not earn their cost
of capital, but in Europe and the Asia-Pacific region they generally do.
Airport switching costs are high, especially for network airlines that are focused on providing
connections. It is easier for point-to-point airlines, especially LCCs flying to larger metropolitan
areas with a number of airports or regional airports not served by network airlines. Cargo airlines,
too, might have a stronger position, especially where the logistical service includes different
modes of transportation.
Airports only marginally better profitability compared to airlines indicates that their effective
bargaining power has been limited. Their main impact on airline industry structure has been

29 | P a g e
through infrastructure capacity constraints and other operational practices that have limited
effective airline capacity adjustments in serving particular connections.
Ground Handling Services/Catering
Ground handling suppliers tend to operate as local monopolies or oligopolies. Airlines are
often the dominant or only buyers of the services provided by ground handling companies.
Their services are technically homogenous and there are many potential entrants outside the
industry with the necessary skills. Switching costs within the existing set of providers are
small. The main barrier to entry is regulation that gives service providers local monopoly
rights.
Most airlines still provide ground handling services themselves (estimated 60% of the market
in 2005) but the degree of outsourcing to independent handlers (24%) and airports (16%) is
expected to rise significantly. Some of the independent handlers belong to larger international
groups but the global market is still highly fragmented. The market for ground handling
services has been liberalized in the US and Europe; here the market share of independent
handlers is already the highest. Elsewhere, there is little competition and airlines usually
provide these services themselves. Many of the independent handlers are profitable, at levels
comparable to companies providing similar services in other parts of the economy.
Ground handling/catering providers have limited bargaining power, largely because airlines
have the option of providing the service in-house. More liberalization in this market will lead
to more outsourcing but limit the market power of these service providers by reducing entry
barriers.
Providers of debt financing have many alternatives for investment, and can demand financing
terms that create solid returns taking into account the risks of the airline industry.
Providers of equity capital, often critical to survival in times of distress, are able to push for
attractive conditions. Given the low overall market capitalization of the airline industry,
investors view equity positions in airlines as high risk but high-return opportunities.
3.3.5. BARGAINING POWER OF BUYERS
The airline industry is made up of two groups of buyers. First, there are individual flyers. They
buy plane tickets for a number of reasons that can be personal or business related. This group
30 | P a g e
is extremely diverse; most people in developed countries have purchased a plane ticket. They
can do this through the specific airline or through the second group of buyers; travel agencies
and online portals. This buyer group works as a middle man between the airlines and the
flyers. They work with multiple airline firms in order to give customers the best flight
possible. Between these two groups there is definitely large amount of buyers compared to the
number of firms.
There are low switching costs between firms because many people choose the flight based on
where they are going and the cost at the time. This is some loyalty to firms but not enough for
high switching costs. Each customer needs a lot of important information. They need to know
the details of what is provided during the flight. Buyers need to understand the timing of the
flight and the safety aspects of flying in general. The service provided is unique. Each airline
has a niche. Some airlines focus on cost, while others focus on having the best amenities, etc.
Overall the bargaining power of buyers has an extremely low threat in this industry.
Business Customers
Frequency is a key differentiator among airlines of a similar type on a given connection.
Airlines have tried to create higher switching costs but these are meaningful mainly for
business travellers. Loyalty programs create switching costs; they have significant effect,
especially for business travellers. Expiration/„inflation‟ of frequent flyer miles creates
incentives to use miles/stay loyal to a given airline/alliance but reduce their value. Operational
coordination in alliances or a large own network is also creating some switching costs for
consumers; there is evidence of a (limited) hub premium for network airlines.
Leisure Customers
The choice of carriers is almost entirely based on price, with low willingness to pay for shorter
travel time or carrier-specific services. In transparent pricing structure due to price
discrimination (time of purchase, overall bundle, flexibility) creates incentives for consumers
to search for “better price”. In transparent additional costs for add-on services (baggage,
priority boarding, credit card use, booking fees, etc.) differentiate between airline types and
classes of services, but not within these groups. Service is highly similar across airlines, at
least within the broad classes of carriers (Network vs. LCC) but also across these groups for
economy class service. For leisure customers there are no inherent costs associated with flying

31 | P a g e
with another airline. Loyalty programs only matter for those passengers that are travelling
extensively on business.
Air Cargo Customers
Freight forwarders control 60% of the global market and wield significant power. Consistent
with this, they earn significant returns on capital relative to airlines.
OVERALL ASSESSMENT
SR. NO. FORCE CONDITION REASONS
1 Existing rivalry High
Limited Product
Differentiation, High Sunk
Cost, Low Marginal Cost,
Multiple Direct and Indirect
Rivals
2 Threat of New Entrance High
Low Switching Cost, High
Capital Requirement,
Demand Side Benefit of
Scale
3 Substitute products Medium
Technology for web-
conferencing if Improving,
No direct substitutes to
industry
4 Bargaining Power of
Supplier High
Aircraft and engine
producers both oligopolies,
Airports are local
monopolies with significant
power
5 Bargaining power of
Buyer High
Buyers are fragmented, Air
travel perceived as
standardized product, Low
switching Cost.

32 | P a g e
3.4 PEST ANALYSIS
PEST analysis is nothing but analysis of external environmental factors. The factors included in
PEST analysis are political/legal, economic, social-cultural, and technological. Each industry is
more or less affected by each of these factors. Every industry has to consider these factors because
these factors can create opportunity or threat at regular period of time. We will now discuss all
these factors in detail.
3.4.1. POLITICAL-LEGAL FACTORS
Many political factors affect and create opportunity or threat for the industry. Due to the
socialist leaning of some of the ministers many multinationals had to move out of India in the
late 70s. A deep-seated fear of multinationals made the political leaders to shut the door on
giant multinational companies for painfully long times. When things turned from bad to worse,
the situation was sought to remedy through a bold liberalization Programme in the early 90s.
Apart from a willingness to bend the rules and get along with the times, political stability is
also essential for economic growth. After liberalization steps taken by P.V. Narasimha Rao
government 1992, they could not make the bold decision on liberalization or could not
implement the planned programs because of the Babri Masjid demolition and subsequent
securities scams. The NDA government also could not go for bold decisions on
disinvestments, power sector reforms, and labor reforms etc. due to the scams of the ministers.
Recent UPA government is also find troubles because of the left parties who are giving
support.
The political party in power decides the legal framework. The government, therefore, may
legislate on matters like wage fixation, managerial remuneration, safety and health at work,
location of plants, entry of multinationals, price controls, import-export policy, licensing
policy etc. During the license-permit-raj that prevailed till the late 80s, licensing policies,
quota restrictions, import duties, FOREX regulations, restrictions on FDI flows, controls on
distribution and pricing of commodities, regulations on all aspects of corporate functioning,
had really put the captains of industry in a spot and pushed them to the wall. The liberalization
measures, macroeconomic reforms, and structural adjustments brought about in the early 90s
have altered the economic scenario quite dramatically. Obviously companies that want to do
business globally must pay attention to the above developments closely and learn to adapt
themselves to the laws of the land. The rules of competition, trademark rights, price controls,

33 | P a g e
product quality lows, and a number of other legal issues in individual countries may be of
special importance to global companies.
• Liberalization of the Sector • Interface form Other Agencies
• Excise Duty and Sales Tax on Aviation Turbine Fuel
• Modernization of Airports • Entry of Low Cost Carriers
3.4.2. ECONOMIC FACTORS
Economic factors throw light on the nature and direction of the economy in which the industry
operates. Interest rates, inflation rates, unemployment rates, gross national product, sectoral
growth rate of agriculture, industry infrastructure, level of disposable income, availability of
credits are some of the economical factors which affect more or less to each industry.
The World Economy
Demand for air travel is characterised by very high income elasticity. Research has shown that
there is a two-to-one relation between demand for air travel and world GDP. Therefore the
airline industry is very dependent on the world economy and its trade cycles. Particularly full
service airlines are susceptible to up- and downturns as they rely heavily on the high-yielding
Business Class/First Class passengers, who can be expected to drop in numbers when
economic activity is low. Another problem with the airline industry in the relation to the trade
cycle is that increasing capacity during upturns can be very difficult, as it often requires the
purchase of new aircraft.
However, the delivery time of an aircraft can be several years and if the airline, eager to prop
up capacity, purchases a large amount of aircraft, the trade cycle may be in a downturn at the
time of delivery, which means that these aircraft must stand idle as the capacity need is no
longer there, or be sold at a significant cost because of the lack of demand.
Therefore long-term planning is important within the airline industry as the investment in
aircraft is a significant financial burden, but of course predicting the development of the trade
cycle is evenly difficult.
Labour Costs
The level of labour costs usually also follow the level of economic activity. A higher level of
economic activity puts upward pressure on the wages as demand increases. However, in countries with
inflexible labour markets and/or strong unions, it is very difficult for airlines to reduce their labour
costs again through lowering wages or reducing the workforce, when theyare hit by downturns,

34 | P a g e
remembering from the research earlier mentioned that airlines generally are hit hard from a downturn
in the economy through the two-to-one correlation between air travel and world GDP.
Fuel Prices
The level of fuel prices has a profound impact on airline economics as the fuel costs constitute
10-14% of an airline‟s operating costs.85 This percentage obviously rises when fuel prices rise
sharply as is presently the case. Several measures can be taken by the airlines in order to lower
these costs.
Fuel-Efficient Aircraft
Through purchasing newer, more fuel-efficient aircraft, airlines can decrease the consumption
of fuel on their flights. Of course, airlines in financial peril often do not have this option as the
purchase of aircraft is very costly, so they cannot enjoy the long-term benefits of these more
fuel-efficient aircraft, as they would not be able to fulfil their short-term financial obligations
associated with such an investment. Additionally airlines specialising in short-haul flights
would benefit the most of more fuel-efficient aircraft as they use up more fuel, in relative
terms, than a long-haul flight as the largest consumption of fuel takes place in the processes of
take-off and landing. At cruising altitude (which is obviously longer on a long-haul flight) the
consumption of fuel is much lower.
3.4.3. SOCIAL FACTOR
The social factors that affect a firm include the values, attitudes, beliefs, opinions, and
lifestyles of persons in the social environment, as developed from demographic, cultural,
religious, educational, and ethnic conditioning. Like other forces in the external environment,
social factors change continually. As social attitudes, beliefs, and values change, so does the
demand for various types of dresses, books, leisure activities, etc.
• Developments in Airport Cities
• Employment Opportunities
• Ensuring a Level Playing Field
• Safety Regulation
• Increase in disposable income
• Increase in business travel
• Increase in consumer spending

35 | P a g e
Change In The Perception Of Air Travel
While air travel was earlier seen as an expensive cost and was not easily available financially
for lower- and middle class income groups, the low cost revolution that has made air travel
across Europe available to the larger public through lower fares.
3.4.4. TECHNOLOGICAL FACTOR
The Increasing use of the internet has provided money opportunities to airline. for e.g.
introduced a service, through the internet wherein the unoccupied seated are auctioned one
week prior to the departure. The internet also provided many internet based services to
customer such as online ticket booking, updated flight information & handling of customer
complaints.
Trade & development association is funding a feasibility study and workshop for the airports
authority of Indian as part of a long-term efforts to promote Indian aviation infrastructure. The
authority is developing modem communication, navigation, surveillance and air traffic
management systems for Indian aviation sector that will help the country meet the expected
growth and demand for air passenger and cargo service over the next decade.
These technological changes in the environment have an impact on airline industry in india as
well. Better airport infrastructure, means better handling of airplanes, which can help reduce
maintenance cost. It also facilities more flights to such destinations.
• Growth of Electronic Ticketing
• Satellite based Navigation Systems
• Technical Cooperation with EU
The Internet And Videoconferencing
The above mentioned factors are the most influential drivers of change in the airlines´
microenvironment regarding technological issues. However, as they influence the industry, it
is found more relevant to explore these topics more in-depth in the Five Forces industry
analysis in the next chapter under the sections of buyer power and threat from substitutes,
respectively, in order to compare them with others factors influencing the industry.

36 | P a g e
3.5 SWOT ANALYSIS
3.5.1 STRENGTH
Fastest transportation service.
Highly trained staff.
Ticket pricing is on the hand of players.
No substitute for international travellers as efficient as airlines.
Concentration on customer satisfaction.
High entry barriers to new player.
Large Route Network
Their extensive route network, particularly from its bases in London and Dublin but also ever
increasing in Continental Europe, provides it with a resource not available to all its
competitors as its customers can reach an airport close to almost any European destination at a
price below the competition. Although it was established in the previous section that most of
their cost advantage is lost when having to make a transfer on a point-to-point service like
Ryanair, one may still obtain a cheaper ticket than competitors for longer journeys between
smaller such as Aarhus-Palermo via London, where at least one transfer would also be needed
on any other airline increasing costs (at least from more airport fees and taxes) and travel time.
Network Of Business Partners
This network provides Ryanair with substantial ancillary revenue as shown in the financial
analysis through the mainly commission based partnerships with hotels, hostels, car rentals
etc. extending its value chain from just the traditional revenue stream of selling seats in an
aircraft to generating revenue both up and down the value chain from pre-flight revenue (e.g.
commission from airport buses) and post-flight (e.g. commission from car rentals).
Financial Resources
As shown in the example of its price war with Go in 2001 they have the financial resources to
force its competitors to retreat in price wars, which is a huge materialistic resource for an
airline as it enables it to defend its routes – and conquer other promising city-pairs. Its low
break-even load factor is also proof of the fact that Ryanair can sustain a prolonged period of

37 | P a g e
time with lower-than-average load factors and still remain profitable, where many other
airlines will sustain losses.
Non-Scheduled Revenues
Ryanair has achieved to bring in substantial ancillary revenue and profits through low-cost
ventures with various partners based on commission, which limits its risk exposure.
Furthermore they have achieved it solely by offering these services online through their
website, reducing the costs of providing the services to a minimum.
Other airlines are also beginning to offer these services (easyJet even as an integrated part of
their overall holding company as explained earlier), but Ryanair still has a competence here,
which other airlines have not yet been able to imitate with the same success.
Cost Leadership
Ryanair´s obvious competence is its ability to achieve cost leadership via its tireless efforts in
cutting costs throughout the organisation. These efforts conform to Porter‟s theory on
achieving overall cost leadership as analysed in the Ryanair case study, but it also conforms
with other theories.
With regards to its aim to achieve high market share and achieve economies of scale they also
conform with the PIMS (Profit Impact on Market Strategy) findings from where it may be
concluded that high volume and particularly high market share leads to lower overall costs and
is hence, related to higher profitability.221 Classical theory on the economies of scale per
product specification222 and production design and techniques223 as well as more recent
theory on lowering cost of input through bulk purchasing and standardisation224 (e.g.
homogenous fleet) and maximising capacity utilisation (e.g. low turnaround time) supports
Ryanair´s approach to cost leadership
Core Competence
Although Ryanair has created a competence in generating ancillary revenue, which is higher
than the industry in general and has therefore achieved a competitive advantage, I do not
assess this as a sustainable competitive advantage, making it a core competence, as this
competence can be duplicated with relative ease by its competitors as I cannot identify any
significant barriers to entry. Ryanair has a certain first-mover advantage that puts it higher on
the learning curve, but if the competition focuses on generating ancillary revenue as Ryanair
has done, I assess it as very feasible to reach the same competence, although Ryanair has an

38 | P a g e
advantage in its economies of scale and can therefore generate higher volume for its partners
in their network.
3.5.2 WEAKNESS
High maintenance cost.
Labour intensive industry.
Directly dependent on some other industry like tourism and corporate travellers.
High wages paid to the staff.
The Service Factor
As duplication is not an imminent threat or weakness as analysed above, one must consider the
scenario where customers may opt for other LFA´s where the no-frills approach is not as bare
bone as that of Ryanair. As mentioned earlier Southwest provides free soft drinks and snack
boxes on its flights as does Air Berlin and as the market matures passengers may consider
using an airline with a minimum of service. From its strategy of outsourcing customer related
functions such as call centers and check-in desks and the fact that it cannot be contacted by
neither phone (except for bookings) nor e-mail it is obvious that Ryanair puts little emphasis
on customer service and although I realise this is a part of their production design that leads to
lower costs one may consider options, which could create ancillary revenue to the company
but also give customers increased service value. A possibility would be to give customers
access to lounges, where this is possible as many of the airports services by Ryanair are
secondary airports without these facilities. However, at the airports with lounges operated by
e.g. Servisair, like Stansted and Dublin Airport customers could have the option at the time of
booking to buy an optional access to this lounge at a fee. This would generate
commissionbased
ancillary revenue for Ryanair and at the same time help terminate a potential weakness, while
giving passengers wishing to “upgrade” their service level this option. Also, Ryanair prides
itself for being “no. 1 for fewest complaints”228 but this does not necessarily mean they have
the most satisfied customers. The fact is that you cannot contact Ryanair´s customer service by
neither telephone, e-mail or letter correspondence. The only way of contacting them is by fax
and therefore many customers may refrain from contacting the airline as is would be too much
hassle for people not owning a fax and Ryanair also allow themselves 7 working days to

39 | P a g e
respond. They do, however, have contact phone numbers for each airport they serve in case of
lost baggage inquiries on arrival at the airports
Secondary and Provincial Airports
As it is an integral part of Ryanair´s strategy to use these airports as they are cheaper and less
congested it is also a double-edged sword as these airport are sometimes a significant distance
from the destination many passengers aim for. Airports that on Ryanair´s website are named
Brussels/Charleroi, Stockholm/Skavsta and Paris/Beauvais refer to the former being the
terminal destination for most travellers but the former being the airport and passenger can
expect bus travel times of 1-2 hours to reach their terminal destinations from these airports.
Ryanair, of course, has concluded that their low fares off-set this inconvenience, but it is a
drawback that is unfortunately not to be remedied if the fares must stay low, but some
travellers might be discouraged by the slightly rural locations of these airports.
3.5.3 OPPORTUNITIES
Percentage of people travelling in airline is increasing gradually.
Increase in per capita income will generate more passengers to airlines.
Air line can be used for cargo.
Large Untapped Indian market.
FDI‟s in Indian airline industry.
The full service airlines are under pressure from the low fare airlines. It has been estimated
that the market share for the latter will grow from 5% of intra-European short haul travel in
2000 to 25% in 2010 while the market share of the former will go down from 75% in 2000 to
60% in 2010 with the remaining 15% travelling with charter carriers.229 Some scholars even
suggest that their market share may drop to 40-50% in Europe and stabilise within this range
Industry Consolidation
As already described, there has been a tendency for consolidation in the full service airline
business as airlines such as KLM and Swiss has been acquired by Air France and Lufthansa,
respectively, and Sabena went bankrupt.
Regarding the low fare airlines, consolidation is also likely as the high oil prices keep margins
low and in relation to this Ryanair CEO recently stated “Only the lowest cost airlines like

40 | P a g e
Southwest in the US and Ryanair in Europe will prosper over the medium term and we expect
further casualties, cut backs and withdrawals among out loss-making competitors”.
Expansion
I also still see further opportunities for geographical expansion towards Eastern Europe for
LFA`s. This can also be seen by the emergence of two new LFA´s based in Eastern Europe
Wizz Air which operates from bases in Budapest, Hungary and Katowice and Warsaw, Poland
and Sky Europe, which is headquartered in Bratislava, Slovakia but also has bases in
Budapest, Hungary and Cracow and Warsaw in Poland.
3.5.4THREATS
Raising fuel costs.
Exchange rate fluctuations.
Taxes imposed by the government.
High competitive industry because of large number of players.
Oil Prices
Rising oil prices will obviously have an impact on the bottom line of all airlines, but LFA´s
will be hit harder if they do not introduce a fuel charge to off-set the rise, as their average fare
price is lower, hence the will the fuel cost be a higher percentage of the total fare price than
airlines with higher fares. As earlier stated Ryanair does not have fuel charges (as well
aseasyJet) but are instead trying to off-set the rising costs by luring customers from other
airlines to their flights, increasing load factors as that will obviously lower the fuel cost per
passenger on their aircraft.
Airport Fees
As explained in the PEST analysis EU legislation may put and end to the policy of Ryanair of
negotiating preferable contracts for their airline with publicly owned airports, which risks
increasing its costs as the airports are no longer allowed to give marketing incentives for more
than 5 years and other methods preferential treatment to attract airlines like Ryanair. Also
their negotiating position with airports may become weaker the more successful its operations
from this airport becomes. This may sound odd, but when Ryanair comes to an underutilised

41 | P a g e
airport it can more or less state its own terms, but as this airport grows with Ryanair´s success
it may attract other airlines and tursn its relationship with Ryanair from a dependency
relationship to an interdependency relationship as Ryanair also does not want to lose a
profitable route.
Passenger Rights
Community Regulation 261/2004 coming into force on February 17, 2005 giving passengers a
right for food and lodging as well as compensation is also a threat to Ryanair in particular as
they are adamant in their “no-frills” concept. An example was an incident at Beauvais airport
outside Paris were a flight was cancelled and all Ryanair offered was army bed cots in an
airport hangar with no food. This policy will not be allowed with the new regulation
Air Disaster
An air disaster in itself is a catastrophe, but for a LFA it is also financially potentially worse
than for a FSA, because there will always be more focus on a LFA as there will always be
speculation that its cost-cutting approach also involves making “short-cuts” with regards to
safety issues. Ryanair CEO has stated: “There are two threats to us not achieving long term
growth targets – an air accident, which could affect air peoples travel habits in short term and
management indiscipline, where we all took out eyes off the ball”. Safety and maintenance is
also an area where Ryanair is not interested in compromising on costs as this could potentially
put the airline out of business if an accident were to occur.

42 | P a g e
3.6 STRATEGIC GROUPS MAPPING
Strategic Groups
In some industries, groups of competitors are constrained by similar resource positions and
follow similar strategies. The groups or clusters of similar competitors are called strategic
groups. The alliance dynamics among the 35 largest firms in the worldwide airline industry
indicates that the likelihood of an alliance between any two firms depends on the local density
of alliances among the members of their strategic groups, rather than on the global density of
alliances in the industry. These results suggest that firms most closely observe and imitate the
strategic behavior of firms who occupy the same strategic niche rather than the behavior of
firms in their industry defined more broadly. Over time, the resource positions and strategies
are converging, and the sharp differences between strategic groups are eroding.
Strategic Group Mapping
A strategic group is a concept used in strategic management that groups companies within an
industry that have similar business models or similar combinations of strategies. For example,
the restaurant industry can be divided into several strategic groups including fast-food and
fine-dining based on variables such as preparation time, pricing, and presentation. The number
of groups within an industry and their composition depends on the dimensions used to define
the groups. Strategic management professors and consultants often make use of a two
dimensional grid to position firms along an industry's two most important dimensions in order
to distinguish direct rivals (those with similar strategies or business models) from indirect
rivals. Strategy is the direction and scope of an organization over the long term which achieves
advantages for the organization while business model refers to how the firm will generate
revenues or make money.
Strategic Group Analysis
Strategic Group Analysis (SGA) aims to identify organizations with similar strategic
characteristics, following similar strategies or competing on similar bases.
Such groups can usually be identified using two or perhaps three sets of characteristics as the
bases of competition.

43 | P a g e
Figure 3.1 Strategic Group Mapping
INTERPRETATION:
As per procedure of making group making, we have taken sales figure of three airline companies
on y axis. The sales figure is related to domestic airline booking of passengers in India As we
have observed that highest number of sales is of Jet Airways and that to the second highest sales
is being shared with Kingfisher airlines. We also observed that Jet Airways is the market leader
in the airline industry and there are no close competitors in that position. We also observed that
Kingfisher airlines and Spicejet is close competitors in airline industry. Now the Kingfisher
airlines are not having the license of carrying passengers in India, they are only in cargo section
of airline industry.
Spice Jet
3258.28
Kingfisher
4508.55
Jet Airways
13253.86
0
2000
4000
6000
8000
10000
12000
14000
16000
Sales

44 | P a g e
Chapter 4
Financial Analysis

45 | P a g e
FINANCIAL ANALYSIS
Financial analysis is an assessment of the (1) effectiveness with which funds (investment and
debt) are employed in a firm, (2) efficiency and profitability of its operations, and (3) value and
safety of debtors' claims against the firm's assets. It employs techniques such as 'funds flow
analysis' and financial ratios to understand the problems and opportunities inherent in an
investment or financing decision.
Tools of Financial Analysis
Ratio Analysis
Trend Analysis
Common Size Statements
I. RATIO ANALYSIS
Ratio analysis involves establishing a relevant financial relationship between components of
financial statement. Two companies may have earned the same amount of profit in a year, but
unless the profit is related to sales or total assets, it is not possible to conclude which of them is
more profitable. Ratio analysis helps in identifying significant relationship between financial
statement items for further investigation. If used with understanding of industry factor and
general economic conditions, it can be powerful tool for recognizing a company‟s strengths as
well as its potential trouble spots.
Ratio analysis is a process of comparison of one figure against another and the interpretation of
the ratio to know the strengths and weaknesses of the firm‟s operation and of its financial
position. Ratio analysis helps various interested parties like prospective investor, creditors, banks,
etc. to draw useful conclusions to serve their purpose.

46 | P a g e
Functional classification:
Ratios are also grouped in accordance with certain tests. On this basis there are four categories of
ratios.
Liquidity Ratios: These ratios indicate the position of liquidity. They are computed to ascertain
whether the company is capable of meeting its short-term obligations from its short term
resources. These are Current Ratio, Liquidity Ratio and Acid Test Ratio.
Profitability Ratios: A number of ratios are designed to indicate the profitability of the business
and are grouped into the category of profitability ratios. These are Gross Profit Ratio, Net Profit
Ratio, Return on Capital Employed, etc.
Leverage Ratios: The composition of capital of business and the proportion of owners‟ capital
and capital provided by outsiders are reflected by leverage ratios. These are Proprietary ratio,
Debt-equity ratio, Capital Gearing Ratio, and Fixed capital-Fixed Assets Ratio.
Efficiency Ratios: These are the ratios showing the effectiveness with which the resources of
the business are employed. It signifies the efficiency of the management. These are Debtors ratio,
Creditors‟ ratio, Total Assets Turnover, Fixed Assets, Turnover, etc..
II. TREND ANALYSIS
Trend Analysis is the practice of collecting information and attempting to spot a pattern, or
trend, in the information. In some fields of study, the term "trend analysis" has more formally
defined meanings Although trend analysis is often used to predict future events, it could be used
to estimate uncertain events in the past, such as how many ancient kings probably ruled between
two dates, based on data such as the average years which other known kings reigned.
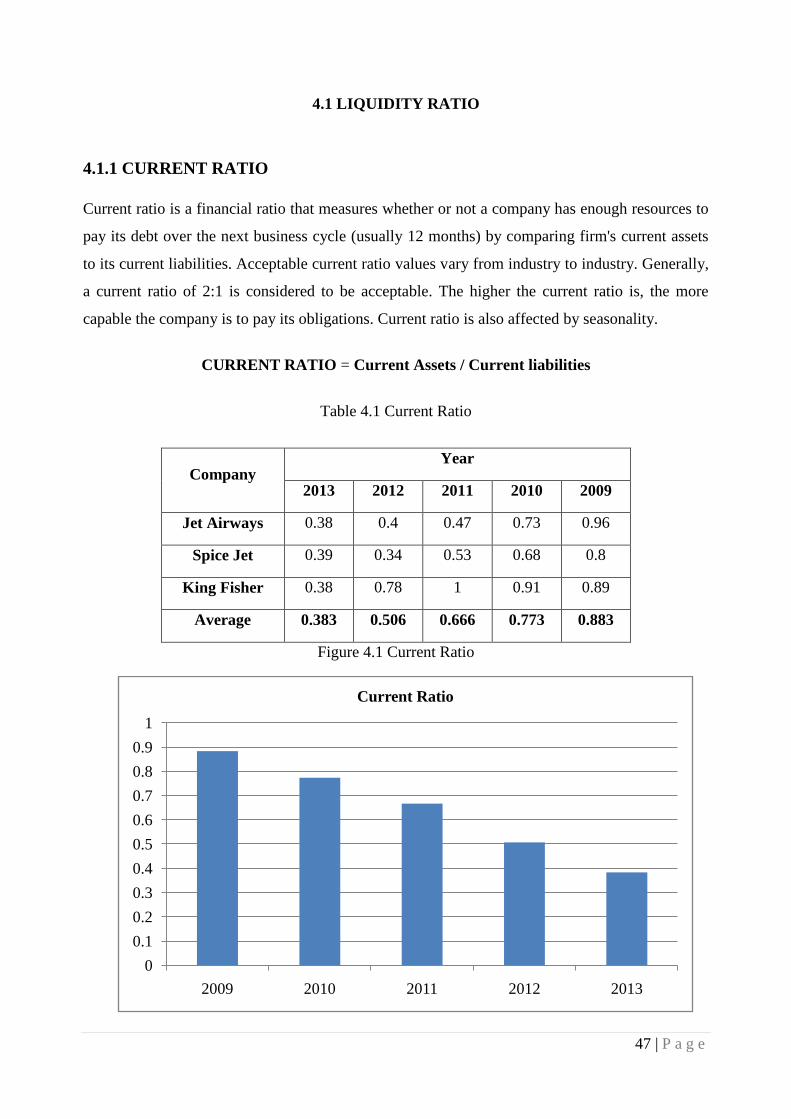
47 | P a g e
4.1 LIQUIDITY RATIO
4.1.1 CURRENT RATIO
Current ratio is a financial ratio that measures whether or not a company has enough resources to
pay its debt over the next business cycle (usually 12 months) by comparing firm's current assets
to its current liabilities. Acceptable current ratio values vary from industry to industry. Generally,
a current ratio of 2:1 is considered to be acceptable. The higher the current ratio is, the more
capable the company is to pay its obligations. Current ratio is also affected by seasonality.
CURRENT RATIO = Current Assets / Current liabilities
Table 4.1 Current Ratio
Company Year
2013 2012 2011 2010 2009
Jet Airways 0.38 0.4 0.47 0.73 0.96
Spice Jet 0.39 0.34 0.53 0.68 0.8
King Fisher 0.38 0.78 1 0.91 0.89
Average 0.383 0.506 0.666 0.773 0.883
Figure 4.1 Current Ratio
0
0.1
0.2
0.3
0.4
0.5
0.6
0.7
0.8
0.9
1
2009 2010 2011 2012 2013
Current Ratio

48 | P a g e
INTERPRETATION:
From the year 2009, Indian airline industry is going to increase its liability, Current Ratio is
continuously decreasing over a period of time. If current ratio is bellow 1 (current liabilities
exceed current assets), then the company may have problems paying its bills on time. However,
low values do not indicate a critical problem but should concern the management. Current ratio
gives an idea of company's operating efficiency. A high ratio indicates "safe" liquidity, but also it
can be a signal that the company has problems getting paid on its receivable or have long
inventory turnover, both symptoms that the company may not be efficiently using its current
assets. So, we can conclude that the industry is moderate for the investment purpose.

49 | P a g e
4.2 LEVERAGE RATIO
4.2.1 DEBT- EQUITY RATIO
Debt-Equity ratio indicates the relationship between total long-term debt and net worth.
Debt/equity ratio represents that how much debt is there in the company on the basis of total
equity, the more Debt Equity Ratio shows the company have more debt. The Debt and Equity
Capital of the company should be balanced to reduce tax payment and long term gain.
DEBT-EQUITY RATIO = Total liabilities / Shareholders Equity
Table 4.2 Debt Equity Ratio
Company Year
2013 2012 2011 2010 2009
Jet Airways 0 89.67 16.49 14.24 9.01
Spice Jet 0 6.29 0 0 0
Kingfisher 0 0 0 0 0
Average 0 31.986 5.496 4.746 3.003
Figure 4.2 Debt Equity Ratio
0
5
10
15
20
25
30
35
2009 2010 2011 2012 2013
Debt Equity Ratio

50 | P a g e
INTERPRETATION:
The ratio shows it is increasing continuous from 2009. So, it can be said that the industry is
taking more debt continuously for running the business, in the previous financial year the data
indicates above 31 percent of Debt Equity Ratio. It is not under control and it is not good for
industry because it increasing its debt.
By looking to the company, Kingfisher has bankrupted in the current year, it affects the whole
industry. Overall industry Debt Equity Ratio is increasing drastically, so that the industry is not
favorable to invest but we can say moderate. Also companies are going to borrow money for
increasing their business.

51 | P a g e
4.3 TURNOVER OR ACTIVITY RATIO
4.3.1 DEBTOR TURNOVER RATIO
Accounts receivable turnover ratio or debtors turnover ratio indicates the number of times the
debtors are turned over a year. The higher the value of debtors turnover the more efficient is the
management of debtors or more liquid the debtors are. Similarly, low debtors turnover ratio
implies inefficient management of debtors or less liquid debtors. It is the reliable measure of the
time of cash flow from credit sales. There is no rule of thumb which may be used as a norm to
interpret the ratio as it may be different from firm to firm.
DEBTOR TURNOVER RATIO = Net Credit Sales / Average Debtors
Table 4.3 Debtor Turnover Ratio
Company Year
2013 2012 2011 2010 2009
Jet Airways 14.17 13.68 14.56 13.57 11.31
Spice Jet 89.3 209.8 159.21 139.14 240.83
Kingfisher 4.83 17.49 16.67 16.99 34.77
Average 36.1 80.323 63.48 56.566 95.636
Figure 4.3Debtor Turnover Ratio
0
20
40
60
80
100
120
2009 2010 2011 2012 2013
Debtor Turnover Ratio

52 | P a g e
INTERPRETATION:
According to above graph we can say that the Debtor Turnover Ratio of airline industry is
fluctuating year to year. In 2009 it was above 95 times per year, after that it was decreased to 56
times in 2010, and increased till the year 2012, and in 2013 it displays 36 times per year. So, we
can say that 2009 and 2012 are more liquidate year out of last five years. It is normal in airline
industry where the investment is huge. but it also directly affect the liquidity of the industry.
So, The industry is moderate for investment.

53 | P a g e
4.3.2 INVENTORY TURNOVER RATIO
Inventory Turnover Ratio measures company's efficiency in turning its inventory into sales. Its
purpose is to measure the liquidity of the inventory. The Ratio is figured as "turnover times".
Average inventory should be used for inventory level to minimize the effect of seasonality.
A ratio showing how many times a company's inventory is sold and replaced over a period.
INVENTORY TURNOVER RATIO = Sales / Inventory
Table 4.4 Inventory Turnover Ratio
Company Year
2013 2012 2011 2010 2009
Jet Airways 22.19 20.5 19.96 17.73 20.29
Spice Jet 144.96 151.66 158.73 147.62 130.16
Kingfisher 2.48 27.17 34.9 31.82 53.49
Average 56.543 66.443 71.196 65.723 67.98
Figure 4.4 Inventory Turnover Ratio
0
10
20
30
40
50
60
70
80
2009 2010 2011 2012 2013
Inventory Turnover Ratio
54 | P a g e
INTERPRETATION:
In 2013, The Inventory Turnover Ratio was 56 times per year which was declined from 66 times
in 2012. A low inventory turnover ratio is a signal of inefficiency, since inventory usually has a
rate of return of zero. It also implies either poor sales or excess inventory. A low turnover rate
can indicate poor liquidity, possible overstocking, and obsolescence, but it may also reflect a
planned inventory buildup in the case of material shortages or in anticipation of rapidly rising
prices. A high inventory turnover ratio implies either strong sales or ineffective buying (the
company buys too often in small quantities, therefore the buying price is higher).A high inventory
turnover ratio can indicate better liquidity, but it can also indicate a shortage or inadequate
inventory levels, which may lead to a loss in business. As compared to previous four years the
Inventory Turnover Ratio is decreased in 2013.

55 | P a g e
4.4 PROFITABILITY RATIO
4.4.1 INTEREST COVERAGE RATIO
A ratio used to determine how easily a company can pay interest on outstanding debt. The
interest coverage ratio is calculated by dividing a company's earnings before interest and taxes
(EBIT) of one period by the company's interest expenses of the same period.
INTEREST COVERAGE RATIO = EBIT / Interest
Table 4.5 Interest Coverage Ratio
Company Year
2013 2012 2011 2010 2009
Jet Airways 0.17 -0.44 0.87 0.46 -1.46
Spice Jet -0.63 -10.21 10.94 6.96 -20.8
Kingfisher -1.99 -1.7 -0.16 -0.87 -1.77
Average -0.816 -4.116 3.883 2.183 -8.01
Figure 4.5 Interest Coverage Ratio
-10
-8
-6
-4
-2
0
2
4
6
2009 2010 2011 2012 2013
Interest Coverage Ratio

56 | P a g e
INTERPRETATION:
The lower the ratio, the more the company is burdened by debt expense. When a industries'
interest coverage ratio is 1.5 or lower, its ability to meet interest expenses may be questionable.
An interest coverage ratio below 1 indicates the industry is not generating sufficient revenues to
satisfy interest expenses. So, in the year 2009, 2012 and 2013 the industry was suffering burden
in the operations because of low Interest coverage Ratio. A company that barely manages to
cover its interest costs may easily fall into bankruptcy if its earnings suffer for even a single
month.
The lower the ratio is, the more a company is burdened by its debt expense. When a company's
interest coverage ratio is 1.5 or less, its ability to meet its interest expenses may be questionable.
An interest coverage ratio below 1 indicates that a company is not generating sufficient revenues
to satisfy interest expenses and should raise a red flag for investors.

57 | P a g e
1. Aggregate Industry Net Sales Trend
Table 4.6 Net Sales Trend
Figure 4.6 Net Sales
-20
0
20
40
60
80
100
120
2009 2010 2011 2012 2013
Net Sales
Year Company Net Sales
(%) Jet Airways Spice Jet Kingfisher
2009 30.85 30.46 263.47 108.26
2010 -9.5 29.1 -4.61 4.99
2011 22.62 31.91 26.5 27.01
2012 16.32 37.06 -13.24 13.38
2013 13.75 42.03 -90.88 -11.7

58 | P a g e
INTERPRETATION:
On the basis of the Net sales of the selected companies, we can interpret that overall Net sales of
the industry decreasing constantly.
From the above Figure we can interpret that in the year 2009, Net sales was at 108.26 % which
was higher in all five years, after 2009 net sales of the industry is continuously declining because
of bankrupt of kingfisher airline in previous year. In 2011 there was an up slop in the graph of net
sales of airline industry and spice jet was at top level in the sales in that year. 2013 is the very
poor year for the Indian airline industry because of the negative sales growth. It is not favorable
to invest in airline industry because of the continuous negative sales. So the sales trend of airline
industry is going to be stable or decline in next year +/- 10 to 15 %.

59 | P a g e
2. Aggregate industry PAT Trend
Table 4.7 PAT Trend
Year Company PAT
(%) Jet Airways Spice Jet Kingfisher
2009 58.99 164.08 755.12 326.06
2010 16.23 -117.43 2.39 -32.93
2011 -102.07 64.61 -37.63 -25.03
2012 -12856.5 -698.88 126.59 -4476.25
2013 -60.72 -68.46 84.76 -14.8067
Figure 4.7 PAT
-5000
-4000
-3000
-2000
-1000
0
1000
2009 2010 2011 2012 2013
PAT

60 | P a g e
INTERPRETATION:
Except 2009 the airline industry is constantly making loss, in the year 2012 there was a huge loss
in the industry because of the giant player Jet Airways. Though kingfisher was the leading profit
making company in 2009, after that there was very critical situation in airline industry with
subject to profitability.
From above figure we can see that in 2009 there was 326% growth in profit, in 2010 it was -32%,
but after 2011 there was through in the profitability of airline industry and in the previous it was
covered and reached at the level of -14%.
So we can say that the trend of PAT can predict positive profit 20 to 30% in next year.

61 | P a g e
3. Aggregate Industry Net Worth Trend
Table 4.8 Net Worth Trend
Year Company Net Worth
(%) Jet Airways Spice Jet Kingfisher
2009 -30.08 -1634.85 -1277.22 -980.71
2010 -36.12 -19.88 78.53 7.51
2011 1.17 -193.32 -11.67 -67.94
2012 -164.47 -145.85 60.82 -83.16
2013 81.76 52.44 139.07 91.09
Figure 4.8 Net Worth
-1200
-1000
-800
-600
-400
-200
0
200
2009 2010 2011 2012 2013
Net Worth

62 | P a g e
INTERPRETATION:
The amount by which assets exceed liabilities. Net worth is a concept applicable to individuals
and businesses as a key measure of how much an entity is worth. A consistent increase in net
worth indicates good financial health; conversely, net worth may be depleted by annual operating
losses or a substantial decrease in asset values relative to liabilities. In the business context, net
worth is also known as book value or shareholders' equity. The average net worth of airline
industry in 2009 was at -980% and after that it is increased to 7%, in previous it was 91% and it is
a good sign for industry.
So, we can say that Net Worth of an industry can be increase in next year.

63 | P a g e
Table 4.9 Common Size Balance Sheet
Mar 13 Mar 12 Mar 11 Mar 10 Mar 09
SOURCES OF FUNDS :
Share Capital -3.313 25.873 40.033 88.743 138.906
Reserves Total 120.97 -74.546 -33.826 -
242.843
-
398.153
Equity Share Warrants 0.263 0 0 2.143 3.48
Equity Application Money 0 0 0 3.696 0
Total Shareholders' Funds 117.92 -48.67 6.206 -148.26 -
255.763
Secured Loans 13.326 34.126 50.136 59.64 51.076
Unsecured Loans -35.113 109.816 41.18 188.613 304.69
Total Debt -21.786 143.943 91.316 248.26 355.763
Other Liabilities 3.866 4.733 2.476 0 0
Total Liabilities 100 100 100 100 100
APPLICATION OF FUNDS :
Gross Block 72.526 95.24 64.916 89.33 103.693
Less : Accumulated Depreciation 10.456 21.46 17.56 23.753 23.093
Less: Impairment of Assets 2.426 0 0 0 0
Net Block 59.64 73.783 47.356 65.576 80.596
Lease Adjustment 0 0 0 0 0
Capital Work in Progress 0.023 0.006 0.08 123.63 120.396
Investments 4.813 3.703 3.533 3.516 2.986
Current Assets, Loans & Advances
Inventories 1.35 4.773 4.596 8.216 10.073
Sundry Debtors 5.316 5.266 6.88 10.996 10.793
Cash and Bank 6.49 11.01 4.333 162.72 176.96
Loans and Advances 5.47 15.533 26.55 57.93 110.616
Total Current Assets 18.63 36.583 42.356 239.856 308.436
Less : Current Liabilities and
Provisions
Current Liabilities -11.99 97.53 94.353 299.28 356.193
Provisions -0.45 1.07 0.726 53.326 71.99
Total Current Liabilities -12.44 98.596 95.086 352.606 428.186
Net Current Assets 31.07 -62.016 -52.726 -112.75 -
119.747
Miscellaneous Expenses not written
off 0 0 0 0 0.043
Deferred Tax Assets 2.206 41.243 28.63 24.846 19.956
Deferred Tax Liability 2.206 4.47 4.94 4.823 4.233
Net Deferred Tax 0 36.77 23.686 20.026 15.72
Other Assets 4.45 47.756 78.07 0 0
Total Assets 100 100 100 100 100

64 | P a g e
Table 4.10 Common Size Profit & Loss A/c
INCOME : Mar 13 Mar 12 Mar 11 Mar 10 Mar 09
Sales Turnover 100 100 100 100 100
Excise Duty 1.043 1.036 0.706 0.713 0.27
Net Sales 98.956 98.963 99.293 99.286 99.73
Other Income 14.996 3.716 2.396 3.246 9.696
Stock Adjustments 0 0 0 0 0
Total Income 113.956 102.68 101.69 102.526 109.426
EXPENDITURE :
Raw Materials 0 0 0 0 0
Power & Fuel Cost 57.233 51.026 37.49 34.49 49.51
Employee Cost 29.253 10.946 9.78 11.19 12.366
Other Manufacturing Expenses 105.79 31.386 17.916 19.94 22.983
Selling and Administration Expenses 77.363 21.516 27.816 33.71 32.54
Miscellaneous Expenses 15.863 1.866 1.776 4.713 5.646
Less: Pre-operative Expenses
Capitalised 0 0 0 0 0
Total Expenditure 285.5 116.74 94.786 104.043 123.043
Operating Profit -
171.543 -14.06 6.903 -1.516 -13.613
Interest 98.326 10.32 9.896 10.59 7.396
Gross Profit -269.87 -24.386 -2.99 -12.106 -21.013
Depreciation 18.15 4.39 3.4 4.25 0.943
Profit Before Tax -
288.023 -28.77 -6.39 -16.356 -21.956
Tax 0 0.03 0.293 0.096 0.013
Fringe Benefit tax 0 0 0 -0.04 0.17
Deferred Tax 0 -6.856 -2.5 -5.03 -3.79
Reported Net Profit -
288.023 -21.946 -4.19 -11.383 -18.353
Extraordinary Items -1.12 0.233 -0.003 -2.14 4.483
Adjusted Net Profit -
286.903 -22.176 -4.18 -9.246 -22.836

65 | P a g e
CHAPTER 5
BUSINESS PLAN

66 | P a g e
Introduction
The tourism industry has undergone rapid growth of unsurpassed nature over the last several
decades. This has mainly been due to the advent of a 'borderless' world and increased information
dissemination about the majestic sceneries throughout the world, with the southern African
region being no exception.
We are on the brink of penetrating a lucrative market in a rapidly growing industry. The current
trend towards an increase in the number of tourists entering the country presents an opportunity
for Turocity to penetrate the market. An opportunity for Turocity‟s success exists because the
national tourism industry is growing at a rapid pace annually. Turocity is poised to take
advantage of this growth and moderate competition in the city travel portion of the industry, with
a dedicated and experienced staff, excellent networking, and effective management and
marketing. Our company intends to provide travel and adventure packages to tourists primarily in
the western region, but also the whole of India Services and products provided by Turocity will
initially include pre-arranged tours, custom packages according to clients specifications, travel
consultation, and as time progresses making reservations for lodging amongst other related
services. Our company seeks to differentiate itself as the premier adventure sections of Gujarat.
Our services will be positioned very carefully: they will be of extremely high quality,
comfortable, informative and tailored to the client‟s needs such that they will enable individuals
to have a greater appreciation of the natural environment and its intricacies.
Product and Services
We are totally into service industry that is serving our valuable customers in travelling throughout
India especially in Gujarat state. There are various places in Gujarat which has been developed by
the government of Gujarat and still developing into tourism sector of our country. Our customers
can book airline tickets online and can make payments through credit/debit cards and can cancel
the ticket online throughout India and can book travel site seeing in Gujarat state.

67 | P a g e
Name of the company: Turocity Private Limited
Address : Sardar Vallabhbhai Patel International Airport,
Ahmedabad
Gujarat 380003.
Contact Details: (079) 22869211/12/13
Email Id: [email protected]
Logo of the company
Partners of the company:
1) Patel Vimal Vishnubhai
2) Patel Vipul Jayantibhai
3) Patel Dixitkumar Kanubhai
4) Parmar Jayesh Vagjibhai
5) Zaloriya Kalpeshkumar Shivrambhai
6) Sandeep Paul

68 | P a g e
Strategy Of The Company
Initially we as Turocity will focus on the local market in the adventure travel sector. The target
customers will mainly include foreign tourists intending on sightseeing various attractions.
Our marketing strategy will emphasize focus. We are a relatively new company on the market
and hence must focus on certain kinds of services with certain kinds of clients. Initially the
business will focus on the local market, expanding into the regional market as time progresses,
and as we gain the necessary experience. Therefore the initial aim will be to instill awareness
and confidence in our services. In order to achieve its goal of becoming the premiere mobile
operator, turocity intends to adopt the following strategies:
1. Establish turocity reputation as a differentiated, specialty provider of city/ adventure travel and
excursions. This will be accomplished through a diverse marketing communications program
directed at tourocity.com target market, utilizing various media as well as the establishment of
strategic allies.
2. Provide unparalleled service to the tourists, local and international, of India in order to gain
repeat business and build trust. This will include providing superior service in all phases of the
transaction, including timely follow-through.
3. Aggressively promote excursions as healthy, eye-opening and exciting activities with those
who participate in them as appreciative of the finer things in life.
4. We intend to build image and awareness through consistency and distinctiveness in our service
provision.
Our strategy is to grow the business by nurturing clients, differentiating the service from our
competitors, particularly through service and staff behavior. All criteria from customer
satisfaction, service provision, price competitiveness to staff attitudes are to be looked at
thoroughly in the initial stages as areas for improvement. Alliances and collaboration with
hotels, lodges and travel agencies are to be adopted as strategies for market penetration.
Training will be conducted on a regular basis to ensure that our staff is fully meeting customer
expectations.
Through the implementation of a fair, effective and competitive remuneration policy we intend
to optimize our human resource output and advancement. We need the right people in the right
place at the right time if we are to ensure optimum growth. We intend to develop our team so
that our people can grow as the company grows - a mutually beneficial relationship. We are
currently vigorously searching and recruiting the right people for our organization.

69 | P a g e
Objective of Turocity
Our business strategy will revolve around the need to provide quality service to our various
target customers, in the process fully satisfying their needs. This shall be undertaken through
recruitment of a professional team and the provision of good quality custom-designed travel
packages, catering to the client's particular needs.
With time our marketing campaign will increase the awareness of our services in the various
market segments we shall be targeting. This is particularly so with the organization looking at
establishing a clear advantage in an increasingly competitive market. We will provide clients
with the opportunity to focus on their core activities whilst their transportation side needs are
fully satisfied. Marketing material shall be professionally done so as to be reflective of our
intended image and reputation. We shall position ourselves as a quality commercial
transportation operator that provides customer-need fulfillment, enjoyment, reliability and a
good image. We intend to establish a good rapport with all the relevant stakeholders,
especially hotels and travel agents.
We also intend to have well-designed brochures and other promotional material that will
enable clients to have an understanding of the types of services we offer and advantages of
utilizing them. In addition well-done, informative brochures, fact sheets and business cards
often have a triggering effect on clients contemplating utilizing our services. Hence this will
undoubtedly generate increased sales of our service.
In summary we intend to attain the following objectives:
Continuously provide enjoyable quality excursions/trips on time and on budget.
Develop enthusiastically satisfied customers all of the time.
Establish a market presence that assures short-term and long-term profitability, growth and
success.
We are fully committed to supporting growth and development in the tourism and overall
economy of India
Contribute positively to our communities and our environment.

70 | P a g e
Vision of Turocity
To become the leading travel agent company in Gujarat state in coming years.
Mission Statement of Turocity Private Limited
Internally we intend to create and nurture a healthy, exuberant, respectful, and enjoyable
environment, in which our employees are fairly compensated and encouraged to respect the
customer and the quality of the service we intend to provide. In addition follow-up will be
mandatory so as ensure customer satisfaction and make any improvements as recommended
by the customers in future. We seek fair and responsible profit, enough to keep the company
financially healthy for the short and long term, and to fairly remunerate employees for the
work and effort.
Market segment identification (Segmentation)
We are today experiencing a rapid growth in the economy of unsurpassed nature. This has
been brought about by, amongst other things, the relaxation of foreign exchange policies and
macroeconomic policies geared towards attracting foreign investors into the country. The
fiscal and monetary policies of the government geared towards maintaining growth with social
justice have largely contributed towards this, evidenced by our economy averaging a growth
rate of 7% since 1990 - very high by international standards.
The current drive and emphasis by the government on diversification of the industrial base
away from the minerals sector presents an opportunity for Turocity to make a valuable
contribution towards achieving this goal. Having undertaken a thorough and comprehensive
research of the market we realized that there was a need for a tourist transport company that
focuses on providing leisure excursions to tourists. Though there are mobile operators
currently on the market, some of whom have been in existence for a relatively long period of
time, we believe that there is a market need for one that specializes on providing comfortable
and enjoyable transport to tourists and visitors. This, also considering the fact that, potentially
India's richest natural resource, the tourism industry is becoming an increasingly important
player in the economy and may in the long term prove even more valuable than mineral
resources in earning foreign exchange.
Aware of the fact that operating in such a market is largely dependent on good networking, we
intend to establish networks and strategic relationships with various hotels, lodges and travel

71 | P a g e
agents to ensure a steady stream of clients. However in so doing we intend to ensure that the
service we provide is of extremely high quality and comfortable. Our initial overall target
market share shall be 10% of the market, mainly focusing on the state of Gujarat, which comes
on western part of India.
We appreciate that entering such a market is not a 'bed of roses' and will require us
establishing strong links with strategic partners as outlined previously. Hence we intend to
implement an aggressive marketing strategy, well supported by the other business functions.
The above prognosis influenced our decision to enter the tourist transport industry.
Segmentation
We will be focusing on those foreign tourists seeking leisure travel and excursions whilst on
vacation in India, with the intention of letting them see and appreciate the numerous
attractions in our country. Though we realize that the majority of our tourists come from South
Africa we shall be mainly targeting those from Europe and the Americas who often do not
have transport or adequate knowledge about the country, unlike their South African
counterparts who often do. Hence we shall be mainly targeting those who are not that mobile
but wanting to see as many sites as possible. These people often do not want to waste their
money on hiring vehicles to move about by themselves, but instead want to be escorted around
places of interest by a reliable source. Hence the need to professionally market ourselves and
the services we provide, offering a service of uncompromised nature.
Promotion Strategies of Turocity Private Limited
Promotional Strategies also plays very important role in increasing sales. Turocity can use
below types of Promotional Strategies which can help us.
Special honeymoon package discount for couples
Festival discount.
Lucky draw on turocity contest.
Free Entry fees of destination in Gujarat.
Discount on airfare tickets.

72 | P a g e
Opportunities and Risk
Current drive by government towards encouraging the participation of indigenous
entrepreneurs in tourism presents an opportunity which we may fully utilize.
Current growth rate of tourism presents an opportunity for ourselves which we may take
advantage of. This is further supported by the current marketing campaigns by both the
government and regional tourism body, the Gujarat tourism, aimed at promoting tourism into
the region.
International tourism trends indicate that today's traveler wants a more enriching experience
than that provided by conventional 'sun and sea' vacations.
The present growth in the tourism sector may result in an increasing number of firms entering
the market. This may led to increased competition emerging from a variety of given sources
including:
Established travel agencies, hotels and lodges may look at the development of new lines and
vertically integrate transportation so as to provide additional services to clients.
New marketing strategies and tactics by established companies aimed at providing excursions
of our intended nature.
Existing competition.
Other start-up travel companies generated by healthy nationwide economic and tourism
growth.

73 | P a g e
Personnel Plan
Sales Planning
Our marketing strategy will be based mainly on ensuring customers know about our existence
and the service we fulfill. Hence our intention is to make the right information available to the
right target customers. This will be done through implementing a market penetration strategy
that will ensure that we are well known and respected in the tourism industry. We will ensure
that our prices take into consideration peoples' budgets, that these people appreciate the
service, know that it exists, and how to contact us. The marketing will convey the sense of
quality in every picture, every promotion, and every publication. Our promotional strategy will
involve integrating advertising, events, personal selling, public relations, direct marketing and
the Internet, details of which are provided in the marketing section of this plan.

74 | P a g e
Company Ownership
Turocity is a Private Limited company incorporated at the Registrar of Companies through the
foresight and vision of all partners. It is a 100% wholly owned firm.

75 | P a g e

76 | P a g e
Main Competitors
We have identified competing companies, some firmly established, that fill the same needs as
Turocity. We intend to market ourselves in such a way that with time competitor customers
will choose our service over competitors' on the basis of our higher quality and informative
excursions. A more thorough outline of our main competitors including their strengths and
weaknesses follows:
1) Makemytrip.com: MakeMyTrip Limited, incorporated on April 28, 2000, is an online travel
company in India. The Company conducts its business principally through its Indian
subsidiary, MakeMyTrip (India) Private Limited (MMT India). Through its primary Website,
www.makemytrip.com, or MakeMyTrip.com, its subsidiaries‟ websites, such as
www.hoteltravel.com, www.makemytrip.ae, www.makemytrip.com.sg, and other technology-
enhanced distribution channels in India, including its call centers, travel stores and travel
agents‟ network, travelers can research, plan and book a wide range of travel services and
products in India as well as overseas.
2) Cleartrip.com: Cleartrip was launched in July 2006 and has grown to become an industry
leader in terms of market share and mind share by staying true to its mission of making travel
simple. Cleartrip is very customer oriented and offers convenience, choice without confusion,
multiple payment options, competitive prices, exclusive destination information and
unparalleled customer support.
3) Yatra.com: Yatra.com is an Indian online travel agency and a travel search engine based
in Gurgaon, Haryana, founded by Dhruv Shringi, Manish Amin and Sabina Chopra in August
2006. In April 2012, it was the second largest online travel website in India, with 30 per cent
share of the 370 billion (US$5.7 billion) market for all online travel-related transactions.

77 | P a g e
Projected Cash flow Statement

78 | P a g e
Projected Profit and Loss Account
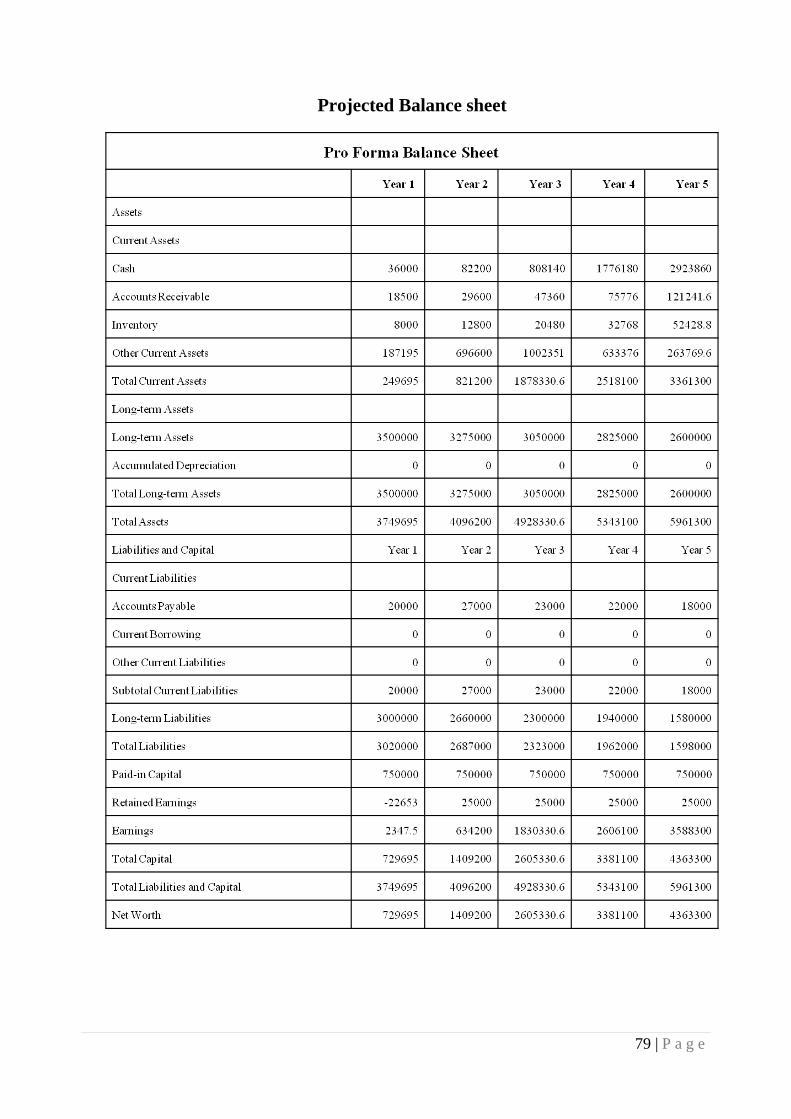
79 | P a g e
Projected Balance sheet
80 | P a g e
Chapter 6
Findings & Recommendation

81 | P a g e
Finding and Recommendations
A. At a macro level there are key leanings for the industry as a whole:
1. Benchmark against other countries
2. Create a clear demand profile and streamline procurement
3. Remove ambiguities in licensing and export policies
4. Establish a robust security policy
5. Bring clarity on the definition of defense equipment
6. Focus on limited platforms to build a vendor base
7. Policy incentive and clustering for MSMEs
8. Align policies to create synergies
9. Procurement and governance Improvements
10. Cost of capital to compete
B. At a company level, the following are key leanings from industry leaders:
1. Build capabilities for the long haul
2. Build capabilities for the global supply Chain
3. Acquisition and partnering to enter and grow
4. Lead with the engineering design and IT areas to build
5. Become a fabric of the industry

82 | P a g e
Chapter 7
Conclusion

83 | P a g e
Conclusion
In accordance with the requirements set forth by the Ministry of Corporate Affairs of the
Government of India, this report analyzed competition inhibiting provisions of statutes, rules,
policies and practices found within the regulatory framework of India„s civil aviation sector.
This report broadly analyzes India„s civil aviation sector, while recognizing the necessity that
deeper assessments of each sub-sector of India„s civil aviation must be undertaken
individually.
While assessing India„s civil aviation sector„s regulatory framework, certain provisions that
limit competition within the industry came to light. All regulations were analyzed and
categorized by looking at whether or not they limit the number and range of suppliers, limit
the suppliers„ ability to compete, reduce the incentive of the suppliers to compete, and affect
investment.
Based on the analysis of the preceding sections of this report we recommend creation of one
single civil aviation policy. This civil aviation policy should aim to reduce artificial barriers to
entry such as fleet and equity requirements. It should have clear delineation between
regulatory authorities that oversee activities in this sector, which would result in clear and
predictable regulatory outcomes. Furthermore, it should include a framework for monitoring
anticompetitive pricing behaviour within the sector. Additionally, this policy should aim to
create a more level competitive field between India„s private, national and foreign carriers. It
should also aim to introduce market mechanisms and incentives into the distribution of slots
and dispersion of routes. Lastly, this policy should aim to attract greater private investment
into India„s airports and improve the competitiveness of the government procurement process
within this sector.

84 | P a g e
Chapter 8
Bibliography

85 | P a g e
Bibliography
http://www.gbta.org/Lists/Resource%20Library/General%20Aviation%20Options%20for
%20Business.pdf
http://www.bga-aeroweb.com/General-Aviation.html
PwC Report - General Aviation – Unfolding Horizons
http://www.rediff.com/business/slide-show/slide-show-1-8-most-expensive-private-jets-
owned-by-indianbillionaires/20111230.htm
http://www.frost.com/sublib/display-market-insight-top.do?id=246211874
http://www.flightglobal.com/news/articles/in-focus-indian-business-aviation-snagged-by-
constraints-368757/
Harris Interactive‟s The Real World of Business Aviation: A Survey of Companies Using
General Aviation Aircraft
http://www.usitc.gov/publications/332/pub4314.pdf
http://msme.gov.in/MSME-Annual-Report-2011-12-English.pdf
http://pib.nic.in/newsite/erelease.aspx?relid=81107
http://eprocure.gov.in/cppp/sites/default/files/gos/imsme_FinalPressorder.pdf
http://www.airbus.com/company/worldwide-presence/airbus-in-india/
http://articles.economictimes.indiatimes.com/2012-04-07/news/31304874_1_defence-
ministry-cabinet-secretarycommerce-ministry

86 | P a g e
Chapter 9
Annexure

87 | P a g e
Annexure
1. Personnel Plan
2. Sales forecast
2. Profit and Loss Account
3. Cash flow Statement
Personnel Plan

88 | P a g e
Sales Forecast

89 | P a g e
Profit and Loss Account

90 | P a g e
Cash flow Statement