Embed Size (px)
Citation preview

www.ijcrt.org © 2020 IJCRT | Volume 8, Issue 6 June 2020 | ISSN: 2320-2882
IJCRT2006259 International Journal of Creative Research Thoughts (IJCRT) www.ijcrt.org 1903
A STUDY ON FINANCIAL PERFORMANCE OF
LAKSHMI MILLS LTD COIMBATORE
Dr.K.Karuppusamy*
Dr.R.Perumalsamy**
*Dr.K.Karuppusamy – Assistant Professor , NIFT –TEA College of Knitwear Fashion,
Tirupur.
* Dr.R.Perumalsamy – Head Of the Department , K.G. College of Arts & Science, Coimbatore
ABSTRACT
This project study gives the analysis of financial perform LAKHSMI MILLS COIMBATORE. The researcher
used the following tool li, ratio analysis, . The main aim of this study is to study the financial performance analysis of
the company, forecasting is also done to determine the future trend of the sales and profit.
Finally, findings, benefits to the company, valuable suggestion and recommendations are given to the company
for better prospects and improving the performance in future.
First and foremost I dedicate this project to the almighty lord who is solely responsible for all the outstanding
performance in my
FINANCIAL ANALYSIS
The financial statement provides of summary of the accounting of a business enterprise. To understand the
financial performance and condition of a firm, its stockholders look at three financial statements the balance
sheet, the profit and loss accounts and the sources and uses of funds statement.

www.ijcrt.org © 2020 IJCRT | Volume 8, Issue 6 June 2020 | ISSN: 2320-2882
IJCRT2006259 International Journal of Creative Research Thoughts (IJCRT) www.ijcrt.org 1904
BALANCE SHEET
It is a statement of financial position of a business at a specified moment of time. It represents all assets
owned by the firm at a particular moment of time and the equities of the owners and outsiders against those assets at
that time.
PROFIT AND LOSS ACCOUNTS
It shows what has happened to business as a result of operations between two balance sheet dates.
2. LITERATURE REVIEW
Financial analysis is a powerful mechanism which helps in ascertaining the strengths and weakness in the operation
and financial position of an enterprise.
According to Myers, Financial analysis is defined as follows:
“Financial statement analysis is largely a study of the relationship among the various financial factors in a
business as disclosed by a single set statement and a study of the trend of these factors as shows in series of
statement”.
“Financial analysis is the process of identifying the financial strengths and weakness of the firm by properly
establishing relationship between the items of the balance sheet and the profit and loss accounts”.
“Financial analysis can be undertaken by management of firm, or by parties of outside the firm, viz, own as
creditors, investors and others. The nature of analysis will differ depending on the purpose of analysis”.
LIMITATION OF THE STUDY
Every research has its own technical and managerial limitations. Time was one of the main limitations of this
study. Because of the lack of time the analysis is based on the secondary data collected from the balance sheet, profit
and loss accounts and other records of the organizations from years
2015-2019.
DATA COLLECTION DETAILS
For a research, researcher may depend either on primary data on secondary data. Primary data is usually
collected with the help of questionnaires. Secondary data is collected from published journals or magazines or
reports.
In the present study, most of the information is collected from balance sheets, profit and loss accounts and
other books of accounts of the company. Besides, some information’s are collected through discussions with finance
and other executives of the finance department.

www.ijcrt.org © 2020 IJCRT | Volume 8, Issue 6 June 2020 | ISSN: 2320-2882
IJCRT2006259 International Journal of Creative Research Thoughts (IJCRT) www.ijcrt.org 1905
Current Ratio
This ratio is an indicator of the firm’s commitment to meet its short-term liabilities. It is expressed as follows:
Current Asset
Current Liability
Current assets mean assets that will either be used up or converted into cash within a year’s time or during the
normal operating cycle of the business, whichever is longer. Current liabilities mean liabilities payable within a year
or by creation of current liabilities.
CALCULATION OF CURRENT RATIO
(2015-16 to 2018-19)
TABLE 3.1
Year Current
Asset(in
lakh)
Current
Liabilities (in
lakh)
Current
atio
2015-2016 16273.98 8015.90 2.03:1
2016-2017 16821.75 8414.81 1.99:1
2017-2018 7156.21 3086.59 2.31:1
2018-2019 7089.78 2247.49 3.15:1
Source: Secondary data
Significance
The current ratio is an index of the concern’s financial stability since it shows the extent of the working
capital which is the amount by which the current assets exceed the current liabilities.

www.ijcrt.org © 2020 IJCRT | Volume 8, Issue 6 June 2020 | ISSN: 2320-2882
IJCRT2006259 International Journal of Creative Research Thoughts (IJCRT) www.ijcrt.org 1906
CHART OF CURRENT RATIO
2. Quick Ratio
This ratio is also termed as ‘acid test ratio’ or ‘liquidity ratio’. This ratio is ascertained by comparing the
liquid assets (i.e., assets which are immediately convertible into cash without much loss) to current liabilities. Prepaid
expenses and stock are not taken as liquid assets. The ratio may be expressed as:
Liquid Assets
Current Liabilities

www.ijcrt.org © 2020 IJCRT | Volume 8, Issue 6 June 2020 | ISSN: 2320-2882
IJCRT2006259 International Journal of Creative Research Thoughts (IJCRT) www.ijcrt.org 1907
CALCULATION OF QUICK RATIO
(2015-2016 to 2018-2019)
source : secondary data
Significance
A comparison of the current ratio with quick ratio shall indicate the inventory hold-ups.
Year
Liquidity
Asset(in
lakhs)
Current
Liability(in
lakhs)
Quick
Ratio
2015-2016 10733.2 8015.9
1.33:1
2016-2017 10905.7 8414.81
1.30:1
2017-2018 3775.52 3086.59
1.22:1
2018-2019 3560.5 2247.49
1.58:1.

www.ijcrt.org © 2020 IJCRT | Volume 8, Issue 6 June 2020 | ISSN: 2320-2882
IJCRT2006259 International Journal of Creative Research Thoughts (IJCRT) www.ijcrt.org 1908
CHART OF QUICK RATIO
3. Working Capital Turnover Ratio
This is also known as Working Capital Leverage Ratio. This ratio indicates whether or not working capital has
been effectively utilized in making sales. In case a company can achieve higher volume of sales with relatively small
amount of working capital, it is an indication of the operating efficiency of the company. The ratio is calculated as
follows:

www.ijcrt.org © 2020 IJCRT | Volume 8, Issue 6 June 2020 | ISSN: 2320-2882
IJCRT2006259 International Journal of Creative Research Thoughts (IJCRT) www.ijcrt.org 1909
CALCULATION OF WORKING CAPITAL TURNOVER RATIO
(2015-2016 to 2018-2019)
TABLE 3.3
Year Net Sales
Working
Capital
Working
Capital
Turnover
Ratio
2015-2016 75,85,26 89,87,45 0.5
2016-2017 548,54,20 789,54,56 1.5
2017-2018 78,65,48 70,12,58 2.5
2018-2019 652,51,75 789,54,75 3.5
Source Data: Secondary Data

www.ijcrt.org © 2020 IJCRT | Volume 8, Issue 6 June 2020 | ISSN: 2320-2882
IJCRT2006259 International Journal of Creative Research Thoughts (IJCRT) www.ijcrt.org 1910
CHART OF WORKING CAPITAL TURNOVER RATIO
Operating Ratio
This ratio is a complementary of net profit ratio. In case the net profit ratio is 20%, it means that the operating
ratio is 80%. It is calculated as follows:
Operating Costs *100
Net Sales
Operating costs include the cost of direct materials, direct labour and other overheads, viz., factory, office or selling.
Financial charges such as interest, provision for taxation, etc., are generally excluded from operating costs.

www.ijcrt.org © 2020 IJCRT | Volume 8, Issue 6 June 2020 | ISSN: 2320-2882
IJCRT2006259 International Journal of Creative Research Thoughts (IJCRT) www.ijcrt.org 1911
Calculation of operating Ratio
(2015-2016 to 2018-2019)
TABLE3.4
Source: Secondary Data
Significance
This ratio is the test of the operational efficiency with which the business is being carried. The operating ratio
should be low enough to leave a portion of sales to give a fair return to the investors.
CHART OF OPERATING RATIO
Proprietary Ratio
It is a variant of debt-equity ratio. It establishes relationship between the proprietor’s funds and the
total tangibles assets. It may be expressed as:
Year
Operating
Cost Net Sales*100
Operating
Ratio
2015-2016 77,69,49 89,17,71 87.12
2016-2017 93,60,92 105,09,41 89.07
2017-2018 103,77,18 110,96,40 93.52
2018-2019 105,70,55 123,72,05 85.44
www.ijcrt.org © 2020 IJCRT | Volume 8, Issue 6 June 2020 | ISSN: 2320-2882
IJCRT2006259 International Journal of Creative Research Thoughts (IJCRT) www.ijcrt.org 1912
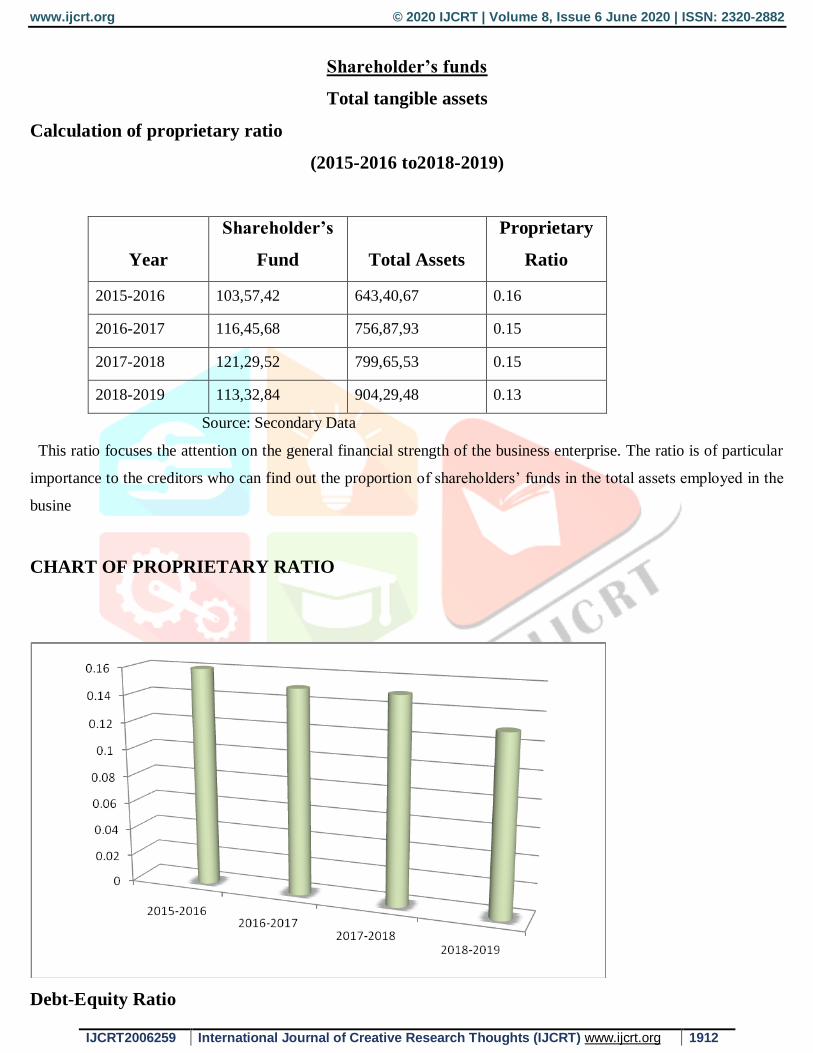
Shareholder’s funds
Total tangible assets
Calculation of proprietary ratio
(2015-2016 to2018-2019)
Year
Shareholder’s
Fund Total Assets
Proprietary
Ratio
2015-2016 103,57,42 643,40,67 0.16
2016-2017 116,45,68 756,87,93 0.15
2017-2018 121,29,52 799,65,53 0.15
2018-2019 113,32,84 904,29,48 0.13
Source: Secondary Data
This ratio focuses the attention on the general financial strength of the business enterprise. The ratio is of particular
importance to the creditors who can find out the proportion of shareholders’ funds in the total assets employed in the
busine
CHART OF PROPRIETARY RATIO
Debt-Equity Ratio

www.ijcrt.org © 2020 IJCRT | Volume 8, Issue 6 June 2020 | ISSN: 2320-2882
IJCRT2006259 International Journal of Creative Research Thoughts (IJCRT) www.ijcrt.org 1913
The debt-equity ratio is determined to ascertain the soundness of the long-term financial polices of the
company. It is also known as “External-Internal” equity ratio. It may be calculated as follows:
External Equities
Internal Equities
The term external equities refers to total outside liabilities and the term internal equities refers to shareho lders’
funds or the tangible net worth. In case the ratio is 1 it is considered to be quite satisfactory
CALCULATIONS OF DEBT-EQUITY RATIO
Year External Equity Internal Equity
Debt-Equity
Ratio
2015-2016 487,73,21 103,57,42 4.7
2016-2017 585,36,54 116,45,68 2.03
2017-2018 628,65,88 121,29,52 5.18
2018-2019 681,26,47 113,32,84 6.01
Source: Secondary Data
Significance
The ratio indicates the proportion of owners’ stake in the business. Excess liabilities tend to cause insolvency.
The ratio indicates the extent to which the firm depends upon outsiders for its existence. The ratio provides a margin
of safety to the creditors. It tells the owners the extent to which they can gain the benefits or maintain control with a
limited investment.

www.ijcrt.org © 2020 IJCRT | Volume 8, Issue 6 June 2020 | ISSN: 2320-2882
IJCRT2006259 International Journal of Creative Research Thoughts (IJCRT) www.ijcrt.org 1914
CHART OF DEBT-EQUITY RATIO
2 SUGGESTION AND RECOMMENDATION
1. It is observed that the company does not follow any method of financing of working capital. So, in order
to maintain a trade – off between profitability and liquidity, the company should follow a well planned
financing performance of working capital.
2. As the average debt collection period is 30 days the debt collection process should be accelerated so as to
maximize credit sales and to minimize cost associated with debt collection and investment in debtors.
3. The profitability ratios based on sales are an important indicator of the operational efficiency of
manufacturing enterprise. However, they suffer from a serious limitation in that they are not useful from
the viewpoint of the owners of the firm
4. The operating ratio will indicate whether the cost component is high or low in the figure of sales. In case
of the comparison shows that there is increase in this ratio, the reason for such increase should be found
out and management be advised to check the increase.
5. The proprietary ratio focused the attention on the general financial strength of business enterprise. The
ratio is of particular importance to the creditors who can find out the proportion of shareholders funds in
the total assets employed in the business.

www.ijcrt.org © 2020 IJCRT | Volume 8, Issue 6 June 2020 | ISSN: 2320-2882
IJCRT2006259 International Journal of Creative Research Thoughts (IJCRT) www.ijcrt.org 1915
Conclusion
Indian Banking sector contributes 8.6% for the Indian economy in 2018 The phenomenal growth of the
banking industry is the positive sign for the growth and development of the country as the more number of investors
are interested to operate the banks. In this current economic scenario ING vysya bank is performing outstanding
manner its consistent profit from the last 4 years and it is performing well in the sector