Embed Size (px)
Citation preview

IOSR Journal of Business and Management (IOSR-JBM)
e-ISSN: 2278-487X, p-ISSN: 2319-7668. Volume 22, Issue 6. Ser. VIII (June. 2020), PP 39-51
www.iosrjournals.org
DOI: 10.9790/487X-2206083951 www.iosrjournals.org 39 | Page
‘A Study on factors affecting exchange rate in foreign exchange
market.’
Yashvi Shah, Kosha Modi Student, Faculty of Management, GLS University, Ahmedabad-380006.
Student, Faculty of Management, GLS University, Ahmedabad-380006.
Abstract The foreign exchange market is the world’s largest market with highest volume of trade transactions. The
foreign exchange markets are subject to high volatility between currency exchange rates. The research focuses
over factors that influence foreign exchange rates with increased focus over impact of crude oil prices over
exchange rate and impact of NSE (Nifty 50) equity investment on share prices. For conducting analysis the
historical data of past 10 years is taken into consideration and results are derived by conducting univariate
analysis, correlation analysis, regression and R square analysis. The data collected has been collected through
authenticated data sources of Reserve Bank of India. Four currency pairs have been taken for consideration.
Analysis of US Dollar, Great British Pound, Euro and Japanese Yen has been considered for evaluation with
comparison to Indian rupee.
Upon analysis of the data collected findings suggest that crude oil prices have significantly less impact as
compared to the impact caused by the price and investment in Nifty 50. Since the past 10 years Indian rupee has
faced depreciation. The continuous fall in Indian rupee is warning signal for the Indian economy and all its
sectors.
Keywords: Depriciation, univariate, correlation, regression, R Square
----------------------------------------------------------------------------------------------------------------------------- ----------
Date of Submission: 08-06-2020 Date of Acceptance: 25-06-2020
----------------------------------------------------------------------------------------------------------------------------- ----------
I. Introduction The foreign exchange market in India originated in 1978 when banks were permitted to undertake
intraday trading in currencies but major changes that helped in building of modern foreign exchange market
were introduced in 1990s. Till 1992-1993 the foreign exchange market was fully under the control of Indian
government who monitored and regulated all the policies to control exchange rates, import-export policies,
foreign direct investment and foreign institutional investment, etc. Foreign Exchange Regulation Act (FERA)
was enacted in 1973 which helped the government a lot to regulate exchange rates. After the economic reforms
of 1991 Indian government liberalized foreign exchange market and introduced Foreign Exchange Management
Act (FEMA) in 1999, which liberalized foreign exchange trading, Import-Export procedures, etc.
Reserve Bank of India (RBI) still has the necessary authority and powers to regulate the exchange rates
and foreign exchange transactions. The exchange rate in the foreign exchange market saw periods of high
volatility since May 2013. To regulate the depreciation of the Indian Rupee policies included necessary
measures to control CRR ratio, Trading restrictions and market interventions.
The Indian foreign exchange market majorly deals in 4 currency pairs that contribute to majority of the
transactions in Multi Commodity Exchange. These currency pairs include USD/INR (US Dollar/Indian Rupee),
EUR/INR (EURO/Indian Rupee), GBP/INR (Great British Pound/Indian Rupee) and JPY/INR (Japanese
Yen/Indian Rupee). Besides them any currency can be traded on a international market.
II. Objective Primary Objectives
To analyze currency pairs and their exchange rates and evaluate major factors responsible for change in
their values.
Secondary Objectives
To analyze the relation between Currencies, Nifty 50 and Crude oil.
To study dependency between Currencies, Nifty 50 and Crude oil.
To forecast the future prices.

‘A Study on factors affecting exchange rate in foreign exchange market.’
DOI: 10.9790/487X-2206083951 www.iosrjournals.org 40 | Page
III. Data Methodology The research design for this research is descriptive and causal. The data will be collected through
secondary data collection from various sources such as books, research papers, magazines, periodical articles
and journal articles. Required data for conducting forecasting and analysis will be gathered from websites of
Indian as well as foreign exchanges such as BSE, NSE, NASDAQ, etc. All the data collected will be relative to
the topic and will help in understanding and analyzing multiple aspects of foreign exchange market.
IV. Literature Review Deepa Gulati and Monika Kakhani (Nov, 2012) It tells us about the stock market and foreign market. It
also tells us about whether there is a casual relationship or not between the foreign exchange rate and stock
market. By claiming the relationships between the INR/ $ exchange rate the Indian stock indices were
determined for data 2004 and 2012.
Ayush Singh, (2016) he had studied the impact of the INR – USD on Indian economy. The factors
which have been affecting the Indian currency rates that leads to the depreciation of Indian rupee against the US
dollars. Due to that it has been affecting a lot on the Indian economy such as the demand and supply of
currencies, changing interest rates and the technical factors.
Mr Srikanth, (2014) analyzed how the foreign exchange currencies are been greatly determined by the
forward markets and it was been prepared by the changing interest rates, and balance of the payments. Since,
many years the Indian foreign exchange markets have been proved by the long lasting component.
Prof Michael, (2013) analyzed the USD and INR the ancient data and also to understand that how the
Indian rupee affects the Indian economy. In this paper it specially focuses on the forecast of the INR – USD
exchange rates. The most significant variables those hypothetically affect foreign exchange rate, balance of
trade, interest rate and inflation rates.
Dr. R Venkata Raman, (2015) this study examined about the bonds between the stock return and
foreign exchange in India throughout the duration time from 2000 January to 2014 June. The outcome
recommend that us dollars and euro lasting connections with the CNN and Sensex.
Desis lava Dimintrova (2005) investigated the link between the stock prices, exchange rate, fiscal
policy and monetary policy. The study concluded that the interest rate parity conditional effects the stock prices
significantly.
Tomoe Moore, Eric. J. Pentecost (2006) entitled ―The Sources of Real Exchange Rate Fluctuations in
India ― attempted to find out the different sources of exchange rate appreciation by using Value at risk
approach. There are nominal shocks which play an important role in defining nominal exchange rate, but, for the
case of real exchange rates, nominal shocks are inapplicable. The study further explores that nominal and real
exchange rates are not co integrated, i.e, they are not having any linear relationship in the long run.
(1)Analysis of USD/INR and crude oil Correlation between USD/INR and crude oil.
Change % CRUDE OIL Change % USD/INR
Change % CRUDE OIL 1
Change % USD/INR 0.120734479 1
Interpretation: The correlation value comes (-0.602627222) which means there is a negative correlation.
Interpretation: - The R Square value is 0.01421501 which is less than 50% which shows less dependency on
crude oil on USD/INR.
ANOVA
Df SS MS F Significance F
Regression 1 13.0540566 13.0540566 2.004379 0.159082343
Regression Statistics
Multiple R 0.119226716
R Square 0.01421501
Adjusted R Square 0.007123032
Standard Error 2.55201289
Observations 141

‘A Study on factors affecting exchange rate in foreign exchange market.’
DOI: 10.9790/487X-2206083951 www.iosrjournals.org 41 | Page
Residual 139 905.2750012 6.512769793
Total 140 918.3290578
Interpretation: - The value of significance F in one way anova is 0.159082343 which being more than 0.05 so
it can be said that USD/INR prices do not have a significant impact over crude oil.
Coefficients Standard Error t Stat P-value Lower 95% Upper 95%
Intercept 0.4376309 0.215240211 2.03329 0.0438 0.01207086 0.8632053
X Variable 1 0.0324207 0.022899852 1.41579 0.1590 -0.0128563 0.0776977
Regression Slope: 0.032420713 Y intercept: 0.437639009 Regression Line: Y= a+ bx USD = 0.437639009 +
0.032420713 Crude oil.

‘A Study on factors affecting exchange rate in foreign exchange market.’
DOI: 10.9790/487X-2206083951 www.iosrjournals.org 42 | Page
(2)Analysis of USD/ INR and Nifty 50. Correlation between USD/INR Exchange rate and Nifty 50.
Change % NIFTY 50 Change % USD/INR
Change % NIFTY 50 1
Change % USD/INR -0.602627222 1
Interpretation:- The correlation value comes (-0.602627222) which means there is a negative correlation.
Regression Statistics
Multiple R 0.627209531
R Square 0.393391796
Adjusted R Square 0.389027708
Standard Error 2.001916241
Observations 141
Interpretation:- The value of R Square is 0.393391796 which is less than 50% which shows less dependency
of Nifty 50 on USD/INR .
ANOVA
Df SS MS F Significance F
Regression 1 361.2631176 361.2631176 90.14296104 8.70435E-17
Residual 139 557.0659402 4.007668635
Total 140 918.3290578
Interpretation:- The value of F significant in one way anova is 0.00 which being less than 0.05 so it can be said
that Nifty 50 prices have a significant impact over USD/INR exchange rate.
Coefficients Standard Error t Stat P-value Lower 95% Upper 95%
Intercept 0.6604090 0.169983657 3.885132721 0.0001576 0.3243211 0.99649696
X variable 1 0.2634321 0.027746156 -9.494364699 8.70435E- -0.3182912 -0.20857304
Regression slope: -0.26343212 Y intercept: 0.660409068 Regression line: Y = a +bx
USD = 0.660409068 + (-0.26343212) Nifty 50.

‘A Study on factors affecting exchange rate in foreign exchange market.’
DOI: 10.9790/487X-2206083951 www.iosrjournals.org 43 | Page
(3) Analysis of GBP/INR and Nifty 50. Correlation between GBP/INR and Nifty 50.
Change % NIFTY 50 Change % GBP/INR
Change % NIFTY 50 1
Change % GBP/INR -0.17588612 1
Interpretation:- The correlation value is -0.17588612 which means there is a negative correlation.
R square analysis:-
Interpretation: The value is 0.033637729 which is less than 50% which shows less dependency on Nifty 50
and GBP/INR.
ANOVA
df SS MS F Significance F
Regression 1 43.09447892 43.09447892 4.838397 0.029485106
Residual 139 1238.040739 8.906767909
Total 140 1281.135218
Interpretation: - The value of F significant 0.029485106 which is less than 0.05 so it can be said that nifty 50
prices have a significant impact on GBP/INR exchange rate.Table 3.14
Coefficients Standard Error t Stat P-value Lower 95% Upper 95%
Intercept 0.2320565 0.25340859 0.91574 0.3613 -0.268977 0.7330903
X variable 1 -0.0909845 0.041363472 -2.19963 0.0294 -0.1727675 -0.00920
Regression slope: -0.090984567 Y intercept: 0.232056578 Regression line: Y= a+bx
GBP = 0.232056578 + (-0.090984567) Nifty 50.
Regression Statistics
Multiple R 0.183405912
R Square 0.033637729
Adjusted R Square 0.026685482
Standard Error 2.984420867
Observations 141

‘A Study on factors affecting exchange rate in foreign exchange market.’
DOI: 10.9790/487X-2206083951 www.iosrjournals.org 44 | Page
(4)Analysis of GBP/INR and crude oil.
Correlation between GBP/INR Exchange rate and Crude oil.
Change % CRUDE OIL Change % GBP/INR
Change % CRUDE OIL 1
Change % GBP/INR 0.494791563 1
Interpretation:- The correlation value comes 0.494791563 which means there is a positive correlation.
R square analysis:-
Regression Statistics
Multiple R 0.494895465
R Square 0.244921522
Adjusted R Square 0.239489302
Standard Error 2.638068881
Observations 141

‘A Study on factors affecting exchange rate in foreign exchange market.’
DOI: 10.9790/487X-2206083951 www.iosrjournals.org 45 | Page
Interpretation:- The value of R Square is 0.244921522 which is less than 50% which shows less dependency
of crude oil on GBP/INR.
ANOVA
df SS MS F Significance F
Regression 1 313.777587 313.777587 45.08683 4.43156E-10
Residual 139 967.3576313 6.95940742
Total 140 1281.135218
Interpretation:- The value of significance F in one way anova is 0.000000000443 which being less than 0.05
so it can be said that Crude oil prices have a significant impact over GBP/INR exchange rate.
Coefficients Standard Error t Stat P-value Lower 95% Upper 95%
Intercept 0.0791858 0.222498289 0.35589405 0.72249 -0.360732837 0.51910447
X variable 1 0.1589500 0.023672054 6.71467239 4.43E-10 0.112146232 0.205753948
Regression slope: 0.15895009 Y intercept: 0.079185817 Regression line: Y = a + bx
GBP = 0.079185817 + 0.15895009 CRUDE OIL

‘A Study on factors affecting exchange rate in foreign exchange market.’
DOI: 10.9790/487X-2206083951 www.iosrjournals.org 46 | Page
(5) Analysis of EUR/INR and nifty 50. The correlation between EUR/INR and Nifty 50.
Change % NIFTY 50 Change % EUR/INR
Change % NIFTY 50 1
Change % EUR/INR
-0.106128134 1
Interpretation:- The correlation value is 0.494791563 which means there is a positive correlation .
R square analysis:-
Regression Statistics
Multiple R 0.099813129
R Square 0.009962661
Adjusted R Square 0.00284009
Standard Error 2.87092653
Observations 141
Interpretation: - The value of R Square is 0.009962661 which is less than 50% which shows less dependency
of nifty 50 on EUR / INR.
ANOVA
Df SS MS F Significance F
Regression 1 11.52876337 11.52876337 1.398745 0.238952834
Residual 139 1145.66846 8.242219138
Total 140 1157.197224
Interpretation:- The value of significance F in one way anova 0.238952834 is which being greater than 0.05 so
it can be said that Nifty 50 prices do not have a significant impact over EUR/INR.
Coefficients Standard Error t Stat P-value Lower 95% Upper 95%
Intercept 0.2943056 0.243771733 1.20730 0.2293 -0.18767441 0.7762856
X variable 1 -0.0470596 0.039790463 -1.1826 0.2389 -0.12573242 0.0316132
Regression slope: -0.047059605 Y intercept: 0.294305617 Regression line: Y = a+bx
EUR = 0.294305617 + (-0.047059605) Nifty 50.

‘A Study on factors affecting exchange rate in foreign exchange market.’
DOI: 10.9790/487X-2206083951 www.iosrjournals.org 47 | Page
(6) Analysis of EUR/INR and crude oil.
Correlation between EUR/INR exchange rate and crude oil.
Change % CRUDE OIL Change % EUR/INR
Change % CRUDE OIL 1
Change % EUR/INR 0.367681079 1
Interpretation:- The correlation value is 0.367681079 which means there is a positive correlation.
R square analysis:-
Regression Statistics
Multiple R 0.370535714
R Square 0.137296715
Adjusted R Square 0.131090217
Standard Error 2.67995201
Observations 141
Interpretation:- The value is 0.137296715 which is less than 50% which shows less dependency of Crude oil
on EUR / INR.
ANOVA
Df SS MS F Significance F
Regression 1 158.8793778 158.8793778 22.12145 6.1039E-06
Residual 139 998.3178457 7.182142775
Total 140 1157.197224
Interpretation: - The value of significance F in one way anova 0.00000610390 is which being less than 0.05 so
it can be said that crude oil prices have a significant impact over EUR/INR crude oil.
Coefficients Standard Error t Stat P-value Lower 95% Upper 95%
Intercept 0.1993612 0.226030769 0.88200 0.3792 -0.24754171 0.6462642
X variable 1 0.1131054 0.024047882 4.70334 6.1E- 0.06555852 0.1606524
Regression slope: 0.113105464 Y intercept: 0.199361279 Regression line: Y = a +bx
EUR = 0.199361279 + 0.113105464 CRUDE OIL.
‘A Study on factors affecting exchange rate in foreign exchange market.’
DOI: 10.9790/487X-2206083951 www.iosrjournals.org 48 | Page
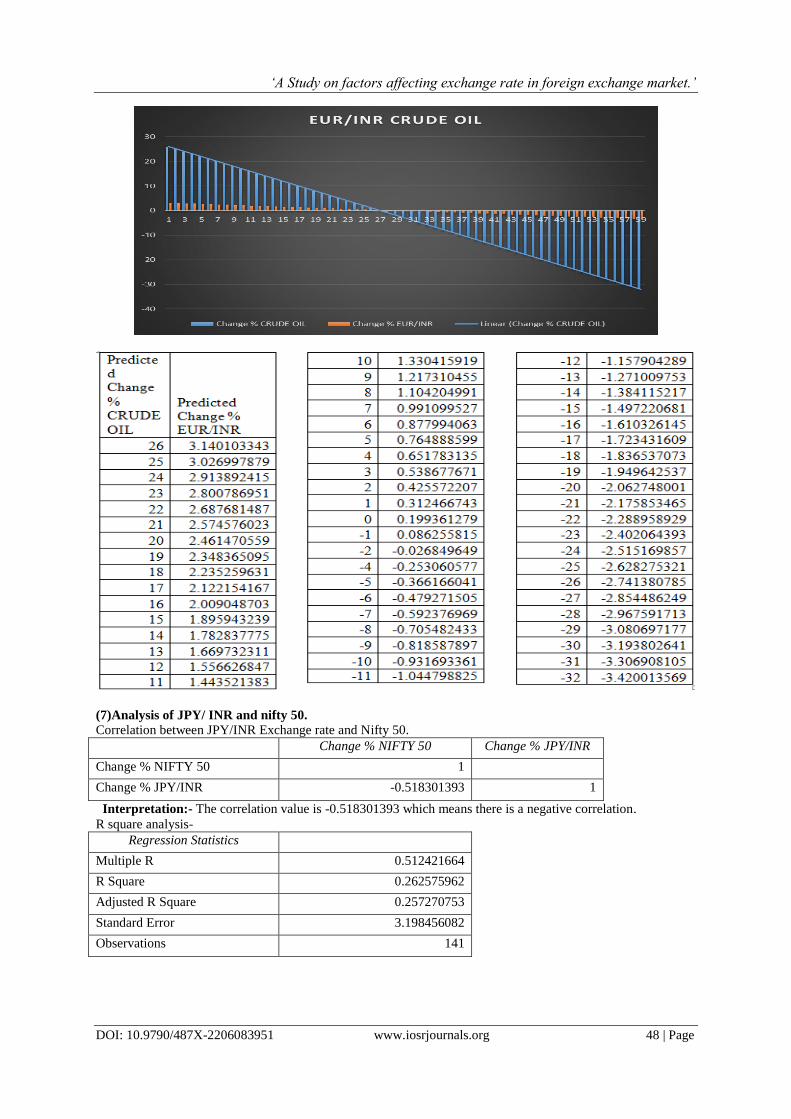
(7)Analysis of JPY/ INR and nifty 50.
Correlation between JPY/INR Exchange rate and Nifty 50.
Change % NIFTY 50 Change % JPY/INR
Change % NIFTY 50 1
Change % JPY/INR -0.518301393 1
Interpretation:- The correlation value is -0.518301393 which means there is a negative correlation.
R square analysis-
Regression Statistics
Multiple R 0.512421664
R Square 0.262575962
Adjusted R Square 0.257270753
Standard Error 3.198456082
Observations 141

‘A Study on factors affecting exchange rate in foreign exchange market.’
DOI: 10.9790/487X-2206083951 www.iosrjournals.org 49 | Page
Interpretation: - The value of R Square is 0.262575962 is which is less than 50% which shows less
dependency of Nifty 50 on JPY / INR.
ANOVA
df SS MS F Significance F
Regression 1 506.3295311 506.3295311 49.49399 8.28158E-11
Residual 139 1421.986862 10.23012131
Total 140 1928.316393
Interpretation:- The value of significance F in one way anova 0.00 is which being less than 0.05 so it can be
said that nifty 50 prices have a significant impact over JPY/INR.
Coefficients Standard Error t Stat P-value Lower 95% Upper 95%
Y Intercept 0.7227757 0.271582422 2.661 0.0086 0.1858090 1.2597424
X variable 1 -0.3118699 0.044329957 -7.035 8.28E- -0.399518161 -0.2242217
Regression slope: - 0.311869959 Y intercept: 0.722775743 Regression line: Y = a+bx
JPY = 0.722775743 + (-0.311869959) Nifty 50

‘A Study on factors affecting exchange rate in foreign exchange market.’
DOI: 10.9790/487X-2206083951 www.iosrjournals.org 50 | Page
(8)Analysis of JPY/INR and Crude oil.
Correlation between JPY/INR Exchange rate and Crude oil.
Change % CRUDE OIL Change % JPY/INR
Change % CRUDE OIL 1
Change % JPY/INR -0.06405339 1
Interpretation:- The correlation value is -0.06405339 which means there is a negative correlation.
R-Square analysis:-
Regression Statistics
Multiple R 0.059448732
R Square 0.003534152
Adjusted R Square -0.003634667
Standard Error 3.718030567
Observations 141
Interpretation:- The value of R Square is 0.003534152 which is less than 50% which shows less dependency
of Crude on JPY / INR.
ANOVA
Df SS MS F Significance F
Regression 1 6.814962724 6.814962724 0.49298939 0.483770896
Residual 139 1921.50143 13.8237513
Total 140 1928.316393
Interpretation:- The value of significance F in one way anova is 0.483770896 which being greater than 0.05
so it can be said that Crude oil prices do not have a significant impact over JPY/INR.
Coefficients Standard Error t Stat P-value Lower 95% Upper 95%
Intercept 0.4908071 0.313583715 1.5651551 0.119820 -0.129203 1.110817883
X Variable 1 -0.023425 0.033362822 -0.7021320 0.4837708 -0.089389 0.042539121
Regression slope: -0.023425106 Y intercept: 0.490807157 Regression line: Y = a+ bx
JPY = 0.490807157 + (-0.023425106) Crude oil

‘A Study on factors affecting exchange rate in foreign exchange market.’
DOI: 10.9790/487X-2206083951 www.iosrjournals.org 51 | Page
HYPOTHESIS
So crude oil prices do not have significant impact over USD/INR, Nifty 50 prices have a significant impact over
USD/INR.
Crude oil prices have significant impact over GBP/INR and are same in case of NIFTY 50.
Crude oil prices have significant impact over EUR/INR; Nifty 50 prices do not have a significant impact over
EUR/INR.
Crude oil prices do not have significant impact over JPY/INR; Nifty 50 prices have a significant impact over
JPY/INR.
V. Conclusion In the past 10 years Indian rupee has seen a significant decline in relation to some of the major
currencies of forex market. The decline in rupee value is a warning signal for the Indian economy. The decrease
in the value of rupee affects all the sectors of the economy. Due to the decline in rupee, there is hidden inflation
which results in declining the growth of economy. The Indian government should take initiatives to encourage
the foreign investment to larger extent and not only for short term. Efforts should be made to reduce the import
and encourage exports in order to bring current account deficit to lower level.
Bibliography [1]. Aghion, P., Bacchetta, P., Ranciere, R., & Rogoff, K. (2006). Exchange Rate Volatility And Productivity Growth: The Role of
Financial Development. Cambridge. Massachusetts: National Bureau Of Economic Research. Retrieved from
https://www.nber.org/papers/w12117.pdf
[2]. Amadeo, K. (2018, November 8). US Dollar Symbols and Denominations. Retrieved from The balance:
https://www.thebalance.com/the-u-s-dollar-3305729
[3]. Amadeo, K. (2019, January 28). Why the US Dollar Is the Global Currency. Retrieved from The Balance: https://www.thebalance.com/world-currency-3305931
[4]. Betz, e. (2018, January 18). What Happened the last Time Antartica Melted. Discover. Retrieved from
http://blogs.discovermagazine.com/crux/2018/01/18/antarctica-melted-joides/#.WpLjsK6WbIU [5]. Catherine, S. (2013). The global gold market and the international monetary system. Enlighten – Research publications by members
of the University of Glasgow (pp. 17-38). University of Glasgow. Retrieved from http://eprints.gla.ac.uk/90725/1/90725.pdf
[6]. Colacito, R., & Croce, M. M. (2007, November 27). Risks for Long Run and real Exchange Rate. [7]. D.Bordo, M., & Eichengreen, b. (1991). A Retrospective on the Bretton Woods System: Lessons forInternational Monetary Reform.
(pp. 3-108). University of Chicago Press. Retrieved from https://www.nber.org/chapters/c6867.pdf
[8]. Dave, D. (2017, December 7). Let's Save This Planet. Retrieved from Lazyfragilethoughts: http://lazyfragilethoughts.blogspot.in/2017/12/lets-save-this-planet.html
[9]. Ebsworth-Goold, E. (2018, January 2). Higher environmental impact from cookstove emissions. The source. Retrieved from
https://source.wustl.edu/2018/01/researchers-discover-higher-environmental-impact-cookstove-emissions/ [10]. Engel, C. (2011). The Real Exchange rate, real interest rates and the risk premium. Massachusetts: National Bureau of Economic
Research. Retrieved from https://www.nber.org/papers/w17116.pdf
[11]. http://eprints.whiterose.ac.uk/83/1/thomascd1.pdf8
Yashvi Shah, et. al. “A Study on factors affecting exchange rate in foreign exchange market."
IOSR Journal of Business and Management (IOSR-JBM), 22(6), 2020, pp. 39-51.