Embed Size (px)
Citation preview
A study on Enterprise Architecture framework
effects on business processes automation
By
Salama AlDhaheri
Dissertation submitted in partial fulfillment of
MSc Information Technology Management
Faculty of Engineering & IT
Dissertation Supervisor
Dr.Khaled Shaalan
May-2011
Page 2 of 121
Abstract
Enterprise Architecture (EA) concept is used usually within the Information
Technology (IT) area, it supports designing and planning of multiple architectural
layers, starting from technology architecture, going through application architecture and
information architecture and ending at the business architecture. Where EA framework,
organizes, describes and presents all the information contains within the EA to support
decision-making. Currently there is new approach for delivering the business using
business services, which demands great understanding to the organization processes and
the supporting technology for these processes. Many organizations encounter issues
with documenting their business processes and the IT architecture because of the fast
growing and complex environment. Adopting EA framework can empower the IT
governance to facilitate solutions that supports understanding the different layers in the
organization and identify the business services for automation. The aim of this research
is to provide insight to the business processes automation projects and the attached
risks, EA framework was discussed as a solution to mitigate or avoid that risk. The
research study was conducted within UAE government organizations; this shall include
the local, federal and semi government organizations. Based on the proposed
methodology to collect the data, a survey, literature review and interviews were carried
to study the possible effect of EA on business processes automation. The observations
recommended EA as a strong supporter to the identified success factors in business
processes automation initiatives, EA could be adopted and implemented by the IT or the
business, however the observations showed that EA implementations requires power
and authority for the change management process.
Key words: Enterprise Architecture, Enterprise System, Chief Information Officer
(CIO), Information Technology (IT) Management, Business Process Automation
(BPA).
Page 3 of 121
Acknowledgements
This dissertation is the last part of my master in IT management at the British university
in dubai. During my academic life I studied different modules in IT and business, so, I
decided to write my dissertation in Enterprise Architecture, EA is an important part in
the IT and business relationship. I couldn’t finish my writing without the help of many
people around me. I would like to thank my mother, father and, my great aunt for their
encouragement and prayers. Thanks to my supervisor Dr.Khalid Shaalan for his
patience in advising me, also for his efforts and follow up helping me to deliver my
dissertation. Aysha and Fatma, thank you for your positive encouragements as friends. I
appreciate all the time and support from my colleagues at work.
Thanks to The Emirates Foundation and The British University in Dubai (BUiD) for the
scholarship and their support during my study. I am confident that I will add a value to
the community with my research; I enjoyed doing this research because it relates to my
job and will be of a great support.
Page 4 of 121
List of abbreviations CIO: Chief Information Officer
DoDAF: Department of Defense Architecture Framework
EA: Enterprise Architecture
FEAF: Federal Enterprise Architecture Framework
IT: Information Technology
KPI: Key Performance Indicator
SOA: Services Oriented Architecture
SaaS: Software as a Service
TOGAF: The Open Group Architecture Framework
List of illustrations Figure 1: Architectural representations (creative homeowner 2004 in Jacobs 2008, p40)
................................................................................................................................ 12
Figure 2: The EA elements (Knippel 2005, p15) ........................................................... 13
Figure 3: EA context (Jacobs 2008, p38) ....................................................................... 14
Figure 4: Architecture Governance Framework - Organizational structure (The Open
Group 2006, p9) ...................................................................................................... 15
Figure 5: Typical enterprise architecture reporting structure (Feurer 2007, p9) ............ 16
Figure 6: Typical entry points (Jensen, Cline & Owen 2011, p22) ................................ 17
Figure 7: Bi chart for the used Enterprise frameworks in 2005 (IFEAD 2005, p28) ..... 20
Figure 8: Bar chart for the used Enterprise frameworks in 2005 (IFEAD 2005, p28) ... 20
Figure 9: The EA tools (IFEAD 2005, p29) ................................................................... 21
Figure 10: TOGAF ADM phase model (Jensen, Cline & Owen 2011, p95) ................. 24
Figure 11 : Segments and services (Enterprise Architecture) (OMB 2007, p3) ............. 26
Figure 12: Projects success factors (CHAOS 2009, p3) ................................................. 30
Figure 13: Project resolution (CHAOS 2009, p1) .......................................................... 30
Figure 14: Empirical cycle (Manor college 2006, p1). ................................................... 35
Figure 15: Evaluating information systems (Gammelgard, Ekstedt & Narman 2010, p3)
................................................................................................................................ 61
Figure 16: Service component reference model (OMB 2005, p19) ............................... 62
Figure 17: Extended influence diagrams (EID) (Raderius, Narman & Ekstedt 2009, p3)
................................................................................................................................ 63
Page 5 of 121
Figure 18: Results assessment (Raderius, Narman & Ekstedt 2009, p10) ..................... 63
Figure 19: Strategy and technology creates a gap between business and the IT (Celik
2009, p2) ................................................................................................................. 64
Figure 20: Objective of EA (Celik 2009, p2) ................................................................. 64
Figure 21: Scania IT area R&D’s concept for EA (Celik 2009,p4) ............................... 65
Figure 22: IT projects phases (Celik 2009, p26) ............................................................ 65
Figure 23: Celik (2009) .................................................................................................. 67
Figure 24-A: Application decisions (Franke and Johnson 2009, p2) ............................ 68
Figure 24-B: Decisions and the calculation of the related utilities (Franke and Johnson
2009, p3) ................................................................................................................. 68
Figure 25: MODAF architecture (Franke & Johnson 2009, p6) .................................... 69
Figure 26: Meta model (Franke & Johnson 2009, p8) ................................................... 70
Figure 27: Bayesian network tool GeNIe to illustrate the use of the method for scenario-
based decision making (Franke & Johnson 2009, p9) ............................................ 71
Figure 28: Conceptual view of an IT/Business alignment operationalization ................ 72
(Saat et al. 2010, p4). ...................................................................................................... 72
Figure 29: The core meta-model (Saat et al. 2010, p7) .................................................. 74
Figure 30: Meta model fragment for as-is situation A on its prioritized qualities ......... 75
(Saat et al. 2010, p7) ....................................................................................................... 75
List of tables Table 1: Zachman framework for enterprise architecture (Saenz 2005, p51) ................ 22
Table 2: Description of TOGAF ADM phases (Josey et al. 2009) ................................ 25
Table 3: SOA issues (Knippel 2005, p20) ...................................................................... 32
Table 4: SOA and EA relation (Knippel 2005, p20) ...................................................... 33
Table 5: Advantages of face-to-face interviews (Niemann 2005, p193) ........................ 39
Table 6: Disadvantages of face-to-face interviews (Niemann 2005, p193) ................... 39
Table 7: Interview analyses report organization A and B .............................................. 58
Table 8: Interview analyses report organization C and D .............................................. 60
Table 9: Four clusters prioritized the following qualities high or very high in their to-be
situations (Saat et al. 2010, p10). ............................................................................ 73
Page 6 of 121
Table of content
1. Introduction ............................................................................................................. 8 1.1. Statement of the problem .................................................................................................................. 8 1.2. Research aim and objectives ............................................................................................................ 9 1.3. The research questions ...................................................................................................................... 9 1.4. Research approach ............................................................................................................................ 10 1.5. The organization of the dissertation ......................................................................................... 10
2. Literature review ................................................................................................... 11 2.1. What is Enterprise architecture .................................................................................................. 11 2.2. Role of enterprise architecture team ........................................................................................ 14 2.3. Benefits of enterprise architecture ............................................................................................ 16 2.4. Enterprise architecture frameworks ......................................................................................... 19 2.4.1. Zachman Framework ................................................................................................................... 21 2.4.2. Open Group Architectural Framework (TOGAF) ............................................................. 23 2.4.3. Federal Enterprise Architecture Framework (FEAF) .................................................... 26
2.5. Business Process Automation (BPA) ......................................................................................... 27 2.6. Rational behind enterprise architecture implementation with business process
automation ........................................................................................................................................................ 28 2.7. Business process automation matters ...................................................................................... 29 2.8. Summary ................................................................................................................................................ 33
3. Methodology ........................................................................................................... 34 3.1. Research methodology design ..................................................................................................... 34 3.2. Empirical research ............................................................................................................................. 35 3.3. Hypothesis and research question ............................................................................................. 36 3.4. Limitations of empirical research ............................................................................................... 37 3.5. Data collection ..................................................................................................................................... 37 3.6. Instrumentation .................................................................................................................................. 38 3.6.1. Interviews method ......................................................................................................................... 38 3.6.2. Interview design ............................................................................................................................. 39 3.6.3. Survey method ................................................................................................................................ 42 3.6.4. Survey Design .................................................................................................................................. 42
3.7. Research validity and reliability .................................................................................................. 49
Page 7 of 121
3.8. Methodology procedure .................................................................................................................. 49 3.9. Research methodology limitations ............................................................................................. 49 3.10. Summary ............................................................................................................................................. 50
4. Findings and discussion ......................................................................................... 51 4.1. Survey results ...................................................................................................................................... 51 4.2. Interview results ................................................................................................................................ 55 4.3. EA strengths in supporting BPA projects ................................................................................ 60 4.3.1. Evaluating different information systems using EA ....................................................... 60 4.3.2. Calculating service quality of existing information system using EA ..................... 62 4.3.3. Managing IT portfolio using EA .............................................................................................. 64 4.3.4. Application consolidation using EA ....................................................................................... 67 4.3.5. IT strategy alignment with business strategy using EA ............................................... 71
4.4. Answering the research questions ............................................................................................. 75 4.5. Summary: .............................................................................................................................................. 79
5. Conclusion and recommendations ....................................................................... 80
5.1. Conclusion ............................................................................................................................................. 80 5.2. Limitations ............................................................................................................................................ 80 5.3. Recommendations and further work ........................................................................................ 80
6. Appendix A: Survey questions ............................................................................. 82
7. Appendix B: Survey data analysis report ............................................................ 89
8. References ............................................................................................................. 117
Page 8 of 121
1. Introduction This chapter will introduce the research study. The first section will discuss the problem
area of enterprise architecture and its necessity to business processes automation
projects. The second section will define the research aim and objectives. Research
questions will be presented in the third section and the methodology to answer the
research questions will be covered in the fourth section of this chapter. The last section
intends to describe the structure of the thesis.
1.1. Statement of the problem In the last decade, the IT field was focusing on two main problems, which are, the
complexity of IT systems and, the difficulty to align the IT systems to the business
needs (Sessions 2007). Today, the same concern is still on the CIO’s agenda, but the
fact that government demands to reduce the spending, have accelerated the need for less
complex IT environments that can be managed and linked to the business strategy.
However, some organizations are seeking efficiency into their business processes,
which could require investment in the process re-engineering initiatives and integration
between the IT systems. Currently, the trend is how to transform the IT to a real value to
organization’s business.
The concept of enterprise architecture was introduced in the past 20 years, as a support
to the decision-making process, such as, adopting new technology, changes to the
information system and documenting IT architectures. As a result many theories and
studies were built based on the enterprise architecture frameworks. One main value for
the enterprise architecture is it acts as a common language between the IT and the
business, and can saves time and effort when mapping the technology to the
organization strategy and processes.
This research argument is about, how essential it is, to have enterprise architecture
framework in the process of implementing an automation initiative. Adopting an
enterprise architecture framework might add value to the automation initiative, in terms
of selecting the right technology and processes.
Page 9 of 121
1.2. Research aim and objectives This research aims to examine the necessity of implementing enterprise architecture
framework for the organizations, as a baseline to achieve their business strategy. The
research study intended to cover UAE government organizations. The objectives which
has been set to achieve the aim are:
• Identify the attached risk with the processes automation initiatives
• Presents the success factors for automation initiatives
• Explore the strength of the enterprise architecture framework
1.3. The research questions Based on the aim and objectives listed in the previous section. The main question for
the research is: How dose implementing enterprise architecture framework affects the
business processes automation initiatives?
In order to answer the above question, there are sub-questions has to be answered first. I
divided the questions into two parts. The aim of part one questions is to learn if there
are issues with the automation initiatives, a survey and literature review will be used to
answer these questions. Where as in part two, the aim is to explore the preparation that
was taken to implement the automation initiatives, part two requires detailed
information; therefore it will be answered using face-to-face interviews. Below are the
questions of part one and two:
Part one:
RQ1-A: What are the issues and risks encountered during the implementation of
business process automation projects?
RQ1-B: What is the root causes for the issues collected from RQ1-A?
RQ1-C: What success factors can be obtained based on the result of RQ1-B?
Part two:
RQ2-A: How dose the technology solution for automation is selected?
RQ2-B: How dose the processes to be automated are selected?
RQ2-C: Are there any hindering reasons for not implementing enterprise architecture
framework?
Page 10 of 121
By answering the questions in part one and two, the answers can be analyzed and
mapped to the capabilities of the enterprise architecture, which will facilitate the answer
for the main question of this research.
1.4. Research approach In order to answer the research question and sub-questions identified in the previous
section, a research approach was designed. The first phase in the approach is to review
the existing related work and find initial information about business processes
automation issues and concerns, the collected information will be included in a survey
to test the validity of this information in UAE government organizations. In parallel
another procedure will be triggered to gather detailed information about existing
business processes automation, face-to-face interviews for this procedure will be used.
After collecting the required data, literature review will be initiated to find EA related
work, which focus on the issues, and concerns that were gathered by the first and
second phases. Final discussion about the findings will be conducted to locate any
correlation between implementing EA and successful business processes automation
initiatives.
1.5. The organization of the dissertation After this section, the dissertation will be structured as follows:
Chapter 2 will review the related literature review in the research topic; it will discuss
the Enterprise Architecture (EA) concept and the benefits from implementing EA to IT
and business strategy. Further more it will present the concept of Business Process
Automation (BPA) and the motivation behind BPA implementations. The relation
between EA and BPA will be introduced as well.
Chapter 3 will discuss the adopted methodology to answer this research question. The
design of the used instrumentations is included with justifications.
Chapter 4 will review the findings and the data analysis.
Chapter 5 is about the final recommendations and conclusion of this research. Also it
will have the research limitations and further work.
Page 11 of 121
2. Literature review 2.1. What is Enterprise architecture
Enterprise architecture has become a more popular term that has been introduced
recently with the SOA. Enterprise architecture differs from the SOA in a way that it
deals with data processing. Koch (2007, p20) stated, “Enterprise architecture role is to
deliver the information and analysis that helps organizations understand how to leverage
the value of proposition of SOA.”
Across many references, there were multiple descriptions and definitions related to the
enterprise architecture, but going into the planned objectives for each enterprise
architecture initiative, the reader can understand better the concept and the
characteristics of that particular enterprise architecture.
In general, enterprise architecture is commonly viewed as a discipline that merges
strategic business and IT objectives with opportunities for change and governs the
resulting change initiatives (Jensen, Cline & Owen 2011). It drives the organization
portfolio in a strategic context by directing the change toward common enterprise goals.
Stevenson (1995 in Jacobs 2008) defined the EA as and integrator between:
• Business planning parts such as goals, visions, strategies and governance principles
• Business operations parts such as business terms, organization structures, business
processes and data
• Application systems and databases
• Computers, operating systems and networks of the technology infrastructure.
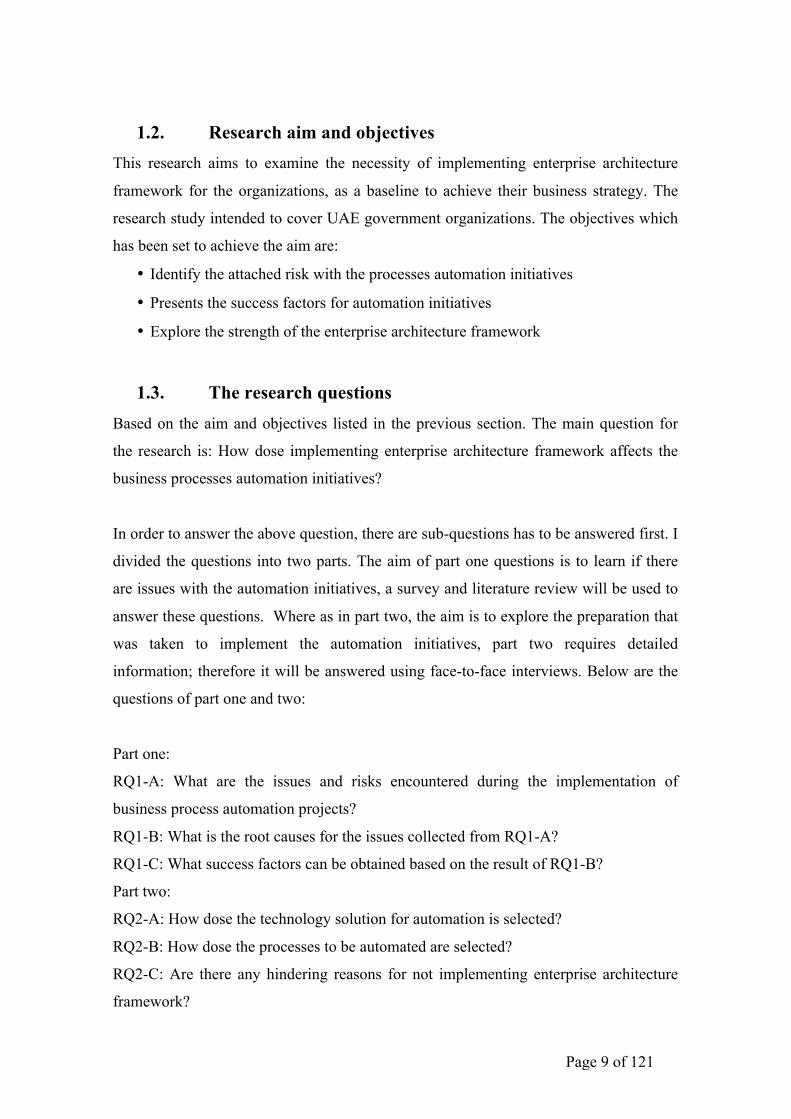
Another engineering definition stated by Jacobs (2008, p39) that simulate the EA as
drawings for a building ”The first principle is that there is a set of architectural
representations produced over the process of building a complex engineering product
representing the different perspectives of the different participants”.
Page 12 of 121
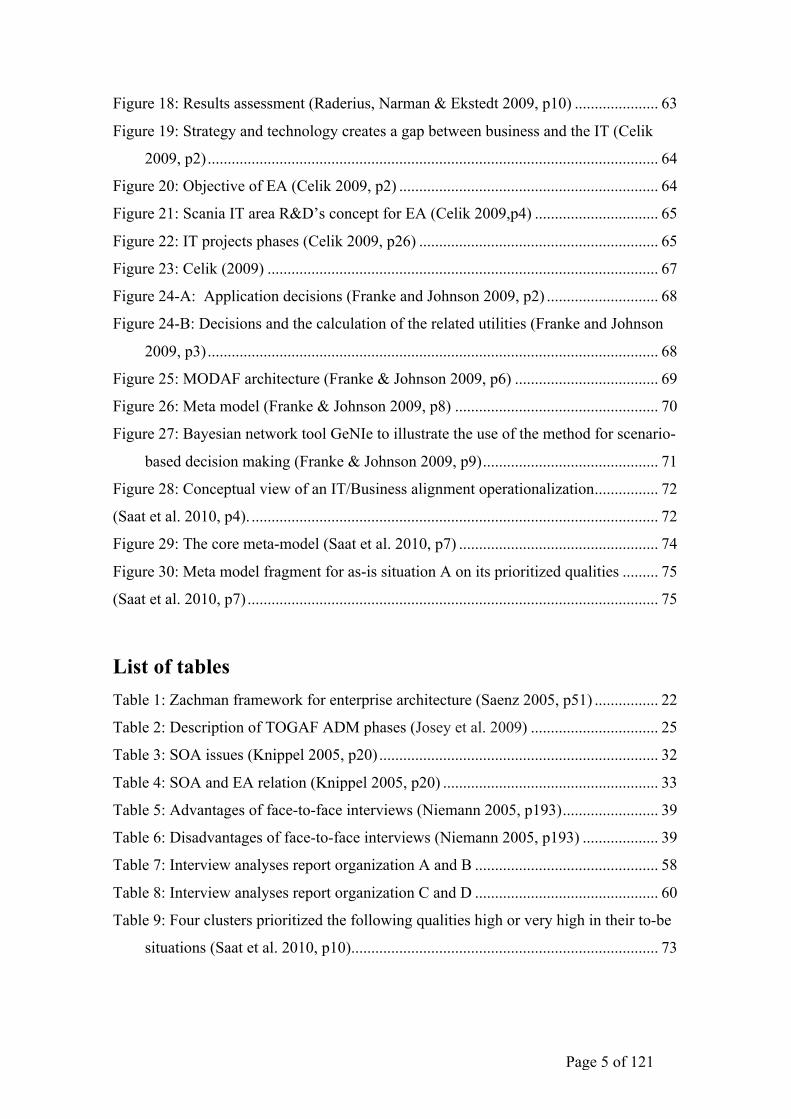
In figure 1, the frontal sheet and the floor plan represent the perspective of the
homeowner whereas the foundation plan and the roof plan are of greater importance for
the builder (Jacobs 2008):
Figure 1: Architectural representations (creative homeowner 2004 in Jacobs 2008, p40)
Enterprise architecture can be seen as a blueprint for the organization’s operation with a
description of how these operations are being maintained by the IT infrastructure
(Congressional research services 2008). Among many organizations, enterprise
architecture can be misunderstood as a solution or a system, where it is more about
! "#
!Figure 2.2: Architectural representations (Creative Homeowner, 2004)
!
� $%&! '&(&)*%! +),! -+'*! ./0)10.-&! 0'! *%+*! +! 1/2''3'&1*02)4! +'! 0)1-5,&,! 0)! 6075/&! 89:4! 0'! +1*5+--;! +!
<-&=0>-&! (0'5+-0'+*02)! 2<! *%&! ,0<<&/&)*! /&./&'&)*+*02)'9! ! $%&! 1/2''3'&1*02)! ,2&'! )2*! 12)*+0)! +);!
+,,0*02)+-! 0)<2/?+*02)! >5*! ./2(0,&'! +! ,0<<&/&)*! +)7-&! 2)! *%&! &=0'*0)7! /&./&'&)*+*02)9! ! @*! 0'!
0?.2/*+)*!*2!)2*&!*%+*!*%&/&!'%25-,!)2*!>&!+);!0)12)'0'*&)10&'!>&*A&&)!*%&!,0<<&/&)*!+/1%0*&1*5/+-!
/&./&'&)*+*02)'!0)1-5,0)7!+);!1/2''3'&1*02)!/&./&'&)*+*02)'9!
!
B0*%!*%&!+/1%0*&1*5/+-!-+)75+7&!.2'0*02)&,!+),!+!)5?>&/!2<!./0)10.-&'!-0'*&,4!0*!0'!)2A!.2''0>-&!*2!5'&!
*%0'!-+)75+7&!*2!./&'&)*4!>;!+)+-27;4!+)!0),01+*02)!2<!+!)5?>&/!2<!12)1&.*'!*2!./2(0,&!12)*&=*!*2!*%&!
'12.&!2<! *%0'!,0''&/*+*02)9! !C2*!2)-;!A0--! *%0'!70(&!+)! 0),01+*02)!2<! *%&! 0)1-5'02)'4!>5*!+-'2!2<! '2?&!
&=1-5'02)'!0)!2/,&/!*2!&)'5/&!+!>&**&/!,&?+/1+*02)!2<!*%&!'12.&!2<!*%0'!,0''&/*+*02)9!
!
6/2)*+-!D%&&*!
6-22/!E-+)!
625),+*02)!E-+)!
F22<!E-+)!
G-&(+*02)!
D*+0/!H&*+0-'!
Page 13 of 121
understanding the organization’s design from top to bottom in order to assist the
decision makers in making the right approach in the right time with the right tool.
As described by Johnson et al. (2007 in Raadt 2011), enterprise architecture provides a
means for choosing from a selection of solution alternatives, the optimal solution, to a
complex organizational problem.
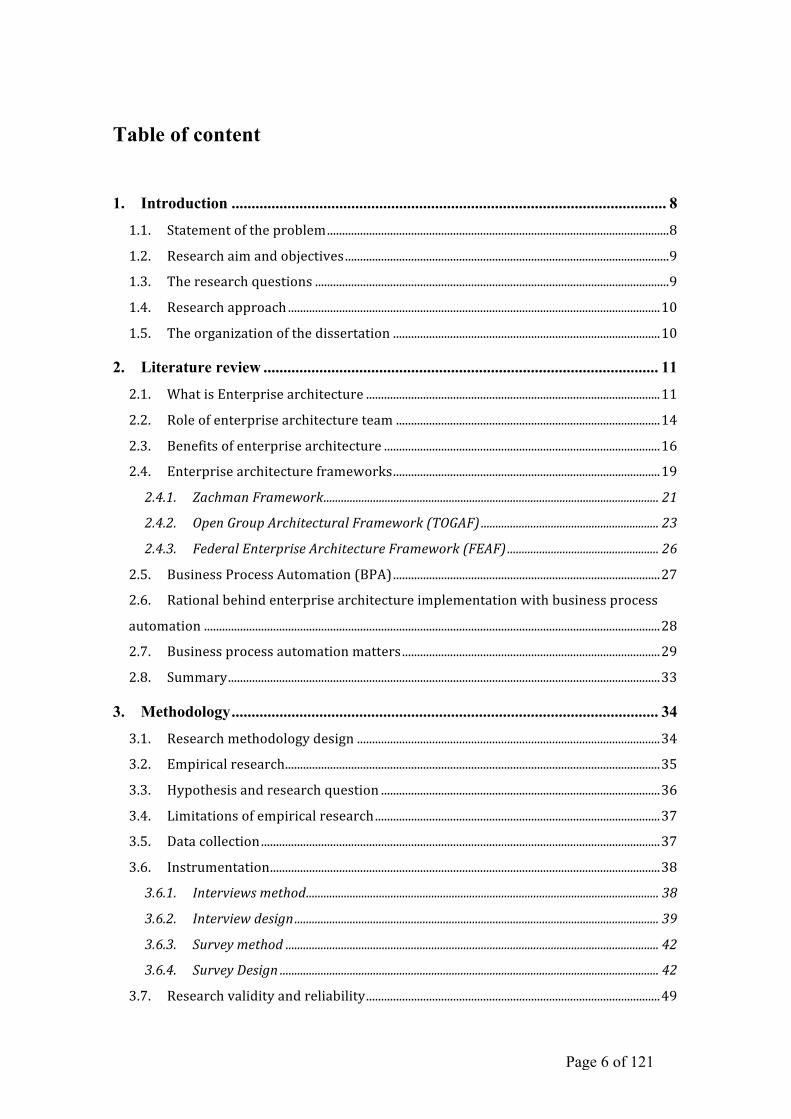
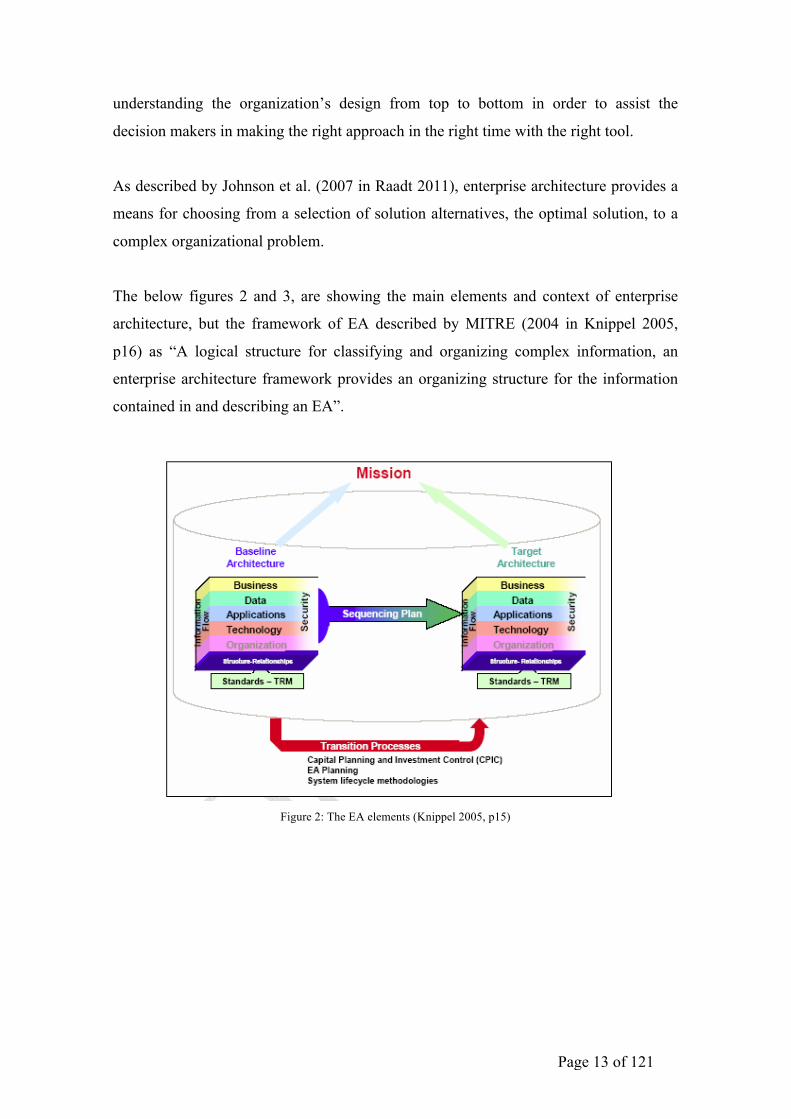
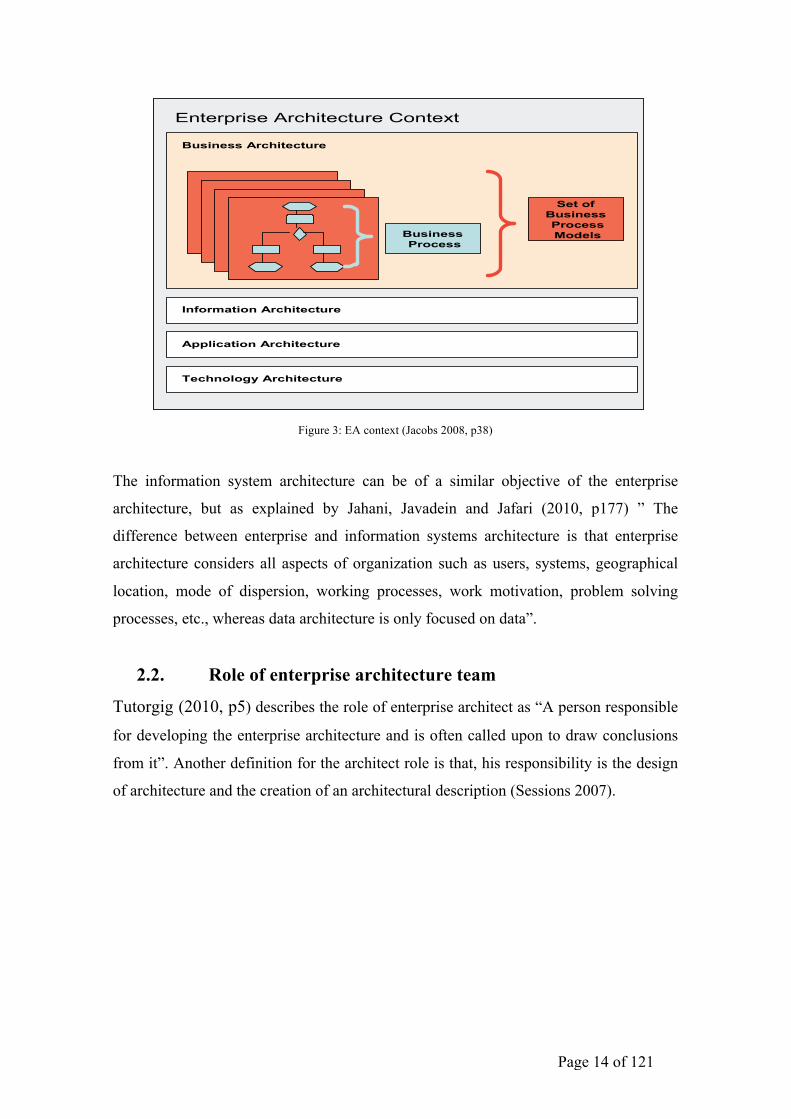
The below figures 2 and 3, are showing the main elements and context of enterprise
architecture, but the framework of EA described by MITRE (2004 in Knippel 2005,
p16) as “A logical structure for classifying and organizing complex information, an
enterprise architecture framework provides an organizing structure for the information
contained in and describing an EA”.
Figure 2: The EA elements (Knippel 2005, p15)
!!!!"#$%&'#!($&#)*#+!,)*#$-$&.#!/$'0&*#'*1$#!203-*#$!4!53'67$81)+!3)+!'8)'#-*.!
!
937#!:;!8<!::=!
/1*08$4!>3.?1.!@)&--#A! !
!Figure 4: Elements of an Enterprise Architecture [Source 7 p.15]
!
B0#!1.13A!3--$83'0!*8!,/!&.!*8!+#.'$&C#!*0#!'1$$#)*!3$'0&*#'*1$#D!3)+!*0#!*3$7#*!3$'0&*#'*1$#
E!
F;GFDGF:GH!B0#)!*0#!,/I-$8'#..!'3)!C#7&)!&)!&+#)*&<J&)7!08K!*8!7#*!*8!*0#!783A4!B0#!B$3).&*&8)!
9$8'#..H! L#<&)&)7! *0#! '1$$#)*I! 3)+! *3$7#*! 3$'0&*#'*1$#! &.! 8<! '81$.#! 3A.8! 3! -3$*! 8<! *0#! ,/I
-$8'#..H!
6.1.3 Enterprise Architecture Framework ,/!3)+!,/!M$3?#K8$6!3$#!8<*#)!1.#+!&)*#$'03)7#3CAJ!FDN!-!:OGH!B0&.!?&.'8)'#-*&8)!P!.##!3.!
C3.#+!8)!.8?#!0&.*8$&'3A!3.-#'*.N!*8!K0&'0!P!K&AA!$#*1$)H!,/!K&AA!'$#3*#!3!A8*!8<!&)<8$?3*&8)!&)!
*0#!.03-#!8<!28?-8)#)*.!3)+!/$*&<3'*.! F:N!-H!:::GH!B0&.!?J$&3+!8<! &)<8$?3*&8)!)##+.! *8!C#!
.*8$#+!&)!3)!8$73)&.#+!?3))#$N!.8!*03*!$#*$&#%3A!8<!&)<8$?3*&8)!&.!A8..A#..!3)+!#3.J!F=N!-H!;GH!
B0&.!&.!*0#!$8A#!8<!*0#!,/!M$3?#K8$6N!K0&'0!?1.*!FDN!-!QEG4!
� P+#)*&<J!*0#!*J-#.!8<!&)<8$?3*&8)!)##+#+!*8!-8$*$3J!3)!,/!!
� ($73)&R#!*0#!*J-#.!8<!&)<8$?3*&8)!&)*8!3!A87&'3A!.*$1'*1$#!!
� L#.'$&C#! *0#! $#A3*&8).0&-.! 3?8)7! *0#! &)<8$?3*&8)! *J-#.H! (<*#)! *0#! &)<8$?3*&8)! &.!
'3*#78$&R#+!&)*8!3$'0&*#'*1$#!?8+#A.!3)+!%&#K-8&)*.H!
!
B0#.#!-8&)*.!3$#!.&?&A3$!*8!08K!J81!?&70*!+#.'$&C#!08K!J81!K8$6!K&*0!$#A3*&8)3A!+3*3C3.#.H!
S0#)!.*8$&)7!+3*3!&)!3!+3*3C3.#N!*0#!<&$.*!*3.6!&.!*8!&+#)*&<J!*0#!$#A3*&8).!C#*K##)!*0#!+3*3!&)!
*0#!8$73)&.3*&8)H!B0#!$#3.8)!<8$!'8?-3$&)7! *0#!,/!M$3?#K8$6! &.!)8*! *8!?36#!3!-3$3AA#A!3.!
.1'0!C1*!8)AJ!*8!$#<#$!*8!3!K#AA!6)8K)!+&.'&-A&)#!&)!'8?-1*#$!.'&#)'#H!"*8$&)7!*0#!,/!-$8+1'*.!
<$8?!*0#!,/!-$8'#..!&.!3)!#%#)!C&77#$!'03AA#)7#!*03)!K8$6&)7!K&*0!$#A3*&8)3A!+3*3C3.#.!3.!
J81! .#A+8?! 6)8K! ! K03*! J81! 3$#! 78&)7! *8! .*8$#N! 3)+! #%#)! ?8$#! +&<<&'1A*N! &.! *8! +#<&)#! *0#!
$#A3*&8).!C#*K##)!*0#!,/!-$8+1'*.H!
!
B0#! '8?-A#T&*J! 8<! +#<&)&)7! *0#! $#A3*&8).! &)*$8+1'#.! *0#! )##+! <8$! 3! ?8$#! 7#)#$3A! %&#K! 8)!
&)<8$?3*&8)!U!3!M$3?#K8$6N!8$!?8$#!-$#'&.#AJ!3)!,/!M$3?#K8$6H!
!
!!!!!!!!!!!!!!!!!!!!!!!!!!!!!!!!!!!!!!!! !!!!!!!!!!D!23AA#+!V3.I&.W!CJ!23$C8)#H!/A.8!$#<#$$#+!*8!3.!*0#!V53.#!X&)#!/$'0&*#'*1$#W!FDG!
E!23AA#+!V*8ICJW!CJ!23$C8)#!
Page 14 of 121
Figure 3: EA context (Jacobs 2008, p38)
The information system architecture can be of a similar objective of the enterprise
architecture, but as explained by Jahani, Javadein and Jafari (2010, p177) ” The
difference between enterprise and information systems architecture is that enterprise
architecture considers all aspects of organization such as users, systems, geographical
location, mode of dispersion, working processes, work motivation, problem solving
processes, etc., whereas data architecture is only focused on data”.
2.2. Role of enterprise architecture team
Tutorgig (2010, p5) describes the role of enterprise architect as “A person responsible
for developing the enterprise architecture and is often called upon to draw conclusions
from it”. Another definition for the architect role is that, his responsibility is the design
of architecture and the creation of an architectural description (Sessions 2007).
! "#
$%&'()&*+! ,-#./0! ! 12! &*! 3*45678'436*! 46! 4(9! 732'82236*! 6:! 9*495;5329! &5'(349'4859+! <823*922!
&5'(349'4859+! <823*922! ;56'92292+! <823*922! ;56'922! )679=2+! <823*922! ;56'922! 59:959*'9! )679=2! &*7!
:=9>3<=9! ?328&=32&436*! 6:! <823*922! ;56'922! )679=2+! 9>&);=92! :56)! 4(9! &5'(349'485&=! 732'3;=3*9! &59!
3*'=8797!46!3==8245&49!4(9!'6*'9;420!!!
!
!!!!!!!!!!!!!!!!!!!!!!!!!!
Figure 2.1: Enterprise architecture context !
2.1.1 Architect’s Deliverables !@*! ,-#.+!%&'()&*!;56;6297! 4(9! &*&=6A682! 3*:65)&436*! 2B249)2! &5'(349'485&=! 59;5929*4&436*!<B! :3524!
9>&)3*3*A!4(9!45&73436*&=!&5'(349'485&=!79=3?95&<=92!;5678'97!3*!4(9!;56'922!6:!'6*2458'43*A!&!<83=73*A!
$%&'()&*+!,-#./0! !C(9!%&'()&*!:5&)9D65E!D3==!<9!732'82297! 3*!)659!794&3=! 3*!29'436*!F0,0F0! !C(9!
;85;629!6:!4(32!29'436*!32!*64!46!792'53<9!4(9!&*&=6AB!;95:65)97!<B!%&'()&*!3*!794&3=!<84!46!(3A(=3A(4!
26)9!;9543*9*4!;53*'3;=92!&*7!46!9>49*7!34!3*!65795!46!9>;=&3*+!3*!&!23)3=&5!&5'(349'485&=!=&*A8&A9+!4(9!
2'6;9!6:!4(32!7322954&436*0!!G=9&29!*649!4(&4!4(9!3*'=8797!A5&;(3'2!&59!:65!3==8245&43?9!;85;6292!6*=B!&*7!
(9*'9!4(9!794&3=!&*7!H8&=34B!6:!26)9!6:!4(9!:3A8592!)&B!*64!<9!379&=0!!1!*8)<95!6:!;53*'3;=92!59=&497!46!
4(9! &5'(349'485&=! &*7! <83=73*A! 76)&3*2! &59! =32497! <&297! 6*! I3A859! F0F! :56)! J59&43?9! K6)96D*95!
$FLLM/0!
Set ofBusinessProcessModels
Business Architecture
Enterprise Architecture Context
Information Architecture
Application Architecture
Technology Architecture
BusinessProcess
Set ofBusinessProcessModels
Business Architecture
Enterprise Architecture Context
Information Architecture
Application Architecture
Technology Architecture
BusinessProcess
Page 15 of 121
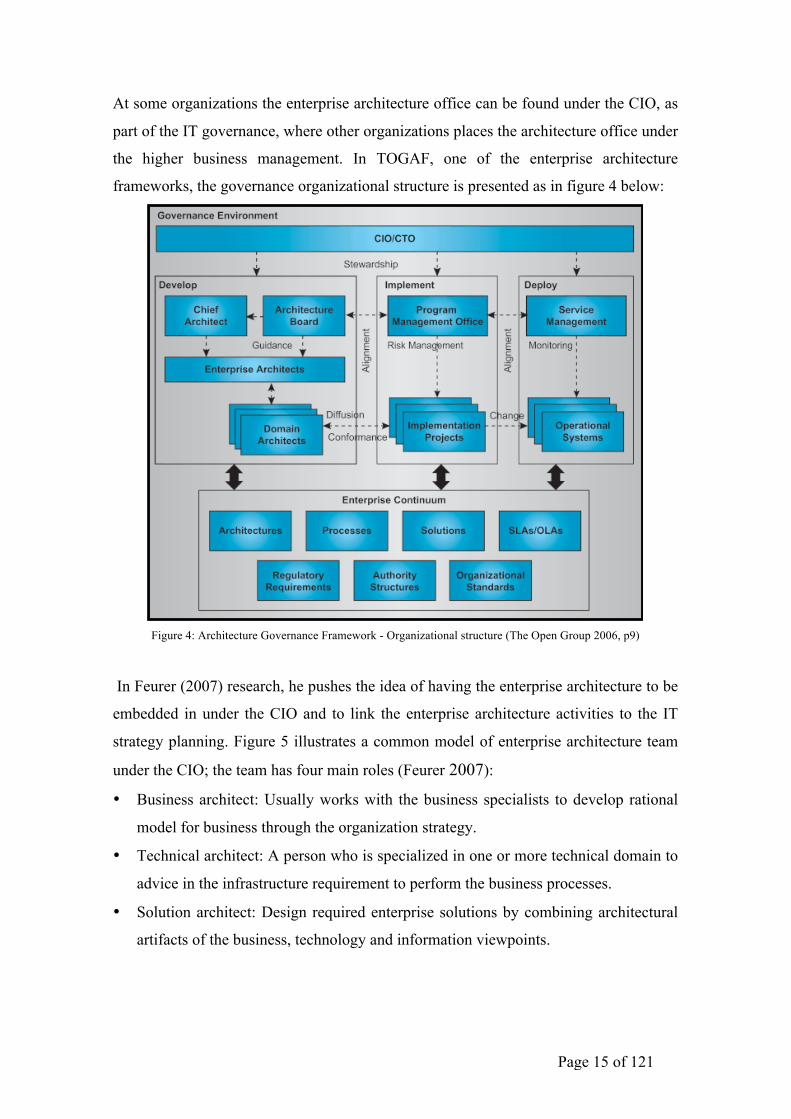
At some organizations the enterprise architecture office can be found under the CIO, as
part of the IT governance, where other organizations places the architecture office under
the higher business management. In TOGAF, one of the enterprise architecture
frameworks, the governance organizational structure is presented as in figure 4 below:
Figure 4: Architecture Governance Framework - Organizational structure (The Open Group 2006, p9)
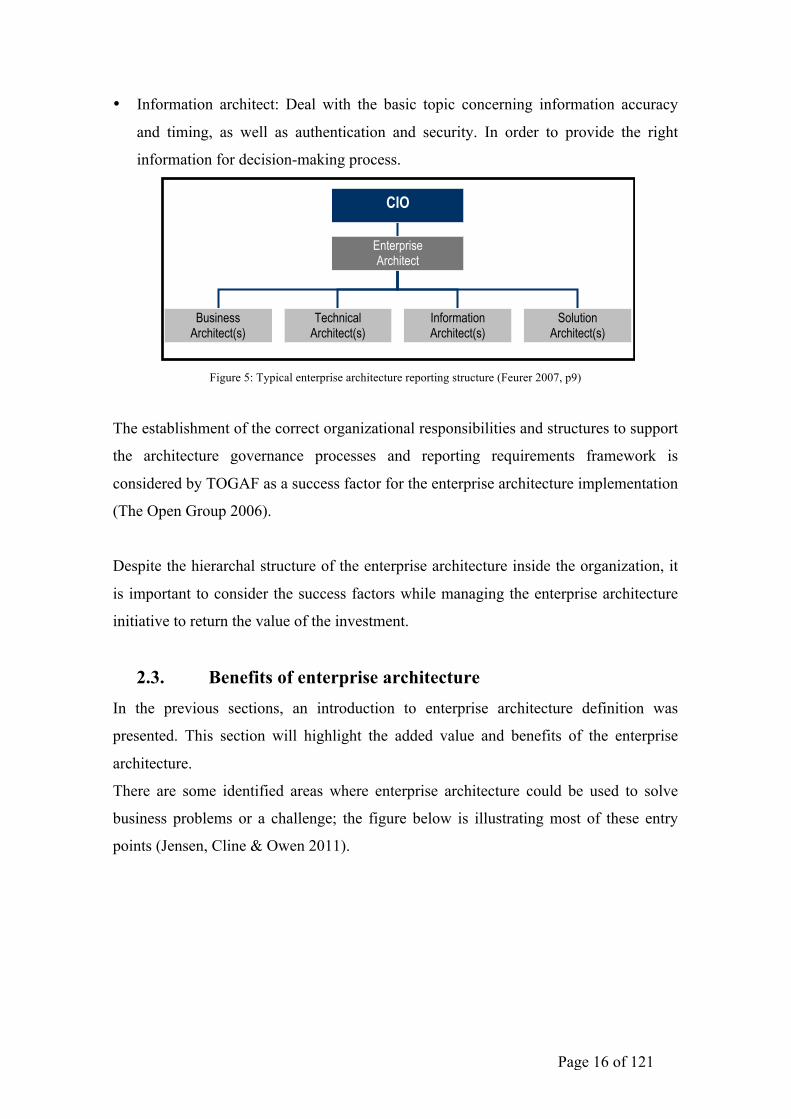
In Feurer (2007) research, he pushes the idea of having the enterprise architecture to be
embedded in under the CIO and to link the enterprise architecture activities to the IT
strategy planning. Figure 5 illustrates a common model of enterprise architecture team
under the CIO; the team has four main roles (Feurer 2007):
• Business architect: Usually works with the business specialists to develop rational
model for business through the organization strategy.
• Technical architect: A person who is specialized in one or more technical domain to
advice in the infrastructure requirement to perform the business processes.
• Solution architect: Design required enterprise solutions by combining architectural
artifacts of the business, technology and information viewpoints.
Page 16 of 121
• Information architect: Deal with the basic topic concerning information accuracy
and timing, as well as authentication and security. In order to provide the right
information for decision-making process.
Figure 5: Typical enterprise architecture reporting structure (Feurer 2007, p9)
The establishment of the correct organizational responsibilities and structures to support
the architecture governance processes and reporting requirements framework is
considered by TOGAF as a success factor for the enterprise architecture implementation
(The Open Group 2006).
Despite the hierarchal structure of the enterprise architecture inside the organization, it
is important to consider the success factors while managing the enterprise architecture
initiative to return the value of the investment.
2.3. Benefits of enterprise architecture In the previous sections, an introduction to enterprise architecture definition was
presented. This section will highlight the added value and benefits of the enterprise
architecture.
There are some identified areas where enterprise architecture could be used to solve
business problems or a challenge; the figure below is illustrating most of these entry
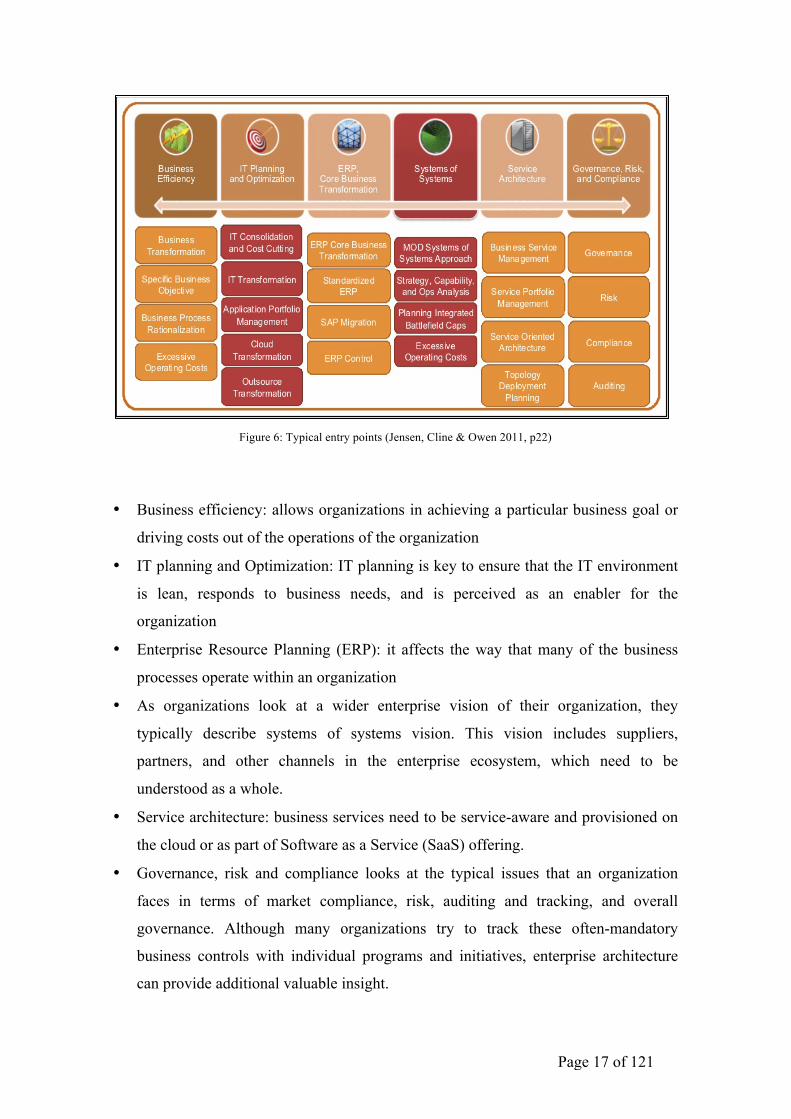
points (Jensen, Cline & Owen 2011).
Enterprise Architecture – Organizational Structure
SAP DEVELOPER NETWORK | sdn.sap.com BUSINESS PROCESS EXPERT COMMUNITY | bpx.sap.com © 2007 SAP AG 9
The Enterprise Architecture Team An essential factor for the enterprise architecture success is the organization structure. First of all, enterprise architecture is a discipline that is handled quite differently across diverse organizations. Some companies may have achieved a certain architecture maturity stage that sufficiently helps them to operate their (current) business and thus these companies care little about architects within a formal enterprise architecture team. These companies typically have architects distributed across various IT domains, providing architectural advice in applications and infrastructure.
However, other companies that emphasize the strategic importance of their holistic enterprise architecture and assign key priorities for new architecture initiatives typically centralize all these architects into an enterprise architecture core team. Compared to decentralized architects within various IT domains, architects of the enterprise architecture team have a much broader view of the enterprise because they are directly involved in enterprise planning activities (strategic business planning in accordance with the business context) [BaJa06].
In order to develop an enterprise architecture fully aligned to the business strategy, the enterprise architecture team must be embedded in the information systems organization, and its activities must be linked to IT strategic planning processes [WeRB05].
Solution Architect(s)
Information Architect(s)
Technical Architect(s)
Business Architect(s)
Enterprise Architect
CIO
Adapted from: [HaWe06]
Figure 4: Typical enterprise architecture reporting structure
The organization model above (figure 4) illustrates a quite common enterprise architecture reporting structure. As mentioned above, the information systems organization is typically led by the chief information officer (CIO) who directly reports to the executive management. The CIO is the strategic decision-making head of the entire enterprise architecture program and thus the key driver of enterprise architecture benefits. The enterprise architect often has the role of a senior manager and reports directly to the CIO. The enterprise architect leads the enterprise architecture team, composed of business, information, technical and solution architects. As the role of an enterprise architect was described above, we will turn particularly to the subordinated roles of an enterprise architect within the enterprise architecture core team [HaWe06]:
� Business architects: Business architects are business-savvy people and understand the business strategy of the company. They work with further business specialists, such as business analysts and business process experts, in order to develop coherent architecture models of the business.
� Information architect: Information architects have a clear understanding of information requirements, information flows and information usage within various business operations. They deal with basic topics concerning information accuracy and timing, as well as authentication and security. From a high-level perspective, information architects ensure that the company can efficiently run all business processes with the right, decision-supportive information at hand.
Page 17 of 121
Figure 6: Typical entry points (Jensen, Cline & Owen 2011, p22)
• Business efficiency: allows organizations in achieving a particular business goal or
driving costs out of the operations of the organization
• IT planning and Optimization: IT planning is key to ensure that the IT environment
is lean, responds to business needs, and is perceived as an enabler for the
organization
• Enterprise Resource Planning (ERP): it affects the way that many of the business
processes operate within an organization
• As organizations look at a wider enterprise vision of their organization, they
typically describe systems of systems vision. This vision includes suppliers,
partners, and other channels in the enterprise ecosystem, which need to be
understood as a whole.
• Service architecture: business services need to be service-aware and provisioned on
the cloud or as part of Software as a Service (SaaS) offering.
• Governance, risk and compliance looks at the typical issues that an organization
faces in terms of market compliance, risk, auditing and tracking, and overall
governance. Although many organizations try to track these often-mandatory
business controls with individual programs and initiatives, enterprise architecture
can provide additional valuable insight.
Page 18 of 121
To elaborate more, Mooney (2009) presented the enterprise architecture as a method to
analyze the organization infrastructure, mainly to optimize the IT spending, as an
effective way to cut the cost. Mooney (2009) identified three values for the enterprise
architecture, which can help the organizations in the recession:
1- Identify duplicates or under-utilized overhead
In enterprise organizations, with growing demands from the customers or internally, the
IT systems can be extremely complex to control, it is not surprising to see some
redundancy in the applications that could be integrated or consolidated for better
utilization and cost saving.
2- Optimize the value chain
For any enterprise service provider, the customer satisfaction is one of the Key
Performance Indicators (KPIs) in its strategic plan. Without understanding the
relationship between the different processes inside the organization, it can be hard to
identify opportunities for efficient performance.
3- Quickly and effectively assimilates mergers and acquisitions
Another key aspect and a value for the enterprise architecture, its capability to anticipate
the change in the organization design, which will support the management in making
better decision and evaluate any opportunities for merging and acquisitions.
In further reference to this, Jensen, Cline and Owen (2011) argue that enterprise
architecture could empower the organization to make specific decisions, about which
future states to implement based on cost, resource, and architectural fit. It will also
impact architectural direction of projects, new applications and technology, based on
business need and value.
By exploring in different areas of problems in which enterprise architecture could
resolve, the below is a summary of the main exhorts for enterprise architecture
implementations:
• Justify the IT spending
• Demands for more information and evaluation criteria by the decision makers
• Share information
• Plan for services to be on cloud computing
Page 19 of 121
• Outsource IT services
• Support business change management
• Maximize the benefit from the relationship of enterprise architecture and
Knowledge Management (KM).
Enterprise architecture can develop compatibility and a harmony among operational,
information and communications technology layers of an organization and creating a
common organizational language (Jahani, Javadein & Jafari 2010), generally this could
be the most beneficial outcome of enterprise architecture to any organization.
2.4. Enterprise architecture frameworks As mentioned in section 1.2, the EA framework is responsible for describing the
organization EA. The Zachman is known as the father of the enterprise architecture
framework as he was the first to introduce the vision of enterprise architecture
framework. In 1987 he originated the Zachman Framework as a standard for classifying
the descriptive representations (models) that comprise enterprise architecture.
EA framework as outlined by Jensen, Cline and Owen (2011, p20) “Enterprise
Architecture frameworks usually provide a context in which all stakeholders in an
organization can communicate and collaborate about their enterprise architecture”. The
framework for enterprise architecture defines how to organize the structure and views
associated with enterprise architecture (Wikipedia 2011).
Many enterprise architecture frameworks have been introduced in the past 20 years;
Sessions (2007) believes that 90 percent of the field use one of these four
methodologies:
• The Zachman Framework for Enterprise Architectures
• The Open Group Architectural Framework (TOGAF)
• The Federal Enterprise Architecture Framework (FEAF)
• The Gartner Methodology
Sessions (2007) is arguing about the non-completion of any framework mentioned
above, and he advice to use a blind methodology based on the organization needs.
Page 20 of 121
Sessions (2007) added in his research that any of these frameworks can complete the
other, although they have so little in common, the architect can build the suitable
framework that can easily be supported and succeed for the organization culture.
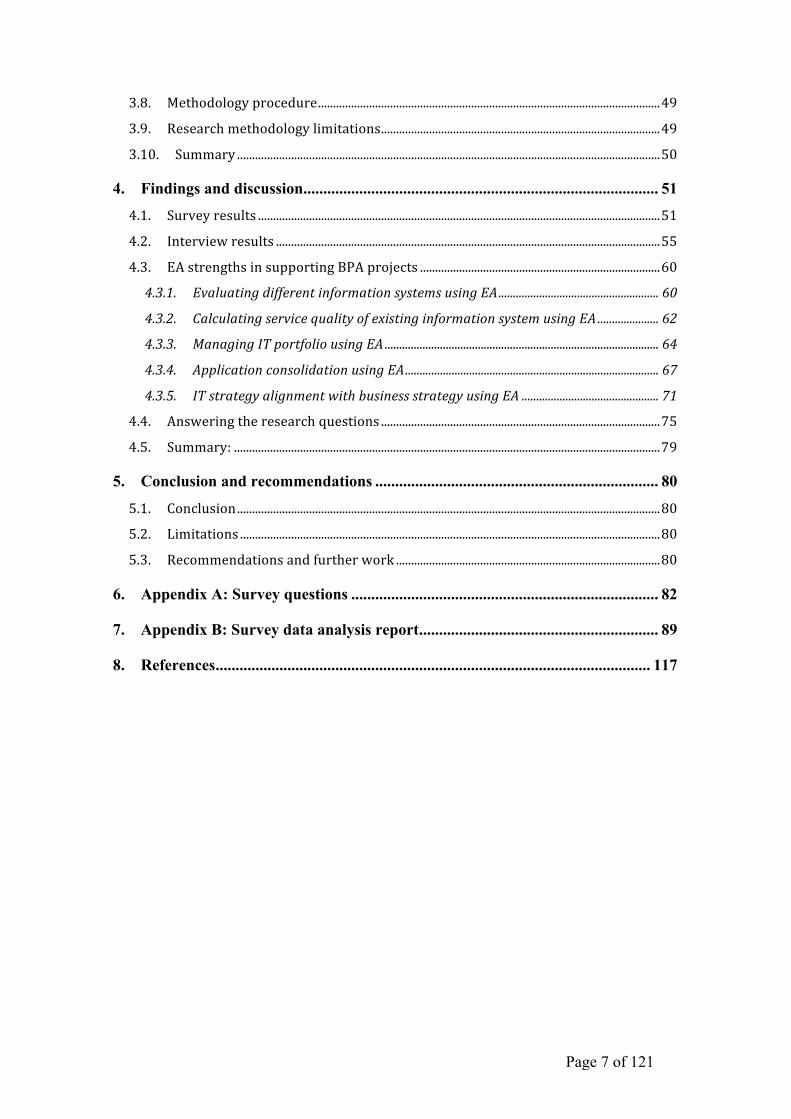
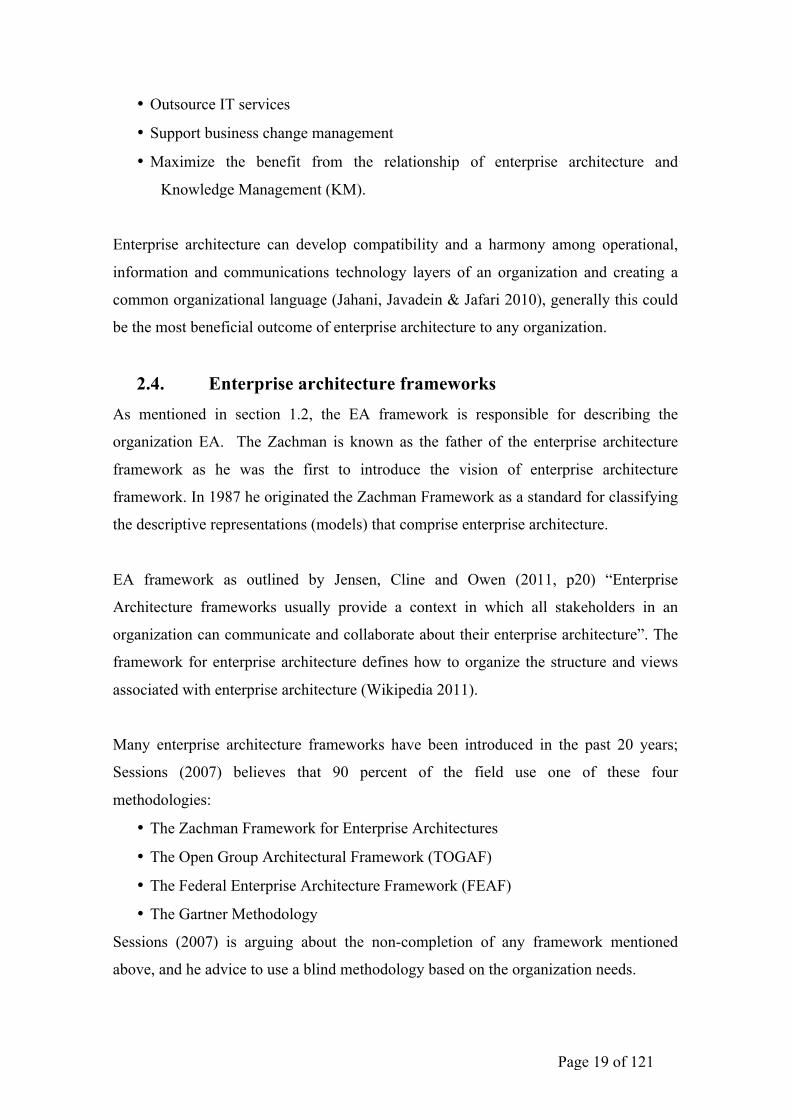
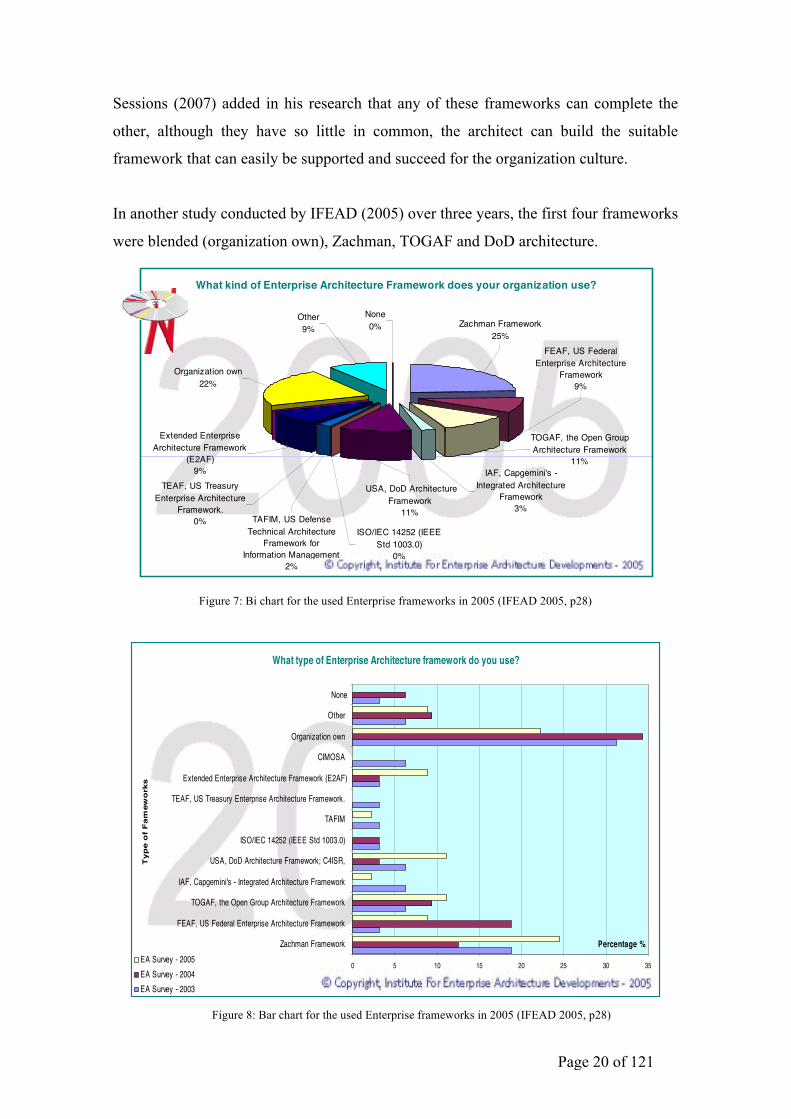
In another study conducted by IFEAD (2005) over three years, the first four frameworks
were blended (organization own), Zachman, TOGAF and DoD architecture.
Figure 7: Bi chart for the used Enterprise frameworks in 2005 (IFEAD 2005, p28)
Figure 8: Bar chart for the used Enterprise frameworks in 2005 (IFEAD 2005, p28)
!"#$%&'!%(!')#!*)+&,!-#./0#2'!
!*,/!+2!32'#&$&+/#!4&5)+'#5'0&#!67789!:%;!.&#!<&=.2+>.'+%2/!?&%=&#//+2=@!
A!B%$C&+=)'!D2/'+'0'#!E%&!32'#&$&+/#!4&5)+'#5'0&#!F#G#H%$1#2'/I!6778!J!4HH!"+=)'/!"#/#&G#,!
!
!"#
! "#$%&'&()%*+&,-($%,$.&%*/%$-01)2*3004)*5*6&78%90&:)*
!;< =-7$*:(#1*0>*"#$%&'&()%*+&,-($%,$.&%*6&78%90&:*10%)*?0.&*0&@7#(A7$(0#*.)%B**
#
What kind of Enterprise Architecture Framework does your organization use?
None0%
Organization own 22%
Other 9%
Extended Enterprise Architecture Framework
(E2AF)9%
USA, DoD Architecture Framework
11%
TOGAF, the Open Group Architecture Framework
11%
FEAF, US Federal Enterprise Architecture
Framework 9%
Zachman Framework 25%
IAF, Capgemini's - Integrated Architecture
Framework 3%
ISO/IEC 14252 (IEEE Std 1003.0)
0%
TAFIM, US Defense Technical Architecture
Framework for Information Management
2%
TEAF, US Treasury Enterprise Architecture
Framework. 0%
##
$%&'#(&)*+),#&'#'%-.&/*#0%1#2/01+3+&'1#4+5%&01506+1#7+),1.-+8'#6')*19##
What type of Enterprise Architecture framework do you use?
0 5 10 15 20 25 30 35
Zachman Framework
FEAF, US Federal Enterprise Architecture Framework
TOGAF, the Open Group Architecture Framework
IAF, Capgemini's - Integrated Architecture Framework
USA, DoD Architecture Framework; C4ISR,
ISO/IEC 14252 (IEEE Std 1003.0)
TAFIM
TEAF, US Treasury Enterprise Architecture Framework.
Extended Enterprise Architecture Framework (E2AF)
CIMOSA
Organization own
Other
None
Type
of F
amew
orks
Percentage %EA Survey - 2005EA Survey - 2004EA Survey - 2003 #
#
!"#$%&'!%(!')#!*)+&,!-#./0#2'!
!*,/!+2!32'#&$&+/#!4&5)+'#5'0&#!67789!:%;!.&#!<&=.2+>.'+%2/!?&%=&#//+2=@!
A!B%$C&+=)'!D2/'+'0'#!E%&!32'#&$&+/#!4&5)+'#5'0&#!F#G#H%$1#2'/I!6778!J!4HH!"+=)'/!"#/#&G#,!
!
!"#
! "#$%&'&()%*+&,-($%,$.&%*/%$-01)2*3004)*5*6&78%90&:)*
!;< =-7$*:(#1*0>*"#$%&'&()%*+&,-($%,$.&%*6&78%90&:*10%)*?0.&*0&@7#(A7$(0#*.)%B**
#
What kind of Enterprise Architecture Framework does your organization use?
None0%
Organization own 22%
Other 9%
Extended Enterprise Architecture Framework
(E2AF)9%
USA, DoD Architecture Framework
11%
TOGAF, the Open Group Architecture Framework
11%
FEAF, US Federal Enterprise Architecture
Framework 9%
Zachman Framework 25%
IAF, Capgemini's - Integrated Architecture
Framework 3%
ISO/IEC 14252 (IEEE Std 1003.0)
0%
TAFIM, US Defense Technical Architecture
Framework for Information Management
2%
TEAF, US Treasury Enterprise Architecture
Framework. 0%
##
$%&'#(&)*+),#&'#'%-.&/*#0%1#2/01+3+&'1#4+5%&01506+1#7+),1.-+8'#6')*19##
What type of Enterprise Architecture framework do you use?
0 5 10 15 20 25 30 35
Zachman Framework
FEAF, US Federal Enterprise Architecture Framework
TOGAF, the Open Group Architecture Framework
IAF, Capgemini's - Integrated Architecture Framework
USA, DoD Architecture Framework; C4ISR,
ISO/IEC 14252 (IEEE Std 1003.0)
TAFIM
TEAF, US Treasury Enterprise Architecture Framework.
Extended Enterprise Architecture Framework (E2AF)
CIMOSA
Organization own
Other
None
Typ
e o
f F
amew
ork
s
Percentage %EA Survey - 2005EA Survey - 2004EA Survey - 2003 #
#
Page 21 of 121
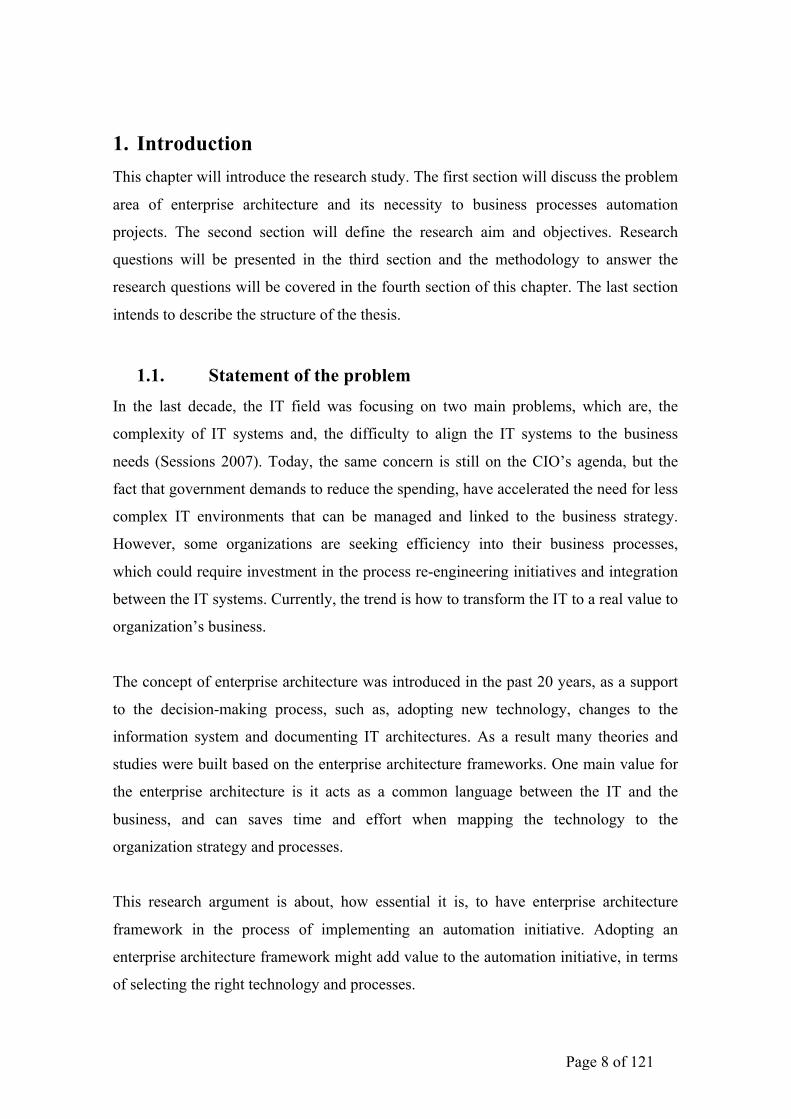
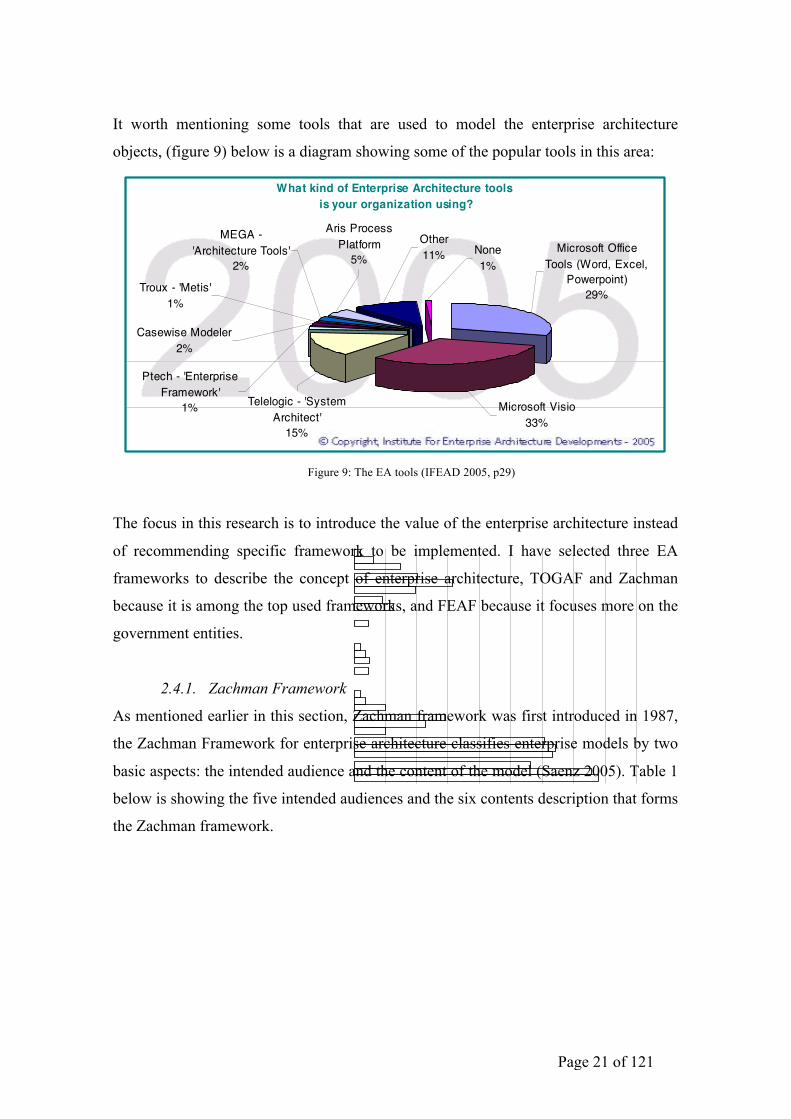
It worth mentioning some tools that are used to model the enterprise architecture
objects, (figure 9) below is a diagram showing some of the popular tools in this area:
Figure 9: The EA tools (IFEAD 2005, p29)
The focus in this research is to introduce the value of the enterprise architecture instead
of recommending specific framework to be implemented. I have selected three EA
frameworks to describe the concept of enterprise architecture, TOGAF and Zachman
because it is among the top used frameworks, and FEAF because it focuses more on the
government entities.
2.4.1. Zachman Framework
As mentioned earlier in this section, Zachman framework was first introduced in 1987,
the Zachman Framework for enterprise architecture classifies enterprise models by two
basic aspects: the intended audience and the content of the model (Saenz 2005). Table 1
below is showing the five intended audiences and the six contents description that forms
the Zachman framework.
!"#$%&'!%(!')#!*)+&,!-#./0#2'!
!*,/!+2!32'#&$&+/#!4&5)+'#5'0&#!67789!:%;!.&#!<&=.2+>.'+%2/!?&%=&#//+2=@!
A!B%$C&+=)'!D2/'+'0'#!E%&!32'#&$&+/#!4&5)+'#5'0&#!F#G#H%$1#2'/I!6778!J!4HH!"+=)'/!"#/#&G#,!
!"#
#
6.1.1 Analysis $%&'#()(*+,-#%.#'//#%0/#/,.1).2'#-1.3%0#.4#%0/#2'(-/#.4#%0/#5(60)(,7'#8,%/191+'/#:160+%/6%21/#;1()/3.1<#6.)9(1/=#%.#%0/#!>>?#1/'2@%'A#8B/,#'.#3/#6(,#'//#%0(%#%0/#.1-(,+*(%+.,'#.3,#8:#41()/3.1<'#(1/#=/6@+,+,-#(,=#%0(%#%0/#91/'/,6/#.4#(#3/@@C<,.3,#8:#41()/3.1<#@+</#%0/#DE#;/=/1(@#8,%/191+'/#:160+%/6%21/#;1()/3.1<#+'#=/6@+,+,-#=1()(%+6(@@FA#G0(%#F.2#/B/,#'.#6(,#'//#+'#%0(%#'%+@@#(#@.%#.4#.1-(,+*(%+.,'#(1/#=/4+,+,-#%0/+1#.3,#8:#41()/3.1<H#.4%/,#I('/=#.,#/J+'%+,-#.,/'A#K0/#2'/#.4#KLM:;#+'#-1.3+,-#'@.3@F#(,=#,/3#+'#%0/#-1.3%0#.4#%0/#8J%/,=/=#8,%/191+'/#:160+%/6%21/#;1()/3.1<A##:#@.%#.4#.%0/1#8:#41()/3.1<'#(1/#,.#@.,-/1#91/'/,%#+,#%0/#!>>N#'21B/FA#
!"# $%&'()*+,(-.(/+'0121*30(415%*'05'610('--73(*3(8-61(-19&+*:&'*-+(63*+9;((
What kind of Enterprise Architecture tools is your organization using?
Other 11% None
1%
Casewise Modeler 2%
Telelogic - 'System Architect'
15%
Microsoft Visio 33%
Microsoft Office Tools (Word, Excel,
Powerpoint) 29%
Ptech - 'Enterprise Framework'
1%
Troux - 'Metis' 1%
MEGA - 'Architecture Tools'
2%
Aris Process Platform
5%
##
K0+'#=+(-1()#+'#'0.3+,-#%0/#%F9/#.4#8,%/191+'/#:160+%/6%21/#%..@'#+,#2'/A##
What kind of EA tools is your organization using?
0 5 10 15 20 25 30 35 40 45
Microsoft Off ice Tools (Word, Excel, Pow erpoint)
Microsof t Visio
Telelogic - 'System Architect'
Ptech - 'Enterprise Framew ork'
Casew ise Modeler
Troux - 'Metis'
MEGA - 'Architecture Tools'
Aris Process Platform
Other
None
Type
o fE
A T
ools
Percentage %
EA Survey - 2005EA Survey - 2004EA Survey - 2003
#
Page 22 of 121
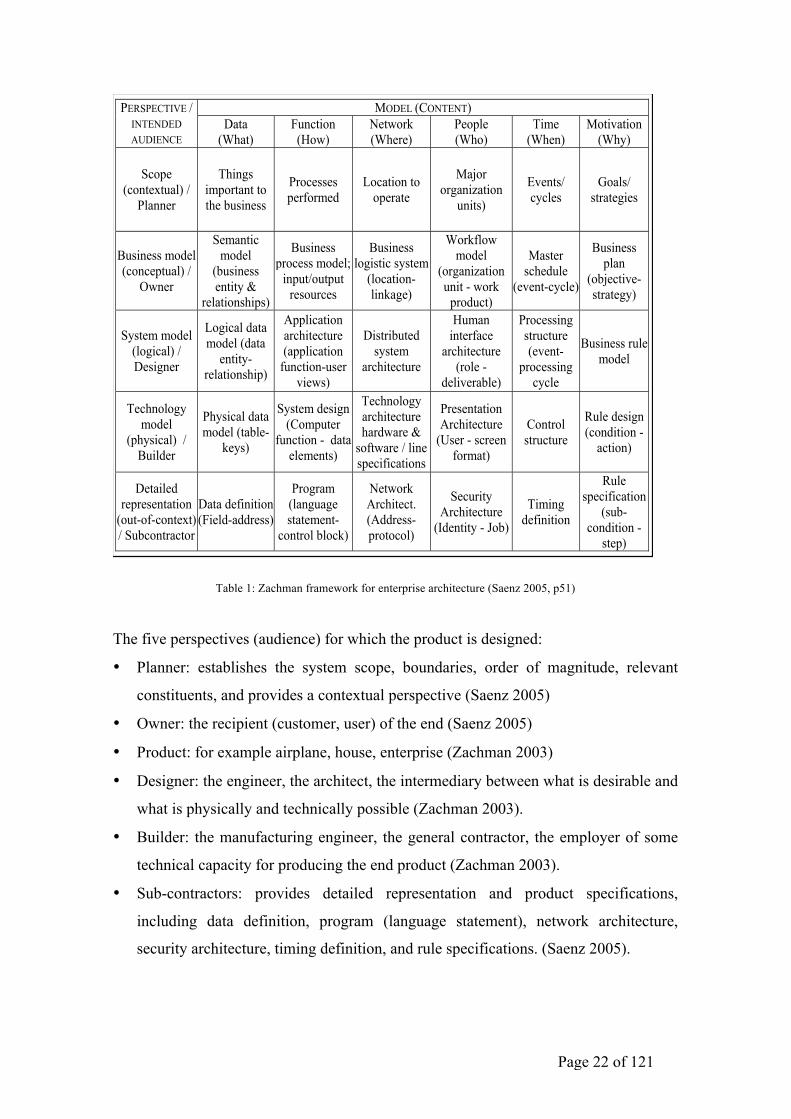
Table 1: Zachman framework for enterprise architecture (Saenz 2005, p51)
The five perspectives (audience) for which the product is designed:
• Planner: establishes the system scope, boundaries, order of magnitude, relevant
constituents, and provides a contextual perspective (Saenz 2005)
• Owner: the recipient (customer, user) of the end (Saenz 2005)
• Product: for example airplane, house, enterprise (Zachman 2003)
• Designer: the engineer, the architect, the intermediary between what is desirable and
what is physically and technically possible (Zachman 2003).
• Builder: the manufacturing engineer, the general contractor, the employer of some
technical capacity for producing the end product (Zachman 2003).
• Sub-contractors: provides detailed representation and product specifications,
including data definition, program (language statement), network architecture,
security architecture, timing definition, and rule specifications. (Saenz 2005).
!
"#!
$%&'(! )*+! ,%&'-! ./012! 3/2! 425)0*0*6! 724872930:28! )42! )*)1;6;<8! 3;! &2=<04252*38-!
>2806*-!)*+!?571252*3)30;*!10@2!9A912!7/)828!0*!$%&'(!)*+!,%&'B!!C.;!+0830*930;*8!.03/!
;3/24! )49/03293<428! )42! 3/)3! 3/2! D)9/5)*E8! @4)52.;4F! @;9<828! ;*! ./)3! ,%&'! 9)118! 3/2!
G0*@;45)30;*! 8A83258! )49/03293<42H-! )*+! 03! 87290@09)11A! 0*91<+28! )! 724872930:2! 9)112+!
G5;30:)30;*H-!+2+09)32+!3;!6;)18!)*+!834)326A!ID)9/5)*-!JKKLMB!!
!
C)N12!JO!D)9/5)*!P4)52.;4F!@;4!%*32474082!'49/03293<42!ID)9/5)*-!JKKLM!
(Q>%R!ISQTC%TCM!,%&U,%SC?V%!W!!
?TC%T>%>!
'X>?%TS%!
>)3)!
IY/)3M!
P<*930;*!
IZ;.M!
T23.;4F!
IY/242M!
,2;712!
IY/;M!
C052!
IY/2*M!
(;30:)30;*!
IY/AM!
U9;72!
I9;*32[3<)1M!W!
,1)**24!
C/0*68!
057;43)*3!3;!
3/2!N<80*288!
,4;928828!
724@;452+!
R;9)30;*!3;!
;724)32!
()\;4!
;46)*0])30;*!
<*038M!
%:2*38W!
9A9128!
$;)18W!
834)326028!
^<80*288!5;+21!
I9;*9273<)1M!W!
Q.*24!
U25)*309!
5;+21!
IN<80*288!
2*303A!_!
421)30;*8/078M!
^<80*288!
74;9288!5;+21`!
0*7<3W;<37<3!
428;<4928!
^<80*288!
1;608309!8A8325!
I1;9)30;*a
10*F)62M!
Y;4F@1;.!
5;+21!
I;46)*0])30;*!
<*03!a!.;4F!
74;+<93M!
()8324!
89/2+<12!
I2:2*3a9A912M!
^<80*288!
71)*!
I;N\2930:2a
834)326AM!
UA8325!5;+21!
I1;609)1M!W!
>2806*24!
R;609)1!+)3)!
5;+21!I+)3)!
2*303Aa
421)30;*8/07M!
'77109)30;*!
)49/03293<42!
I)77109)30;*!
@<*930;*a<824!
:02.8M!
>08340N<32+!!
8A8325!!
)49/03293<42!
Z<5)*!
0*324@)92!
)49/03293<42!
I4;12!a
+210:24)N12M!
,4;92880*6!
834<93<42!
I2:2*3a
74;92880*6!
9A912!
^<80*288!4<12!
5;+21!
C29/*;1;6A!
5;+21!
I7/A809)1M!!W!
^<01+24!
,/A809)1!+)3)!
5;+21!I3)N12a
F2A8M!
UA8325!+2806*
IS;57<324!
@<*930;*!a !+)3)!
21252*38M!
C29/*;1;6A!
)49/03293<42!
/)4+.)42!_!
8;@3.)42!W!10*2!
87290@09)30;*8
,4282*3)30;*!
'49/03293<42!
IX824!a!89422*!
@;45)3M!
S;*34;1!
834<93<42!
&<12!+2806*!
I9;*+030;*!a!
)930;*M!
>23)012+!
4274282*3)30;*!
I;<3a;@a9;*32[3M!
W!U<N9;*34)93;4!
>)3)!+2@0*030;*!
IP021+a)++4288M!
,4;64)5!
I1)*6<)62!
83)3252*3a
9;*34;1!N1;9FM
T23.;4F!
'49/03293B!
I'++4288a!
74;3;9;1M!
U29<403A!
'49/03293<42!
I?+2*303A!a!b;NM
C050*6!
+2@0*030;*!
&<12!
87290@09)30;*!
I8<Na
9;*+030;*!a!
8327M!
!
LBLBc! '49/03293<42!;@!?*3264)32+!?*@;45)30;*!UA8325!!
'99;4+0*6! 3;! 038! )<3/;4-!'&?U! 08! 8<03)N12! @;4! @<11A! +28940N0*6! 83)*+)4+! 8;@3.)42! 8;1<30;*8-!
0*3264)30*6!523/;+8! @;4!5;+210*6! 0*@;45)30;*! 8A83258-! +2:21;70*6!523/;+8! @;4! +28940N0*6!
Page 23 of 121
As for the model (content) prospective there are six described in the following:
• Data (What): the important objects to store data about data models and relationships
(Saenz 2005)
• Function (How): the functional specification, the transformations for enterprises and
the process models (Zachman 2003)
• Network (Where): where the components are located relative to one another
(Zachman 2003)
• People (Who): who does what work, the manuals, the operating instructions for
enterprises (Zachman 2003)
• Time (When): focusing on when events happen and life cycles (Saenz 2005)
• Motivation (Why): strategies for enterprises, similar to a control view (Saenz 2005).
2.4.2. Open Group Architectural Framework (TOGAF)
TOGAF is about set of techniques used to support enterprise architecture, it is an
architecture framework developed by The Open Group Architecture Forum. First
version was developed in 1995; it was based on the US DoF technical architecture
framework for information management (TAFIM) (Josey et al. 2009). TOGAF is
designed to support four types of architecture that are accepted as a subset from the
enterprise architecture.
• Business architecture: The business strategy, governance, organization and key
business process
• Data architecture: The structure of an organization’s logical and physical data assets
and data management resources
• Application architecture: A blue print of the individual application systems to be
deployed, their interactions, and their relationships to the core business processes of
the organization
• Technology architecture: the logical software and hardware capabilities that are
required to support the deployment of business, data, and application services. This
includes IT infrastructure, middleware, networks, communications, processing, and
standards (The Open Group 2006).
Page 24 of 121
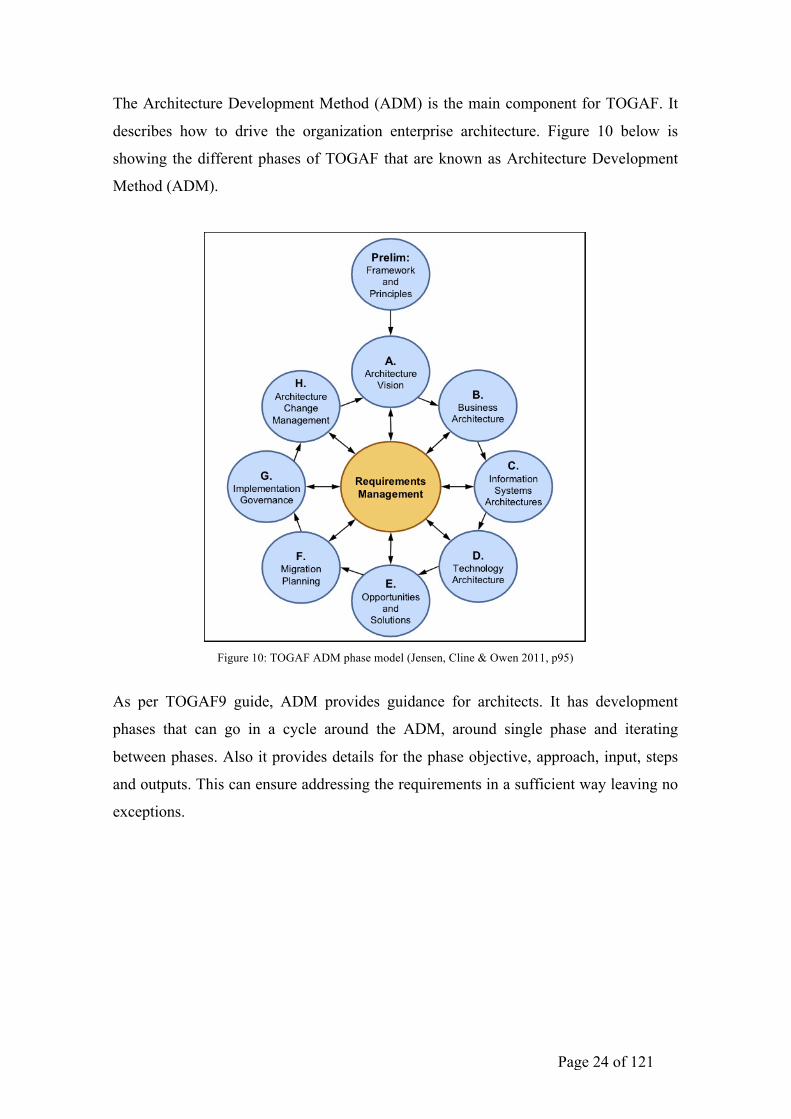
The Architecture Development Method (ADM) is the main component for TOGAF. It
describes how to drive the organization enterprise architecture. Figure 10 below is
showing the different phases of TOGAF that are known as Architecture Development
Method (ADM).
Figure 10: TOGAF ADM phase model (Jensen, Cline & Owen 2011, p95)
As per TOGAF9 guide, ADM provides guidance for architects. It has development
phases that can go in a cycle around the ADM, around single phase and iterating
between phases. Also it provides details for the phase objective, approach, input, steps
and outputs. This can ensure addressing the requirements in a sufficient way leaving no
exceptions.
Page 25 of 121
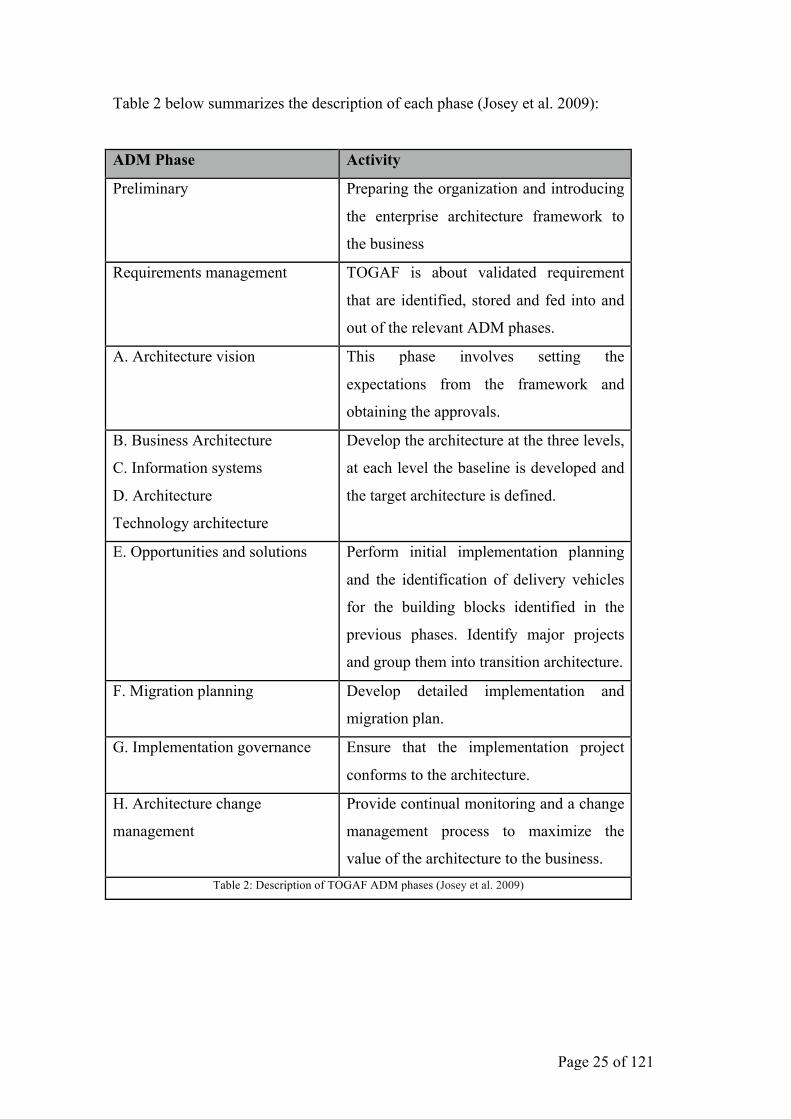
Table 2 below summarizes the description of each phase (Josey et al. 2009):
ADM Phase Activity
Preliminary Preparing the organization and introducing
the enterprise architecture framework to
the business
Requirements management TOGAF is about validated requirement
that are identified, stored and fed into and
out of the relevant ADM phases.
A. Architecture vision This phase involves setting the
expectations from the framework and
obtaining the approvals.
B. Business Architecture
C. Information systems
D. Architecture
Technology architecture
Develop the architecture at the three levels,
at each level the baseline is developed and
the target architecture is defined.
E. Opportunities and solutions Perform initial implementation planning
and the identification of delivery vehicles
for the building blocks identified in the
previous phases. Identify major projects
and group them into transition architecture.
F. Migration planning Develop detailed implementation and
migration plan.
G. Implementation governance Ensure that the implementation project
conforms to the architecture.
H. Architecture change
management
Provide continual monitoring and a change
management process to maximize the
value of the architecture to the business. Table 2: Description of TOGAF ADM phases (Josey et al. 2009)
Page 26 of 121
2.4.3. Federal Enterprise Architecture Framework (FEAF)
As per Congressional research services (2008, p3), FEAF is designed to “ensure that IT
investments support the functions of government, rather than allowing technology
choices determine how the government carries out its operations”. The federal CIO
issued the FEA in September 1999, and it was declared as “conceptual model that
begins to define a documented and coordinated structure for cross-cutting businesses
and design developments in the Government” (Congressional research services 2008,
p2).
OMB CircularA-11 updated in July 2010, requires from all federal agencies to align its
major IT investments with each reference model within the FEA framework (OMB
2010) before getting budget approval.
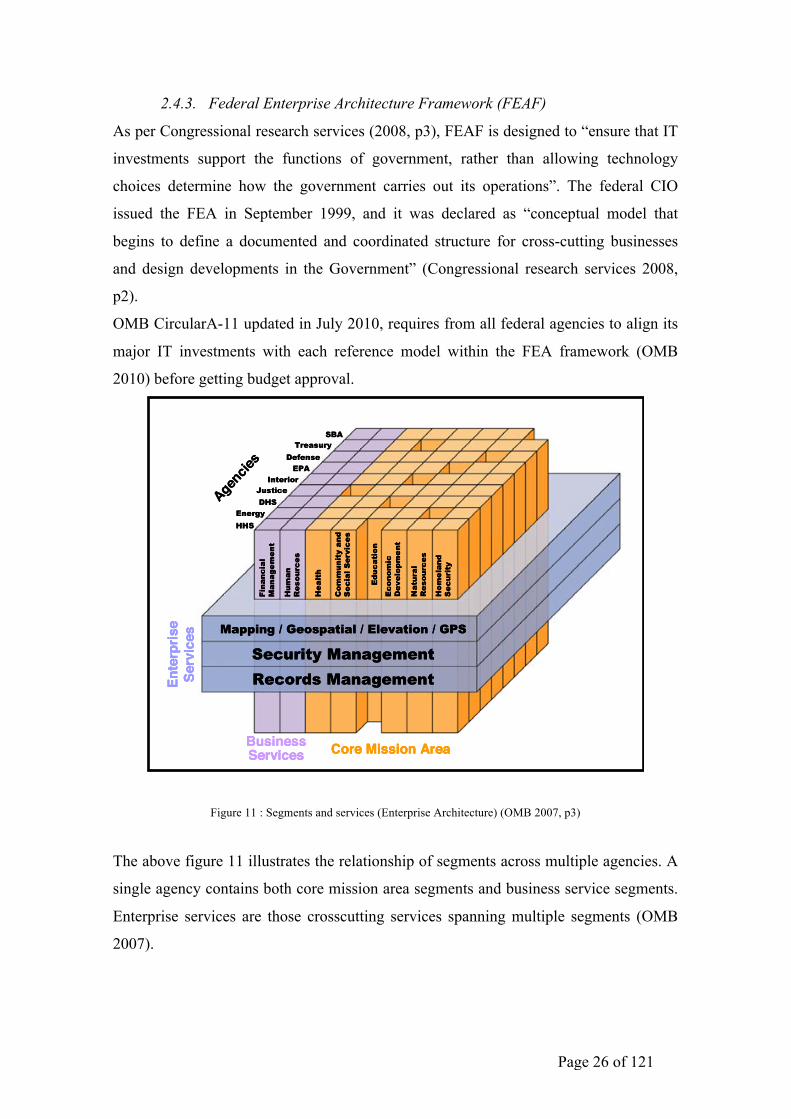
Figure 11 : Segments and services (Enterprise Architecture) (OMB 2007, p3)
The above figure 11 illustrates the relationship of segments across multiple agencies. A
single agency contains both core mission area segments and business service segments.
Enterprise services are those crosscutting services spanning multiple segments (OMB
2007).
FEA Practice Guidance – Overview
November 2007 1 - 3
Figure 1-1 illustrates the relationship of segments across multiple agencies. A single agency contains both core mission area segments and business service segments. Enterprise services are those cross-cutting services spanning multiple segments. Segments can be leveraged within an agency, across several agencies, or the entire federal government.
Principles
Business-led architecture is more successful in meeting strategic goals, responding to changing mission needs, and serving citizens’ expectations than technology- or budget-driven architecture. This principle encourages agency architects to proactively collaborate with business stakeholders to develop architecture work products. Architects must understand the current state of the business and where the business stakeholders would like to make improvements. With this shared understanding, architects and business stakeholders can work together to develop the architecture work products supporting better investment and implementation decision-making. Agencies are expected to architect first, and then use the architecture to guide and inform information technology (IT) investment planning and implementation (program and project management). This principle recognizes the time required to capture business needs, define higher performance levels and develop architecture sufficient to drive investment decisions. This also recognizes the time required to reconcile how much of the business needs will be met by individual business solutions or enterprise (agency-wide) investments. For more information on federal architectural principles, refer to the Architectural Principles for the U.S. Government located at www.egov.gov.
Performance Improvement Lifecycle
Results-oriented architecture is developed within the context of the Performance Improvement Lifecycle broken down into three-phases: “Architect”, “Invest” and “Implement” (Figure 1-2). Each lifecycle phase is comprised of tightly integrated processes which combine to transform the agency’s top-down strategic goals and bottom-up system needs into a logical series of work products designed to help the agency achieve strategic results. Through practice area integration, the Performance
Figure 1-1: Segments and Services
Mapping / Geospatial / Elevation / GPS
Security ManagementRecords Management
Eco
nom
ic
Dev
elop
me
nt
Edu
cati
on
Com
mun
ity
and
S
oci
al S
ervi
ces
Hea
lth
Hum
an
Res
ourc
es
Fin
anci
al
Man
age
men
t
Nat
ural
R
esou
rces
Hom
ela
nd
Se
curi
ty
HHSEnergy
DHS
InteriorJustice
EPA
SBA
DefenseTreasury
Ente
rpris
e Se
rvic
es
Core Mission Area
Agencie
s
Business Services
Page 27 of 121
FEA is built around five reference models (Congressional research services, 2008):
• Performance reference model: a framework for measuring the output of major
information technology investments and their contributions to program performance
• Business reference model: a framework for describing the federal government
business operations independent of the agencies that performs them
• Service Component reference model: a framework for identifying information
technology service components (applications) used to support business and/or
performance objectives
• Data reference model: a framework that, at an aggregate level, describes the data
and information used to support government program delivery and business
operations
• Technical reference model: a framework for describing the standards, specifications,
and technologies that support and enable the delivery of service components
(applications) and capabilities.
2.5. Business Process Automation (BPA) In the previous sections of chapter one, EA concept and EA framework were described.
In this section, the BPA will be explained. Business process automation concept
declared by Tatum (2011, p1) as “Business process automation, or BPA, is a strategy
that is used to optimize and streamline the essential processes used to operate a
business, using the latest technology to automate the functions involved in carrying out
those processes.”
In some references they refer to the business process automation as a baseline for the
workflow automation technology. A workflow basically is a connected step for a
business process, which might come across with another workflow as an input or
output. Workflow is "A sequence of structured or semi-structured tasks, performed in
series or in parallel, by two or more individuals, to reach a common goal"(Rashid 1999,
p1).
Page 28 of 121
The value behind implementing automated workflow is that it can, enforce the policies
and procedures inside the organizations, which could reduce the cost and the effort of
training. It can enforce law and reduce error. The implementation of business process
automation can be done in through different technologies, an example, ERP, CRM and
content management system. Adding to that, workflow management systems (WFMS)
technology has been widely used recently to support the collaboration between the
different parties in the business process. In the public sector, the adoption of the
workflow process results primarily in enhanced effectiveness and efficiency seen in
cross-functional departments (Sajjad et al. 2011).
However, in today’s technology approaches, a new concept called Services Oriented
Architecture (SOA) has been introduced to deliver the business as services. The
business process automation can be as underlined layer for the SOA. When SOA
applied to business processes automation, the business logic represents by the business
processes, which are the performed activities to deliver an output (Veger 2008).
Arsanjani (n.d. in Knippel 2005, p17) stated, “SOA is not a product, it is about bridging
the gap between business and IT trough a set of business-aligned IT services using a set
of design principles, patterns and techniques”. In other words, SOA is a form of
technology architecture that adheres to the principles of service orientation. When
realized through the web services technology platform, SOA establishes the potential to
support and promote these principles throughout the business process and automation
domains of an enterprise (Knippel 2005).
2.6. Rational behind enterprise architecture implementation
with business process automation As explained earlier in the introduction chapter, the organizations are looking to
position the technology as a value center that drives the business process efficiency.
Having said that, not all the business processes necessary need to be automated. There
are key processes, which should be selected through an evaluation criterion. The cost of
process automation varied based on the environment complexity.
Page 29 of 121
When the organization selects an existing business service to be automated using
information systems, these services will depend on another system services, these
services require or produce information forming blocks of data entities. The need for
integration depends on an organization’s operating model, which shows the business
requirement for integration of business process or sharing data across business areas
(The open group 2008).
The rapid rate of changes in market demands, will force the organizations to accelerate
the process or enhancements, accordingly, there is a high risk of automating the wrong
function or using the wrong technology (The open group 2008). Moreover, it is very
hard to gather the business needs or the organization objectives, as it can be implicit or
explicit.
The Open Group (2008, p8)“In order to ensure that the organization’s goals,
objectives, measures, and requirements are met, they can be distilled into
qualitative statements of business need or principles, which can then be used to
govern the organization’s transformation”.
Architecture models or blocks can be used to describe the aspects of the organization.
As part of EA implementation conducted by Chi (2006), he evaluated the value of the
business principles, which was captured in the enterprise architecture; Chi’s (2006)
evaluation focused on how well the business principles can be applied in practice. Chi
(2006) chose three projects to examine the compliance with the business principles
related to customer relationships. The projects were, unique voice portal, call
management and customer information management. The evaluation shows the focus
on the principles, although there were some principles that did not comply, these can be
identified for business improvement.
2.7. Business process automation matters After introducing the EA and BPA idea in the earlier sections, we need to understand
what are the related issues to BPA projects. To start this task, first we need to look at
the project management issues. The project management experts have been studying the
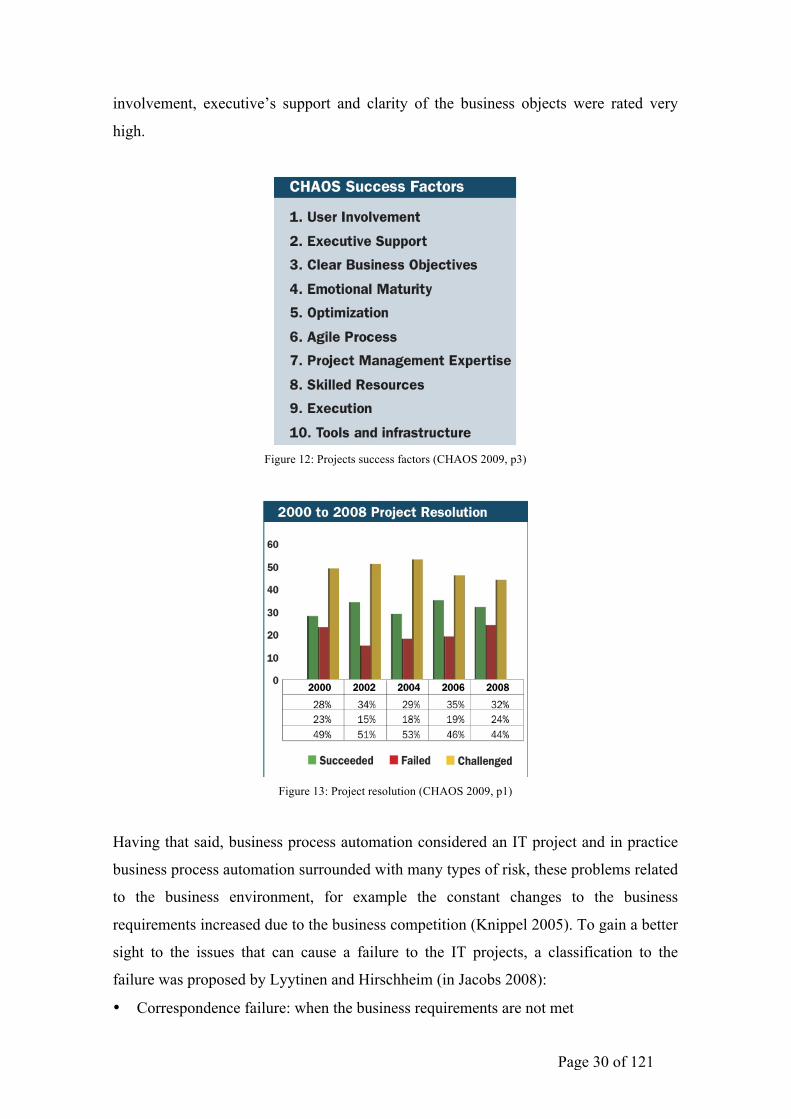
factors which can affect the project success over many years, figure 12 below showing
the top ten success factors in projects as per CHAOS (2009) report, the user
Page 30 of 121
involvement, executive’s support and clarity of the business objects were rated very
high.
Figure 12: Projects success factors (CHAOS 2009, p3)
Figure 13: Project resolution (CHAOS 2009, p1)
Having that said, business process automation considered an IT project and in practice
business process automation surrounded with many types of risk, these problems related
to the business environment, for example the constant changes to the business
requirements increased due to the business competition (Knippel 2005). To gain a better
sight to the issues that can cause a failure to the IT projects, a classification to the
failure was proposed by Lyytinen and Hirschheim (in Jacobs 2008):
• Correspondence failure: when the business requirements are not met
Page 31 of 121
• Process failure: when the project runs over time or budget and performance is
unsatisfactory
• Interaction failure: if there are problems related to the use of the system or when the
system is hardly used
• Expectation failure: a superset of the above three types of failures, when
stakeholders’ exceptions cannot be met.
The correspondence failure is our concern in this research, among many references,
defined business process was found to be the most critical success factors on successful
information system implementation (Jacobs 2008). Jacobs (2008) highlighted the
importance of the well-defined business processes; also dose Hammer and Stanton
(1999 in Jacobs 2008) and Paul and Serrano (2003 in Jacobs 2008). As example, the
ERP cannot be of a real value to the business if the business process are not integrated
(Jacobs 2008).
Jacobs (2008) research concludes the dependency between the quality of the business
requirement and the understanding of the business requirements by the stakeholders and
the successful automation of business processes through information technology
systems. On the other hand Jacobs (2008) studied the causes for the quality of business
requirements, one factor was the Business Process Re-engineering (BPR), it was found
that BPR drives the information systems toward achieving the desired outcome (Caron,
Jarvenpaa & Stoddard 1994 in Jacobs 2008).
Another factor is the application evaluation, when organization tries to implement a new
information system, the evaluation for this information system will be mainly dependent
on the business requirements, and how the system will be used inside it (Mende, Brecht
& Osterle 1994 in Jacobs 2008). Evaluating the information systems should not be
dependent on the IT requirement only; it should be combined with the business
requirement. Compatibility is also factor in the business requirements quality, the desire
for potential adopters and innovation should be part from the business requirements
(Larsent 2001 in Jacobs 2008).
Page 32 of 121
Drori (1997 in Jacobs 2008, p22) identified the “partial understanding of the
information given by the user is one of the pitfalls during the systems analysis and the
definition of the business requirements stage”. Moreover, software process
improvement can be successful if it is linked with the business alignment and
orientation (Jacobs 2008).
Adding to the above factors related to quality of business requirements, is the modeling
of business processes, which found to be a critical success factor to the business process
re-engineering (Jacobs 2008). Kaisler, Armour and Valivullah (2005 in Jacobs 2008,
p22) indicated, “It is essential to describe and understand enterprise architecture”. One
last factor to the quality of business requirements is the persistent questioning of the
information system value to the business (Jacobs 2008).
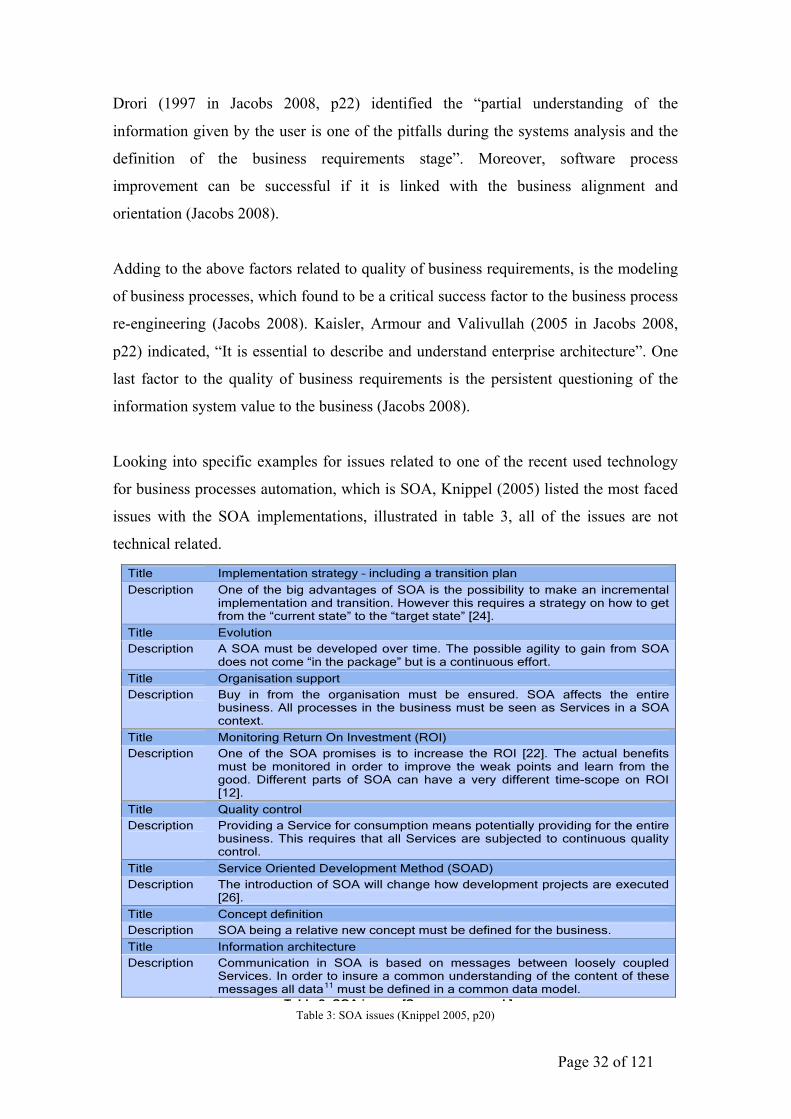
Looking into specific examples for issues related to one of the recent used technology
for business processes automation, which is SOA, Knippel (2005) listed the most faced
issues with the SOA implementations, illustrated in table 3, all of the issues are not
technical related.
Table 3: SOA issues (Knippel 2005, p20)
!!!!"#$%&'#!($&#)*#+!,)*#$-$&.#!/$'0&*#'*1$#!203-*#$!4!53'67$81)+!3)+!'8)'#-*.!
!
937#!:;!8<!::=!/1*08$4!>3.?1.!@)&--#A! !
?#*08+8A87BC! +#-A8B?#)*! 3)+! .1--8$*! -A3).C! 3)+! -3$*)#$D'1.*8?#$D.1--A&#$!$#A3*&8).0&-.E!
� F8%&)7!*8!"(/!&.!)8!.?3AA!<#3*E!G*!'3)!3)+!.081A+!H#!+8)#!&)'$#?#)*3AABC!H1*!$#I1&$#.!3! .0&<*! &)! 08J! J#! 3$'0&*#'*! 3)+! '8?-8.#! .#$%&'#.KH3.#+! 3--A&'3*&8).! J0&A#!?3L&?&M&)7!#L&.*&)7!*#'0)8A87B!&)%#.*?#)*.E!!
!N0#! *0$##!?3&)! &..1#.!-8&)*#+!81*!HB!"OP!3$#! *0#!N#'0)&'3AC!P8)KN#'0)&'3A!3)+! *0#!"(/!N$3).&*&8)E! N0#.#! *0$##! &..1#.! .1--8$*! ?B! #3$A&#$! .*3*#?#)*Q! "(/! &.! )8*! 8)AB! 3! *#'0)&'3A!&..1#E!(<!'81$.#C!#%#$B*0&)7!*03*!)##+.!*8!H#!&?-A#?#)*#+!03.!3!*#'0)&'3A!.&+#C!H1*!&)!8$+#$!*8! 1*&A&M#! *0#! *#'0)&'3A! -8..&H&A&*&#.! &*! &.! *0#! )8)K*#'0)&'3A! &..1#.! *03*! '3)! 7&%#! *0#! +#.&$#+!%3A1#E!!G)! *0#! <8AA8J&)7! *3HA#! G! 03%#! A&.*#+! .8?#! 8<! *0#! )8)K*#'0)&'3A! &..1#.C! J0&'0! G! .##! ?1.*! H#!3++$#..#+! &)! 8$+#$! *8! .1--8$*! 3)+! '8)*$8A! "(/! R! #E7E! &..1#.! *03*! ?1.*! H#! '8%#$#+! HB! *0#!"(/K-$8'#..E!!N&*A#! G?-A#?#)*3*&8)!.*$3*#7B!R!&)'A1+&)7!3!*$3).&*&8)!-A3)!
S#.'$&-*&8)! ()#!8<! *0#!H&7!3+%3)*37#.!8<!"(/!&.! *0#!-8..&H&A&*B! *8!?36#!3)! &)'$#?#)*3A!&?-A#?#)*3*&8)!3)+!*$3).&*&8)E!T8J#%#$!*0&.!$#I1&$#.!3!.*$3*#7B!8)!08J!*8!7#*!<$8?!*0#!U'1$$#)*!.*3*#V!*8!*0#!U*3$7#*!.*3*#V!WXYZE!
N&*A#! ,%8A1*&8)!S#.'$&-*&8)! /!"(/!?1.*!H#!+#%#A8-#+!8%#$! *&?#E!N0#!-8..&HA#!37&A&*B! *8!73&)! <$8?!"(/!
+8#.!)8*!'8?#!U&)!*0#!-3'637#V!H1*!&.!3!'8)*&)181.!#<<8$*E!
N&*A#! ($73)&.3*&8)!.1--8$*!S#.'$&-*&8)! 51B! &)! <$8?! *0#! 8$73)&.3*&8)! ?1.*! H#! #).1$#+E! "(/! 3<<#'*.! *0#! #)*&$#!
H1.&)#..E!/AA!-$8'#..#.!&)!*0#!H1.&)#..!?1.*!H#!.##)!3.!"#$%&'#.!&)!3!"(/!'8)*#L*E!
N&*A#! F8)&*8$&)7!>#*1$)!()!G)%#.*?#)*![>(G\!S#.'$&-*&8)! ()#! 8<! *0#! "(/! -$8?&.#.! &.! *8! &)'$#3.#! *0#! >(G! WXXZE! N0#! 3'*13A! H#)#<&*.!
?1.*! H#! ?8)&*8$#+! &)! 8$+#$! *8! &?-$8%#! *0#! J#36! -8&)*.! 3)+! A#3$)! <$8?! *0#!788+E! S&<<#$#)*! -3$*.! 8<! "(/! '3)! 03%#! 3! %#$B! +&<<#$#)*! *&?#K.'8-#! 8)! >(G!W:XZE!
N&*A#! ]13A&*B!'8)*$8A!S#.'$&-*&8)! 9$8%&+&)7!3!"#$%&'#!<8$!'8).1?-*&8)!?#3).!-8*#)*&3AAB!-$8%&+&)7!<8$!*0#!#)*&$#!
H1.&)#..E!N0&.! $#I1&$#.! *03*!3AA!"#$%&'#.!3$#!.1H^#'*#+! *8!'8)*&)181.!I13A&*B!'8)*$8AE!
N&*A#! "#$%&'#!($&#)*#+!S#%#A8-?#)*!F#*08+!["(/S\!S#.'$&-*&8)! N0#!&)*$8+1'*&8)!8<!"(/!J&AA!'03)7#!08J!+#%#A8-?#)*!-$8^#'*.!3$#!#L#'1*#+!
WX_ZE!!
N&*A#! 28)'#-*!+#<&)&*&8)!S#.'$&-*&8)! "(/!H#&)7!3!$#A3*&%#!)#J!'8)'#-*!?1.*!H#!+#<&)#+!<8$!*0#!H1.&)#..E!!
N&*A#! G)<8$?3*&8)!3$'0&*#'*1$#!S#.'$&-*&8)! 28??1)&'3*&8)! &)! "(/! &.! H3.#+! 8)! ?#..37#.! H#*J##)! A88.#AB! '81-A#+!
"#$%&'#.E!G)!8$+#$!*8!&).1$#!3!'8??8)!1)+#$.*3)+&)7!8<!*0#!'8)*#)*!8<!*0#.#!?#..37#.!3AA!+3*3::!?1.*!H#!+#<&)#+!&)!3!'8??8)!+3*3!?8+#AE!
Table 2: SOA issues [Source: own work] !G!J&AA!)8*!+#.'$&H#!*0#!&..1#.!&)!<1$*0#$!+#-*0!3*!*0&.!-8&)*C!H1*!$#*1$)!*8!*0#.#!&..1#.C!3)+!)8J!A886!3*!08J!*0#B!$#A3*#!*8!,/E!
!!!!!!!!!!!!!!!!!!!!!!!!!!!!!!!!!!!!!!!! !!!!!!!!!!::!58*0!.#?3)*&'!3)+!.B)*3'*&'!+#<&)&*&8).!8<!3AA!'8)'#-*.!&)!*0#!8$73)&M3*&8)!
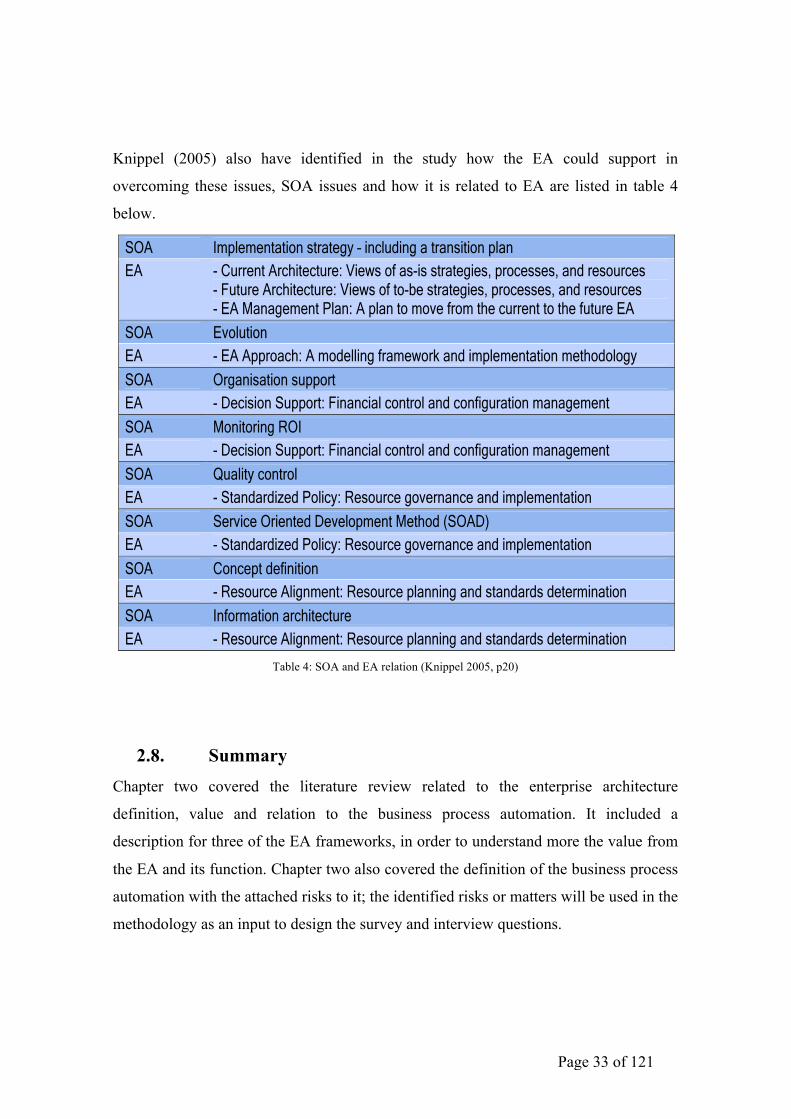
Page 33 of 121
Knippel (2005) also have identified in the study how the EA could support in
overcoming these issues, SOA issues and how it is related to EA are listed in table 4
below.
Table 4: SOA and EA relation (Knippel 2005, p20)
2.8. Summary Chapter two covered the literature review related to the enterprise architecture
definition, value and relation to the business process automation. It included a
description for three of the EA frameworks, in order to understand more the value from
the EA and its function. Chapter two also covered the definition of the business process
automation with the attached risks to it; the identified risks or matters will be used in the
methodology as an input to design the survey and interview questions.
!!!!"#$%&'#!($&#)*#+!,)*#$-$&.#!/$'0&*#'*1$#!
203-*#$!4!53'67$81)+!3)+!'8)'#-*.!
!
937#!:;!8<!==>!
/1*08$4!?3.@1.!A)&--#B! !
C0#! 3D8%#! &..1#.! .1--8$*! *0#! )8)E*#'0)&'3B! +#<&)&*&8)! 8<!"(/! F.##! .#'*&8)! GH:IJ! 3.! 3BB! *0#!
&..1#.!3$#!8<!3!)8)E*#'0)&'3B!)3*1$#J!D1*!@8$#! &)*#$#.*&)7BK! *0#! &..1#.! $#B3*#.! *8!L03*!L3.!
&+#)*&<&#+!3.!D#&)7!&)!*0#!'8)*#M*!8<!,/!F.##!.#'*&8)!GH=H=IH!N!03%#!@3--#+!"'8**!/H!5#$)3$+!
+#<&)&*&8)!8<!L03*! &.! -$8%&+#+!DK!,/O! PQ8'1@#)*3*&8)!@#*08+R!3)+! PS3)37#@#)*!-$87$3@R!
F.##!.#'*&8)!GH=H=I!&)*8!*0#!'8)*#M*!8<!C3DB#!:H!
!
"(/! N@-B#@#)*3*&8)!.*$3*#7K!T!&)'B1+&)7!3!*$3).&*&8)!-B3)!
,/! E!21$$#)*!/$'0&*#'*1$#4!U&#L.!8<!3.E&.!.*$3*#7&#.J!-$8'#..#.J!3)+!$#.81$'#.!
E!V1*1$#!/$'0&*#'*1$#4!U&#L.!8<!*8ED#!.*$3*#7&#.J!-$8'#..#.J!3)+!$#.81$'#.!
E!,/!S3)37#@#)*!9B3)4!/!-B3)!*8!@8%#!<$8@!*0#!'1$$#)*!*8!*0#!<1*1$#!,/!
"(/! ,%8B1*&8)!
,/! E!,/!/--$83'04!/!@8+#BB&)7!<$3@#L8$6!3)+!&@-B#@#)*3*&8)!@#*08+8B87K!
"(/! ($73)&.3*&8)!.1--8$*!
,/! E!Q#'&.&8)!"1--8$*4!V&)3)'&3B!'8)*$8B!3)+!'8)<&71$3*&8)!@3)37#@#)*!
"(/! S8)&*8$&)7!?(N!
,/! E!Q#'&.&8)!"1--8$*4!V&)3)'&3B!'8)*$8B!3)+!'8)<&71$3*&8)!@3)37#@#)*!
"(/! W13B&*K!'8)*$8B!
,/! E!"*3)+3$+&X#+!98B&'K4!?#.81$'#!78%#$)3)'#!3)+!&@-B#@#)*3*&8)!
"(/! "#$%&'#!($&#)*#+!Q#%#B8-@#)*!S#*08+!F"(/QI!
,/! E!"*3)+3$+&X#+!98B&'K4!?#.81$'#!78%#$)3)'#!3)+!&@-B#@#)*3*&8)!
"(/! 28)'#-*!+#<&)&*&8)!
,/! E!?#.81$'#!/B&7)@#)*4!?#.81$'#!-B3))&)7!3)+!.*3)+3$+.!+#*#$@&)3*&8)!
"(/! N)<8$@3*&8)!3$'0&*#'*1$#!
,/! E!?#.81$'#!/B&7)@#)*4!?#.81$'#!-B3))&)7!3)+!.*3)+3$+.!+#*#$@&)3*&8)!
Table 3: EA and SOA relations [Source: own work] !
,/!&.!3D81*!&+#)*&<K&)7!/$*&<3'*.!3)+!28@-8)#)*.!F,/E-$8+1'*.IJ!3)+!+#.'$&D#!3)+!8$73)&X#!
*0#.#!&)!$#B3*&8)!*8!8)#!3)8*0#$H!C0#!&..1#.!$#B3*#+!*8!"(/J!*03*!N!03%#!+#.'$&D#+!&)!C3DB#!:J!
L&BB!-$8+1'#!3!B8*!8<!/$*&<3'*.!3)+!28@-8)#)*.H!
6.2.3 Services C0#!'8)'#-*!8<!+#%#B8-&)7!"#$%&'#.!&)!NC!&.!)8*!3!)#L!*$#)+!D1*!03.!D##)!1.#+!<8$!37#.J!3)+!
&.! *0#! -3$*! 8<! "(/! L0#$#! *0#! B&)6! *8! *0#! #.*3DB&.0#+! NC! @#*08+8B87&#.! 3$#! .*$8)7#.*! T! 3.!
&BB1.*$3*#+!DK!0K-#$+&'*&8)3$KY.!+#<&)&*&8)!8<!"#$%&'#4!
!!
PZ8$6!-#$<8$@#+!F8$!8<<#$#+I!DK!3!.#$%#$H!C0&.!@3K!@#3)!.&@-BK!.#$%&)7!.&@-B#!
$#[1#.*.!<8$!+3*3!*8!D#!.#)*!8$!.*8$#+!F3.!L&*0!<&B#!.#$%#$.J!78-0#$!8$!0**-!.#$%#$.J!
#E@3&B! .#$%#$.J! <&)7#$! .#$%#$.J! "W\! .#$%#$.J! #*'HIO! 8$! &*! @3K! D#! @8$#! '8@-B#M!
L8$6J! .1'0!3.! *03*! 8<! &$'! .#$%#$.J! -$&)*! .#$%#$.J!]!Z&)+8L.! .#$%#$.J! 8$! -$8'#..!
.#$%#$.HR!
^_>`!
!
C0&.! +#<&)&*&8)! &.! )8*! .##)! &)! 3! .-#'&<&'! '8)*#M*J! 3B*08170! &*! &.! '#)*$#+! 3$81)+! 3! .#$%#$!
-#$.-#'*&%#H!
!
25QN!+#<&)#.!3!"#$%&'#4!
!
Pa&.! 3! %#0&'B#! DK! L0&'0! 3! '8).1@#$Y.! )##+! 8$! L3)*! &.! .3*&.<&#+! 3''8$+&)7! *8! 3!
)#78*&3*#+! '8)*$3'*! F&@-B&#+! 8$! #M-B&'&*I! L0&'0! &)'B1+#.! "#$%&'#! /7$##@#)*J!
V1)'*&8)!(<<#$#+!#*'RH!
^=bJ!-H!_`!
Page 34 of 121
3. Methodology This chapter will cover the methodology that will guide this research. First section
contains the selected approach and the rational behind it in answering the research
question. Second section covers the discussion to justify the data collection sampling
approach. Third section will describe the instrumentation that will be used and its
characteristics, which will help in collecting the required data. Following that are
sections of validity, reliability, procedure and finally the limitations of the proposed
methodology.
3.1. Research methodology design
There are many reasons for initiating a scientific research, you can prove, disprove or
question a hypothesis, new facts might also be generated from the research; but, the
research has to be of a value and significant to the community. The result out of this
research should answer the question:
“How dose implementing enterprise architecture framework affects the business
processes automation initiatives? ”
In the domain of enterprise architecture frameworks, there have been many records of
researches through thesis, particularly around the business value. Also, decision makers
become more aware of the impact of selecting the wrong approach, especially during
the last few years, when most of the companies and organizations have gone under
budget reduction. As a result, the scientific researches can help the decision makers in
the process of decision-making, by providing proven facts, tools and applied methods to
produce a guideline or justification to the decisions.
As this research is covering the enterprise architecture topic and it is a newly concept at
the government organizations in UAE, thus, an empirical research at this area, will build
a good knowledge base for the decision makers.
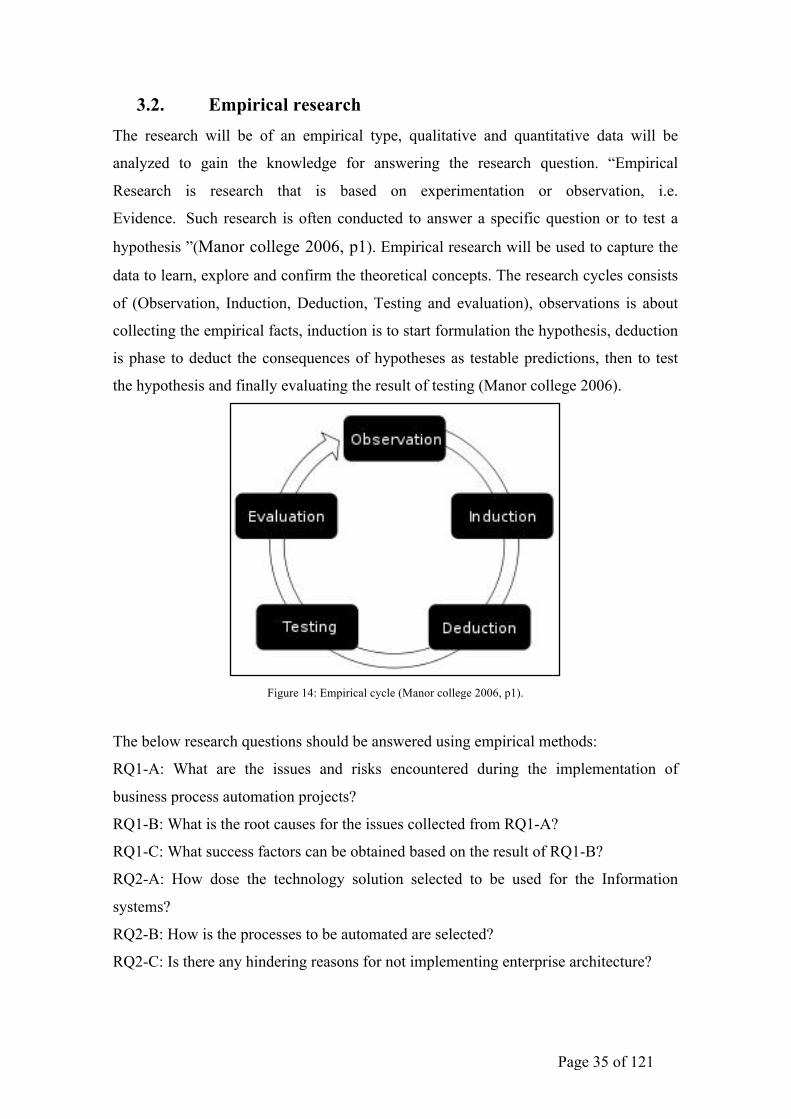
Page 35 of 121
3.2. Empirical research The research will be of an empirical type, qualitative and quantitative data will be
analyzed to gain the knowledge for answering the research question. “Empirical
Research is research that is based on experimentation or observation, i.e.
Evidence. Such research is often conducted to answer a specific question or to test a
hypothesis ”(Manor college 2006, p1). Empirical research will be used to capture the
data to learn, explore and confirm the theoretical concepts. The research cycles consists
of (Observation, Induction, Deduction, Testing and evaluation), observations is about
collecting the empirical facts, induction is to start formulation the hypothesis, deduction
is phase to deduct the consequences of hypotheses as testable predictions, then to test
the hypothesis and finally evaluating the result of testing (Manor college 2006).
Figure 14: Empirical cycle (Manor college 2006, p1).
The below research questions should be answered using empirical methods:
RQ1-A: What are the issues and risks encountered during the implementation of
business process automation projects?
RQ1-B: What is the root causes for the issues collected from RQ1-A?
RQ1-C: What success factors can be obtained based on the result of RQ1-B?
RQ2-A: How dose the technology solution selected to be used for the Information
systems?
RQ2-B: How is the processes to be automated are selected?
RQ2-C: Is there any hindering reasons for not implementing enterprise architecture?
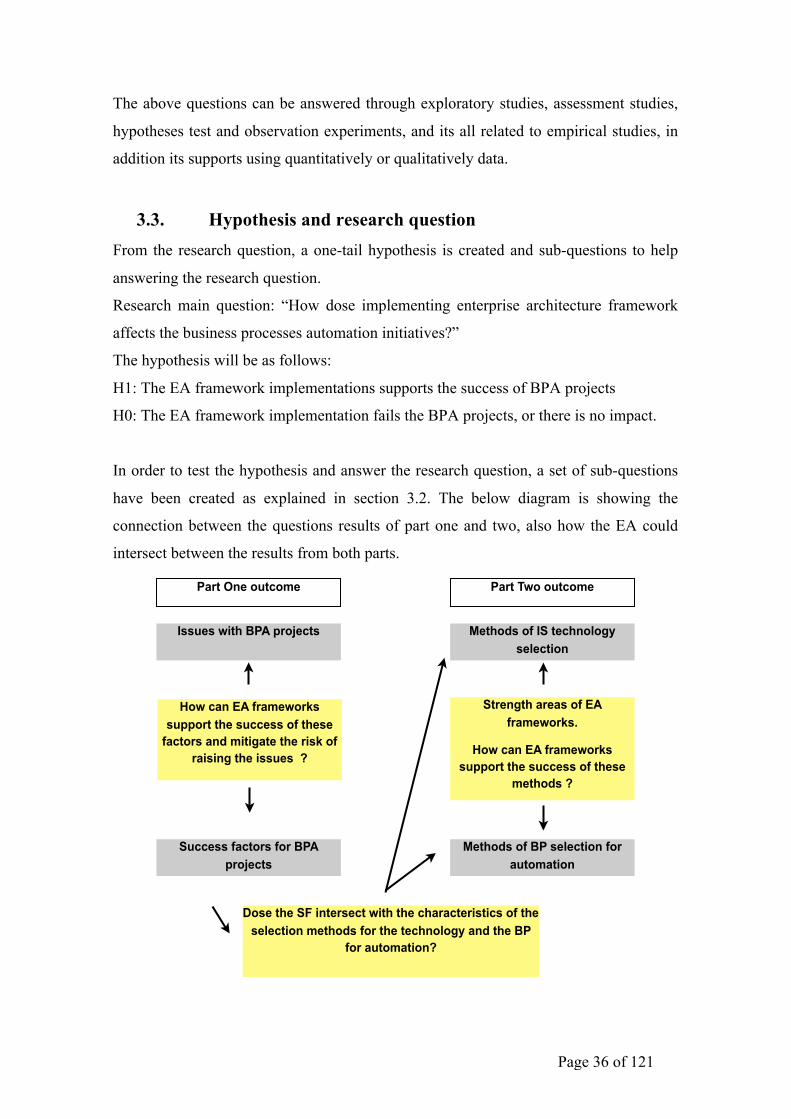
Page 36 of 121
The above questions can be answered through exploratory studies, assessment studies,
hypotheses test and observation experiments, and its all related to empirical studies, in
addition its supports using quantitatively or qualitatively data.
3.3. Hypothesis and research question From the research question, a one-tail hypothesis is created and sub-questions to help
answering the research question.
Research main question: “How dose implementing enterprise architecture framework
affects the business processes automation initiatives?”
The hypothesis will be as follows:
H1: The EA framework implementations supports the success of BPA projects
H0: The EA framework implementation fails the BPA projects, or there is no impact.
In order to test the hypothesis and answer the research question, a set of sub-questions
have been created as explained in section 3.2. The below diagram is showing the
connection between the questions results of part one and two, also how the EA could
intersect between the results from both parts.
How can EA frameworks support the success of these
factors and mitigate the risk of raising the issues ?
Part One outcome
Issues with BPA projects
Success factors for BPA projects
Part Two outcome
Methods of BP selection for automation
Methods of IS technology selection
Strength areas of EA frameworks.
How can EA frameworks support the success of these
methods ?
Dose the SF intersect with the characteristics of the selection methods for the technology and the BP
for automation?
Page 37 of 121
3.4. Limitations of empirical research While the empirical research can support the research objectives, but empirical research
has its limitations. This research will use hypothesis approach; this hypothesis testing
procedure is responsible for an important limitation of empirical research. Empirical
studies are very good at identifying design errors and wrong assumptions but they do
not suggest new theories or approaches directly. Even an explorative study requires
some hypotheses about possible impact factors. Thus, empirical evaluations have to be
combined with theoretical grounds to yield useful results (Weibelizahl 2010). In
addition to that, empirical research relays on the validity of the collected data, it could
be not reliable enough.
3.5. Data collection The research data collection will depend on distributed survey and structured
interviews, the target is the government organizations in UAE, business decision makers
and IT team will be the main target. However, it is very difficult to collect the data from
all the population under this category. So, a scientific sampling method has to be used.
In this research non probability sampling will be used, it dose not involve random
selection, as the target population has to be from two groups the IT and business units,
non-proportional quota sampling is the subcategory from non probability method, using
this sampling, a minimum number of sampled units can be specified for each category
IT and business units. Five percent minimum respondents have to be from the IT
category, and not more than 50% of the total respondents. This is to assure getting
adequate feedback from the business and not to be bias to the IT responses.
The below table is showing how is the data will be collected and from whom for this
research:
Question
code Size of the sample
Quantitative/qualitative
data
Where and from whom the
data will be collected
RQ1-A At least 5% of the
respondents has to
come from IT units,
Quantitative data will be
used as it is time saving
and can be formed in a
1- Literature Review will be
used for two things, first, to
be used as initial data in
RQ1-B RQ1-C
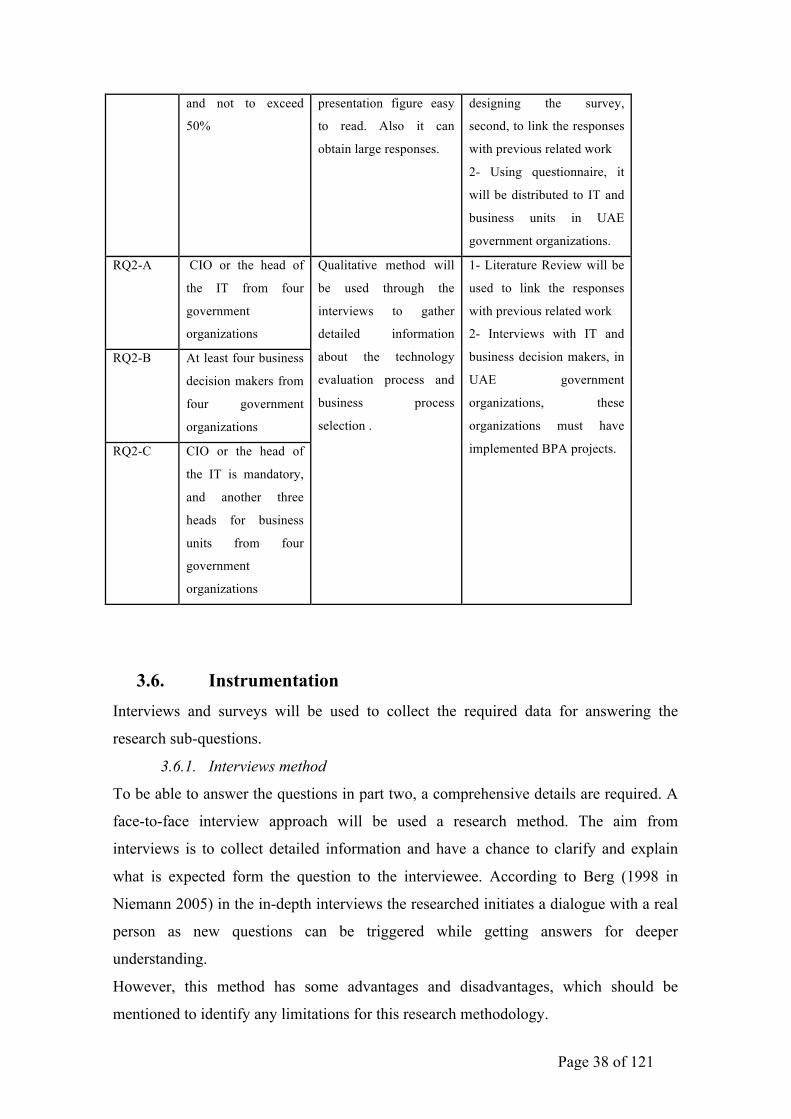
Page 38 of 121
and not to exceed
50% presentation figure easy
to read. Also it can
obtain large responses.
designing the survey,
second, to link the responses
with previous related work
2- Using questionnaire, it
will be distributed to IT and
business units in UAE
government organizations. RQ2-A CIO or the head of
the IT from four
government
organizations
Qualitative method will
be used through the
interviews to gather
detailed information
about the technology
evaluation process and
business process
selection .
1- Literature Review will be
used to link the responses
with previous related work
2- Interviews with IT and
business decision makers, in
UAE government
organizations, these
organizations must have
implemented BPA projects.
RQ2-B At least four business
decision makers from
four government
organizations RQ2-C CIO or the head of
the IT is mandatory,
and another three
heads for business
units from four
government
organizations
3.6. Instrumentation Interviews and surveys will be used to collect the required data for answering the
research sub-questions.
3.6.1. Interviews method
To be able to answer the questions in part two, a comprehensive details are required. A
face-to-face interview approach will be used a research method. The aim from
interviews is to collect detailed information and have a chance to clarify and explain
what is expected form the question to the interviewee. According to Berg (1998 in
Niemann 2005) in the in-depth interviews the researched initiates a dialogue with a real
person as new questions can be triggered while getting answers for deeper
understanding.
However, this method has some advantages and disadvantages, which should be
mentioned to identify any limitations for this research methodology.
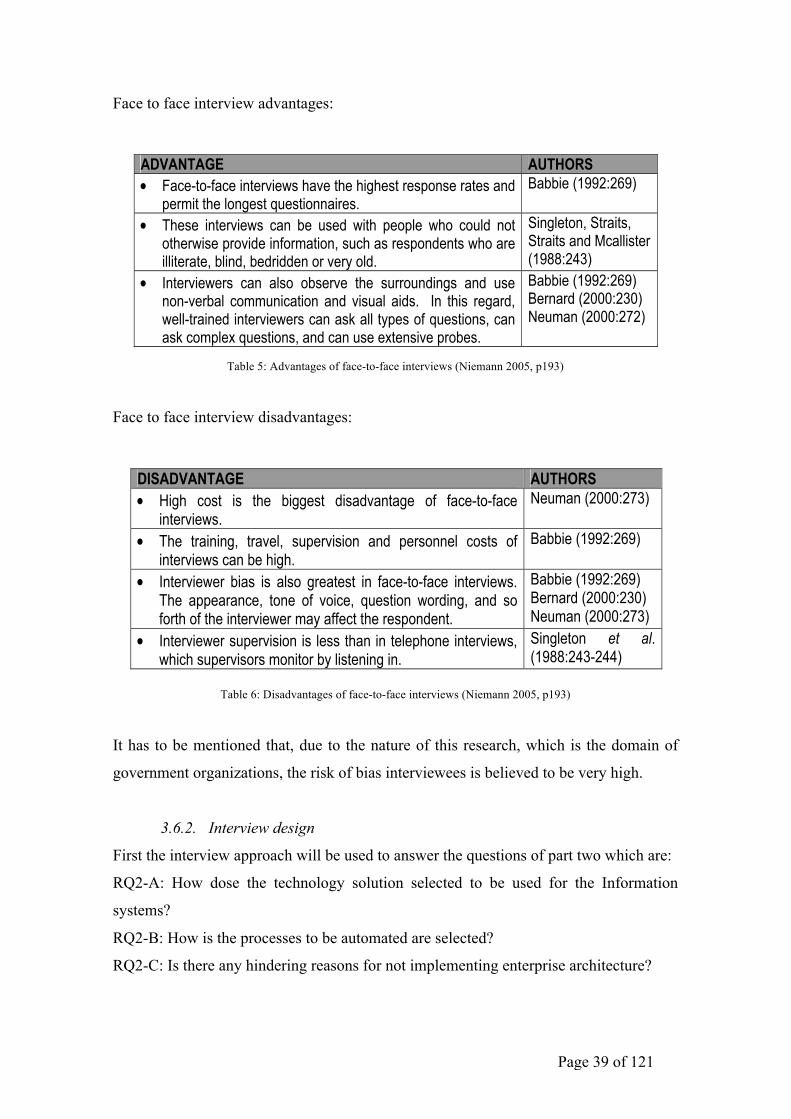
Page 39 of 121
Face to face interview advantages:
Table 5: Advantages of face-to-face interviews (Niemann 2005, p193)
Face to face interview disadvantages:
Table 6: Disadvantages of face-to-face interviews (Niemann 2005, p193)
It has to be mentioned that, due to the nature of this research, which is the domain of
government organizations, the risk of bias interviewees is believed to be very high.
3.6.2. Interview design
First the interview approach will be used to answer the questions of part two which are:
RQ2-A: How dose the technology solution selected to be used for the Information
systems?
RQ2-B: How is the processes to be automated are selected?
RQ2-C: Is there any hindering reasons for not implementing enterprise architecture?
Chapter 6 Methodology: Empirical research
193
Face-to-face administration offers some advantages, but it has some
disadvantages as well. The advantages are discussed first in a table containing
the views of different authors.
Table 6.6 Advantages of face-to-face interviews ADVANTAGE AUTHORS � Face-to-face interviews have the highest response rates and
permit the longest questionnaires. Babbie (1992:269)
� These interviews can be used with people who could not otherwise provide information, such as respondents who are illiterate, blind, bedridden or very old.
Singleton, Straits, Straits and Mcallister (1988:243)
� Interviewers can also observe the surroundings and use non-verbal communication and visual aids. In this regard, well-trained interviewers can ask all types of questions, can ask complex questions, and can use extensive probes.
Babbie (1992:269) Bernard (2000:230) Neuman (2000:272)
Consequently, the use of a face-to-face approach in conducting interviews also
has some disadvantages. These disadvantages are discussed in Table 6.7.
Table 6.7 Disadvantages of face-to-face interviews DISADVANTAGE AUTHORS � High cost is the biggest disadvantage of face-to-face
interviews. Neuman (2000:273)
� The training, travel, supervision and personnel costs of interviews can be high.
Babbie (1992:269)
� Interviewer bias is also greatest in face-to-face interviews. The appearance, tone of voice, question wording, and so forth of the interviewer may affect the respondent.
Babbie (1992:269) Bernard (2000:230) Neuman (2000:273)
� Interviewer supervision is less than in telephone interviews, which supervisors monitor by listening in.
Singleton et al. (1988:243-244)
The greatest disadvantage of face-to-face interviews in this study was that
interviewer bias could be considered as a possible factor, as the appearance,
tone of voice, and question wording of the interviewer might have affected the
respondents. However, the other three disadvantages did not have an impact on
the interviews, as the interviews did not have major cost implications and all the
interviews were conducted by the researcher and therefore no supervision of
other interviewers was required.
Page 40 of 121
The interview will start with introduction to the university and the research aim and
objectives, following that an introduction to the research significant to the
organizations. A confidentiality and privacy statement will be mentioned to the
interviewee before starting the interview.
The introduction will be in English or Arabic; it depends on the interviewee
preferences, below is a detailed context for the interview introduction and questions:
Introduction statement:
I want to thank you for taking the time to meet with me today. My name is Salama
aldhaheri and I would like to talk to you about your business process automation
projects. I am assessing the different approaches that are used to select the technology
or the processes for the purpose of BPA initiatives.
The interview should take less than an hour. I will be typing the session on my laptop.
Please be sure to speak up so that i do not miss your comments.
All responses will be kept confidential. This means that your interview responses will
only be shared with research team members and we will ensure that any information we
include in our report does not identify you as the respondent. Remember, you don’t
have to talk about anything you don’t want to and you may end the interview at any
time.
Are there any questions about what I have just explained? Are you willing to participate
in this interview?
The first part from the interview will be directed to the decision makers in the IT units
or the CIO, to answer the research sub-question for part two:
RQ2-A: How dose the technology solution selected to be used for the information
systems?
Below are list of more questions to guide the answer to the above sub-question:
• Do you have any process automation projects? What are they?
• Who owns these applications?
• Do you consider integration the applications and provide the business as a services,
such as the approach of SOA?
• How are the applications describes the business processes?
• How do you describe the relation between the IT and business stakeholders in
Page 41 of 121
supporting the business process automation?
• Do you have any strategy to purchase the information systems or any other
technology for business process automation?
• Can you describe to me the process?
• Would you please give me an example?
• What did you think of this strategy?
• What would you do differently next time? Please explain why?
• How do you describe the relation between the IT and business stakeholders in
supporting the business process automation?
The second part from the interview will be directed to the business decision makers in
the organization, this part should answer the research sub-question for part two:
RQ2-B: How is the processes to be automated are selected?
Below are list of more questions to guide the answer to the above sub-question, it is to
understand in deep how is the business processes described, documented and
implemented through business process automation.
• Do you have any process automation projects? What are they?
• Who owns these applications?
• Dose the business processes described as services?
• Do you have any strategy to identify the business process, which needs
automation?
• Can you describe to me the process?
• Would you please give me an example?
• What did you think of this approach?
• What would you do differently next time? Please explain why?
• How do you describe the relation between the IT and business stakeholders in
supporting the business process automation?
The final part of the interview is question:
RQ2-C: Is there any hindering reasons for not implementing enterprise architecture?
This question will be asked to both, IT and business decision makers and will be used
for future recommendations.
In order to guide the interviewee to provide detailed information for the above question,
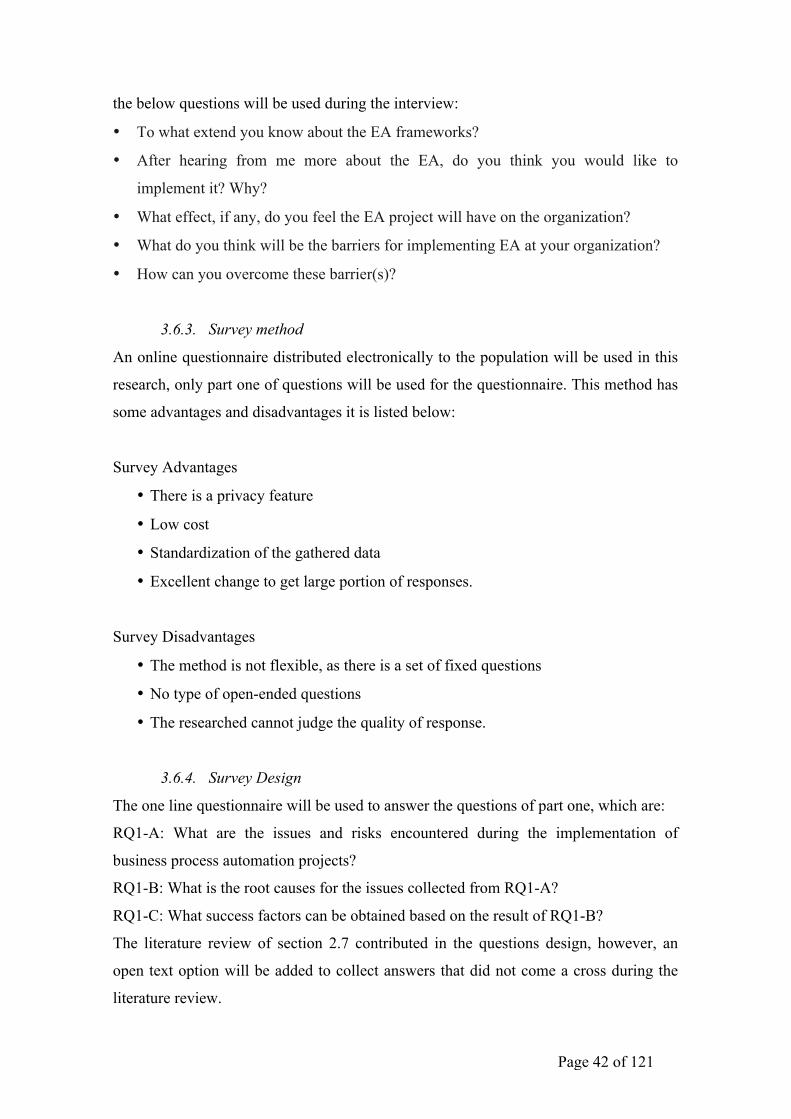
Page 42 of 121
the below questions will be used during the interview:
• To what extend you know about the EA frameworks?
• After hearing from me more about the EA, do you think you would like to
implement it? Why?
• What effect, if any, do you feel the EA project will have on the organization?
• What do you think will be the barriers for implementing EA at your organization?
• How can you overcome these barrier(s)?
3.6.3. Survey method
An online questionnaire distributed electronically to the population will be used in this
research, only part one of questions will be used for the questionnaire. This method has
some advantages and disadvantages it is listed below:
Survey Advantages
• There is a privacy feature
• Low cost
• Standardization of the gathered data
• Excellent change to get large portion of responses.
Survey Disadvantages
• The method is not flexible, as there is a set of fixed questions
• No type of open-ended questions
• The researched cannot judge the quality of response.
3.6.4. Survey Design
The one line questionnaire will be used to answer the questions of part one, which are:
RQ1-A: What are the issues and risks encountered during the implementation of
business process automation projects?
RQ1-B: What is the root causes for the issues collected from RQ1-A?
RQ1-C: What success factors can be obtained based on the result of RQ1-B?
The literature review of section 2.7 contributed in the questions design, however, an
open text option will be added to collect answers that did not come a cross during the
literature review.
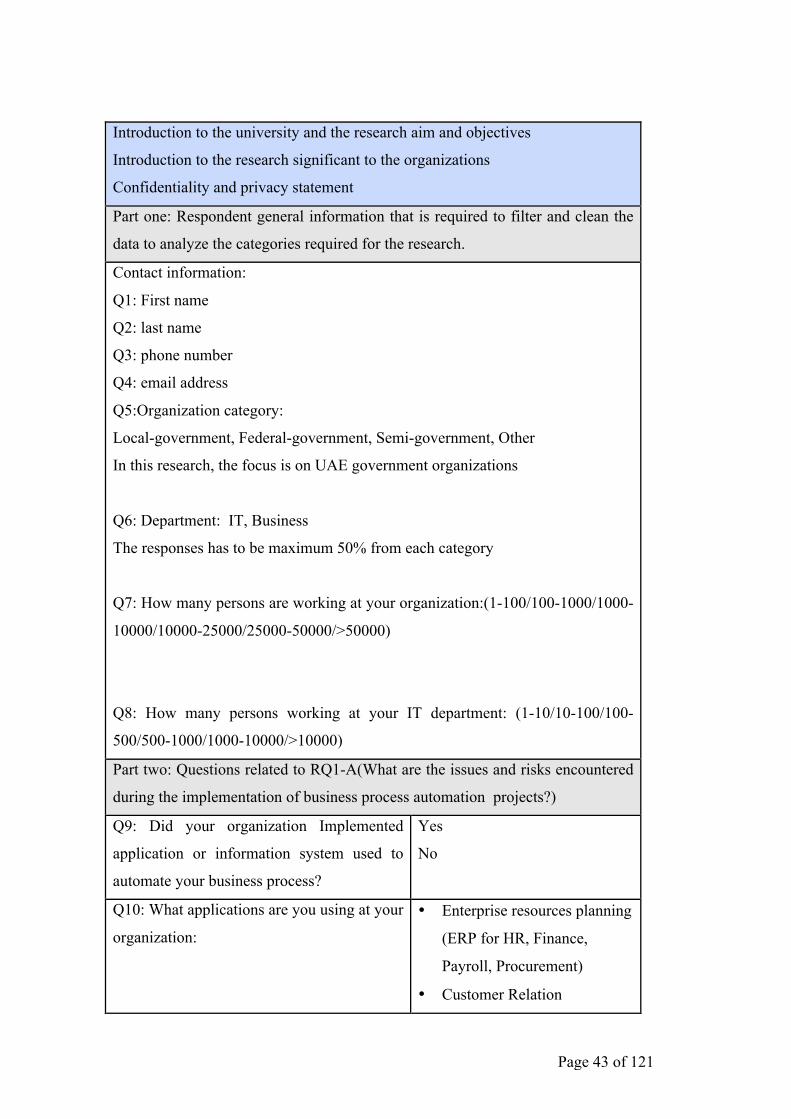
Page 43 of 121
Introduction to the university and the research aim and objectives
Introduction to the research significant to the organizations
Confidentiality and privacy statement
Part one: Respondent general information that is required to filter and clean the
data to analyze the categories required for the research.
Contact information:
Q1: First name
Q2: last name
Q3: phone number
Q4: email address
Q5:Organization category:
Local-government, Federal-government, Semi-government, Other
In this research, the focus is on UAE government organizations
Q6: Department: IT, Business
The responses has to be maximum 50% from each category
Q7: How many persons are working at your organization:(1-100/100-1000/1000-
10000/10000-25000/25000-50000/>50000)
Q8: How many persons working at your IT department: (1-10/10-100/100-
500/500-1000/1000-10000/>10000)
Part two: Questions related to RQ1-A(What are the issues and risks encountered
during the implementation of business process automation projects?)
Q9: Did your organization Implemented
application or information system used to
automate your business process?
Yes
No
Q10: What applications are you using at your
organization:
• Enterprise resources planning
(ERP for HR, Finance,
Payroll, Procurement)
• Customer Relation
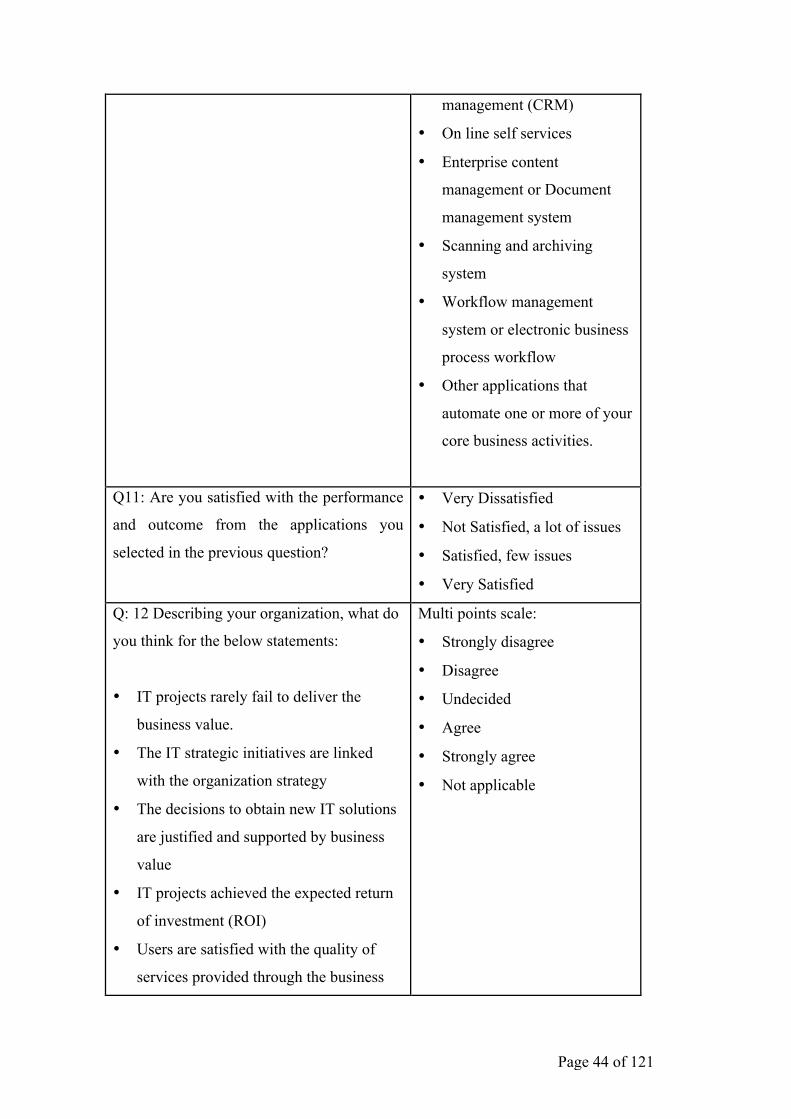
Page 44 of 121
management (CRM)
• On line self services
• Enterprise content
management or Document
management system
• Scanning and archiving
system
• Workflow management
system or electronic business
process workflow
• Other applications that
automate one or more of your
core business activities.
Q11: Are you satisfied with the performance
and outcome from the applications you
selected in the previous question?
• Very Dissatisfied
• Not Satisfied, a lot of issues
• Satisfied, few issues
• Very Satisfied
Q: 12 Describing your organization, what do
you think for the below statements:
• IT projects rarely fail to deliver the
business value.
• The IT strategic initiatives are linked
with the organization strategy
• The decisions to obtain new IT solutions
are justified and supported by business
value
• IT projects achieved the expected return
of investment (ROI)
• Users are satisfied with the quality of
services provided through the business
Multi points scale:
• Strongly disagree
• Disagree
• Undecided
• Agree
• Strongly agree
• Not applicable
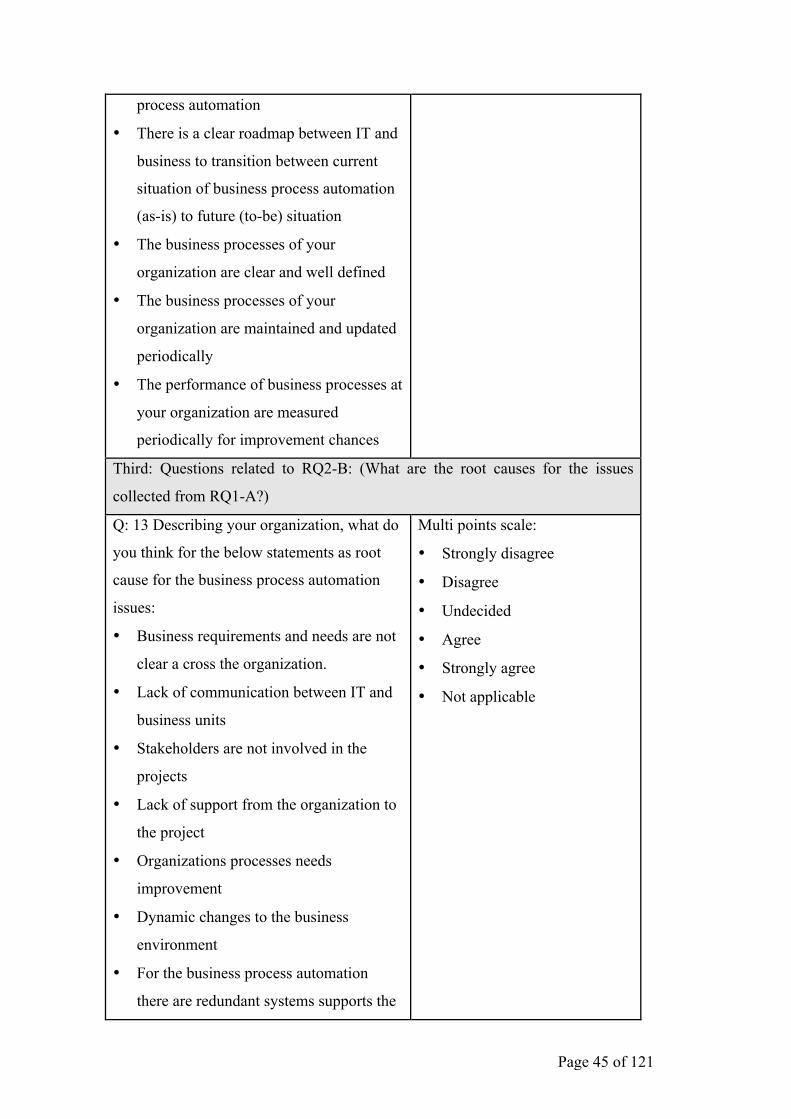
Page 45 of 121
process automation
• There is a clear roadmap between IT and
business to transition between current
situation of business process automation
(as-is) to future (to-be) situation
• The business processes of your
organization are clear and well defined
• The business processes of your
organization are maintained and updated
periodically
• The performance of business processes at
your organization are measured
periodically for improvement chances
Third: Questions related to RQ2-B: (What are the root causes for the issues
collected from RQ1-A?)
Q: 13 Describing your organization, what do
you think for the below statements as root
cause for the business process automation
issues:
• Business requirements and needs are not
clear a cross the organization.
• Lack of communication between IT and
business units
• Stakeholders are not involved in the
projects
• Lack of support from the organization to
the project
• Organizations processes needs
improvement
• Dynamic changes to the business
environment
• For the business process automation
there are redundant systems supports the
Multi points scale:
• Strongly disagree
• Disagree
• Undecided
• Agree
• Strongly agree
• Not applicable
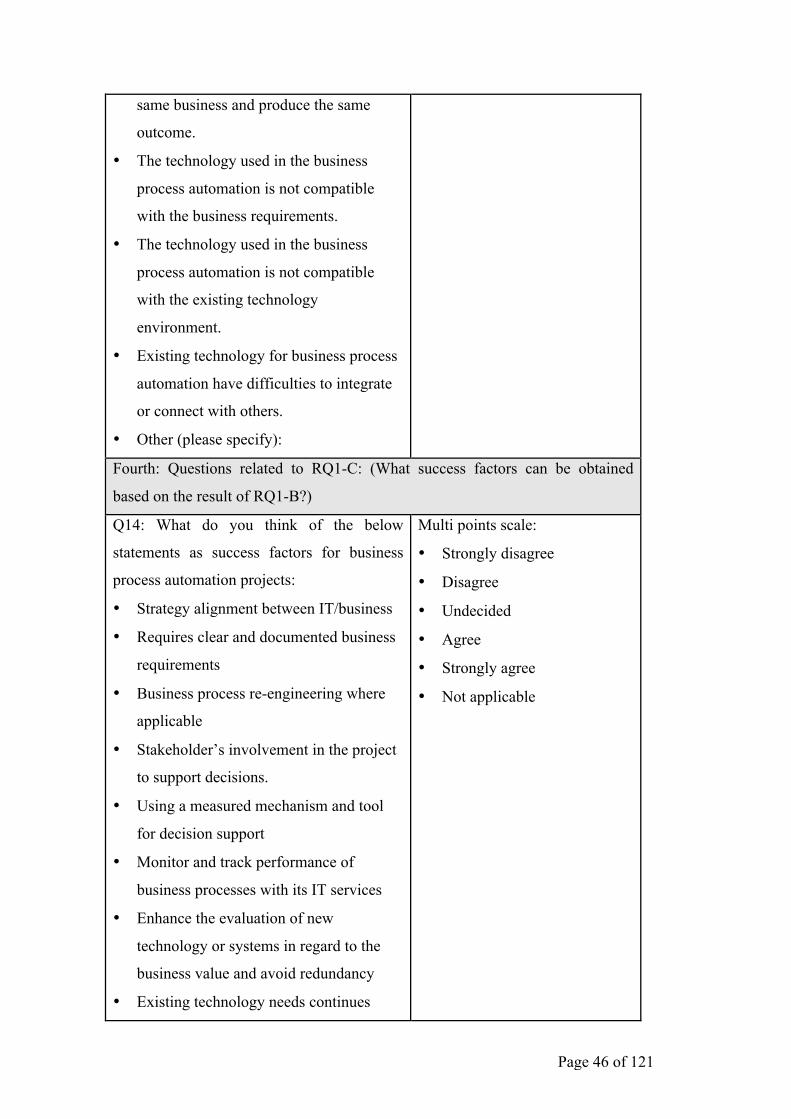
Page 46 of 121
same business and produce the same
outcome.
• The technology used in the business
process automation is not compatible
with the business requirements.
• The technology used in the business
process automation is not compatible
with the existing technology
environment.
• Existing technology for business process
automation have difficulties to integrate
or connect with others.
• Other (please specify):
Fourth: Questions related to RQ1-C: (What success factors can be obtained
based on the result of RQ1-B?)
Q14: What do you think of the below
statements as success factors for business
process automation projects:
• Strategy alignment between IT/business
• Requires clear and documented business
requirements
• Business process re-engineering where
applicable
• Stakeholder’s involvement in the project
to support decisions.
• Using a measured mechanism and tool
for decision support
• Monitor and track performance of
business processes with its IT services
• Enhance the evaluation of new
technology or systems in regard to the
business value and avoid redundancy
• Existing technology needs continues
Multi points scale:
• Strongly disagree
• Disagree
• Undecided
• Agree
• Strongly agree
• Not applicable
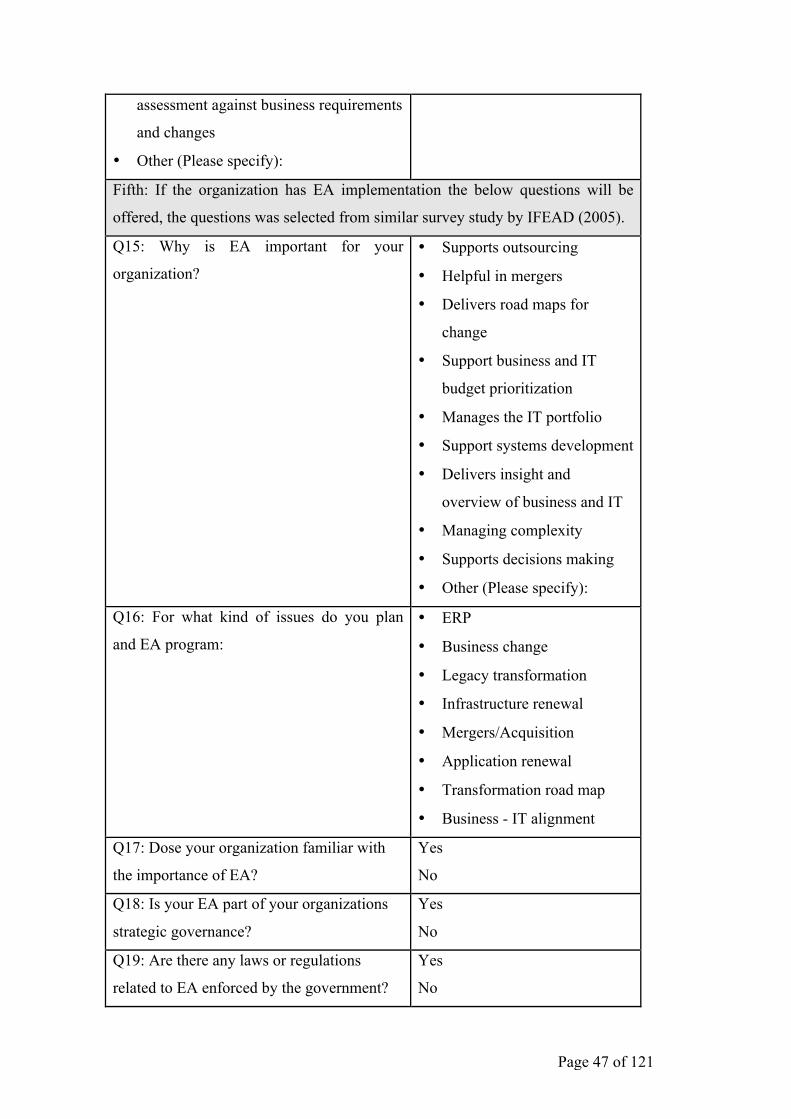
Page 47 of 121
assessment against business requirements
and changes
• Other (Please specify):
Fifth: If the organization has EA implementation the below questions will be
offered, the questions was selected from similar survey study by IFEAD (2005).
Q15: Why is EA important for your
organization?
• Supports outsourcing
• Helpful in mergers
• Delivers road maps for
change
• Support business and IT
budget prioritization
• Manages the IT portfolio
• Support systems development
• Delivers insight and
overview of business and IT
• Managing complexity
• Supports decisions making
• Other (Please specify):
Q16: For what kind of issues do you plan
and EA program:
• ERP
• Business change
• Legacy transformation
• Infrastructure renewal
• Mergers/Acquisition
• Application renewal
• Transformation road map
• Business - IT alignment
Q17: Dose your organization familiar with
the importance of EA?
Yes
No
Q18: Is your EA part of your organizations
strategic governance?
Yes
No
Q19: Are there any laws or regulations
related to EA enforced by the government?
Yes
No
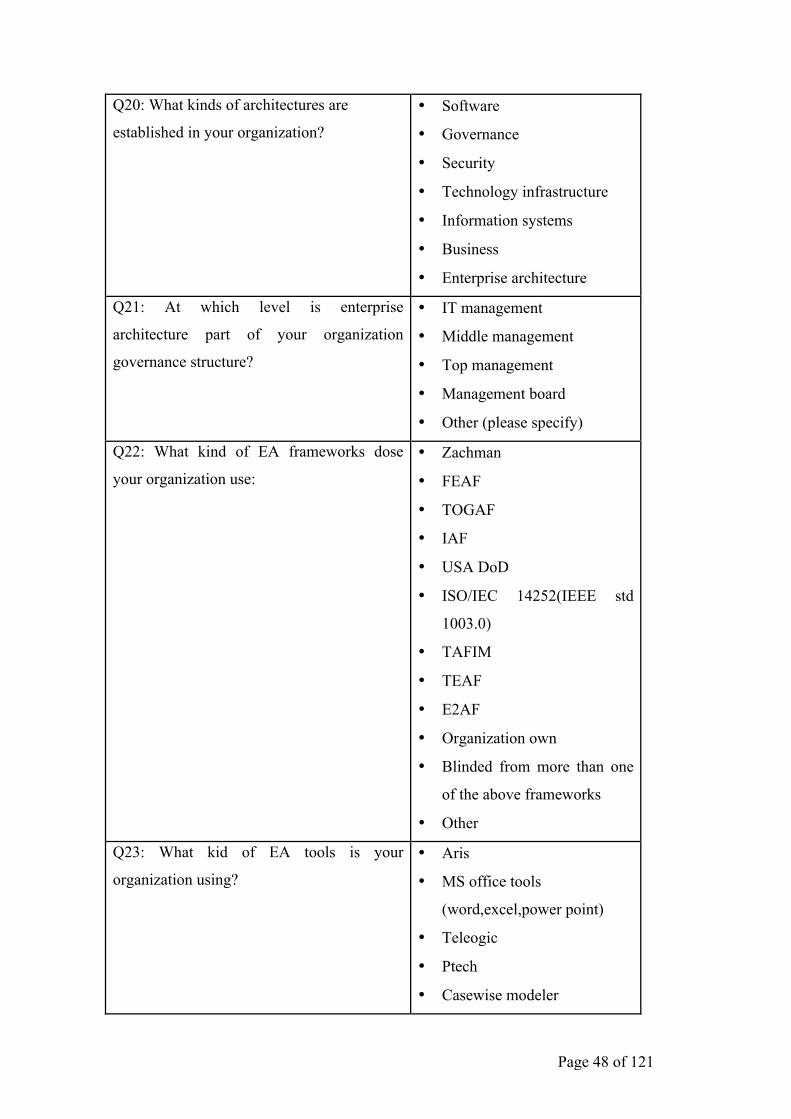
Page 48 of 121
Q20: What kinds of architectures are
established in your organization?
• Software
• Governance
• Security
• Technology infrastructure
• Information systems
• Business
• Enterprise architecture
Q21: At which level is enterprise
architecture part of your organization
governance structure?
• IT management
• Middle management
• Top management
• Management board
• Other (please specify)
Q22: What kind of EA frameworks dose
your organization use:
• Zachman
• FEAF
• TOGAF
• IAF
• USA DoD
• ISO/IEC 14252(IEEE std
1003.0)
• TAFIM
• TEAF
• E2AF
• Organization own
• Blinded from more than one
of the above frameworks
• Other
Q23: What kid of EA tools is your
organization using?
• Aris
• MS office tools
(word,excel,power point)
• Teleogic
• Ptech
• Casewise modeler
Page 49 of 121
• Troux’Metis’
• MEGA
• Other
3.7. Research validity and reliability Validity of the findings is a concern for the questioners approach, however by
conduction interviews, the data validity will be much higher, as the risk of
misunderstanding the questions will be reduced. The results reliability will be tested
through a comparison with the collected literature review, to find out if there are any
similarities, Moreover, by working with both questioners and interviews, the risk of
getting biased responses will be reduced.
3.8. Methodology procedure The two types used in this research are interviews and questionnaire. For the
questionnaire, an online survey will be implemented and distributed to the target
population electronically using, emails, Facebook, iPhone and BlackBerry.
As for the interviews, an appointment will be scheduled with the targeted people, at the
beginning of the interview, an introduction will be given about the university program
and researches role in the university, and then an introduction to the research subject
will start. The interviewee will be asked for any ethical concerns before starting. A
guideline in how to answer the question without bias will be communicated; the risk of
giving bias information will be explained to the interviewee. After collecting the
required data, the answers will be confirmed and reviewed in the concluding.
3.9. Research methodology limitations The research methodology has some limitations in the area of data validity and bias
respondents as explained in the sections of empirical research and methodology
instrumentations. However, the interview and the survey will be in both Arabic and
English languages to facilitate the respondents task. The results will be translated back
in English for the research document.

Page 50 of 121
3.10. Summary The purpose of this chapter was to discuss the methodology approach in the empirical
research of the study. The justification for using the qualitative and quantitative data
was presented and linked to the research requirements. Also the method of sampling
design and data analysis was clarified. For each part of the methodology, the limitations
were identified and a mitigation or workarounds were suggested.
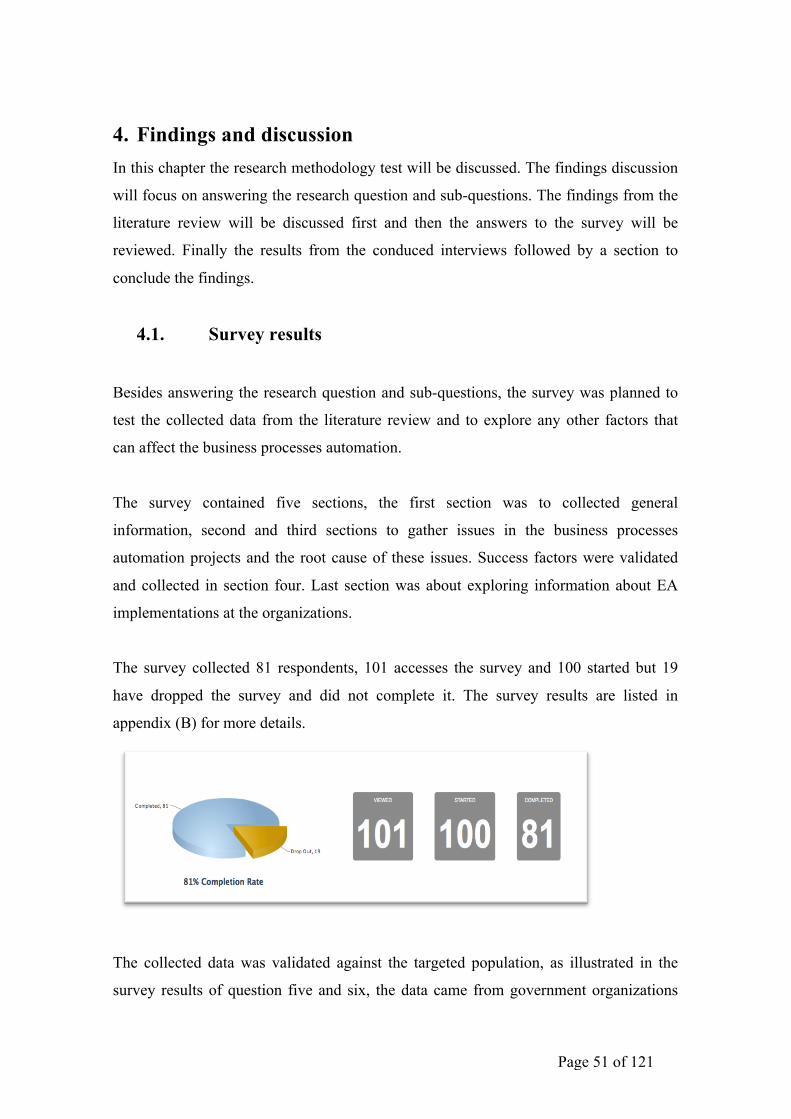
Page 51 of 121
4. Findings and discussion In this chapter the research methodology test will be discussed. The findings discussion
will focus on answering the research question and sub-questions. The findings from the
literature review will be discussed first and then the answers to the survey will be
reviewed. Finally the results from the conduced interviews followed by a section to
conclude the findings.
4.1. Survey results
Besides answering the research question and sub-questions, the survey was planned to
test the collected data from the literature review and to explore any other factors that
can affect the business processes automation.
The survey contained five sections, the first section was to collected general
information, second and third sections to gather issues in the business processes
automation projects and the root cause of these issues. Success factors were validated
and collected in section four. Last section was about exploring information about EA
implementations at the organizations.
The survey collected 81 respondents, 101 accesses the survey and 100 started but 19
have dropped the survey and did not complete it. The survey results are listed in
appendix (B) for more details.
The collected data was validated against the targeted population, as illustrated in the
survey results of question five and six, the data came from government organizations
Page 52 of 121
only and the responses from IT employees didn’t exceed the 50% as it was planned, and
with a contribution from large organizations with a population between (100 to 10,000)
as showed in the results of question number seven and eight.
Most of the respondents to question number nine and ten identified business process
automation implementations in their organizations. Around 56% of these projects
related to Enterprise Resource Planning (ERP), workflow management and other core
business solutions.
Section two of the survey contributed in identifying the issues or risks that could be
associated with business process automation projects, question number eleven, pointed
out that around 90% of the respondents encountering issues with the performance of
their automation projects, from the 90% there are 24% indicated a lot of issues and
complete dissatisfaction.
Further more, when the respondents were asked to say what they think of the quality of
services coming through the automated processes, only 43% agreed that the users are
not satisfied with the quality, 47% indicated a satisfaction with the service and 10% did
not decide.
In order to investigate deeper on the issues behind user dissatisfaction in business
process automation performance, section three from the survey contains a collected
statements from the literature review that are expected to describe the issues in the
business process projects. The respondents were asked to describe their opinion about
these statements. More than 50% of the responses highlighted great trust that IT projects
rarely fail, supported by the business and aligned with the organization strategy.
However there was not enough information whether these projects have returned on
investment, this might be because these organizations are funded by the government and
the practice of ROI is not yet mature and the data not yet formulated or published, but
this research will not go deep on this matter as its out of the research scope.
On the other hand, between 53% and 60% responses disagree with the below statements
and 10% did not decide about it:
• There is a clear roadmap between IT and business to transition between current
Page 53 of 121
situation of business process automation (as-is) to future (to-be) situation
• The business processes of your organization are clear and well defined
• The business processes of your organization are maintained and updated
periodically
• The performance of business processes at your organization are measured
periodically for improvement chances
The above statements pointing to a business processes concerns and not a technology
issues.
In section three, statements of an expected root causes for the unsatisfactory of the
business process automation projects were listed, respondents were requested to provide
their judgment about it. The result shows that the root cause can be less effective if it is
related to the organization support or the stakeholder participation. Also there was no
clear trend of having a communication problem, 50% did not think the communication
between IT and business is a root cause. The dynamic change in the organization
process was not listed as an important root cause; only 34% identified it as a root cause,
which shows a support from the government and the organizations to the IT projects.
Instead, 61% agrees that business requirements clarity a cross the organization is a main
root cause for the issues related to business process automation and 50% agreed that if
the organizations didn’t not improve its processes before engaging in an automation
project, the automation project will have issues, which has been proven in the literature
review as well.
On the other hand, although there was 50% who disagree that the technology is not
supporting the business requirements and 51% disagree that the technology is not
compatible with the existing IT environment, but 60% respondents agreed that existing
technology for business process automation have difficulties to integrate or connects,
and 65% respondents highlighted the redundancy in the information systems as a root
cause, on other words, there are some applications can deliver or store the same
information causing a redundancy. This contradiction shows that organizations are
facilitating the acquisition of high-end technology but the linking to the business
Page 54 of 121
processes could be hindrance to deliver the business value.
For the same section of the survey, the respondents specified in the free text question
number of other root causes listed below:
1. IT outsourcing initiatives affecting the internal business process delivery
2. Sharing the IT infrastructure or applications with other organizations which have
different business requirements
3. Organization strategy not clear or mature.
The fourth section of the survey, presented a success factors for the business processes
automation projects obtained from the literature review, the respondents ordered the
importance of these success factors as below:
1. Monitor and track performance of business processes with its IT services
2. Requires clear and documented business requirements
3. Using a measured mechanism and tool for decision support
4. Strategy alignment between IT/business
5. Stakeholder’s involvement in the project to support decisions
6. Enhance the evaluation of new technology or systems in regard to the business value
and avoid redundancy
7. Existing technology needs continues assessment against business requirements and
changes
8. Business process re-engineering where applicable
There are other success factors mentioned by the respondents in the free text question,
classified in the category of expert human resources and benchmark exercise.
The last section in the survey focused on the organizations that have implemented the
EA, it was found that 69% identified what is EA but did not implement it, 22% do not
know what is EA and only 9% implemented the EA.
It was interesting to find that 100% of the respondents from organizations, which
implemented EA, have an existing government regulation forcing the organization to
use the EA and its part of the IT governance. This regulation came from Abu Dhabi
Page 55 of 121
System and Information Center (ADSIC) the technology arm for Abu Dhabi
government (ADSIC 2011). The survey also showed the highest leading reasons for
starting EA program, which were prioritization business and IT budget, manage the IT
portfolio and manage the complexity.
Moreover, the survey results identified the legacy transformation, infrastructure renewal
and business-IT alignment were the issues for which EA planned to support
The EA found to be in the IT management organization as per 77% of the respondents
and its newly introduced, therefor 42% indicated that the organization is not aware of
the EA program.
Although the results of section five were not sophisticated and the number of
respondents were only seven, but this was expected as the EA concept in UAE
government newly introduced in the past few years.
4.2. Interview results
The interviews included sixteen participants from four government organizations in
Abu Dhabi the capital city of UAE, four of them were IT senior managers and the other
twelve were senior executives and decision makers. Each interview took about 20-30
minutes, not all of the interviewee participated by answering with questions in details,
as most of them have less free time, as a results most of the questions were answered in
short statements.
The interview objectives were to gather detailed information about the process of
initiating a business process automation projects in regard to the process of selecting the
technology and the business process nomination. Also, the interviews were planned to
understand any issues or concerns about the projects. The EA concept was introduced
and the interviewee were asked to provide their outlook of EA implementations at their
organizations.
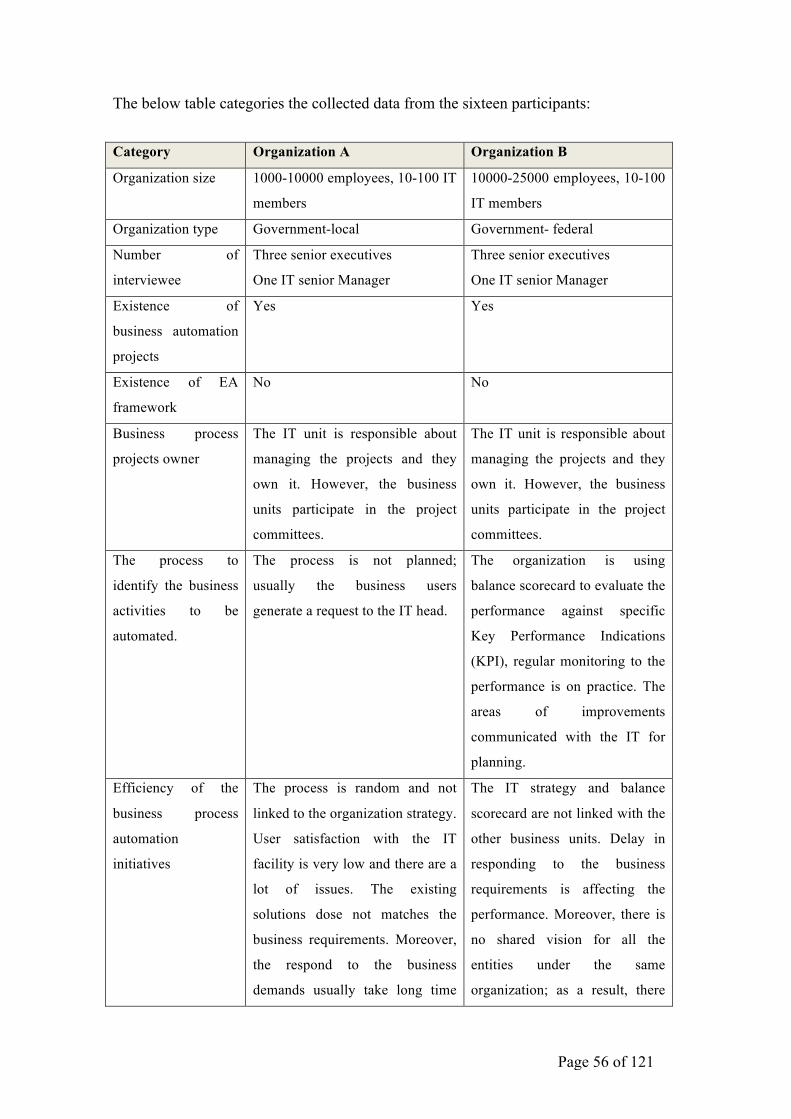
Page 56 of 121
The below table categories the collected data from the sixteen participants:
Category Organization A Organization B
Organization size 1000-10000 employees, 10-100 IT
members
10000-25000 employees, 10-100
IT members
Organization type Government-local Government- federal
Number of
interviewee
Three senior executives
One IT senior Manager
Three senior executives
One IT senior Manager
Existence of
business automation
projects
Yes Yes
Existence of EA
framework
No No
Business process
projects owner
The IT unit is responsible about
managing the projects and they
own it. However, the business
units participate in the project
committees.
The IT unit is responsible about
managing the projects and they
own it. However, the business
units participate in the project
committees.
The process to
identify the business
activities to be
automated.
The process is not planned;
usually the business users
generate a request to the IT head.
The organization is using
balance scorecard to evaluate the
performance against specific
Key Performance Indications
(KPI), regular monitoring to the
performance is on practice. The
areas of improvements
communicated with the IT for
planning.
Efficiency of the
business process
automation
initiatives
The process is random and not
linked to the organization strategy.
User satisfaction with the IT
facility is very low and there are a
lot of issues. The existing
solutions dose not matches the
business requirements. Moreover,
the respond to the business
demands usually take long time
The IT strategy and balance
scorecard are not linked with the
other business units. Delay in
responding to the business
requirements is affecting the
performance. Moreover, there is
no shared vision for all the
entities under the same
organization; as a result, there
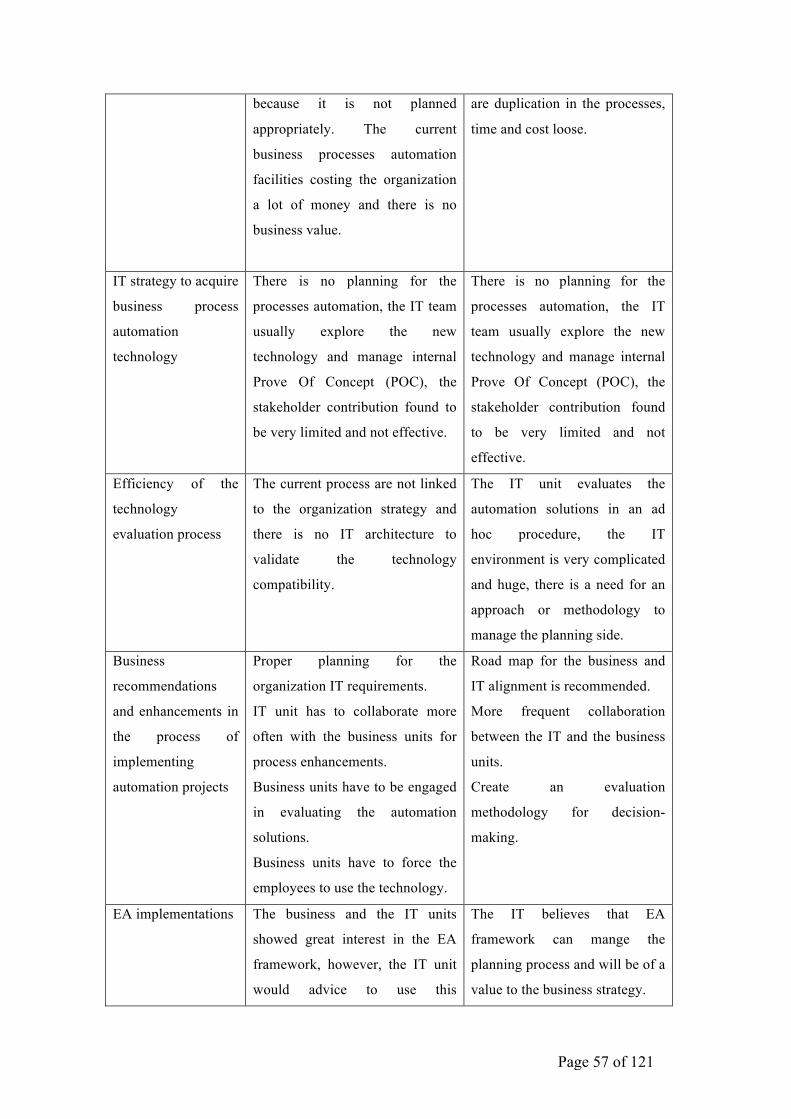
Page 57 of 121
because it is not planned
appropriately. The current
business processes automation
facilities costing the organization
a lot of money and there is no
business value.
are duplication in the processes,
time and cost loose.
IT strategy to acquire
business process
automation
technology
There is no planning for the
processes automation, the IT team
usually explore the new
technology and manage internal
Prove Of Concept (POC), the
stakeholder contribution found to
be very limited and not effective.
There is no planning for the
processes automation, the IT
team usually explore the new
technology and manage internal
Prove Of Concept (POC), the
stakeholder contribution found
to be very limited and not
effective.
Efficiency of the
technology
evaluation process
The current process are not linked
to the organization strategy and
there is no IT architecture to
validate the technology
compatibility.
The IT unit evaluates the
automation solutions in an ad
hoc procedure, the IT
environment is very complicated
and huge, there is a need for an
approach or methodology to
manage the planning side.
Business
recommendations
and enhancements in
the process of
implementing
automation projects
Proper planning for the
organization IT requirements.
IT unit has to collaborate more
often with the business units for
process enhancements.
Business units have to be engaged
in evaluating the automation
solutions.
Business units have to force the
employees to use the technology.
Road map for the business and
IT alignment is recommended.
More frequent collaboration
between the IT and the business
units.
Create an evaluation
methodology for decision-
making.
EA implementations The business and the IT units
showed great interest in the EA
framework, however, the IT unit
would advice to use this
The IT believes that EA
framework can mange the
planning process and will be of a
value to the business strategy.
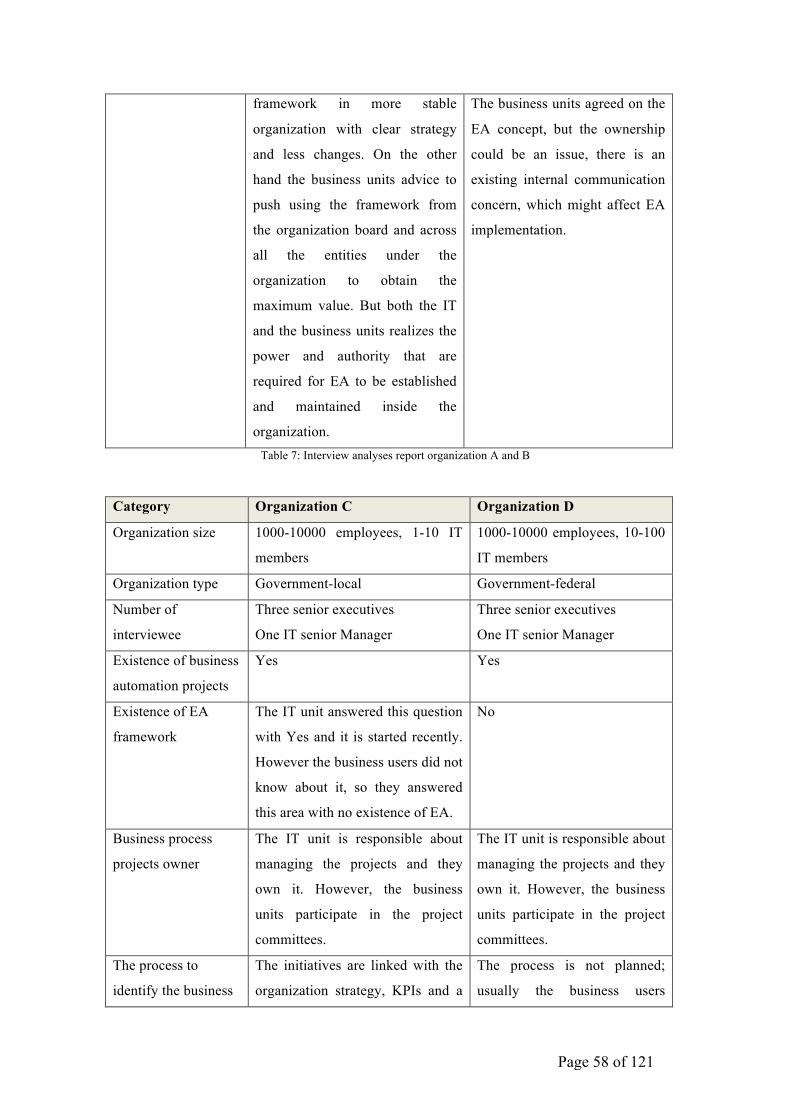
Page 58 of 121
framework in more stable
organization with clear strategy
and less changes. On the other
hand the business units advice to
push using the framework from
the organization board and across
all the entities under the
organization to obtain the
maximum value. But both the IT
and the business units realizes the
power and authority that are
required for EA to be established
and maintained inside the
organization.
The business units agreed on the
EA concept, but the ownership
could be an issue, there is an
existing internal communication
concern, which might affect EA
implementation.
Table 7: Interview analyses report organization A and B
Category Organization C Organization D
Organization size 1000-10000 employees, 1-10 IT
members
1000-10000 employees, 10-100
IT members
Organization type Government-local Government-federal
Number of
interviewee
Three senior executives
One IT senior Manager
Three senior executives
One IT senior Manager
Existence of business
automation projects
Yes Yes
Existence of EA
framework
The IT unit answered this question
with Yes and it is started recently.
However the business users did not
know about it, so they answered
this area with no existence of EA.
No
Business process
projects owner
The IT unit is responsible about
managing the projects and they
own it. However, the business
units participate in the project
committees.
The IT unit is responsible about
managing the projects and they
own it. However, the business
units participate in the project
committees.
The process to
identify the business
The initiatives are linked with the
organization strategy, KPIs and a
The process is not planned;
usually the business users
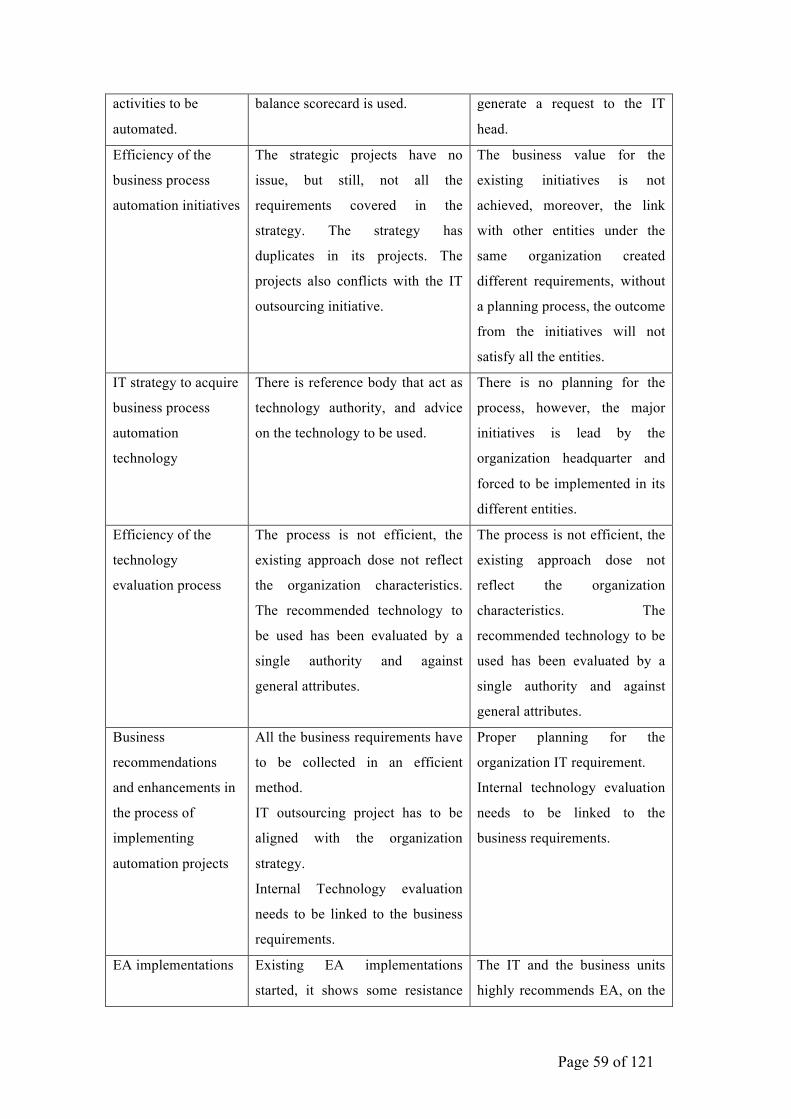
Page 59 of 121
activities to be
automated.
balance scorecard is used. generate a request to the IT
head.
Efficiency of the
business process
automation initiatives
The strategic projects have no
issue, but still, not all the
requirements covered in the
strategy. The strategy has
duplicates in its projects. The
projects also conflicts with the IT
outsourcing initiative.
The business value for the
existing initiatives is not
achieved, moreover, the link
with other entities under the
same organization created
different requirements, without
a planning process, the outcome
from the initiatives will not
satisfy all the entities.
IT strategy to acquire
business process
automation
technology
There is reference body that act as
technology authority, and advice
on the technology to be used.
There is no planning for the
process, however, the major
initiatives is lead by the
organization headquarter and
forced to be implemented in its
different entities.
Efficiency of the
technology
evaluation process
The process is not efficient, the
existing approach dose not reflect
the organization characteristics.
The recommended technology to
be used has been evaluated by a
single authority and against
general attributes.
The process is not efficient, the
existing approach dose not
reflect the organization
characteristics. The
recommended technology to be
used has been evaluated by a
single authority and against
general attributes.
Business
recommendations
and enhancements in
the process of
implementing
automation projects
All the business requirements have
to be collected in an efficient
method.
IT outsourcing project has to be
aligned with the organization
strategy.
Internal Technology evaluation
needs to be linked to the business
requirements.
Proper planning for the
organization IT requirement.
Internal technology evaluation
needs to be linked to the
business requirements.
EA implementations Existing EA implementations
started, it shows some resistance
The IT and the business units
highly recommends EA, on the
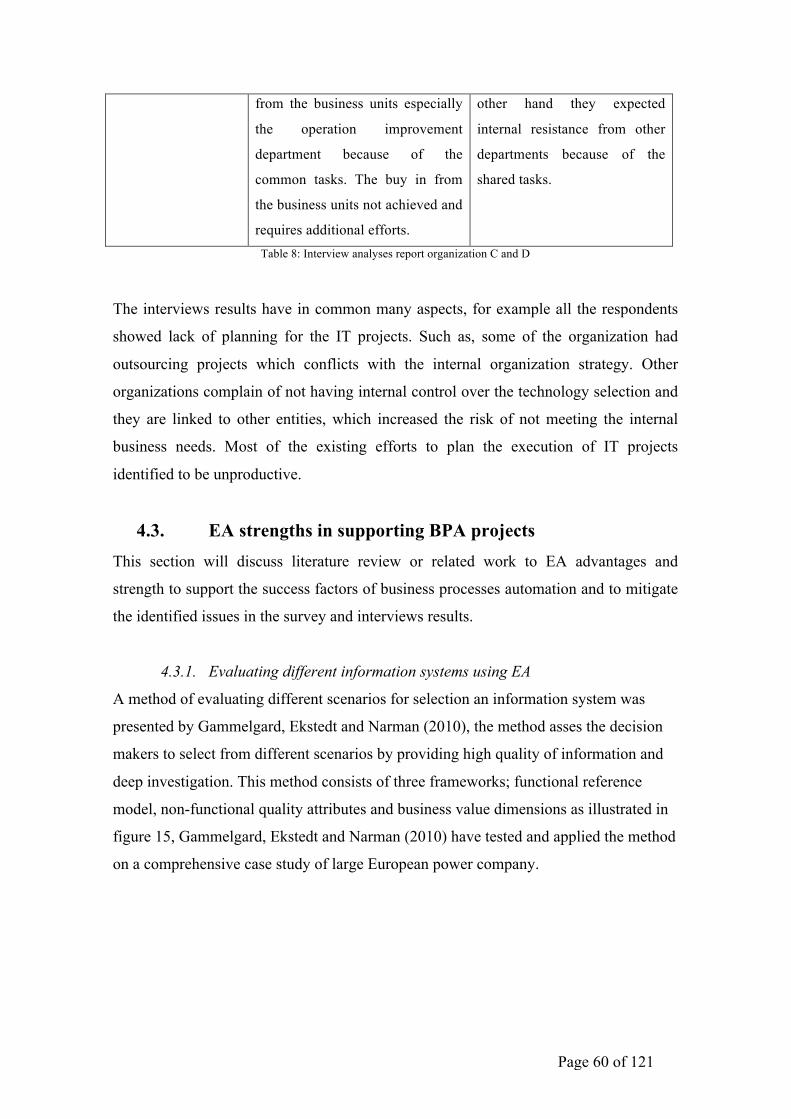
Page 60 of 121
from the business units especially
the operation improvement
department because of the
common tasks. The buy in from
the business units not achieved and
requires additional efforts.
other hand they expected
internal resistance from other
departments because of the
shared tasks.
Table 8: Interview analyses report organization C and D
The interviews results have in common many aspects, for example all the respondents
showed lack of planning for the IT projects. Such as, some of the organization had
outsourcing projects which conflicts with the internal organization strategy. Other
organizations complain of not having internal control over the technology selection and
they are linked to other entities, which increased the risk of not meeting the internal
business needs. Most of the existing efforts to plan the execution of IT projects
identified to be unproductive.
4.3. EA strengths in supporting BPA projects This section will discuss literature review or related work to EA advantages and
strength to support the success factors of business processes automation and to mitigate
the identified issues in the survey and interviews results.
4.3.1. Evaluating different information systems using EA
A method of evaluating different scenarios for selection an information system was
presented by Gammelgard, Ekstedt and Narman (2010), the method asses the decision
makers to select from different scenarios by providing high quality of information and
deep investigation. This method consists of three frameworks; functional reference
model, non-functional quality attributes and business value dimensions as illustrated in
figure 15, Gammelgard, Ekstedt and Narman (2010) have tested and applied the method
on a comprehensive case study of large European power company.
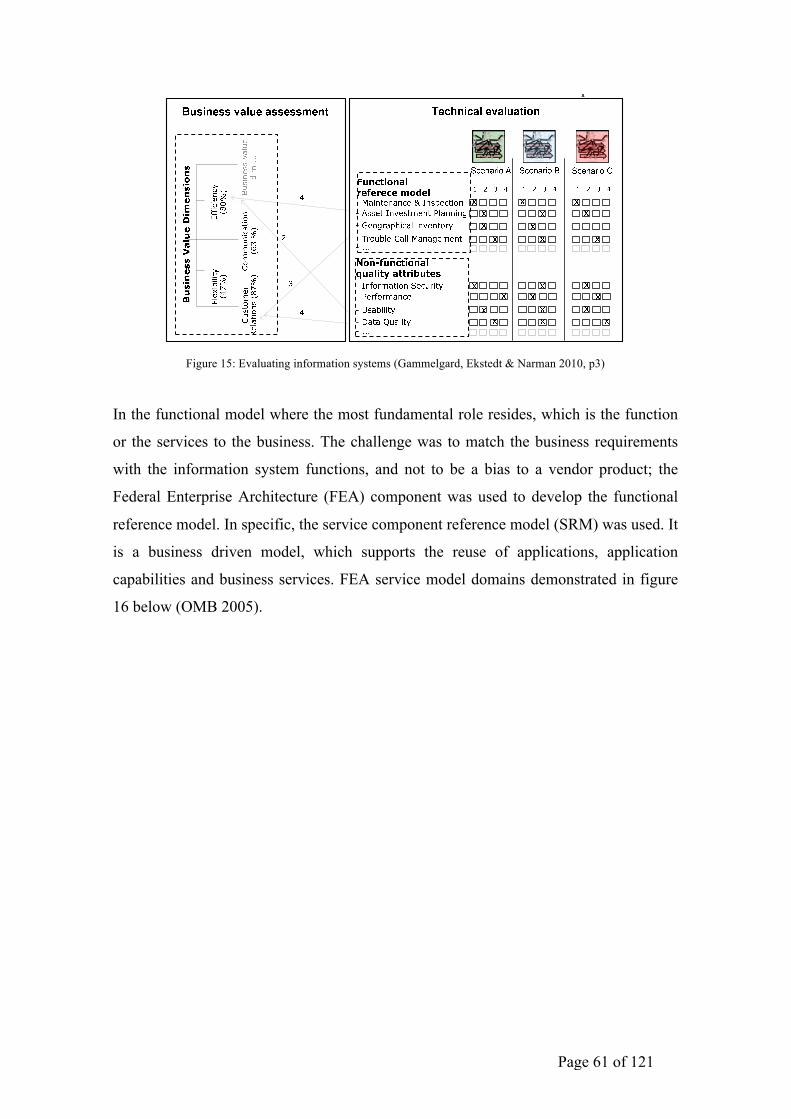
Page 61 of 121
Figure 15: Evaluating information systems (Gammelgard, Ekstedt & Narman 2010, p3)
In the functional model where the most fundamental role resides, which is the function
or the services to the business. The challenge was to match the business requirements
with the information system functions, and not to be a bias to a vendor product; the
Federal Enterprise Architecture (FEA) component was used to develop the functional
reference model. In specific, the service component reference model (SRM) was used. It
is a business driven model, which supports the reuse of applications, application
capabilities and business services. FEA service model domains demonstrated in figure
16 below (OMB 2005).
aspects that are evaluated in the scenarios, and secondly a general description is given on how these individual measurements are combined when calculating the numerical result.
2.1 The assessment frameworks The method features three frameworks with a number of evaluation questions, see Figure 2.
Figure 2: The main parts of the method. The three dotted boxes refers to the three framework described in the text below. The boxes with solid lines indicate the two main evaluations done in the method. The first framework consists of a reference model of dimensions of business value. These dimensions are qualitative in nature and exclude financial metrics. The second assessment framework consists of a reference model of all potential functionality that can be implemented in information systems for asset management. The third framework consists of metrics for evaluating non-functional properties of information systems.
2.2 Combination of measurements The three frameworks are connected to give a total estimate of business value. The technical side of the method yield evaluations of the functional and non-functional properties of information system scenarios. Data is collected by interviews with system experts and system users. These answers are aggregated into an individual estimate for each function of the functional reference model. At the business side, the business value impact of the functional and non-functional system properties is estimated by having system users identifying which technical properties that affect which business value dimensions. Finally, business executives prioritize the business dimensions according to their business importance. A total index for the business value is then calculated. The method requires information from multiple sources. Low quality information will inevitably lead to low quality decision support and there is therefore a need for the decision maker to be able to judge the quality of the evaluation. Essentially there are two different sources of low quality information. Firstly the input; the answers may be incorrect. Consequently, the certainty of input data needs to be estimated. Secondly, in order to have a completely correct result, the amount of information needed is immense and economically impossible to gather. Thus, input data will be incomplete. The method needs to be able to state something about how this incompleteness affects the certainty of the final result. The method uses statistical mathematics taken from the Dempster-Shafer theory to make the uncertainty of results explicit (Yang and Xu 2002a) (Yang and Xu 2002b) (Dempster 1968) (Shafer 1976).
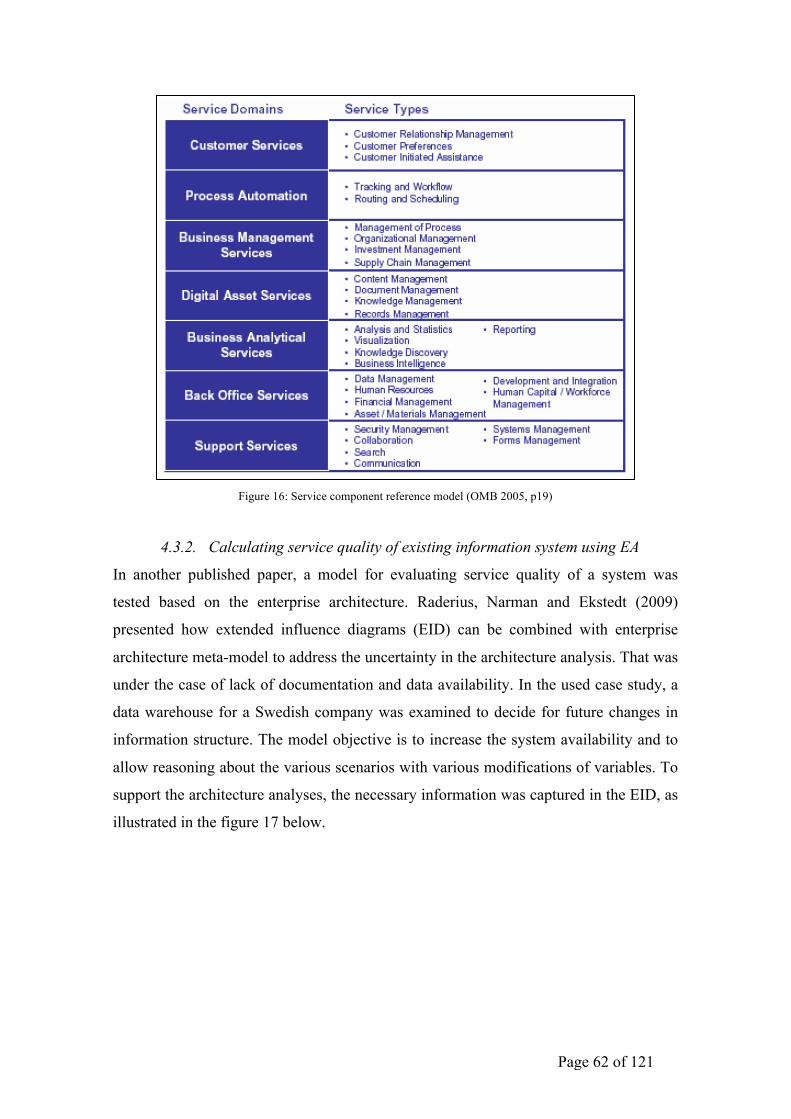
Page 62 of 121
Figure 16: Service component reference model (OMB 2005, p19)
4.3.2. Calculating service quality of existing information system using EA
In another published paper, a model for evaluating service quality of a system was
tested based on the enterprise architecture. Raderius, Narman and Ekstedt (2009)
presented how extended influence diagrams (EID) can be combined with enterprise
architecture meta-model to address the uncertainty in the architecture analysis. That was
under the case of lack of documentation and data availability. In the used case study, a
data warehouse for a Swedish company was examined to decide for future changes in
information structure. The model objective is to increase the system availability and to
allow reasoning about the various scenarios with various modifications of variables. To
support the architecture analyses, the necessary information was captured in the EID, as
illustrated in the figure 17 below.
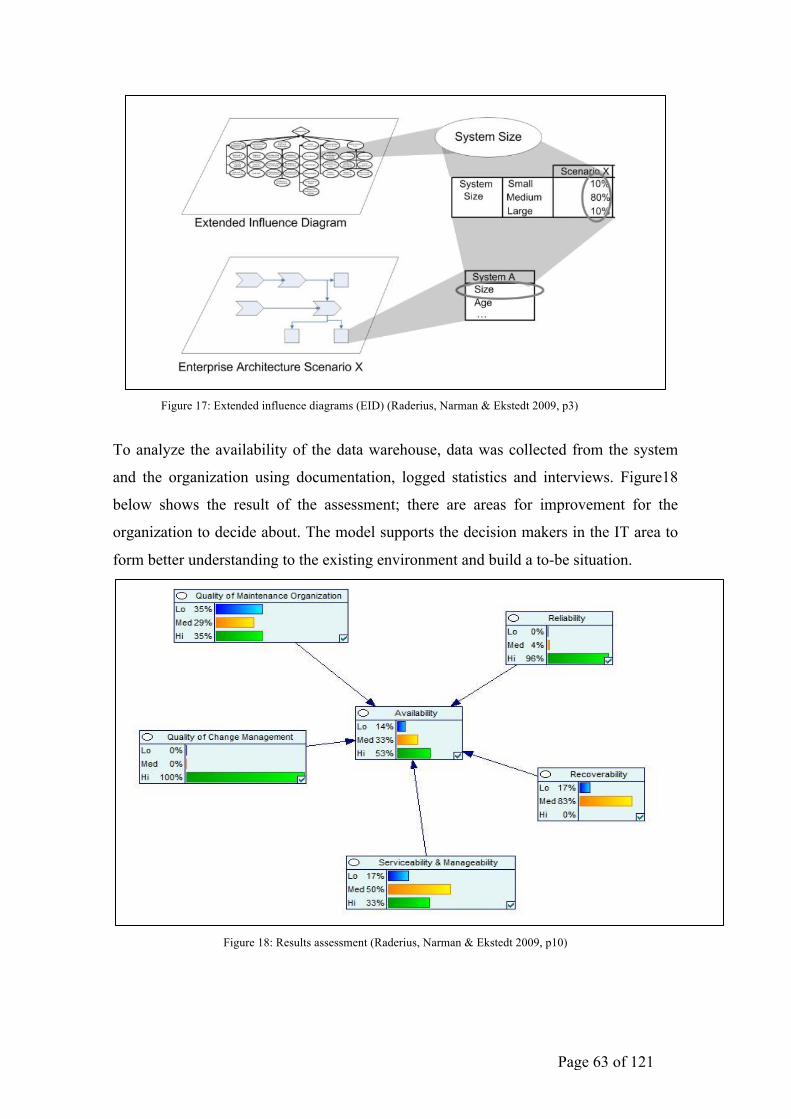
Page 63 of 121
Figure 17: Extended influence diagrams (EID) (Raderius, Narman & Ekstedt 2009, p3)
To analyze the availability of the data warehouse, data was collected from the system
and the organization using documentation, logged statistics and interviews. Figure18
below shows the result of the assessment; there are areas for improvement for the
organization to decide about. The model supports the decision makers in the IT area to
form better understanding to the existing environment and build a to-be situation.
Figure 18: Results assessment (Raderius, Narman & Ekstedt 2009, p10)
!"#"$%&'()*"+,"-./0(1.".0&'%&)(+2",/&3.4+/5"
!"#$% &"'()*+%,#--% (+*$*.)% )"*% $/*-*)0.% 01% '% 1+'2*,0+/%,"#&"% &'.% 3*% 4$*5% )0% &+*')*%205*-$%)"')%,#--%'.$,*+%'%6*+7%$(*#&%$*)%01%84*$)#0.$%'304)%)"*%84'-#)7%01%$*+6#&*%01%*.)*+(+#$*% #.10+2')#0.% $7$)*2$9% !"*% '((+0'&"% 4)#-#:*$% '% 205*-;3'$*5% '((+0'&"% )0%'&"#*6*% '% -*6*-% 01% '3$)+'&)#0.% $411#&#*.)% )0% (*+10+2% '.'-7$*$% &0.&*+.#.<% $7$)*2%84'-#)#*$% $4&"% '$% )"*% 14.&)#0.'-#)7=% '6'#-'3#-#)7=% 4$'3#-#)7=% (*+10+2'.&*=% $*&4+#)7% '.5%#.)*+0(*+'3#-#)79%%%
%6(7%/." 89" :+" ;%<<+/)" &/1=().1)%/." &2&'*;(;>" )=." &/1=().1)%/." 3+?.';" 3%;)"
1+2)&(2" (2,+/3&)(+2" ;<.1(,(.?"@*" )=." &2&'*;(;" ,/&3.4+/5>" =./." 1&<)%/.?" (2" )=.",+/3"+,"&2".A).2?.?"(2,'%.21."?(&7/&3B"
>05*-$% '+*% &+*')*5% ,#)"% '% $(*#&% <0'-% #.% 2#.5=% $4&"% '$% #.&+*'$*5% $7$)*2%'6'#-'3#-#)7=% '.5% '--0,% +*'$0.#.<% '304)% )"*% &0.$*84*.&*$% 01% 6'+#04$% $&*.'+#0$% ,#)"%6'+#04$% 205#1#&')#0.$% 01% 6'+#'3-*$9% !0% <4'+'.)**% )"')% )"*% 205*-$% $4((0+)% $7$)*2%84'-#)7% '.'-7$*$=% )"*% 4.5*+-7#.<% 2*)'205*-% 24$)% &0.)'#.% ')% -*'$)% )"*% #.10+2')#0.%+*84#+*5%37%)"*%'.'-7$#$%1+'2*,0+/$%10+%)"*%+*$(*&)#6*%$7$)*2%84'-#)#*$9%?0+%*@'2(-*=%#1% )"*% <0'-% #$% )0% '.'-7:*% $7$)*2% 2'#.)'#.'3#-#)7% )"*% '.'-7$#$% 1+'2*,0+/% 2#<")%(0$)4-')*%)"')%)"*%'.'-7$)%24$)%5*)*+2#.*%)"*%$#:*%01%)"*%$7$)*29%A1%)"*%'.'-7$)%4$*$%'%205*-;�������������� ������ �� ���� ���������������� �� � ������������������������������?#<4+*%B9%C#.&*%)"*%&0.)*.)%01%)"*%'+&"#)*&)4+*%205*-%#$%5*)*+2#.*5%37%)"*#+%4.5*+-7#.<% 2*)'205*-=% )"*% �������% 2*)'205*-% 24$)% 3*% &-0$*-7% &04(-*5% ,#)"% )"*%'.'-7$#$%1+'2*,0+/$9%%
In order to break down system characteristics into concrete and measurable questions suitable for analysis, we capture the characteristics using Extended Influence Diagrams (EID). These are graphic representations of decision problems and can be used to formally specify enterprise architecture analyses [4][7]. EIDs are an extension of influence diagrams, [18] [19] and feature the probabilistic inference engine taken from Bayesian networks [5][20], with which it is possible to reason about causal relations between different nodes through the means of Conditional Probability Tables.
Nodes of EIDs could in this context ������� ������������� �������������������� % ���������������, and capture% ���������� ��� ��� ����� ������� ���� ��� ������% system
!"#$%&'()*'$
!"#$%&' (' )*+,)' -*&' %&)$.-)' /+%' -*&' 010".02"."-3' 0))&))4&5-' +/' -*&' 60-0' ,0%&*+$)"5#')+.$-"+57'8-')*+$.6'2&'"5-&%9%&-&6'0)'-*&'9%+202"."-"&)'-*0-'010".02"."-3'%&0:*&)'0':&%-0"5')-0-&7' 85' -*")' :0)&;' "-' ")' *"#*' ,"-*' <=>;' 4&6"$4' ,"-*' ==>' 056' .+,' ,"-*' ?@>'9%+202"."-37'A)' -*&' "5-&%#%+$9',&"#*-)' +/' -*&' 6"//&%&5-' "5/.$&5:&)' /+%' -*")' 90%-":$.0%')3)-&4' 0%&' 5+-' B5+,5;' ,&"#*-&6' )049."5#' 6")-%"2$-"+5' ")' $)&6' -+' 6")-%"2$-&' -*&'9%+9+%-"+50."-3'+/'-*&'"5/.$&5:&)'"5'-*&'C&D8&'4+6&.'&1&5.37'
'+,-(.&$/"$012,)23,),*4$.&'()*'$
/"$$052)4','$
A::+%6"5#'-+'-*&'%&)$.-)'6")9.03&6'"5'!"#$%&'(;'+5&':05')03',"-*'<=>':&%-0"5-3'-*0-'-*&'010".02"."-3' +/' -*&' :0)&' )-$63' )3)-&4' ")' *"#*7' E"#*' "5' -*")' :+5-&F-' -%05).0-&)' -+' -*&'GG7HIGG7G>'$9-"4&' 5&:&))0%3' -+' $9*+.6' -*&' +%#05"J0-"+5)K' &)-02.")*&6' )&%1":&' .&1&.'0#%&&4&5-)' ,"-*' :$)-+4&%)7' L*$);' -*")' M$0."-3' 0--%"2$-&' :+$.6' :&%-0"5.3' $)&' )+4&'"49%+1&4&5-7'L*&' 010".02"."-3' :0$)0."-"&)' /+$56' "5' -*&'N8O' /+%' 010".02"."-3' P!"#$%&'QR' )-0-&' -*0-'
-*&'M$0."-3'+/'-*&'40"5-&505:&'+%#05"J0-"+5;'-*&'S&:+1&%02"."-3'056'-*&'T&%1":&02"."-3'U'V050#&02"."-3'+/'-*&')3)-&4'0%&'40"5'"5/.$&5:&)'056'-*&'C&D8&'4+6&.')-0-&)'-*0-'-*&3'0%&'=<>;'?W>'056'?W>'.+,'%&)9&:-"1&.37'85'-*&':0)&'+/'-*&'40"5-&505:&'+%#05"J0-"+5'+5&':05'-&..'/%+4'-*&'C&D8&'4+6&.'-*0-'
-*&'.+,')-0-&)'+%"#"50-&'"5'-*&'.0:B'+/'0'2$)"5&))'%&M$"%&4&5-)')9&:"/":0-"+5'056':.0%"-3'+/'-*&':+%%&.0-"+5'2&-,&&5'2$)"5&))'%&M$"%&4&5-)'056')3)-&4'/$5:-"+50.'%&M$"%&4&5-)7'E&5:&;'0':.&0%'."5B'2&-,&&5'2$)"5&))':+5:&%5)'056'8L')*+$.6'"49%+1&'010".02"."-37''L*&'%&:+1&%02"."-3'")'05+-*&%')+$%:&'+/':+5:&%5;'40"5.3'2&:0$)&'+/'0'.+,'M$0."-3'+/'
-*&'/0$.-'9%&6":-"+5'056'01+"605:&')3)-&47'L*")'"5'-$%5'")':0$)&6'23'0'1&%3'."4"-&6')&-'+/'/0$.-'*056."5#'.+#":'"49.&4&5-&67'T$##&)-"+5)' /+%' "49%+1&4&5-' "5:.$6&' 6&1&.+9"5#' 0' 4+5"-+%"5#' 056' 4&))0#&'
*056."5#' 099.":0-"+5' -+' 2&' 02.&' -+' %&)9+56' -+' "5:"6&5-)' 4+%&' &//&:-"1&.3' 056'
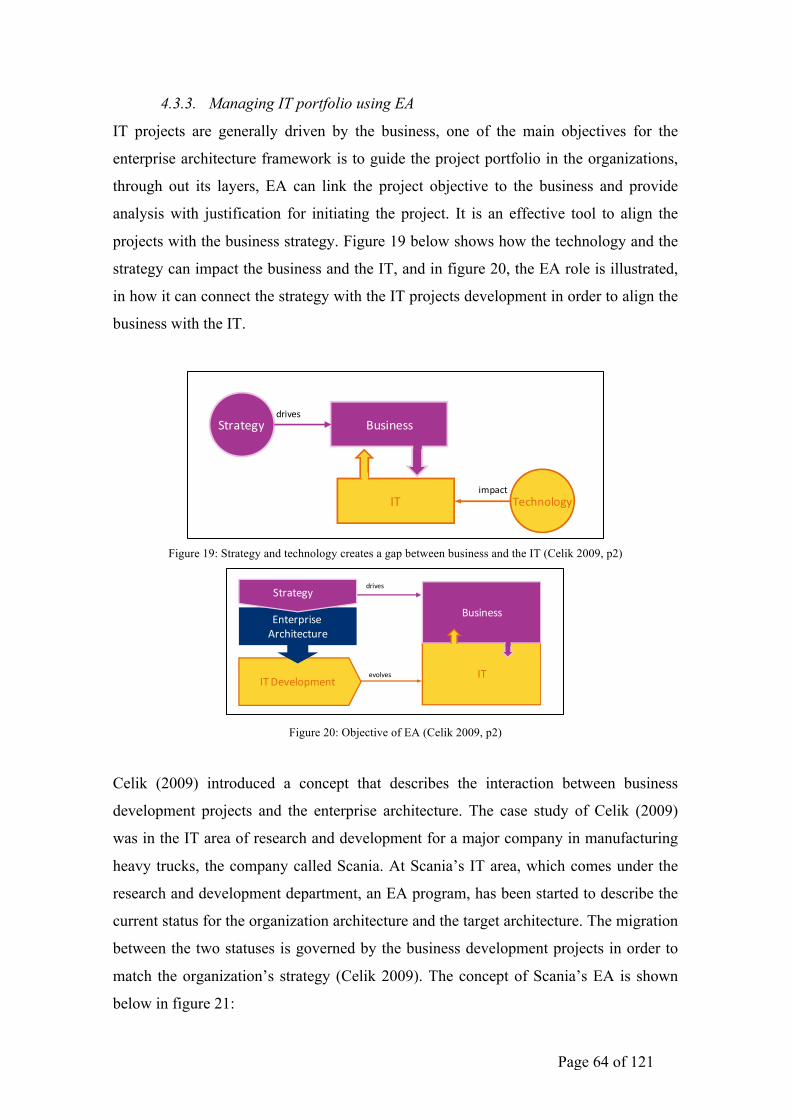
Page 64 of 121
4.3.3. Managing IT portfolio using EA
IT projects are generally driven by the business, one of the main objectives for the
enterprise architecture framework is to guide the project portfolio in the organizations,
through out its layers, EA can link the project objective to the business and provide
analysis with justification for initiating the project. It is an effective tool to align the
projects with the business strategy. Figure 19 below shows how the technology and the
strategy can impact the business and the IT, and in figure 20, the EA role is illustrated,
in how it can connect the strategy with the IT projects development in order to align the
business with the IT.
Figure 19: Strategy and technology creates a gap between business and the IT (Celik 2009, p2)
Figure 20: Objective of EA (Celik 2009, p2)
Celik (2009) introduced a concept that describes the interaction between business
development projects and the enterprise architecture. The case study of Celik (2009)
was in the IT area of research and development for a major company in manufacturing
heavy trucks, the company called Scania. At Scania’s IT area, which comes under the
research and development department, an EA program, has been started to describe the
current status for the organization architecture and the target architecture. The migration
between the two statuses is governed by the business development projects in order to
match the organization’s strategy (Celik 2009). The concept of Scania’s EA is shown
below in figure 21:
Master Thesis 2009-05-05 Dept. of Industrial Information and Control Systems
KTH, Royal Institute of Technology, Stockholm, Sweden
user need, but placed in a context with other systems, the complex IT landscape creates room for sub-optimizations. Consequently, IT environment fails to interact optimally with existing business operations and its compliance with company-wide business objectives is often unsatisfactorily. The rise of complexity in IT landscape is partly a result of insufficient alignment between business operations and IT. The gap between business and IT can be traced to different viewpoints IT and business represents (see Figure 1-2). Business operations are primarily strategy driven while IT development is mainly technology driven. Incoherency between these drivers result in that the development and acquisition of new hardware and software systems is not anchored with corporate objectives. These issues have not yet been resolved in many organizations due to enterprises failure to implement a mechanism that “bridges the gap” between the business and IT, which ensures that IT development is aligned with corporate goals and objectives. [2]
!"#$%&##'()*(&+,
-&./%010+,2-
3)$4&#
$56*.(
Figure 1-2. Different drivers creates a gap between business and IT
1.2 Foundation for Enterprise Architecture Enterprise architecture (EA) can be considered as an instrument to achieve compliance between IT environment and business operations and eliminate the gap seen in Figure 1-2 [3]. The main purpose of enterprise architecture is to understand how different information systems and other organizational components work together in order to steer evolution of IT landscape that optimally supports business and reflects company’s strategic objectives (see Figure 1-3) [4]. Consequently, the enterprise architecture will serve as a mechanism that reduces the IT complexity described in previous section.
2-�7&4&1065&%(
8%(&)6)$#&�9)./$(&.(")&
2-
!"#$%&##
'()*(&+,3)$4&#
&4014&#
Figure 1-3. One of objectives of enterprise architecture
Faris Celik
- 2 -
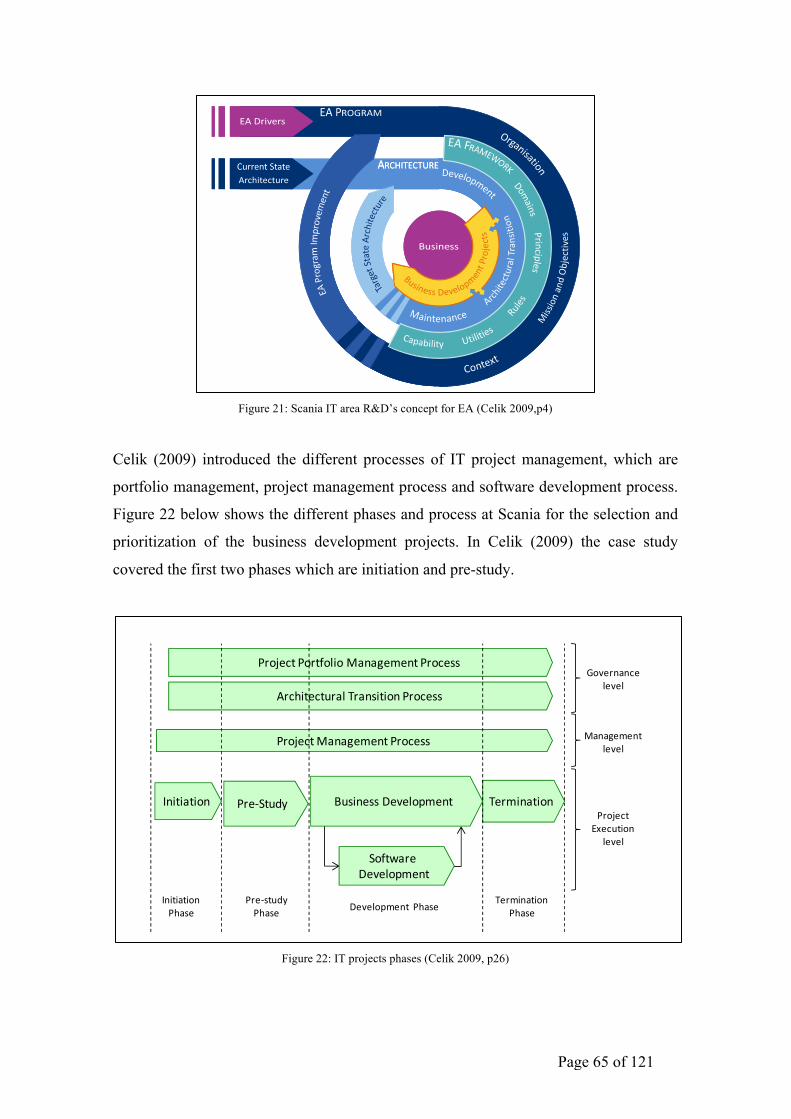
Page 65 of 121
Figure 21: Scania IT area R&D’s concept for EA (Celik 2009,p4)
Celik (2009) introduced the different processes of IT project management, which are
portfolio management, project management process and software development process.
Figure 22 below shows the different phases and process at Scania for the selection and
prioritization of the business development projects. In Celik (2009) the case study
covered the first two phases which are initiation and pre-study.
Figure 22: IT projects phases (Celik 2009, p26)
Master Thesis 2009-05-05 Dept. of Industrial Information and Control Systems
KTH, Royal Institute of Technology, Stockholm, Sweden
1.3.2 Enterprise Architecture at Scania R&D IT Area Scania R&D IT Area has developed a concept for enterprise architecture that is illustrated in Figure 1-5. The EA Concept encompasses aspects of EA Program such as business objectives and organizational structure. EA Program is supported by an EA Framework that represents architectural domains, principles, rules, capabilities and utilities. EA Framework provides the base for describing current state architecture, target state architecture and the architectural transition which portrays the path to migrate from organization’s current to target state. Migration from current to target state is achieved through governing business development projects so that they match with the organization's strategic directions and provide desired support to the business.
Figure 1-5. Scania IT Area R&D’s Concept for Enterprise Architecture [7]
1.4 Thesis Scope Focus of this master thesis is to describe the interaction between the architectural transition and the business development projects (see Figure 1-6). The architectural transition process is the area of IT governance mechanism which ensures that IT projects are operating towards the target state architecture and are aligned with companywide strategy. In addition to its governance role, architectural transition should also provide support and guidance for business development projects.
Faris Celik
- 4 -
Master Thesis 2009-05-05 Dept. of Industrial Information and Control Systems
KTH, Royal Institute of Technology, Stockholm, Sweden
At first glance it may look as RUP resembles SDLC, but the distinctions are at several. Firstly, RUP-phases can (in contrast to SDLC) be conducted in cycle of several iterations. Secondly, Rational Unified Process utilizes the object-oriented approach which supports usage of models to describe business requirements that are essential for system development. [2] Benefits gained from RUP methodology are that models describe business environment in an adequate way which all stakeholders can interpret. Consequently, the models also provide a great basis for documentation of developed software. At the same time, the object-oriented approach can also be a disadvantage because it is too large block to embrace. As a result, the learning and maturity process of implementing and operating along RUP guidelines is time demanding. [17]
3.3.4 Business Development Process at IT Area R&D
Business development projects at Scania IT Area R&D are governed, managed and executed with support of different project models of the company. Depending on the field of work and responsibility, project models correspond to governance, management or execution level. This is illustrated in Figure 3-16. Governance level represents a portfolio management process which is responsible for prioritization, strategic compliance and the coordination of the project throughout its lifecycle. Its objectives, tasks and responsibilities reflect the theoretical point of view described in sub-section 3.3.1. Portfolio Management Process. At governance level, architectural transition process is to be established. Purpose of architectural transition process is to govern and support the business development project from architectural perspective.
!"#$%&'(%)&
*#+,%("+(-#'.�!#'&/%(%)&�0#)+"//
1)2(3'#"�4"5".)6$"&(
0#)7"+(�8'&'9"$"&(�0#)+"//
0#)7"+(�0)#(2).%)�8'&'9"$"&(�0#)+"//
:&%(%'(%)& 0#"�1(-;< =-/%&"//�4"5".)6$"&(
>)5"#&'&+"�."5".
8'&'9"$"&(�."5".
0#)7"+(?@"+-(%)&�
."5".
:&%(%'(%)&0,'/"
0#"�/(-;<0,'/"
4"5".)6$"&(��0,'/"!"#$%&'(%)&
0,'/"
Figure 3-16. Processes and phases in a Business Development Project
The objectives of the business process of project management correspond to theory description in sub-section 3.3.2. Project Management Process. Its main focus
Faris Celik
- 26 -
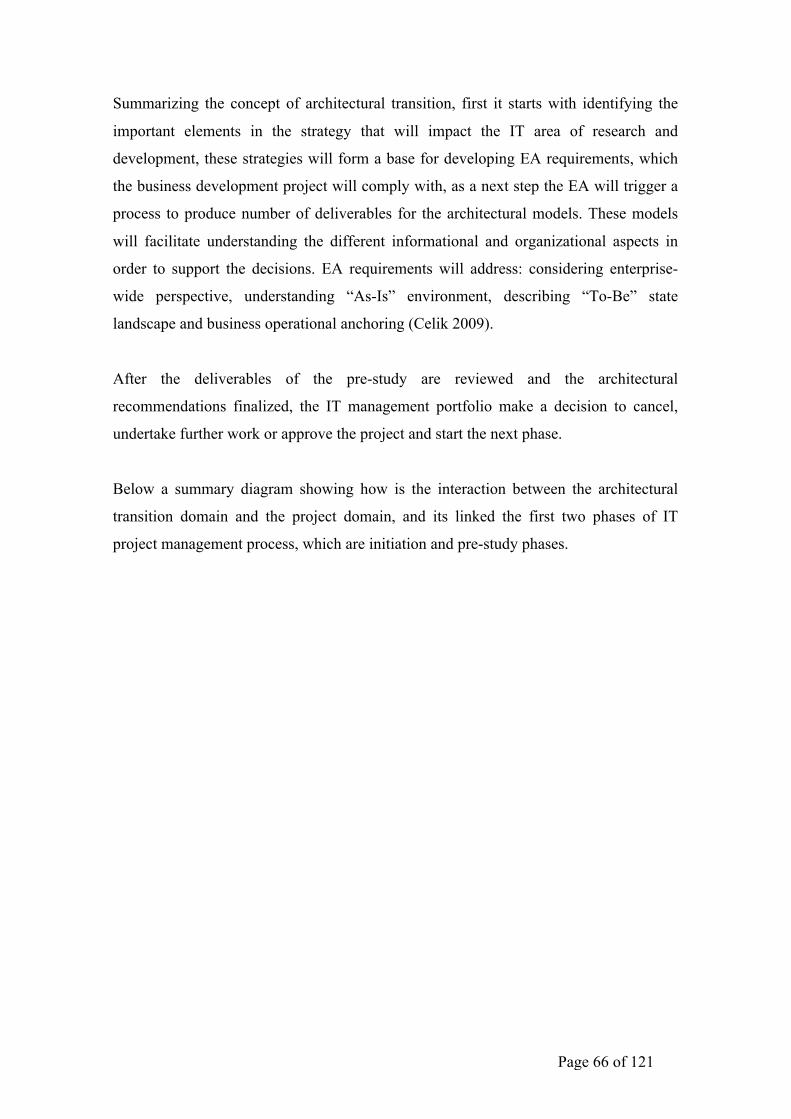
Page 66 of 121
Summarizing the concept of architectural transition, first it starts with identifying the
important elements in the strategy that will impact the IT area of research and
development, these strategies will form a base for developing EA requirements, which
the business development project will comply with, as a next step the EA will trigger a
process to produce number of deliverables for the architectural models. These models
will facilitate understanding the different informational and organizational aspects in
order to support the decisions. EA requirements will address: considering enterprise-
wide perspective, understanding “As-Is” environment, describing “To-Be” state
landscape and business operational anchoring (Celik 2009).
After the deliverables of the pre-study are reviewed and the architectural
recommendations finalized, the IT management portfolio make a decision to cancel,
undertake further work or approve the project and start the next phase.
Below a summary diagram showing how is the interaction between the architectural
transition domain and the project domain, and its linked the first two phases of IT
project management process, which are initiation and pre-study phases.
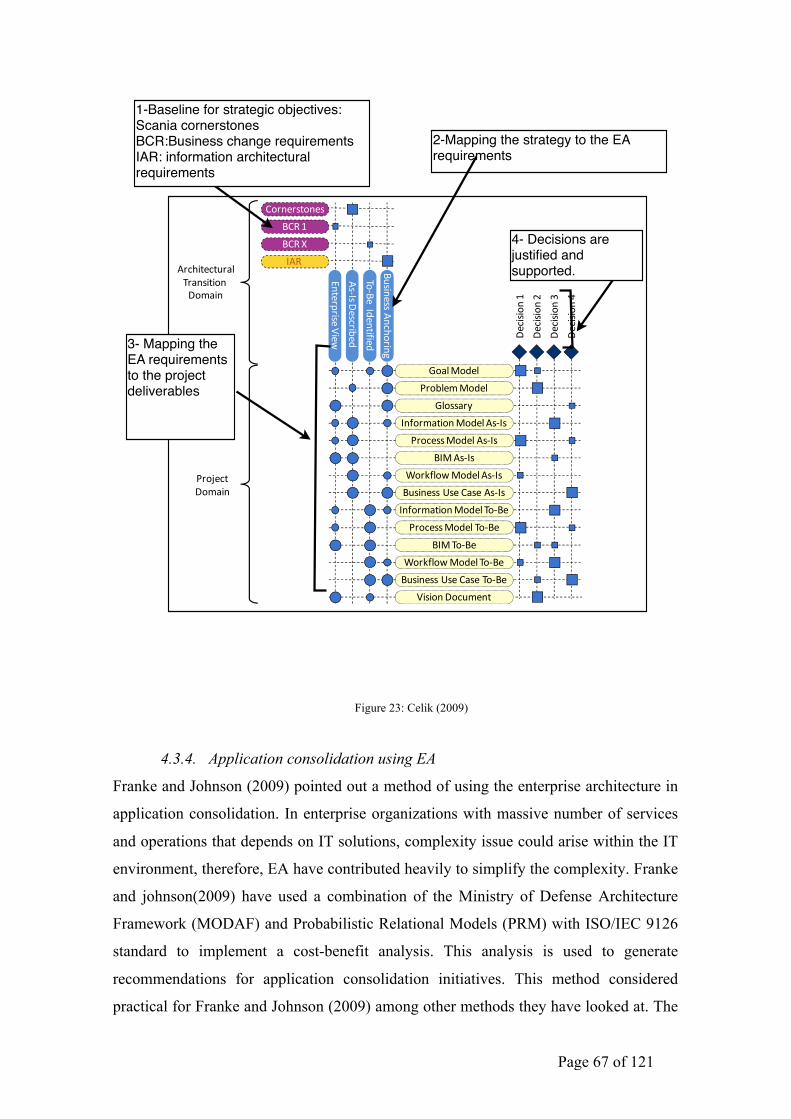
Page 67 of 121
Figure 23: Celik (2009)
4.3.4. Application consolidation using EA
Franke and Johnson (2009) pointed out a method of using the enterprise architecture in
application consolidation. In enterprise organizations with massive number of services
and operations that depends on IT solutions, complexity issue could arise within the IT
environment, therefore, EA have contributed heavily to simplify the complexity. Franke
and johnson(2009) have used a combination of the Ministry of Defense Architecture
Framework (MODAF) and Probabilistic Relational Models (PRM) with ISO/IEC 9126
standard to implement a cost-benefit analysis. This analysis is used to generate
recommendations for application consolidation initiatives. This method considered
practical for Franke and Johnson (2009) among other methods they have looked at. The
Master Thesis 2009-05-05 Dept. of Industrial Information and Control Systems
KTH, Royal Institute of Technology, Stockholm, Sweden
!"#�
$%#�&
$%#�'
%()*+),-(*+,
.*-+)/)0,+�10+2
",�!,�3
+,4)05+6�
7(�$+��!6+*-080+6
$9,0*+,,�"*4:()0*;
<(=>�?(6+>
@)(5>+A�?(6+>
<>(,,=)B
!*8()A=-0(*�?(6+>�",�!,
@)(4+,,�?(6+>�",�!,
$!?�",�!,
C()D8>(2�?(6+>�",�!,
$9,0*+,,�E,+�%=,+�",�!,
!*8()A=-0(*�?(6+>�7(�$+
@)(4+,,�?(6+>�7(�$+
$!?�7(�$+
C()D8>(2�?(6+>�7(�$+
$9,0*+,,�E,+�%=,+�7(�$+
10,0(*�3(49A+*-
3+40,0(*�'
3+40,0(*�F
3+40,0(*�G
3+40,0(*�H
")4:0-+4-9)=>7)=*,0-0(*3(A=0*
@)(I+4-3(A=0*
Figure 5-14. Mapping of strategy-decision making path
Faris Celik
- 44 -
2-Mapping the strategy to the EA requirements
3- Mapping the EA requirements to the project deliverables
4- Decisions are justified and supported.
1-Baseline for strategic objectives: Scania cornerstonesBCR:Business change requirementsIAR: information architectural requirements
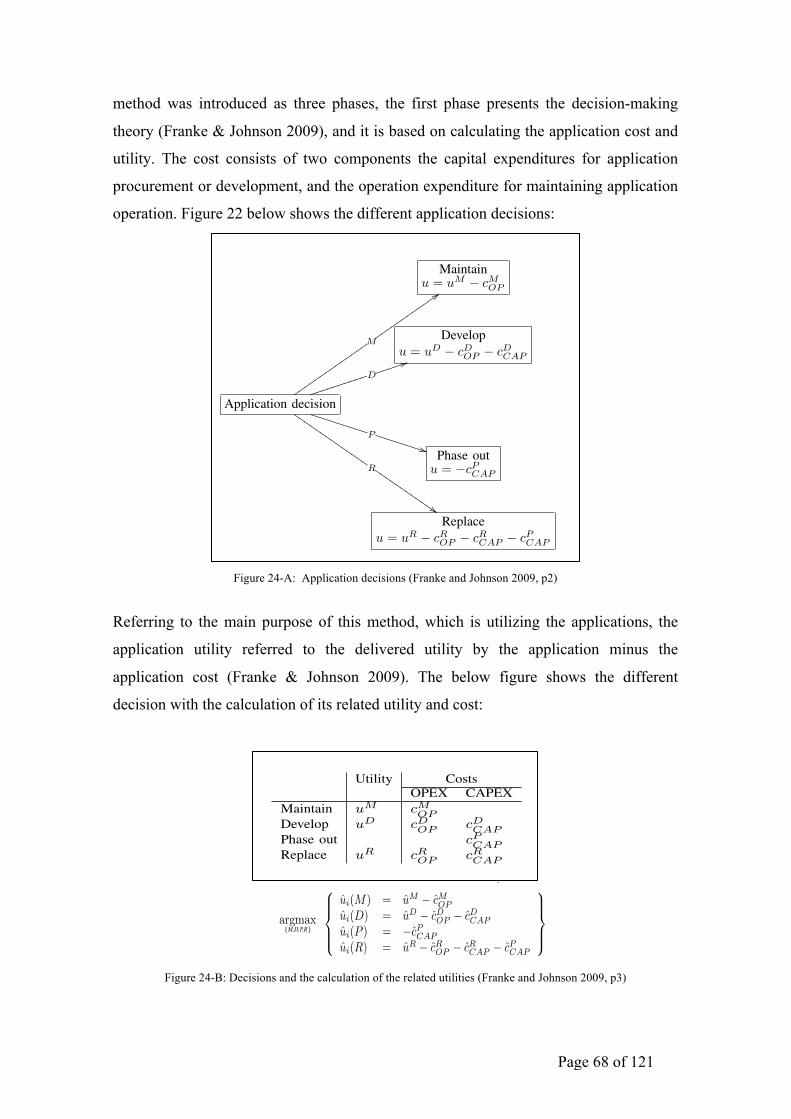
Page 68 of 121
method was introduced as three phases, the first phase presents the decision-making
theory (Franke & Johnson 2009), and it is based on calculating the application cost and
utility. The cost consists of two components the capital expenditures for application
procurement or development, and the operation expenditure for maintaining application
operation. Figure 22 below shows the different application decisions:
Figure 24-A: Application decisions (Franke and Johnson 2009, p2)
Referring to the main purpose of this method, which is utilizing the applications, the
application utility referred to the delivered utility by the application minus the
application cost (Franke & Johnson 2009). The below figure shows the different
decision with the calculation of its related utility and cost:
Figure 24-B: Decisions and the calculation of the related utilities (Franke and Johnson 2009, p3)
is presented that predicts the impact of application consol-idation on transaction response times, accurate to withina few percent. Similarly, [7] presents a framework forperformance evaluation in the area of server consolidation.However, while very detailed, such frameworks are alsolimited. Typically, these simulations address single systemqualities (such as performance) and achieve accuracy inthese at the cost of generality; leaving other system qualities(such as availability, security etc.) out. Also, the notion ofmonetary cost is usually underdeveloped.
Articles with an economics or accounting perspectivenaturally address the notion of cost in-depth. For example,[8] asks whether consolidation of back-office operations inbanks really reduces operating costs. A thorough model isbuilt, based on 1979-1996 data from the US Federal Re-serve’s consolidation of its Fedwire electronic funds transfersystem. However, such studies are not very applicable for thedecision-maker embarking on a consolidation project.
[9] looks at enterprise IT costs from an accounting per-spective, and gives good examples of tracking and break-down of costs. These insights are valuable and are put to usein the present article. However, [9] has too much cost focusand treats the benefits provided by the IT too shallowly.
The present contribution aims to find a suitable balancebetween the technical and the cost perspectives as found inthe literature, employing Enterprise Architecture methods.
III. A GENERAL MODEL OF APPLICATIONCONSOLIDATION DECISION-MAKING
Today, most enterprises and business processes are sup-ported by information systems. Most often, these informa-tion systems are interconnected into complex applicationlandscapes, where it is not obvious which applicationssupport which business processes, nor whether there isredundancy among the systems or the information theyprocess. Application consolidation is an optimization of theapplication landscape, primarily by removing unnecessaryapplications. Some consolidation benefits commonly citedare (i) lower total cost of ownership, (ii) improved servicelevels and availability, and (iii) reduced business risks [7].
A decision maker managing an application consolidationproject wants to save money, but still keep the benefitsdelivered by the applications on the same, or possible evenon a higher, level. How should this problem be modeled?Using the framework of decision theory [10], it is possibleto express it in terms of a cost-benefit analysis. Each applica-tion in the enterprise must then be identified with a cost anda utility. Some costs and utilities of applications are easy tofind, such as the income from services sold to customers, orthe license and electricity costs. Others are less easy to defineand measure, such as the usability of an application or thecustomer satisfaction generated by high-availability services.Nevertheless, to make as rational decisions as possible, thesecosts and utilities should, preferably, all be weighed together.
Maintainu = uM � cM
OP
Developu = uD � cD
OP � cDCAP
Application decision
Muuuuuuuuuuuuuu
::uuuuuuuuuuuu
Djjjjjjjjjj
44jjjjj
PUUUUUUUUU
**UUUUUUUU
RIIIIIIIIIIIIII
$$IIIIIIIIIIIIPhase out
u = �cPCAP
Replaceu = uR � cR
OP � cRCAP � cP
CAP
Figure 1. Application consolidation decision-making.
First, consider the costs. Costs are often divided into twoparts: (i) capital expenditures (CAPEX), i.e. one-time costsof procuring or developing an application, and (ii) operatingexpenditures (OPEX), i.e. on-going costs for running anapplication. Thus, when an application is left unchanged,the CAPEX is zero. We call this alternative to maintain theapplication. Conversely, in the case where an application isphased out completely, its OPEX afterwards is zero. We callthis alternative to phase out the application.
Clearly, maintain and phase out are extremes. In betweenare two more decisions. The first one is to develop anexisting application. This means accepting a capital expen-diture either to decrease future operating expenditure, or toincrease the application utility. The second one is to replacean existing application. This means that one application isphased out, and another takes its place. Here, the capitalexpenditure consists of two parts; first, the phase-out cost ofthe old application, second, the phase-in cost of the newone. The operating expenditure in all cases will be thatof the application running after implementation. The modelproposed in Fig. 1 illustrates these four decisions. Dependingon the action taken, one of four different outcomes willobtain. For each of the actions, there is some utility to begained, and some costs to be carried, as depicted in Table I.
The goal, of course, is to maximize utility, viz. the utilitydelivered by an application minus its cost. The problemis that at decision time, the real posterior utilities u andcosts c are not available. Rather, they must be replaced bya priori estimates u and c, used by the decision maker tobe able to make a rational decision. In the next section,
Table IVARIABLES IN THE MODEL OF APPLICATION CONSOLIDATION
DECISION-MAKING.
Utility CostsOPEX CAPEX
Maintain uM cMOP
Develop uD cDOP cD
CAPPhase out cP
CAPReplace uR cR
OP cRCAP
we will get back to the issue of these estimates, and howwe can address it. Given estimates u and c, however, thenaive decision maker’s problem for an application portfolioof n applications is then simply to pick the best of the fouralternatives in each of the n cases, considered by itself:
argmax{M,D,P,R}
�⌥⌥⇧
⌥⌥⇤
ui(M) = uM � cMOP
ui(D) = uD � cDOP � cD
CAPui(P ) = �cP
CAPui(R) = uR � cR
OP � cRCAP � cP
CAP
⇥⌥⌥⌃
⌥⌥⌅
However, this holds only if the applications can beevaluated independently of each other. This is, of course,rarely the case. Rather, a major rationale for applicationconsolidation is the inherent complexity of intertwined ap-plications. Thus in the general case, the utilities and cost ofan application i are a function of all the other systems. Thisleads not to n independent simple maximization problemsas above, but rather to a single much larger optimizationproblem made up of n coupled components.
The fact that the problem inevitably exhibits a great degreeof interdependencies indicates the need for a more holisticapproach. The next sections outline such an approach.
IV. ESTIMATION OF UTILITIES AND COSTS
To solve the problem described in section III, two issuesneed to be addressed. First, reliable estimation techniquesmust be used for the utilities u and costs c. Second,the complexity of the many interconnections needs to bemanaged. A good framework requires both components. Inthis section, the estimation aspect will be addressed.
To do so, we use the functional/non-functional dichotomy,known from software engineering [11]. Functional require-ments describe application functions; its processing anddisplaying of data. Non-functional requirements describehow well such functions are carried out, e.g. throughput, andother non-functional properties, e.g. application availability.
A. Estimating non-functional utilities
Figure 2 displays the structure of the ISO/IEC 9126standard [12]. The concepts used in this standard are agood starting point for the non-functional utility estimates.However, the nature of application consolidation decision-making makes it futile to expect to be able to use the
standard in full as defined in the three technical reports [13],[14], [15] accompanying the official standard document. Thereason for this should be obvious: the need for applicationconsolidation only arises when the application landscape islarge, unruly, and difficult to observe in detail. So by defi-nition, the letter of the detailed definitions of the ISO/IEC9126 are ruled out. Its spirit can still be used, though.
What can be achieved are, again, estimates. To choosesuitable estimates, we loosely adhere to the model forchoosing software assessment measures presented in [16],a method emphasizing the trade-off between precision andcost. In particular, a useful class of operationalizations arerelative measures that relate requirements to measurements.
To give an example, consider the reliability factor inthe ISO/IEC 9126 standard. By the standard, it is brokendown into (i) maturity, (ii) fault tolerance, (iii) recover-ability, and (iv) reliability compliance. Each of these isitself broken down into metrics, such as estimated latentfault density, calculated by counting ”the number of faultsdetected during a defined trial period and predict potentialnumber of future faults using a reliability growth estimationmodel” [13]. Again, such a detailed model cannot be appliedto an application landscape in the hundreds or thousands,where the exact number of applications might not even beknown, much less hundreds of applications characteristicson latent fault density. Instead, we operationalize a notionof availability, where stakeholders define an availabilityrequirement. This requirement is then compared to the actualavailability, as estimated by the users.
While this is certainly a less precise measure than theone advocated in the ISO/IEC 9126 standard, it has threeimportant benefits that makes it suitable for decision-makingon application consolidation:
Simplicity It is simple enough to be feasible to collectthroughout a large application landscape. As it isput in [9]: ”The key is to avoid allowing the detailsto drown the analysis: understand the strategicquestions up front and focus only on gathering theinformation necessary to answer those questions.”
Separation of concerns The requirements are usuallycollected at one place in the enterprise, whereas thedata needed to determine whether these require-ments are fulfilled or not is generally collectedat another. This aims to minimize the impact ofself-serving bias and organizational rivalry on thequality of the assessment.
Contextuality It firmly connects the application qualityinvestigated to specific application requirements.In this way, we sidestep the question of whatconstitutes high or low availability in an objectivesense, and are fully content to let this be contextual.
This method of contrasting requirements with fulfillmentscan be used not only in the case of availability, but in the
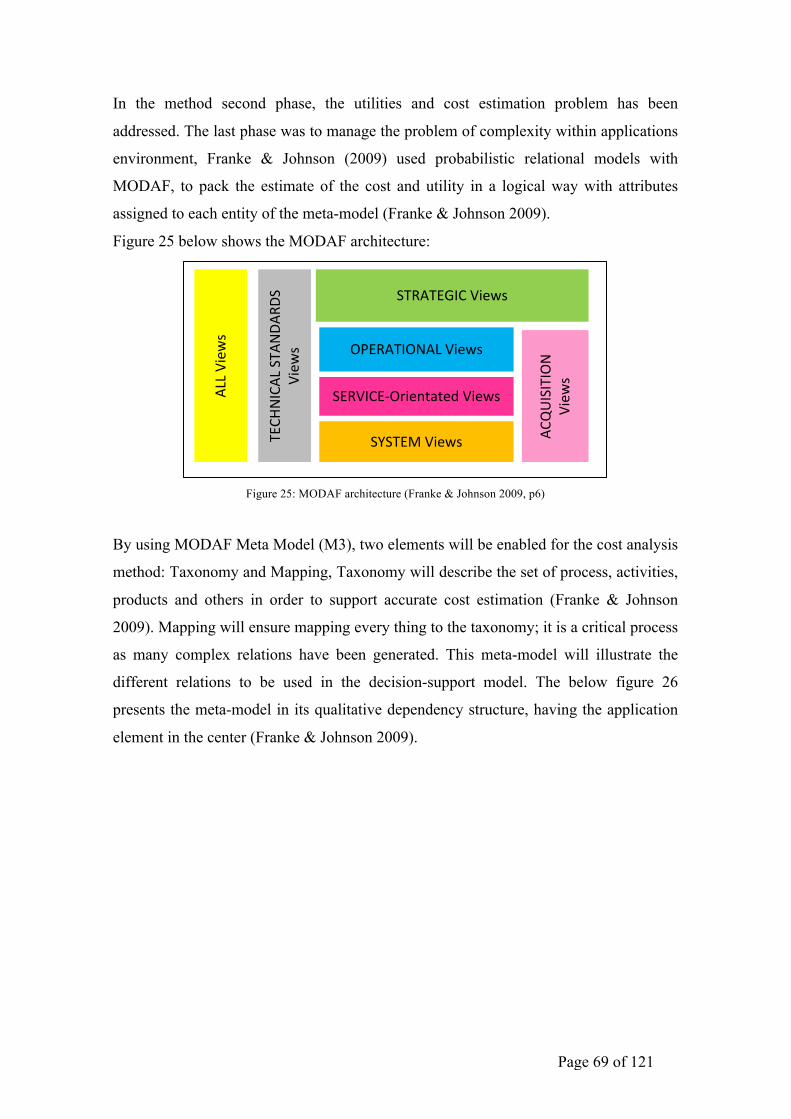
Page 69 of 121
In the method second phase, the utilities and cost estimation problem has been
addressed. The last phase was to manage the problem of complexity within applications
environment, Franke & Johnson (2009) used probabilistic relational models with
MODAF, to pack the estimate of the cost and utility in a logical way with attributes
assigned to each entity of the meta-model (Franke & Johnson 2009).
Figure 25 below shows the MODAF architecture:
Figure 25: MODAF architecture (Franke & Johnson 2009, p6)
By using MODAF Meta Model (M3), two elements will be enabled for the cost analysis
method: Taxonomy and Mapping, Taxonomy will describe the set of process, activities,
products and others in order to support accurate cost estimation (Franke & Johnson
2009). Mapping will ensure mapping every thing to the taxonomy; it is a critical process
as many complex relations have been generated. This meta-model will illustrate the
different relations to be used in the decision-support model. The below figure 26
presents the meta-model in its qualitative dependency structure, having the application
element in the center (Franke & Johnson 2009).
A probabilistic relational model � specifies a probabilitydistribution over all instantiations I of the metamodel M.This probability distribution is specified as a Bayesiannetwork [18], which consists of a qualitative dependencystructure and associated quantitative parameters.
The qualitative dependency structure is defined by associ-ating with each attribute X.A a set of parents Pa(X.A). Anadvantage of PRM:s over standard Bayesian networks is thatthe set of parents needs not be fixed at the instance level,but can grow and shrink dynamically as long as the parentsare appropriately defined in the metamodel. We can also letx.A depend probabilistically on some aggregate propertyof several parent attributes, such as the mean (MEAN ) ofone, two or ten parents, or the the cardinality (CARD) ofthis parent set. Other aggregation functions would includethe logical operations AND, OR, and NOT , or arithmeticoperations such as SUM and PRODUCT .
We can now define a probabilistic relational model (PRM)� for a metamodel M as follows. For each class X � Xand each descriptive attribute A � A(X), we have a set ofparents Pa(X.A), and a conditional probability distribution(CPD) that represents P�(X.A|Pa(X.A)).
Given a relational skeleton �r (i.e. a metamodel instan-tiated to all but the attribute values), a PRM � specifiesa probability distribution over a set of instantiations Iconsistent with �r:
P (I|�r,�) =�
x��r(X)
�
A�A(x)
P (x.A|Pa(x.A))
where �r(X) are the objects of each class as specified bythe relational skeleton �r.
A PRM thus constitutes a formal machinery for calcu-lating the probabilities of various architecture instantiations.This allows us to infer the probability that a certain attributeassumes a specific value, given some (possibly incomplete)evidence of the rest of the architecture instantiation. In ad-dition to expressing and inferring uncertainty about attributevalues as specified above, PRMs also provide support forspecifying uncertainty about the structure of the instantia-tions. A more detailed description of this topic is, however,beyond the scope of the paper.
B. The Ministry of Defence Architecture FrameworkMODAF, the Ministry of Defence Architecture Frame-
work, is designed to support the creation of an enterprisearchitecture for the British Ministry of Defence [21]. Inaddition to the UK, MODAF is used by the SwedishArmed Forces and the Swedish Defence Materiel Adminis-tration in their architecture efforts. As MODAF is originallybased upon version 1 of its U.S. counterpart DoDAF, theDepartment of Defense Architecture Framework, the twoframeworks are closely related. Nevertheless there are signif-icant differences. DoDAF defines four different views of itscore architecture data model, CADM, viz. the Operational,
!"#$%&'!(%)*+,-./
0&$%'2*+,-./
0#$+'2#3!4,-5676-8*+,-./
090&#:*+,-./
%))*+,-./

('2%)*0&%(<%$<
0*+,-.
/
%2=
>'0'&'!(*
+,-.
/
Figure 4. The MODAF Architecture viewpoints, adapted from [21].
Systems and Services, Technical Standards and the Allview. Each view is divided into different viewpoints, orproducts. MODAF closely adheres to this general structure,but features an extended set of viewpoints, as illustrated inFig. 4. Each viewpoint consists of a number of views, thatreveal different details of the overall architecture.
1. The Strategic Viewpoint is made up of Strategic Views(StVs), designed to support the process of realizingstrategic intents through military capabilities. Theviewpoint aims at providing tools for gap / overlapanalysis, capability audit etc., supported by appropri-ate measures of effectiveness.
2. The Operational Viewpoint consists of OperationalViews (OVs) that put the capabilities defined in theStrategic Viewpoint in the context of an operation.The viewpoint can be used in the development of userrequirements, to capture future concepts, to supportthe operational planning processes, etc.
3. The Service-Orientated Viewpoint holds Service-Orientated Views (SOVs) that specify services foruse in a Service-Oriented Architecture (SOA). Thisspecification includes orchestration and definitions ofthe capabilities delivered.
4. The System Viewpoint contains the System Views(SVs) and describe how capabilities are actually real-ized. Resources, broadly construed, and their interac-tions, as well as system interfaces and human-systeminteraction are in focus. SVs play a large role in thedevelopment of system solutions, as well as in thedevelopment of appropriate system requirements.
5. The Technical Standards Viewpoint comprises Tech-nical Standards Views (TVs) that contain standards,rules, policy and guidance. These are not exclusivelytechnical, but also include doctrine, Standard Operat-ing Procedures (SOPs) etc.
6. The Acquisition Viewpoint is made of AcquisitionViews (AcVs) that describe programs, projects andother activities involved in capability management andacquisition.
7. The All-Views Viewpoint holds All-Views (AVs) thatprovide an overall description of the architecture itself.
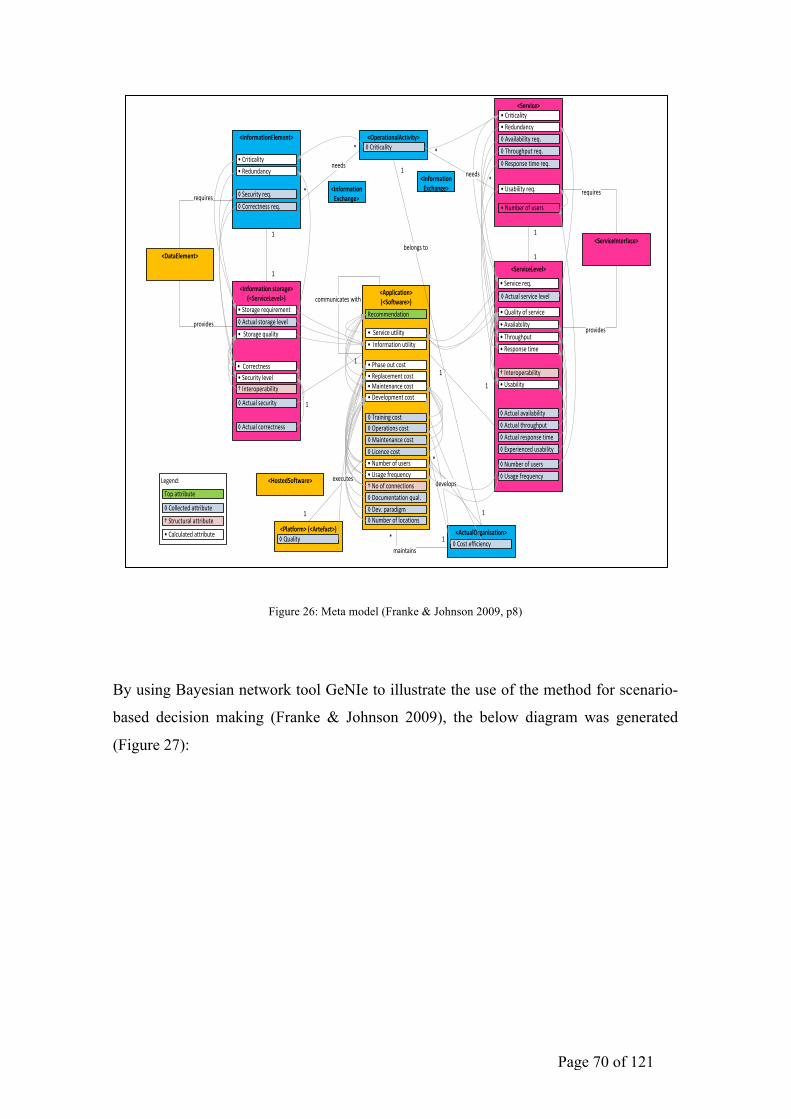
Page 70 of 121
Figure 26: Meta model (Franke & Johnson 2009, p8)
By using Bayesian network tool GeNIe to illustrate the use of the method for scenario-
based decision making (Franke & Johnson 2009), the below diagram was generated
(Figure 27):
!"#$%&'#(#%#)*
!+,#$-.&/0-)1'.&%&.2*�!"#$%$&'($%)
!"#$%&'#**!"#$%$&'($%)
*!+,-./-'/&)
!1,,)&'-.&/0*34!"/5.6-$#*7
�!01'$('2$($%)!#,34
�!0&%.'(!'1'$('2$($%)
�!56#7.869.%!#,34
*!56#7.869.%
�!+,:97/:,!%$;,!#,34
*!+,:97/:,!%$;,
*!<.;2,#!7=!.:,#:
*!>:'2$($%)
!1'.8-)+$9-0&:-.&/0*
�!"7:%!,==$&$,/&)
*!<.;2,#!7=!.:,#:
�!?'$/%,/'/&,!&7:%
�!@9,#'%$7/:!&7:%
�!A$&,/&,!&7:%
!;)-.5/$<*34!1$.#5-'.*7�!B.'($%)
*!>:'8,!=#,3.,/&)
�!C,14!9'#'-$8;
!=05/$<-.&/0>)#<#0.*
*!+,-./-'/&)
D!<7!7=!&7//,&%$7/:
*!!E,#1$&,!.%$($%)
�!0&%.'(!:,#1$&,!(,1,(
F
F
F
F
+,&7;;,/-'%$7/
*!E,#1$&,!#,34!=05/$<-.&/03:./$-9#*3
4!"#$%&'#(#%#)*7
�!0&%.'(!:%7#'8,!(,1,(
F
F
F
F
*!E%7#'8,!#,3.$#,;,/%
*!"#$%$&'($%)
*!!G/=7#;'%$7/!.%$($%)
*!01'$('2$($%)!
D!G/%,#79,#'2$($%) *!?'$/%,/'/&,!&7:%*!C,1,(79;,/%!&7:%
�!0&%.'(!%6#7.869.%
�!0&%.'(!#,:97/:,!%$;,
�!E,&.#$%)!#,34
�!"7##,&%/,::!#,34
�!0&%.'(!&7##,&%/,::
*!E,&.#$%)!(,1,(
*!B.'($%)!7=!:,#1$&,
*!!E%7#'8,!3.'($%)
*!!"7##,&%/,::D!G/%,#79,#'2$($%)
�!HI9,#$,/&,-!.:'2$($%)
*!>:'2$($%)!#,34
�!C7&.;,/%'%$7/!3.'(4
,I,&.%,:
F
J
;'$/%'$/:
FJ
�!<.;2,#!7=!.:,#:
!"#$%&'#=0.#$5-'#*
#,3.$#,:
9#71$-,:
�!>:'8,!=#,3.,/&)
&7;;./$&'%,:!K$%6
-,1,(79:
!?-.->)#<#0.*
#,3.$#,:
9#71$-,:
/,,-:/,,-:
�!"7((,&%,-!'%%#$2.%,
D!E%#.&%.#'(!'%%#$2.%,
*!"'(&.('%,-!'%%#$2.%,
579!'%%#$2.%,
2,(7/8:!%7
F
F
!@/:.#A"/5.6-$#*
�!5#'$/$/8!&7:%
�!<.;2,#!7=!(7&'%$7/:
*!L6':,!7.%!&7:%*!+,9('&,;,/%!&7:%
�!0&%.'(!:,&.#$%)
A,8,/-M
!=05/$<-.&/0>B'C-09#*!=05/$<-.&/0
>B'C-09#*
J
J
J
J
Figure 5. The qualitative dependency structure of the PRM for application consolidation, mapped to the MODAF metamodel (M3).
technique. On the information side, the qualities are securityand correctness. On the service side, they are availability,throughput, response time and usability.
Interoperability deserves a special remark. As indicatedby the †, it is construed as a structural feature in boththe information and the service context. The reason forthis is that an interoperability check requires the traversalof all application-to-application connections, ensuring thatcompatible data formats and interfaces are consistently usedalong the way. Since the details of such interoperabilitychecks are at the same time relatively straight-forward andrequire a relatively high technical granularity, they have beenomitted in Fig. 5. More details on this approach to Enter-prise Architecture interoperability assessments, employingmetamodels and causal relations, can be found in [22].
A note on the naming of the entities is appropriate. Thenames given in Fig. 5 adher to MODAF naming conventionsin the sense that all the entities, with definitions, are to befound in the M3. In some cases, however, the name of theMODAF entity is so generic that another name was adopted
in Fig. 5. In these cases, the original MODAF name is givenwithin parenthesis. An example is the information storageentity, which is just a MODAF service level applied in aparticular context.
VI. SCENARIO-BASED DECISIONS
The preceding discussion has shown how the twomain problems of the account in section III – estimatesand complexity – can be addressed using the combinedPRM/MODAF framework. However, so far precious littlehas been said on how exactly to apply the data collectedand structured by the PRM dependency structure of Fig. 5.
There are many reasons for this. One important caveatis that application consolidation – despite our attempts –is not an exact science. There will invariably be elementsand factors that are not properly taken into account by ourmodel, or any other. This is also the reason why the topattribute is called recommendation rather than decision –we do not claim to have achieved full automation in thedecision-making process. However, to illustrate the use of
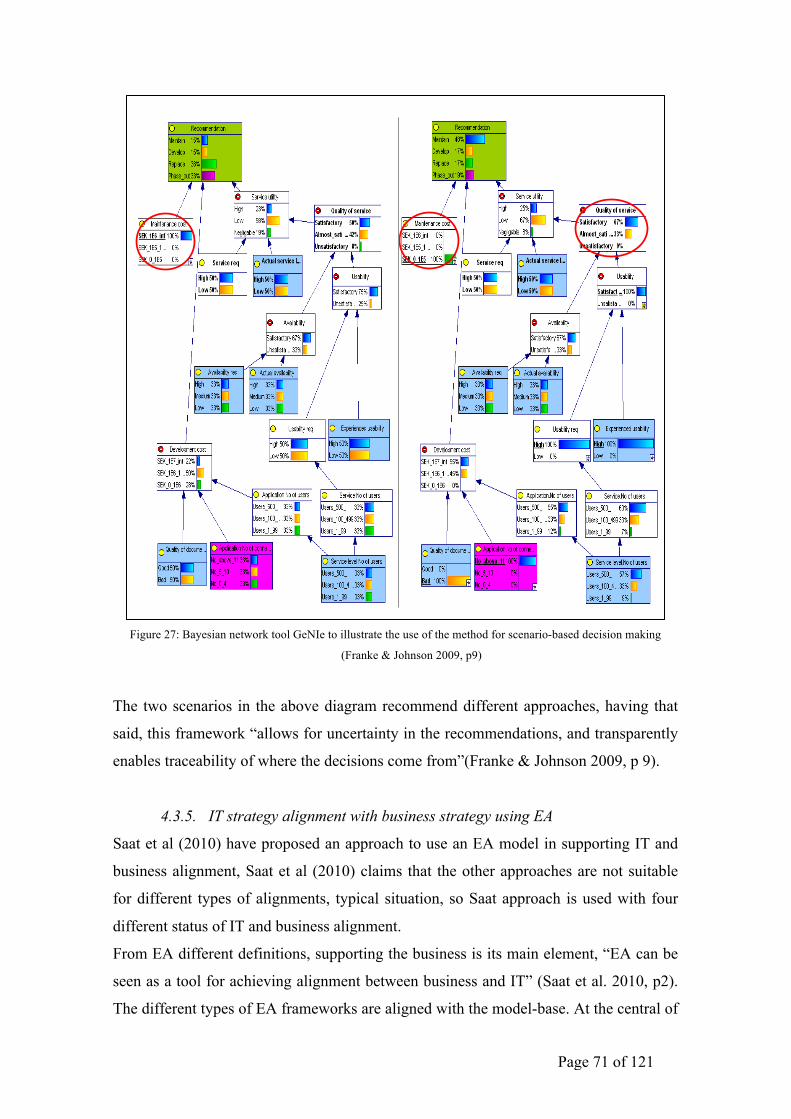
Page 71 of 121
Figure 27: Bayesian network tool GeNIe to illustrate the use of the method for scenario-based decision making
(Franke & Johnson 2009, p9)
The two scenarios in the above diagram recommend different approaches, having that
said, this framework “allows for uncertainty in the recommendations, and transparently
enables traceability of where the decisions come from”(Franke & Johnson 2009, p 9).
4.3.5. IT strategy alignment with business strategy using EA
Saat et al (2010) have proposed an approach to use an EA model in supporting IT and
business alignment, Saat et al (2010) claims that the other approaches are not suitable
for different types of alignments, typical situation, so Saat approach is used with four
different status of IT and business alignment.
From EA different definitions, supporting the business is its main element, “EA can be
seen as a tool for achieving alignment between business and IT” (Saat et al. 2010, p2).
The different types of EA frameworks are aligned with the model-base. At the central of
Figure 6. Two different scenarios.
the framework, Fig. 6 uses a simplified excerpt of the frame-work, implemented in the Bayesian network tool GeNIe[23], to illustrate its use for scenario-based decision making.In the figure to the left, we see that the high maintenacecosts makes the framework recommend either replace orphase-out. In the figure to the right, low maintenance costsand fair quality of service makes maintain the favoredalternative. However, it should be noted that the probabilisticframework allows for uncertainty in the recommendations,and transparently enables traceability of where the decisionscome from.
One of the greatest advantages of Enterprise Architecturemodels is that they enable this kind of decision making:whereas experimenting in the real world is costly andtime-consuming, models can be played with to explore theconsequences of decisions before they are actually made[24]. For these reasons, the use of scenarios in consolidationprojects is advocated in [7].
One requirement for successful scenario evaluation, how-ever, is that there is a standard by which to compare differentscenarios, so that the good can be separated from thebad. The criterion prescribed in section III is the overallutility/cost ratio of the entire application landscape. How-ever, since many of the constituent utilities and costs areonly measured on crude ordinal scales in our approximatesolution (as illustrated in table II), this ratio is not readily
available. Instead, we propose a proxy criterion: aim tominimize the service and information redundancies. This isnot guaranteed to be sufficient, but it seems plausible toassume that it is at least necessary for an optimal solution.
The redundancy attributes work in a similar way as do thecriticalities and qualities of service, using PRM aggregationfunctions. The redundancy of a service is calculated usingthe (functional) actual service level provided by its con-stituent software systems, and grows with increasing overlap,i.e. if there are several software systems providing the samefunctionality. Minimizing these redundancy measures willnot guarantee the best overall utility/cost ratio, but it will atleast select plausible candidates. In this sense, it serves as agood heuristic when using the framework.
VII. CONCLUSIONS
The contributions of the present paper are three-fold: First,an analysis and description of application consolidation fromthe perspective of decision theory is provided. The problemis formally characterized as a large optimization problem inrandom variables, and the practical problems of treating itas such are discussed. Second, the insights from the decisiontheoretical framework are applied to create a more practicalframework for application consolidation using EnterpriseArchitecture methods, specifically using the ISO/IEC 9126standard, the MODAF Enterprise Architecture framework,
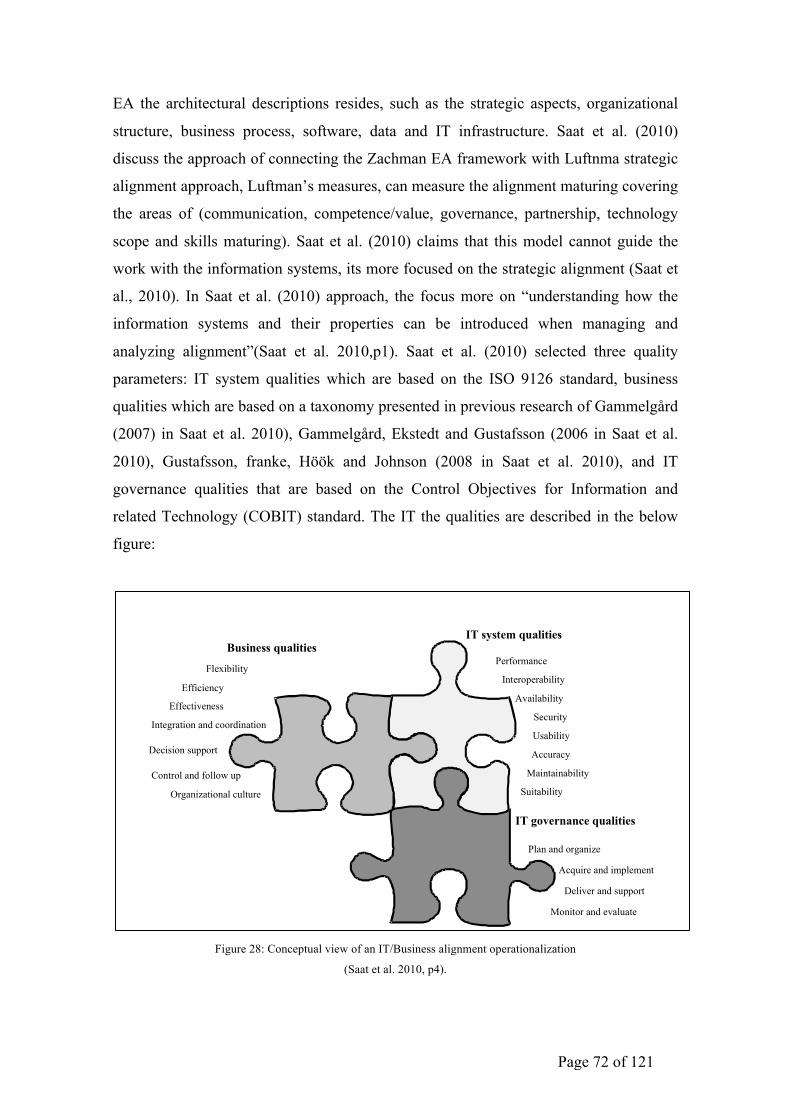
Page 72 of 121
EA the architectural descriptions resides, such as the strategic aspects, organizational
structure, business process, software, data and IT infrastructure. Saat et al. (2010)
discuss the approach of connecting the Zachman EA framework with Luftnma strategic
alignment approach, Luftman’s measures, can measure the alignment maturing covering
the areas of (communication, competence/value, governance, partnership, technology
scope and skills maturing). Saat et al. (2010) claims that this model cannot guide the
work with the information systems, its more focused on the strategic alignment (Saat et
al., 2010). In Saat et al. (2010) approach, the focus more on “understanding how the
information systems and their properties can be introduced when managing and
analyzing alignment”(Saat et al. 2010,p1). Saat et al. (2010) selected three quality
parameters: IT system qualities which are based on the ISO 9126 standard, business
qualities which are based on a taxonomy presented in previous research of Gammelgård
(2007) in Saat et al. 2010), Gammelgård, Ekstedt and Gustafsson (2006 in Saat et al.
2010), Gustafsson, franke, Höök and Johnson (2008 in Saat et al. 2010), and IT
governance qualities that are based on the Control Objectives for Information and
related Technology (COBIT) standard. The IT the qualities are described in the below
figure:
Figure 28: Conceptual view of an IT/Business alignment operationalization
(Saat et al. 2010, p4).
!"#$%&'!()!*!+,-+'./%01!2#'3!,4!0-!5678%9#-'99!01#$-:'-/!,.'&0/#,-01#;0/#,-)!
!"#$%&'#()"*'"+*,))&+("'#()"! 4,+%9'9!,-! /<'!='$&''! /,!3<#+<!/<'!,&$0-#;0/#,-01!%-#/9!#-!0!+,:.0->!<02'!/<'!08#1#/>!/,! #-/'$&0/'! 0-=! +,,&=#-0/'! =#44'&'-/! .0&/9! ,4! /<'!,&$0-#;0/#,-?! #)')! +,,&=#-0/#,-! ,4! /<'! .&,=%+/#,-! 0-=! /<'!=#9/%/#,-!='.0&/:'-/?!,4!/<'!901'9!0-=!.&,=%+/#,-!.10--#-$!='.0&/:'-/9!'/+)!-$,(.()"* ./00)&#! ='019! 3#/<! /<'! ='$&''! /,! 3<#+<! 0-!
,&$0-#;0/#,-01! %-#/! <09! .&,.'&! ='+#9#,-! 9%..,&/?! #)')! :0@'9!3'11A#-4,&:'=! ='+#9#,-9?! ='+#9#,-9! 0&'! /0@'-! +1,9'! /,!,.'&0/#,-9?! ='+#9#,-9! <02'! <#$<! &'1#08#1#/>! 0-=! 1,3!%-+'&/0#-/>?!='+#9#,-9!:0='!0&'!0++'./'=!8>!/<'!,&$0-#;0/#,-!'/+)!1)"#&)2*'"+*3)22)4*/0!#9!='4#-'=!09!/<'!='$&''!/,!3<#+<!
0-!,&$0-#;0/#,-!<09!/<'!08#1#/>!/,!+,-/&,1!0-=!4,11,3!%.!3,&@!#)')!='+#9#,-9!0&'!'201%0/'=!#-!&'/&,9.'+/?!1'99,-9!1'0&-'=!0&'!=,+%:'-/'=! 0-=! &'A%9'=?! -'3! .&,B'+/9! /0@'! .&'2#,%9!'C.'&#'-+'9!#-/,!0++,%-/!'/+)!5&%'"(6'#()"'2* ,/2#/&$! :'0-9! /,! 3<0/! ='$&''! /<'!
,&$0-#;0/#,-01! +%1/%&'! #-! 0! +,:.0->! #9! 0..&'+#0/'=! 8>! /<'!.',.1'! 3,&@#-$! 0/! /<'! +,:.0->?! #)')! /<'&'! #9! 0! <#$<! B,8!90/#940+/#,-!0-=!:,/#20/#,-?!-,!-'$0/#2'!9/&'99?!1,3!-%:8'&9!,4!9#+@!1'02'!'/+)!
!"! #$%&'()*+,+-)%./,0121)3%6<'!56!$,2'&-0-+'!D%01#/#'9!0&'!809'=!,-! /<'! 4,%&!:0#-!
.&,+'99'9!,4!/<'!3'11A@-,3-!EFG56!9/0-=0&=!HIJK)!72'"* '"+* )&%'"(6$! +,2'&9! 9/&0/'$>! 0-=! /0+/#+9?! 0-=!
+,-+'&-9!/<'!#='-/#4#+0/#,-!,4!/<'!30>!56!+0-!8'9/!+,-/%/'!/,!/<'!0+<#'2':'-/!,4!/<'!8%9#-'99!,8B'+/#2'9)!8,9/(&$* '"+* (:02$:$"#! #9! 08,%/! &'01#;#-$! /<'! 56A
9/&0/'$>?! #='-/#4>#-$?! ='2'1,.#-$?! ,&! 0+D%#&#-$! 56A9,1%/#,-9?!09! 3'11! 09! #:.1':'-/#-$! 0-=! #-/'$&0/#-$! /<'9'! #-/,! /<'!8%9#-'99!.&,+'99'9)!
-$2(;$&* '"+* ./00)&#! #9! +,-+'&-'=! 3#/<! /<'! 0+/%01!='1#2'&>! ,4! &'D%#&'=! 9'&2#+'9?! 3<#+<! #-+1%='9! 9'&2#+'!='1#2'&>?! :0-0$':'-/! ,4! 9'+%&#/>! 0-=! +,-/#-%#/>?! 9'&2#+'!9%..,&/! 4,&! %9'&9?! 0-=!:0-0$':'-/! ,4! =0/0! 0-=! ,.'&0/#,-01!40+#1#/#'9)!<)"(#)&* '"+* $;'2/'#$! 0==&'99'9! .'&4,&:0-+'!
:0-0$':'-/?! :,-#/,&#-$! ,4! #-/'&-01! +,-/&,1?! &'$%10/,&>!+,:.1#0-+'! 0-=! $,2'&-0-+'! #-! ,&='&! /,! @''.! ,&! #:.&,2'!D%01#/>!0-=!+,:.1#0-+'!3#/<!+,-/&,1!&'D%#&':'-/9)!E,:.0&'=!/,!/<'!56A9>9/':!0-=!8%9#-'99!D%01#/#'9?!/<'!56!
$,2'&-0-+'! D%01#/#'9! :#$</! .&#:0! 40+#'! 1,,@! :,&'! 1#@'!0+/#2#/#'9)! L,3'2'&?! /<#9! 9<,%1=! 8'! #-/'&.&'/'=! 09! 0-!,.'&0/#,-01#;0/#,-! ,4! 56! $,2'&-0-+'! D%01#/#'9! #-! /'&:9! ,4!:0/%&#/>! ,4! /<'! 56!.&,+'99'9)!6<%9?! /<'! 56!.&,+'99'9! .'&! 9'!0&'!-,/!,%&!.&#:0&>!#-/'&'9/!<'&')!
5M)! *N!OPQ5R5E*S!*N*STU5U!F"!567GVU5NOUU!*S5WNPON6!U56V*65FNU!
6<'! ,2'&011! 0#:! ,4! /<'! .&'9'-/! 9/%=>! #9! /,! #='-/#4>!=#44'&'-/! 09A#9! 9#/%0/#,-9! ,4! 5678%9#-'99! 01#$-:'-/)! 5-! 0!9'+,-=! 9/'.?! +,%&9'9! ,4! 0+/#,-! 4,&! 4%/%&'! ='2'1,.:'-/! 0&'!=''=! 0-=! 9%..,&/#-$! :'/0! :,='1! 4&0$:'-/9! /0#1,&'=!9.'+#4#+011>! /,! 9%#/! /<'! #='-/#4#'=! 9#/%0/#,-9! 0&'! .&,2#='=! #-!9'+/#,-!M)!*-! ,-1#-'! 9%&2'>!309! %9'=! 4,&! =0/0! +,11'+/#,-)! Q&#,&! /,!
=#9/%/#,-?! /<'! 9%&2'>! 309! .&'/'9/'=!3#/<! O*! 'C.'&/9! 0-=!201%081'!+,::'-/9!3'&'!&'+'#2'=!0-=!0==&'99'=)!5-2#/0/#,-9!3'&'! ':0#1'=! /,! O*! .&,4'99#,-019! #-! U3'='-?! U3#/;'&10-=?!*%9/�!0-=!W'&:0->)!6<'!':0#1!0==&'99'9!3'&'!+,-='-9'=!4,&:!/<'!0//'-=0-+'!1#9/9!,4!O*!.&0+/#/#,-'&!+,-4'&'-+'9!/<0/!<02'! 8''-! ,&$0-#;'=! 8>! /<'! 0%/<,&#-$! #-9/#/%/#,-9)!*==#/#,-011>!0!3'8!1#-@!/,!/<'!9%&2'>!309!.,9/'=!,-!9'2'&01!O*! +,::%-#/>! 3'89#/'9)! F%/! ,4! ((JX! #-2#/0/#,-9! 9'-/?! YI!':0#19! 8,%-+'=?! ZZY! .'&9,-9! 9/0&/'=! 0-=! ([\! .'&9,-9!
Q'&4,&:0-+'
5-/'&,.'&08#1#/>!
*20#108#1#/>!
U'+%&#/>!
V908#1#/>!
*++%&0+>!
P0#-/0#-08#1#/>
U%#/08#1#/>!
"1'C#8#1#/>!
O44#+#'-+>!
O44'+/#2'-'99!
5-/'$&0/#,-!0-=!+,,&=#-0/#,-!
]'+#9#,-!9%..,&/!
E,-/&,1!0-=!4,11,3!%.
F&$0-#;0/#,-01!+%1/%&'!
Q10-!0-=!,&$0-#;'!
*+D%#&'!0-=!#:.1':'-/!
]'1#2'&!0-=!9%..,&/!
P,-#/,&!0-=!'201%0/'!
!= .>.#$:*9/'2(#($.
!= %);$&"'",$*9/'2(#($.
?/.("$..*9/'2(#($.
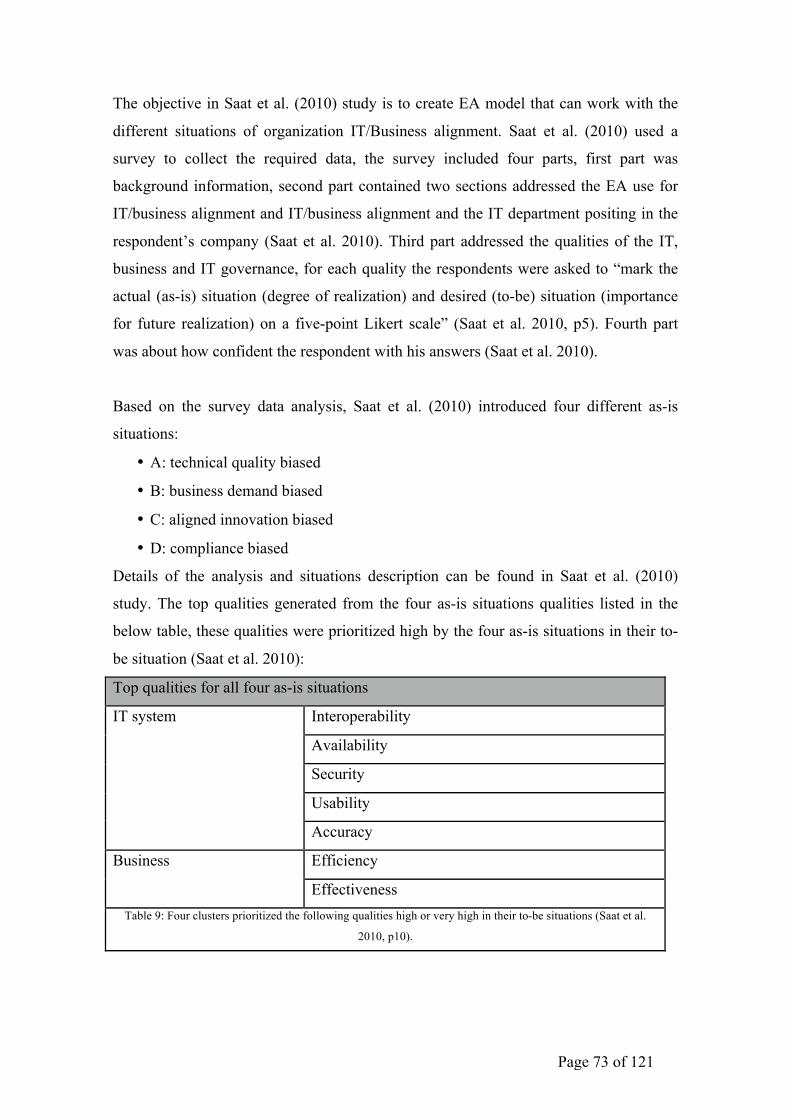
Page 73 of 121
The objective in Saat et al. (2010) study is to create EA model that can work with the
different situations of organization IT/Business alignment. Saat et al. (2010) used a
survey to collect the required data, the survey included four parts, first part was
background information, second part contained two sections addressed the EA use for
IT/business alignment and IT/business alignment and the IT department positing in the
respondent’s company (Saat et al. 2010). Third part addressed the qualities of the IT,
business and IT governance, for each quality the respondents were asked to “mark the
actual (as-is) situation (degree of realization) and desired (to-be) situation (importance
for future realization) on a five-point Likert scale” (Saat et al. 2010, p5). Fourth part
was about how confident the respondent with his answers (Saat et al. 2010).
Based on the survey data analysis, Saat et al. (2010) introduced four different as-is
situations:
• A: technical quality biased
• B: business demand biased
• C: aligned innovation biased
• D: compliance biased
Details of the analysis and situations description can be found in Saat et al. (2010)
study. The top qualities generated from the four as-is situations qualities listed in the
below table, these qualities were prioritized high by the four as-is situations in their to-
be situation (Saat et al. 2010):
Top qualities for all four as-is situations
IT system Interoperability
Availability
Security
Usability
Accuracy
Business Efficiency
Effectiveness Table 9: Four clusters prioritized the following qualities high or very high in their to-be situations (Saat et al.
2010, p10).
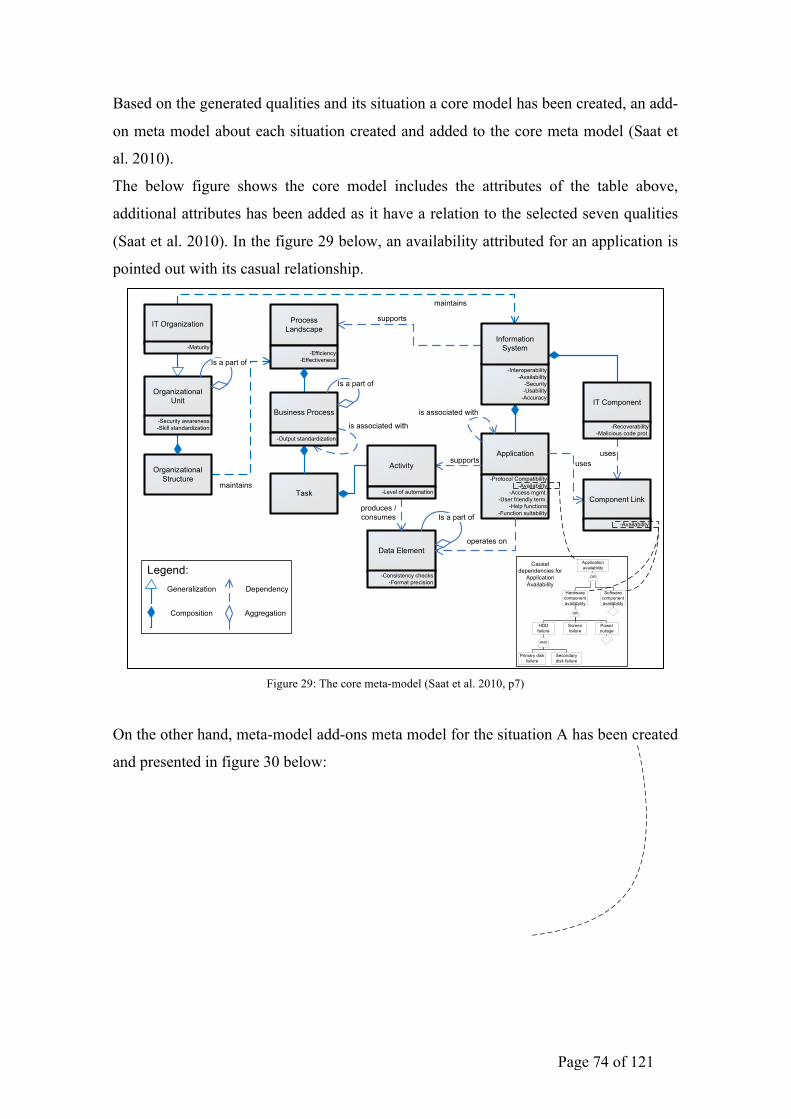
Page 74 of 121
Based on the generated qualities and its situation a core model has been created, an add-
on meta model about each situation created and added to the core meta model (Saat et
al. 2010).
The below figure shows the core model includes the attributes of the table above,
additional attributes has been added as it have a relation to the selected seven qualities
(Saat et al. 2010). In the figure 29 below, an availability attributed for an application is
pointed out with its casual relationship.
Figure 29: The core meta-model (Saat et al. 2010, p7)
On the other hand, meta-model add-ons meta model for the situation A has been created
and presented in figure 30 below:
!
!"#$%&'!()!*+'!,-&'!.'/0!.-1'2)!
!
!"#$%&'!3)!4!.'/0!.-1'2!5&0$.'6/!5-&!078#7!7#/%0/#-6!4!907'1!-6!#/7!:&#-&#/#;'1!<%02#/#'7)!
!""#$%&'$()
*&+,
+-""(.'+
/&$)'&$)+
$+0&++(%$&'12 3$'4
-+1+5.6&)$7&'$()'.-%'-.1
9.(%1++0:&)2+%&"1
;<==$%$1)%>;<==1%'$?1)1++
+-""(.'+
/&$)'&$)+
;9.('(%(#0@(/"&'$A$#$'>;!?&$#&A$#$'>
;!%%1++0/6/'B;C+1.0=.$1)2#>0'1./B
;D1#"0=-)%'$()+;E-)%'$()0+-$'&A$#$'>
-+1+
F&'&0<#1/1)'("1.&'1+0()
".(2-%1+ G0%()+-/1+
;@()+$+'1)%>0%41%,+;E(./&'0".1%$+$()
$+0&++(%$&'12 3$'4
;H)'1.("1.&A$#$'>;!?&$#&A$#$'>;81%-.$'>;C+&A$#$'>;!%%-.&%>
H)=(./&'$()08>+'1/
H*05.6&)$7&'$()
;I&'-.$'>
5.6&)$7&'$()�C)$'
;81%-.$'>0&3&.1)1++;8,$##0+'&)2&.2$7&'$()
J-+$)1++09.(%1++
;5-'"-'0+'&)2&.2$7&'$()
!%'$?$'>
;:1?1#0(=0&-'(/&'$()@(/"()1)'0:$),
;!?&$#&A$#$'>
H*0@(/"()1)'
;K1%(?1.&A$#$'>;I&#$%$(-+0%(210".('B
:161)2LM1)1.&#$7&'$()
@(/"(+$'$()
F1"1)21)%>
H+0&0"&.'0(=
!66.16&'$()
H+0&0"&.'0(=
H+0&0"&.'0(=
D&.23&.10%(/"()1)'0&?&$#&A$#$'>
5K
DFF0=&$#-.1
8%.11)0=&$#-.1
9(31.0(-'&61
!NF
9.$/&.>02$+,0=&$#-.1
81%()2&.>02$+,0=&$#-.1
8(='3&.10%(/"()1)'0&?&$#&A$#$'>
5K
!""#$%&'$()0&?&$#&A$#$'>
@&-+"1)21)%$1+0=(.0!""#$%&'$()0!?&$#&A$#$'>
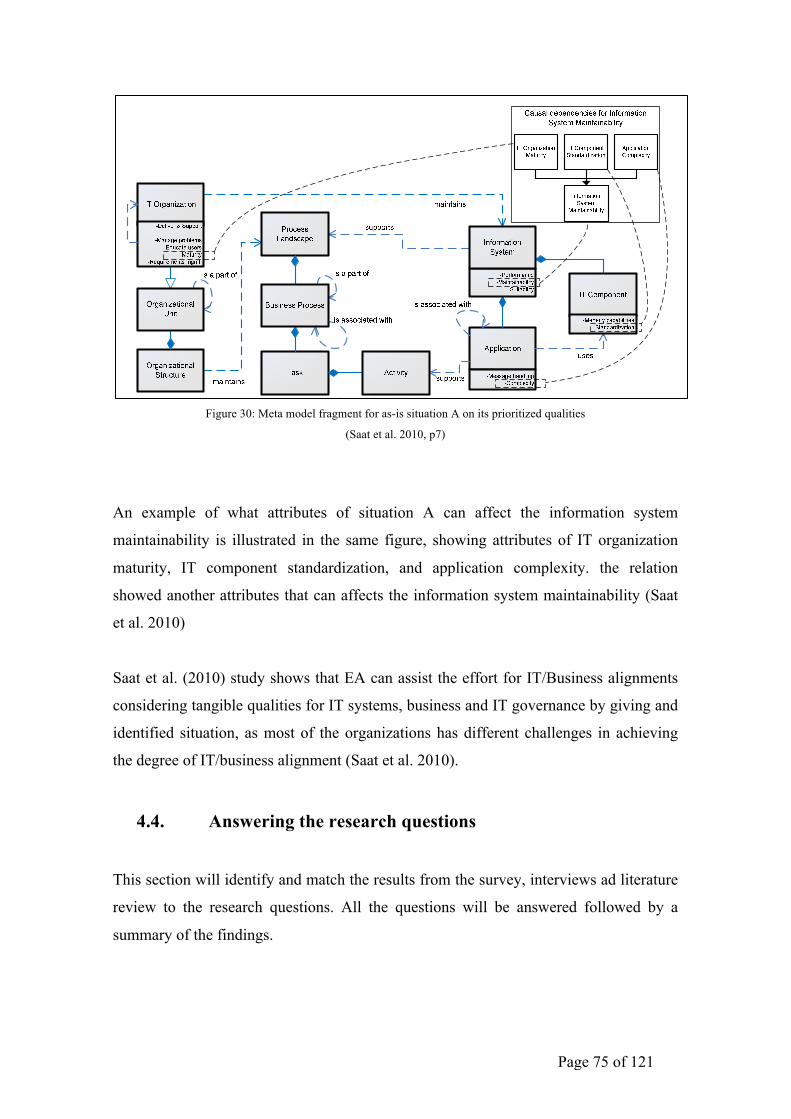
Page 75 of 121
Figure 30: Meta model fragment for as-is situation A on its prioritized qualities
(Saat et al. 2010, p7)
An example of what attributes of situation A can affect the information system
maintainability is illustrated in the same figure, showing attributes of IT organization
maturity, IT component standardization, and application complexity. the relation
showed another attributes that can affects the information system maintainability (Saat
et al. 2010)
Saat et al. (2010) study shows that EA can assist the effort for IT/Business alignments
considering tangible qualities for IT systems, business and IT governance by giving and
identified situation, as most of the organizations has different challenges in achieving
the degree of IT/business alignment (Saat et al. 2010).
4.4. Answering the research questions
This section will identify and match the results from the survey, interviews ad literature
review to the research questions. All the questions will be answered followed by a
summary of the findings.
!
!"#$%&'!()!*+'!,-&'!.'/0!.-1'2)!
!
!"#$%&'!3)!4!.'/0!.-1'2!5&0$.'6/!5-&!078#7!7#/%0/#-6!4!907'1!-6!#/7!:&#-&#/#;'1!<%02#/#'7)!
!""#$%&'$()
*&+,
+-""(.'+
/&$)'&$)+
$+0&++(%$&'12 3$'4
-+1+5.6&)$7&'$()'.-%'-.1
9.(%1++0:&)2+%&"1
;<==$%$1)%>;<==1%'$?1)1++
+-""(.'+
/&$)'&$)+
;9.('(%(#0@(/"&'$A$#$'>;!?&$#&A$#$'>
;!%%1++0/6/'B;C+1.0=.$1)2#>0'1./B
;D1#"0=-)%'$()+;E-)%'$()0+-$'&A$#$'>
-+1+
F&'&0<#1/1)'("1.&'1+0()
".(2-%1+ G0%()+-/1+
;@()+$+'1)%>0%41%,+;E(./&'0".1%$+$()
$+0&++(%$&'12 3$'4
;H)'1.("1.&A$#$'>;!?&$#&A$#$'>;81%-.$'>;C+&A$#$'>;!%%-.&%>
H)=(./&'$()08>+'1/
H*05.6&)$7&'$()
;I&'-.$'>
5.6&)$7&'$()�C)$'
;81%-.$'>0&3&.1)1++;8,$##0+'&)2&.2$7&'$()
J-+$)1++09.(%1++
;5-'"-'0+'&)2&.2$7&'$()
!%'$?$'>
;:1?1#0(=0&-'(/&'$()@(/"()1)'0:$),
;!?&$#&A$#$'>
H*0@(/"()1)'
;K1%(?1.&A$#$'>;I&#$%$(-+0%(210".('B
:161)2LM1)1.&#$7&'$()
@(/"(+$'$()
F1"1)21)%>
H+0&0"&.'0(=
!66.16&'$()
H+0&0"&.'0(=
H+0&0"&.'0(=
D&.23&.10%(/"()1)'0&?&$#&A$#$'>
5K
DFF0=&$#-.1
8%.11)0=&$#-.1
9(31.0(-'&61
!NF
9.$/&.>02$+,0=&$#-.1
81%()2&.>02$+,0=&$#-.1
8(='3&.10%(/"()1)'0&?&$#&A$#$'>
5K
!""#$%&'$()0&?&$#&A$#$'>
@&-+"1)21)%$1+0=(.0!""#$%&'$()0!?&$#&A$#$'>
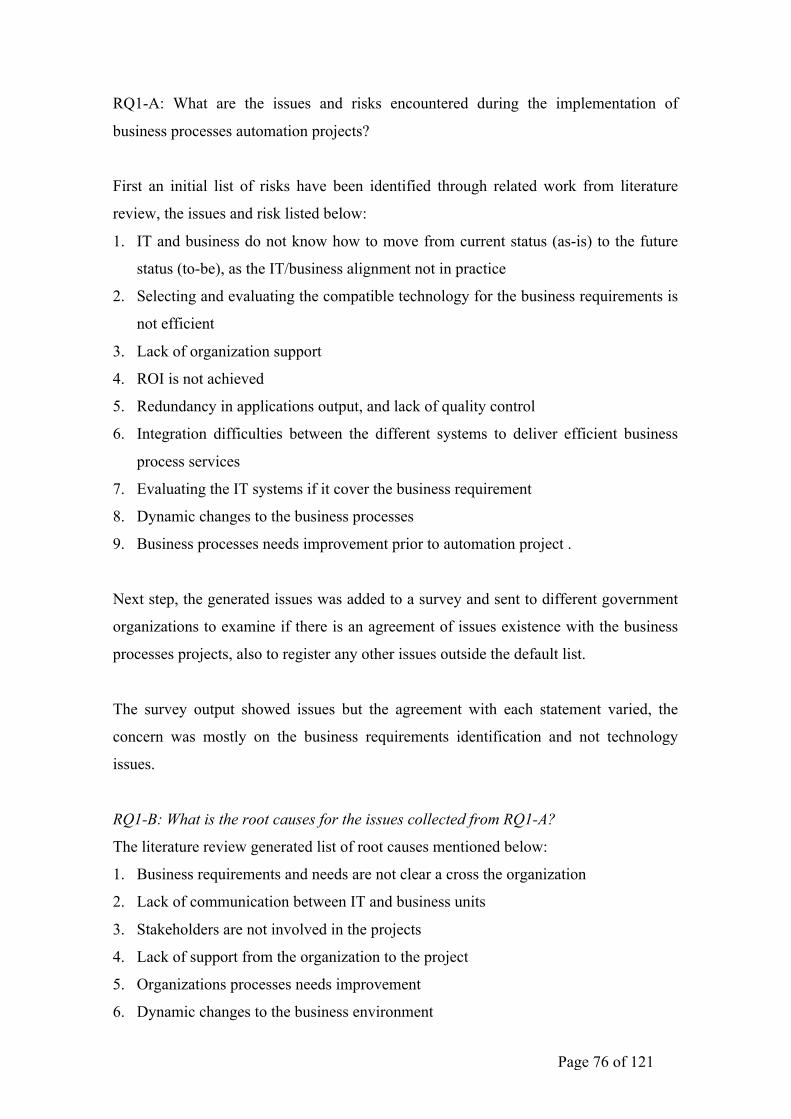
Page 76 of 121
RQ1-A: What are the issues and risks encountered during the implementation of
business processes automation projects?
First an initial list of risks have been identified through related work from literature
review, the issues and risk listed below:
1. IT and business do not know how to move from current status (as-is) to the future
status (to-be), as the IT/business alignment not in practice
2. Selecting and evaluating the compatible technology for the business requirements is
not efficient
3. Lack of organization support
4. ROI is not achieved
5. Redundancy in applications output, and lack of quality control
6. Integration difficulties between the different systems to deliver efficient business
process services
7. Evaluating the IT systems if it cover the business requirement
8. Dynamic changes to the business processes
9. Business processes needs improvement prior to automation project .
Next step, the generated issues was added to a survey and sent to different government
organizations to examine if there is an agreement of issues existence with the business
processes projects, also to register any other issues outside the default list.
The survey output showed issues but the agreement with each statement varied, the
concern was mostly on the business requirements identification and not technology
issues.
RQ1-B: What is the root causes for the issues collected from RQ1-A?
The literature review generated list of root causes mentioned below:
1. Business requirements and needs are not clear a cross the organization
2. Lack of communication between IT and business units
3. Stakeholders are not involved in the projects
4. Lack of support from the organization to the project
5. Organizations processes needs improvement
6. Dynamic changes to the business environment
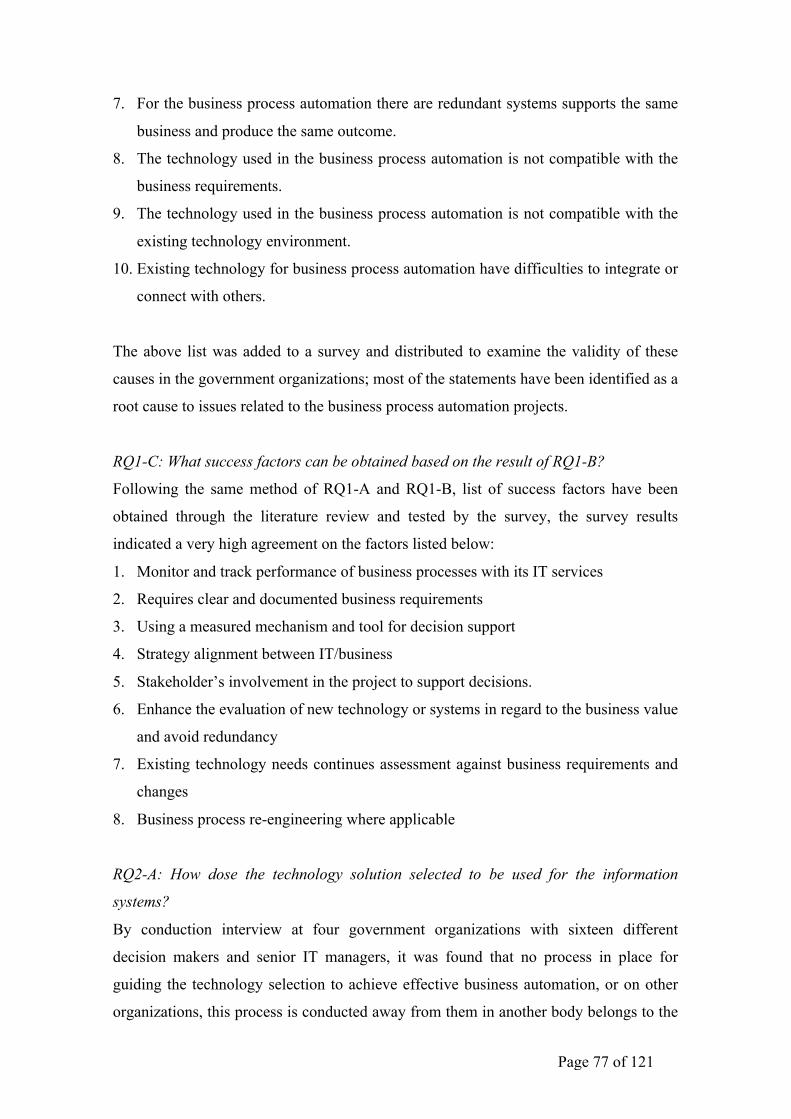
Page 77 of 121
7. For the business process automation there are redundant systems supports the same
business and produce the same outcome.
8. The technology used in the business process automation is not compatible with the
business requirements.
9. The technology used in the business process automation is not compatible with the
existing technology environment.
10. Existing technology for business process automation have difficulties to integrate or
connect with others.
The above list was added to a survey and distributed to examine the validity of these
causes in the government organizations; most of the statements have been identified as a
root cause to issues related to the business process automation projects.
RQ1-C: What success factors can be obtained based on the result of RQ1-B?
Following the same method of RQ1-A and RQ1-B, list of success factors have been
obtained through the literature review and tested by the survey, the survey results
indicated a very high agreement on the factors listed below:
1. Monitor and track performance of business processes with its IT services
2. Requires clear and documented business requirements
3. Using a measured mechanism and tool for decision support
4. Strategy alignment between IT/business
5. Stakeholder’s involvement in the project to support decisions.
6. Enhance the evaluation of new technology or systems in regard to the business value
and avoid redundancy
7. Existing technology needs continues assessment against business requirements and
changes
8. Business process re-engineering where applicable
RQ2-A: How dose the technology solution selected to be used for the information
systems?
By conduction interview at four government organizations with sixteen different
decision makers and senior IT managers, it was found that no process in place for
guiding the technology selection to achieve effective business automation, or on other
organizations, this process is conducted away from them in another body belongs to the
Page 78 of 121
same authority or the organization head quarter, which contradict with their internal
business requirements. All the interviews agreed that this process is necessary and the
existing approach has to be improved.
RQ2-B: How is the processes to be automated are selected?
The interviews results showed that there is no process exists in place, but a adopting
balance scorecards and KPIs approach is used to guide the automation initiatives, in
addition, all the interviewee had a common issue on this regard, which was the missing
link between the IT strategy and the business strategy, they all agreed that a
methodology has to be implemented to guide the business processes automation inside
the same organization or between its different entities to achieve efficiency.
RQ2-C: Is there any hindering reasons for not implementing enterprise architecture?
The main objective from this question was to draw future recommendations regarding
EA implementations, however the answer to this question will not lead to answer this
research main question.
A collected data through the interviews dialogue, helped answering this question,
bellow list of identified hindering reasons against EA implementation:
1. The existence of other authorities or internal departments with similar function
might contradict or show resistance
2. Awareness sessions are very important to buy in the program internally and gain the
departments cooperation, as existing communication problems could affect the
implementation
3. Most of the responses think that EA implementations will need a power of position
and authority to operates and maintain its objectives.
By answering the above sub-questions, it is proved that there is issues with the business
processes automation projects, the next phase to explore literature review for possible
EA solutions to resolve the generated issues and supports the success factors of business
process automation projects.
Page 79 of 121
Going through the literature review in section 4.5, it was found that many studies and
approaches were using the EA to address related issues generated from answering sub-
questions (RQ1-A,RQ1-B,RQ1-C,RQ2-A,RQ2-B). Also using the results from the
interviews, all the interviewees agreed that EA would assist the business process
implementations in a positive line. This conclude to prove this research hypothesis:
H1: The EA framework implementations supports the success of BPA project
Proving H1 answered the research main question:
“How dose implementing enterprise architecture framework affects the business
processes automation initiatives?”
4.5. Summary: All the research sub-questions were answered, which showed the existence of an issues
with the business processes automation initiatives, moreover, using the literature review
showed that EA would assist in avoiding the issues and risk attached with the business
processes automation, EA could be additional success factor to the business processes
automation initiatives.
Page 80 of 121
5. Conclusion and recommendations 5.1. Conclusion
The aim of this research is to examine the necessity of implementing enterprise
architecture framework in the organizations to achieve agility in its business processes.
The main findings of this research were identifying nonproductive planning process a
cross the government organizations, that results in a dissatisfaction of the business
process automation initiatives. Also the government is spending effort and money to
support these initiatives, but the business value is not measured. The research showed
an opportunity of using enterprise architecture framework to address the issues that
results or combines with the business process automation projects. On the other hand,
this research revealed the great support from the local and federal government towards
the automation initiatives, which should be appreciated; also, efforts should continue to
assist the government in achieving its vision.
5.2. Limitations Although the research questions were answered, some results from the survey could not
be confirmed. This is due to the small gap or disagreement between the answers. A
greater sample could resolve this matter; also another style of answers could be used to
obtain convinced results. Interviews were not long enough to get sophisticated details,
however, there were a lot of similarities in the collected data, which indicates a good
quality of information and consistency.
Also, it has to be mentioned that the interviews covered UAE capital city Abu Dhabi,
other areas like Dubai and Sharjah could not be reached due to the time constraint.
5.3. Recommendations and further work An interesting finding in this research was the issue of the different entities that belongs
to the same organization but it differs in the business. These entities are facing great
challenge to comply with the organization standards and its internal business standards.
This could be taking further for future study to implement a common EA framework
Page 81 of 121
that could work for such organizations.
Another observation obtained from the results, was the concept of Return Of Investment
(ROI). Although it was found during the interview that Abu Dhabi government is
spending on the business processes automation projects, the government and the
research field might be interesting in getting statistics showing the return of investment.
EA framework could support this approach.
A final observation during the interviews was the subject of knowledge management
initiatives, to stay focus on the research objectives, this discussion could not be
registered, however, three of the four organizations that were included in the interview
process, started knowledge management initiative. The government supports the
initiative and a road map for wider implementation is under process. As seen from the
literature review, one of the EA framework aspects is its ability to generate information
from the stored data in its repositories, using different tools and algorithms in order to
support the decision-making. EA framework combination with knowledge management
projects could be a topic for future research to support Abu Dhabi government
initiatives.
Page 82 of 121
6. Appendix A: Survey questions
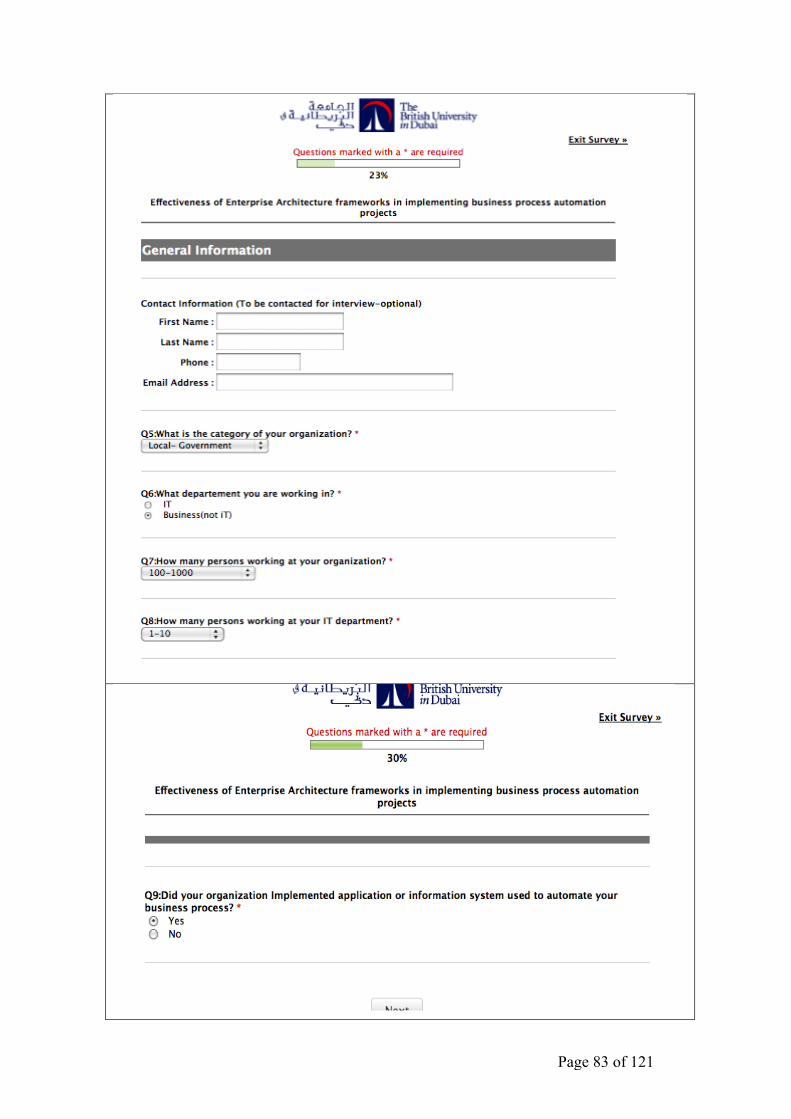
Page 83 of 121
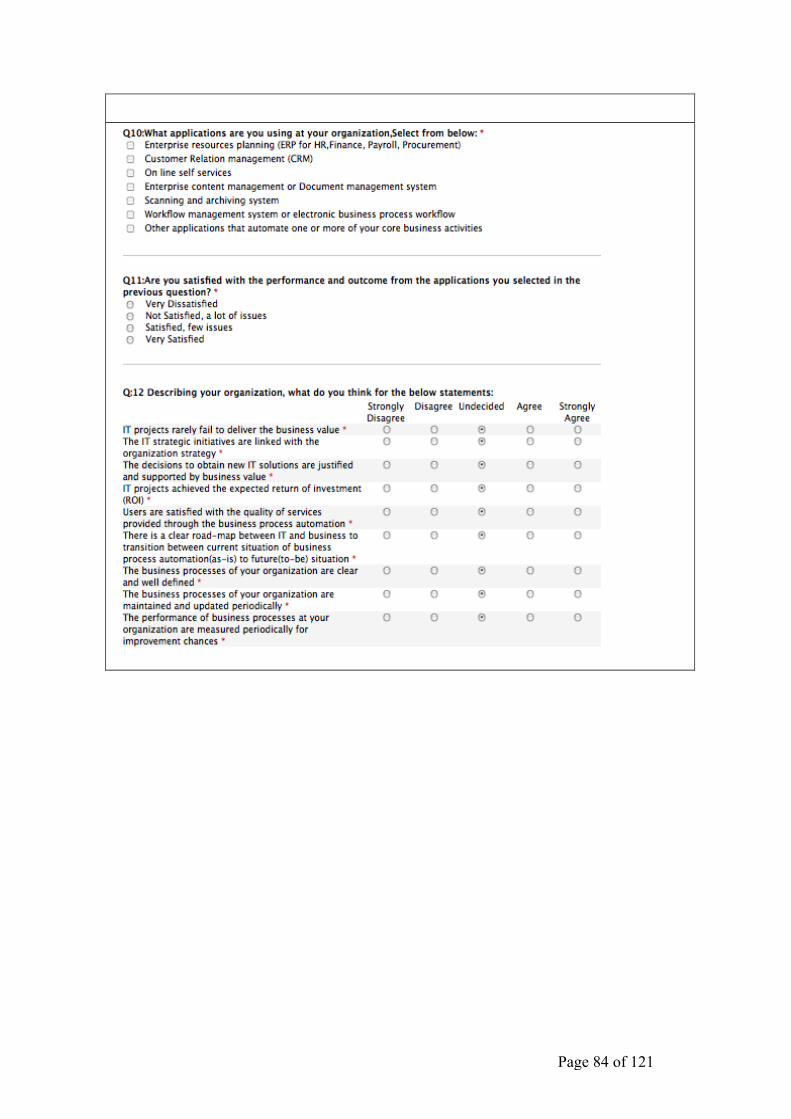
Page 84 of 121
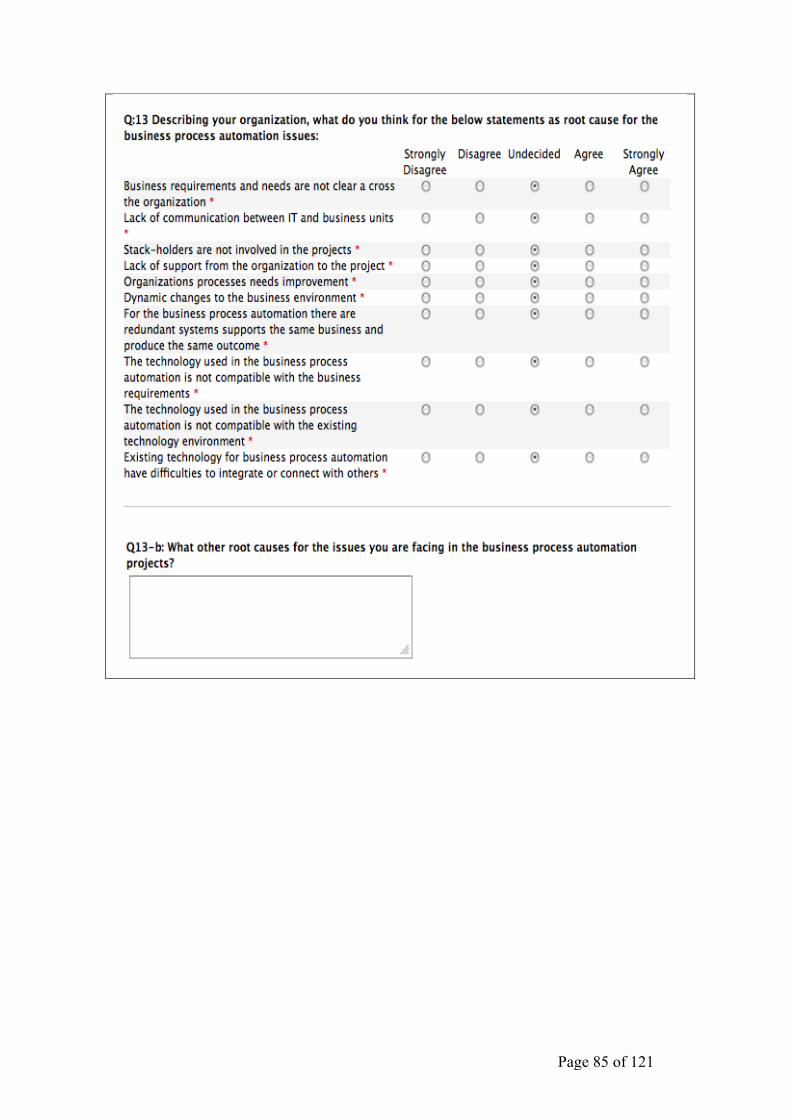
Page 85 of 121
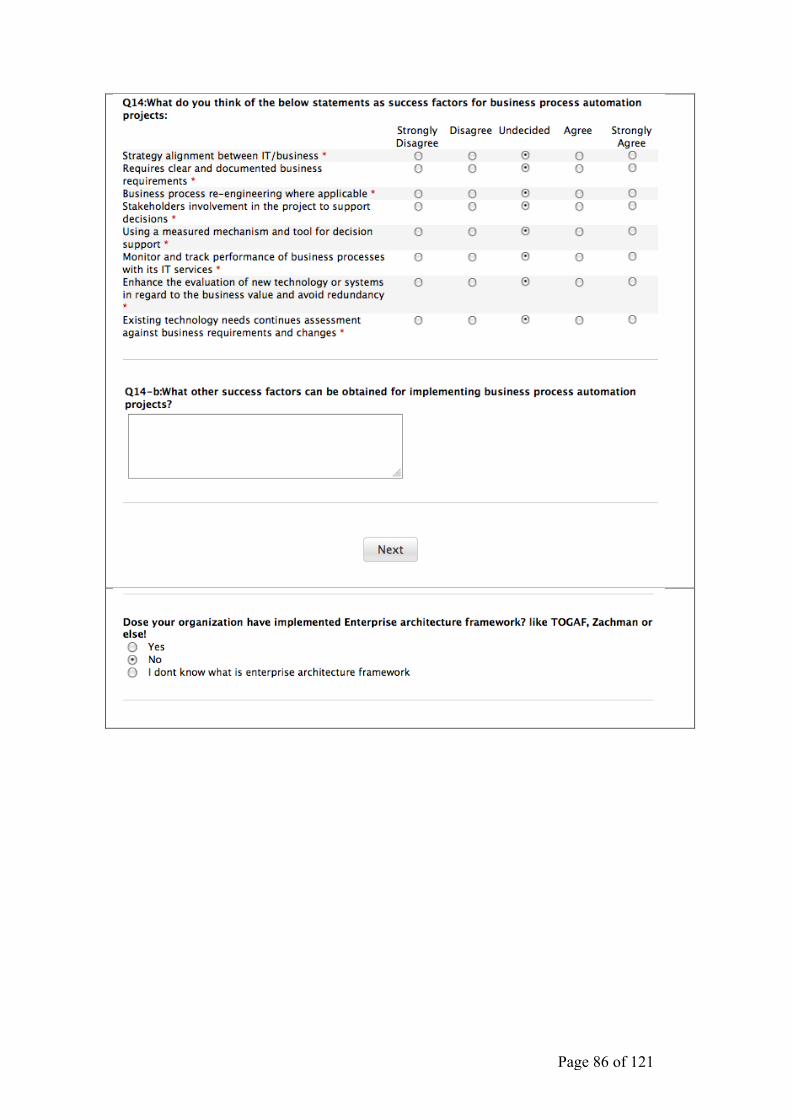
Page 86 of 121
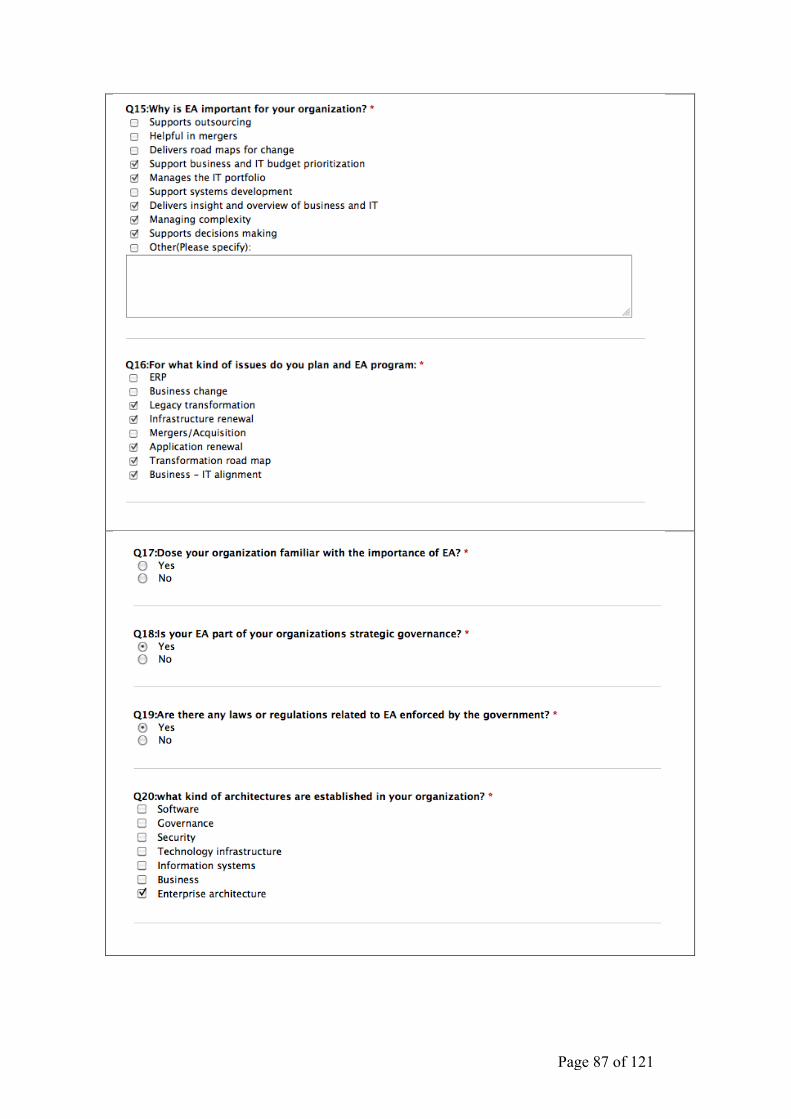
Page 87 of 121
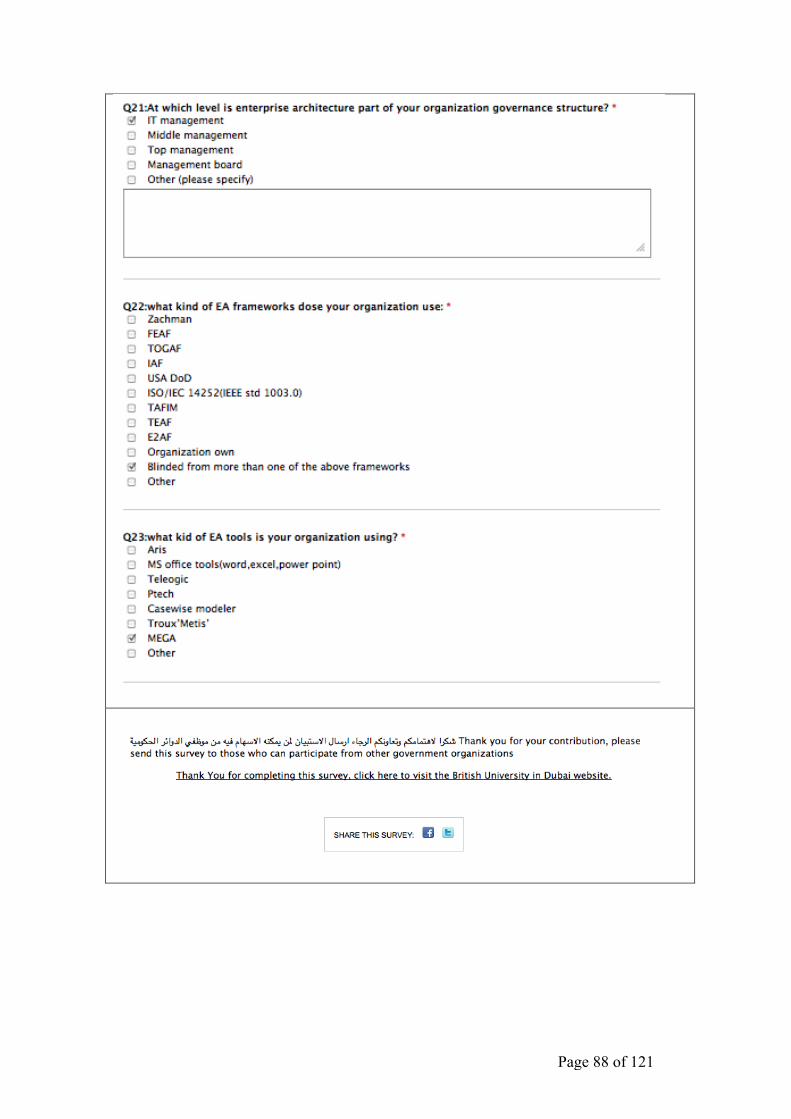
Page 88 of 121
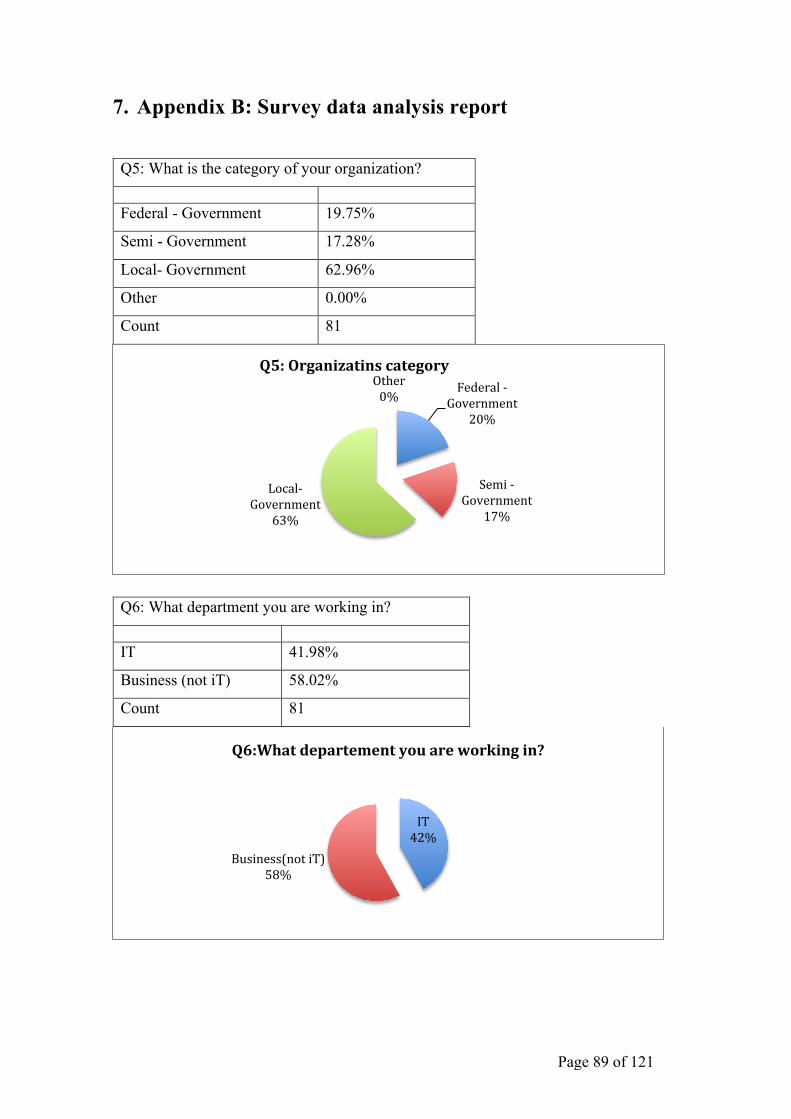
Page 89 of 121
7. Appendix B: Survey data analysis report
Q5: What is the category of your organization?
Federal - Government 19.75%
Semi - Government 17.28%
Local- Government 62.96%
Other 0.00%
Count 81
Q6: What department you are working in?
IT 41.98%
Business (not iT) 58.02%
Count 81
Federal -‐ Government
20%
Semi -‐ Government
17%
Local-‐ Government
63%
Other 0%
Q5: Organizatins category
IT 42%
Business(not iT) 58%
Q6:What departement you are working in?
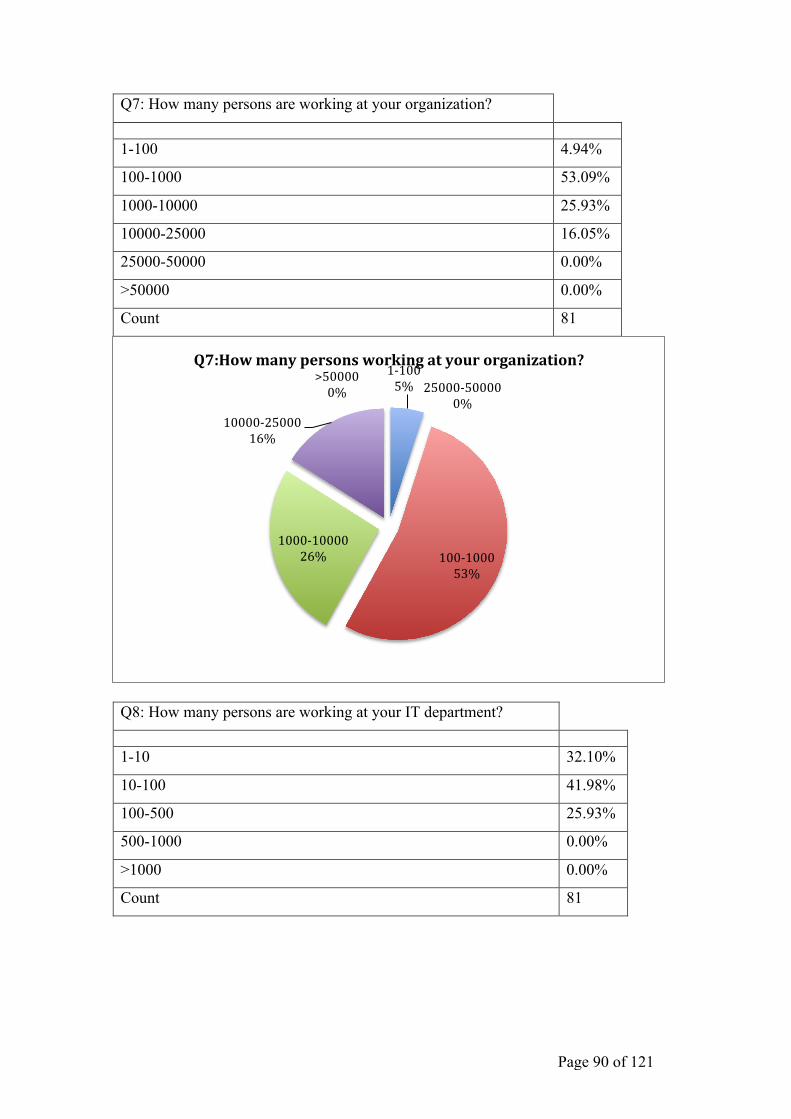
Page 90 of 121
Q7: How many persons are working at your organization?
1-100 4.94%
100-1000 53.09%
1000-10000 25.93%
10000-25000 16.05%
25000-50000 0.00%
>50000 0.00%
Count 81
Q8: How many persons are working at your IT department?
1-10 32.10%
10-100 41.98%
100-500 25.93%
500-1000 0.00%
>1000 0.00%
Count 81
1-‐100 5%
100-‐1000 53%
1000-‐10000 26%
10000-‐25000 16%
25000-‐50000 0%
>50000 0%
Q7:How many persons working at your organization?
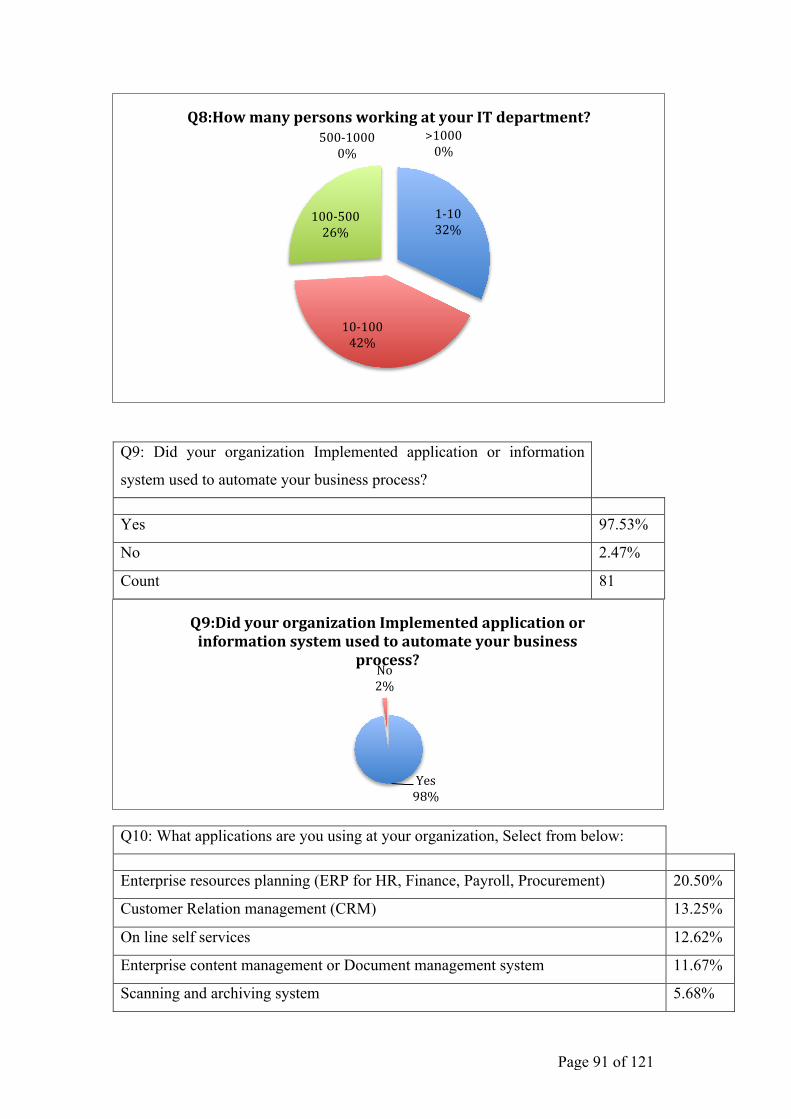
Page 91 of 121
Q9: Did your organization Implemented application or information
system used to automate your business process?
Yes 97.53%
No 2.47%
Count 81
Q10: What applications are you using at your organization, Select from below:
Enterprise resources planning (ERP for HR, Finance, Payroll, Procurement) 20.50%
Customer Relation management (CRM) 13.25%
On line self services 12.62%
Enterprise content management or Document management system 11.67%
Scanning and archiving system 5.68%
1-‐10 32%
10-‐100 42%
100-‐500 26%
500-‐1000 0%
>1000 0%
Q8:How many persons working at your IT department?
Yes 98%
No 2%
Q9:Did your organization Implemented application or information system used to automate your business
process?
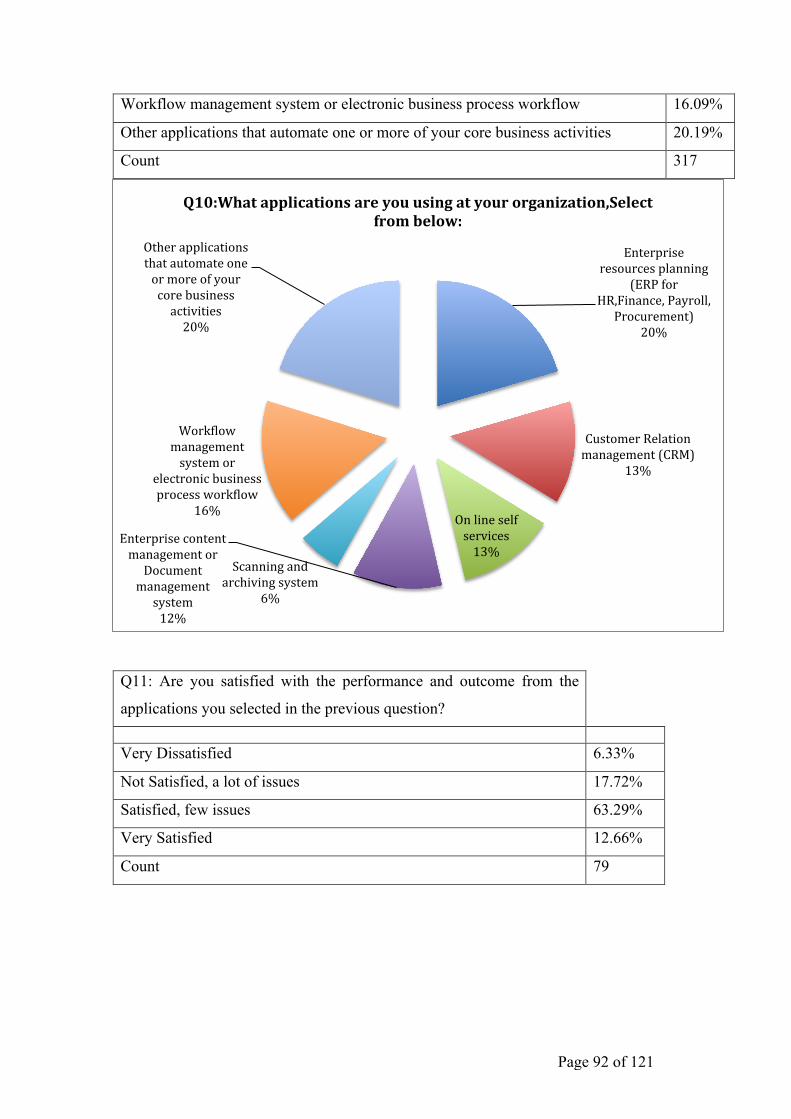
Page 92 of 121
Workflow management system or electronic business process workflow 16.09%
Other applications that automate one or more of your core business activities 20.19%
Count 317
Q11: Are you satisfied with the performance and outcome from the
applications you selected in the previous question?
Very Dissatisfied 6.33%
Not Satisfied, a lot of issues 17.72%
Satisfied, few issues 63.29%
Very Satisfied 12.66%
Count 79
Enterprise resources planning
(ERP for HR,Finance, Payroll, Procurement)
20%
Customer Relation management (CRM)
13%
On line self services 13%
Enterprise content management or Document management system 12%
Scanning and archiving system
6%
Work`low management system or
electronic business process work`low
16%
Other applications that automate one or more of your core business activities 20%
Q10:What applications are you using at your organization,Select from below:

Page 93 of 121
Q12: Describing your organization, what do you think for the below statements:
IT projects rarely fail to deliver the business value
Strongly Disagree 1.27%
Disagree 25.32%
Undecided 7.59%
Agree 65.82%
Strongly Agree 0.00%
Count 79
Mean 3.38
Very Dissatis`ied 6% Not Satis`ied, a lot
of issues 18%
Satis`ied, few issues 63%
Very Satis`ied 13%
Q11:Are you satisKied with the performance and outcome from the applications you selected in the previous
question?
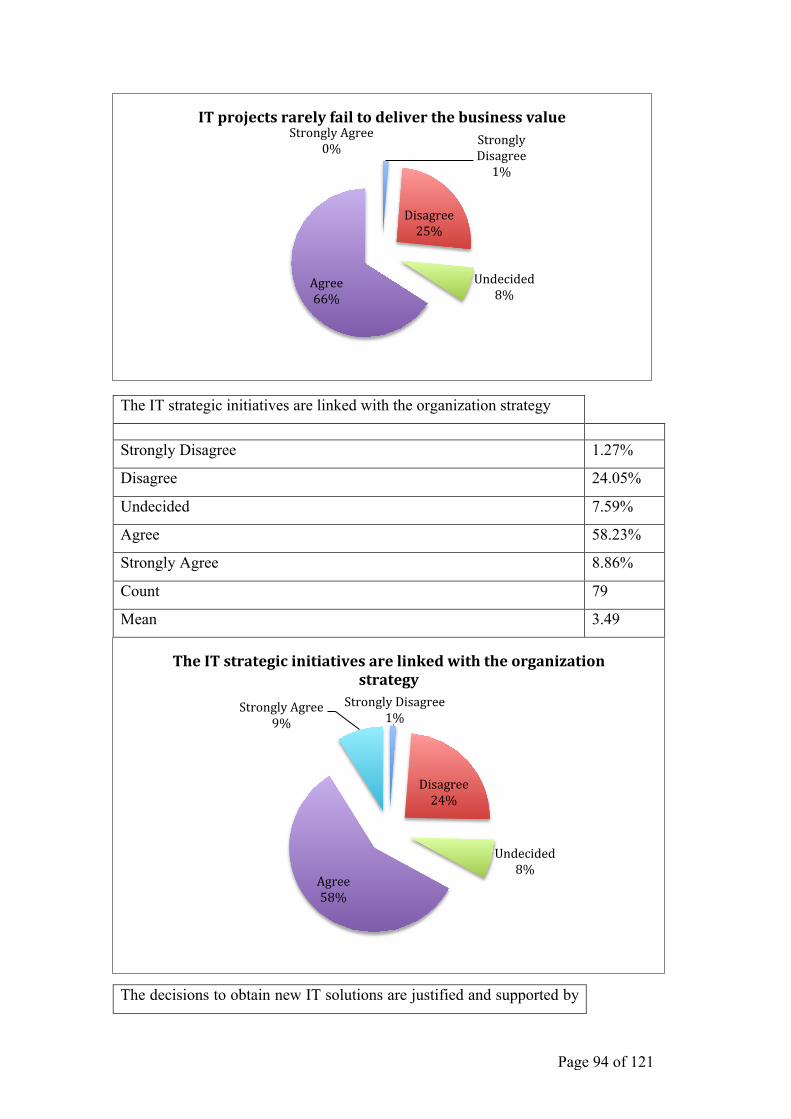
Page 94 of 121
The IT strategic initiatives are linked with the organization strategy
Strongly Disagree 1.27%
Disagree 24.05%
Undecided 7.59%
Agree 58.23%
Strongly Agree 8.86%
Count 79
Mean 3.49
The decisions to obtain new IT solutions are justified and supported by
Strongly Disagree 1%
Disagree 25%
Undecided 8%
Agree 66%
Strongly Agree 0%
IT projects rarely fail to deliver the business value
Strongly Disagree 1%
Disagree 24%
Undecided 8%
Agree 58%
Strongly Agree 9%
The IT strategic initiatives are linked with the organization strategy
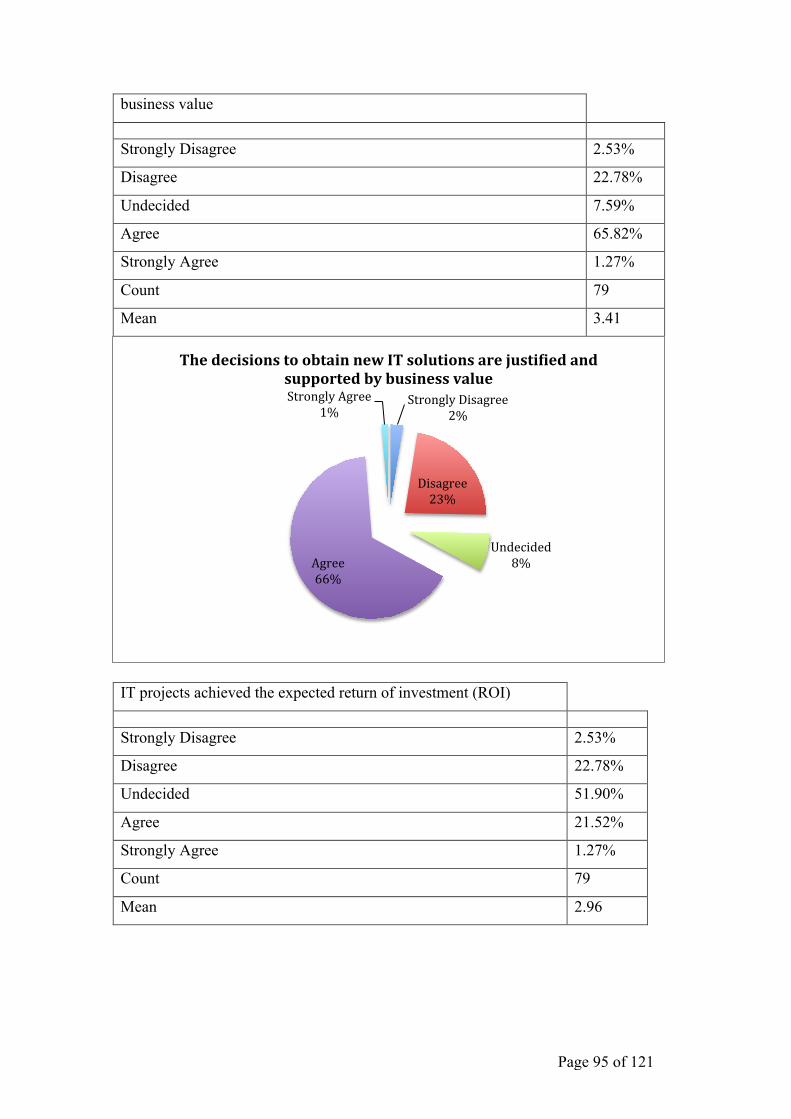
Page 95 of 121
business value
Strongly Disagree 2.53%
Disagree 22.78%
Undecided 7.59%
Agree 65.82%
Strongly Agree 1.27%
Count 79
Mean 3.41
IT projects achieved the expected return of investment (ROI)
Strongly Disagree 2.53%
Disagree 22.78%
Undecided 51.90%
Agree 21.52%
Strongly Agree 1.27%
Count 79
Mean 2.96
Strongly Disagree 2%
Disagree 23%
Undecided 8% Agree
66%
Strongly Agree 1%
The decisions to obtain new IT solutions are justiKied and supported by business value
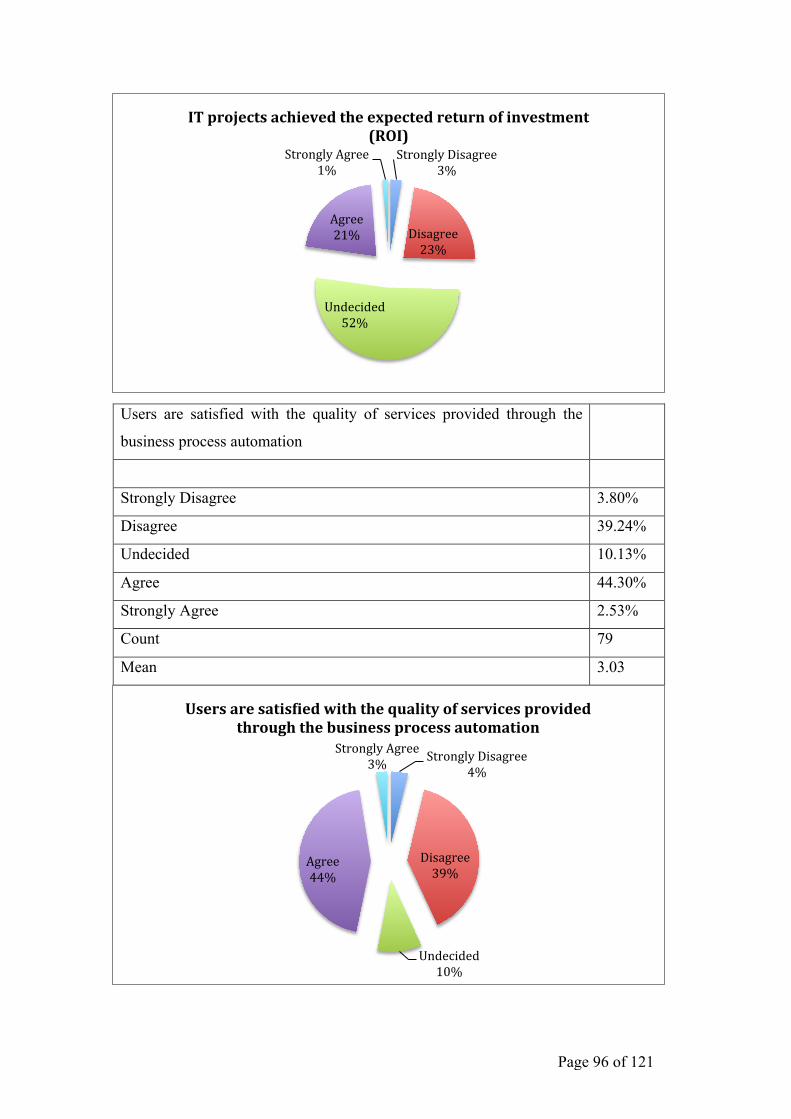
Page 96 of 121
Users are satisfied with the quality of services provided through the
business process automation
Strongly Disagree 3.80%
Disagree 39.24%
Undecided 10.13%
Agree 44.30%
Strongly Agree 2.53%
Count 79
Mean 3.03
Strongly Disagree 3%
Disagree 23%
Undecided 52%
Agree 21%
Strongly Agree 1%
IT projects achieved the expected return of investment (ROI)
Strongly Disagree 4%
Disagree 39%
Undecided 10%
Agree 44%
Strongly Agree 3%
Users are satisKied with the quality of services provided through the business process automation
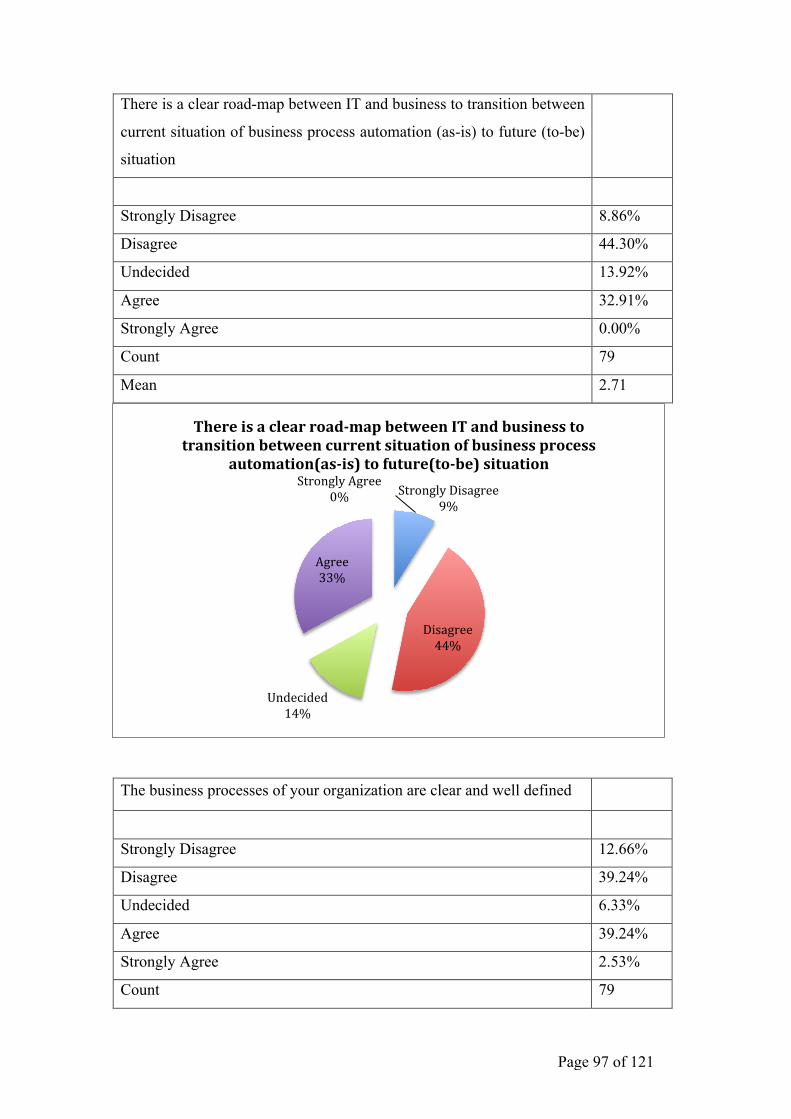
Page 97 of 121
There is a clear road-map between IT and business to transition between
current situation of business process automation (as-is) to future (to-be)
situation
Strongly Disagree 8.86%
Disagree 44.30%
Undecided 13.92%
Agree 32.91%
Strongly Agree 0.00%
Count 79
Mean 2.71
The business processes of your organization are clear and well defined
Strongly Disagree 12.66%
Disagree 39.24%
Undecided 6.33%
Agree 39.24%
Strongly Agree 2.53%
Count 79
Strongly Disagree 9%
Disagree 44%
Undecided 14%
Agree 33%
Strongly Agree 0%
There is a clear road-‐map between IT and business to transition between current situation of business process
automation(as-‐is) to future(to-‐be) situation
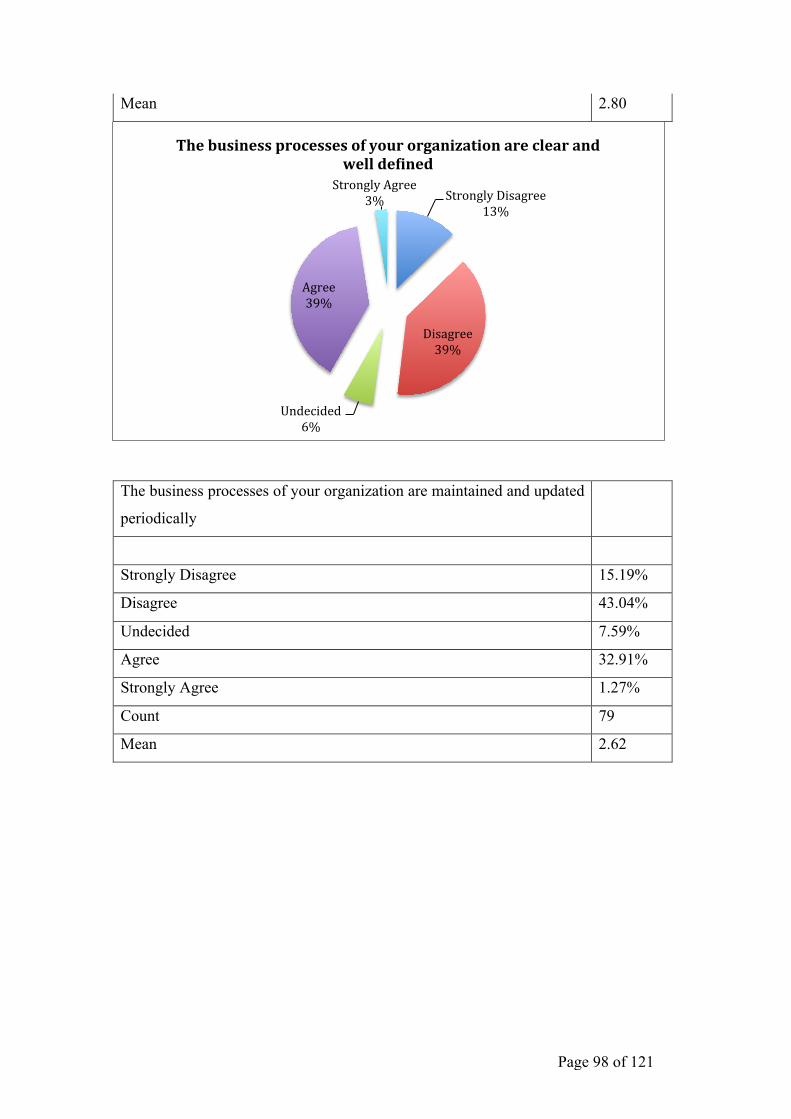
Page 98 of 121
Mean 2.80
The business processes of your organization are maintained and updated
periodically
Strongly Disagree 15.19%
Disagree 43.04%
Undecided 7.59%
Agree 32.91%
Strongly Agree 1.27%
Count 79
Mean 2.62
Strongly Disagree 13%
Disagree 39%
Undecided 6%
Agree 39%
Strongly Agree 3%
The business processes of your organization are clear and well deKined
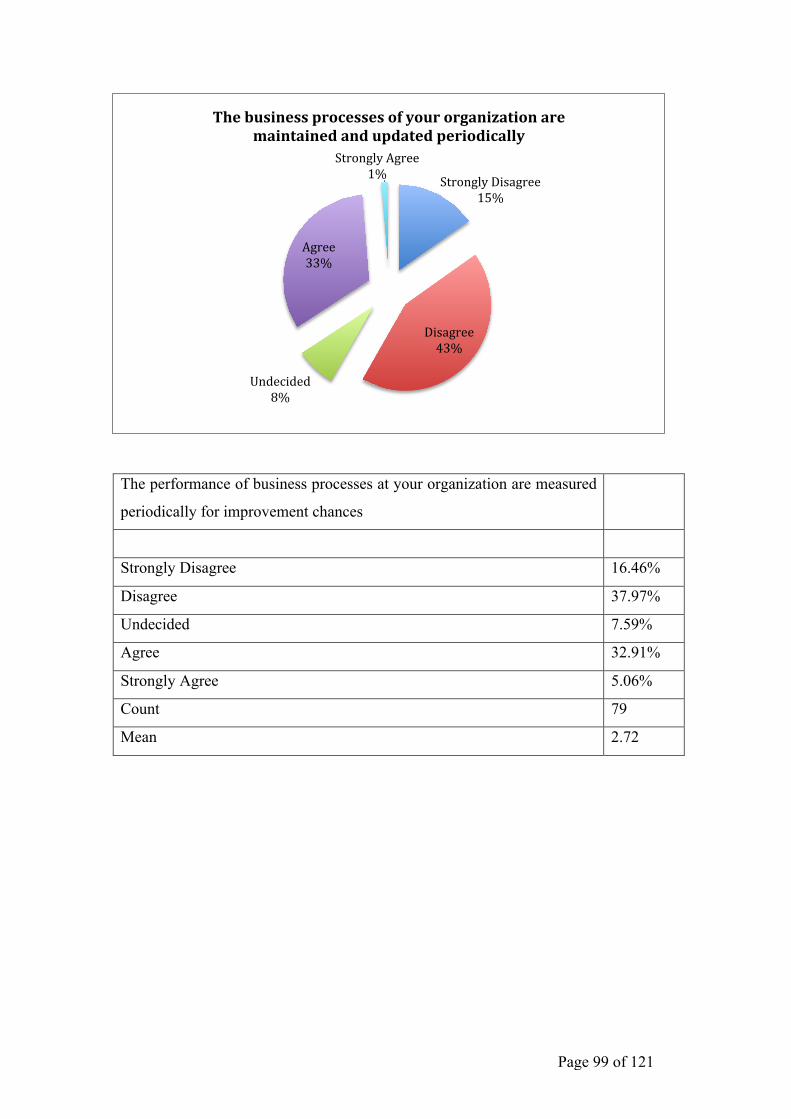
Page 99 of 121
The performance of business processes at your organization are measured
periodically for improvement chances
Strongly Disagree 16.46%
Disagree 37.97%
Undecided 7.59%
Agree 32.91%
Strongly Agree 5.06%
Count 79
Mean 2.72
Strongly Disagree 15%
Disagree 43%
Undecided 8%
Agree 33%
Strongly Agree 1%
The business processes of your organization are maintained and updated periodically
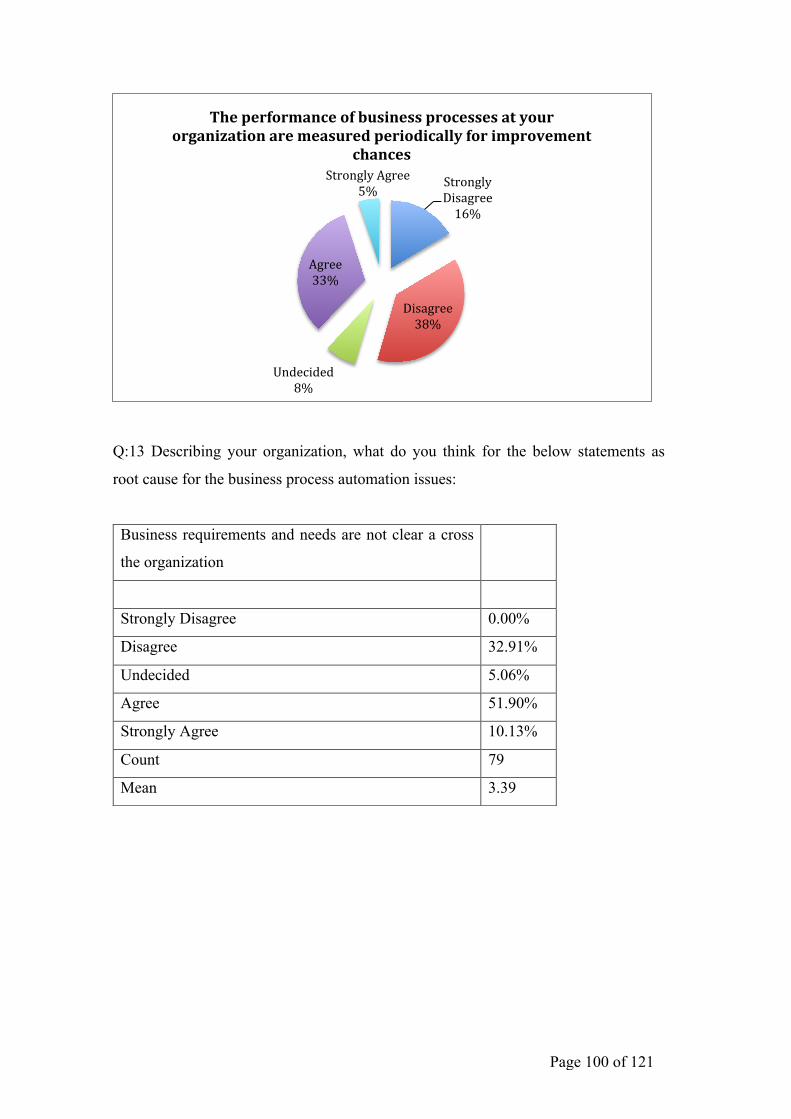
Page 100 of 121
Q:13 Describing your organization, what do you think for the below statements as
root cause for the business process automation issues:
Business requirements and needs are not clear a cross
the organization
Strongly Disagree 0.00%
Disagree 32.91%
Undecided 5.06%
Agree 51.90%
Strongly Agree 10.13%
Count 79
Mean 3.39
Strongly Disagree 16%
Disagree 38%
Undecided 8%
Agree 33%
Strongly Agree 5%
The performance of business processes at your organization are measured periodically for improvement
chances
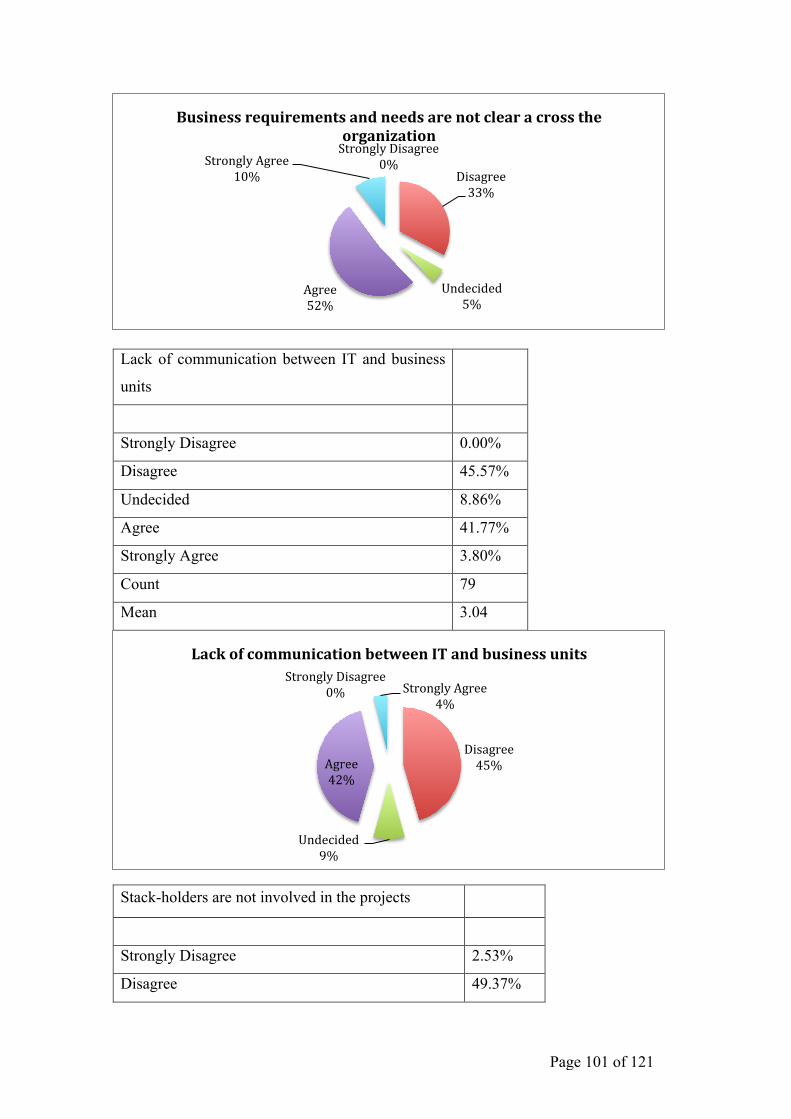
Page 101 of 121
Lack of communication between IT and business
units
Strongly Disagree 0.00%
Disagree 45.57%
Undecided 8.86%
Agree 41.77%
Strongly Agree 3.80%
Count 79
Mean 3.04
Stack-holders are not involved in the projects
Strongly Disagree 2.53%
Disagree 49.37%
Strongly Disagree 0%
Disagree 33%
Undecided 5%
Agree 52%
Strongly Agree 10%
Business requirements and needs are not clear a cross the organization
Strongly Disagree 0%
Disagree 45%
Undecided 9%
Agree 42%
Strongly Agree 4%
Lack of communication between IT and business units
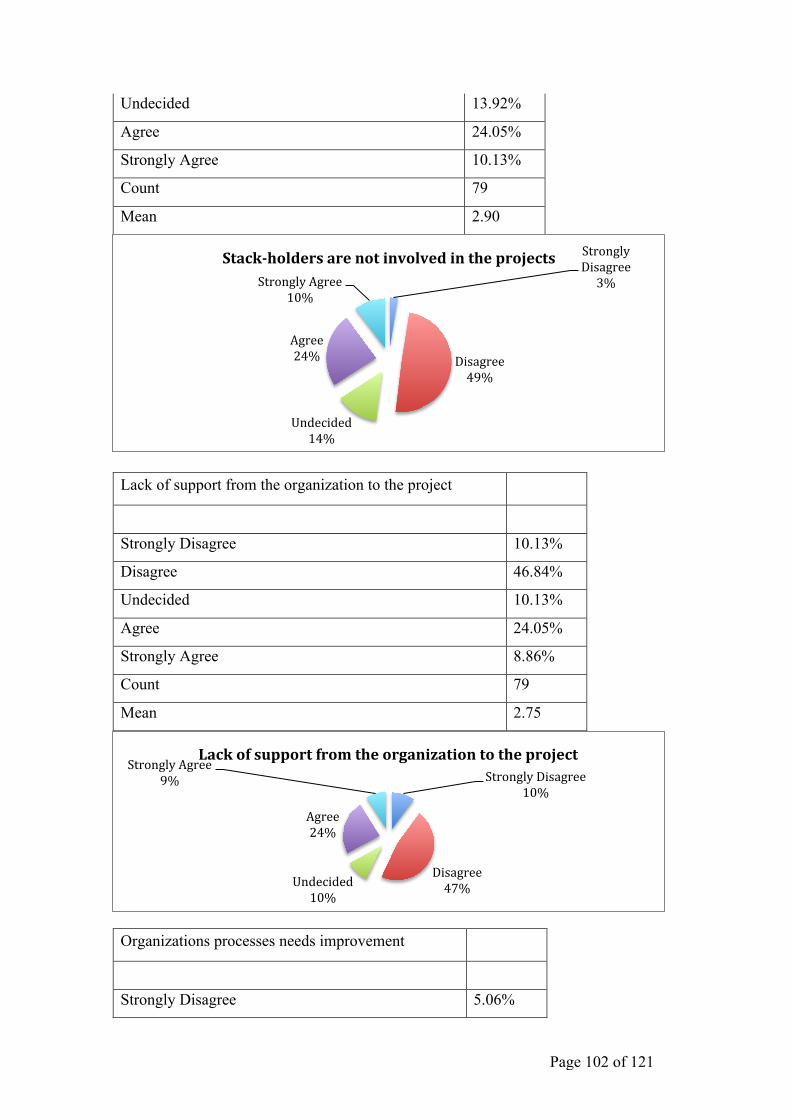
Page 102 of 121
Undecided 13.92%
Agree 24.05%
Strongly Agree 10.13%
Count 79
Mean 2.90
Lack of support from the organization to the project
Strongly Disagree 10.13%
Disagree 46.84%
Undecided 10.13%
Agree 24.05%
Strongly Agree 8.86%
Count 79
Mean 2.75
Organizations processes needs improvement
Strongly Disagree 5.06%
Strongly Disagree 3%
Disagree 49%
Undecided 14%
Agree 24%
Strongly Agree 10%
Stack-‐holders are not involved in the projects
Strongly Disagree 10%
Disagree 47% Undecided
10%
Agree 24%
Strongly Agree 9%
Lack of support from the organization to the project
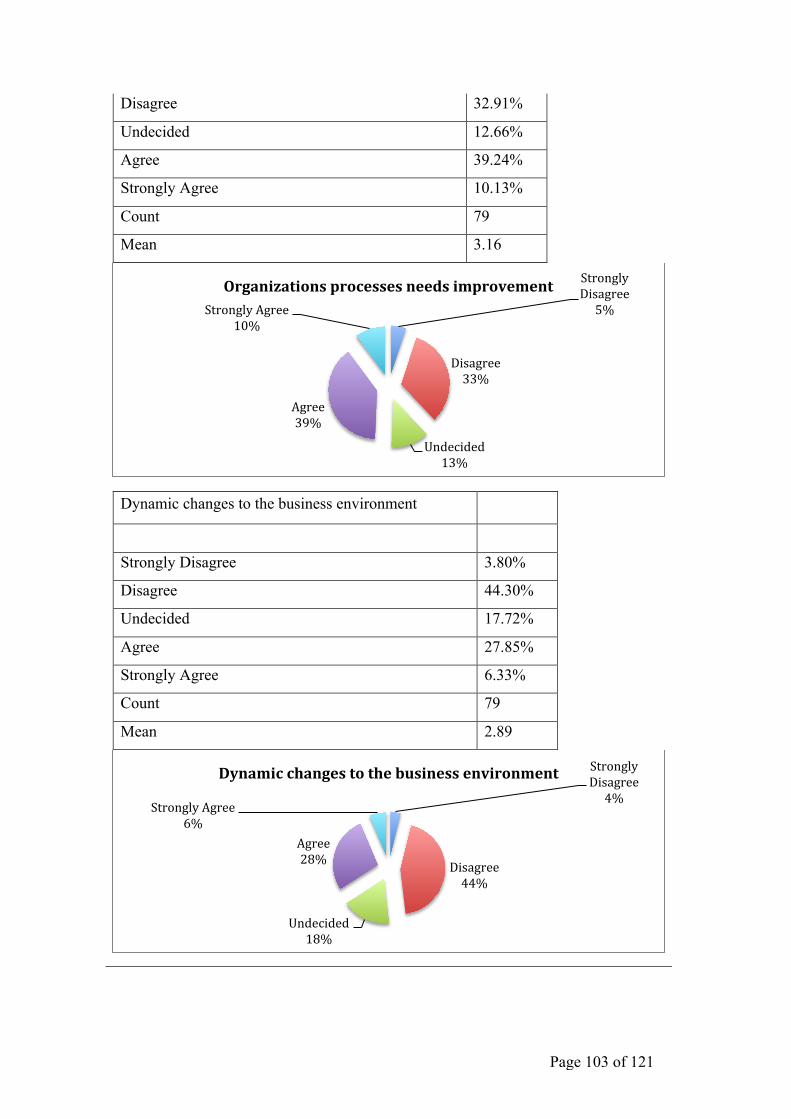
Page 103 of 121
Disagree 32.91%
Undecided 12.66%
Agree 39.24%
Strongly Agree 10.13%
Count 79
Mean 3.16
Dynamic changes to the business environment
Strongly Disagree 3.80%
Disagree 44.30%
Undecided 17.72%
Agree 27.85%
Strongly Agree 6.33%
Count 79
Mean 2.89
Strongly Disagree 5%
Disagree 33%
Undecided 13%
Agree 39%
Strongly Agree 10%
Organizations processes needs improvement
Strongly Disagree 4%
Disagree 44%
Undecided 18%
Agree 28%
Strongly Agree 6%
Dynamic changes to the business environment
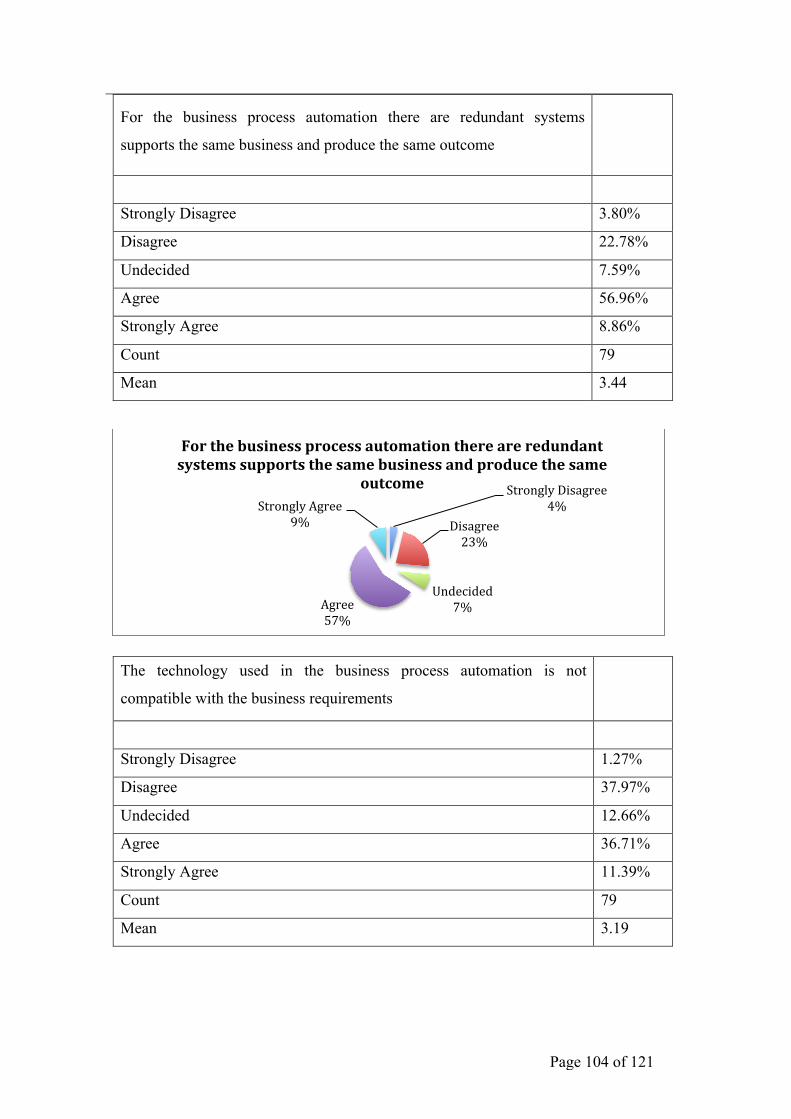
Page 104 of 121
For the business process automation there are redundant systems
supports the same business and produce the same outcome
Strongly Disagree 3.80%
Disagree 22.78%
Undecided 7.59%
Agree 56.96%
Strongly Agree 8.86%
Count 79
Mean 3.44
The technology used in the business process automation is not
compatible with the business requirements
Strongly Disagree 1.27%
Disagree 37.97%
Undecided 12.66%
Agree 36.71%
Strongly Agree 11.39%
Count 79
Mean 3.19
Strongly Disagree 4%
Disagree 23%
Undecided 7% Agree
57%
Strongly Agree 9%
For the business process automation there are redundant systems supports the same business and produce the same
outcome
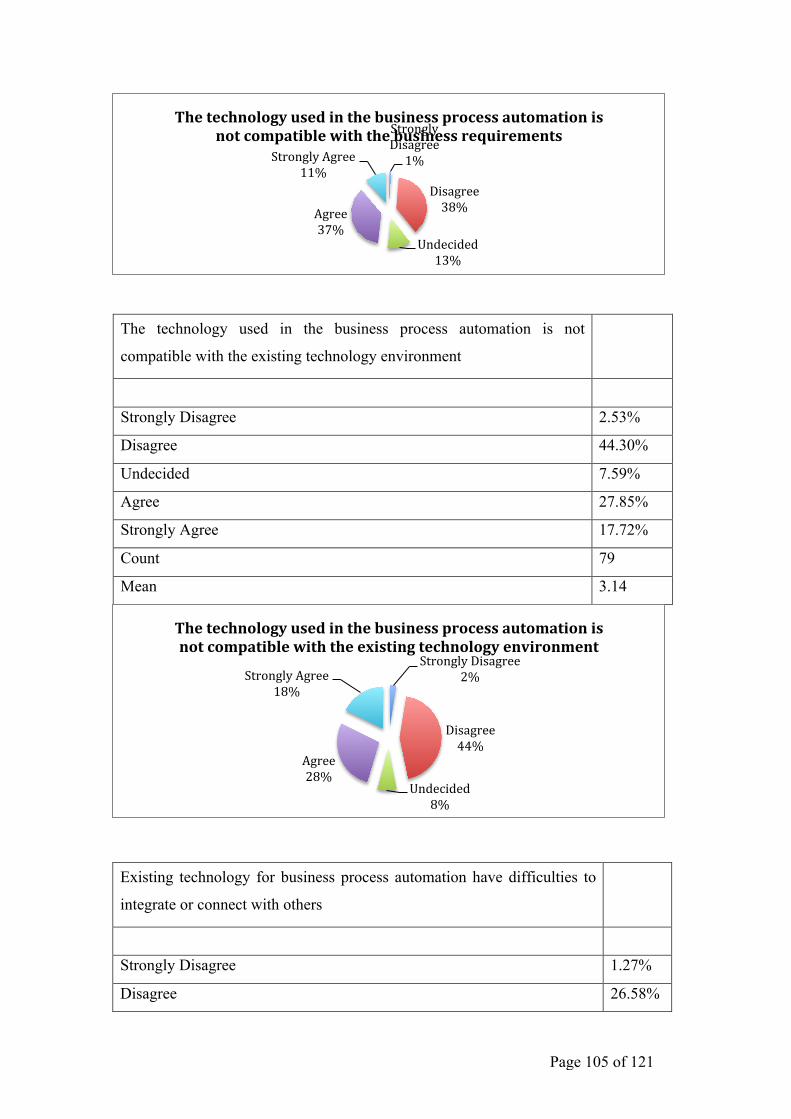
Page 105 of 121
The technology used in the business process automation is not
compatible with the existing technology environment
Strongly Disagree 2.53%
Disagree 44.30%
Undecided 7.59%
Agree 27.85%
Strongly Agree 17.72%
Count 79
Mean 3.14
Existing technology for business process automation have difficulties to
integrate or connect with others
Strongly Disagree 1.27%
Disagree 26.58%
Strongly Disagree 1%
Disagree 38%
Undecided 13%
Agree 37%
Strongly Agree 11%
The technology used in the business process automation is not compatible with the business requirements
Strongly Disagree 2%
Disagree 44%
Undecided 8%
Agree 28%
Strongly Agree 18%
The technology used in the business process automation is not compatible with the existing technology environment
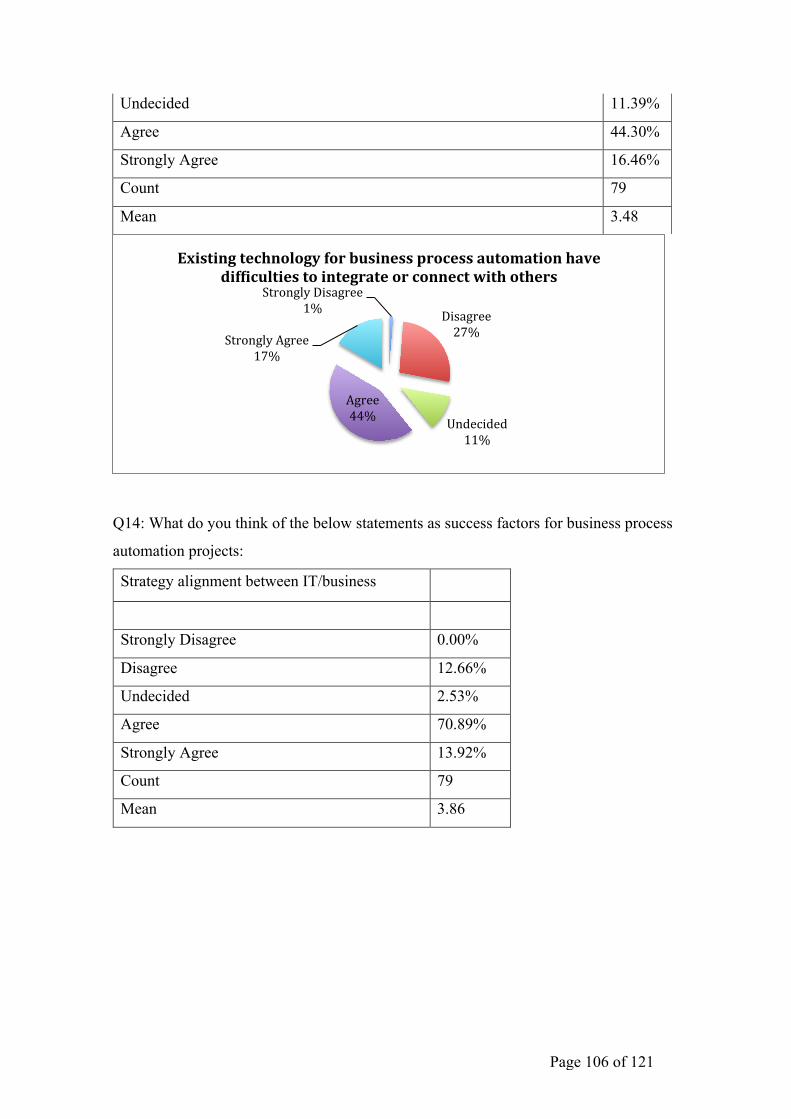
Page 106 of 121
Undecided 11.39%
Agree 44.30%
Strongly Agree 16.46%
Count 79
Mean 3.48
Q14: What do you think of the below statements as success factors for business process
automation projects:
Strategy alignment between IT/business
Strongly Disagree 0.00%
Disagree 12.66%
Undecided 2.53%
Agree 70.89%
Strongly Agree 13.92%
Count 79
Mean 3.86
Strongly Disagree 1% Disagree
27%
Undecided 11%
Agree 44%
Strongly Agree 17%
Existing technology for business process automation have difKiculties to integrate or connect with others
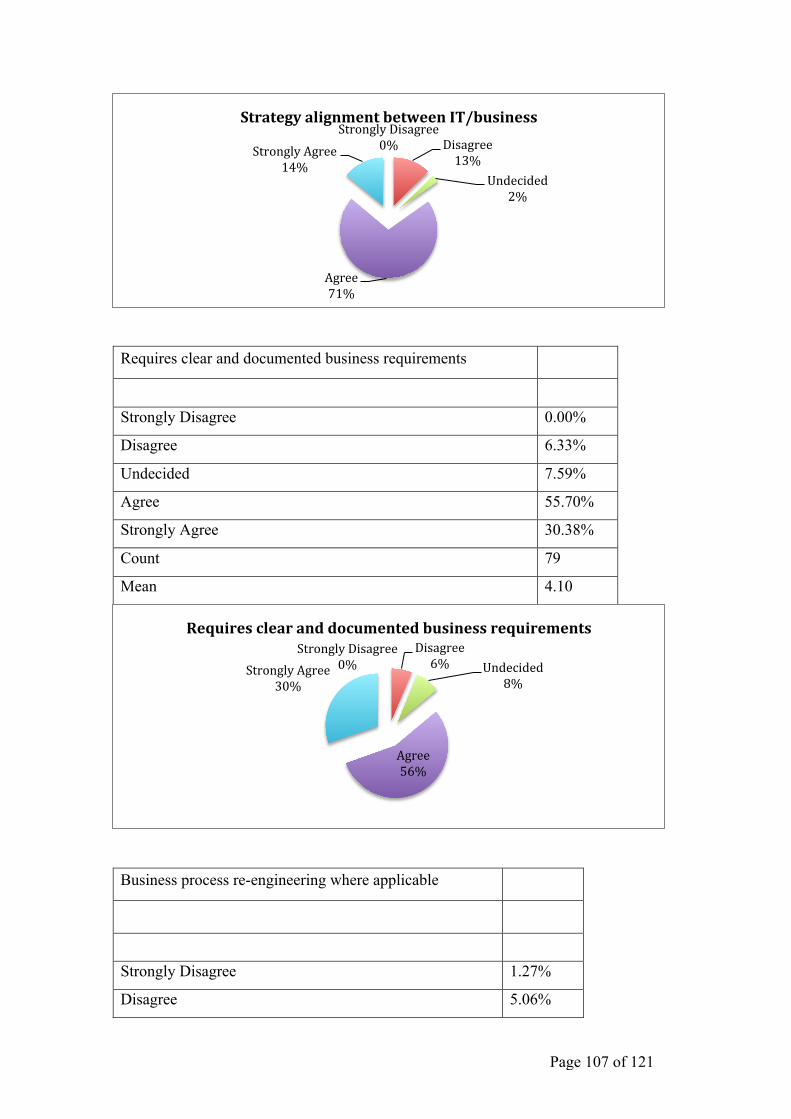
Page 107 of 121
Requires clear and documented business requirements
Strongly Disagree 0.00%
Disagree 6.33%
Undecided 7.59%
Agree 55.70%
Strongly Agree 30.38%
Count 79
Mean 4.10
Business process re-engineering where applicable
Strongly Disagree 1.27%
Disagree 5.06%
Strongly Disagree 0% Disagree
13% Undecided
2%
Agree 71%
Strongly Agree 14%
Strategy alignment between IT/business
Strongly Disagree 0%
Disagree 6% Undecided
8%
Agree 56%
Strongly Agree 30%
Requires clear and documented business requirements
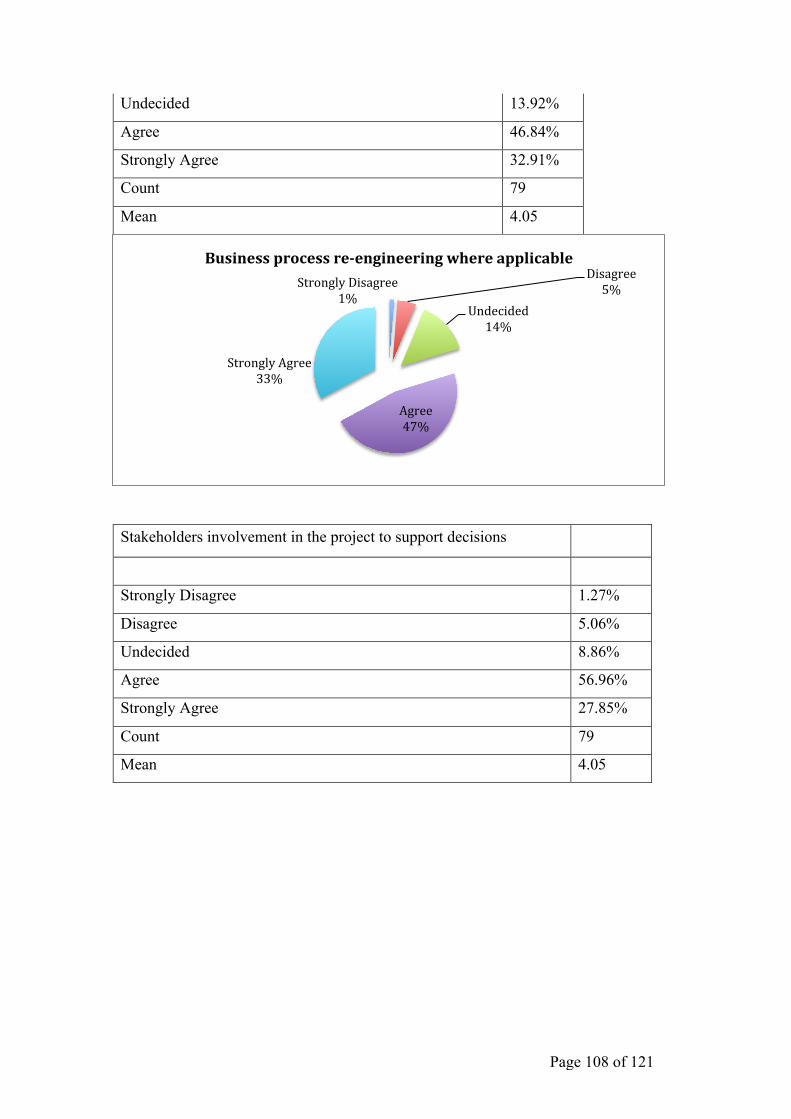
Page 108 of 121
Undecided 13.92%
Agree 46.84%
Strongly Agree 32.91%
Count 79
Mean 4.05
Stakeholders involvement in the project to support decisions
Strongly Disagree 1.27%
Disagree 5.06%
Undecided 8.86%
Agree 56.96%
Strongly Agree 27.85%
Count 79
Mean 4.05
Strongly Disagree 1%
Disagree 5%
Undecided 14%
Agree 47%
Strongly Agree 33%
Business process re-‐engineering where applicable
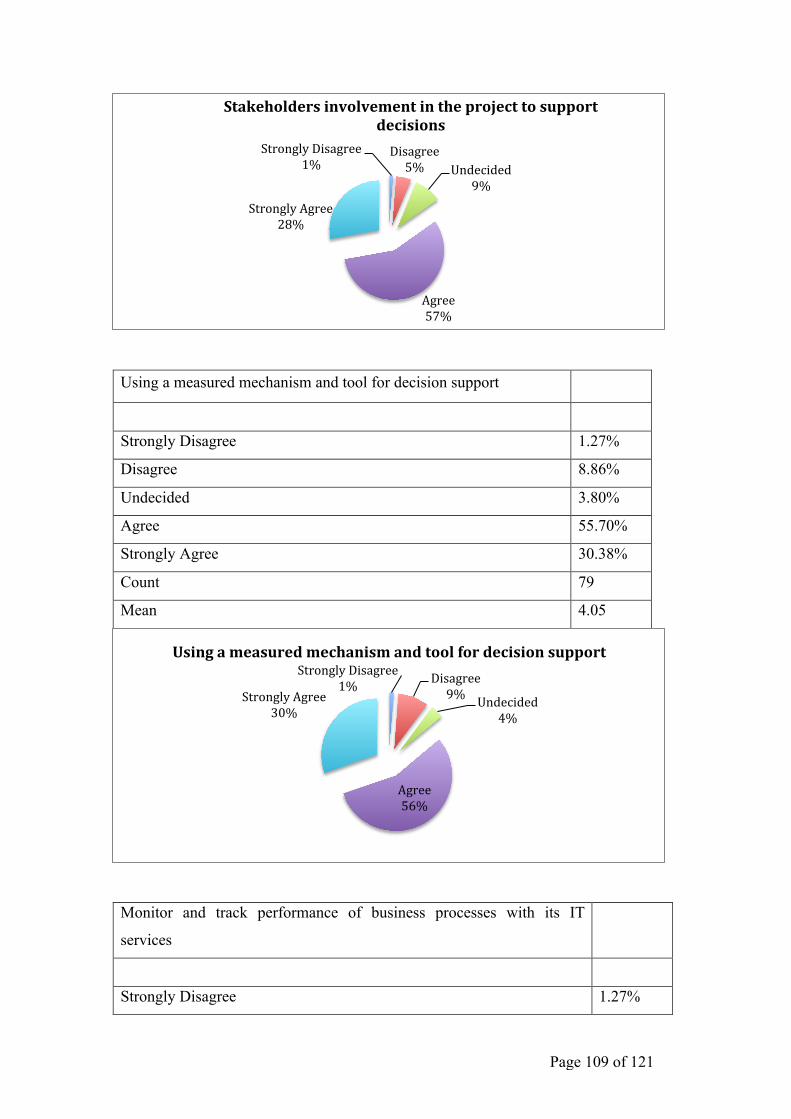
Page 109 of 121
Using a measured mechanism and tool for decision support
Strongly Disagree 1.27%
Disagree 8.86%
Undecided 3.80%
Agree 55.70%
Strongly Agree 30.38%
Count 79
Mean 4.05
Monitor and track performance of business processes with its IT
services
Strongly Disagree 1.27%
Strongly Disagree 1%
Disagree 5% Undecided
9%
Agree 57%
Strongly Agree 28%
Stakeholders involvement in the project to support decisions
Strongly Disagree 1% Disagree
9% Undecided 4%
Agree 56%
Strongly Agree 30%
Using a measured mechanism and tool for decision support
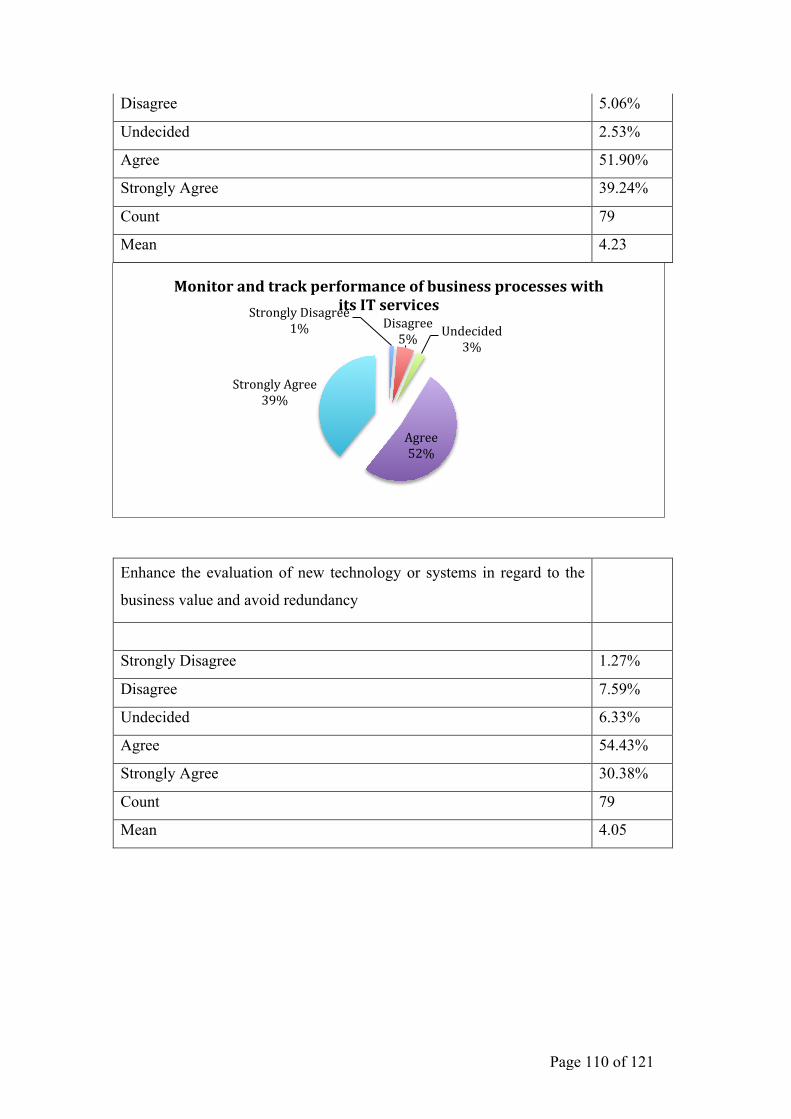
Page 110 of 121
Disagree 5.06%
Undecided 2.53%
Agree 51.90%
Strongly Agree 39.24%
Count 79
Mean 4.23
Enhance the evaluation of new technology or systems in regard to the
business value and avoid redundancy
Strongly Disagree 1.27%
Disagree 7.59%
Undecided 6.33%
Agree 54.43%
Strongly Agree 30.38%
Count 79
Mean 4.05
Strongly Disagree 1% Disagree
5% Undecided 3%
Agree 52%
Strongly Agree 39%
Monitor and track performance of business processes with its IT services
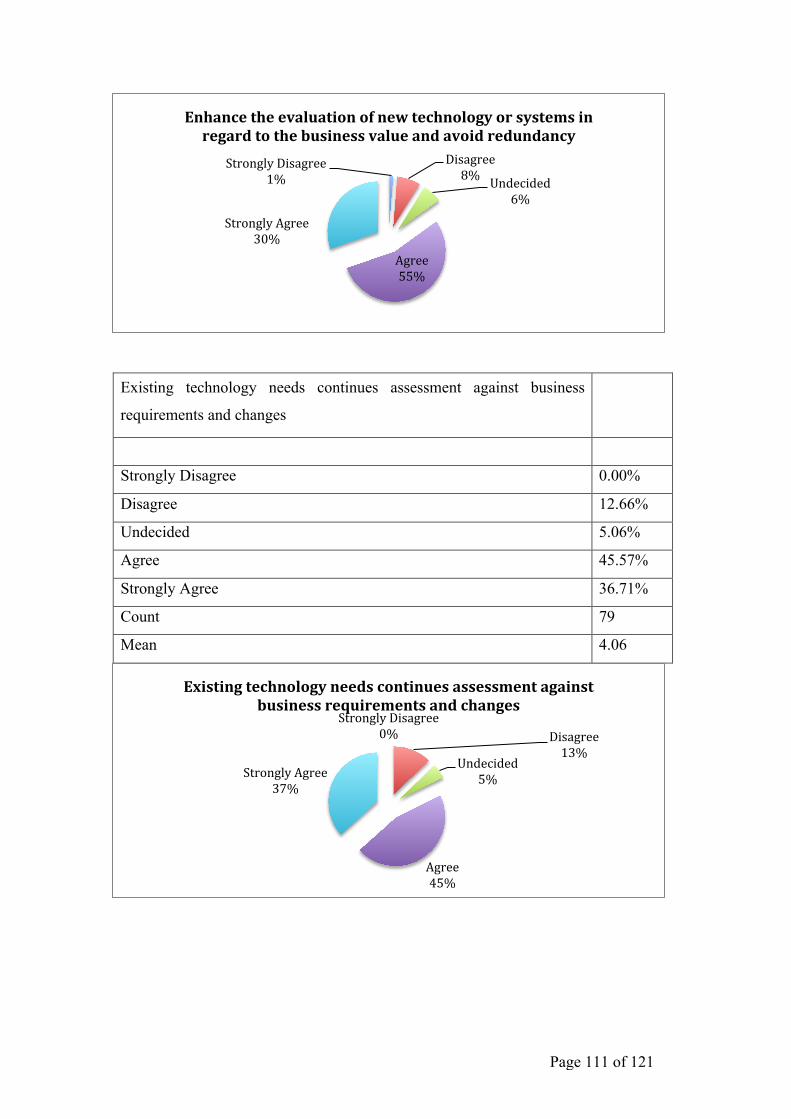
Page 111 of 121
Existing technology needs continues assessment against business
requirements and changes
Strongly Disagree 0.00%
Disagree 12.66%
Undecided 5.06%
Agree 45.57%
Strongly Agree 36.71%
Count 79
Mean 4.06
Strongly Disagree 1%
Disagree 8% Undecided
6%
Agree 55%
Strongly Agree 30%
Enhance the evaluation of new technology or systems in regard to the business value and avoid redundancy
Strongly Disagree 0% Disagree
13% Undecided
5%
Agree 45%
Strongly Agree 37%
Existing technology needs continues assessment against business requirements and changes
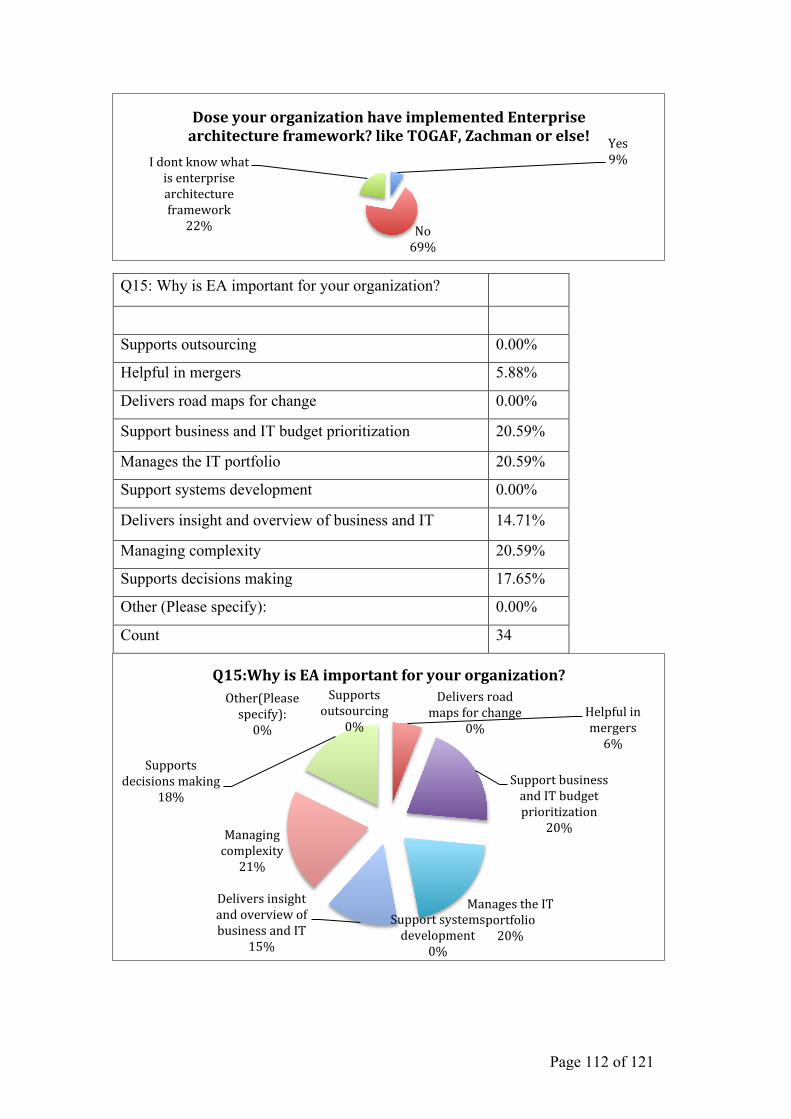
Page 112 of 121
Q15: Why is EA important for your organization?
Supports outsourcing 0.00%
Helpful in mergers 5.88%
Delivers road maps for change 0.00%
Support business and IT budget prioritization 20.59%
Manages the IT portfolio 20.59%
Support systems development 0.00%
Delivers insight and overview of business and IT 14.71%
Managing complexity 20.59%
Supports decisions making 17.65%
Other (Please specify): 0.00%
Count 34
Yes 9%
No 69%
I dont know what is enterprise architecture framework
22%
Dose your organization have implemented Enterprise architecture framework? like TOGAF, Zachman or else!
Supports outsourcing
0% Helpful in mergers 6%
Delivers road maps for change
0%
Support business and IT budget prioritization
20%
Manages the IT portfolio 20%
Support systems development
0%
Delivers insight and overview of business and IT
15%
Managing complexity
21%
Supports decisions making
18%
Other(Please specify): 0%
Q15:Why is EA important for your organization?
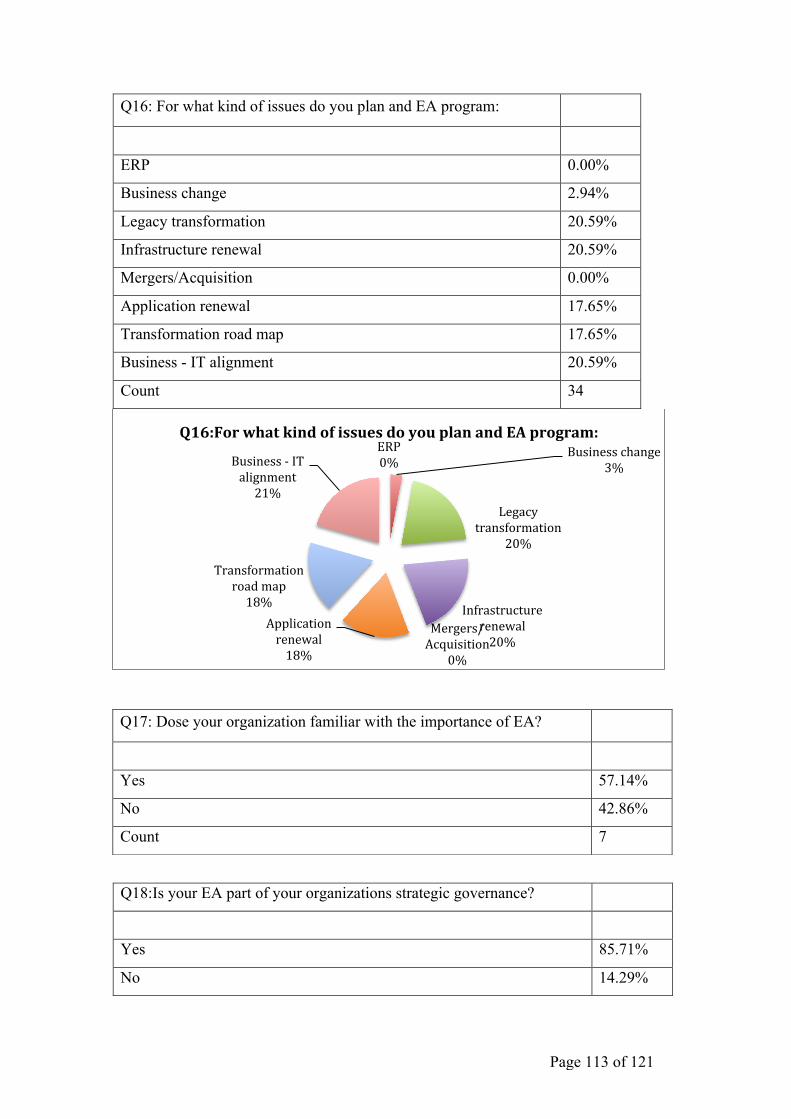
Page 113 of 121
Q16: For what kind of issues do you plan and EA program:
ERP 0.00%
Business change 2.94%
Legacy transformation 20.59%
Infrastructure renewal 20.59%
Mergers/Acquisition 0.00%
Application renewal 17.65%
Transformation road map 17.65%
Business - IT alignment 20.59%
Count 34
Q17: Dose your organization familiar with the importance of EA?
Yes 57.14%
No 42.86%
Count 7
Q18:Is your EA part of your organizations strategic governance?
Yes 85.71%
No 14.29%
ERP 0%
Business change 3%
Legacy transformation
20%
Infrastructure renewal 20%
Mergers/Acquisition
0%
Application renewal 18%
Transformation road map 18%
Business -‐ IT alignment 21%
Q16:For what kind of issues do you plan and EA program:
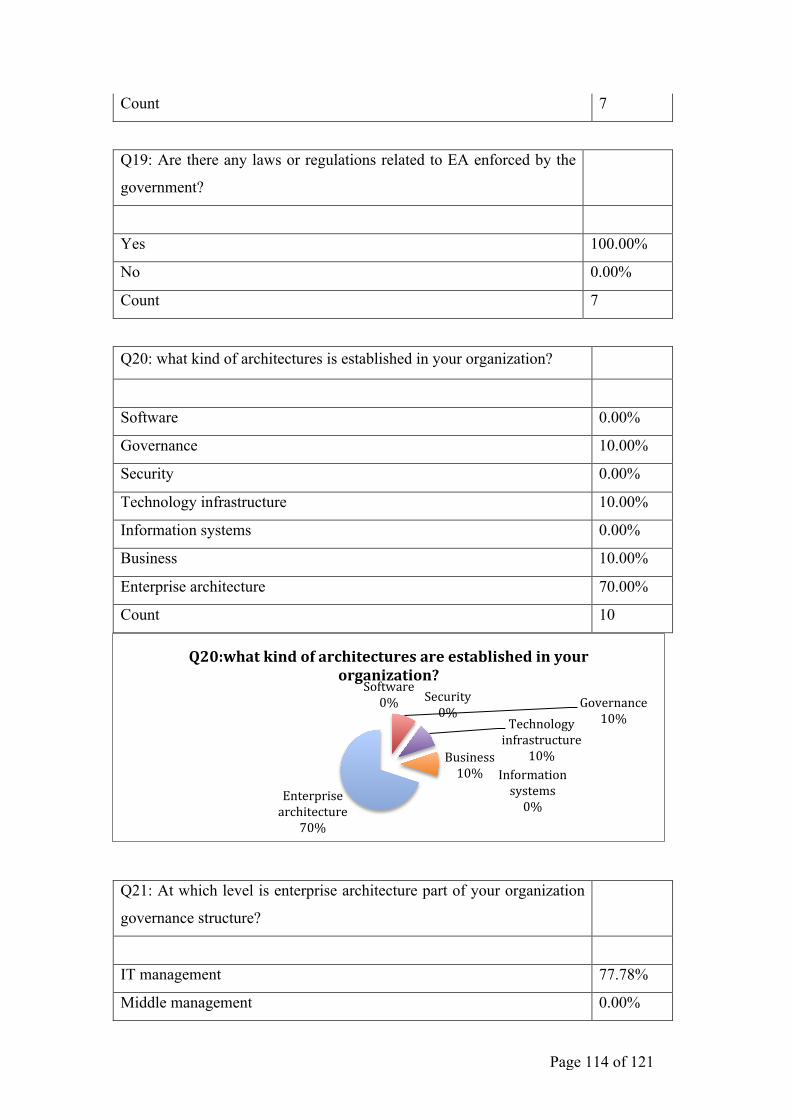
Page 114 of 121
Count 7
Q19: Are there any laws or regulations related to EA enforced by the
government?
Yes 100.00%
No 0.00%
Count 7
Q20: what kind of architectures is established in your organization?
Software 0.00%
Governance 10.00%
Security 0.00%
Technology infrastructure 10.00%
Information systems 0.00%
Business 10.00%
Enterprise architecture 70.00%
Count 10
Q21: At which level is enterprise architecture part of your organization
governance structure?
IT management 77.78%
Middle management 0.00%
Software 0% Governance
10% Security 0%
Technology infrastructure
10% Information systems 0%
Business 10%
Enterprise architecture
70%
Q20:what kind of architectures are established in your organization?
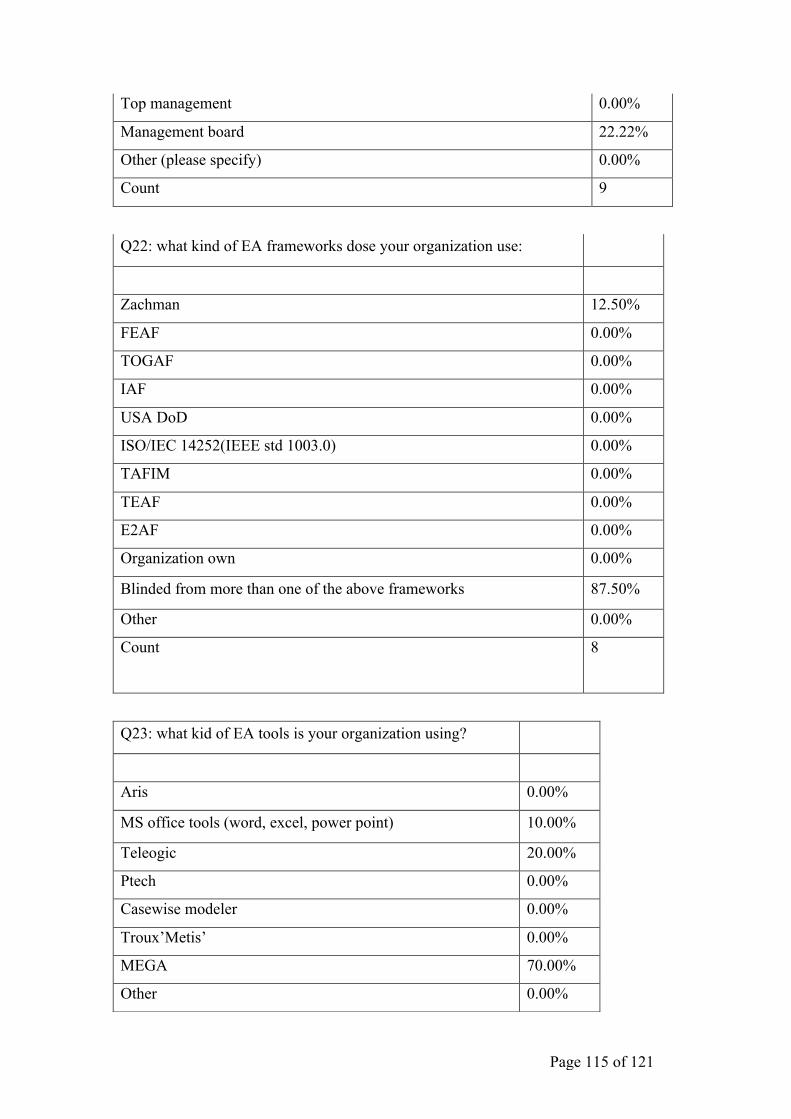
Page 115 of 121
Top management 0.00%
Management board 22.22%
Other (please specify) 0.00%
Count 9
Q22: what kind of EA frameworks dose your organization use:
Zachman 12.50%
FEAF 0.00%
TOGAF 0.00%
IAF 0.00%
USA DoD 0.00%
ISO/IEC 14252(IEEE std 1003.0) 0.00%
TAFIM 0.00%
TEAF 0.00%
E2AF 0.00%
Organization own 0.00%
Blinded from more than one of the above frameworks 87.50%
Other 0.00%
Count 8
Q23: what kid of EA tools is your organization using?
Aris 0.00%
MS office tools (word, excel, power point) 10.00%
Teleogic 20.00%
Ptech 0.00%
Casewise modeler 0.00%
Troux’Metis’ 0.00%
MEGA 70.00%
Other 0.00%
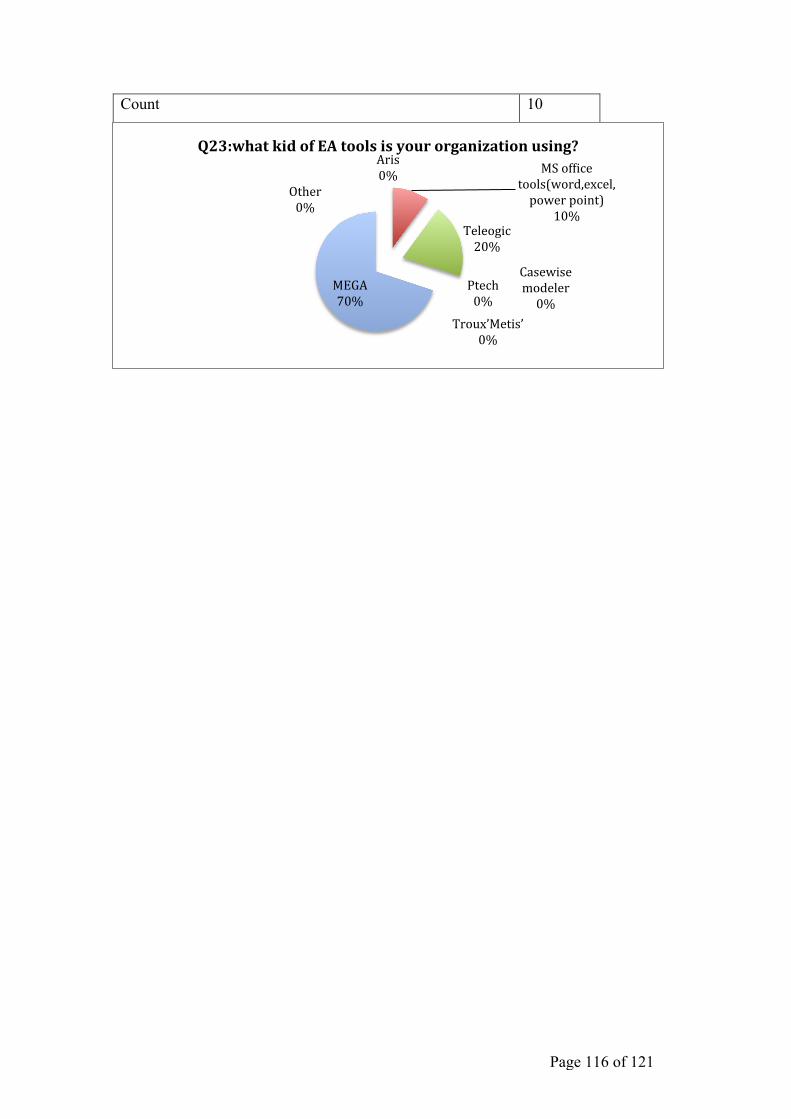
Page 116 of 121
Count 10
Aris 0% MS of`ice
tools(word,excel,power point)
10% Teleogic 20%
Ptech 0%
Casewise modeler 0%
Troux’Metis’ 0%
MEGA 70%
Other 0%
Q23:what kid of EA tools is your organization using?
Page 117 of 121
8. References
‘ADSIC’. (2011). Technology architecture [online]. [Accessed 20 April] Available at:
http://adsic.abudhabi.ae/Sites/ADSIC/Navigation/EN/Projects/it-architecture-and-
standards,did=110732.html
Celik, F. (2009). Enterprise architecture-creating a process for architectural transition.
Master Thesis. Royal institute of technology.
CHAOS. (2009). CHAOS summary 2009, the 10 laws of CHAOS. Boston: The standish
group international
Chi,A.(2006). Implementing Enterprise architecture. MSc. Thesis. Technische
university delft.
Congressional research services (2008). Federal enterprise architecture and E-
government: issues for information technology management. USA:Congressional
research services.
Feurer,S.(2007). Enterprise architecture-organizational structure. Diploma Thesis.
University of Applied Sciences.
Franke,U. & Johnson,P.(2009). An enterprise architecture for application consolidation
in the swedish armed forces. Enterprise distributed object computing conference
workshops:EDOCW 2009 13th. Auckland. 1-4 September. Institute of Electrical and
Electronics Engineers:New york.
Gammelgard,M.,Ekstedt,M. & Narman,P.(2010). A method for assessing the business
value of information system scenarios with an estimated credibility of the result.
International journal of services technology and management, vol. 13 (1/2), pp.105-133.
Gartner(2003). IT spending: Executive Report Series.[online]. Stamford:Gartner.
Page 118 of 121
[Accessed 30 march 2011] Available
at:www.gartner.com/research/attributes/attr_47450_115.pdf
Gartner (2009). Gartner symposium/ITxpo: IT spending [online]. Orlando:Gartner.
[Accessed 30 march 2011]. Available at:
http://www.gartner.com/it/page.jsp?id=1209913
IFEAD(Institute for Enterprise Architecture Developments)(2005). Trends in enterprise
architecture Amersfoort: Institute for Enterprise Architecture Developments.
Jacobs,D. (2008). Towards a business process model warehouse framework. MSc.
Thesis. University of South Africa.
Jahani,B., Javadein,S. & Jafari,H.(2010). Measurement of enterprise architecture
readiness within organizations. Journal of the business strategy series, vol.
11(3),pp.177-191.
Jensen,C.,Cline,O. & Owen,M.(2011). Combining business process management and
enterprise architecture for better business outcomes[online]. USA:IBM redbooks
[Accessed 30 march 2011]. Available
at:http://www.redbooks.ibm.com/abstracts/sg247947.html?Open
Josey,A.,Harrison,R.,Homan,P.,Rouse,M.,Sante,T.,Turner,M. & Merwe,P.(2009).
TOGAF version9. Berkshire:Van haren.
Knippel,R. (2005). Service oriented enterprise architecture. MSc. Thesis. IT University
of Copehagan
Koch,C.(2007). CIO Business technology leadership-IT strategy [online]. [Accessed 30
march 2011]. Available at: http://books.google.ae/books
Manor college (2006). What is empirical research?[online]. Jenkintown: Manor
college. [Accessed 15 April 2011]. Available at:
http://library.manor.edu/tutorial/empiricalresearch.htm
Page 119 of 121
Mooney,L.(2009). How to use business process management and enterprise
architecture tools to thrive in a recession? [online]. [Accessed 2 April 2011]. Available
at : http://www.eweek.com/c/a/Enterprise-Applications/How-to-Use-Business-Process-
Management-and-Enterprise-Architecture-Tools-to-Thrive-in-a-Recession
Niemann,I.(2005). Strategic integrated communication implementation: towards a
south African conceptual model-Methodology:empirical research. Ph.D. Thesis.
University of Pretorial etd.
OMB office of management and budget (2005). National archives and records
administration v1.0 Washington,D.C: Federal enterprise architecture program
management office.
OMB office of management and budget (2010). Circular NO.A-11 preparation,
submission and execution of the budget Washington,D.C: Federal enterprise architecture
program management office.
OMB office of management and budget (2007). FEA practice guidance
Washington,D.C: Federal enterprise architecture program management office.
Raadt,B.(2011). Enterprise architecture coming of age. PhD. Thesis. Vrije University.
Raderius,J.,Narman & P.,Ekstedt,M.(2009). Service oriented computing-ICSOC 2008
workshops lecture nots in computer science. Berlin:Springer.
Rashid,K.(1999). Workflow automation: the new frontier of productivity [online].
[Accessed 10 April 2011]. Available at:
http://findarticles.com/p/articles/mi_qa3857/is_199901/ai_n8831725/?tag=content;col1
Royce,W.(2009). Improving software economics: top10 principles of archiving agility
at scale [online]. New York:IBM [Accessed 30 march 2011]. Available at:
ftp://public.dhe.ibm.com/common/ssi/ecm/en/raw14148usen/RAW14148USEN.PDF
Page 120 of 121
Saat,J.,Franke,U.,Lagerstrom,R. & Ekstedt,M.(2010). Enterprise architecture meta
models for IT/Business alignment situations. Enterprise distributed object computing
conference workshops:EDOCW 2010 14th. Vitoria. 14-23 October. IEEE computer
sociality:Washignton.
Saenz,O.(2005). Framework for enterprise systems engineering. Ph.D. Thesis. Florida
International University.
Sajjad,F.,Lee,H.,Kamal,M. & Irni,Z.(2011) Workflow technology as an e-participation
tool to
support policy-making processes. Journal of Enterprise information management, vol.
24 (2), pp.197-212.
Sessions,R.(2007). A Comparison of the Top Four Enterprise-Architecture
Methodologies[online]. [Accessed 28 March 2011]. Available at:
http://msdn.microsoft.com/en-us/library/bb466232.aspx#eacompar_topic4
Swithinkbank, P., Chessell,M., Gardner,T., Griffin,C., Man,J., Wylie, H. &
Yusuf,L.(2005). Patterns:model driven development using IBM rational software
architect. Viewed 30 March 2011.
http://www.redbooks.ibm.com/redbooks/pdfs/sg247105.pdf
Tatum,M. (2011). What is business process automation?[online]. [Accessed 10 April
2011]. Available at: http://www.wisegeek.com/what-is-business-process-
automation.htm
The Open Group. (2008) Why dose enterprise architecture matter? San Francisco:The
Open Group.
The Open Group (2006). The open group architecture framework: Architecture
governance [online]. San Francisco:The open group [Accessed 10 march 2011].
Available at: http://pubs.opengroup.org/architecture/togaf8-doc/arch/chap26.html
Page 121 of 121
Thorn,S.(2011). Cloud computing requires enterprise architecture and TOGAF9 can
show the way[online]. [Accessed 10 march 2011]. Available at:
http://www.architecting-the-
enterprise.com/pdf/presentations/cloud_computing_requires_enterprise_architecture_an
d_togaf9_can_show_the_way.pdf
Tutorgig(2010). Enterprise architecture[online].Center of advancement of the
enterprise architecture profession. [Accessed 10 April 2011]. Available at:
http://www.tutorgig.com/ed/Enterprise_architecture#Relationship_to_other_disciplines
Veger, M. (2008). Wide services oriented architecture: a multi-case study research.
MSc. Thesis. University of Twente
Weibelizahl,S.,Weber,G.(2010). Advantages, opportunities, and limits of empirical
evaluations: evaluating adaptive systems [online]. University of education freiburg.
[Accessed 15 April 2011]. Available at:
http://citeseerx.ist.psu.edu/viewdoc/download?doi=10.1.1.18.7909&rep=rep1&type=pd
f
Wikipedia(2011). Enterprise architecture [online]. [Accessed 10 April 2011]. Available
at: http://en.wikipedia.org/wiki/Enterprise_architecture
Zachman,J.(2003). The zachman framework for enterprise architecture: primer for
enterprise engineering and manufacturing[online]. Zachman [Accessed 1 April 2011].
Available at: http://www.zachmaninternational.com