Embed Size (px)
Citation preview

A STUDY ON EFFECTS OF SATURATION ON SOIL SUBGRADE STRENGTH
A THESIS SUBMITTED IN PARTIAL FULFILMENT OF THE REQUIRMENTS FOR THE DEGREE OF
MASTER OF TECHNOLOGY
In
CIVIL ENGINEERING
By
PRAGYANSHREE PADHY (Roll No. 211CE3247)
Department of Civil Engineering National Institute of Technology, Rourkela
Odisha – 769 008 MAY 2013

A STUDY ON EFFECTS OF SATURATION ON SOIL SUBGRADE STRENGTH
Thesis
Submitted in Partial Fulfillment of the Requirements
For the Degree of
MASTER OF TECHNOLOGY
In
CIVIL ENGINEERING
[Specialization: Transportation Engineering] By
Pragyanshree Padhy
Roll No. 211CE3247
Under the guidance of
Prof. Mahabir Panda
Department of Civil Engineering National Institute of Technology, Rourkela
Odisha-769 008 MAY 2013

i
DEPARTMENT OF CIVIL ENGINEERING
NATIONAL INSTITUTE OF TECHNOLOGY
ROURKELA, ODISHA-769008
CERTIFICATE
This is to certify that the thesis entitled “A STUDY ON EFFECTS OF SATURATION ON
SOIL SUBGRADE STRENGTH” submitted by Pragyanshree Padhy bearing roll no.
211CE3247 in partial fulfilment of the requirements for the award of Master of Technology
in Civil Engineering with specialization in “Transportation Engineering” during 2011-
2013 session at the National Institute of Technology, Rourkela is an authentic work carried out
by her under my supervision and guidance.
To the best of my knowledge, the results contained in this thesis have not been submitted to
any other University or Institute for the award of any degree or diploma.
Date: Prof. Mahabir Panda
Place: Rourkela Department of Civil Engineering
National Institute of technology
Rourkela, Odisha-769008

ii
ACKNOWLEDGEMENTS I would like to express my deep sense of gratitude from the core of my heart to my supervisor
Prof. Mahabir Panda, Professor of the Civil Engineering Department, NIT Rourkela for
initiating an interesting study, his personal commitment, interesting discussion and valuable
advice. He has been continuously encouraging me throughout the work and contributing with
valuable guidance and supervision.
I am very grateful to Prof. Nagendra Roy, HOD of Civil Engineering Department, Prof.
Prasanta kumar Bhuyan, and Prof. Ujjal Chattaraj for their helpful suggestions during my
entire course work. I also extend my sincere thanks to the Department of Civil Engineering,
Ceramic Engineering and Metallurgy Engineering at Nit Rourkela for providing all the
facilities needed for this project work.
My thanks to Mr. S. C. Xess, Mr. Hari Mohan Garnayak, Rahul bhai and Sambhu bhai of
Highway and Concrete Laboratory can never be enough in mere words. They simply helped
in every possible way they could. Without their guidance and cooperation I could not have
finished this research.
I also want to convey sincere thanks to all my friends, especially to Transportation
Engineering Specialization for making my stay in the campus a pleasant one. Last but not the
least I would also like to thank my parents and the Almighty whose blessings have helped me
in achieving great strides.
Pragyanshree Padhy
Roll no. 211ce3247

iii
ABSTRACT
The design of the pavement layers to be laid over sub grade soil starts off with the estimation of
sub grade strength and the volume of traffic to be carried. Design of the various pavement layers
are very much dependent on the strength of the sub grade soil over which they are going to be
laid. Sub grade strength is mostly expressed in terms of CBR (California Bearing Ratio). Weaker
sub grade essentially requires thicker layers whereas stronger sub grade goes well with thinner
pavement layers. The sub grade is always subjected to change in saturation level due to
precipitation, capillary action, flood or abrupt rise or subsidal of water table. Change in moisture
level in sub grade causes change in the sub grade strength. And it becomes quite essential for an
engineer to understand the exact nature of dependence of sub grade strength on moisture
variation. An understanding of the dependence of the CBR strength of local soils on water
content will contribute towards better design and maintenance practices. Normally CBR test is an
easy and well adopted method conducted on soil samples to measure the strength of sub grade.
However, many other tests are also considered for assessing the sub grade strength.
The strength of soil, used for sub grade may vary largely on the amount of saturation in it, i.e.
amount of water exposed to the soil. Hence, in this study an attempt has been made to vary the
degree of soaking and hence the saturation level in various types of soils and study the
engineering properties of soils including CBR at different saturation levels.
It is observed that for coarse grained soil, worst engineering properties are observed after three
days of soaking and for fine grained soils, the same is found at the end of four days.
Keywords: Sub grade soil, Moisture content , Compaction, Degree of saturation, CBR

iv
CONTENT
Item Page no.
Certificate i
Acknowledgement ii
Abstract iii
Content iv-viii
List of Figures ix-xii
List of Tables xiii-xvii
Chapter 1
Introduction 1-4
1.1Subgrade 1
1.1.1Subgrade Performance 1
1.1.2Desirable Properties 2
1.2 California Bearing Ratio Test 3
1.3 Organization of Thesis 4
Chapter 2
Literature Review 5-9

v
2.1 Effect of moisture variation on California 5
Bearing Ratio Test
2.2 Effect of moisture variation on Direct shear test 8
Chapter 3
Methodology and Experimental Investigations 10-13
Methodology 10
3.1 Experimental Investigation 10
3.1.1 Liquid Limit 11
3.1.2 Plastic Limit 11
3.1.3 Plasticity Index 11
3.1.4 Differential Free Swell 11
3.1.5 Specific Gravity 12
3.1.6 Sieve Analysis 12
3.1.7 Modified Proctor Test 12
3.1.8 California Bearing Ratio Test 12
3.1.9 Direct Shear Test 13
Chapter 4
Results and Discussions 14-10
4.1 Type 1 Soil 14

vi
4.1.1 Index Properties 14
4.1.2 Particle Size Distribution 15
4.1.3 Modified Proctor Compaction Test 16
4.1.4 California Bearing Ratio Test Results 17
4.1.4.1Test-1(conducted under OMC (16.4%) 17
and MDD (1.84g/cc)
4.1.4.2Test 2 (98% dry side) under moisture content (12.89%) 24
and dry density (1.8g/cc)
4.1.4.3Test 3 (98% wet side) under moisture content (17.8%) 30
and dry density (1.8g/cc)
4.1.1.4Test 4 (97% dry side) under moisture content (12.2%) 35
and dry density (1.78g/cc)
4.1.1.5Test 5 (97% wet side) under moisture content (19%) 40
and dry density (1.78g/cc)
4.2 Type 2 Soil 45-71
4.2.1 Index Properties 45
4.2.2 Particle Size Distribution 45
4.2.3 Modified Proctor Compaction Test 46
4.2.4 California Bearing Ratio Test Results 47

vii
4.2.4.1Test-1(conducted under OMC (14.8%) and MDD (1.85g/cc) 47
4.2.4.2Test 2 (98% dry side) under moisture content (12.46%) 52
and dry density (1.82g/cc)
4.2.4.3Test 3 (98% wet side) under moisture content (16.25%) 57
and dry density (1.82g/cc)
4.2.4.4Test 4 (97% dry side) under moisture content (10.7%) 62
and dry density (1.794g/cc)
4.2.4.5Test 5 (97% wet side) under moisture content (17.8%) 67
and dry density (1.794g/cc)
4.3 Type 3 Soil 72-99
4.3.1 Index Properties 72
4.3.2 Particle Size Distribution 72
4.3.3 Modified Proctor Compaction Test 73
4.3.4 California Bearing Ratio Test Results 74
4.3.3.1Test-1(conducted under OMC (10.83%) and MDD (2.15g/cc) 74
4.3.3.2Test 2 (98% dry side) under moisture content (12.46%) 79
and dry density (1.82g/cc)
4.3.3.3Test 3 (98% wet side) under moisture content (16.25%) and 84
dry density (1.82g/cc)
viii
4.3.3.4Test 4 (97% dry side) under moisture content (7.5%) 89
and dry density (2.08g/cc)
4.3.3.5Test 4 (97% wet side) under moisture content (12.5%) and 94
dry density (2.08g/cc)
4.4 Direct Shear Test Results 99-101
Chapter 5 106-107
Conclusions 106
Future scope of work 107
References 108- 109

ix
List of Figures
Figure 4.1: Modified proctor compaction test for type – 1 soil 16
Figure 4.2 Load vs penetration graph for test – 1, type – 1 soil for unsoaked condition 17
Figure 4.3 Load vs penetration graph for test –1, type – 1soil for soaked (day - 1) condition 18
Figure 4.4 Load vs penetration graph for test –1, type – 1soil for soaked (day – 2) condition 18
Figure 4.5 Load vs penetration graph for test –1, type – 1soil for soaked (day - 3) condition 19
Figure 4.6 Load vs penetration graph for test –1, type – 1soil for soaked (day - 4) condition 19
Figure 4.7 Load vs penetration graph for test –1, type – 1soil for soaked (day - 5) condition 20
Figure 4.8 Horizontal and vertical positions of soil sample 21
Figure 4.9 Load vs penetration graph for test –2, type – 1soil for unsoaked condition 24
Figure 4.10 Load vs penetration graph for test –2, type – 1soil for soaked (day-1) condition 25
Figure 4.11 Load vs penetration graph for test –2, type – 1soil for soaked (day-2) condition 25
Figure 4.12 Load vs penetration graph for test –2, type – 1soil for soaked (day-3) condition 26
Figure 4.13 Load vs penetration graph for test –2, type – 1soil for soaked (day-4) condition 26
Figure 4.14 Load vs penetration graph for test –2, type – 1soil for soaked (day-5) condition 27
Figure 4.15 Load vs penetration graph for test –3, type – 1soil for unsoaked condition 30
Figure 4.16 Load vs penetration graph for test –3, type – 1soil for soaked (day-1) condition 30
Figure 4.17 Load vs penetration graph for test –3, type – 1soil for soaked (day-2) condition 31
Figure 4.18 Load vs penetration graph for test –3, type – 1soil for soaked (day-3) condition 31
Figure 4.19 Load vs penetration graph for test –3, type – 1soil for soaked (day-4) condition 32
Figure 4.20 Load vs penetration graph for test –3, type – 1soil for soaked (day-5) condition 32
Figure 4.21 Load vs penetration graph for test –4, type – 1soil for unsoaked condition 35
Figure 4.22 Load vs penetration graph for test –4, type – 1soil for soaked (day-1) condition 35
Figure 4.23 Load vs penetration graph for test –4, type – 1soil for soaked (day-2) condition 36
Figure 4.24 Load vs penetration graph for test –4, type – 1soil for soaked (day-3) condition 36

x
Figure 4.25 Load vs penetration graph for test –4, type – 1soil for soaked (day-4) condition 37
Figure 4.26 Load vs penetration graph for test –4, type – 1soil for soaked (day-5) condition 37
Figure 4.27 Load vs penetration graph for test –5, type – 1soil for unsoaked condition 40
Figure 4.28 Load vs penetration graph for test –5, type – 1soil for soaked (day-1) condition 40
Figure 4.29 Load vs penetration graph for test –5, type – 1soil for soaked (day-2) condition 41
Figure 4.30 Load vs penetration graph for test –5, type – 1soil for soaked (day-3) condition 41
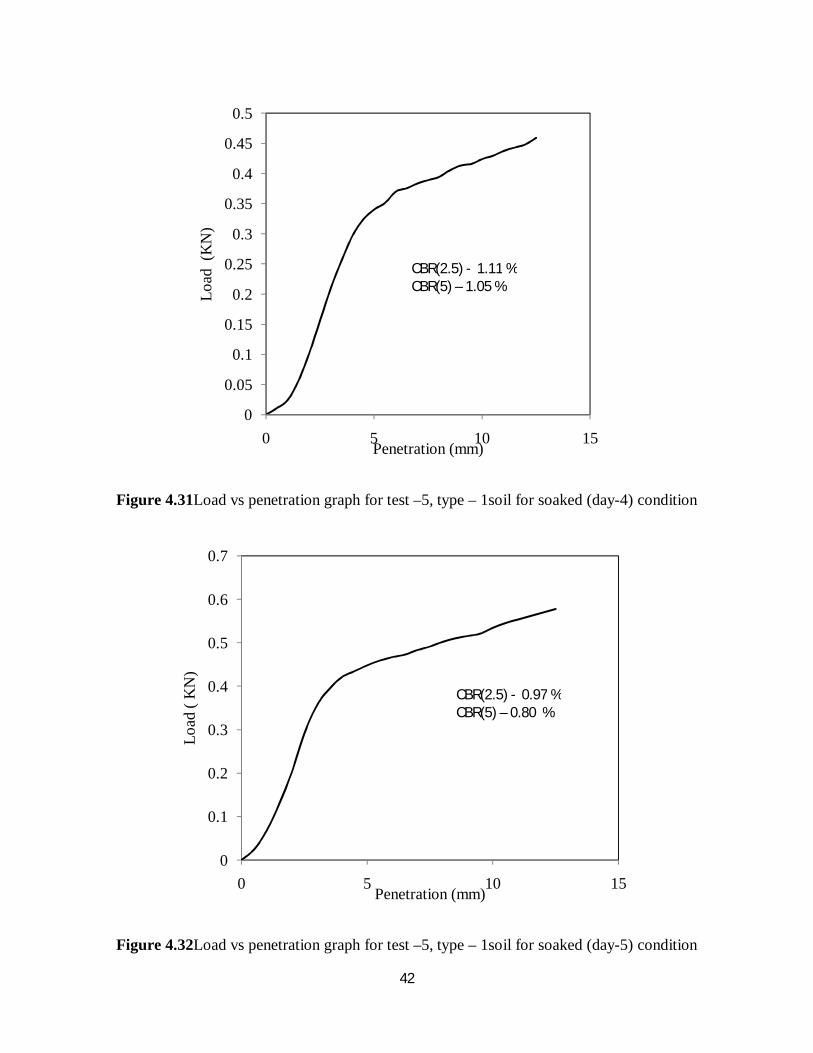
Figure 4.31 Load vs penetration graph for test –5, type – 1soil for soaked (day-4) condition 42
Figure 4.32 Load vs penetration graph for test –5, type – 1soil for soaked (day-5) condition 42
Figure 4.33: Modified proctor compaction test for type – 2 soil 46
Figure 4.34 Load vs penetration graph for test – 1, type – 2 soil for unsoaked condition 47
Figure 4.35 Load vs penetration graph for test –1, type – 2soil for soaked (day - 1) condition 47
Figure 4.36 Load vs penetration graph for test –1, type – 2soil for soaked (day – 2) condition 48
Figure 4.37 Load vs penetration graph for test –1, type – 2soil for soaked (day - 3) condition 48
Figure 4.38 Load vs penetration graph for test –1, type – 2soil for soaked (day - 4) condition 49
Figure 4.39 Load vs penetration graph for test –1, type – 2soil for soaked (day - 5) condition 49
Figure 4.40 Load vs penetration graph for test –2, type – 2soil for unsoaked condition 52
Figure 4.41 Load vs penetration graph for test –2, type – 2soil for soaked (day-1) condition 52
Figure 4.42 Load vs penetration graph for test –2, type – 2soil for soaked (day-2) condition 53
Figure 4.43 Load vs penetration graph for test –2, type – 2soil for soaked (day-3) condition 53
Figure 4.44 Load vs penetration graph for test –2, type – 2soil for soaked (day-4) condition 54
Figure 4.45 Load vs penetration graph for test –2, type – 2soil for soaked (day-5) condition 54
Figure 4.46 Load vs penetration graph for test –3, type – 2soil for unsoaked condition 57
Figure 4.47 Load vs penetration graph for test –3, type – 2soil for soaked (day-1) condition 57
Figure 4.48 Load vs penetration graph for test –3, type – 2soil for soaked (day-2) condition 58
Figure 4.49 Load vs penetration graph for test –3, type – 2soil for soaked (day-3) condition 58

xi
Figure 4.50 Load vs penetration graph for test –3, type – 2soil for soaked (day-4) condition 59
Figure 4.51 Load vs penetration graph for test –3, type – 2soil for soaked (day-5) condition 59
Figure 4.52 Load vs penetration graph for test –4, type – 2soil for unsoaked condition 62
Figure 4.53 Load vs penetration graph for test –4, type – 2 soil for soaked (day-1) condition 62
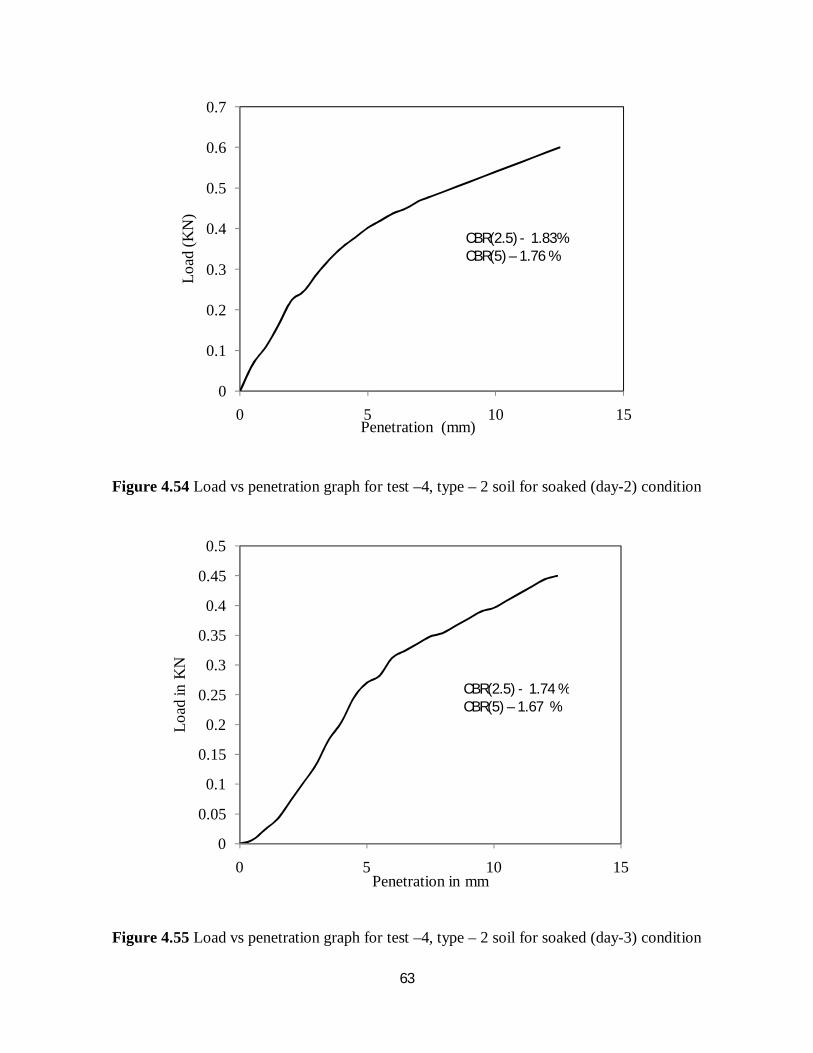
Figure 4.54 Load vs penetration graph for test –4, type – 2soil for soaked (day-2) condition 63
Figure 4.55 Load vs penetration graph for test –4, type – 2soil for soaked (day-3) condition 63
Figure 4.56 Load vs penetration graph for test –4, type – 2soil for soaked (day-4) condition 64
Figure 4.57 Load vs penetration graph for test –4, type – 2soil for soaked (day-5) condition 64
Figure 4.58 Load vs penetration graph for test –5, type – 2soil for unsoaked condition 67
Figure 4.59 Load vs penetration graph for test –5, type – 2soil for soaked (day-1) condition 67
Figure 4.60 Load vs penetration graph for test –5, type – 2soil for soaked (day-2) condition 68
Figure 4.61 Load vs penetration graph for test –5, type – 2soil for soaked (day-3) condition 68
Figure 4.62 Load vs penetration graph for test –5, type – 2soil for soaked (day-4) condition 69
Figure 4.63 Load vs penetration graph for test –5, type – 2soil for soaked (day-5) condition 69
Figure 4.64: Modified proctor compaction test for type – 2 soil 73
Figure 4.65 Load vs penetration graph for test – 1, type – 2 soil for unsoaked condition 74
Figure 4.66 Load vs penetration graph for test –1, type – 2soil for soaked (day - 1) condition 74
Figure 4.67 Load vs penetration graph for test –1, type – 2soil for soaked (day – 2) condition 75
Figure 4.68 Load vs penetration graph for test –1, type – 2soil for soaked (day - 3) condition 75
Figure 4.69 Load vs penetration graph for test –1, type – 2soil for soaked (day - 4) condition 76
Figure 4.70 Load vs penetration graph for test –1, type – 2soil for soaked (day - 5) condition 76
Figure 4.71 Load vs penetration graph for test –2, type – 2soil for unsoaked condition 79
Figure 4.72 Load vs penetration graph for test –2, type – 2soil for soaked (day-1) condition 79
Figure 4.73 Load vs penetration graph for test –2, type – 2soil for soaked (day-2) condition 80
Figure 4.74 Load vs penetration graph for test –2, type – 2soil for soaked (day-3) condition 80

xii
Figure 4.75 Load vs penetration graph for test –2, type – 2soil for soaked (day-4) condition 81
Figure 4.76 Load vs penetration graph for test –2, type – 2soil for soaked (day-5) condition 81
Figure 4.77 Load vs penetration graph for test –3, type – 2soil for unsoaked condition 84
Figure 4.78 Load vs penetration graph for test –3, type – 2soil for soaked (day-1) condition 84
Figure 4.79 Load vs penetration graph for test –3, type – 2soil for soaked (day-2) condition 85
Figure 4.80 Load vs penetration graph for test –3, type – 2soil for soaked (day-3) condition 85
Figure 4.81 Load vs penetration graph for test –3, type – 2soil for soaked (day-4) condition 86
Figure 4.82 Load vs penetration graph for test –3, type – 2soil for soaked (day-5) condition 86
Figure 4.83 Load vs penetration graph for test –4, type – 2soil for unsoaked condition 89
Figure 4.84 Load vs penetration graph for test –4, type – 2 soil for soaked (day-1) condition 89
Figure 4.85 Load vs penetration graph for test –4, type – 2soil for soaked (day-2) condition 90
Figure 4.86 Load vs penetration graph for test –4, type – 2soil for soaked (day-3) condition 90
Figure 4.87 Load vs penetration graph for test –4, type – 2soil for soaked (day-4) condition 91
Figure 4.88 Load vs penetration graph for test –4, type – 2soil for soaked (day-5) condition 91
Figure 4.89 Load vs penetration graph for test –5, type – 2soil for unsoaked condition 94
Figure 4.90 Load vs penetration graph for test –5, type – 2soil for soaked (day-1) condition 94
Figure 4.91 Load vs penetration graph for test –5, type – 2soil for soaked (day-2) condition 95
Figure 4.92 Load vs penetration graph for test –5, type – 2soil for soaked (day-3) condition 95
Figure 4.93 Load vs penetration graph for test –5, type – 2soil for soaked (day-4) condition 96
Figure 4.94 Load vs penetration graph for test –5, type – 2soil for soaked (day-5) condition 96
Figure 4.95 Shear stress vs normal stress for test -1,type- 1 soil 99
Figure 4.96 Shear stress vs normal stress for test -2,type- 1 soil 99
Figure 4.97 Shear stress vs normal stress for test -3,type- 1 soil 100
Figure 4.98 Shear stress vs normal stress for test -4,type- 1 soil 100
Figure 4.99 Shear stress vs normal stress for test -5,type- 1 soil 101

xiii
LIST OF TABLES
Table-4.1 Index properties of type – 1 soil 14
Table-4.2 Grain size distribution of type - 1 soil 15
Table 4.3 Moisture content for test- 1,type – 1 soil for soaked (day - 1) condition 22
Table 4.4 Moisture content for test -1, type – 1 soil for soaked (day - 2) condition 22
Table4. 5 Moisture content for test – 1, type – 1 soil for soaked (day - 3) condition 23
Table 4.6 Moisture content for test – 1,type – 1 soil for soaked (day - 4) condition 23
Table 4.7 Moisture content for test – 1, type – 1 soil for soaked (day - 5) condition 24
Table 4.8 Moisture content for test – 2, type – 1 soil for soaked (day - 1) condition 28
Table 4.9 Moisture content for test – 2, type – 1 soil for soaked (day - 2) condition 28
Table 4.10 Moisture content for test – 2, type – 1 soil for soaked (day - 3) condition 28
Table 4.11 Moisture content for test – 2, type – 1 soil for soaked (day - 4) condition 29
Table 4.12 Moisture content for test – 2, type – 1 soil for soaked (day - 5) condition 29
Table 4.13 Moisture content for test – 3, type – 1 soil for soaked (day - 1) condition 33
Table 4.14 Moisture content for test – 3, type – 1 soil for soaked (day - 2) condition 33
Table 4.15 Moisture content for test – 3, type – 1 soil for soaked (day -3) condition 33
Table 4.16 Moisture content for test –3, type – 1 soil for soaked (day - 4) condition 34
Table 4.17 Moisture content for test –3, type – 1 soil for soaked (day - 5) condition 34
Table 4.18 Moisture content for test – 4, type – 1 soil for soaked (day - 1) condition 38
Table 4.19 Moisture content for test – 4, type – 1 soil for soaked (day - 2) condition 38
Table 4.20 Moisture content for test – 4, type – 1 soil for soaked (day - 3) condition 38
Table 4.21 Moisture content for test – 4, type – 1 soil for soaked (day - 4) condition 39
Table 4.22. Moisture content for test – 4, type – 1 soil for soaked (day - 5) condition 39
Table 4.23 Moisture content for test – 5, type – 1 soil for soaked (day - 1) condition 43
xiv
Table 4.24 Moisture content for test – 5, type – 1 soil for soaked (day - 2) condition 43
Table 4.25 Moisture content for test – 5, type – 1 soil for soaked (day - 3) condition 43
Table 4.26 Moisture content for test – 5, type – 1 soil for soaked (day - 4) condition 44
Table 4.27 Moisture content for test – 5, type – 1 soil for soaked (day - 5) condition 44
Table4. 28 Index properties of type – 2 soil 45
Table 4.29Grain size distribution of type - 2 soil 45
Table 4.30 Moisture content for test – 1, type – 2 soil for soaked (day - 1) condition 50
Table 4.31 Moisture content for test – 1, type – 2 soil for soaked (day - 2) condition 50
Table 4.32 Moisture content for test – 1, type – 2 soil for soaked (day - 3) condition 50
Table 4.33 Moisture content for test – 1, type – 2 soil for soaked (day - 4) condition 51
Table 4.34 Moisture content for test – 1, type – 2 soil for soaked (day - 5) condition 52
Table 4.35 Moisture content for test – 2, type – 2 soil for soaked (day - 1) condition 55
Table 4.36 Moisture content for test – 2, type – 2 soil for soaked (day - 2) condition 55
Table 4.37 Moisture content for test – 2, type – 2 soil for soaked (day - 3) condition 55
Table 4.38 Moisture content for test – 2, type – 2 soil for soaked (day - 4) condition 56
Table 4.39 Moisture content for test – 2, type – 2 soil for soaked (day - 5) condition 56
Table 4.40 Moisture content for test – 3, type – 2 soil for soaked (day - 1) condition 60
Table 4.41 Moisture content for test – 3, type – 2 soil for soaked (day - 2) condition 60
Table 4.42 Moisture content for test – 3, type – 2 soil for soaked (day - 3) condition 60
Table 4.43 Moisture content for test – 3, type – 2 soil for soaked (day - 4) condition 61
Table 4.44 Moisture content for test – 3, type – 2 soil for soaked (day - 5) condition 61
Table 4.45 Moisture content for test – 4, type – 2 soil for soaked (day - 1) condition 65
Table 4.46 Moisture content for test – 4, type – 2 soil for soaked (day - 2) condition 65
Table 4.47 Moisture content for test – 4, type – 2 soil for soaked (day - 3) condition 65
Table 4.48 Moisture content for test – 4, type – 2 soil for soaked (day - 4) condition 66

xv
Table 4.49 Moisture content for test – 4, type – 2 soil for soaked (day - 5) condition 66
Table 4.50 Moisture content for test – 5, type – 2 soil for soaked (day - 1) condition 70
Table 4.51 Moisture content for test – 5, type – 2 soil for soaked (day - 2) condition 70
Table 4.52 Moisture content for test – 5, type – 2 soil for soaked (day - 3) condition 70
Table 4.53 Moisture content for test – 5, type – 2 soil for soaked (day - 4) condition 71
Table 4.54 Moisture content for test – 5, type – 2 soil for soaked (day - 5) condition 71
Table4. 55 Index properties of type- 3 soil 72
Table4. 56 Grain size distribution of type - 3 soil 72
Table 4.57 Moisture content for test – 1, type – 3 soil for soaked (day - 1) condition 77
Table 4.58 Moisture content for test – 1, type – 3 soil for soaked (day - 2) condition 77
Table 4.59 Moisture content for test – 1, type – 3 soil for soaked (day - 3) condition 77
Table 4.60 Moisture content for test – 1, type – 3 soil for soaked (day - 4) condition 78
Table 4.61 Moisture content for test – 1, type – 3 soil for soaked (day - 5) condition 78
Table 4.62 Moisture content for test – 2, type – 3 soil for soaked (day - 1) condition 82
Table 4.63 Moisture content for test – 2, type – 3 soil for soaked (day - 2) condition 82
Table 4.64 Moisture content for test – 2, type – 3 soil for soaked (day - 3) condition 82
Table 4.65 Moisture content for test – 2, type – 3 soil for soaked (day - 4) condition 83
Table 4.66 Moisture content for test – 2, type – 3 soil for soaked (day - 5) condition 83
Table 4.67 Moisture content for test – 3, type – 3 soil for soaked (day - 1) condition 87
Table 4.68 Moisture content for test – 3, type – 3 soil for soaked (day - 2) condition 87
Table 4.69 Moisture content for test – 3, type – 3 soil for soaked (day - 3) condition 87
Table 4.70 Moisture content for test – 3, type – 3 soil for soaked (day - 4) condition 88
Table 4.71 Moisture content for test – 3, type – 3 soil for soaked (day - 5) condition 88
Table 4.72 Moisture content for test – 4, type – 3 soil for soaked (day - 1) condition 92
Table 4.73 Moisture content for test – 4, type – 3 soil for soaked (day - 2) condition 92
xvi
Table 4.74 Moisture content for test – 4, type – 3 soil for soaked (day - 3) condition 92
Table 4.75 Moisture content for test – 4, type – 3 soil for soaked (day - 4) condition 93
Table 4.76 Moisture content for test – 4, type – 3 soil for soaked (day - 5) condition 93
Table 4.77 Moisture content for test – 5, type – 3 soil for soaked (day - 1) condition 97
Table 4.78 Moisture content for test – 5, type – 3 soil for soaked (day - 2) condition 97
Table 4.79 Moisture content for test – 5, type – 3 soil for soaked (day - 3) condition 97
Table 4.80 Moisture content for test – 5, type – 3 soil for soaked (day - 4) condition 98
Table 4.81 Moisture content for test – 5, type – 3 soil for soaked (day - 5) condition 98
Table4. 82 CBR values of first type of soil 102
Table4. 83 CBR values of second type of soil 103
Table4. 84 CBR values of third type of soil 104

1
CHAPTER 1
INTRODUCTION
1.1 SUBGRADE
The crust of a pavement, whether flexible or rigid, rests on a soil foundation on an embankment
or cutting, normally known as subgrade. Subgrade can be defined as a compacted layer,
generally of naturally occurring local soil, assumed to be 500/300 mm in thickness, just beneath
the pavement crust, providing a suitable foundation for the pavement. The subgrade in
embankment is compacted in two layers, usually to a higher standard than the lower part of the
embankment .The soil in subgrade is normally stressed to certain minimum level of stresses due
to the traffic loads and the subgrade soil should be of good quality and appropriately compacted
so as to utilize its full strength to withstand the stresses due to traffic loads. This leads to
economization of the overall pavement thickness. On the other hand the subgrade soil is
characterized for its strength for the purpose of analysis and design of pavement.
1.1.1 SubgradePerformance
A subgrade’s performance generally depends on three of the basic characteristics, which are
briefly described below:
1. Load bearing capacity: The subgrade must be able to support loads transmitted from the
pavement structure. This load bearing capacity is often affected by degree of
compaction, moisture content, and soil type. A subgrade that can support a high amount
of loading without excessive deformation is considered good.

2
2. Moisture content: Moisture tends to affect a number of subgrade properties including
load bearing capacity, shrinkage and swelling. Moisture content can be influenced by a
number of things such as drainage, groundwater table elevation, infiltration, or pavement
porosity (which can be assisted by cracks in the pavement). Generally, excessively wet
subgrades will deform excessively under load.
3. Shrinkage and/or swelling: Some soils shrink or swell depending upon their moisture
content. Additionally, soils with excessive fines content may be susceptible to frost
heave in northern climates. Shrinkage, swelling and frost heave will tend to deform and
crack any pavement type constructed over them.
1.1.2 Desirable Properties
The desirable properties of subgrade soil as a highway material are
• Withstand capability (Stability)
• Ease of compaction
• Strength permanency
• Low change in volume during adverse conditions of weather and ground water table
• Superior drainage
• Incompressibility
The most common parameter used to evaluate pavement layer strength is the California Bearing
Ratio (CBR). The CBR value is influenced by the water content and the dry density as well as
the texture of the soil.Generally, the CBR test in the laboratory is conducted on test samples
prepared at the dry density and water content likely to be achieved in the field. Whereas the
3
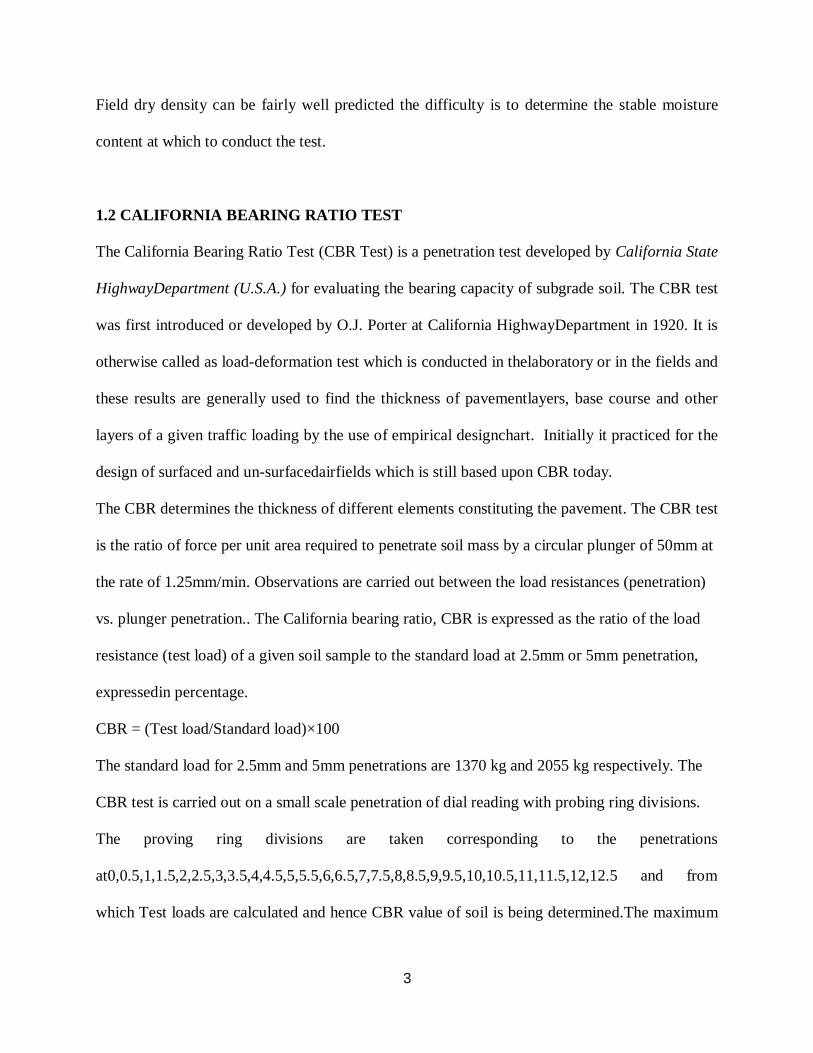
Field dry density can be fairly well predicted the difficulty is to determine the stable moisture
content at which to conduct the test.
1.2 CALIFORNIA BEARING RATIO TEST
The California Bearing Ratio Test (CBR Test) is a penetration test developed by California State
HighwayDepartment (U.S.A.) for evaluating the bearing capacity of subgrade soil. The CBR test
was first introduced or developed by O.J. Porter at California HighwayDepartment in 1920. It is
otherwise called as load-deformation test which is conducted in thelaboratory or in the fields and
these results are generally used to find the thickness of pavementlayers, base course and other
layers of a given traffic loading by the use of empirical designchart. Initially it practiced for the
design of surfaced and un-surfacedairfields which is still based upon CBR today.
The CBR determines the thickness of different elements constituting the pavement. The CBR test
is the ratio of force per unit area required to penetrate soil mass by a circular plunger of 50mm at
the rate of 1.25mm/min. Observations are carried out between the load resistances (penetration)
vs. plunger penetration.. The California bearing ratio, CBR is expressed as the ratio of the load
resistance (test load) of a given soil sample to the standard load at 2.5mm or 5mm penetration,
expressedin percentage.
CBR = (Test load/Standard load)×100
The standard load for 2.5mm and 5mm penetrations are 1370 kg and 2055 kg respectively. The
CBR test is carried out on a small scale penetration of dial reading with probing ring divisions.
The proving ring divisions are taken corresponding to the penetrations
at0,0.5,1,1.5,2,2.5,3,3.5,4,4.5,5,5.5,6,6.5,7,7.5,8,8.5,9,9.5,10,10.5,11,11.5,12,12.5 and from
which Test loads are calculated and hence CBR value of soil is being determined.The maximum

4
load and penetration is recorded if it occurs for a penetration of less than 12.5 mm. The curve is
mainly convex upwards although the initial portion of the curve may be concave upwards due to
surface irregularities. A correction is then applied by drawing a tangent to the curve at the point
of greatest slope. The corrected origin will be the point where the tangent meets the abscissa. The
CBR values are usually calculated for penetrations of 2.5 mm and 5mm. Generally the CBR
values at 2.5mm penetration will be greater than 5mm penetration and in such a case the former
is taken as the CBR value for design purposes. If the CBR value corresponding to a penetration
of 5mm exceeds that for 2.5mm, the test is repeated. If identical results follow, the bearing ratio
corresponding to 5mm penetration is taken for design.
Considering the above, it has been proposed in this project to study the various strength
properties of different types of soil made at different moisture and density levels and conclude
the general aspects of moisture conditions on determination of different strength parameters, so
as to achieve the most viable and economical pavement design.
1.3 ORGANIZATION OF THESIS
The thesis consists of six chapters as described below:
Chapter 1 gives a brief introduction of the project
Chapter 2 deals with a review of previous work on laboratory studies.
Chapter 3 deals with methodology andexperimental investigation.
Analysis of the results and discussion on the experimental investigations is discussed
in Chapter 4.
Conclusions of this research are summarized in Chapter 5.

5
CHAPTER 2
LITERATURE REVIEW
2.1 EFFECT OF MOISTURE VARIATION ON CBR
Alayaki and Bajomo(2011) examined the effect of moisture variation on the strength
characteristics of laterite soil in Abeokuta, Ogun State, Nigeria.The result showed that an
increase in the soaking period of the compacted soil sample from 1to 5 days result in decrease in
the CBR of the soil. He observed thatthe top face of the soaking soil has a CBR value greater
than that at the bottom face.
Jaleel (2011)studied the effect of soaking on the top and bottom CBR value of a sub-base
material. He prepared fourteen CBR samples at 95% relative modified AASHTO compaction.
The results showed that, a significant drop in the CBR for top and bottom due tothe soaking was
observed.Most of decrease in soaking CBR value was pronouncedinthe first days for top and
bottom CBR, respectively. From the results of the testingconducted in this study on the effectof
soaking period on top and bottomsubbase for highway purpose,he concluded that the load
applied on thesubbase layer decreases withincrease of period soaking.
Ampadu (2006) examined the effect of water content on the CBR of a subgrade soil samples of
soil from a study site were prepared by laboratory compactionat the optimum water content using
different levels of compaction to obtain samplesat different densities. The remolded samples
were then subjected to different levelsof wetting in a water tank and different degrees of drying
in the laboratory and the CBR value were determined. From the laboratory CBR test results on a
subgrade material at different watercontents for three different dry densities, it may be concluded

6
that the rate ofchange in CBR per percentage change in water content during drying from
theOMC was 3 to 7 times larger than during wetting from OMC.
Singh et al.(2011) developed regression-based models for estimating soaking and unsoaking
California Bearing Ratio (CBR) values for fine-grained subgrade soils .Five locally available
soils werecollected from different zones of West Bengal. The samples were compacted at four
different levels of compaction (i.e.,50, 56, 65, and 75 blows) and at five different levels of
moisture contents on dry and wet sides of an optimum moisturecontent (OMC) of a soil (i.e., ±
2% OMC, ± 1% OMC, and OMC).Regression models were developedconsidering different
independent parameters namely, index properties of soils, degree of compaction, and
moisturecontent.It was observed that the CBR value, both soaking and unsoaking significantly
affected by change inmoisture content and compaction effort.
Ningsih et al.(2012) studied correlation between index properties and CBR tests of Pekanbaru
(Indonesia)soils with and without soaking.This research aims to make comparisons between
CBR soaking test results for CBR un-soaking in somevariation of clay content and make simple
comparisons between CBR soaking for CBR unsoaking by considering the soil properties. The
results showed that there was a linear correlation between the CBR soaking and CBR unsoaking
also influenced by the nature of the index (the properties of the soil).
Rahman(2010) studied the correlation between CBR results and physical properties of soil.
Correlation had been proposed in the study to predict the CBR values at top face of the soil
sample for Malaysia’s type of soil based on the collected soil data and results from laboratory
7
works. These correlations were developed based on the Maximum dry density (MDD), Optimum
moisture content(OMC) and the number of blows(of CBR test).
Hussain(2008) correlated between CBR value and Undrained Shear Strength from Vane Shear
Test. Several soil samples with different Plasticity Index and moisture content were compacted
and tested using CBR test and Vane Shear test to obtain the data to establish the correlation. He
found that CBR value and Undrained shear strength increases with increase of Plastic index.
CBR value and Undrained shear strength from Vane shear test of soil samples are inversely
proportional with the moisture content.
Cokca et al.(2003) studied the effects of compaction moisture contenton the shear strength of an
unsaturated clay. In this study, the effects of compaction moisture content and soaking on the
unsaturatedshear strength parameters ofclay were investigated. Experiments weredone on
samples compacted at optimum moisture content , on the dry side of optimum and on the wet
side of optimum .He found that angle of friction decreases rapidly with increasing moisture
contents , the cohesion component of shear strength attains its peak value at around optimum
Moisture content and then decreases.
ERES Division(2001) studiedcorrelation of CBR values withsoil index properties.The objective
of this study was to develop general correlations that describe the relationshipbetween Soil Index
Properties and the California Bearing Ratio (CBR) and Resilient Modulus(MR) of unbound
materials such as base, subbase, and subgrade layers in pavement systems.
8
Yasinet al. studied the Effect of Submergence on Subgrade Strength. His study aimed at
determining the effects of depth of submergence and duration of submergence on the subgrade
strength of soil samples collected from the Dhaka-Aricha highway. CBR tests were performed
with different heights of submergence after normal soaking period and also after prolonged
submergence. For the studied depth and duration of submergence, no effect of submergence on
sub-grade CBR strength could be found for any of the three types of soils tested.
Razouki et al.(2003) examined Long–term soaking effect on strength and deformation
characteristics of a gypsiferous subgrade soil. The behaviour during long-term soaking of the
California Bearing Ratio (CBR), the resilient modulus and the deformation of compacted Iraqi
gypsiferous soil containing about 34% gypsum was studied.Sixteen (CBR) samples compacted at
optimum moisture content and 95% of the maximum dry density of the modified AASHTO
compaction test were prepared.The paper reveals that a soaking period of four days can lead to
misleading and unsafe results regarding strength, stiffness and deformation of gypsiferous soils.
2.2 EFFECT OF MOISTURE VARIATION ON DIRECT SHEAR TEST
Kim(2011) studied the variation of shear strength of weathered granite soil with water content.
Thisstudy investigates the effects of initial water content and disturbance on the strength
reduction for both disturbedand undisturbed samples of weathered granite soil in Korea using
direct shear test.Several series of directshear tests were carried out on undisturbed or disturbed
samples with various water contents under normalstress ranging from 30 KPa to 140 KPa. He
found out that cohesion and friction angleof weathered granitesoils linearly decrease with an
increase in degree of saturation.

9
Blazejczak et al. (1995) investigated the effect of soil water conditions and soil compaction on
the age hardening process of loamy sand and silty loamy sand in relation to the tensile strength.
Soil samples were moulded at water contents 10%,15%,20% and compacted
upto1.35,1.45,1.55g/cm3. At intervals after moulding, the tensile strengths of the moist samples
were measured with the indirect tension test. High water content had a negative effect on the
tensile strength of soil at constant bulk density. High bulk density,however, had a positive effect
on tensile strength at constant water content.
10
CHAPTER 3
METHODOLOGY AND EXPERIMENTAL INVESTIGATIONS
INTRODUCTION
The entire study has been conducted on three types of soil,i.e. 1.Clayey Soil (from Bonai,
Sundergarh District), 2.Clayey soil(from Rajgangpur, Sundergarh District) and 3.Red Moorum
Soil(from NIT Rourkela campus).
Initially experiments were conducted to find out different properties of soil such as index
properties, grain size distribution and differential free swell index. Later on heavy compaction
tests were conducted to find out the optimum moisture content & corresponding maximum dry
density. Then CBR tests were made at different moisture contents including OMC and analysis
made to investigate the variation of CBR with respect to different days of soaking, i.e. from
unsoaked (day 0) to soaked (day 5). The variations were also made with regard to moisture
content at different layers along with different positions (east, west, north, south, centre
positions) and also the variations of moisture content with respect to different days of soaking
were observed.Direct Shear Test was also conducted on the soil samples.
3. 1 EXPERIMENTAL INVESTIGATIONS
Soils are classified with different engineering properties which affect the behavior of soil under
different conditions. These properties are described briefly here.

11
3.1.1 Liquid Limit
The liquid limit (LL) is the water content at which a soil changes from plastic to liquid behavior.
At this limit, the soil possesses a small value of shear strength, losing its ability to flow as a
liquid. In other words, the liquid limit is the minimum moisture content at which the soil tends to
flow as a liquid.
3.1.2 Plastic Limit
Plastic limit (PL) is the arbitrary limit of water content at which the soil tends to pass from the
plastic state to the semi-solid state of consistency. Thus, this is the minimum water content, at
which the change in shape of the soil is accompanied by visible cracks, i.e., when worked upon,
the soil crumbles.
3.1.3 Plasticity Index
Plasticity Index (PI) is the range of water content within which the soil exhibits plastic
properties, that is, it is the difference between liquid and plastic limits.
Plasticity Index (IP ) = Liquid Limit(WL) -Plastic Limit (WP)
3.1.4 Differential Free Swell
Free Swell Index is the increase in volume of a soil, without any external constraints, on
submergence in water.
12
Where, Vd = volume of soil specimen read from the graduated cylinder containing distilled
water.
Vk = volume of soil specimen read from the graduated cylinder containing kerosene.
3.1.5 Specific Gravity
Specific gravity of soil solids is defined as the ratio of unit weight of solids to the unit weight of
water at the standard temperature (4°C).
3.1.6 Sieve Analysis
About 1kg of soil was taken and it was washed thoroughly with water on 75 micron sieve
,soilretained on sieve was dried and weighed and used for sieve analysis .These dried soils
werepassed through stack of sieves like 4.75mm,2.36mm,1.18mm,600μm,300 μm,150 μm, 0.75
μm.
3.1.7 Modified Proctor Test
The Proctor compaction test is a laboratory method of experimentally determining the optimal
moisture content at which a given soil type will become most dense and achieve its maximum
dry density. The term Proctor is in honor of R. R. Proctor, who in 1933 showed that the dry
density of a soil for a given compactive effort depends on the amount of water the soil contains
during soil compaction. His original test is most commonly referred to as the standard Proctor
compaction test; later on, his test was updated to create the modified Proctor compaction test.
3.1.8 California Bearing Ratio Test

13
The CBR is a measure of resistance of a material to penetration of standard plunger under
controlled density and moisture conditions. The test procedure should be strictly adhered if high
degree of reproducibility is desired. The CBR test may be conducted in re-moulded or
undisturbed specimens in the laboratory. The test has been extensively investigated for field
correlation of flexible pavement thickness requirement.
Briefly, the test consists of causing a cylindrical plunger of 50mm diameter to penetrate a
pavement component material at 1.25mm/minute. The loads, for 2.5mm and 5mm are recorded.
This load is expressed as a percentage of standard load value at a respective deformation level to
obtain CBR value.
3.1.9 Direct Shear Test:
A direct shear test is a laboratory or field test used by geotechnical engineers to measure the
shearstrength properties of soil or rock material, or of discontinuities in soil or rock masses.

14
CHAPTER 4
RESULTS AND DISCUSSIONS
4.1 TYPE 1 SOIL
4.1.1 Index Properties
Theindex properties such as Liquid limit, Plastic limit, Plasticity Index value are presented in
Table4.1 as follows:
Table-4.1Index properties of type – 1 soil
Index property Experimental Value
Liquid Limit 55.29%
Plastic Limit 34.04%
Plasticity Index 21.25%
Specific Gravity 2.65
Differential Swell Index 57%
15
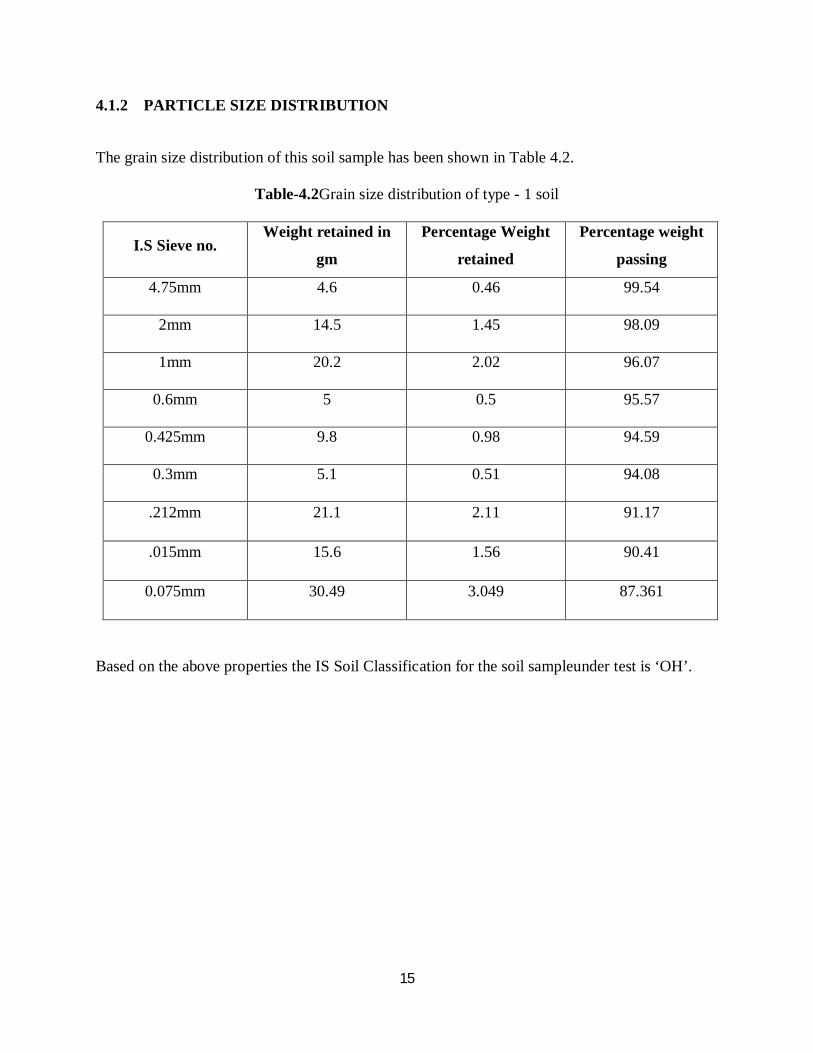
4.1.2 PARTICLE SIZE DISTRIBUTION
The grain size distribution of this soil sample has been shown in Table 4.2.
Table-4.2Grain size distribution of type - 1 soil
I.S Sieve no. Weight retained in
gm
Percentage Weight
retained
Percentage weight
passing
4.75mm 4.6 0.46 99.54
2mm 14.5 1.45 98.09
1mm 20.2 2.02 96.07
0.6mm 5 0.5 95.57
0.425mm 9.8 0.98 94.59
0.3mm 5.1 0.51 94.08
.212mm 21.1 2.11 91.17
.015mm 15.6 1.56 90.41
0.075mm 30.49 3.049 87.361
Based on the above properties the IS Soil Classification for the soil sampleunder test is ‘OH’.

16
4.1.3 Modified Proctor Compaction Test
The results of modified proctor compaction test are represented in figure 4.1:
Figure 4.1: Modified proctor compaction test for type – 1 soil
1.7
1.72
1.74
1.76
1.78
1.8
1.82
1.84
1.86
0 5 10 15 20 25
Dry
Dens
ity (g
m/c
c)
Water Content (%)
OMC - 16.4 %
MDD – 1.84 gm/cc
17
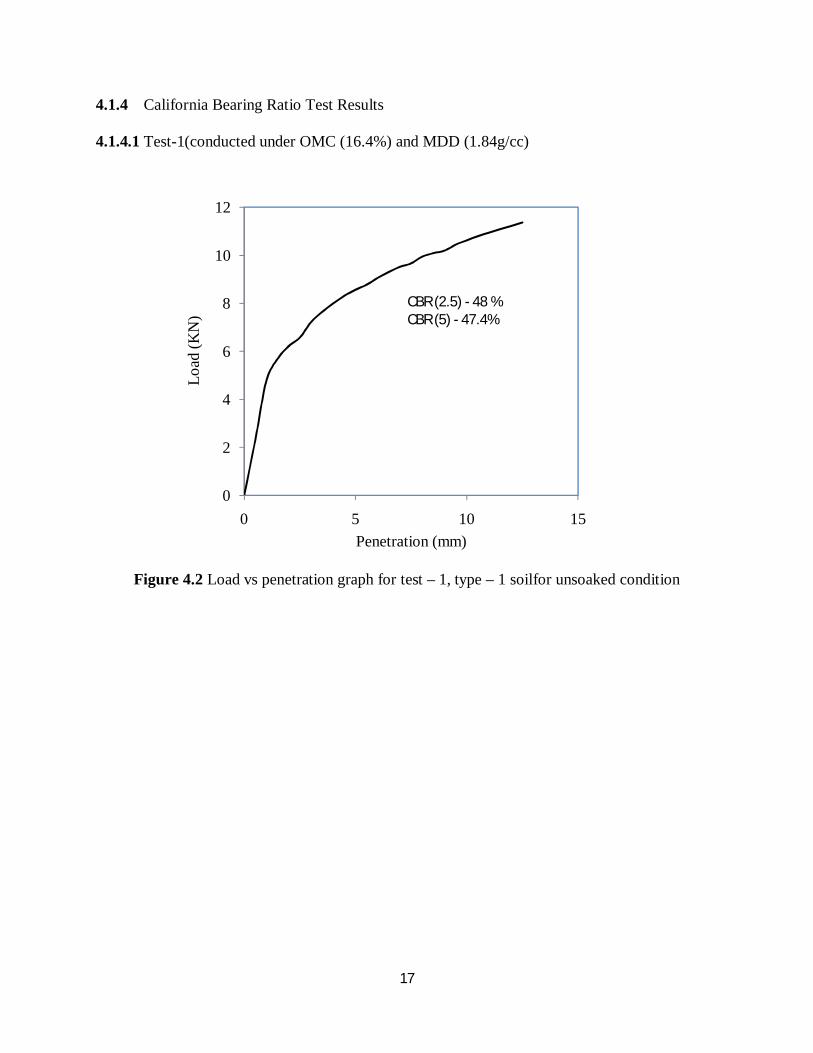
4.1.4 California Bearing Ratio Test Results
4.1.4.1 Test-1(conducted under OMC (16.4%) and MDD (1.84g/cc)
Figure 4.2 Load vs penetration graph for test – 1, type – 1 soilfor unsoaked condition
0
2
4
6
8
10
12
0 5 10 15
Load
(KN
)
Penetration (mm)
CBR (2.5) - 48 % CBR (5) - 47.4%

18
Figure 4.3 Load vs penetration graph for test –1, type – 1soil for soaked (day - 1) condition
Figure 4.4Load vs penetration graph for test –1, type – 1soil for soaked (day – 2) condition
0
0.1
0.2
0.3
0.4
0.5
0.6
0.7
0 5 10 15
Load
(KN
)
Penetration (mm)
CBR (2.5) - 2.9 %CBR (5) - 2.7 %
0
0.1
0.2
0.3
0.4
0.5
0.6
0.7
0 5 10 15
Load
(KN
)
Penetration (mm)
CBR (2.5) - 2.2 % CBR (5) - 2.1 %

19
Figure 4.5Load vs penetration graph for test –1, type – 1soil for soaked (day - 3) condition
Figure 4.6Load vs penetration graph for test –1, type – 1soil for soaked (day - 4) condition
0
0.1
0.2
0.3
0.4
0.5
0.6
0 5 10 15
Load
( K
N)
Penetration (mm)
CBR (2.5) - 1.9 % CBR (5) - 1.8 %
0
0.05
0.1
0.15
0.2
0.25
0.3
0.35
0.4
0 5 10 15
Load
(K
N)
Penetration (mm)
CBR (2.5) - 1.6 % CBR (5) - 1.52 %

20
Figure 4.7Load vspenetration graph for test –1, type – 1soil for soaked (day - 5) condition
0
0.05
0.1
0.15
0.2
0.25
0.3
0.35
0.4
0.45
0 5 10 15
Load
(KN
)
Penetration (mm)
CBR (2.5) – 1.5 %
CBR (5) – 1.4 %

21
MOISTURE VARIATION IN SOIL SAMPLE
Attempts have been made to take soil samples from various parts of a CBR sample for
determination of moisture content, as per the schematic diagram given in Figure 4.8. Middle
layer is almost in the middle of the sample (vertical level). The top and bottom layers are about
15 cm from the top and bottom of a sample respectively. The east and west for each layer
(horizontal) indicate towards left and right side of the sample respectively, while north and south
represent samples away and towards the observer respectively.
Figure 4.8 Horizontal and vertical positions of soil sample

22
Table 4.3 Moisture content for test- 1,type – 1 soil for soaked (day - 1) condition
Vertical
Positions
MOISTURE CONTENTS%
Horizontal Positions
EAST WEST NORTH SOUTH CENTRE
TOP 16.93 17.52 17.74 18.90 18.64
MIDDLE 16.77 16.56 16.65 16.50 16.70
BOTTOM 16.62 17.80 15.65 16.49 16.73
Table4.4 Moisture content for test -1, type – 1 soil for soaked (day - 2) condition
Vertical
Positions
MOISTURE CONTENTS%
Horizontal Positions
EAST WEST NORTH SOUTH CENTRE
TOP 26.48 26.92 24.26 23.36 25.12
MIDDLE 18.84 18.57 18.76 18.54 18.49
BOTTOM 17.34 17.66 17.84 18.17 17.96

23
Table4. 5 Moisture content for test – 1, type – 1 soil for soaked (day - 3) condition
Vertical
Positions
MOISTURE CONTENTS%
Horizontal Positions
EAST WEST NORTH SOUTH CENTRE
TOP 24.52 24.28 24.78 24.88 23.98
MIDDLE 19.70 20.03 20.44 20.88 19.63
BOTTOM 17.75 17.86 18.33 17.78 18.72
Table4.6 Moisture content for test – 1, Type – 1 soil for soaked (day - 4) condition
Vertical
Positions
MOISTURE CONTENTS%
Horizontal Positions
EAST WEST NORTH SOUTH CENTRE
TOP 25.52 24.97 24.60 24.67 25.40
MIDDLE 19.33 20.94 21.43 22.75 22.7
BOTTOM 20.64 19.57 19.82 20.22 21.84

24
Table4.7 Moisture content for test – 1, type – 1 soil for soaked (day - 5) condition
Vertical
Positions
MOISTURE CONTENTS%
Horizontal Positions
EAST WEST NORTH SOUTH CENTRE
TOP 28.18 26.25 26.25 25.68 25.55
MIDDLE 24.43 22.96 22.39 21.87 23.09
BOTTOM 22.39 19.40 20..75 21.74 20.61
4.1.4.2 Test 2 (98% dry side) under moisture content (12.89%) and dry density (1.8g/cc)
Figure 4.9Load vs penetration graph for test –2, type – 1soil for unsoaked condition
0
2
4
6
8
10
12
0 5 10 15
Load
( K
N)
Penetration in mm
CBR(2.5) - 35.03 %CBR(5) - 33.23 %

25
Figure 4.10Load vs penetration graph for test –2, type – 1soil for soaked (day-1) condition
Figure 4.11Load vs penetration graph for test –2, type – 1soil for soaked (day-2) condition
0
0.1
0.2
0.3
0.4
0.5
0.6
0 5 10 15
Load
(K
N)
Penetration (mm)
CBR(2.5) - 1.98 %CBR(5) - 1.85 %
0
0.05
0.1
0.15
0.2
0.25
0.3
0.35
0.4
0.45
0.5
0 5 10 15
Load
(KN
)
Penetration (mm)
CBR(2.5) - 1.87 %CBR(5) - 1.83 %

26
Figure 4.12Load vs penetration graph for test –2, type – 1soil for soaked (day-3) condition
Figure 4.13Load vs penetration graph for test –2, type – 1soil for soaked (day-4) condition
0
0.1
0.2
0.3
0.4
0.5
0.6
0 5 10 15
Load
(KN
)
Penetration (mm)
0
0.1
0.2
0.3
0.4
0.5
0.6
0 5 10 15
Load
( K
N)
Penetration (mm)
CBR(2.5) - 1.98 % CBR(5) - 1.85 %
CBR(2.5) - 1.71 % CBR(5) - 1.69 %

27
Figure 4.14Load vs penetration graph for test –2, type – 1soil for soaked (day-5) condition
0
0.1
0.2
0.3
0.4
0.5
0.6
0 5 10 15
Load
( K
N)
Penetration (mm)
CBR(2.5) - 1.54 %CBR(5) - 1.48 %

28
MOISTURE VARIATION IN SOIL SAMPLE
Table 4.8 Moisture content for test – 2, type – 1 soil for soaked (day - 1) condition
Vertical
Positions
MOISTURE CONTENTS%
Horizontal Positions
EAST WEST NORTH SOUTH CENTRE
TOP 13.93 13.52 14.41 13.90 14.56
MIDDLE 14.36 14.78 14.38 13.69 13.44
BOTTOM 13.08 13.65 13.68 13.49 13.73
Table 4.9 Moisture content for test – 2, type – 1 soil for soaked (day - 2) condition
Vertical
Positions
MOISTURE CONTENTS%
Horizontal Positions
EAST WEST NORTH SOUTH CENTRE
TOP 18.96 20.39 21.39 23.54 22.08
MIDDLE 20.14 21.11 22.17 20.17 20.87
BOTTOM 19.68 17.58 17.77 18.25 18.81
Table 4.10 Moisture content for test – 2, type – 1 soil for soaked (day - 3) condition
Vertical
Positions
MOISTURE CONTENTS%
Horizontal Positions
EAST WEST NORTH SOUTH CENTRE
TOP 24.26 23.09 23.55 24.96 22.09
MIDDLE 20.11 21.30 20.85 21.33 22.47
BOTTOM 19.35 18.56 18.25 19.09 20.01
29
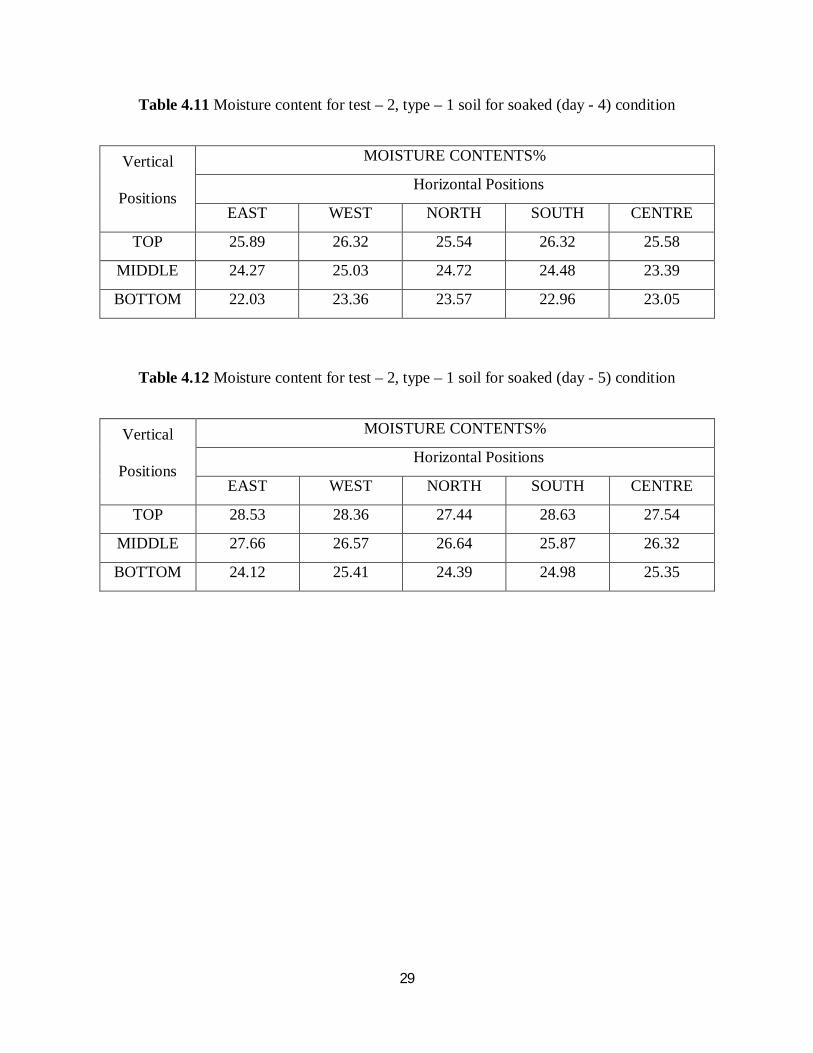
Table 4.11 Moisture content for test – 2, type – 1 soil for soaked (day - 4) condition
Vertical
Positions
MOISTURE CONTENTS%
Horizontal Positions
EAST WEST NORTH SOUTH CENTRE
TOP 25.89 26.32 25.54 26.32 25.58
MIDDLE 24.27 25.03 24.72 24.48 23.39
BOTTOM 22.03 23.36 23.57 22.96 23.05
Table 4.12 Moisture content for test – 2, type – 1 soil for soaked (day - 5) condition
Vertical
Positions
MOISTURE CONTENTS%
Horizontal Positions
EAST WEST NORTH SOUTH CENTRE
TOP 28.53 28.36 27.44 28.63 27.54
MIDDLE 27.66 26.57 26.64 25.87 26.32
BOTTOM 24.12 25.41 24.39 24.98 25.35

30
4.1.4.3Test 3 (98% wet side) under moisture content (17.8%) and dry density (1.8g/cc)
Figure 4.15Load vs penetration graph for test –3, type – 1soil for unsoakedcondition
Figure 4.16Load vs penetration graph for test –3, type – 1soil for soaked (day-1) condition
0
1
2
3
4
5
6
0 5 10 15
Load
(KN
)
Penetration (mm)
0
0.2
0.4
0.6
0.8
1
1.2
1.4
1.6
1.8
2
0 5 10 15
Load
( K
N)
Penetration (mm)
CBR(2.5) - 2.22 %CBR(5) – 2.05%
CBR(2.5) - 37.47 %
CBR(5) – 36.5%

31
Figure 4.17Load vs penetration graph for test –3, type – 1soil for soaked (day-2) condition
Figure 4.18Load vs penetration graph for test –3, type – 1soil for soaked (day-3) condition
0
0.1
0.2
0.3
0.4
0.5
0.6
0.7
0.8
0 5 10 15
Load
(KN
)
Penetration (mm)
CBR(2.5) - 1.97 %CBR(5) – 1.88 %
0
0.1
0.2
0.3
0.4
0.5
0.6
0 5 10 15
Load
(KN
)
Penetration (mm)
CBR(2.5) - 1.82 %CBR(5) – 1.76 %
32
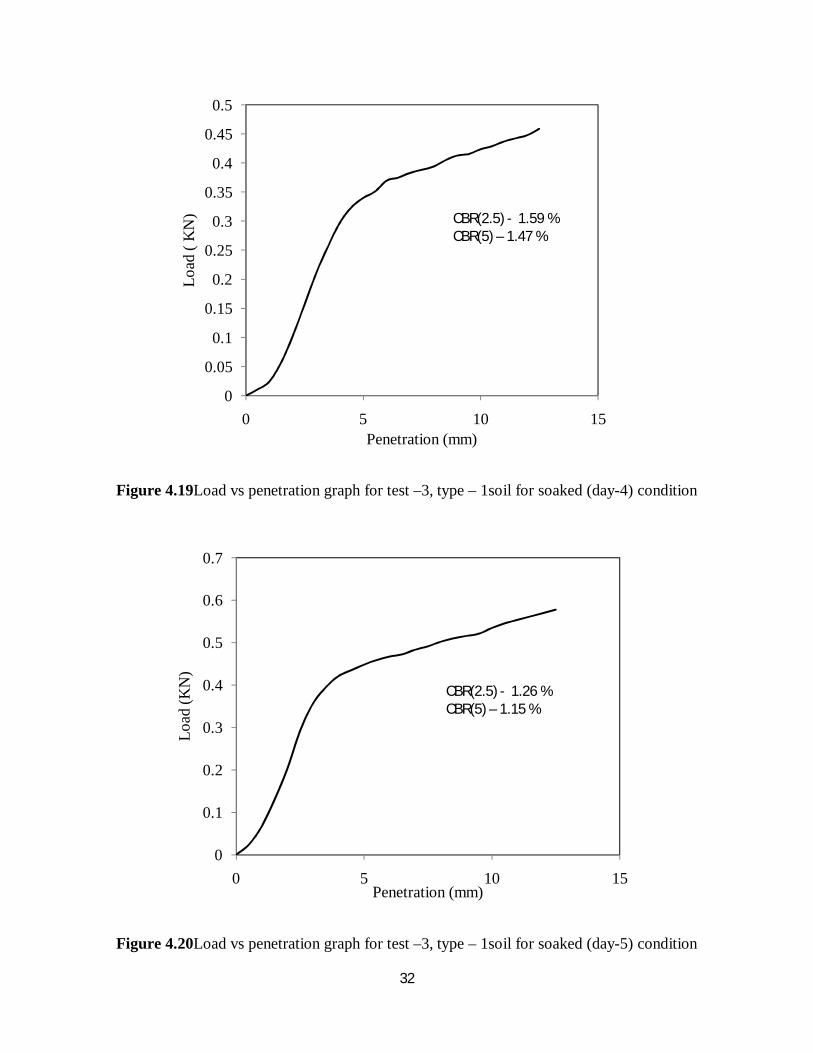
Figure 4.19Load vs penetration graph for test –3, type – 1soil for soaked (day-4) condition
Figure 4.20Load vs penetration graph for test –3, type – 1soil for soaked (day-5) condition
0
0.05
0.1
0.15
0.2
0.25
0.3
0.35
0.4
0.45
0.5
0 5 10 15
Load
( K
N)
Penetration (mm)
CBR(2.5) - 1.59 %CBR(5) – 1.47 %
0
0.1
0.2
0.3
0.4
0.5
0.6
0.7
0 5 10 15
Load
(KN
)
Penetration (mm)
CBR(2.5) - 1.26 %CBR(5) – 1.15 %

33
MOISTURE VARIATION IN SOIL SAMPLE
Table 4.13 Moisture content for test – 3, type – 1 soil for soaked (day - 1) condition
Vertical
Positions
MOISTURE CONTENTS%
Horizontal Positions
EAST WEST NORTH SOUTH CENTRE
TOP 23.37 23.27 23.45 23.69 20.64
MIDDLE 20.47 22.01 21.25 22.02 20.33
BOTTOM 19.83 20.93 21.25 21.11 19.42
Table 4.14 Moisture content for test – 3, type – 1 soil for soaked (day - 2) condition
Vertical
Positions
MOISTURE CONTENTS%
Horizontal Positions
EAST WEST NORTH SOUTH CENTRE
TOP 23.24 23.79 23.21 23.62 22.38
MIDDLE 21.90 21.46 21.57 21.69 20.60
BOTTOM 21.64 21.46 21.92 21.77 20.88
Table 4.15 Moisture content for test – 3, type – 1 soil for soaked (day -3) condition
Vertical
Positions
MOISTURE CONTENTS%
Horizontal Positions
EAST WEST NORTH SOUTH CENTRE
TOP 25.08 26.68 26.37 25.24 24.56
MIDDLE 21.62 22.44 21.68 20.01 20.49
BOTTOM 19.37 20.35 20.08 19.65 20.47

34
Table 4.16 Moisture content for test –3, type – 1 soil for soaked (day - 4) condition
Vertical
Positions
MOISTURE CONTENTS%
Horizontal Positions
EAST WEST NORTH SOUTH CENTRE
TOP 25.53 25.48 24.35 24.34 25.57
MIDDLE 21.28 22.20 20.88 20.80 20.44
BOTTOM 19.07 19.56 19.55 18.46 19.12
Table 4.17 Moisture content for test –3, type – 1 soil for soaked (day - 5) condition
Vertical
Positions
MOISTURE CONTENTS%
Horizontal Positions
EAST WEST NORTH SOUTH CENTRE
TOP 27.68 27.91 26.22 25.96 25.47
MIDDLE 22.01 21.06 20.65 20.86 20.56
BOTTOM 20.10 19.37 19.39 19.15 21.72

35
4.1.1.4Test 4 (97% dry side) under moisture content (12.2%) and dry density (1.78g/cc)
Figure 4.21Load vs penetration graph for test –4, type – 1soil for unsoakedcondition
Figure 4.22Load vs penetration graph for test –4, type – 1soil for soaked (day-1) condition
0
2
4
6
8
10
12
14
0 5 10 15
Load
(KN
)
Penetration (mm)
CBR(2.5) - 30.46 %CBR(5) – 29.27 %
0
0.1
0.2
0.3
0.4
0.5
0.6
0.7
0 5 10 15
Load
(KN
)
Penetration (mm)
CBR(2.5) - 3.9 %CBR(5) – 3.73 %

36
Figure 4.23Load vs penetration graph for test –4, type – 1soil for soaked (day-2) condition
Figure 4.24Load vs penetration graph for test –4, type – 1soil for soaked (day-3) condition
0
0.05
0.1
0.15
0.2
0.25
0.3
0.35
0 5 10 15
load
( K
N)
penetration (mm)
CBR(2.5) - 2.31%CBR(5) – 2.28 %
0
0.05
0.1
0.15
0.2
0.25
0.3
0.35
0.4
0.45
0 5 10 15
Load
( K
N)
Penetration (mm)
CBR(2.5) - 2.1 %CBR(5) – 2.05 %

37
Figure 4.25Load vs penetration graph for test –4, type – 1soil for soaked (day-4) condition
Figure 4.26Load vs penetration graph for test –4, type – 1soil for soaked (day-5) condition
0
0.05
0.1
0.15
0.2
0.25
0.3
0.35
0.4
0 5 10 15
Load
(KN
)
Penetration (mm)
0
0.05
0.1
0.15
0.2
0.25
0.3
0.35
0.4
0 5 10 15
Load
(KN
)
Penetration in mm
CBR(2.5) - 1.92 %CBR(5) – 1.88 %
CBR(2.5) - 2.00 %
CBR(5) – 1.95 %

38
MOISTURE VARIATION IN SOIL SAMPLE
Table 4.18Moisture content for test – 4, type – 1 soil for soaked (day - 1) condition
Vertical
Positions
MOISTURE CONTENTS%
Horizontal Positions
EAST WEST NORTH SOUTH CENTRE
TOP 23.28 21.85 24.40 23.97 23.42
MIDDLE 17.25 17.46 17.18 16.95 16.64
BOTTOM 16.77 16.37 15.93 15.67 15.92
Table 4.19Moisture content for test – 4, type – 1 soil for soaked (day - 2) condition
Vertical
Positions
MOISTURE CONTENTS%
Horizontal Positions
EAST WEST NORTH SOUTH CENTRE
TOP 26.32 26.30 24.79 24.29 25.11
MIDDLE 21.69 21.99 23.18 22.31 20.96
BOTTOM 20.06 18.59 19.82 19.49 20.02
Table 4.20Moisture content for test – 4, type – 1 soil for soaked (day - 3) condition
Vertical
Positions
MOISTURE CONTENTS%
Horizontal Positions
EAST WEST NORTH SOUTH CENTRE
TOP 28.28 25.91 27.68 28.28 28.10
MIDDLE 25.64 17.58 21.62 22.57 23.59
BOTTOM 21.33 19.92 17.57 19.24 19.58

39
Table 4.21Moisture content for test – 4, type – 1 soil for soaked (day - 4) condition
Vertical
Positions
MOISTURE CONTENTS%
Horizontal Positions
EAST WEST NORTH SOUTH CENTRE
TOP 29.56 28.44 28.61 29.03 29.12
MIDDLE 26.09 25.32 25.59 25.60 26.46
BOTTOM 22.09 21.84 20.93 21.78 22.85
Table 4.22.Moisture content for test – 4, type – 1 soil for soaked (day - 5) condition
Vertical
Positions
MOISTURE CONTENTS%
Horizontal Positions
EAST WEST NORTH SOUTH CENTRE
TOP 31.49 31.40 31.27 30.75 29.37
MIDDLE 28.40 28.18 27.70 27.87 27.84
BOTTOM 27.42 26.15 27.20 26.83 26.27

40
4.1.1.5Test 5 (97% wet side) under moisture content (19%) and dry density (1.78g/cc)
Figure 4.27Load vs penetration graph for test –5, type – 1soil for unsoakedcondition
Figure 4.28Load vs penetration graph for test –5, type – 1soil for soaked (day-1) condition
0
1
2
3
4
5
6
0 5 10 15
Load
(KN
)
Penetration in mm
0
0.2
0.4
0.6
0.8
1
1.2
1.4
1.6
1.8
2
0 5 10 15
Load
( K
N)
Penetration (mm)
CBR(2.5) - 34.62 % CBR(5) – 33.25 %
CBR(2.5) - 3.9 % CBR(5) – 3.76 %

41
Figure 4.29Load vs penetration graph for test –5, type – 1soil for soaked (day-2) condition
Figure 4.30Load vs penetration graph for test –5, type – 1soil for soaked (day-3) condition
0
0.1
0.2
0.3
0.4
0.5
0.6
0.7
0.8
0 2 4 6 8 10 12 14
Load
( K
N)
Penetration (mm)
0
0.1
0.2
0.3
0.4
0.5
0.6
0 5 10 15
Load
( KN
)
Penetration (mm)
CBR(2.5) - 1.66 % CBR(5) – 1.58 %
CBR(2.5) - 1.5 %
CBR(5) – 1.39 %
42
Figure 4.31Load vs penetration graph for test –5, type – 1soil for soaked (day-4) condition
Figure 4.32Load vs penetration graph for test –5, type – 1soil for soaked (day-5) condition
0
0.05
0.1
0.15
0.2
0.25
0.3
0.35
0.4
0.45
0.5
0 5 10 15
Load
(K
N)
Penetration (mm)
0
0.1
0.2
0.3
0.4
0.5
0.6
0.7
0 5 10 15
Load
( K
N)
Penetration (mm)
CBR(2.5) - 1.11 % CBR(5) – 1.05 %
CBR(2.5) - 0.97 % CBR(5) – 0.80 %

43
MOISTURE VARIATION IN SOIL SAMPLE
Table 4.23Moisture content for test – 5, type – 1 soil for soaked (day - 1) condition
Vertical
Positions
MOISTURE CONTENTS%
Horizontal Positions
EAST WEST NORTH SOUTH CENTRE
TOP 23.28 21.85 24.40 23.97 23.42
MIDDLE 22.32 21.58 22.37 21.87 22.45
BOTTOM 21.04 20.96 21.67 21.56 20.97
Table 4.24Moisture content for test – 5, type – 1 soil for soaked (day - 2) condition
Vertical
Positions
MOISTURE CONTENTS%
Horizontal Positions
EAST WEST NORTH SOUTH CENTRE
TOP 24.26 24.98 23.02 23.30 26.50
MIDDLE 23.38 23.88 23.47 22.97 23.77
BOTTOM 22.25 22.83 21.37 22.54 22.31
Table 4.25 Moisture content for test – 5, type – 1 soil for soaked (day - 3) condition
Vertical
Positions
MOISTURE CONTENTS%
Horizontal Positions
EAST WEST NORTH SOUTH CENTRE
TOP 25.29 26.46 20.83 25.15 27.15
MIDDLE 24.42 24.69 24.15 23.87 25.53
BOTTOM 23.51 24.04 21.29 22.31 22.24

44
Table 4.26Moisture content for test – 5, type – 1 soil for soaked (day - 4) condition
Vertical
Positions
MOISTURE CONTENTS%
Horizontal Positions
EAST WEST NORTH SOUTH CENTRE
TOP 27.86 28.51 26.69 27.53 26.72
MIDDLE 26.65 27.46 25.52 24.87 25.69
BOTTOM 23.38 24.54 24.29 25.13 24.62
Table 4.27Moisture content for test – 5, type – 1 soil for soaked (day - 5) condition
Vertical
Positions
MOISTURE CONTENTS%
Horizontal Positions
EAST WEST NORTH SOUTH CENTRE
TOP 28.96 29.34 28.54 28.71 28.63
MIDDLE 26.67 26.37 25.93 25.63 27.84
BOTTOM 25.27 25.95 25.30 26.08 26.37
45
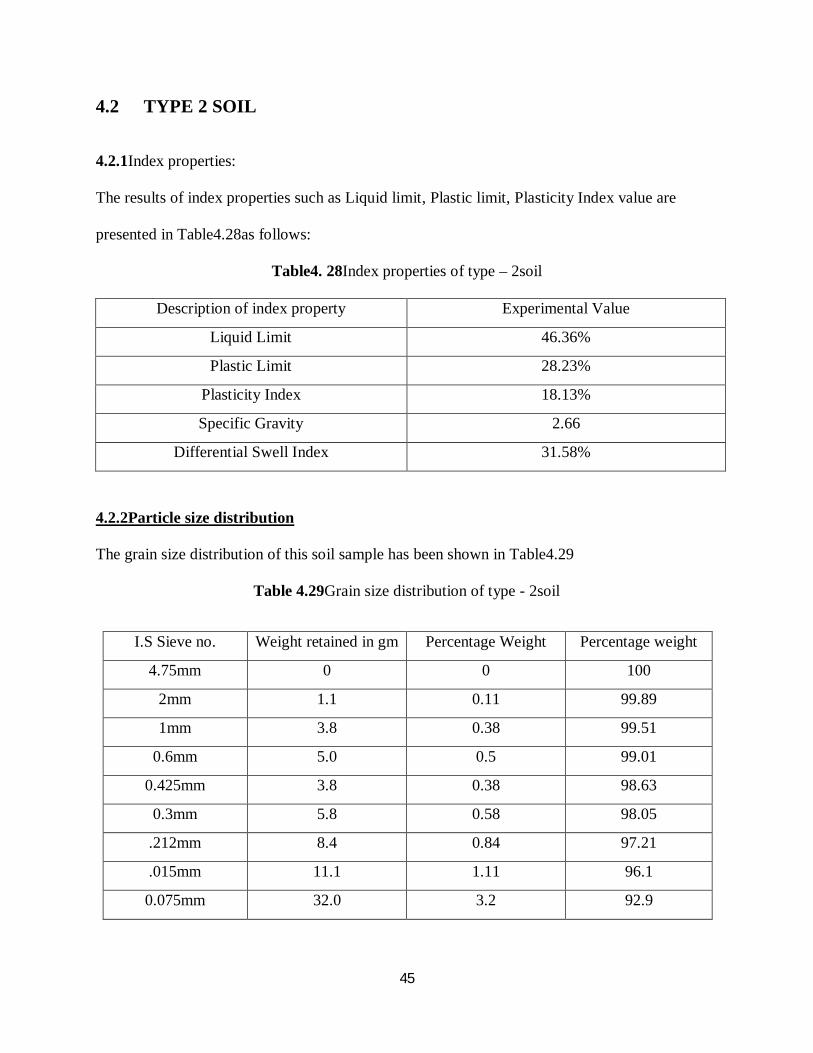
4.2 TYPE 2 SOIL
4.2.1Index properties:
The results of index properties such as Liquid limit, Plastic limit, Plasticity Index value are
presented in Table4.28as follows:
Table4. 28Index properties of type – 2soil
Description of index property Experimental Value
Liquid Limit 46.36%
Plastic Limit 28.23%
Plasticity Index 18.13%
Specific Gravity 2.66
Differential Swell Index 31.58%
4.2.2Particle size distribution
The grain size distribution of this soil sample has been shown in Table4.29
Table 4.29Grain size distribution of type - 2soil
I.S Sieve no. Weight retained in gm Percentage Weight Percentage weight
4.75mm 0 0 100
2mm 1.1 0.11 99.89
1mm 3.8 0.38 99.51
0.6mm 5.0 0.5 99.01
0.425mm 3.8 0.38 98.63
0.3mm 5.8 0.58 98.05
.212mm 8.4 0.84 97.21
.015mm 11.1 1.11 96.1
0.075mm 32.0 3.2 92.9

46
Based on the above properties the IS Soil Classification for the soil sample under test is ‘CI’
4.2.3Modified Proctor Compaction Test
The results of modified proctor compaction test are represented in figure:
Figure 4.33:Modified proctor compaction test for type – 2 soil
1.7
1.72
1.74
1.76
1.78
1.8
1.82
1.84
1.86
0 5 10 15 20 25
DRY
DEN
SITY
M.C
OMC – 14.8 %
MDD – 1.85 gm/cc
47
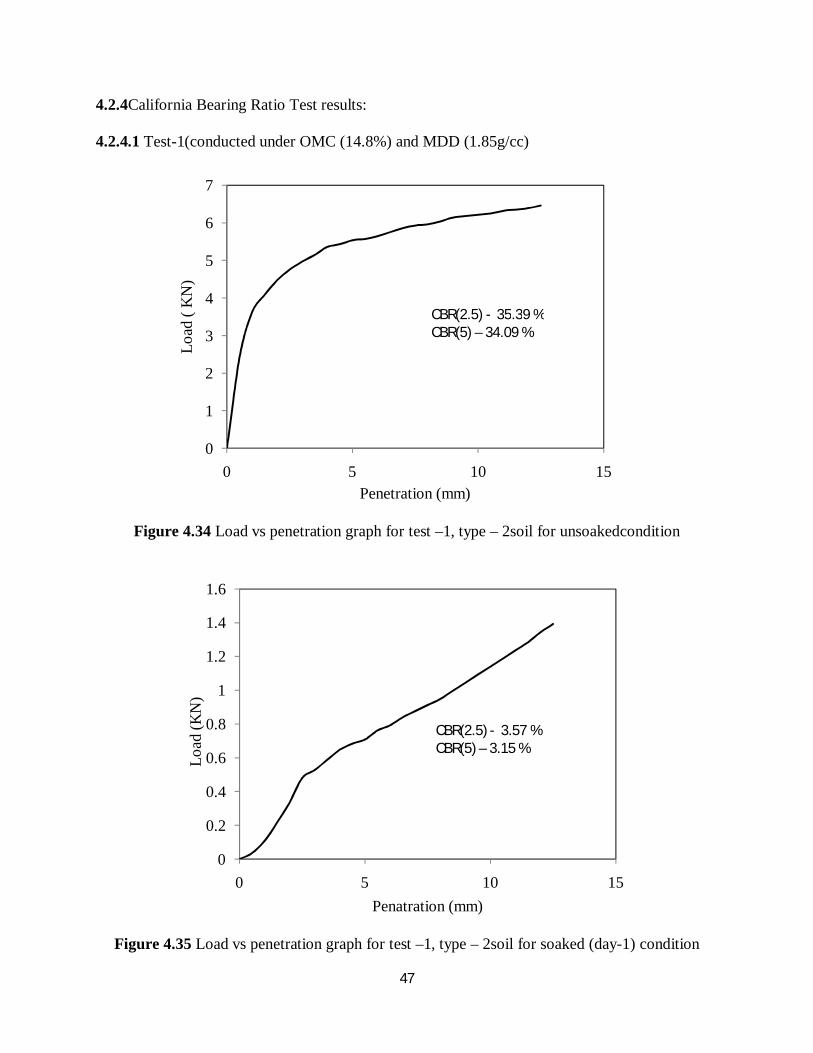
4.2.4California Bearing Ratio Test results:
4.2.4.1 Test-1(conducted under OMC (14.8%) and MDD (1.85g/cc)
Figure 4.34 Load vs penetration graph for test –1, type – 2soil for unsoakedcondition
Figure 4.35 Load vs penetration graph for test –1, type – 2soil for soaked (day-1) condition
0
1
2
3
4
5
6
7
0 5 10 15
Load
( K
N)
Penetration (mm)
0
0.2
0.4
0.6
0.8
1
1.2
1.4
1.6
0 5 10 15
Load
(KN
)
Penatration (mm)
CBR(2.5) - 3.57 %CBR(5) – 3.15 %
CBR(2.5) - 35.39 % CBR(5) – 34.09 %

48
Figure 4.36 Load vs penetration graph for test –1, type – 2soil for soaked (day-2) condition
Figure 4.37 Load vs penetration graph for test –1, type – 2 soil for soaked (day-3) condition
0
0.1
0.2
0.3
0.4
0.5
0.6
0.7
0.8
0.9
1
0 5 10 15
Load
( K
N)
Penetration (mm)
CBR(2.5) - 2.9 %CBR(5) – 2.81 %
0
0.2
0.4
0.6
0.8
1
1.2
0 5 10 15
Load
( K
N)
Penetration (mm)
CBR(2.5) - 2.67 %CBR(5) – 2.65 %

49
Figure 4.38 Load vs penetration graph for test –1, type – 2soil for soaked (day-4) condition
Figure 4.39 Load vs penetration graph for test –1, type – 2soil for soaked (day-5) condition
0
0.2
0.4
0.6
0.8
1
1.2
0 5 10 15
Load
(KN
)
Penetration (mm)
CBR(2.5) - 2.5 %CBR(5) – 2.4 %
0
0.05
0.1
0.15
0.2
0.25
0.3
0.35
0.4
0.45
0.5
0 5 10 15
Load
( KN
)
Penetration (mm)
CBR(2.5) - 1.13 %CBR(5) – 1.09 %

50
MOISTURE VARIATION IN SOIL SAMPLE
Table 4.30Moisture content for test – 1, type – 2 soil for soaked (day - 1) condition
Vertical
Positions
MOISTURE CONTENTS%
Horizontal Positions
EAST WEST NORTH SOUTH CENTRE
TOP 17.19 17.52 17.89 17.66 17.57
MIDDLE 16.43 17.02 17.15 16.88 17.02
BOTTOM 16.49 16.94 16.69 16.59 16.82
Table 4.31Moisture content for test – 1, type – 2 soil for soaked (day - 2) condition
Vertical
Positions
MOISTURE CONTENTS%
Horizontal Positions
EAST WEST NORTH SOUTH CENTRE
TOP 20.15 21.08 21.35 20.28 21.49
MIDDLE 19.43 20.63 19.38 20.07 18.80
BOTTOM 18.55 20.07 16.39 19.85 18.24
Table 4.32Moisture content for test – 1, type – 2 soil for soaked (day - 3) condition
Vertical
Positions
MOISTURE CONTENTS%
Horizontal Positions
EAST WEST NORTH SOUTH CENTRE
TOP 22.04 19.77 21.67 20.76 21.23
MIDDLE 19.70 18.19 20.44 20.88 18.25
BOTTOM 19.25 19.45 17.33 19.14 18.24

51
Table 4.33Moisture content for test – 1, type – 2 soil for soaked (day - 4) condition
Vertical
Positions
MOISTURE CONTENTS%
Horizontal Positions
EAST WEST NORTH SOUTH CENTRE
TOP 23.21 22.87 23.28 23.02 22.63
MIDDLE 23.85 20.57 21.88 20.03 21.92
BOTTOM 20.45 20.37 19.66 20.08 19.63
Table 4.34Moisture content for test – 1, type – 2 soil for soaked (day - 5) condition
Vertical
Positions
MOISTURE CONTENTS%
Horizontal Positions
EAST WEST NORTH SOUTH CENTRE
TOP 25.34 24.65 25.13 24.78 25.54
MIDDLE 23.31 22.57 22.85 21.19 23.64
BOTTOM 21.14 21.57 21.36 20.96 20.87

52
4.2.4.2Test 2 (98% dry side) under moisture content (12.46%) and dry density (1.82g/cc)
Figure 4.40 Load vs penetration graph for test –2, type – 2soil for un soaked condition
Figure 4.41 Load vs penetration graph for test –2, type – 2 soil for soaked (day-1) condition
0
2
4
6
8
10
12
0 5 10 15
Load
(KN
)
Penetration (mm)
0
0.1
0.2
0.3
0.4
0.5
0.6
0 5 10 15
Load
(K
N)
Penetration (mm)
CBR(2.5) - 1.96 %CBR(5) – 1.84 %
CBR(2.5) - 31.77 % CBR(5) – 30.87 %

53
Figure 4.42 Load vs penetration graph for test –2, type – 2 soil for soaked (day-2) condition
Figure 4.43 Load vs penetration graph for test –2, type – 2 soil for soaked (day-3) condition
0
0.5
1
1.5
2
2.5
3
3.5
4
4.5
5
0 5 10 15
Load
(KN
)
Penetration (mm)
0
0.1
0.2
0.3
0.4
0.5
0.6
0 5 10 15
Load
(K
N)
Penetration (mm)
CBR(2.5) - 2.6 % CBR(5) – 2.57 %
CBR(2.5) - 1.87 % CBR(5) – 1.72 %

54
Figure 4.44 Load vs penetration graph for test –2, type – 2 soil for soaked (day-4) condition
Figure 4.45 Load vs penetration graph for test –2, type – 2 soil for soaked (day-5) condition
0
0.1
0.2
0.3
0.4
0.5
0.6
0 5 10 15
Load
( K
N)
Penetration (mm)
0
0.1
0.2
0.3
0.4
0.5
0.6
0.7
0 5 10 15
Load
(KN
)
Penetration (mm)
CBR(2.5) - 0.90 %CBR(5) – 0.78 %
CBR(2.5) - 1.56 %
CBR(5) – 1.45 %

55
MOISTURE VARIATION IN SOIL SAMPLE
Table 4.35 Moisture content for test – 2, type – 2 soil for soaked (day - 1) condition
Vertical
Positions
MOISTURE CONTENTS%
Horizontal Positions
EAST WEST NORTH SOUTH CENTRE
TOP 16.55 16.22 16.87 17.30 19.88
MIDDLE 14.21 14.29 14.93 15.19 15.04
BOTTOM 14.37 13.94 14.64 13.45 13.35
Table 4.36 Moisture content for test – 2, type – 2 soil for soaked (day - 2) condition
Vertical
Positions
MOISTURE CONTENTS%
Horizontal Positions
EAST WEST NORTH SOUTH CENTRE
TOP 18.65 18.88 17.96 18.02 18.56
MIDDLE 17.25 16.54 15.47 16.23 16.87
BOTTOM 15.44 15.36 14.98 15.56 15.87
Table 4.37 Moisture content for test – 2, type – 2 soil for soaked (day - 3) condition
Vertical
Positions
MOISTURE CONTENTS%
Horizontal Positions
EAST WEST NORTH SOUTH CENTRE
TOP 23.83 24.22 24.55 23.76 24.26
MIDDLE 21.68 20.87 20.86 21.74 22.19
BOTTOM 20.72 21.12 20.66 20.78 21.58
56
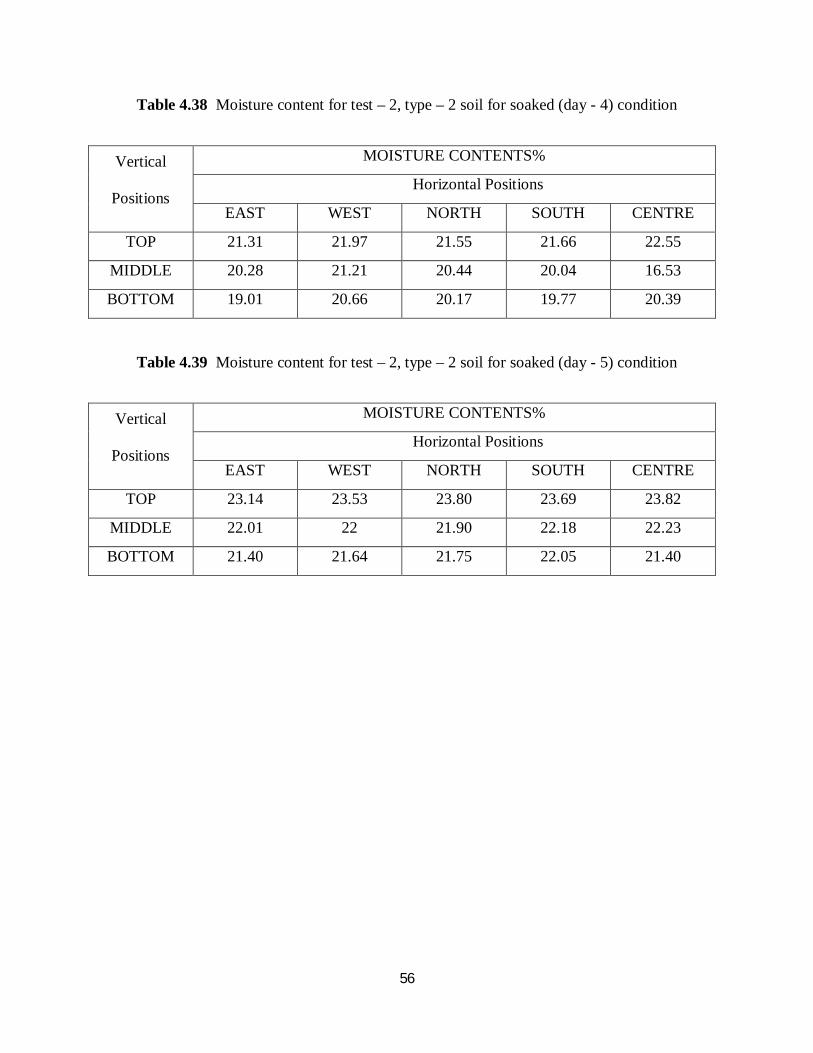
Table 4.38 Moisture content for test – 2, type – 2 soil for soaked (day - 4) condition
Vertical
Positions
MOISTURE CONTENTS%
Horizontal Positions
EAST WEST NORTH SOUTH CENTRE
TOP 21.31 21.97 21.55 21.66 22.55
MIDDLE 20.28 21.21 20.44 20.04 16.53
BOTTOM 19.01 20.66 20.17 19.77 20.39
Table 4.39 Moisture content for test – 2, type – 2 soil for soaked (day - 5) condition
Vertical
Positions
MOISTURE CONTENTS%
Horizontal Positions
EAST WEST NORTH SOUTH CENTRE
TOP 23.14 23.53 23.80 23.69 23.82
MIDDLE 22.01 22 21.90 22.18 22.23
BOTTOM 21.40 21.64 21.75 22.05 21.40

57
4.2.4.3Test 3 (98% wet side) under moisture content (16.25%) and dry density (1.82g/cc)
Figure 4.46 Load vs penetration graph for test –3, type – 2 soil for unsoakedcondition
Figure 4.47 Load vs penetration graph for test –3, type – 2 soil for soaked (day-1) condition
0
0.5
1
1.5
2
2.5
3
0 5 10 15
Load
(KN
)
Penetration (mm)
CBR(2.5) - 33.05 %CBR(5) – 32.57 %
0
0.2
0.4
0.6
0.8
1
1.2
1.4
0 5 10 15
Load
(K
N)
Penetration (mm)
CBR(2.5) - 2.12 %CBR(5) – 2.08 %

58
Figure 4.48 Load vs penetration graph for test –3, type – 2 soil for soaked (day-2) condition
Figure 4.49 Load vs penetration graph for test –3, type – 2 soil for soaked (day-3) condition
0
0.1
0.2
0.3
0.4
0.5
0.6
0.7
0.8
0 5 10 15
Load
( K
N)
Penetration (mm)
CBR(2.5) - 2.08%CBR(5) – 1.96 %
0
0.1
0.2
0.3
0.4
0.5
0.6
0 5 10 15
Load
(KN
)
Penetration (mm)
CBR(2.5) - 1.95 % CBR(5) – 1.88 %

59
Figure 4.50 Load vs penetration graph for test –3, type – 2 soil for soaked (day-4) condition
Figure 4.51 Load vs penetration graph for test –3, type – 2 soil for soaked (day-5) condition
0
0.1
0.2
0.3
0.4
0.5
0.6
0.7
0.8
0 5 10 15
Load
( K
N)
Penetration (mm)
0
0.1
0.2
0.3
0.4
0.5
0.6
0.7
0 5 10 15
Load
( K
N)
Penetration (mm)
CBR(2.5) - 1.12%CBR(5) – 1.02 %
CBR(2.5) - 1.78 % CBR(5) – 1.66 %

60
MOISTURE VARIATION IN SOIL SAMPLE
Table 4.40 Moisture content for test – 3, type – 2 soil for soaked (day - 1) condition
Vertical
Positions
MOISTURE CONTENTS%
Horizontal Positions
EAST WEST NORTH SOUTH CENTRE
TOP 17.36 18.37 17.49 18.22 18.74
MIDDLE 16.37 16.56 17.08 16.33 16.58
BOTTOM 16.03 16.25 16.44 17.02 17.09
Table 4.41 Moisture content for test – 3, type – 2 soil for soaked (day - 2) condition
Vertical
Positions
MOISTURE CONTENTS%
Horizontal Positions
EAST WEST NORTH SOUTH CENTRE
TOP 18.23 19.37 18.22 18.81 19.06
MIDDLE 17.76 16.99 17.25 18.08 17.33
BOTTOM 16.88 16.82 16.35 17.24 17.49
Table 4.42 Moisture content for test – 3, type – 2 soil for soaked (day - 3) condition
Vertical
Positions
MOISTURE CONTENTS%
Horizontal Positions
EAST WEST NORTH SOUTH CENTRE
TOP 20.96 21.35 20.44 20.97 21.29
MIDDLE 19.95 19.32 20.03 18.54 19.63
BOTTOM 18.85 17.24 18.36 17.83 17.52

61
Table 4.43 Moisture content for test – 3, type – 2 soil for soaked (day - 4) condition
Vertical
Positions
MOISTURE CONTENTS%
Horizontal Positions
EAST WEST NORTH SOUTH CENTRE
TOP 22.25 23.48 22.63 21.68 23.37
MIDDLE 21.58 22.09 21.68 21.77 22.06
BOTTOM 20.65 21.05 20.77 20.63 21.57
Table 4.44 Moisture content for test – 3, type – 2 soil for soaked (day - 5) condition
Vertical
Positions
MOISTURE CONTENTS%
Horizontal Positions
EAST WEST NORTH SOUTH CENTRE
TOP 24.26 25.33 25.64 24.39 25.09
MIDDLE 22.89 23.45 22.63 22.87 23.08
BOTTOM 21.11 21.35 22.06 21.47 22.87

62
4.2.4.4Test 4 (97% dry side) under moisture content (10.7%) and dry density (1.794g/cc)
Figure 4.52 Load vs penetration graph for test –4, type – 2 soil for unsoakedcondition
Figure 4.53 Load vs penetration graph for test –4, type – 2 soil for soaked (day-1) condition
0
1
2
3
4
5
6
7
0 5 10 15
Load
(K
N)
Penetration (mm)
0
0.1
0.2
0.3
0.4
0.5
0.6
0.7
0.8
0 5 10 15
Load
( K
N)
Penetration (mm)
CBR(2.5) - 2.02 %CBR(5) – 1.97 %
CBR(2.5) - 32.45 %
CBR(5) – 31.15 %
63
Figure 4.54 Load vs penetration graph for test –4, type – 2 soil for soaked (day-2) condition
Figure 4.55 Load vs penetration graph for test –4, type – 2 soil for soaked (day-3) condition
0
0.1
0.2
0.3
0.4
0.5
0.6
0.7
0 5 10 15
Load
(KN
)
Penetration (mm)
CBR(2.5) - 1.83%CBR(5) – 1.76 %
0
0.05
0.1
0.15
0.2
0.25
0.3
0.35
0.4
0.45
0.5
0 5 10 15
Load
in K
N
Penetration in mm
CBR(2.5) - 1.74 % CBR(5) – 1.67 %

64
Figure 4.56 Load vs penetration graph for test –4, type – 2 soil for soaked (day-4) condition
Figure 4.57 Load vs penetration graph for test –4, type – 2 soil for soaked (day-5) condition
0
0.05
0.1
0.15
0.2
0.25
0.3
0.35
0.4
0 5 10 15
Load
in K
N
Penetration in mm
CBR(2.5) - 1.67 %CBR(5) – 1.44 %
0
0.05
0.1
0.15
0.2
0.25
0.3
0.35
0 5 10 15
Load
in K
N
Penetration in mm
CBR(2.5) – 0.7 % CBR(5) – 0.58 %

65
MOISTURE VARIATION IN SOIL SAMPLE
Table 4.45 Moisture content for test – 4, type – 2 soil for soaked (day - 1) condition
Vertical
Positions
MOISTURE CONTENTS%
Horizontal Positions
EAST WEST NORTH SOUTH CENTRE
TOP 15.56 17.88 16.32 16.25 17.89
MIDDLE 14.44 13.38 15.22 14.36 14.41
BOTTOM 13.35 14.09 13.25 14.08 13.55
Table 4.46 Moisture content for test – 4, type – 2 soil for soaked (day - 2) condition
Vertical
Positions
MOISTURE CONTENTS%
Horizontal Positions
EAST WEST NORTH SOUTH CENTRE
TOP 19.39 18.88 19.75 18.26 19.35
MIDDLE 17.77 17.15 16.63 16.58 17.65
BOTTOM 15.52 16.05 15.98 16.66 15.55
Table 4.47Moisture content for test – 4, type – 2 soil for soaked (day - 3) condition
Vertical
Positions
MOISTURE CONTENTS%
Horizontal Positions
EAST WEST NORTH SOUTH CENTRE
TOP 20.68 21.55 21.74 20.87 22.09
MIDDLE 18.63 18.85 19.68 19.55 20.02
BOTTOM 16.59 17.49 17.65 16.38 17.55
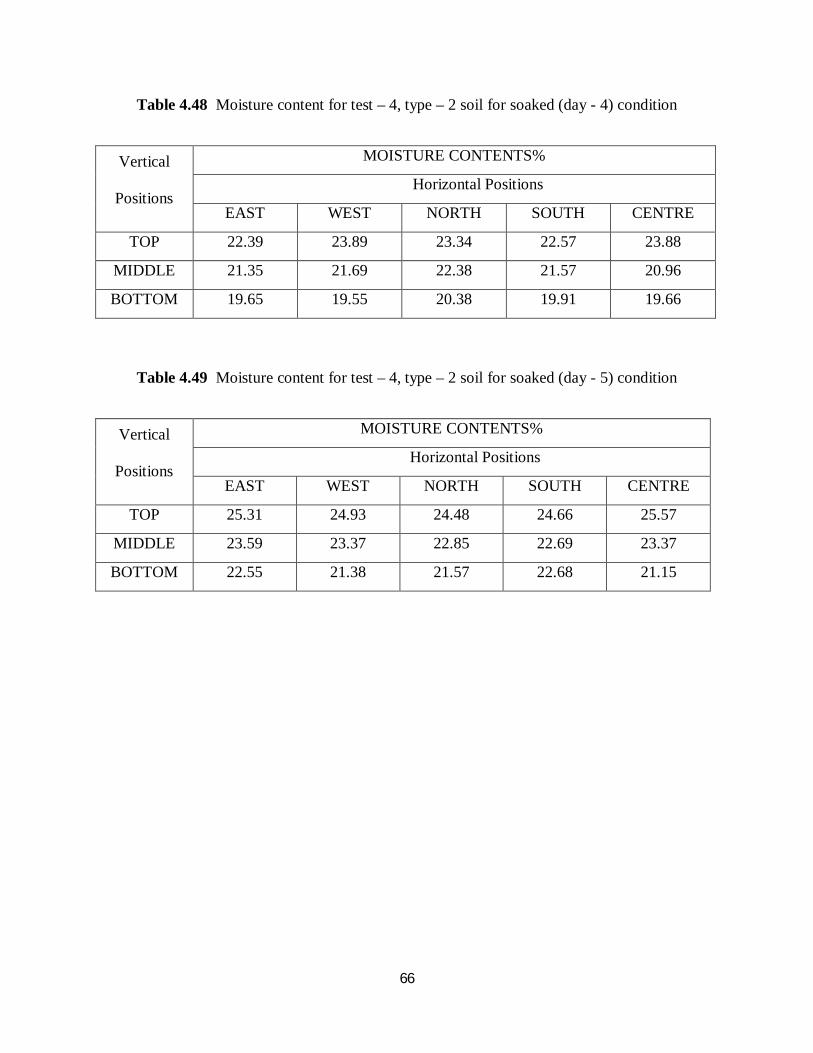
66
Table 4.48 Moisture content for test – 4, type – 2 soil for soaked (day - 4) condition
Vertical
Positions
MOISTURE CONTENTS%
Horizontal Positions
EAST WEST NORTH SOUTH CENTRE
TOP 22.39 23.89 23.34 22.57 23.88
MIDDLE 21.35 21.69 22.38 21.57 20.96
BOTTOM 19.65 19.55 20.38 19.91 19.66
Table 4.49 Moisture content for test – 4, type – 2 soil for soaked (day - 5) condition
Vertical
Positions
MOISTURE CONTENTS%
Horizontal Positions
EAST WEST NORTH SOUTH CENTRE
TOP 25.31 24.93 24.48 24.66 25.57
MIDDLE 23.59 23.37 22.85 22.69 23.37
BOTTOM 22.55 21.38 21.57 22.68 21.15

67
4.2.4.5Test 5 (97% wet side) under moisture content (17.8%) and dry density (1.794g/cc)
Figure 4.58Load vs penetration graph for test –5, type – 2 soil for unsoakedcondition
Figure 4.59 Load vs penetration graph for test –5, type – 2 soil for soaked (day-1) condition
0
0.5
1
1.5
2
2.5
3
0 2 4 6 8 10 12 14
Load
in K
N
Penetration in mm
0
0.2
0.4
0.6
0.8
1
1.2
1.4
1.6
1.8
0 5 10 15
Load
in K
N
Penetration in mm
CBR(2.5) - 34.33 % CBR(5) – 33.56 %
CBR(2.5) - 2.07 % CBR(5) – 1.98 %

68
Figure 4.60 Load vs penetration graph for test –5, type – 2 soil for soaked (day-2) condition
Figure 4.61 Load vs penetration graph for test –5, type – 2 soil for soaked (day-3) condition
0
0.1
0.2
0.3
0.4
0.5
0.6
0.7
0.8
0 5 10 15
Load
in K
N
Penetration in mm
CBR(2.5) - 1.93%CBR(5) – 1.85 %
0
0.1
0.2
0.3
0.4
0.5
0.6
0 5 10 15Penetration in mm
CBR(2.5) – 1.88 %
CBR(5) – 1.76 %

69
Figure 4.62 Load vs penetration graph for test –5, type – 2 soil for soaked (day-4) condition
Figure 4.63 Load vs penetration graph for test –5, type – 2 soil for soaked (day-5) condition
0
0.1
0.2
0.3
0.4
0.5
0.6
0.7
0.8
0.9
1
0 5 10 15
Load
in K
N
Penetration in mm
CBR(2.5) - 1.76 %CBR(5) – 1.68 %
0
0.1
0.2
0.3
0.4
0.5
0.6
0.7
0 5 10 15
Load
in K
N
Penetration in mm
CBR(2.5) - 0.8%CBR(5) – 0.66 %

70
MOISTURE VARIATION IN SOIL SAMPLE
Table 4.50 Moisture content for test – 5, type – 2 soil for soaked (day - 1) condition
Vertical
Positions
MOISTURE CONTENTS%
Horizontal Positions
EAST WEST NORTH SOUTH CENTRE
TOP 20.34 22.34 21.25 22.24 22.63
MIDDLE 20.05 21.24 20.36 20.57 21.19
BOTTOM 19.66 19.85 18.86 20.06 20.59
Table 4.51 Moisture content for test – 5, type – 2 soil for soaked (day - 2) condition
Vertical
Positions
MOISTURE CONTENTS%
Horizontal Positions
EAST WEST NORTH SOUTH CENTRE
TOP 22.58 23.69 23.57 22.35 23.96
MIDDLE 21.06 21.55 21.68 21.85 22.58
BOTTOM 20.58 20.97 21.11 22.03 22.54
Table 4.52 Moisture content for test – 5, type – 2 soil for soaked (day - 3) condition
Vertical
Positions
MOISTURE CONTENTS%
Horizontal Positions
EAST WEST NORTH SOUTH CENTRE
TOP 24.55 23.38 24.96 24.22 23.57
MIDDLE 22.89 23.35 24.45 23.30 23.67
BOTTOM 20.86 21.84 22.05 22.68 21.15

71
Table 4.53 Moisture content for test – 5, type – 2 soil for soaked (day - 4) condition
Vertical
Positions
MOISTURE CONTENTS%
Horizontal Positions
EAST WEST NORTH SOUTH CENTRE
TOP 25.53 26.23 25.63 26.35 24.49
MIDDLE 24.42 23.55 23.14 24.08 24.39
BOTTOM 22.57 22.58 21.98 21.54 20.69
Table 4.54 Moisture content for test – 5, type – 2 soil for soaked (day - 5) condition
Vertical
Positions
MOISTURE CONTENTS%
Horizontal Positions
EAST WEST NORTH SOUTH CENTRE
TOP 26.35 26.32 25.58 25.21 24.88
MIDDLE 25.03 24.36 25.88 23.69 24.44
BOTTOM 23.35 22.87 22.57 24.06 23.35

72
TYPE 3 SOIL
4.3Index properties:
The results of index properties such as Liquid limit, Plastic limit, Plasticity Index value are
presented in Table4.55 as follows:
Table4. 55 Index properties of type- 3 soil
Description of index property Experimental Value
Liquid Limit 28.18%
Plastic Limit 18.18%
Plasticity Index 10%
Specific Gravity 2.73
Differential Swell Index 10%
4.3.1Particle size distribution
The grain size distribution of this soil sample has been shown in Table4.56
Table4. 56Grain size distribution of type - 3soil
I.S Sieve no. Weight retained in gm Percentage Weight Percentage weight
4.75mm 169 16.9 83.1
2mm 208.6 20.86 62.24
1mm 151.7 15.17 47.07
0.6mm 47.3 4.73 42.34
0.425mm 23.6 2.36 39.98
0.3mm 15.9 1.59 38.39
.212mm 26.6 2.66 35.73
.015mm 10.8 1.08 34.65
0.075mm 30.9 3.09 31.56

73
Based on the above properties the IS Soil Classification for the soil sample under test is ‘GM’
4.3.2 Modified Proctor Compaction Test
The results of modified proctor compaction test are represented in figure:
Figure4.64Modified proctor compaction test for type – 3 soil
1.85
1.9
1.95
2
2.05
2.1
2.15
2.2
0 5 10 15 20
Dry
Den
sity
Moisture Content
OMC – 10.83 %
MDD – 2.15 gm/cc

74
4.3.3California Bearing Ratio Test results:
4.3.3.1Test-1(conducted under OMC (10.83%) and MDD (2.15g/cc)
Figure 4.65 Load vs penetration graph for test –1, type – 3soil for unsoaked condition
Figure 4.66 Load vs penetration graph for test –1, type – 3 soil for soaked (day-1) condition
0
5
10
15
20
25
30
0 5 10 15
Load
in K
N
Penetration in mm
CBR(2.5) - 72.64 %CBR(5) – 71.25%
0
2
4
6
8
10
12
14
16
18
0 5 10 15
Load
in K
N
Penetration in mm
CBR(2.5) - 44.27 % CBR(5) – 43.35 %

75
Figure 4.67 Load vs penetration graph for test –1, type – 3 soil for soaked (day-2) condition
Figure 4.68 Load vs penetration graph for test –1, type – 3 soil for soaked (day-3) condition
0
2
4
6
8
10
12
14
16
18
20
0 5 10 15
Load
in K
N
Penetration in mm
0
2
4
6
8
10
12
14
0 5 10 15
Load
in K
N
Penetration in mm
CBR(2.5) - 21.35 %CBR(5) – 20.55 %
CBR(2.5) - 29.68 % CBR(5) – 27.45 %

76
Figure 4.69 Load vs penetration graph for test –1, type – 3 soil for soaked (day - 4) condition
Figure 4.70 Load vs penetration graph for test –1, type – 3 soil for soaked (day-5) condition
0
1
2
3
4
5
6
7
8
9
10
0 5 10 15
Load
in K
N
Penetration in mm
CBR(2.5) - 20.31 %CBR(5) – 19.96 %
0
2
4
6
8
10
12
14
0 5 10 15
Load
( K
N)
Penetration( mm)
CBR(2.5) - 19.31 %CBR(5) – 18.97 %

77
MOISTURE VARIATION IN SOIL SAMPLE
Table 4.57 Moisture content for test – 1, type – 3 soil for soaked (day - 1) condition
Vertical
Positions
MOISTURE CONTENTS%
Horizontal Positions
EAST WEST NORTH SOUTH CENTRE
TOP 11.50 12.13 11.48 11.49 11.90
MIDDLE 11.08 11.36 11.57 10.77 10.87
BOTTOM 10.58 11.23 10.58 10.83 11.25
Table 4.58 Moisture content for test – 1, type – 3 soil for soaked (day - 2) condition
Vertical
Positions
MOISTURE CONTENTS%
Horizontal Positions
EAST WEST NORTH SOUTH CENTRE
TOP 13.47 12.40 12.69 12.20 12.37
MIDDLE 11.95 11.47 11.82 12.61 11.49
BOTTOM 11.24 11.94 10.84 9.68 11.25
Table 4.59 Moisture content for test – 1, type – 3 soil for soaked (day - 3) condition
Vertical
Positions
MOISTURE CONTENTS%
Horizontal Positions
EAST WEST NORTH SOUTH CENTRE
TOP 13.16 13.68 1.347 13.82 14.11
MIDDLE 12.23 12.96 12.62 12.28 12.22
BOTTOM 11.12 10.69 11.58 11.47 10.39

78
Table 4.60 Moisture content for test – 1, type – 3 soil for soaked (day - 4) condition
Vertical
Positions
MOISTURE CONTENTS%
Horizontal Positions
EAST WEST NORTH SOUTH CENTRE
TOP 13.59 14.25 13.79 14.84 14.09
MIDDLE 13.18 12.94 12.54 13.39 13.03
BOTTOM 12.69 12.5 12.58 13.04 12.64
Table 4.61 Moisture content for test – 1, type – 3 soil for soaked (day - 5) condition
Vertical
Positions
MOISTURE CONTENTS%
Horizontal Positions
EAST WEST NORTH SOUTH CENTRE
TOP 14.04 13.13 14.67 14.03 13.92
MIDDLE 13.39 12.91 12.33 13.25 13.7
BOTTOM 12.09 12.82 11.85 12.70 11.12

79
4.3.3.2Test 2 (98% dry side) under moisture content (12.%) and dry density (2.107g/cc)
Figure 4.71 Load vs penetration graph for test –1, type – 3 soil for unsoakedcondition
Figure 4.72 Load vs penetration graph for test –1, type – 3 soil for soaked (day-1) condition
0
2
4
6
8
10
12
14
16
18
0 5 10 15
Load
in K
N
Penetration in mm
0
2
4
6
8
10
12
0 5 10 15
Load
in K
N
Penetration in mm
CBR(2.5) – 44.58 % CBR(5) – 43.37%
CBR(2.5) - 30.96%
CBR(5) – 29.97 %

80
Figure 4.73 Load vs penetration graph for test –1, type – 3 soil for soaked (day-2) condition
Figure 4.74 Load vs penetration graph for test –1, type – 3 soil for soaked (day-3) condition
0
2
4
6
8
10
12
0 5 10 15
Load
in K
N
Penetration in mm
CBR(2.5) - 23.46 %CBR(5) – 22.86 %
0
2
4
6
8
10
12
0 5 10 15
Load
in K
N
Penetration in mm
CBR(2.5) - 20.73 %CBR(5) – 19.92 %

81
Figure 4.75 Load vs penetration graph for test –1, type – 3 soil for soaked (day-4) condition
Figure 4.76 Load vs penetration graph for test –1, type – 3 soil for soaked (day-5) condition
0
2
4
6
8
10
12
14
0 5 10 15
Load
in K
N
Penetration in mm
0
2
4
6
8
10
12
0 5 10 15
Load
in K
N
Penetration in mm
CBR(2.5) - 15.08 % CBR(5) – 14.48 %
CBR(2.5) - 14.04 % CBR(5) – 13.88 %

82
MOISTURE VARIATION IN SOIL SAMPLE
Table 4.62 Moisture content for test – 2, type – 3 soil for soaked (day - 1) condition
Vertical
Positions
MOISTURE CONTENTS%
Horizontal Positions
EAST WEST NORTH SOUTH CENTRE
TOP 11.11 11.24 12.60 12.84 12.65
MIDDLE 11.82 11.51 11.12 10.03 10.56
BOTTOM 11.62 11.78 11.17 12.15 11.60
Table 4.63 Moisture content for test – 2, type – 3 soil for soaked (day - 2) condition
Vertical
Positions
MOISTURE CONTENTS%
Horizontal Positions
EAST WEST NORTH SOUTH CENTRE
TOP 13.34 13.02 12.91 13.79 13.69
MIDDLE 13.11 13.87 13.34 13.20 13.55
BOTTOM 12.45 12.70 12.58 12.69 12.58
Table 4.64 Moisture content for test – 2, type – 3 soil for soaked (day - 3) condition
Vertical
Positions
MOISTURE CONTENTS%
Horizontal Positions
EAST WEST NORTH SOUTH CENTRE
TOP 13.84 14.16 13.26 13.68 13.54
MIDDLE 13.91 13.24 13.33 13.17 12.85
BOTTOM 12.05 12.58 11.83 13.88 12.22
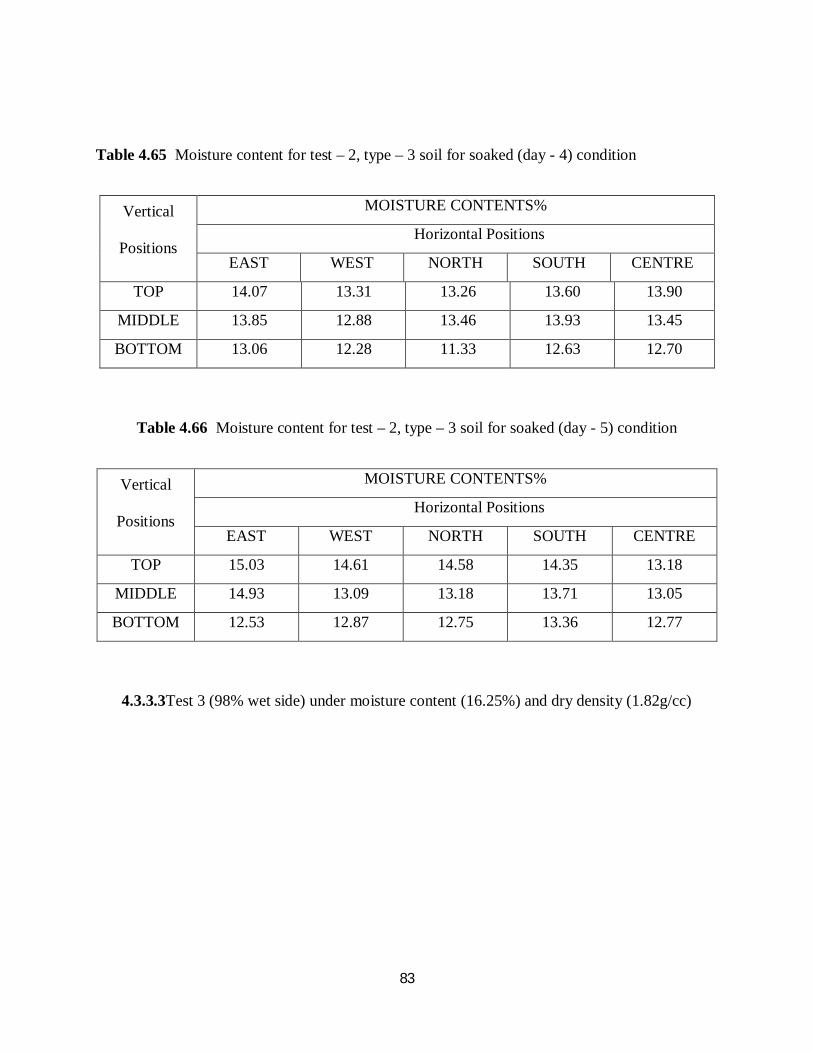
83
Table 4.65 Moisture content for test – 2, type – 3 soil for soaked (day - 4) condition
Vertical
Positions
MOISTURE CONTENTS%
Horizontal Positions
EAST WEST NORTH SOUTH CENTRE
TOP 14.07 13.31 13.26 13.60 13.90
MIDDLE 13.85 12.88 13.46 13.93 13.45
BOTTOM 13.06 12.28 11.33 12.63 12.70
Table 4.66 Moisture content for test – 2, type – 3 soil for soaked (day - 5) condition
Vertical
Positions
MOISTURE CONTENTS%
Horizontal Positions
EAST WEST NORTH SOUTH CENTRE
TOP 15.03 14.61 14.58 14.35 13.18
MIDDLE 14.93 13.09 13.18 13.71 13.05
BOTTOM 12.53 12.87 12.75 13.36 12.77
4.3.3.3Test 3 (98% wet side) under moisture content (16.25%) and dry density (1.82g/cc)
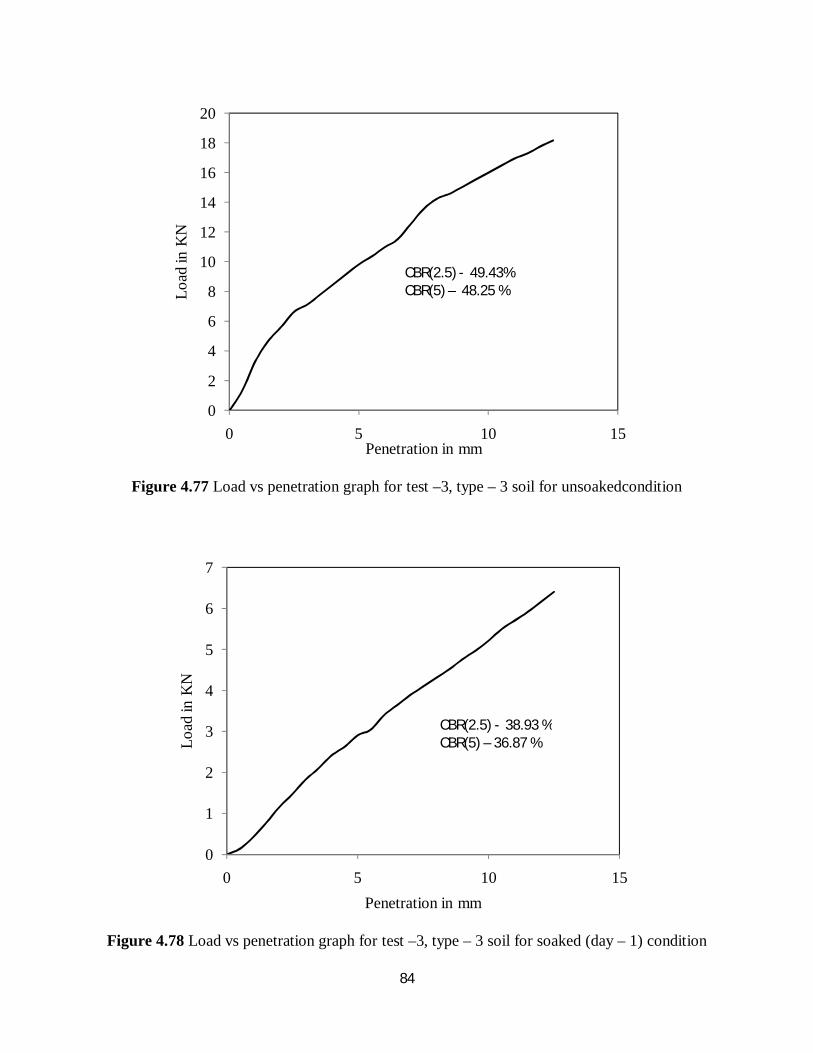
84
Figure 4.77 Load vs penetration graph for test –3, type – 3 soil for unsoakedcondition
Figure 4.78 Load vs penetration graph for test –3, type – 3 soil for soaked (day – 1) condition
0
2
4
6
8
10
12
14
16
18
20
0 5 10 15
Load
in K
N
Penetration in mm
CBR(2.5) - 49.43%CBR(5) – 48.25 %
0
1
2
3
4
5
6
7
0 5 10 15
Load
in K
N
Penetration in mm
CBR(2.5) - 38.93 % CBR(5) – 36.87 %

85
Figure 4.79 Load vs penetration graph for test –3, type – 3 soil for soaked (day – 2) condition
Figure 4.80 Load vs penetration graph for test –3, type – 3 soil for soaked (day – 3) condition
0
2
4
6
8
10
12
0 5 10 15
Load
in K
N
Penetration in mm
CBR(2.5) - 28.23 %CBR(5) – 27.74%
0
2
4
6
8
10
12
14
0 5 10 15
Load
in K
N
Penetration in mm
CBR(2.5) - 19.28 % CBR(5) – 18.54 %

86
Figure 4.81 Load vs penetration graph for test –3, type – 3 soil for soaked (day – 4) condition
Figure 4.82 Load vs penetration graph for test –3, type – 3 soil for soaked (day – 5) condition
0
0.5
1
1.5
2
2.5
3
3.5
4
0 5 10 15
Load
in K
N
Penetration in mm
0
1
2
3
4
5
6
7
8
9
10
0 5 10 15
Load
in K
N
Penetration in mm
CBR(2.5) - 13.31 %CBR(5) – 12.55 %
CBR(2.5) - 14.65%
CBR(5) – 13.36 %

87
MOISTURE VARIATION IN SOIL SAMPLE
Table 4.67Moisture content for test – 3, type – 3 soil for soaked (day - 1) condition
Vertical
Positions
MOISTURE CONTENTS%
Horizontal Positions
EAST WEST NORTH SOUTH CENTRE
TOP 14.63 14.64 13.53 15.26 14.63
MIDDLE 13.24 12.77 12.48 14.66 12.61
BOTTOM 12.91 13.42 13.73 11.42 12.60
Table 4.68 Moisture content for test – 3, type – 3 soil for soaked (day - 2) condition
Vertical
Positions
MOISTURE CONTENTS%
Horizontal Positions
EAST WEST NORTH SOUTH CENTRE
TOP 13.55 14.57 13.66 13.86 13.03
MIDDLE 13.29 12.78 13.69 12.87 13.00
BOTTOM 12.55 13.31 13.50 13.14 13.73
Table 4.69 Moisture content for test – 3, type – 3 soil for soaked (day - 3) condition
Vertical
Positions
MOISTURE CONTENTS%
Horizontal Positions
EAST WEST NORTH SOUTH CENTRE
TOP 14.53 14.10 13.64 13.52 13.04
MIDDLE 12.98 12.17 12.45 12.48 13.57
BOTTOM 12.87 12.15 12.42 12.62 12.60

88
Table 4.70 Moisture content for test – 3, type – 3 soil for soaked (day - 4) condition
Vertical
Positions
MOISTURE CONTENTS%
Horizontal Positions
EAST WEST NORTH SOUTH CENTRE
TOP 14.03 14.13 13.16 12.63 13.30
MIDDLE 13.89 12.55 12.72 12.69 13.25
BOTTOM 12.13 12.36 12.46 12.44 12.89
Table 4.71 Moisture content for test – 3, type – 3 soil for soaked (day - 5) condition
Vertical
Positions
MOISTURE CONTENTS%
Horizontal Positions
EAST WEST NORTH SOUTH CENTRE
TOP 14.45 14.67 14.27 14.07 14.28
MIDDLE 13.74 12.77 13.34 13.60 13.08
BOTTOM 13.54 13.77 13.25 13.85 13.91

89
4.3.3.4Test 4 (97% dry side) under moisture content (7.5%) and dry density (2.08g/cc)
Figure 4.83 Load vs penetration graph for test –4, type – 3 soil for unsoakedcondition
Figure 4.84 Load vs penetration graph for test –4, type – 3 soil for soaked (day –1) condition
0
2
4
6
8
10
12
14
16
18
0 5 10 15
Load
in K
N
Penetration in mm
0
1
2
3
4
5
6
7
0 5 10 15
Load
in K
N
Penetration in mm
CBR(2.5) - 38.65 % CBR(5) – 36.27 %
CBR(2.5) - 26.54 % CBR(5) – 25.56 %

90
Figure 4.85 Load vs penetration graph for test –4, type – 3 soil for soaked (day-2) condition
Figure 4.86 Load vs penetration graph for test –4, type – 3 soil for soaked (day-3) condition
0
0.5
1
1.5
2
2.5
3
3.5
4
0 5 10 15
Load
in K
N
Penetration in mm
0
2
4
6
8
10
12
14
0 5 10 15
Load
in K
N
Penetration in mm
CBR(2.5) - 22.77 % CBR(5) – 21.01 %
CBR(2.5) - 18.47 % CBR(5) – 17.49 %

91
Figure 4.87 Load vs penetration graph for test –4, type – 3 soil for soaked (day-5) condition
Figure 4.88 Load vs penetration graph for test –4, type – 3 soil for soaked (day-5) condition
0
0.5
1
1.5
2
2.5
3
3.5
4
4.5
5
0 5 10 15
Load
in K
N
Penetration in mm
0
1
2
3
4
5
6
7
8
0 5 10 15
Load
in K
N
Penetration in mm
CBR(2.5) - 12.49% CBR(5) – 11.14 %
CBR(2.5) - 10.08 % CBR(5) – 9.68%

92
MOISTURE VARIATION IN SOIL SAMPLE
Table 4.72 Moisture content for test – 4, type – 3 soil for soaked (day - 1) condition
Vertical
Positions
MOISTURE CONTENTS%
Horizontal Positions
EAST WEST NORTH SOUTH CENTRE
TOP 12.25 12.01 12.14 12.81 12.63
MIDDLE 11.56 11.23 11.89 11.14 10.36
BOTTOM 10.99 11.34 10.69 9.86 10.89
Table 4.73 Moisture content for test – 4, type – 3 soil for soaked (day - 2) condition
Vertical
Positions
MOISTURE CONTENTS%
Horizontal Positions
EAST WEST NORTH SOUTH CENTRE
TOP 13.23 13.69 12.87 13.21 13.25
MIDDLE 11.86 12.36 10.87 11.52 11.69
BOTTOM 10.58 11.58 11.69 10.87 10.56
Table 4.74 Moisture content for test – 4, type – 3 soil for soaked (day - 3) condition
Vertical
Positions
MOISTURE CONTENTS%
Horizontal Positions
EAST WEST NORTH SOUTH CENTRE
TOP 13.69 13.45 14.87 14.02 14.36
MIDDLE 12.85 12.98 13.47 13.58 14.05
BOTTOM 11.25 11.87 11.58 11.24 12.36

93
Table 4.75 Moisture content for test – 4, type – 3 soil for soaked (day - 4) condition
Vertical
Positions
MOISTURE CONTENTS%
Horizontal Positions
EAST WEST NORTH SOUTH CENTRE
TOP 14.83 14.31 14.00 14.96 14.34
MIDDLE 13.69 13.88 13.49 13.36 13.87
BOTTOM 12.70 12.54 11.98 12.54 12.65
Table 4.76 Moisture content for test – 4, type – 3 soil for soaked (day - 5) condition
Vertical
Positions
MOISTURE CONTENTS%
Horizontal Positions
EAST WEST NORTH SOUTH CENTRE
TOP 14.13 14.70 14.02 14.67 13.86
MIDDLE 13.54 13.66 12.35 13.01 13.24
BOTTOM 12.48 13.86 12.76 13.14 13.93

94
4.3.3.5Test 5 (97% wet side) under moisture content (12.5%) and dry density (2.08g/cc)
Figure 4.89 Load vs penetration graph for test –5, type – 3 soil for unsoakedcondition
Figure 4.90 Load vs penetration graph for test –5, type – 3 soil for soaked (day-1) condition
0
2
4
6
8
10
12
14
16
18
0 5 10 15
Load
in K
N
Penetration in mm
0
2
4
6
8
10
12
14
16
18
0 5 10 15
Load
in K
N
Penetration in mm
CBR(2.5) - 34.23 % CBR(5) – 33.57 %
CBR(2.5) - 20.33 % CBR(5) – 19.96%

95
Figure 4.91 Load vs penetration graph for test –5, type – 3 soil for soaked (day-2) condition
Figure 4.92 Load vs penetration graph for test –5, type – 3 soil for soaked (day-3) condition
0
0.5
1
1.5
2
2.5
3
3.5
4
4.5
5
0 5 10 15
Load
in K
N
Penetration in mm
0
1
2
3
4
5
6
0 5 10 15
Load
in K
N
Penetration in mm
CBR(2.5) - 15.98 % CBR(5) – 14.45 %
CBR(2.5) - 13.72 %
CBR(5) – 12.88 %
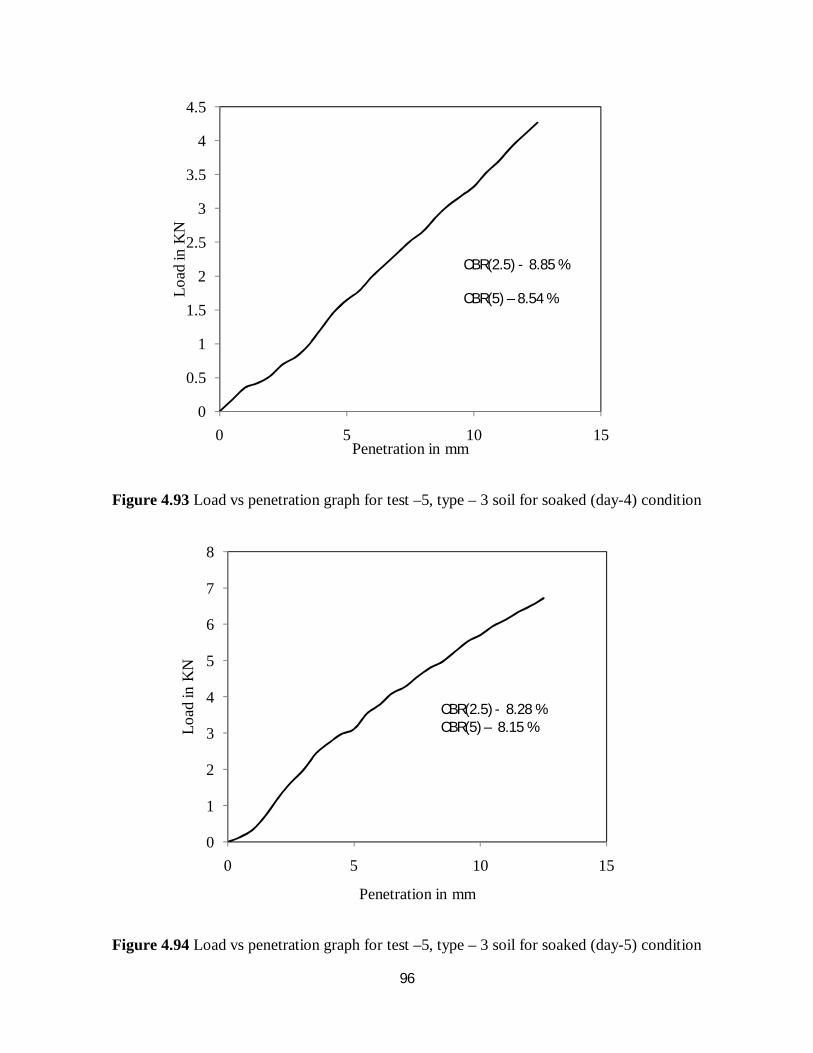
96
Figure 4.93 Load vs penetration graph for test –5, type – 3 soil for soaked (day-4) condition
Figure 4.94 Load vs penetration graph for test –5, type – 3 soil for soaked (day-5) condition
0
0.5
1
1.5
2
2.5
3
3.5
4
4.5
0 5 10 15
Load
in K
N
Penetration in mm
0
1
2
3
4
5
6
7
8
0 5 10 15
Load
in K
N
Penetration in mm
CBR(2.5) - 8.28 %CBR(5) – 8.15 %
CBR(2.5) - 8.85 %
CBR(5) – 8.54 %
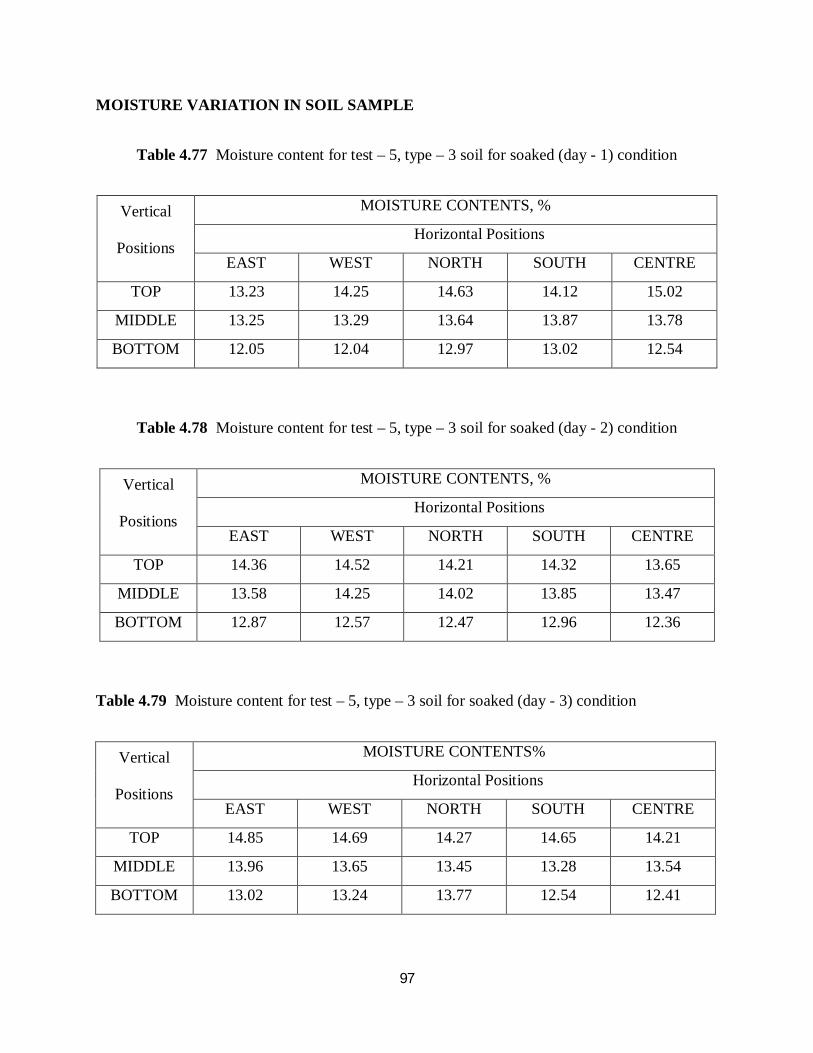
97
MOISTURE VARIATION IN SOIL SAMPLE
Table 4.77 Moisture content for test – 5, type – 3 soil for soaked (day - 1) condition
Vertical
Positions
MOISTURE CONTENTS, %
Horizontal Positions
EAST WEST NORTH SOUTH CENTRE
TOP 13.23 14.25 14.63 14.12 15.02
MIDDLE 13.25 13.29 13.64 13.87 13.78
BOTTOM 12.05 12.04 12.97 13.02 12.54
Table 4.78 Moisture content for test – 5, type – 3 soil for soaked (day - 2) condition
Vertical
Positions
MOISTURE CONTENTS, %
Horizontal Positions
EAST WEST NORTH SOUTH CENTRE
TOP 14.36 14.52 14.21 14.32 13.65
MIDDLE 13.58 14.25 14.02 13.85 13.47
BOTTOM 12.87 12.57 12.47 12.96 12.36
Table 4.79 Moisture content for test – 5, type – 3 soil for soaked (day - 3) condition
Vertical
Positions
MOISTURE CONTENTS%
Horizontal Positions
EAST WEST NORTH SOUTH CENTRE
TOP 14.85 14.69 14.27 14.65 14.21
MIDDLE 13.96 13.65 13.45 13.28 13.54
BOTTOM 13.02 13.24 13.77 12.54 12.41

98
Table 4.80 Moisture content for test – 5, type – 3 soil for soaked (day - 4) condition
Vertical
Positions
MOISTURE CONTENTS%
Horizontal Positions
EAST WEST NORTH SOUTH CENTRE
TOP 14.16 15.88 15.73 14.44 14.46
MIDDLE 14.01 13.87 13.44 13.47 13.86
BOTTOM 13.56 13.68 13.81 13.82 12.70
Table 4.81 Moisture content for test – 5, type – 3 soil for soaked (day - 5) condition
Vertical
Positions
MOISTURE CONTENTS%
Horizontal Positions
EAST WEST NORTH SOUTH CENTRE
TOP 15.23 15.55 15.32 15.21 14.88
MIDDLE 14.89 14.36 14.57 14.26 14.22
BOTTOM 14.02 14.36 14.52 14.87 13.58

99
4.1.5 DIRECT SHEAR TEST RESULTS
Direct shear test was carried out at different dry densities and moisture contents.
Type 1 soil
Results of direct shear test are:
Figure 4.95Shear stress vs normal stress for test -1,type- 1 soil
Figure 4.96Shear stress vs normal stress for test -2,type- 1 soil
0
0.5
1
1.5
2
0 0.5 1 1.5 2 2.5
Shea
r stre
ss
Normal stress
C = 0.6KG/CM2Φ = 26°33´OMC, MDD
0
0.5
1
1.5
2
0 0.5 1 1.5 2 2.5
Shea
r stre
ss
Normal stress
C = 0.4KG/CM2Φ = 37°8´98% density (dry side)

100
il
Figure4.97Shear stress vs normal stress for test -3,type- 1 soil
Figure4.98Shear stress vs normal stress for test -4,type- 1 soil
0
0.5
1
1.5
0 0.5 1 1.5 2 2.5
Shea
r stre
ss
Normal stress
C = 0.38KG/CM2Φ = 25°38´98% density (wet side)
0
0.5
1
1.5
2
0 0.5 1 1.5 2 2.5
Shea
r stre
ss
Normal Stress
C = 0.36KG/CM2Φ = 31°31´97% density (dry side)

101
Figure4.99Shear stress vs normal stress for test -5,type- 1 soil
0
0.5
1
1.5
2
0 0.5 1 1.5 2 2.5
Shea
r Stre
ss
Normal Stress
C = 0.3KG/CM2Φ = 33°25´97% density (wet side)

102
CBR VALUES OF SOIL
Table4.82CBR values of first type of soil
Compaction Conditions(M.C&D.D) CBR(%)
DAYS OF SOAKING
0 1 2 3 4 5
OMC &MDD (16.4,1.85) 48 2.9 2.2 1.9 1.6 1.5
98% Density(wet side) (17.8,1.8)
98% Density(dry side)
(12.89,1.8)
37.47
35.03
2.22
1.98
1.97
1.87
1.82
1.82
1.59
1.77
1.26
1.54
97% Density(wet side)
(19,1.78)
34.62
2.88
1.6
1.5
1.11
0.97
97%Density(dry side) (12.2,1.78) 30.46 3.90 2.31 2.10 2.00 1.92
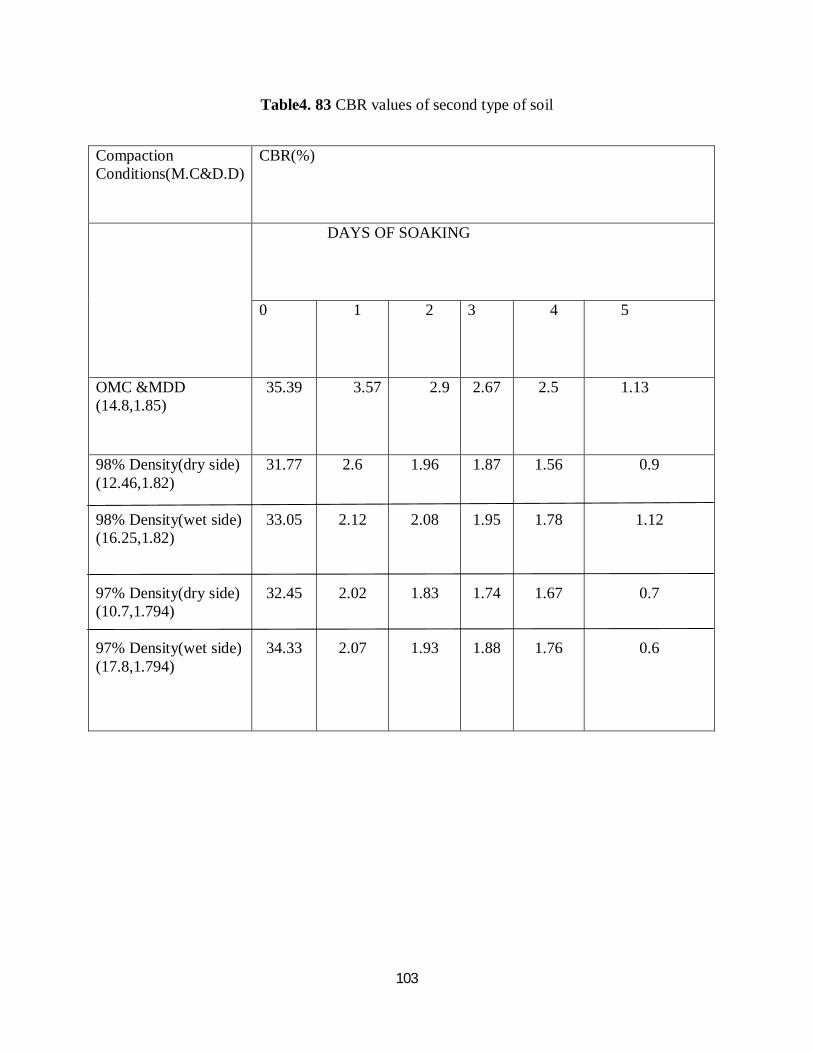
103
Table4. 83 CBR values of second type of soil
Compaction Conditions(M.C&D.D)
CBR(%)
DAYS OF SOAKING
0 1 2 3 4 5
OMC &MDD (14.8,1.85)
35.39 3.57 2.9 2.67 2.5 1.13
98% Density(dry side) (12.46,1.82) 98% Density(wet side) (16.25,1.82) 97% Density(dry side) (10.7,1.794) 97% Density(wet side) (17.8,1.794)
31.77
33.05
32.45
34.33
2.6
2.12
2.02
2.07
1.96
2.08
1.83
1.93
1.87
1.95
1.74
1.88
1.56
1.78
1.67
1.76
0.9
1.12
0.7
0.6

104
Table4. 84 CBR values of third type of soil
Compaction Conditions (O.M.C & D.D)
CBR (%)
DAYS OF SOAKING
0 1 2 3 4 5
OMC & MDD (10.83%,2.15gm/cc)
72.64 44.27 29.68 21.35 20.31 19.55
98% Density (wet side)(12%,2.107gm/cc)
44.58 30.96 23.43 20.73 15.08 14.04
98% Density (dry side) (8%,2.107gm/cc)
49.43 38.93 28.23 19.28 14.65 13.31
97% Density (Wet side) (12.5%,2.08gm/cc)
38.65 26.54 22.77 18.47 12.49 10.08
97% Density (dry side) (7.5%,2.08gm/cc)
34.23 20.33 15.98 13.72 8.85 8.28
From the above tests and results for the three type of soils , it has been found that for the first and
second type of soil the decrease in strength (CBR Value) is quite similar. There is a sudden
decrease in CBR from unsoaked condition to that with one day soaking. But there is no
significant variation of CBR from third to fourth day of soaking. It has been observed that higher
moisture contents result at top layers than compared to that in lower layers. Rate of decrease in
CBR value for third type of soil is less. Effect of varying days of soaking does not affect much to
third type of soil.

105
CHAPTER 6
CONCLUSIONS
6.1CONCLUSIONS
An attempt has been made in this project work to explore the effect of saturation, i.e.,
soaking on the strength properties of subgrade soil, namely CBR which is widely used as
a measure of design of all types of pavements. For this three types of soils have been
considered .The effect of soaking on degree of saturation on different parts of the soil
sample have also been considered in this study. From the results and discussions
presented earlier, following conclusions are drawn :
1. It is observed that the CBR value of the given clayey soil sample with BIS classification
“OH” prepared at a particular density decreases rapidly with time of soaking up to 1day
after which the rate of decrease is small.While the CBR value reduces by about 20 times
compared to the unsoaked conditions, the loss of CBR value in 4 days is about half
compared to that after 1 day.It is also observed that there are not much significant
variations in CBR values from 3rd day to 4th day of soaking.When soil samples are taken
from different points of the CBR sample and tested for its moisture content, it is also
observed that there variations in moisture content in a given layer are not significant in
unsoaked conditions and 1 day of soaking.However, it is observed that for a longer
soaking time, higher moisture contents result at top layer compared to that in the lower
layers.

106
2. For the 2nd type of soil considered and found to be of “CI” classification, the trend is
almost similar to the first type of soil used.
3. For the 3rd type of soil classified as ‘GM’, the rate of decrease of strength is very less.
Although there is decrease in CBR value with increase in number of days of soaking but
the rate of decrease is not as much as in 1st type and 2nd type of soil considered.
4. For 1st type and 2nd type of soil wet side of Optimum Moisture Content (CBR values)
gives better results than that dry side. However this trend was not observed 3rd type soil.
5. It has been observed that as usual with decrease in degree of compaction (either on wet or
dry side) cohesion and angle of friction decreases.
6.2Future Scope of Work
1. Other engineering properties such as direct shear, unconfined compression and triaxial
test should also be considered for different levels of saturation.
2. Effect of stabilization with weak (clayey) soil on engineering properties at different levels
of saturation needs to be explored.
3. The considerations on engineering properties as stated above may be applied to a variety
of soils, so that a database may be prepared to justify the period of soaking of a soil for
deciding the CBR value or any such engineering property that may be used for pavement
design.
107
References
1. Alayaki, F. M., Bajomo, O. S. (2011), Effect of Moisture Variation on the Strength
Characteristics of Laterite soil. Proceedings of the Environmental Management
Conference, Federal University of Agriculture, Abeokuta, Nigeria.
2. Ampadu,S,I.K. (2006) , “Laboratory Investigation into the Effect of Water Content on the
CBR of a Subgrade soil”.
3. Blazejcak,D.,Horn.R.,Pytka.J.(1995), “Soil tensile strength as affected by time, water
content and bulk density”.Int.Agrophysics,pp179-188.
4. Cokca,E.,Erol,O., Armangil. (2004), “Effects of compaction moisture content on the
shear strength of an unsaturated clay”, Geotechnical and Geological Engineering
22,pp285-297.
5. Chauhan.(2010),” a laboratory study on effect of test conditions on subgrade strength”.
Unpublished B.Tech Thesis,N.I.T Rourkela.
6. ERES Division (2001), “Correlation of CBR values with soil index properties”, Illinois.
7. Hussain,N.A.B.(2008), “Correlation between CBR value and undrained shear strength
from vane shear test”,Malaysia.
8. Jaleel,Z.T.(2011), Effect of Soaking on the CBR-Value of Subbase Soil. Eng. and Tech.
journal, vol.29.
9. Kim,Y.T., Shin.H.,Park.D.K .(2011), “Variation of shear strength of weathered granite
soil with water content”.pp253-258.

108
10. Nugroho,S.A., Hendri,A., Ningsih,S.R.(2012), Correlation between index properties and
california bearing ratio test of pekanbaru soils with and without soaked.Canadian Journal
on Environmental, Construction and Civil Engineering Vol. 3,Indonesia
11. Rahman,Q.B.A.(2010), “Correlation between CBR results and physical properties of
soils”,Malaysia.
12. Razouki,S.S., Al-Azawi,M.S.(2003),”long – term soaking effect on strength and
deformation characteristics of a gypsiferous subgrade soil”.Engineering Journal of the
University of Qatar, Vol. 16,Iraq, pp49-60.
13. Singh,D., Reddy.,K.S, Yadu.L.(2011) , Moisture and Compaction Based Statistical
Model for Estimating CBR of Fine Grained Subgrade Soils.International Journal of
Earth Sciences and Engineering,pp 100-103.
14. Tomar and Mallick.(2011) , “a study on variation of test conditions on CBR
determination” Unpublished B.Tech Thesis, N.I.T Rourkela.
15. Venkatramaiah C.(2009).,”Geotechnical Engineering”,New Age International
Publishers,pp60-61.
16. Yasin,S.J.Md.,HossainAli,Md.,Al-Hussaini,T.M.,Hoque,E and Ahmed,S.,”Effect of
Submergence on Subgrade Strength”,pp77-89.

109