Embed Size (px)
Citation preview

Vol. 6 No. 2 March 2018 ISSN: 2319-961X
66
Vol. 6 No. 2 March 2018 ISSN: 2319-961X UGC Approval No: 44192 Impact Factor: 3.104
A STUDY ON EDUCATIONAL STATUS IN INDIA
Article Particulars
Received: 09.02.2018 Accepted: 26.02.2018 Published: 27.03.2018
Dr.R.VEERACHAMY & Mr.R.DINESH KANNANAssistant Professors, PG and Research Department of EconomicsThiagarajar College, Madurai, Tamil Nadu, India
AbstractsEducation plays an important role in facilitating the social and economic progress as it opens up
opportunities leading to both individual and group entitlements. Education is the most crucial inputthat empowers people with skills and knowledge giving them access to productive employment infuture. In recent years sustained and high levels of economic growth provide a unique opportunityand momentum for faster social sector development. Investing in education plays a key role inmeeting the World Bank’s social development objectives, which support inclusive growth, socialcohesion, and accountability in development. Professor Amartya Sen recently emphasisededucation as an important parameter for any inclusive growth in an economy. The policies have tofocus on inclusive rather than divisive growth strategies. Corporate India moving towards thissector is laudable, but it is clear that deficiency in education cannot be met by mere expansion ofprivate schools in urban areas. “Public education is as indispensable as public health care, no matterwhat supplementary role private schools and private medical care can play”(Prof. Sen, 2008).Keywords: Amartya Sen, NFHS-3, Fundamental Rights, tenth plan, Formal Education, UNESCO
IntroductionMajor indicators to measure the status of literacy and educational attainment of
any society pose statistical challenges, particularly in developing countries like India,where the Population and size of the problems is a major deterrent for venturing intoinnovative economic growth products from different sources the present state ofeducation. The role of reliable, relevant, accurate and up to date educational statisticsin effective planning and policy formulation and for optimal use of resources canhardly be overrated. The major sources of economic development and information onliteracy, participation in education of the population are the administrative records ofthe Ministry of Human Resource Development and the nation‐wide surveys andPopulation Censuses. From the findings of the latest such large scale statistical exercisesviz. Population Census 2001, NFHS‐3 (2005‐06) and NSSO survey on Participation &Expenditure in Education (July 2007 ‐ June 2008) the changing scenario of education inIndia in the new millennium emerges.
Education is Fundamental RightsThe Constitution of India was amended at the beginning of the tenth plan period

Shanlax International Journal of Economics
67
to make education a fundamental right of the child between the ages of 6-14 years.While great strides have been made in providing access to education, the right itselfcannot be said to have been realized for all children. The challenge for SSA is to beable to address the needs for access and quality education for each child. This willrequire a strong rights orientation within the programme. In very broad terms thefollowing 2 dimensions of work are crucial for the 2nd phase of SSA under the 11thplan: (i) Improvement of the quality of education imparted in the primary and upperprimary schools through a range of coherent and comprehensive strategies withclearly defined goals that help in measuring progress. Quality of education is a muchdiscussed issue and there is no clear consensus on what constitutes quality, how tomeasure it, or whether it can be measured at all. The focus on the most vulnerablegroups of children who are still out of school would require partnership with NGOs anda commitment to a rights based, equity rented approach. Equity needs to permeateeach process under SSA beginning with planning. Equity issues need to become acentral theme in the discussion and vision for quality improvement.
Types of EducationIn how many ways, people get education is the type of education. Generally
people get education by following method.Formal Education: The education provided by educational institution (school,
college, universities) is formal education. Such as education has determined certaincurriculum, textbook, time, place, certificates, grades and levels. In such education,after completion of certain level educational institution provides certificates of merit.
Non-formal Education: Non formal education is opposite of formal education. Insuch education has not determined certain curriculum, textbook, place, time, gradesand levels. There is no bound of any age group. Anyone can take part in sucheducation. Such education is provided outside of schools, colleges and universities.Computer education, mobile repairing, radio-TV repairing etc. skilled based educationis example of non-formal education.
Education of Economic GrowthThere are two very basic reasons for expecting to find some link between
education and economic growth. First of all at the most general level it is intuitivelyplausible that living standards have risen so much over the last millennium and inparticular since 1800 because of education. Progress of the sort enjoyed in Europewas not observed in the illiterate societies that have gradually merged into the worldeconomy over the last two hundred years. To the most casual observer it must seemthat there is a link between scientific advance and the way in which education hasfacilitated the development of knowledge. Education is needed for people to benefitfrom scientific advance as well as to contribute to it. Secondly, at a more specific level,
Vol. 6 No. 2 March 2018 ISSN: 2319-961X
68
a wide range of econometric studies indicates that the incomes individuals cancommand depend on their level of education.
Education for All(EFA) Global Monitoring report 2008, released by UNESCO marks the midway in
the ambitious movement to expand learning opportunity to every child by 2015. TheUNESCO defined six EFA goals, Expanding and improving comprehensive childhood care and education,
especially for the most vulnerable and disadvantaged children; Ensuring that by 2015 all children, particularly girls, children in difficult
circumstances and those belonging to ethnic minorities, have access to free andcompulsory primary education of good quality;
Ensuring that the learning needs of all young people and adults are met toequitable access to appropriate learning and life skills programme;
Eliminating gender disparities in primary and secondary education by 2005 andachieving gender equality in education by 2015;
Improving all aspects of quality of education and ensuring excellence so thatrecognised and measurable learning outcomes are achieved, especially inliteracy, numeracy and in essential life skills.
Objectives and MethodologyObjectives
On the basis of the Survey of relevant literature, the specifics objectives areformulated for the present study as follow:1. To study the education status of India,2. To study the education institutions in India,3. To study the students enrolments by different levels in India,4. To study finance allocation for education in India.
MethodologyThe present study has primary attempted to study the growth economic status of
India. Hence the required data to analyse its objectives were collection form thevarious issues of public government reports such as selected education statistics, andallied statistics and education in India. The study has also attempted to studyeducation expenditure is last 10 years. The data were collected from Governmentreports and documents for following research.
Education in IndiaEducation plays an important role in facilitating the social and economic progress as
it opens up opportunities leading to both individual and group entitlements. Education isthe most crucial input that empowers people with skills and knowledge giving them

Shanlax International Journal of Economics
69
access to productive employment in future. Improvement in education not onlyenhances efficiency but also augments the overall quality of life. Looking into theadvantages of Sarva Shiksha Abiyan (SSA) with an allocation of Rs.210 crore, a newscheme for Universal Secondary Education has been proposed by the CentralGovernment on the lines of SSA.
Table 1 Literate population in India 2011 censusTotal literate population (Rs. crore) Literacy rate (%)
Total Rural Urban Total Rural UrbanTotal 778,454,120 493,020,878 285,433,242 74.04 68.91 84.98Male 444,203,762 288,047,480 156,156,282 82.14 78.57 89.67Female 334,250,358 204,973,398 129,276,960 65.46 58.75 79.92
Source: Census of India-various, Government of India.
Literate population in India in IndiaThe data related Literate population in India for the period of 2011 are provided in
table - 1. India has an average literacy rate of 74.04 per cent, male literacy is82.14 per cent and female literacy is 65.46 per cent. India nation is one of the betterperforming countries at international level in terms of overall education. As per 2011census India had a literate population of 778,454,120of which male constitutes444,203,762 and the female counts 334,250,358. Among the four zones of the city southzone performed higher literacy rate when compared to other zones. As per 2011census India had a literate population of 778,454,120of which rural constitutes493,020,878 and the urbane counts 285,433,242. Among the rural and urban divisionurban literacy level is better literacy rate when compared to rural. India has anaverage literacy rate of 74.04 per cent, urban literacy is 84.98 per cent and ruralliteracy is 68.91 per cent. Still India rural area need to be more focus, Indianeducational support must focus to rural educational system.
Table 2 Literacy Rate in India (1951 - 2011)Literacy Rate in India (1951 - 2011)
The data related Literatepopulation in India for the period of1951 to 2011 are provided in table -2. India has an average literacyrate of 18.33 per cent, maleliteracy is 27.16 per cent andfemale literacy is 8.86 per cent atthe time of Independent. There areafter our country gives more focus
to the education so that literate population rate was increased in every census. After
YearsPersons
(%)Male(%)
Female(%)
951 18.33 27.16 8.861961 28.3 40.4 15.351971 34.45 45.96 21.971981 43.57 56.38 29.761991 52.21 64.13 39.292001 64.83 75.26 53.672011 74.04 82.14 65.46
Source: Census of India-various, Government of India.

Vol. 6 No. 2 March 2018 ISSN: 2319-961X
70
the Independent education was concurrent list so both state and central governmentfocus to education. During these period lot of educational instructions wereestablished through out the country. At 2011population census the average literacyrate of 74.04 per cent, male literacy is 82.14 per cent and female literacy is 65.46 percent. Still one fourth female population are illiterate in India.
Literacy ratesIn earlier censuses up to 1981, it was customary to work out the literacy rate
taking into account the total population. Since literacy rate is more meaningful ifthe sub-population in the age group 0-6 is excluded from the total population, it wasdecided in 1991 to calculate literacy rate for the population seven years and above.The same concept has been retained in all censuses since 1991. The literatesexcluded the children in the age group of 0 - 6 who are by definition treated asilliterate. The literacy rate is the number of literates per 100 population of aged 7 +. Asper 2011 Census, the overall literacy rate of India is 74.04 per cent. The male literacyrate is 82.14 per cent and female literacy rate is 65.46 per cent. The 2001 rates for Indiastand at 64.8 for total; 75.3 for males and 53.7 for females. Kerala stands first of allthe states with 90.92 per cent literacy rate. Tamil Nadu ranks 14 among all the statewith 80.33 per cent which is higher than national level.
Table 3 State wise literacy Rate in India 2011 census1 Nct of Delhi 86.34 82.67 86.432 Rajasthan 67.06 62.34 80.733 Uttar Pradesh 69.72 67.55 77.014 Bihar 63.82 61.83 78.755 Sikkim 82.20 79.82 89.266 Arunachal Pradesh 66.95 61.59 84.577 Nagaland 80.11 75.86 90.218 Manipur 79.85 77.15 85.989 Mizoram 91.58 84.31 98.10
10 Tripura 87.75 85.58 93.6111 Meghalaya 75.48 71.15 91.3312 Assam 73.18 70.44 88.8813 West Bengal 77.08 72.97 85.5414 Jharkhand 67.63 62.40 83.3015 Orissa 73.45 70.78 86.4516 Chattisgarh 71.04 66.76 84.7917 Madhya pradesh 70.63 65.29 84.0918 Gujarat 79.31 73.00 87.5819 Damman & diu 87.07 81.51 88.8720 Dadra & nagar haveli 77.65 65.89 90.8621 Maharashtra 82.91 77.09 89.8422 Andra Pradesh 67.66 61.14 80.5423 Karnataka 75.60 68.86 86.2124 Goa 87.40 84.26 89.31
Shanlax International Journal of Economics
71
25 Lakshadweep 92.28 91.92 92.3826 Kerala 93.91 92.92 94.9927 Tamil Nadu 80.33 73.80 87.2428 Puducherry 86.55 81.02 89.0929 A & n island 86.27 84.39 89.6030 India 74.04 68.91 84.98
Source: Census of India in 2011
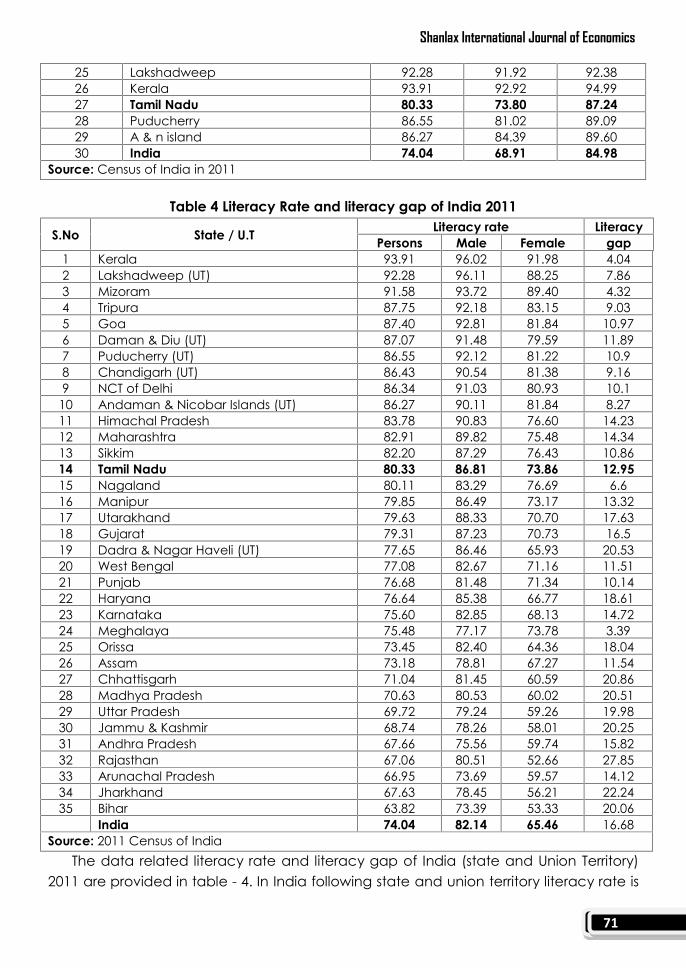
Table 4 Literacy Rate and literacy gap of India 2011
S.No State / U.T Literacy rate LiteracyPersons Male Female gap
1 Kerala 93.91 96.02 91.98 4.042 Lakshadweep (UT) 92.28 96.11 88.25 7.863 Mizoram 91.58 93.72 89.40 4.324 Tripura 87.75 92.18 83.15 9.035 Goa 87.40 92.81 81.84 10.976 Daman & Diu (UT) 87.07 91.48 79.59 11.897 Puducherry (UT) 86.55 92.12 81.22 10.98 Chandigarh (UT) 86.43 90.54 81.38 9.169 NCT of Delhi 86.34 91.03 80.93 10.1
10 Andaman & Nicobar Islands (UT) 86.27 90.11 81.84 8.2711 Himachal Pradesh 83.78 90.83 76.60 14.2312 Maharashtra 82.91 89.82 75.48 14.3413 Sikkim 82.20 87.29 76.43 10.8614 Tamil Nadu 80.33 86.81 73.86 12.9515 Nagaland 80.11 83.29 76.69 6.616 Manipur 79.85 86.49 73.17 13.3217 Utarakhand 79.63 88.33 70.70 17.6318 Gujarat 79.31 87.23 70.73 16.519 Dadra & Nagar Haveli (UT) 77.65 86.46 65.93 20.5320 West Bengal 77.08 82.67 71.16 11.5121 Punjab 76.68 81.48 71.34 10.1422 Haryana 76.64 85.38 66.77 18.6123 Karnataka 75.60 82.85 68.13 14.7224 Meghalaya 75.48 77.17 73.78 3.3925 Orissa 73.45 82.40 64.36 18.0426 Assam 73.18 78.81 67.27 11.5427 Chhattisgarh 71.04 81.45 60.59 20.8628 Madhya Pradesh 70.63 80.53 60.02 20.5129 Uttar Pradesh 69.72 79.24 59.26 19.9830 Jammu & Kashmir 68.74 78.26 58.01 20.2531 Andhra Pradesh 67.66 75.56 59.74 15.8232 Rajasthan 67.06 80.51 52.66 27.8533 Arunachal Pradesh 66.95 73.69 59.57 14.1234 Jharkhand 67.63 78.45 56.21 22.2435 Bihar 63.82 73.39 53.33 20.06
India 74.04 82.14 65.46 16.68Source: 2011 Census of India
The data related literacy rate and literacy gap of India (state and Union Territory)2011 are provided in table - 4. In India following state and union territory literacy rate is
Vol. 6 No. 2 March 2018 ISSN: 2319-961X
72
very high they are Kerala (93.91), Lakshadweep (UT) (92.28), Mizoram (91.58), Tripura(87.75), Goa (87.40), Daman & Diu (UT) (87.07) and Puducherry (UT) (86.55). Amongthese state Kerala state literacy gap between male and female is very narrow ie.Only4.04. in Kerala educational achievements very high compare to the other states.At the same time literacy gap also very narrow. It leads to developed the peopleHuman Development Resources as significant level. The overall female literacy gap theentire country is 16.68 per cent. The highest female literacy gap is found in thefollowing states Utarakhand (17.63), Gujarat (16.5), Dadra & Nagar Haveli (UT) (20.53),Haryana (18.61), Orissa (18.04), Chhattisgarh (20.86), Madhya Pradesh (20.51), UttarPradesh (19.98), Jammu & Kashmir (20.25), Rajasthan (27.85), Jharkhand (22.24) andBihar (20.06). These state gaps is more than national average. If literacy gap is thatarea socio economic condition is poor.
The lowest female literacy gap is found in the following states Kerala (4.04),Lakshadweep (UT) (7.86), Mizoram (4.32), Tripura(9.03), Chandigarh (UT) (9.16),Andaman & Nicobar Islands (UT) (8.27), Nagaland (6.6) and Meghalaya (3.39).Specifically Meghalaya state literacy gap is only 3.39 per cent.
The data related Literate gap in India for the period of 1991 to 2011. Indi’sliteracy gap is 24.85 at 1991 census. In the 2001 census the literacy gap is furthernarrow 21.59 in the 2001 census. In the latest 2011 population census literate gapis further narrow 16.68. This is one of the positive indicators for the educationdevelopment.
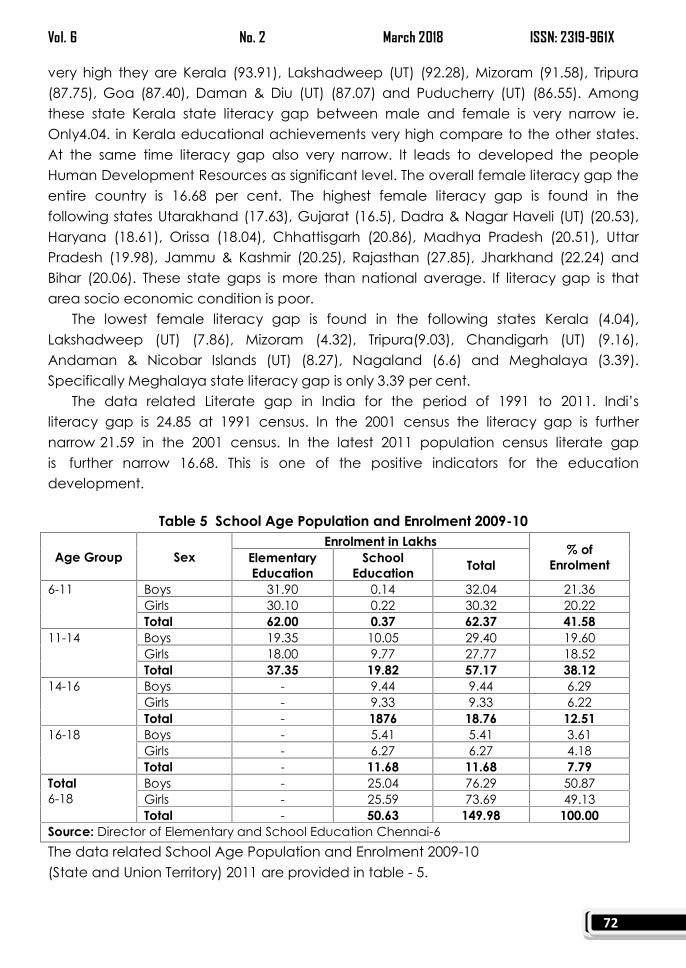
Table 5 School Age Population and Enrolment 2009-10
Age Group SexEnrolment in Lakhs % of
EnrolmentElementaryEducation
SchoolEducation Total
6-11 Boys 31.90 0.14 32.04 21.36Girls 30.10 0.22 30.32 20.22Total 62.00 0.37 62.37 41.58
11-14 Boys 19.35 10.05 29.40 19.60Girls 18.00 9.77 27.77 18.52Total 37.35 19.82 57.17 38.12
14-16 Boys - 9.44 9.44 6.29Girls - 9.33 9.33 6.22Total - 1876 18.76 12.51
16-18 Boys - 5.41 5.41 3.61Girls - 6.27 6.27 4.18Total - 11.68 11.68 7.79
Total6-18
Boys - 25.04 76.29 50.87Girls - 25.59 73.69 49.13Total - 50.63 149.98 100.00
Source: Director of Elementary and School Education Chennai-6The data related School Age Population and Enrolment 2009-10(State and Union Territory) 2011 are provided in table - 5.
Shanlax International Journal of Economics
73
In the age group of (6-18) 149.98 lakhs students are studying in the India.At schools age (6-11) in India 62.37 lakhs are studying in the regular primary schoolstheir percentage to the total students is 41.58 to total students. In the age group of (11-14) 57.17 lakhs students are studying their percentage is 38.12 per cent. In the agegroup of (14-16) 18.76 lakhs students are studying their percentage is 12.51 per cent.In the age group of (16-18) 11.68 lakhs students are studying their percentage is 7.79per cent.
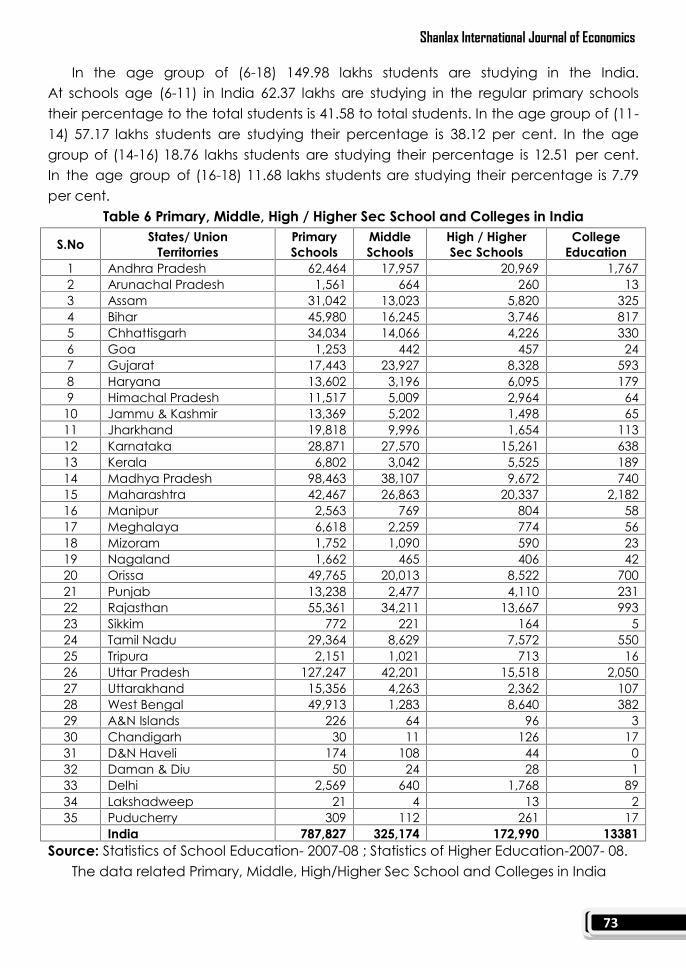
Table 6 Primary, Middle, High / Higher Sec School and Colleges in India
S.No States/ UnionTerritorries
PrimarySchools
MiddleSchools
High / HigherSec Schools
CollegeEducation
1 Andhra Pradesh 62,464 17,957 20,969 1,7672 Arunachal Pradesh 1,561 664 260 133 Assam 31,042 13,023 5,820 3254 Bihar 45,980 16,245 3,746 8175 Chhattisgarh 34,034 14,066 4,226 3306 Goa 1,253 442 457 247 Gujarat 17,443 23,927 8,328 5938 Haryana 13,602 3,196 6,095 1799 Himachal Pradesh 11,517 5,009 2,964 64
10 Jammu & Kashmir 13,369 5,202 1,498 6511 Jharkhand 19,818 9,996 1,654 11312 Karnataka 28,871 27,570 15,261 63813 Kerala 6,802 3,042 5,525 18914 Madhya Pradesh 98,463 38,107 9,672 74015 Maharashtra 42,467 26,863 20,337 2,18216 Manipur 2,563 769 804 5817 Meghalaya 6,618 2,259 774 5618 Mizoram 1,752 1,090 590 2319 Nagaland 1,662 465 406 4220 Orissa 49,765 20,013 8,522 70021 Punjab 13,238 2,477 4,110 23122 Rajasthan 55,361 34,211 13,667 99323 Sikkim 772 221 164 524 Tamil Nadu 29,364 8,629 7,572 55025 Tripura 2,151 1,021 713 1626 Uttar Pradesh 127,247 42,201 15,518 2,05027 Uttarakhand 15,356 4,263 2,362 10728 West Bengal 49,913 1,283 8,640 38229 A&N Islands 226 64 96 330 Chandigarh 30 11 126 1731 D&N Haveli 174 108 44 032 Daman & Diu 50 24 28 133 Delhi 2,569 640 1,768 8934 Lakshadweep 21 4 13 235 Puducherry 309 112 261 17
India 787,827 325,174 172,990 13381Source: Statistics of School Education- 2007-08 ; Statistics of Higher Education-2007- 08.
The data related Primary, Middle, High/Higher Sec School and Colleges in India

Vol. 6 No. 2 March 2018 ISSN: 2319-961X
74
Table 7 Drop-out Rates in Classes I-X (6 – 16 age group) in India 2007-08S.No States/UTs Boys Girls Total
1 Andhra Pradesh 62.30 64.00 63.132 Arunachal Pradesh 63.67 62.21 63.003 Assam 75.12 76.34 75.684 Bihar 78.27 81.46 79.545 Chattisgarh* - - -6 Goa 41.97 35.56 38.867 Gujarat 57.53 61.19 59.118 Haryana 33.99 39.15 36.439 Himachal Pradesh 26.14 34.23 30.21
10 Jammu & Kashmir 63.62 64.48 63.9911 Jharkhand* - - -12 Karnataka 49.93 48.85 49.4113 Kerala 1.54 -2.59 -0.5014 Madhya Pradesh 57.99 66.17 61.6015 Maharashtra 43.41 49.15 46.1716 Manipur 47.91 40.83 44.6017 Meghalaya 76.78 75.50 76.1418 Mizoram 73.15 69.49 71.4319 Nagaland 74.58 73.39 74.0020 Orissa 65.07 64.27 64.7021 Punjab 49.95 50.04 49.9922 Rajasthan 70.19 73.58 71.4523 Sikkim 80.63 79.30 79.9824 Tamil Nadu 38.88 36.51 37.7325 Tripura 73.48 73.35 73.4226 Uttar Pradesh 30.27 19.60 26.1827 Uttarakhand* - - -28 West Bengal 71.38 74.40 72.8029 A&N Islands 32.39 30.30 31.3830 Chandigarh 35.66 41.52 38.4631 D&N Haveli 52.67 62.14 57.0432 Daman & Diu 31.83 29.47 30.6933 Delhi 33.84 38.38 36.0434 Lakshadweep 26.26 35.67 30.7435 Puducherry 5.16 -0.94 2.19
India 56.43 57.29 56.81Source: Abstract of Selected Educational Statistics 2007-08; Ministry of Human
Resources Development; GoI* Dropout rates are shown combined with the respective parent state; Zero
indicates that there is no Drop-out.The data related Drop-out Rates in Classes I-X (6 – 16 age groups) in India for the
period of 2007-08 was provided in table - 7.
Education System in IndiaIndia is the seventh largest country in the world, covering an area of 3,287,782 sq.
km. India is a pluralistic society with great diversity in culture, religion and languages. It is

Shanlax International Journal of Economics
75
the second most populous country in the world, next to China. According to recentestimates by the Government of India (2000), the population has crossed the one billionmark. India is a Union of twenty-five states and seven Union Territories (UTs), and hasadopted a parliamentary form of government with a federal structure. The Constitutionof India provides for a division of powers between centre and states, drawing three lists:the union list, the state list and the concurrent list (Government of India, 1967). Thecentral and state governments are jointly concerned by the subjects specified in theconcurrent list, education being one of these. The central government can implementpolicy decisions directly through a network of organizations, such as the CentralAdvisory Board of Education, the University Grants Commission, etc. State governmentsalso implement educational policies through similar organizations, such as State Boardsof Education, State Councils for Educational Research and Training etc.
Literacy Rate in IndiaThe data related Literate population in India for the period of 1951 to 2011 are
provided in table - 4.2. India has an average literacy rate of 18.33 per cent, maleliteracy is 27.16 per cent and female literacy is 8.86 per cent at the time ofIndependent. There are after our country gives more focus to the education so thatliterate population rate was increased in every census. After the Independenteducation was concurrent list so both state and central government focus toeducation. During these period lot of educational instructions were establishedthrougho ut the country. At 2011population census the average literacy rate of74.04 per cent, male literacy is 82.14 per cent and female literacy is 65.46 per cent. Stillone fourth female population are illiterate in India.
Literacy Rate and literacy gap of IndiaIn India following state and union territory literacy rate is very high they are Kerala
(93.91), Lakshadweep (UT) (92.28), Mizoram (91.58), Tripura (87.75), Goa (87.40), Daman& Diu (UT) (87.07) and Puducherry (UT) (86.55). Among these state Kerala state literacygap between male and female is very narrow ie. only 4.04. In Kerala educationalachievements very high compare to the other states. At the same time literacy gapalso very narrow. It leads to developed the people Human Development Resources assignificant level.
The overall female literacy gap the entire country is 16.68 per cent. The highestfemale literacy gap is found in the following states Utarakhand (17.63), Gujarat (16.5),Dadra & Nagar Haveli (UT) (20.53), Haryana (18.61), Orissa (18.04), Chhattisgarh (20.86),Madhya Pradesh (20.51), Uttar Pradesh (19.98), Jammu & Kashmir (20.25), Rajasthan(27.85), Jharkhand (22.24) and Bihar (20.06). This state gap is more than nationalaverage. If literacy gap is that area socio economic condition is poor.
The lowest female literacy gap is found in the following states Kerala (4.04),

Vol. 6 No. 2 March 2018 ISSN: 2319-961X
76
Lakshadweep (UT) (7.86), Mizoram (4.32), Tripura (9.03), Chandigarh (UT) (9.16),Andaman & Nicobar Islands (UT) (8.27), Nagaland (6.6) and Meghalaya (3.39).Specifically Meghalaya state literacy gap is only 3.39 per cent.
The data related Literate gap in India for the period of 1991 to 2011. Indi’sliteracy gap is 24.85 at 1991 census. In the 2001 census the literacy gap is furthernarrow
21.59 in the 2001 census. In the latest 2011 population census literate gap isfurther narrow 16.68. This is one of the positive indicators for the educationdevelopment.
Conclusions"There is in our time no well-educated literate population that is poor; there is no
illiterate population that is other than poor." (John Kenneth Galbraith) This simple butforceful message reiterates that education alone can be the salvation for poverty, andup- liftmen of the socially discriminated. In a populous country like India where evenwith education life is difficult, there can be little hope without it. Poor as well as middle-income group, rural as well as urban all are willing to send their children to school.There is solid evidence from all over the country for this increasing appetite foreducation across all social groups and across all income groups. In recent yearssustained and high levels of economic growth provide a unique opportunity andmomentum for faster social sector development. Investing in education plays a keyrole in meeting the World Bank’s social development objectives, which supportinclusive growth, social cohesion, and accountability in development. ProfessorAmartya Sen recently emphasised education as an important parameter for anyinclusive growth in an economy. The policies have to focus on inclusive rather thandivisive growth strategies. Corporate India moving towards this sector is laudable, butit is clear that deficiency in education cannot be met by mere expansion of privateschools in urban areas. “Public education is as indispensable as public health care, nomatter what supplementary role private schools and private medical care canplay”(Prof. Sen, 2008).
References1. Adel man Irma and Morris (1976), “Society Politics and Economic Development-
A Quantitative Approach”, The John Hopkins Bultimor.2. Arul Gosh (1992), “Education the Basic Development Planning in India”, The
change of Nineties, Pp.85-105.3. Andre Bettle March (1995), “Universities as Institutions”, Economic and Political
Weekly, Vol.XXX, No.9.4. Allen Roy and others (2000),”Education Expenditure of large states”, Economic
and Political weekly, Vol.XXX, No.7.

Shanlax International Journal of Economics
77
5. Baljit.F. and Berstecher.D (1986),”Economics of Indian Education”, MeenakshiPrakasham, New Delhi.
6. Edding.F. and Berstecher.D (1969), “Insternational Development of EducationalExpenditure”, Paris, UNESCO.
7. Guhan.S. (1995), “Social Expenditure in the Union Budget”, Economic andpolitical weekly, Vol. 30 Issue (19), May 6-13, Pp 1095-1102.
8. Goel.S.C, “Education and Economic Growth in India”, The Macmilan Companyof India Ltd. (1975).
9. Gosal.G.S.(1964),”Literacy in India, “An inter-Pretative Study, Rural Sociology,Volume No.29.
10. Government of India (1985), “Challenge of Education-A policy perspective”,Ministry of Education, Government of India, New Delhi.
11. Harbison and Myers, “Education, Manpower and Economic Growth”, Oxfordand IBH Publishing Company (1974).
12. Jandhyala.B.G, Tilak (1980), “Allocation of Resource to Education”, EasternEconomist, 29th August.
13. Jallade.J.P. (1979),”Financing Education for Income Distribution Margin”.14. Joy Kumar.A.(1992), “Impact of Noon Meal Programme on Primary Education”,
Economics and Political Weekly, 24th October.15. Kasum. K.Premi (1990), “Education Prospective 1981-2001”, Major Lassues Man
and Development, Volume No.XII, June Purchase power. 40-50.16. Kiran Batty (1998), “Educational Deprivation in India – A survey of field
investigation”, Economic Political Weekly, Volume No.33 (27), P (1731).17. Krishna Kumar (1998), “Educational and Society in Post Independence India
looking towards the Future”, Economic Political Weekly, Volume No.33 (23), P1391.18. National Council for Education Research, and Training (NCAER), (1992), Household
survey of Medicare, New Delhi, P19.19. Narayan.D.(2001), “Has Poverty Declined in India”, Economic Political Weekly,
Volume No.XXXVI, No.14, October 13, P3950.20. Nayana Tata (1989), “Issues in India Higher Education, Yojana.21. Paromesh Acharya.(1994), “Problems of Universal Elementary Education”, -
Economic Political weekly, Volume No .XXIXX, No.40, December3.22. Rangarkan (1996-97), “Dimension Of Primary Education – The base for
Economic Development in India”, Southern Economist, Volume No.23, PurchasePower.21-31. Reddy.K.N. (1987), “State Disparities in Education Expenditure “,Journal Educational Expenditure and Administration, Volume No.384, Silver jubileeSpecial Issue.
23. Savitha Sinha Aprik (1991), “Expenditure on Education in India Policy and Issue”,Southern Economist.

Vol. 6 No. 2 March 2018 ISSN: 2319-961X
78
24. Schulter.S, “Education in the 1990’s Economic Political Weekly, Volume No.31,P2086.
25. Schulter. T.P (1988), “Expansion of Public School Expenditure and Enrolments –Inter Country Evidence on the Effect of Income, Prices and Population Growth”,Economic and Education review 7(2), Purchase power.183.
26. Surabhi Patel, Equality of Educational Opportunity in India.27. Tilak.B.G. (1985), “Educational Finance in India”, NIEPA, Occasional Paper.
Tilak.G.G. (1997), “Inter State Disparities in Educational Development”, EasternEconomist, July 20, Purchase power.140-146.
28. Vashoist (1989), “Population Problem in Education”, Yojana No.5.29. Zymelman.M (1989), “Patterns of Educational Expenditure”, World Bank Staff
Working Paper, No.246, Washington D.C.30. Stevens and Martin Weale (August 2003) Philip and Economic Growth National
Institute of Economic and Social Research 2, Dean Trench Street London SW1P 3HE31. S. C. Goel (Jun., 1974) Education and Economic Growth in India Comparative
Education, Vol. 10, No. 2, , pp. 147-158 Published Taylor & Francis, Ltd. StableURL: http://www.jstor.org/stable/3098057 Accessed: 09/07/2008 04:09
32. Sheila Slaughter (2001) Problems in comparative higher education: Politicaleconomy, political sociology and postmodernism Centre for the Study of HigherEducation, the University of Arizona, Tucson, AZ, USA Kluwer Academic Publishers.
33. Monojit Chatterji February (2008) Education and Economic Development inIndia University of Dundee