Embed Size (px)
Citation preview
International Journal of Management Studies ISSN(Print) 2249-0302 ISSN (Online)2231-2528 http://www.researchersworld.com/ijms/
Vol.–V, Issue –3(8), July 2018 [102]
DOI : 10.18843/ijms/v5i3(8)/12
DOIURL :http://dx.doi.org/10.18843/ijms/v5i3(8)/12
A Study on Customer Satisfaction Towards
Departmental Stores in Tirupur District
Dr. R.Chandrakala, M.Com (C.A)., M.Phil.,
Assistant Professor,
Department of B.Com (C.A),
Tiruppur Kumaran College for Women,
Tirupur, Tamilnadu, India.
Dr. M.Sudhahar,
M.Com.,M.Phil., PGDCA.,MBA, (CA Inter), Ph.D,
Assistant Professor,
PG & Research Department of Commerce,
Gobi Arts & Science College,
Gobichettipalayam, Erode, Tamilnadu, India.
ABSTRACT
The substitution of small retail stores by the large stores has been a topic of debate among
academics, practitioners, retailers and general public, especially in the context of foreign firms
entering emerging markets such as China and India. The purpose of this research is to find out the
determinants of consumer satisfaction in departmental stores, with a sample from Tirupur district.
As satisfied customer is a valuable asset to any organization, especially, for the ones dealing with
ultimate consumers Data were collected using a 19-item structured questionnaire developed by the
authors. The sample consists of 400 consumers who shop at departmental stores in Tripur District.
Exploratory factor analysis grouped the 19 variables into 6 factors. Further, ANOVA and f-test
revealed that six of the factors (Employees’ behavior, Leisure & refreshment, Ambience, Price &
Quality, Location and Exclusive Products) were major predictors of consumer satisfaction as they
were found to be significant at 1% or 5% level. The factor analysis, ANOVA and f-test results
reveal that customer satisfaction is influenced by the six factors resulted from factor analysis test
and further, socio-economic variables have a good voice-over the customer satisfaction while
buying in the departmental stores in Tirupur district. The research can be extended in other areas
of the State and comparative study can be undertaken by taking other organized retail formats.
Keywords: Customer satisfaction, departmental stores, Leisure & refreshment and Ambience.
INTRODUCTION:
Customer satisfaction plays a vital role in the formation of consumers‟ future purchase intentions. Satisfied
customers are treated as an asset of any business concern in the present competitive era. Consumers are likely to
express others of their favorable experiences and engage in positive word of mouth advertising. Customer
satisfaction, not only is the leading indication to measure customer loyalty, identify unhappy customers, reduce
churn and increase revenue, it is also a key point of differentiation that helps to attract new customers in
competitive business environments. In a turbulent commercial environment, in order to sustain the growth and
increase their market share, departmental stores need to understand how to satisfy customers, as customer
satisfaction is crucial for establishing long term customer relationships. It is evident by the fact that over the last
five years customer satisfaction surveys have become common in many business outlets. Thus, a fundamental
understanding of factors impacting customer satisfaction is of great importance to business, particularly the
business of departmental stores.
REVIEW OF LITERATURE:
Satnam Kour Ubeja and D.D. Bedia (2011), quoted that Customer satisfaction is a complex phenomenon for
marketers as well as researchers. The objectives of the present study were to analyze the customer satisfaction
International Journal of Management Studies ISSN(Print) 2249-0302 ISSN (Online)2231-2528 http://www.researchersworld.com/ijms/
Vol.–V, Issue –3(8), July 2018 [103]
in shopping malls with respect to product, price, place and promotion in Indore city and to study the variations
in customer satisfaction due to different demographic variables. The factors were product consciousness,
comfort with entertainment seeker, extra service conscious, store and hygiene consciousness, price
consciousness, billing flexibility and facility, sales people consciousness, choice of store, employee
consciousness and taste consciousness.
Saini Neelam (2012), indicate that variety of products, branded products and availability of necessary goods
under same roof, reasonable price and fixed price and location of organized retail outlets at close to residence or
work place play a significant role in motivating the customers to visit organized retail outlet. There is a
significant relationship between customer satisfaction and 5 dimensions of service quality of organized retail
outlets. Those five dimensions were Product Characteristics, Price factor, Physical aspects, Promotional
schemes and Personnel interaction. Since the results of the study show that customers‟ satisfaction is related
with service quality of retail stores in terms above said 5 dimensions, therefore, retailers need to stress on these
related aspects in providing their services.
U.Dinesh kumar and P.Vikkraman (2012), found that 64% of respondents were purchasing from convenience
store before moving to organised retail stores. They also found that consumers were highly satisfied with quality
of services provided in organised retail stores and highly dissatisfied with variety of mode of payment and
parking facility. The study suggested increasing the services like parking facility, convenient payment methods
and special attention to avoid long standing queue for billing and payment will make the business flourish.
K.Narayanan, Samal and Rao (2013), found that 36% customers were satisfied with the goods and services of
organised retail stores, 38% customers were not satisfied due to inconvenient parking facility, long standing
queue for billing and delivery, poor home delivery services and the like and remaining 26% customers were
sure about their satisfaction level. This fact is a word of caution for organised retailers to take care of services to
win over the customers‟ satisfaction.
R.Gomathi, S.Kishore, R.Deepika (2013), spells out that there is relationship between the gender of the
respondents and various offers and discounts offered by the departmental stores. The customers are dissatisfied
with the parking facilities, price of products like fancy items, children‟s toys, door delivery, billing procedure, long
waiting time the departmental stores should address these issues quickly to make their customers satisfy and happy.
Sushmana (2014) have proved that 40% of the customers prefer unorganised retail shopping while 34% of the
customers prefer organised retail stores and 26% of the customers prefer both. Further, 58% of the customers
are satisfied with pricing strategy, 42% of the customers are not satisfied.
Hameed (2015), highlighted that store layout must be favourable for high level of satisfaction, for high level of
brand loyalty. It is also found that factors like less queue and welcoming staff, services, quality and accuracy of
bills, price and price discount positively affects the customers‟ reliability. The researcher suggested that if
additional facilities are provided to customers they are attracted towards stores.
Sameera.P (2015), found that majority of customers are satisfied with the product variety and price range,
physical facilities, adaption of modern equipment and fixtures, operating hours, quality of services etc., They
are also satisfied with self service, product price, visual merchandising, home delivery and fast checkouts. They
feel that the store layout is easily accessible to find the products. But at the same time the study points out some
difficulties are associated with organized retail outlets like improper, insufficient parking facility and in this era
of technological advancement the customers are likely to have variety mode of payment in the shops as their
convenience. But majority of shops are lacking these facilities.
RESEARCH METHODOLOGY:
The study is descriptive in nature. Among the different districts Tirupur districts has been purposively selected
for the present study. The respondents have been selected by adopting multi-stage sampling technique through
pre-tested, structured questionnaire and analyzed using the statistical tools factor analysis, ANOVA and f-test.
The period of study is June 2017 – August 2017. Both primary as well as secondary data was used for the study.
Likert Scale has been incorporated to gather information on 19 statements related to satisfaction of customers.
Necessary changes have been made in the questionnaire after the pilot study with 50 respondents.
Quantification and Scoring Procedure :
To measure the level of satisfaction of the sample customers towards departmental stores, Likert‟s summated scaling
technique has been adopted. Nineteen statements relating to the satisfaction of customers have been constructed.
The respondents have been asked to indicate their satisfaction regarding each satisfaction statement in the Likert‟s
five point scale. The scale values 5,4,3,2 and 1 have been used to measure the satisfaction level of the respondent.
International Journal of Management Studies ISSN(Print) 2249-0302 ISSN (Online)2231-2528 http://www.researchersworld.com/ijms/
Vol.–V, Issue –3(8), July 2018 [104]
For the purpose of analysis based on the satisfaction score, the customers have been grouped into three viz., low,
medium and high. The respondents who have scored 47 or less are classified as „Low‟ (that is, if his or her
response for 10 or more statements is dissatisfied or highly dissatisfied and for 9 statements is neutral). The
respondents who have scored 67 and above are classified as „High‟ (that is, if his or her response for 10 or more
statements is highly satisfied or satisfied and for 9 or less statements is neutral). The respondents who have
scored between 48 to 66 are classified as „Medium‟.
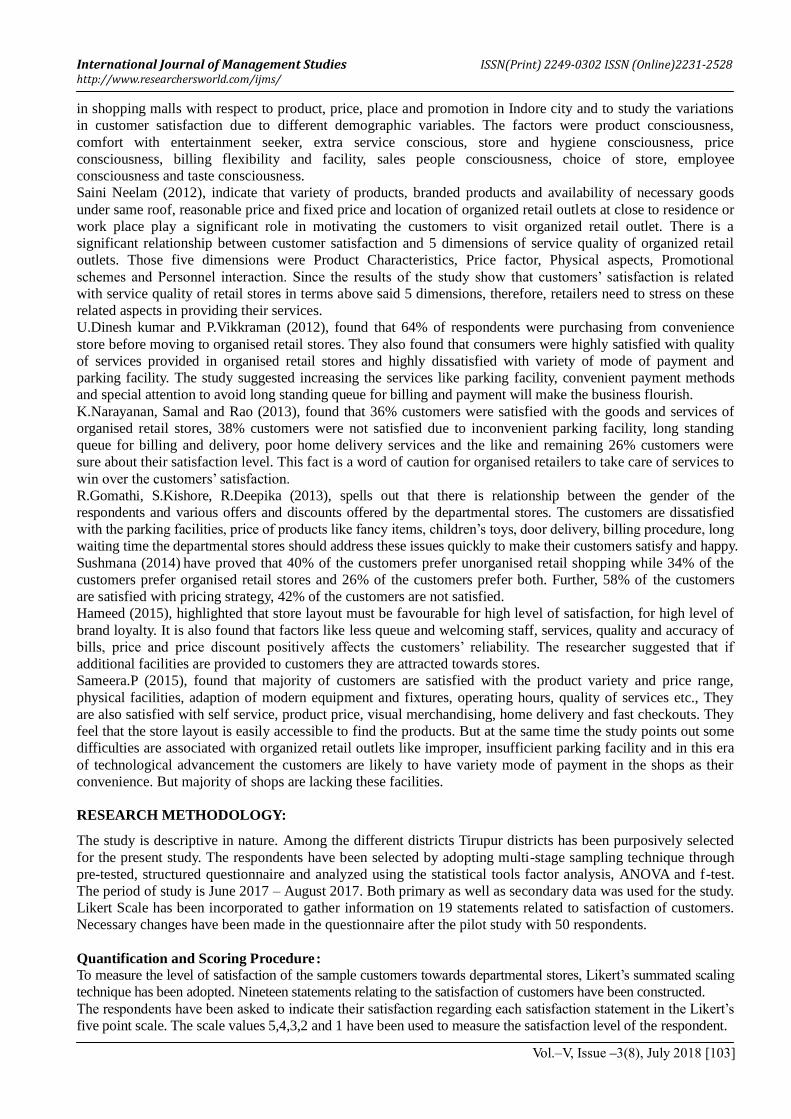
Table 1: Distribution of respondents based on the level of satisfaction
Level of satisfaction No. Percent
Low(47 or less) 116 29.0
Medium (48-66) 152 38.0
High(67 and above) 132 33.0
Total 400 100.0
Table 1 shows that among 400 customers, 116 (26%) are having low level of satisfaction, 152 (38%) are having
medium level of satisfaction and 132 (33%) are having high level of satisfaction towards departmental stores.
Relationship Between the Overall Satisfaction Level and Socio-Economic Characteristics of the Customers:
From the fresh look of the past literatures, it is understood that the socio-economic characteristics influence to
some extent the satisfaction of respondents towards departmental stores. Hence, an attempt has been made to
examine the relationship between the socio-economic characteristics of the respondents and their level of
satisfaction, for which the following hypothesis has been framed and tested. The result of the analysis is
presented below.
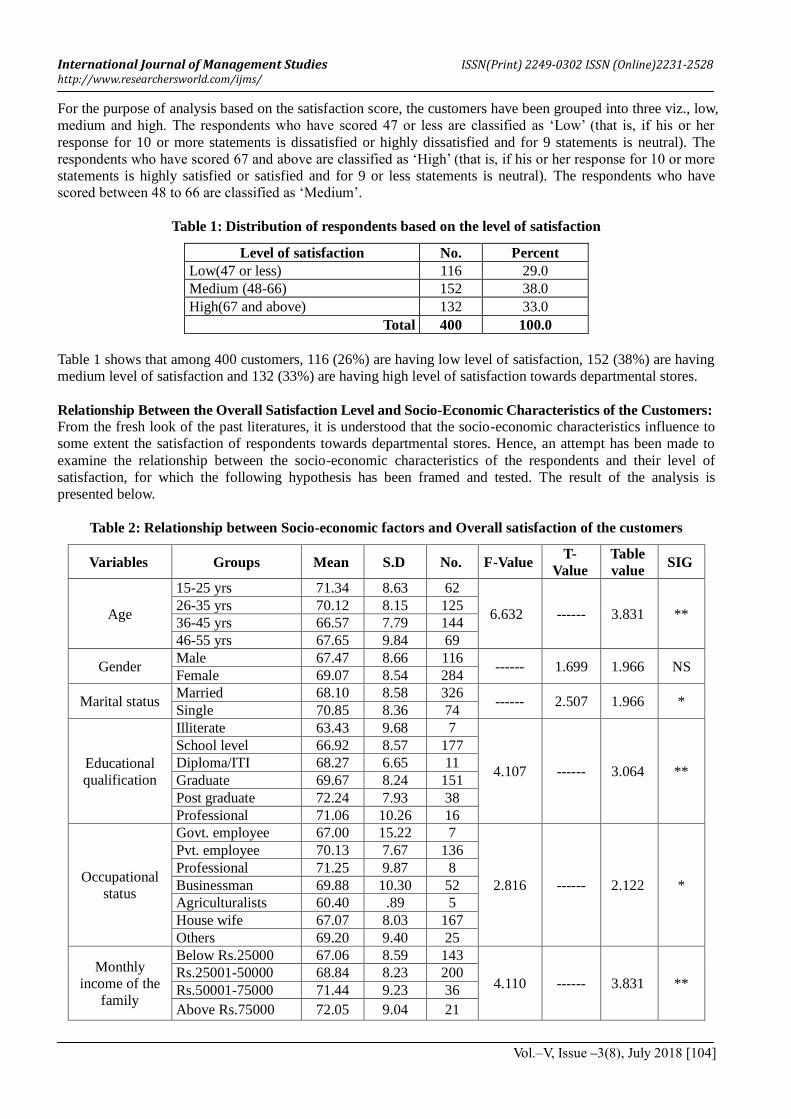
Table 2: Relationship between Socio-economic factors and Overall satisfaction of the customers
Variables Groups Mean S.D No. F-Value T-
Value
Table
value SIG
Age
15-25 yrs 71.34 8.63 62
6.632 ------ 3.831 ** 26-35 yrs 70.12 8.15 125
36-45 yrs 66.57 7.79 144
46-55 yrs 67.65 9.84 69
Gender Male 67.47 8.66 116
------ 1.699 1.966 NS Female 69.07 8.54 284
Marital status Married 68.10 8.58 326
------ 2.507 1.966 * Single 70.85 8.36 74
Educational
qualification
Illiterate 63.43 9.68 7
4.107 ------ 3.064 **
School level 66.92 8.57 177
Diploma/ITI 68.27 6.65 11
Graduate 69.67 8.24 151
Post graduate 72.24 7.93 38
Professional 71.06 10.26 16
Occupational
status
Govt. employee 67.00 15.22 7
2.816 ------ 2.122 *
Pvt. employee 70.13 7.67 136
Professional 71.25 9.87 8
Businessman 69.88 10.30 52
Agriculturalists 60.40 .89 5
House wife 67.07 8.03 167
Others 69.20 9.40 25
Monthly
income of the
family
Below Rs.25000 67.06 8.59 143
4.110 ------ 3.831 ** Rs.25001-50000 68.84 8.23 200
Rs.50001-75000 71.44 9.23 36
Above Rs.75000 72.05 9.04 21
International Journal of Management Studies ISSN(Print) 2249-0302 ISSN (Online)2231-2528 http://www.researchersworld.com/ijms/
Vol.–V, Issue –3(8), July 2018 [105]
Variables Groups Mean S.D No. F-Value T-
Value
Table
value SIG
Duration of
Shopping
Less than 1 year 71.68 8.92 80
9.805 ------ 3.831 ** 1-5 years 66.63 7.77 195
6-10 years 68.63 8.48 88
More than 10 years 72.35 9.39 37
Distance
travelled
Up to 5 km 68.97 8.44 243
0.838 ------ 3.018 NS 6-10 km 67.83 9.22 134
11-15 km 69.30 6.00 23
Amount spent
Rs.1000 69.80 7.05 30
0.395 ------ 2.627 NS
Rs.2000 68.96 9.99 90
Rs.3000 67.63 8.89 119
Rs.4000 67.77 8.54 82
Rs.5000 69.56 7.09 64
More than Rs.5000 72.33 4.10 15
Impulsive
purchase
Yes 68.75 8.40 302 ------- 0.612 1.966 NS
No 68.14 9.18 98
Note: *- 5% level of significance, ** - 1% level of significance, NS- not significance
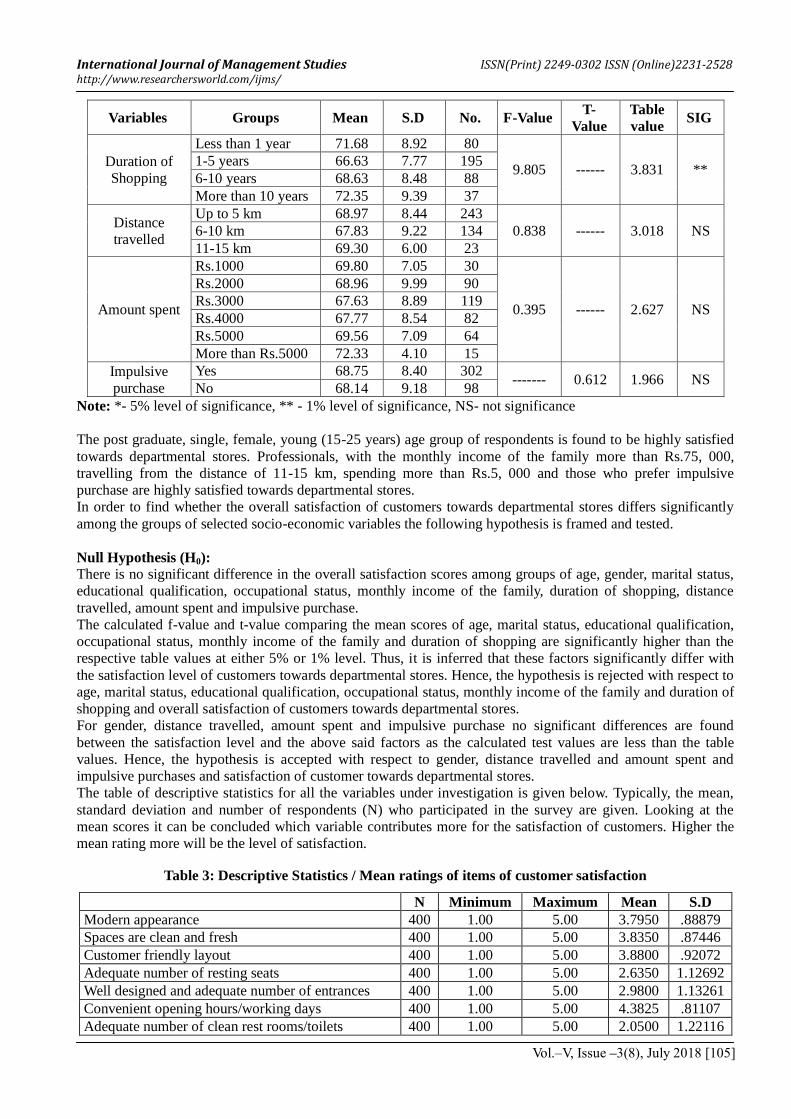
The post graduate, single, female, young (15-25 years) age group of respondents is found to be highly satisfied
towards departmental stores. Professionals, with the monthly income of the family more than Rs.75, 000,
travelling from the distance of 11-15 km, spending more than Rs.5, 000 and those who prefer impulsive
purchase are highly satisfied towards departmental stores.
In order to find whether the overall satisfaction of customers towards departmental stores differs significantly
among the groups of selected socio-economic variables the following hypothesis is framed and tested.
Null Hypothesis (H0):
There is no significant difference in the overall satisfaction scores among groups of age, gender, marital status,
educational qualification, occupational status, monthly income of the family, duration of shopping, distance
travelled, amount spent and impulsive purchase.
The calculated f-value and t-value comparing the mean scores of age, marital status, educational qualification,
occupational status, monthly income of the family and duration of shopping are significantly higher than the
respective table values at either 5% or 1% level. Thus, it is inferred that these factors significantly differ with
the satisfaction level of customers towards departmental stores. Hence, the hypothesis is rejected with respect to
age, marital status, educational qualification, occupational status, monthly income of the family and duration of
shopping and overall satisfaction of customers towards departmental stores.
For gender, distance travelled, amount spent and impulsive purchase no significant differences are found
between the satisfaction level and the above said factors as the calculated test values are less than the table
values. Hence, the hypothesis is accepted with respect to gender, distance travelled and amount spent and
impulsive purchases and satisfaction of customer towards departmental stores.
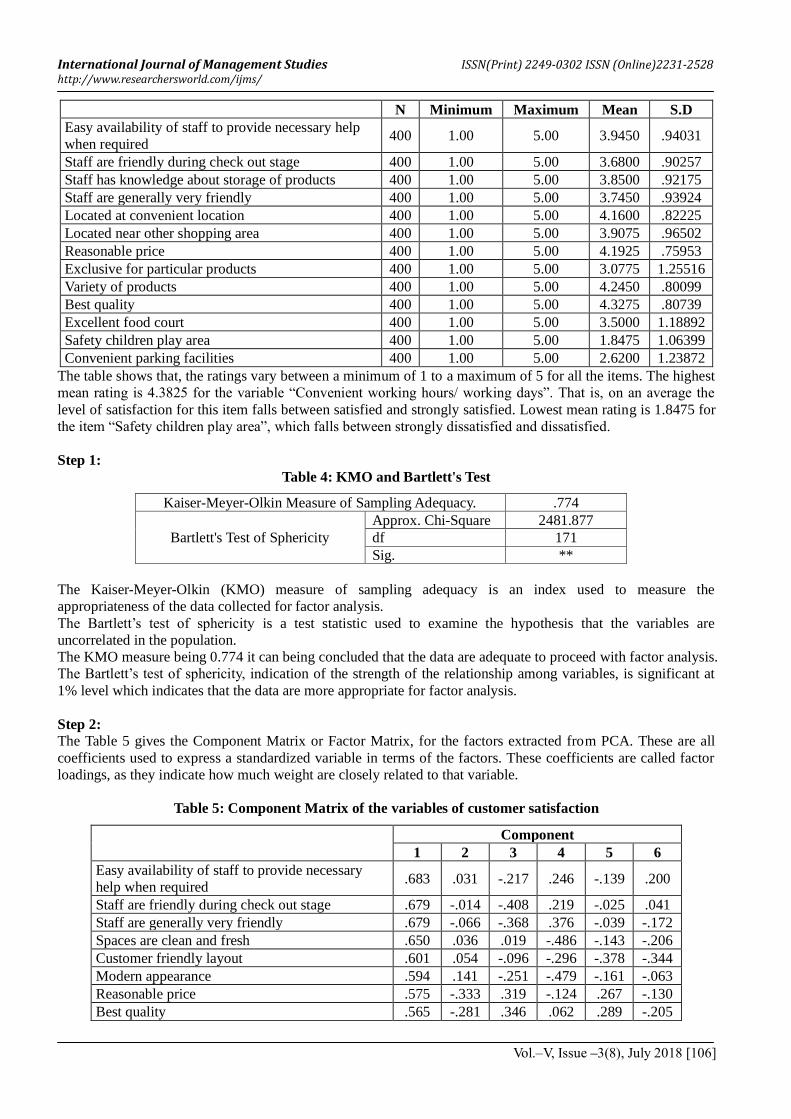
The table of descriptive statistics for all the variables under investigation is given below. Typically, the mean,
standard deviation and number of respondents (N) who participated in the survey are given. Looking at the
mean scores it can be concluded which variable contributes more for the satisfaction of customers. Higher the
mean rating more will be the level of satisfaction.
Table 3: Descriptive Statistics / Mean ratings of items of customer satisfaction
N Minimum Maximum Mean S.D
Modern appearance 400 1.00 5.00 3.7950 .88879
Spaces are clean and fresh 400 1.00 5.00 3.8350 .87446
Customer friendly layout 400 1.00 5.00 3.8800 .92072
Adequate number of resting seats 400 1.00 5.00 2.6350 1.12692
Well designed and adequate number of entrances 400 1.00 5.00 2.9800 1.13261
Convenient opening hours/working days 400 1.00 5.00 4.3825 .81107
Adequate number of clean rest rooms/toilets 400 1.00 5.00 2.0500 1.22116
International Journal of Management Studies ISSN(Print) 2249-0302 ISSN (Online)2231-2528 http://www.researchersworld.com/ijms/
Vol.–V, Issue –3(8), July 2018 [106]
N Minimum Maximum Mean S.D
Easy availability of staff to provide necessary help
when required 400 1.00 5.00 3.9450 .94031
Staff are friendly during check out stage 400 1.00 5.00 3.6800 .90257
Staff has knowledge about storage of products 400 1.00 5.00 3.8500 .92175
Staff are generally very friendly 400 1.00 5.00 3.7450 .93924
Located at convenient location 400 1.00 5.00 4.1600 .82225
Located near other shopping area 400 1.00 5.00 3.9075 .96502
Reasonable price 400 1.00 5.00 4.1925 .75953
Exclusive for particular products 400 1.00 5.00 3.0775 1.25516
Variety of products 400 1.00 5.00 4.2450 .80099
Best quality 400 1.00 5.00 4.3275 .80739
Excellent food court 400 1.00 5.00 3.5000 1.18892
Safety children play area 400 1.00 5.00 1.8475 1.06399
Convenient parking facilities 400 1.00 5.00 2.6200 1.23872
The table shows that, the ratings vary between a minimum of 1 to a maximum of 5 for all the items. The highest
mean rating is 4.3825 for the variable “Convenient working hours/ working days”. That is, on an average the
level of satisfaction for this item falls between satisfied and strongly satisfied. Lowest mean rating is 1.8475 for
the item “Safety children play area”, which falls between strongly dissatisfied and dissatisfied.
Step 1:
Table 4: KMO and Bartlett's Test
Kaiser-Meyer-Olkin Measure of Sampling Adequacy. .774
Bartlett's Test of Sphericity
Approx. Chi-Square 2481.877
df 171
Sig. **
The Kaiser-Meyer-Olkin (KMO) measure of sampling adequacy is an index used to measure the
appropriateness of the data collected for factor analysis.
The Bartlett‟s test of sphericity is a test statistic used to examine the hypothesis that the variables are
uncorrelated in the population.
The KMO measure being 0.774 it can being concluded that the data are adequate to proceed with factor analysis.
The Bartlett‟s test of sphericity, indication of the strength of the relationship among variables, is significant at
1% level which indicates that the data are more appropriate for factor analysis.
Step 2:
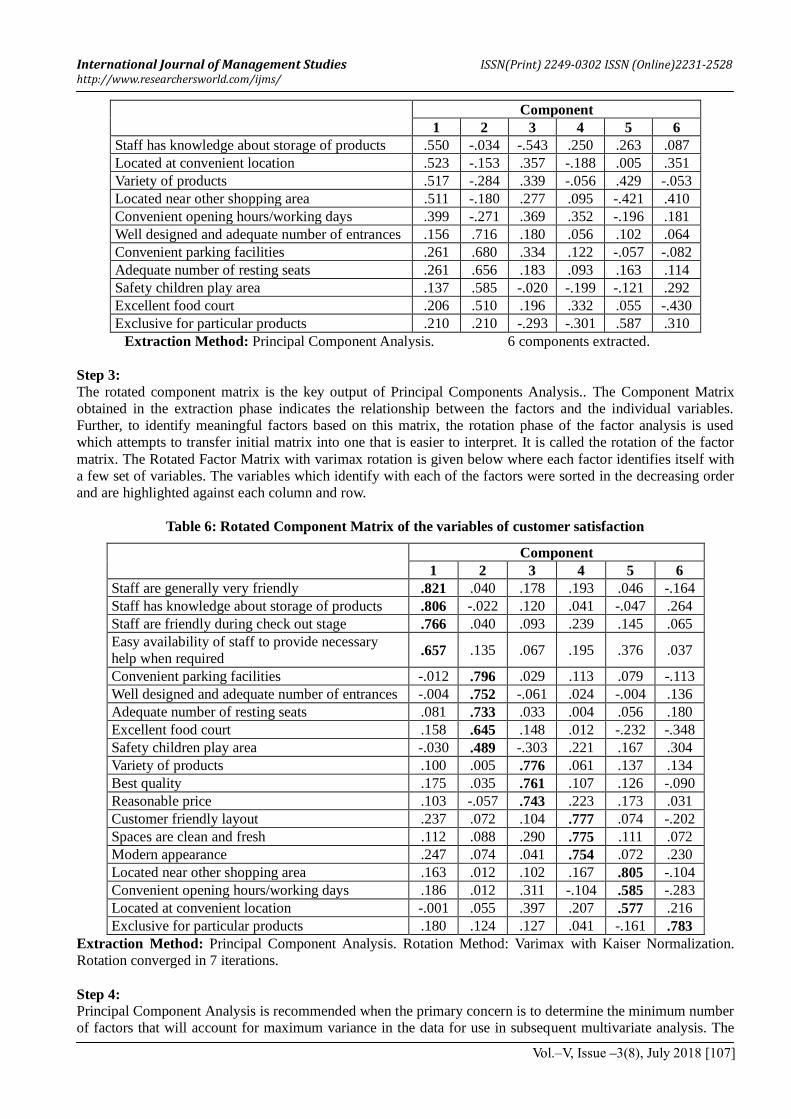
The Table 5 gives the Component Matrix or Factor Matrix, for the factors extracted from PCA. These are all
coefficients used to express a standardized variable in terms of the factors. These coefficients are called factor
loadings, as they indicate how much weight are closely related to that variable.
Table 5: Component Matrix of the variables of customer satisfaction
Component
1 2 3 4 5 6
Easy availability of staff to provide necessary
help when required .683 .031 -.217 .246 -.139 .200
Staff are friendly during check out stage .679 -.014 -.408 .219 -.025 .041
Staff are generally very friendly .679 -.066 -.368 .376 -.039 -.172
Spaces are clean and fresh .650 .036 .019 -.486 -.143 -.206
Customer friendly layout .601 .054 -.096 -.296 -.378 -.344
Modern appearance .594 .141 -.251 -.479 -.161 -.063
Reasonable price .575 -.333 .319 -.124 .267 -.130
Best quality .565 -.281 .346 .062 .289 -.205
International Journal of Management Studies ISSN(Print) 2249-0302 ISSN (Online)2231-2528 http://www.researchersworld.com/ijms/
Vol.–V, Issue –3(8), July 2018 [107]
Component
1 2 3 4 5 6
Staff has knowledge about storage of products .550 -.034 -.543 .250 .263 .087
Located at convenient location .523 -.153 .357 -.188 .005 .351
Variety of products .517 -.284 .339 -.056 .429 -.053
Located near other shopping area .511 -.180 .277 .095 -.421 .410
Convenient opening hours/working days .399 -.271 .369 .352 -.196 .181
Well designed and adequate number of entrances .156 .716 .180 .056 .102 .064
Convenient parking facilities .261 .680 .334 .122 -.057 -.082
Adequate number of resting seats .261 .656 .183 .093 .163 .114
Safety children play area .137 .585 -.020 -.199 -.121 .292
Excellent food court .206 .510 .196 .332 .055 -.430
Exclusive for particular products .210 .210 -.293 -.301 .587 .310
Extraction Method: Principal Component Analysis. 6 components extracted.
Step 3:
The rotated component matrix is the key output of Principal Components Analysis.. The Component Matrix
obtained in the extraction phase indicates the relationship between the factors and the individual variables.
Further, to identify meaningful factors based on this matrix, the rotation phase of the factor analysis is used
which attempts to transfer initial matrix into one that is easier to interpret. It is called the rotation of the factor
matrix. The Rotated Factor Matrix with varimax rotation is given below where each factor identifies itself with
a few set of variables. The variables which identify with each of the factors were sorted in the decreasing order
and are highlighted against each column and row.
Table 6: Rotated Component Matrix of the variables of customer satisfaction
Component
1 2 3 4 5 6
Staff are generally very friendly .821 .040 .178 .193 .046 -.164
Staff has knowledge about storage of products .806 -.022 .120 .041 -.047 .264
Staff are friendly during check out stage .766 .040 .093 .239 .145 .065
Easy availability of staff to provide necessary
help when required .657 .135 .067 .195 .376 .037
Convenient parking facilities -.012 .796 .029 .113 .079 -.113
Well designed and adequate number of entrances -.004 .752 -.061 .024 -.004 .136
Adequate number of resting seats .081 .733 .033 .004 .056 .180
Excellent food court .158 .645 .148 .012 -.232 -.348
Safety children play area -.030 .489 -.303 .221 .167 .304
Variety of products .100 .005 .776 .061 .137 .134
Best quality .175 .035 .761 .107 .126 -.090
Reasonable price .103 -.057 .743 .223 .173 .031
Customer friendly layout .237 .072 .104 .777 .074 -.202
Spaces are clean and fresh .112 .088 .290 .775 .111 .072
Modern appearance .247 .074 .041 .754 .072 .230
Located near other shopping area .163 .012 .102 .167 .805 -.104
Convenient opening hours/working days .186 .012 .311 -.104 .585 -.283
Located at convenient location -.001 .055 .397 .207 .577 .216
Exclusive for particular products .180 .124 .127 .041 -.161 .783
Extraction Method: Principal Component Analysis. Rotation Method: Varimax with Kaiser Normalization.
Rotation converged in 7 iterations.
Step 4:
Principal Component Analysis is recommended when the primary concern is to determine the minimum number
of factors that will account for maximum variance in the data for use in subsequent multivariate analysis. The
International Journal of Management Studies ISSN(Print) 2249-0302 ISSN (Online)2231-2528 http://www.researchersworld.com/ijms/
Vol.–V, Issue –3(8), July 2018 [108]
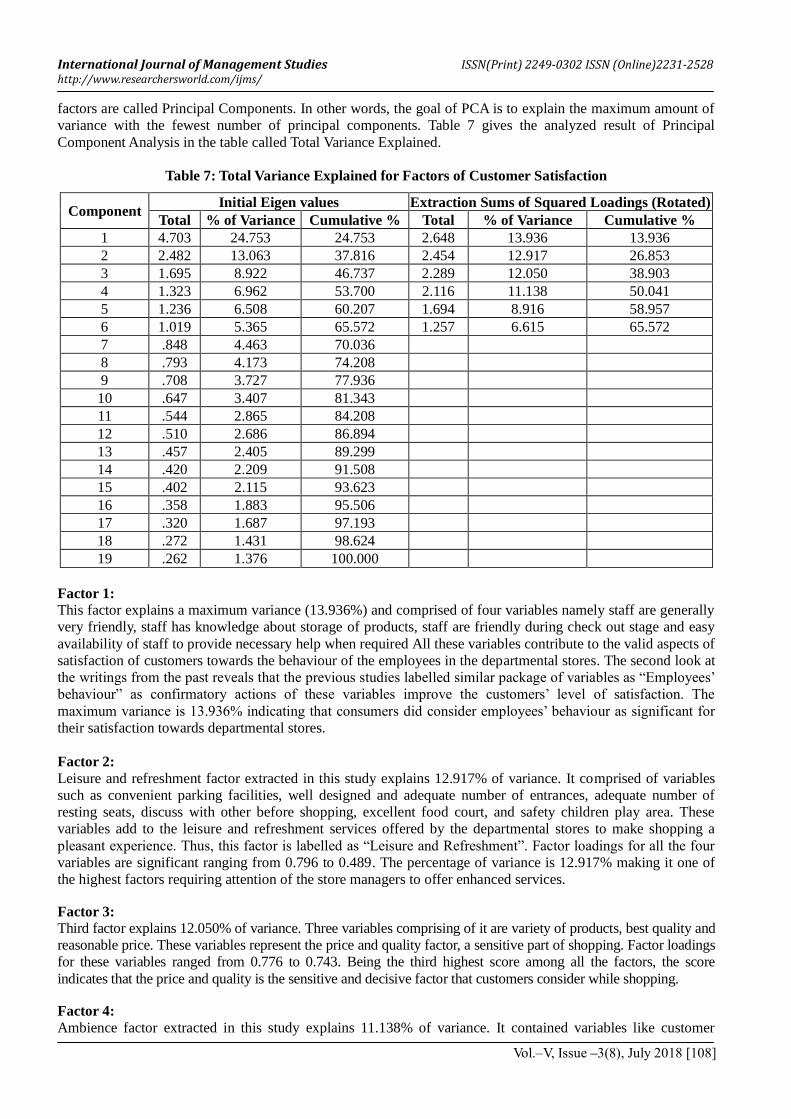
factors are called Principal Components. In other words, the goal of PCA is to explain the maximum amount of
variance with the fewest number of principal components. Table 7 gives the analyzed result of Principal
Component Analysis in the table called Total Variance Explained.
Table 7: Total Variance Explained for Factors of Customer Satisfaction
Component Initial Eigen values Extraction Sums of Squared Loadings (Rotated)
Total % of Variance Cumulative % Total % of Variance Cumulative %
1 4.703 24.753 24.753 2.648 13.936 13.936
2 2.482 13.063 37.816 2.454 12.917 26.853
3 1.695 8.922 46.737 2.289 12.050 38.903
4 1.323 6.962 53.700 2.116 11.138 50.041
5 1.236 6.508 60.207 1.694 8.916 58.957
6 1.019 5.365 65.572 1.257 6.615 65.572
7 .848 4.463 70.036
8 .793 4.173 74.208
9 .708 3.727 77.936
10 .647 3.407 81.343
11 .544 2.865 84.208
12 .510 2.686 86.894
13 .457 2.405 89.299
14 .420 2.209 91.508
15 .402 2.115 93.623
16 .358 1.883 95.506
17 .320 1.687 97.193
18 .272 1.431 98.624
19 .262 1.376 100.000
Factor 1:
This factor explains a maximum variance (13.936%) and comprised of four variables namely staff are generally
very friendly, staff has knowledge about storage of products, staff are friendly during check out stage and easy
availability of staff to provide necessary help when required All these variables contribute to the valid aspects of
satisfaction of customers towards the behaviour of the employees in the departmental stores. The second look at
the writings from the past reveals that the previous studies labelled similar package of variables as “Employees‟
behaviour” as confirmatory actions of these variables improve the customers‟ level of satisfaction. The
maximum variance is 13.936% indicating that consumers did consider employees‟ behaviour as significant for
their satisfaction towards departmental stores.
Factor 2:
Leisure and refreshment factor extracted in this study explains 12.917% of variance. It comprised of variables
such as convenient parking facilities, well designed and adequate number of entrances, adequate number of
resting seats, discuss with other before shopping, excellent food court, and safety children play area. These
variables add to the leisure and refreshment services offered by the departmental stores to make shopping a
pleasant experience. Thus, this factor is labelled as “Leisure and Refreshment”. Factor loadings for all the four
variables are significant ranging from 0.796 to 0.489. The percentage of variance is 12.917% making it one of
the highest factors requiring attention of the store managers to offer enhanced services.
Factor 3:
Third factor explains 12.050% of variance. Three variables comprising of it are variety of products, best quality and
reasonable price. These variables represent the price and quality factor, a sensitive part of shopping. Factor loadings
for these variables ranged from 0.776 to 0.743. Being the third highest score among all the factors, the score
indicates that the price and quality is the sensitive and decisive factor that customers consider while shopping.
Factor 4:
Ambience factor extracted in this study explains 11.138% of variance. It contained variables like customer
International Journal of Management Studies ISSN(Print) 2249-0302 ISSN (Online)2231-2528 http://www.researchersworld.com/ijms/
Vol.–V, Issue –3(8), July 2018 [109]
friendly layout, spaces are clean and fresh and modern appearance. These variables seemingly relate to layout
and appearance of the departmental stores which the consumers value as most important aspect. However, these
variables underline a common aspect, an attempt to attract consumers to the departmental stores using the
psychological aspect “look out of the stores”. Consumers are easily attracted towards the friendly atmosphere of
the store. So, it is apt to label these variables under “Ambience”. It indicates that customers are more drawn
towards modern look and appearance of the stores.
Factor 5:
Location factor explains 8.916% of variance associated with the location of the store. It consists of factors
namely located near other shopping area, convenient opening hours/working days and located at convenient
location. The variables point towards position of the departmental store in compared with other shopping zones
and hence, labeled “Location”. It turned out to be the fifth important factor contributing towards the satisfaction
level of customers shopping in the departmental stores.
Factor 6:
The last factor explains 6.615% of the variance associated with the availability of exclusive products in the
departmental stores. The percentage of variance indicates that consumers consider this factor as least significant
factor in shopping in the departmental stores. This may be due to the fact that the customers lack knowledge
about the availability of variety and designs of products in other stores and e-stores.
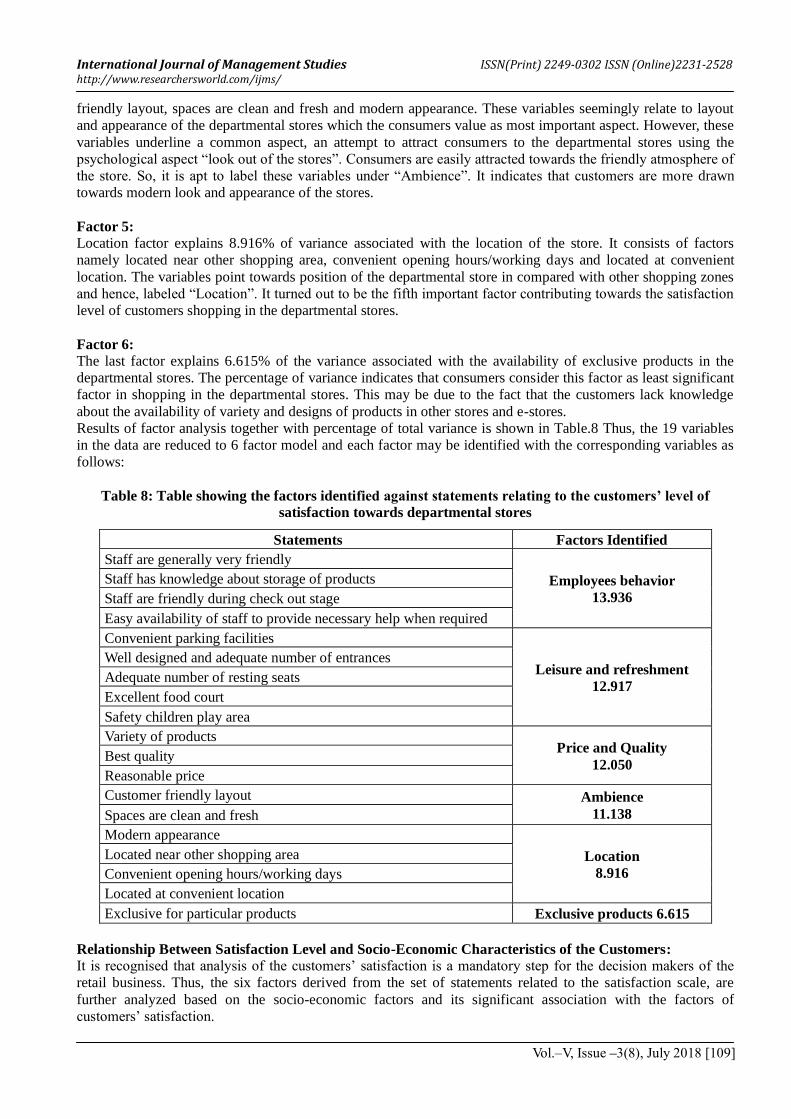
Results of factor analysis together with percentage of total variance is shown in Table.8 Thus, the 19 variables
in the data are reduced to 6 factor model and each factor may be identified with the corresponding variables as
follows:
Table 8: Table showing the factors identified against statements relating to the customers’ level of
satisfaction towards departmental stores
Statements Factors Identified
Staff are generally very friendly
Employees behavior
13.936
Staff has knowledge about storage of products
Staff are friendly during check out stage
Easy availability of staff to provide necessary help when required
Convenient parking facilities
Leisure and refreshment
12.917
Well designed and adequate number of entrances
Adequate number of resting seats
Excellent food court
Safety children play area
Variety of products Price and Quality
12.050 Best quality
Reasonable price
Customer friendly layout Ambience
11.138 Spaces are clean and fresh
Modern appearance
Location
8.916
Located near other shopping area
Convenient opening hours/working days
Located at convenient location
Exclusive for particular products Exclusive products 6.615
Relationship Between Satisfaction Level and Socio-Economic Characteristics of the Customers:
It is recognised that analysis of the customers‟ satisfaction is a mandatory step for the decision makers of the
retail business. Thus, the six factors derived from the set of statements related to the satisfaction scale, are
further analyzed based on the socio-economic factors and its significant association with the factors of
customers‟ satisfaction.
International Journal of Management Studies ISSN(Print) 2249-0302 ISSN (Online)2231-2528 http://www.researchersworld.com/ijms/
Vol.–V, Issue –3(8), July 2018 [110]
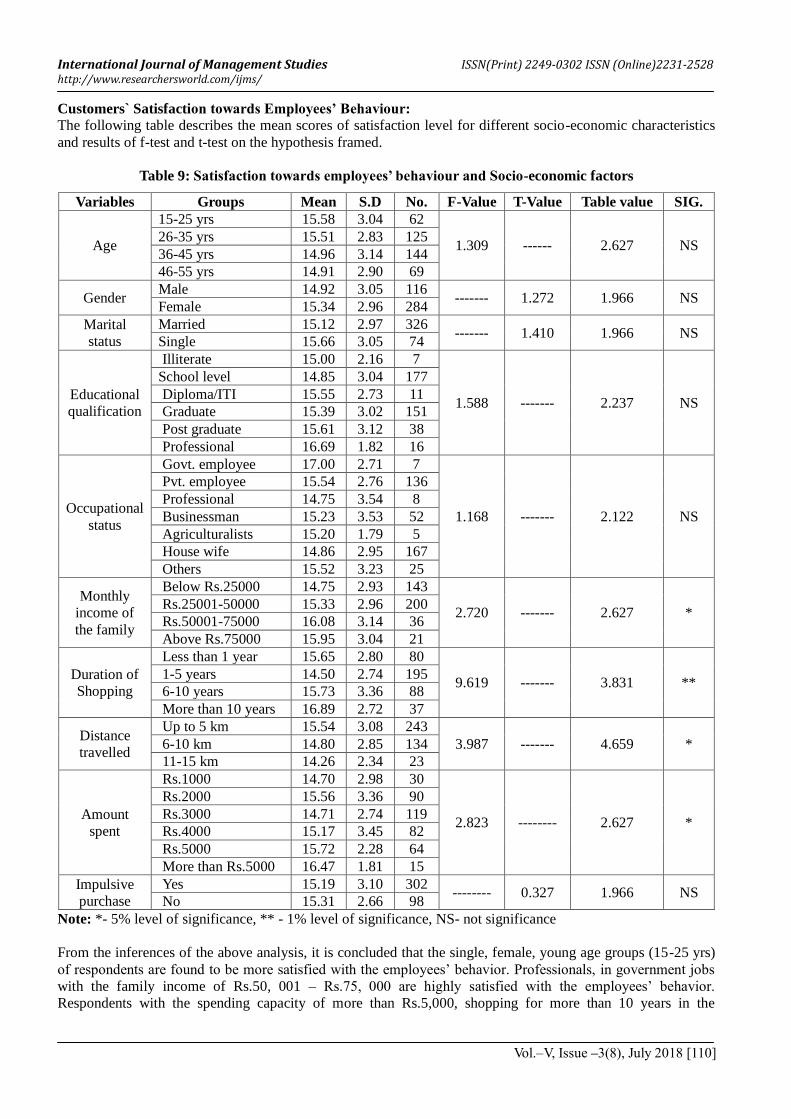
Customers` Satisfaction towards Employees’ Behaviour:
The following table describes the mean scores of satisfaction level for different socio-economic characteristics
and results of f-test and t-test on the hypothesis framed.
Table 9: Satisfaction towards employees’ behaviour and Socio-economic factors
Variables Groups Mean S.D No. F-Value T-Value Table value SIG.
Age
15-25 yrs 15.58 3.04 62
1.309 ------ 2.627 NS 26-35 yrs 15.51 2.83 125
36-45 yrs 14.96 3.14 144
46-55 yrs 14.91 2.90 69
Gender Male 14.92 3.05 116
------- 1.272 1.966 NS Female 15.34 2.96 284
Marital
status
Married 15.12 2.97 326 ------- 1.410 1.966 NS
Single 15.66 3.05 74
Educational
qualification
Illiterate 15.00 2.16 7
1.588 ------- 2.237 NS
School level 14.85 3.04 177
Diploma/ITI 15.55 2.73 11
Graduate 15.39 3.02 151
Post graduate 15.61 3.12 38
Professional 16.69 1.82 16
Occupational
status
Govt. employee 17.00 2.71 7
1.168 ------- 2.122 NS
Pvt. employee 15.54 2.76 136
Professional 14.75 3.54 8
Businessman 15.23 3.53 52
Agriculturalists 15.20 1.79 5
House wife 14.86 2.95 167
Others 15.52 3.23 25
Monthly
income of
the family
Below Rs.25000 14.75 2.93 143
2.720 ------- 2.627 * Rs.25001-50000 15.33 2.96 200
Rs.50001-75000 16.08 3.14 36
Above Rs.75000 15.95 3.04 21
Duration of
Shopping
Less than 1 year 15.65 2.80 80
9.619 ------- 3.831 ** 1-5 years 14.50 2.74 195
6-10 years 15.73 3.36 88
More than 10 years 16.89 2.72 37
Distance
travelled
Up to 5 km 15.54 3.08 243
3.987 ------- 4.659 * 6-10 km 14.80 2.85 134
11-15 km 14.26 2.34 23
Amount
spent
Rs.1000 14.70 2.98 30
2.823 -------- 2.627 *
Rs.2000 15.56 3.36 90
Rs.3000 14.71 2.74 119
Rs.4000 15.17 3.45 82
Rs.5000 15.72 2.28 64
More than Rs.5000 16.47 1.81 15
Impulsive
purchase
Yes 15.19 3.10 302 -------- 0.327 1.966 NS
No 15.31 2.66 98
Note: *- 5% level of significance, ** - 1% level of significance, NS- not significance
From the inferences of the above analysis, it is concluded that the single, female, young age groups (15-25 yrs)
of respondents are found to be more satisfied with the employees‟ behavior. Professionals, in government jobs
with the family income of Rs.50, 001 – Rs.75, 000 are highly satisfied with the employees‟ behavior.
Respondents with the spending capacity of more than Rs.5,000, shopping for more than 10 years in the
International Journal of Management Studies ISSN(Print) 2249-0302 ISSN (Online)2231-2528 http://www.researchersworld.com/ijms/
Vol.–V, Issue –3(8), July 2018 [111]
departmental stores travelling within 5 km and who do not favour impulsive purchases are highly satisfied and
fulfilled with employees‟ behavior.
In order to find whether the satisfaction scores with respect to employees‟ behaviour differs significantly among
the groups of selected socio-economic variables, the following hypothesis is framed and tested.
Null Hypothesis (H0):
There is no significant difference in the employees‟ behaviour satisfaction scores among groups of age, gender,
marital status, educational qualification, occupational status, monthly income of the family, duration of
shopping, distance travelled, amount spent and impulsive purchases.
The calculated f-value and t-value comparing the mean scores of monthly income of the family, duration of
shopping, distance travelled and amount spent and satisfaction towards employees‟ behaviour are significantly
higher than the respective table values at either 5% or 1% level. Thus, there exists significant difference
between these socio-economic factors and the satisfaction towards employees‟ behaviour and hence, hypothesis
is rejected in case of these factors and satisfaction towards employees‟ behaviour.
For age, gender, marital status, educational qualification, occupational status and impulsive purchase no
significant differences are found with the satisfaction towards employees‟ behaviour as the calculated test
values are less than the table values. Hence, the hypothesis is accepted with respect to these factors and
satisfaction towards employees‟ behaviour.
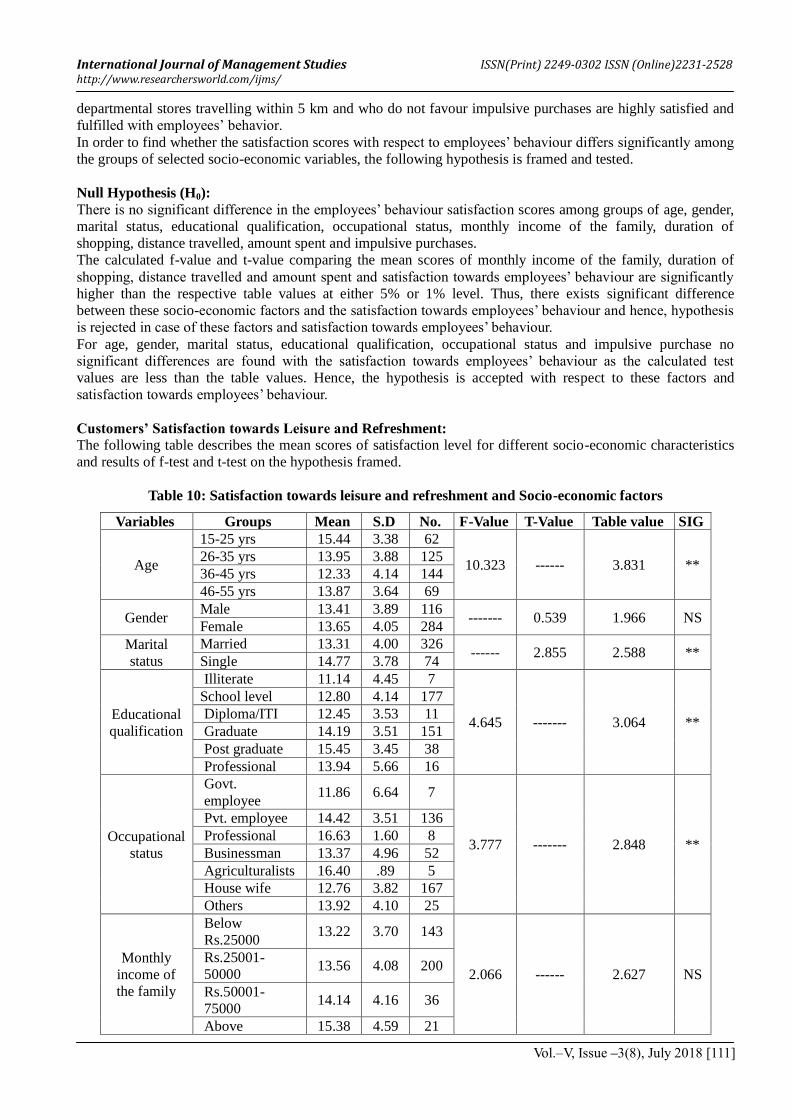
Customers’ Satisfaction towards Leisure and Refreshment:
The following table describes the mean scores of satisfaction level for different socio-economic characteristics
and results of f-test and t-test on the hypothesis framed.
Table 10: Satisfaction towards leisure and refreshment and Socio-economic factors
Variables Groups Mean S.D No. F-Value T-Value Table value SIG
Age
15-25 yrs 15.44 3.38 62
10.323 ------ 3.831 ** 26-35 yrs 13.95 3.88 125
36-45 yrs 12.33 4.14 144
46-55 yrs 13.87 3.64 69
Gender Male 13.41 3.89 116
------- 0.539 1.966 NS Female 13.65 4.05 284
Marital
status
Married 13.31 4.00 326 ------ 2.855 2.588 **
Single 14.77 3.78 74
Educational
qualification
Illiterate 11.14 4.45 7
4.645 ------- 3.064 **
School level 12.80 4.14 177
Diploma/ITI 12.45 3.53 11
Graduate 14.19 3.51 151
Post graduate 15.45 3.45 38
Professional 13.94 5.66 16
Occupational
status
Govt.
employee 11.86 6.64 7
3.777 ------- 2.848 **
Pvt. employee 14.42 3.51 136
Professional 16.63 1.60 8
Businessman 13.37 4.96 52
Agriculturalists 16.40 .89 5
House wife 12.76 3.82 167
Others 13.92 4.10 25
Monthly
income of
the family
Below
Rs.25000 13.22 3.70 143
2.066 ------ 2.627 NS
Rs.25001-
50000 13.56 4.08 200
Rs.50001-
75000 14.14 4.16 36
Above 15.38 4.59 21
International Journal of Management Studies ISSN(Print) 2249-0302 ISSN (Online)2231-2528 http://www.researchersworld.com/ijms/
Vol.–V, Issue –3(8), July 2018 [112]
Variables Groups Mean S.D No. F-Value T-Value Table value SIG
Rs.75000
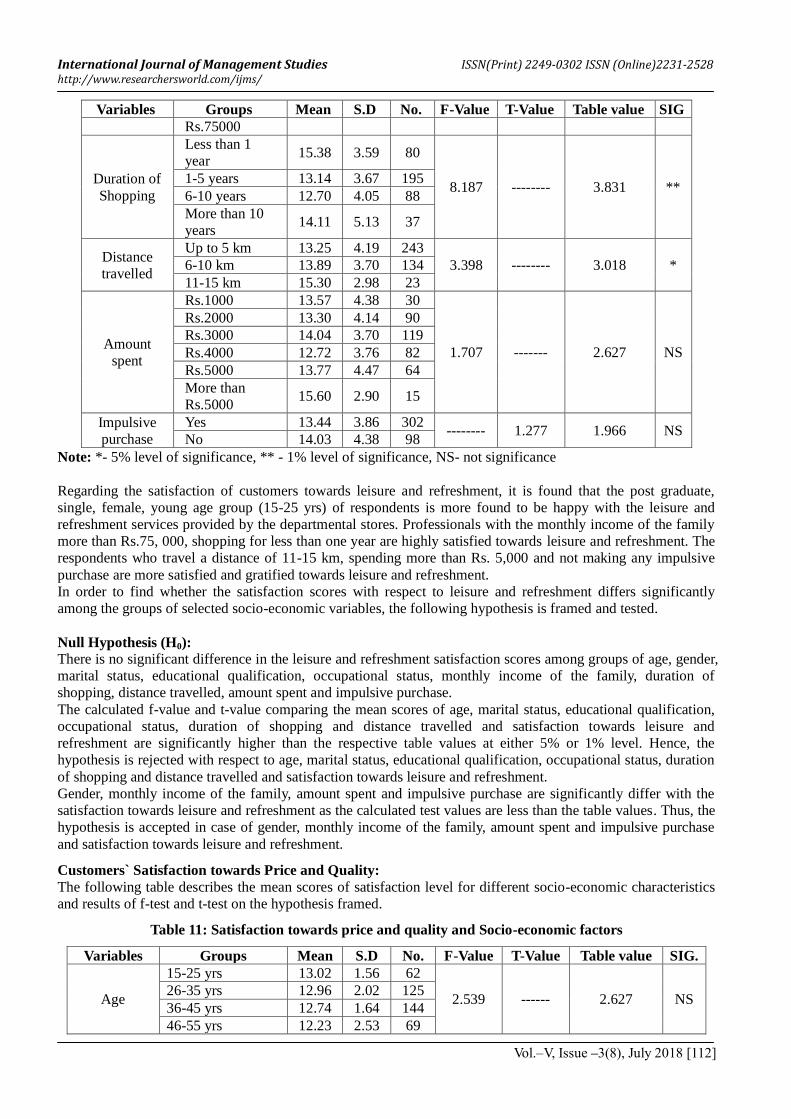
Duration of
Shopping
Less than 1
year 15.38 3.59 80
8.187 -------- 3.831 ** 1-5 years 13.14 3.67 195
6-10 years 12.70 4.05 88
More than 10
years 14.11 5.13 37
Distance
travelled
Up to 5 km 13.25 4.19 243
3.398 -------- 3.018 * 6-10 km 13.89 3.70 134
11-15 km 15.30 2.98 23
Amount
spent
Rs.1000 13.57 4.38 30
1.707 ------- 2.627 NS
Rs.2000 13.30 4.14 90
Rs.3000 14.04 3.70 119
Rs.4000 12.72 3.76 82
Rs.5000 13.77 4.47 64
More than
Rs.5000 15.60 2.90 15
Impulsive
purchase
Yes 13.44 3.86 302 -------- 1.277 1.966 NS
No 14.03 4.38 98
Note: *- 5% level of significance, ** - 1% level of significance, NS- not significance
Regarding the satisfaction of customers towards leisure and refreshment, it is found that the post graduate,
single, female, young age group (15-25 yrs) of respondents is more found to be happy with the leisure and
refreshment services provided by the departmental stores. Professionals with the monthly income of the family
more than Rs.75, 000, shopping for less than one year are highly satisfied towards leisure and refreshment. The
respondents who travel a distance of 11-15 km, spending more than Rs. 5,000 and not making any impulsive
purchase are more satisfied and gratified towards leisure and refreshment.
In order to find whether the satisfaction scores with respect to leisure and refreshment differs significantly
among the groups of selected socio-economic variables, the following hypothesis is framed and tested.
Null Hypothesis (H0):
There is no significant difference in the leisure and refreshment satisfaction scores among groups of age, gender,
marital status, educational qualification, occupational status, monthly income of the family, duration of
shopping, distance travelled, amount spent and impulsive purchase.
The calculated f-value and t-value comparing the mean scores of age, marital status, educational qualification,
occupational status, duration of shopping and distance travelled and satisfaction towards leisure and
refreshment are significantly higher than the respective table values at either 5% or 1% level. Hence, the
hypothesis is rejected with respect to age, marital status, educational qualification, occupational status, duration
of shopping and distance travelled and satisfaction towards leisure and refreshment.
Gender, monthly income of the family, amount spent and impulsive purchase are significantly differ with the
satisfaction towards leisure and refreshment as the calculated test values are less than the table values. Thus, the
hypothesis is accepted in case of gender, monthly income of the family, amount spent and impulsive purchase
and satisfaction towards leisure and refreshment.
Customers` Satisfaction towards Price and Quality:
The following table describes the mean scores of satisfaction level for different socio-economic characteristics
and results of f-test and t-test on the hypothesis framed.
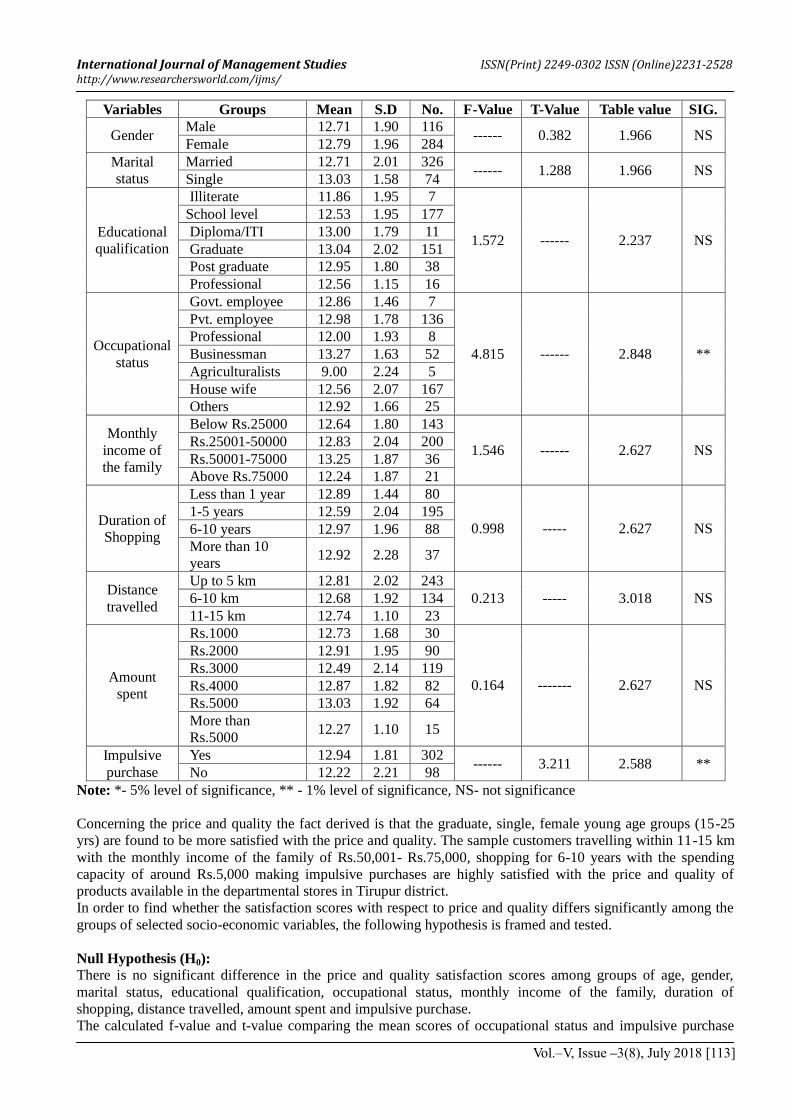
Table 11: Satisfaction towards price and quality and Socio-economic factors
Variables Groups Mean S.D No. F-Value T-Value Table value SIG.
Age
15-25 yrs 13.02 1.56 62
2.539 ------ 2.627 NS 26-35 yrs 12.96 2.02 125
36-45 yrs 12.74 1.64 144
46-55 yrs 12.23 2.53 69
International Journal of Management Studies ISSN(Print) 2249-0302 ISSN (Online)2231-2528 http://www.researchersworld.com/ijms/
Vol.–V, Issue –3(8), July 2018 [113]
Variables Groups Mean S.D No. F-Value T-Value Table value SIG.
Gender Male 12.71 1.90 116
------ 0.382 1.966 NS Female 12.79 1.96 284
Marital
status
Married 12.71 2.01 326 ------ 1.288 1.966 NS
Single 13.03 1.58 74
Educational
qualification
Illiterate 11.86 1.95 7
1.572 ------ 2.237 NS
School level 12.53 1.95 177
Diploma/ITI 13.00 1.79 11
Graduate 13.04 2.02 151
Post graduate 12.95 1.80 38
Professional 12.56 1.15 16
Occupational
status
Govt. employee 12.86 1.46 7
4.815 ------ 2.848 **
Pvt. employee 12.98 1.78 136
Professional 12.00 1.93 8
Businessman 13.27 1.63 52
Agriculturalists 9.00 2.24 5
House wife 12.56 2.07 167
Others 12.92 1.66 25
Monthly
income of
the family
Below Rs.25000 12.64 1.80 143
1.546 ------ 2.627 NS Rs.25001-50000 12.83 2.04 200
Rs.50001-75000 13.25 1.87 36
Above Rs.75000 12.24 1.87 21
Duration of
Shopping
Less than 1 year 12.89 1.44 80
0.998 ----- 2.627 NS
1-5 years 12.59 2.04 195
6-10 years 12.97 1.96 88
More than 10
years 12.92 2.28 37
Distance
travelled
Up to 5 km 12.81 2.02 243
0.213 ----- 3.018 NS 6-10 km 12.68 1.92 134
11-15 km 12.74 1.10 23
Amount
spent
Rs.1000 12.73 1.68 30
0.164 ------- 2.627 NS
Rs.2000 12.91 1.95 90
Rs.3000 12.49 2.14 119
Rs.4000 12.87 1.82 82
Rs.5000 13.03 1.92 64
More than
Rs.5000 12.27 1.10 15
Impulsive
purchase
Yes 12.94 1.81 302 ------ 3.211 2.588 **
No 12.22 2.21 98
Note: *- 5% level of significance, ** - 1% level of significance, NS- not significance
Concerning the price and quality the fact derived is that the graduate, single, female young age groups (15-25
yrs) are found to be more satisfied with the price and quality. The sample customers travelling within 11-15 km
with the monthly income of the family of Rs.50,001- Rs.75,000, shopping for 6-10 years with the spending
capacity of around Rs.5,000 making impulsive purchases are highly satisfied with the price and quality of
products available in the departmental stores in Tirupur district.
In order to find whether the satisfaction scores with respect to price and quality differs significantly among the
groups of selected socio-economic variables, the following hypothesis is framed and tested.
Null Hypothesis (H0):
There is no significant difference in the price and quality satisfaction scores among groups of age, gender,
marital status, educational qualification, occupational status, monthly income of the family, duration of
shopping, distance travelled, amount spent and impulsive purchase.
The calculated f-value and t-value comparing the mean scores of occupational status and impulsive purchase
International Journal of Management Studies ISSN(Print) 2249-0302 ISSN (Online)2231-2528 http://www.researchersworld.com/ijms/
Vol.–V, Issue –3(8), July 2018 [114]
and satisfaction towards price and quality are significantly higher than the respective table values at either 5%
or 1% level. Thus, there exists significant difference between occupational status and impulsive purchase and
satisfaction towards price and quality and hence, hypothesis is rejected.
For age, gender, marital status, educational qualification, monthly income of the family, duration of shopping,
distance travelled and amount spent no significant differences are found with satisfaction towards price and
quality as the calculated test values are less than the table values. Hence, the hypothesis is accepted in these
cases of socio-economic factors and satisfaction towards price and quality.
Customers` Satisfaction towards Ambience:
The following table describes the mean scores of satisfaction level for different socio-economic characteristics
and results of f-test and t-test on the hypothesis framed.
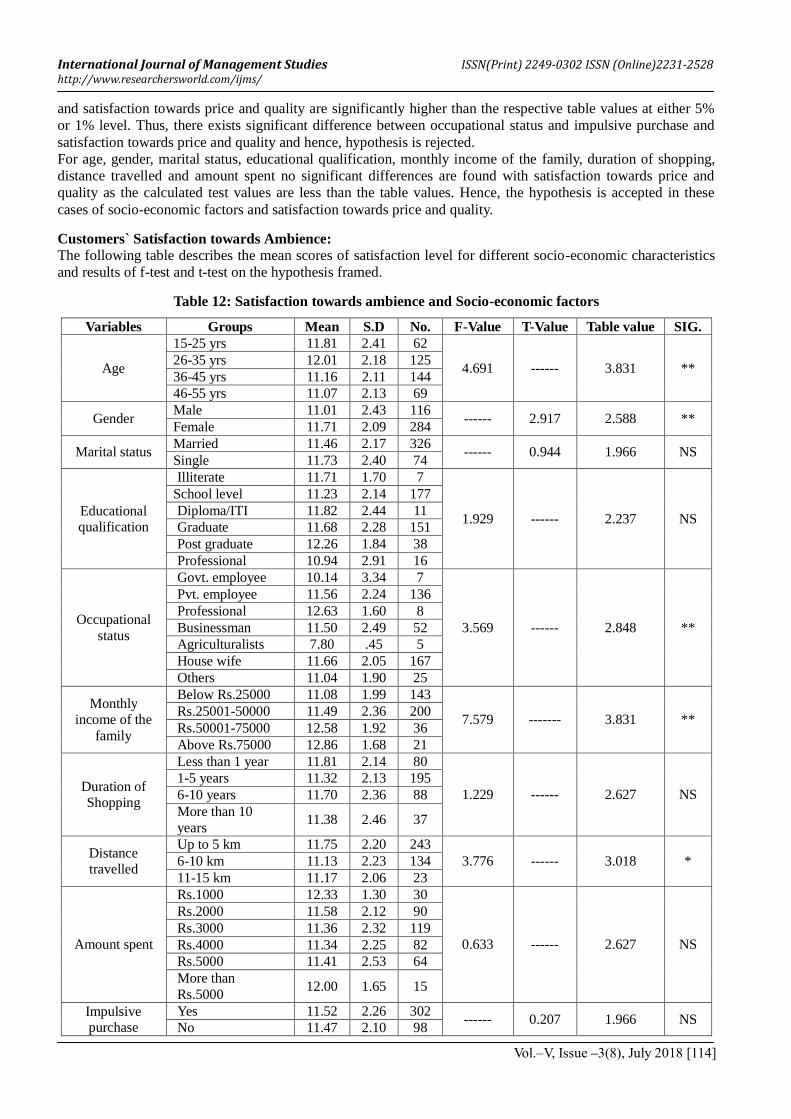
Table 12: Satisfaction towards ambience and Socio-economic factors
Variables Groups Mean S.D No. F-Value T-Value Table value SIG.
Age
15-25 yrs 11.81 2.41 62
4.691 ------ 3.831 ** 26-35 yrs 12.01 2.18 125
36-45 yrs 11.16 2.11 144
46-55 yrs 11.07 2.13 69
Gender Male 11.01 2.43 116
------ 2.917 2.588 ** Female 11.71 2.09 284
Marital status Married 11.46 2.17 326
------ 0.944 1.966 NS Single 11.73 2.40 74
Educational qualification
Illiterate 11.71 1.70 7
1.929 ------ 2.237 NS
School level 11.23 2.14 177
Diploma/ITI 11.82 2.44 11
Graduate 11.68 2.28 151
Post graduate 12.26 1.84 38
Professional 10.94 2.91 16
Occupational
status
Govt. employee 10.14 3.34 7
3.569 ------ 2.848 **
Pvt. employee 11.56 2.24 136
Professional 12.63 1.60 8
Businessman 11.50 2.49 52
Agriculturalists 7.80 .45 5
House wife 11.66 2.05 167
Others 11.04 1.90 25
Monthly income of the
family
Below Rs.25000 11.08 1.99 143
7.579 ------- 3.831 ** Rs.25001-50000 11.49 2.36 200
Rs.50001-75000 12.58 1.92 36
Above Rs.75000 12.86 1.68 21
Duration of Shopping
Less than 1 year 11.81 2.14 80
1.229 ------ 2.627 NS
1-5 years 11.32 2.13 195
6-10 years 11.70 2.36 88
More than 10
years 11.38 2.46 37
Distance travelled
Up to 5 km 11.75 2.20 243
3.776 ------ 3.018 * 6-10 km 11.13 2.23 134
11-15 km 11.17 2.06 23
Amount spent
Rs.1000 12.33 1.30 30
0.633 ------ 2.627 NS
Rs.2000 11.58 2.12 90
Rs.3000 11.36 2.32 119
Rs.4000 11.34 2.25 82
Rs.5000 11.41 2.53 64
More than
Rs.5000 12.00 1.65 15
Impulsive purchase
Yes 11.52 2.26 302 ------ 0.207 1.966 NS
No 11.47 2.10 98
International Journal of Management Studies ISSN(Print) 2249-0302 ISSN (Online)2231-2528 http://www.researchersworld.com/ijms/
Vol.–V, Issue –3(8), July 2018 [115]
Note: *- 5% level of significance, ** - 1% level of significance, NS- not significance
The analysis of ambience of the store with the socio-economic factors reveal that the single, female
professionals with post graduation under the age group of 26-35 years are found to be more satisfied towards
ambience of the stores they are purchasing. The respondents with the family income of above Rs.75, 000,
shopping for less than 1 year, travelling within 5 km, spending around Rs.1000 and making impulsive purchase
are found to be highly satisfied with the ambience of the stores.
In order to find whether the satisfaction scores with respect to ambience differs significantly among the groups
of selected socio-economic variables, the following hypothesis is framed and tested.
Null Hypothesis (H0):
There is no significant difference in the satisfaction scores towards ambience among groups of age, gender,
marital status, educational qualification, occupational status, monthly income of the family, duration of
shopping, distance travelled, amount spent and impulsive purchase.
The calculated f-value and t-value comparing the mean scores of age, gender, occupational status, monthly
income of the family and distance travelled and satisfaction towards ambience are significantly higher than the
respective table values at either 5% or 1% level. Hence, the hypothesis is rejected with respect these factors and
satisfaction towards ambience.
For marital status, educational qualification, duration of shopping, amount spent and impulsive purchase no
significant differences are found with satisfaction towards ambience as the calculated test values are less than
the table values. Hence, the hypothesis is accepted in case of these factors and satisfaction towards ambience.
Customers` Satisfaction towards Location:
The following table describes the mean scores of satisfaction level for different socio-economic characteristics
and results of f-test and t-test on the hypothesis framed.
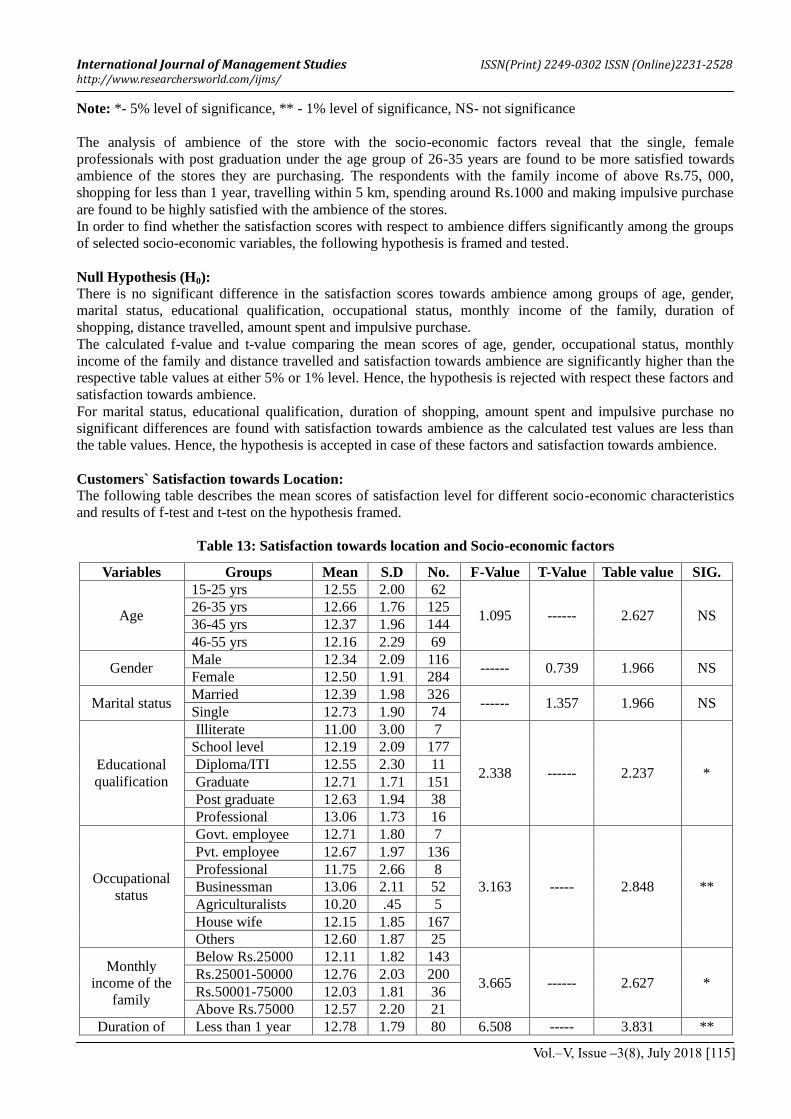
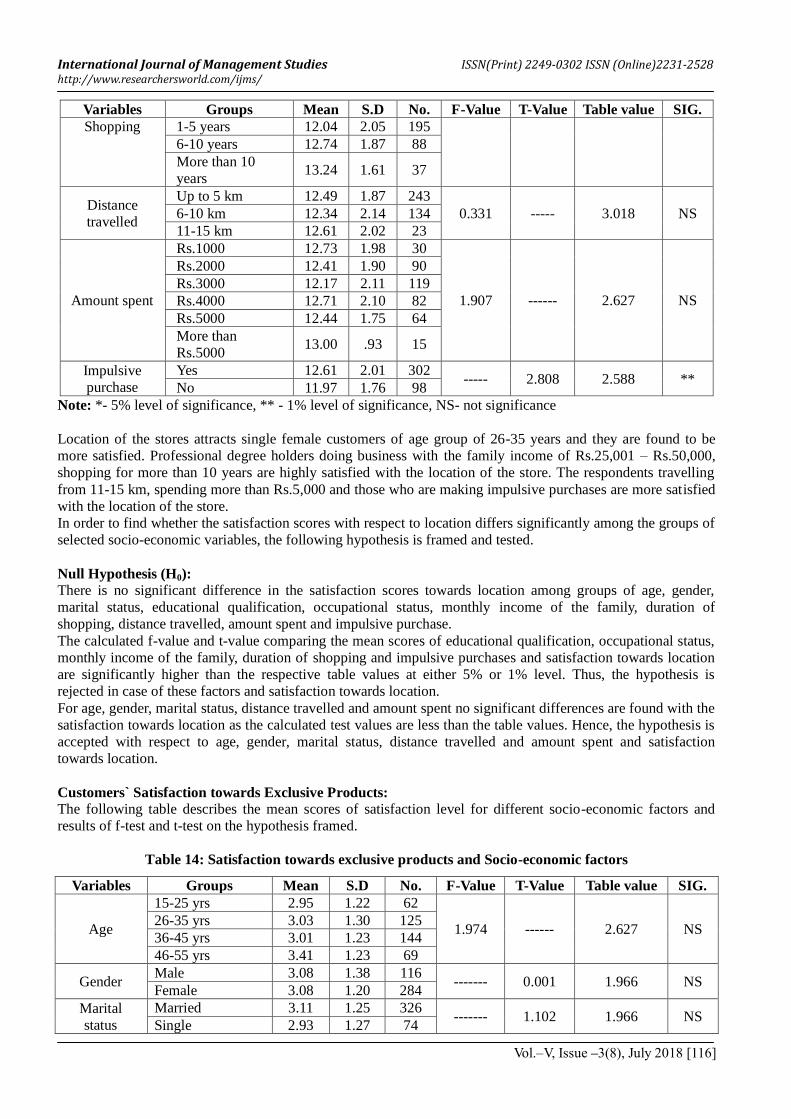
Table 13: Satisfaction towards location and Socio-economic factors
Variables Groups Mean S.D No. F-Value T-Value Table value SIG.
Age
15-25 yrs 12.55 2.00 62
1.095 ------ 2.627 NS 26-35 yrs 12.66 1.76 125
36-45 yrs 12.37 1.96 144
46-55 yrs 12.16 2.29 69
Gender Male 12.34 2.09 116
------ 0.739 1.966 NS Female 12.50 1.91 284
Marital status Married 12.39 1.98 326
------ 1.357 1.966 NS Single 12.73 1.90 74
Educational
qualification
Illiterate 11.00 3.00 7
2.338 ------ 2.237 *
School level 12.19 2.09 177
Diploma/ITI 12.55 2.30 11
Graduate 12.71 1.71 151
Post graduate 12.63 1.94 38
Professional 13.06 1.73 16
Occupational
status
Govt. employee 12.71 1.80 7
3.163 ----- 2.848 **
Pvt. employee 12.67 1.97 136
Professional 11.75 2.66 8
Businessman 13.06 2.11 52
Agriculturalists 10.20 .45 5
House wife 12.15 1.85 167
Others 12.60 1.87 25
Monthly
income of the
family
Below Rs.25000 12.11 1.82 143
3.665 ------ 2.627 * Rs.25001-50000 12.76 2.03 200
Rs.50001-75000 12.03 1.81 36
Above Rs.75000 12.57 2.20 21
Duration of Less than 1 year 12.78 1.79 80 6.508 ----- 3.831 **
International Journal of Management Studies ISSN(Print) 2249-0302 ISSN (Online)2231-2528 http://www.researchersworld.com/ijms/
Vol.–V, Issue –3(8), July 2018 [116]
Variables Groups Mean S.D No. F-Value T-Value Table value SIG.
Shopping 1-5 years 12.04 2.05 195
6-10 years 12.74 1.87 88
More than 10
years 13.24 1.61 37
Distance
travelled
Up to 5 km 12.49 1.87 243
0.331 ----- 3.018 NS 6-10 km 12.34 2.14 134
11-15 km 12.61 2.02 23
Amount spent
Rs.1000 12.73 1.98 30
1.907 ------ 2.627 NS
Rs.2000 12.41 1.90 90
Rs.3000 12.17 2.11 119
Rs.4000 12.71 2.10 82
Rs.5000 12.44 1.75 64
More than
Rs.5000 13.00 .93 15
Impulsive
purchase
Yes 12.61 2.01 302 ----- 2.808 2.588 **
No 11.97 1.76 98
Note: *- 5% level of significance, ** - 1% level of significance, NS- not significance
Location of the stores attracts single female customers of age group of 26-35 years and they are found to be
more satisfied. Professional degree holders doing business with the family income of Rs.25,001 – Rs.50,000,
shopping for more than 10 years are highly satisfied with the location of the store. The respondents travelling
from 11-15 km, spending more than Rs.5,000 and those who are making impulsive purchases are more satisfied
with the location of the store.
In order to find whether the satisfaction scores with respect to location differs significantly among the groups of
selected socio-economic variables, the following hypothesis is framed and tested.
Null Hypothesis (H0):
There is no significant difference in the satisfaction scores towards location among groups of age, gender,
marital status, educational qualification, occupational status, monthly income of the family, duration of
shopping, distance travelled, amount spent and impulsive purchase.
The calculated f-value and t-value comparing the mean scores of educational qualification, occupational status,
monthly income of the family, duration of shopping and impulsive purchases and satisfaction towards location
are significantly higher than the respective table values at either 5% or 1% level. Thus, the hypothesis is
rejected in case of these factors and satisfaction towards location.
For age, gender, marital status, distance travelled and amount spent no significant differences are found with the
satisfaction towards location as the calculated test values are less than the table values. Hence, the hypothesis is
accepted with respect to age, gender, marital status, distance travelled and amount spent and satisfaction
towards location.
Customers` Satisfaction towards Exclusive Products:
The following table describes the mean scores of satisfaction level for different socio-economic factors and
results of f-test and t-test on the hypothesis framed.
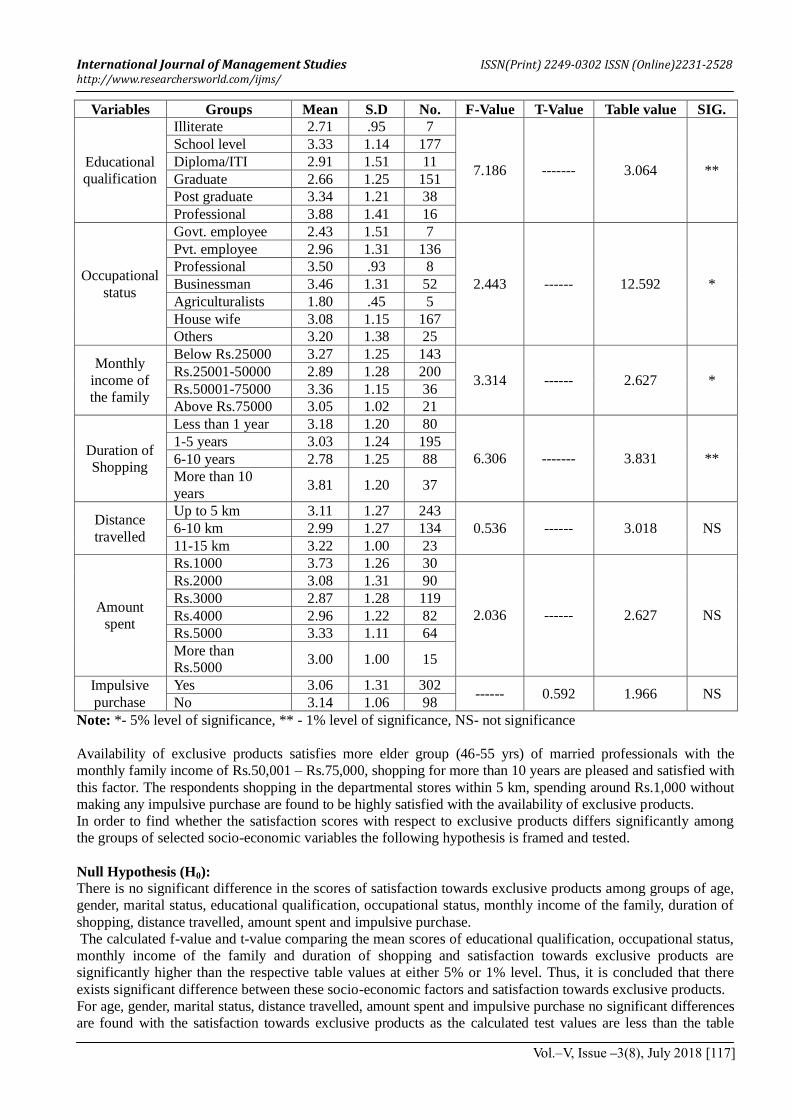
Table 14: Satisfaction towards exclusive products and Socio-economic factors
Variables Groups Mean S.D No. F-Value T-Value Table value SIG.
Age
15-25 yrs 2.95 1.22 62
1.974 ------ 2.627 NS 26-35 yrs 3.03 1.30 125
36-45 yrs 3.01 1.23 144
46-55 yrs 3.41 1.23 69
Gender Male 3.08 1.38 116
------- 0.001 1.966 NS Female 3.08 1.20 284
Marital
status
Married 3.11 1.25 326 ------- 1.102 1.966 NS
Single 2.93 1.27 74
International Journal of Management Studies ISSN(Print) 2249-0302 ISSN (Online)2231-2528 http://www.researchersworld.com/ijms/
Vol.–V, Issue –3(8), July 2018 [117]
Variables Groups Mean S.D No. F-Value T-Value Table value SIG.
Educational
qualification
Illiterate 2.71 .95 7
7.186 ------- 3.064 **
School level 3.33 1.14 177
Diploma/ITI 2.91 1.51 11
Graduate 2.66 1.25 151
Post graduate 3.34 1.21 38
Professional 3.88 1.41 16
Occupational
status
Govt. employee 2.43 1.51 7
2.443 ------ 12.592 *
Pvt. employee 2.96 1.31 136
Professional 3.50 .93 8
Businessman 3.46 1.31 52
Agriculturalists 1.80 .45 5
House wife 3.08 1.15 167
Others 3.20 1.38 25
Monthly
income of
the family
Below Rs.25000 3.27 1.25 143
3.314 ------ 2.627 * Rs.25001-50000 2.89 1.28 200
Rs.50001-75000 3.36 1.15 36
Above Rs.75000 3.05 1.02 21
Duration of
Shopping
Less than 1 year 3.18 1.20 80
6.306 ------- 3.831 **
1-5 years 3.03 1.24 195
6-10 years 2.78 1.25 88
More than 10
years 3.81 1.20 37
Distance
travelled
Up to 5 km 3.11 1.27 243
0.536 ------ 3.018 NS 6-10 km 2.99 1.27 134
11-15 km 3.22 1.00 23
Amount
spent
Rs.1000 3.73 1.26 30
2.036 ------ 2.627 NS
Rs.2000 3.08 1.31 90
Rs.3000 2.87 1.28 119
Rs.4000 2.96 1.22 82
Rs.5000 3.33 1.11 64
More than
Rs.5000 3.00 1.00 15
Impulsive
purchase
Yes 3.06 1.31 302 ------ 0.592 1.966 NS
No 3.14 1.06 98
Note: *- 5% level of significance, ** - 1% level of significance, NS- not significance
Availability of exclusive products satisfies more elder group (46-55 yrs) of married professionals with the
monthly family income of Rs.50,001 – Rs.75,000, shopping for more than 10 years are pleased and satisfied with
this factor. The respondents shopping in the departmental stores within 5 km, spending around Rs.1,000 without
making any impulsive purchase are found to be highly satisfied with the availability of exclusive products.
In order to find whether the satisfaction scores with respect to exclusive products differs significantly among
the groups of selected socio-economic variables the following hypothesis is framed and tested.
Null Hypothesis (H0):
There is no significant difference in the scores of satisfaction towards exclusive products among groups of age,
gender, marital status, educational qualification, occupational status, monthly income of the family, duration of
shopping, distance travelled, amount spent and impulsive purchase.
The calculated f-value and t-value comparing the mean scores of educational qualification, occupational status,
monthly income of the family and duration of shopping and satisfaction towards exclusive products are
significantly higher than the respective table values at either 5% or 1% level. Thus, it is concluded that there
exists significant difference between these socio-economic factors and satisfaction towards exclusive products.
For age, gender, marital status, distance travelled, amount spent and impulsive purchase no significant differences
are found with the satisfaction towards exclusive products as the calculated test values are less than the table
International Journal of Management Studies ISSN(Print) 2249-0302 ISSN (Online)2231-2528 http://www.researchersworld.com/ijms/
Vol.–V, Issue –3(8), July 2018 [118]
values. Hence, the hypothesis is accepted with respect these factors and satisfaction towards exclusive products.
CONCLUSION:
Customer satisfaction is the key area to be focused by the retail sector, particularly the departmental stores. As
these stores are facing cut throat competition from multiple angles the study on customer satisfaction is the need
of the hour.
The study reveals that, if not all the factors, at least the factors derived out of factors analysis are to be enhanced
immediately to satisfy the customers shopping in the stores .From the inferences, of the results of analysis, it is
concluded that satisfaction level of the customers towards the six factors extracted through factor analysis is
significantly influenced by the socio-economic factors.
REFERENCES:
Lakshmi Narayanan.K, Ajata Shathru Samal and P.Nagaraja Rao (2013). A Study on Consumer Buying
Behaviour towards Organised and Unorganised Retail Stores in Bangalore City, International Journal
of Management Research and Business Strategy, Vol 2, Issue 3, pp 161-169.
R.Gomathi, S.Kishore, R. Deepika (2013). A Study on Customer Satisfaction towards Department stores in
Erode City, International Journal of Engineering and Management Research, Vole 3, Issue 5 pp 38-41.
Saini Neelam (2012). A Study of Organised retail outlets in Haryana- determinants of retail customer
satisfaction, International Journal of Marketing and Management Research, Vol 2, Issue 7 pp 66-68
Sameera.P (2015). A Study on the Customer Satisfaction in the Organised retail Outlets, International Journal
of Economic and Business Review, Vol 3, Issue 1 pp 238-243.
Satnam Kour Ubeja and D.D. Bedia (2011). A Study of Customer Satisfaction from Organized Retailing (With
Reference To Indore City), Prestige International Journal of Management and Research, Vol 4, Issue 2,
pp 38-45
Shaheema Hameed (2015). A Study on Consumer Satisfaction in Organised Retail with respect to Apparels,
Research Paper, Vol 4, Issue 10 pp 24-32.
Sushmana (2014). Consumer Perception towards Organised and Unorganised Retailing, International Journal
of Advance Research in Education, Technology and Management, Vol 1, Issue 3, pp 84-89.
U. Dinesh kumar and P.Vikkraman (2012). Customers‟ Satisfaction towards Organised Retail Outlets in Erode
City” IOSR Journal of Business and Management, Vol 3, Issue 4, pp 34-40.
----