Embed Size (px)
Citation preview
152 | P a g e
A STUDY ON CUSTOMER PREFERENCE AND
SATISFACTION TOWARDS CELL PHONES
SERVICE PROVIDERS IN TAMIL NADU
Mrs. A. Rosithabanu1, Dr. R. Bharathi
2, Ms. V. Rajalakshmi
3
1M .Com., M. Phil.,
2M.Com. , M.Phil., Ph.D.
3M.Com., B.Ed., M.Phil.,, Professor of Commerce
Vel Tech Ranga Sanku Arts College, Avadi – Chennai (India)
I. PREAMBLE
In India, the telephony services were introduced in the year 1881 and the first telephone exchange was opened in
Kolkata, Chennai and Mumbai. Further, in 1947, all foreign telecommunication companies got nationalized. The
Department of Telecommunications (DoT) separated from the postal system was established in 1975. The
Government of India felt the need of a framework to regulate growing telecom sector and the National Telecom
Policy was announced in 1994 to create a modern and efficient telecommunication infrastructure taking into
account the convergence of information technology, media, telecom and consumer electronics and enabling the
Indian telecom companies to become truly global players. In 1995, the cellular mobile services were launched in
India on commercial basis. Initially the government of India offered two types of licenses viz. CMTS (Cellular
Mobile Technology Services) and UAS (Universal Access Service Provider). CMTS was introduced first, as
primarily a GSM (Global System for Mobile Communications) based service. Later on in 2002-03, CDMA
(Code Division Multiple Access) technology under UAS license enables the mobile service providers to offer a
new standard for multiple mobile services to their customers. In order to regulate cellular services in the
country, the Telecom Regulatory Authority of India (TRAI) was established in 1997. With the constant efforts
of TRAI, the New Telecom Policy (1999) was drafted in the year 1999.
II. OBJECTIVES OF THE STUDY
Primary objective of the study is to analyse consumer preference and measure the customer satisfaction on cell
phones in Tiruchirappalli city. In order to attain the objective, the following secondary objectives are framed:
1. To study the preference of the customers over the different service providers of cell phones in Tiruchirappalli
city.
2. To measure the awareness of the customers towards various service providers in Tiruchirappalli city.
3. To measure the satisfaction level of the customers towards various service providers in Tiruchirappalli city.
4. To examine the attitude of the customers on the possession of their cell phone connections.
153 | P a g e
III. IMPORTANCE OF STUDY
This is the era of mobile phones. The cell phones have opened a new way to human life. They have created an
attractive business opportunity in all fields. The mobile phones have created a sort of demand among the lower
level entrepreneurial groups, such as plumbers, carpenters, masons, conductors, painters, cooks, auto repair
mechanics, welders, waiters, suppliers, vegetable, venders, auto drivers, astrologists and so on. In this way cell
phone sector has emerged a separate business field, in which huge amount has been invested. Now a day, market
research is important to every cell phone company. The consumer is the king in market, so that all firms have to
study the consumers‟ taste, preference, likes and dislikes carefully. Retaining the existing consumers and
creating new customers are the two important tasks to the business firms in these days. Hence, consumer
research takes a vital part in market survey. Utility of consumer research is felt strongly in these days.
IV. NEED FOR THE STUDY
Mobile phones have become part and parcel of human life and have made their own unique place. Once
considered as a luxury, is now almost become a necessity for a common man. Besides, being a mode of
interpersonal communications, mobile phones serve the purpose of wristwatches, personal diaries, calculators,
alarm clocks, cameras, music players and games etc. Telecom sector is one of the fastest growing sectors in
India. Government of India has taken several initiatives to increase Tele density. Now, Indian cell phone
industry is under a heavy competition.
V. SIGNIFICANCE OF THE STUDY
This study is greatly significant in various ways. Findings of the study provide a more reliable scientific
measure and perspective to the management for the customers‟ satisfaction or dissatisfaction. It also serves as
invaluable sources of information that brings to limelight the customers. It shows the customers‟
satisfaction/dissatisfaction regarding the telecom services. So from the findings of the research, the service
providing companies will get an idea to give their best service to the customers. From the study, the important
factors regarding the selection of cell phone service providers will be derived. And, on the bases of these factors,
companies will get an idea to focus on such most important factors to attract the customers.
VI. STATEMENT OF THE PROBLEM
In earlier period, companies were not responsive about the customers because of less competition in the market.
But as the time has passed out, the marketing scenario has been changed. Now new products, bundle of package,
schemes etc. have been offered to the customers. So the decision has become more complicated for the
customers to select the best one. It has also become tricky to select the companies because due to the growing
demand for cell phone services. So the question of customer satisfaction is very important and crucial in current
scenario. (Sarma, S. J. 2010). Company should be aware of customer satisfaction as well as his/her perception to
make marketing strategies. More and more cell phone companies are now up-and-coming in the Indian
Telecommunication Sector with opening up of the economy. Several international leaders have been trying to
venture into the Indian Telecommunication Industry. The idea is that to understand the needs of customers as
154 | P a g e
well as the changes in their needs over the time allows cell phone companies to become more customer focused
and hence remain profitable over the time.
VII. SCOPE OF THE STUDY
Scope of this research is limited to Triuchirappalli City of Tamil Nadu state. The research confines to the study
of cell phone services from customer‟ s preferences and customer satisfaction among subscribers covering all
cell phone service providers in Triuchirappalli City. The six Broad Dimensions of customers‟ preference and
satisfaction covered under study are; Level of satisfaction, level of awareness, attitude of the customers,
attractive factors, discouraging factors and expectation factors. The customer satisfaction items include;
Network Coverage, Net work quality, Customer support, Complaint management, Availability customer service
centers, Billing Services, Value Added Services and Promotional offers. The study is helpful in improving
customer‟ s preference and customer satisfaction with telecom services. This study will also be helpful to draw
up further policy on related fields and act as a secondary data for further research.
VIII. LIMITATIONS OF THE STUDY
The following limitations are applicable to the present study:
1. The present study is based on the perception of the customers and it is based on their own experience; the
perception is subject to change in future.
2. The research is based on the strength of the opinions of the sample consumers and there are some possibilities
for changing their opinions in due course. So, the findings of the study may vary in passage of time.
3. The survey has been undertaken in the metropolitan city so that the findings may not be appropriate to semi
urban and rural areas.
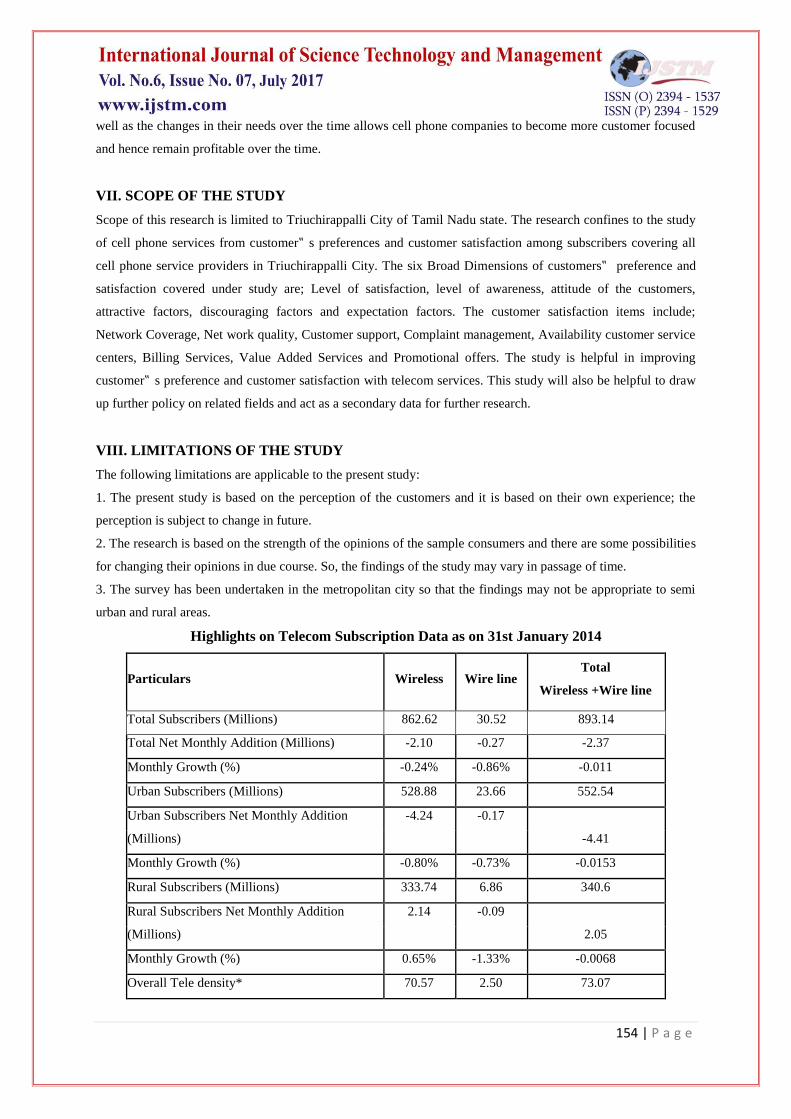
Highlights on Telecom Subscription Data as on 31st January 2014
Particulars Wireless Wire line Total
Wireless +Wire line
Total Subscribers (Millions) 862.62 30.52 893.14
Total Net Monthly Addition (Millions) -2.10 -0.27 -2.37
Monthly Growth (%) -0.24% -0.86% -0.011
Urban Subscribers (Millions) 528.88 23.66 552.54
Urban Subscribers Net Monthly Addition -4.24 -0.17
(Millions) -4.41
Monthly Growth (%) -0.80% -0.73% -0.0153
Rural Subscribers (Millions) 333.74 6.86 340.6
Rural Subscribers Net Monthly Addition 2.14 -0.09
(Millions) 2.05
Monthly Growth (%) 0.65% -1.33% -0.0068
Overall Tele density* 70.57 2.50 73.07
155 | P a g e
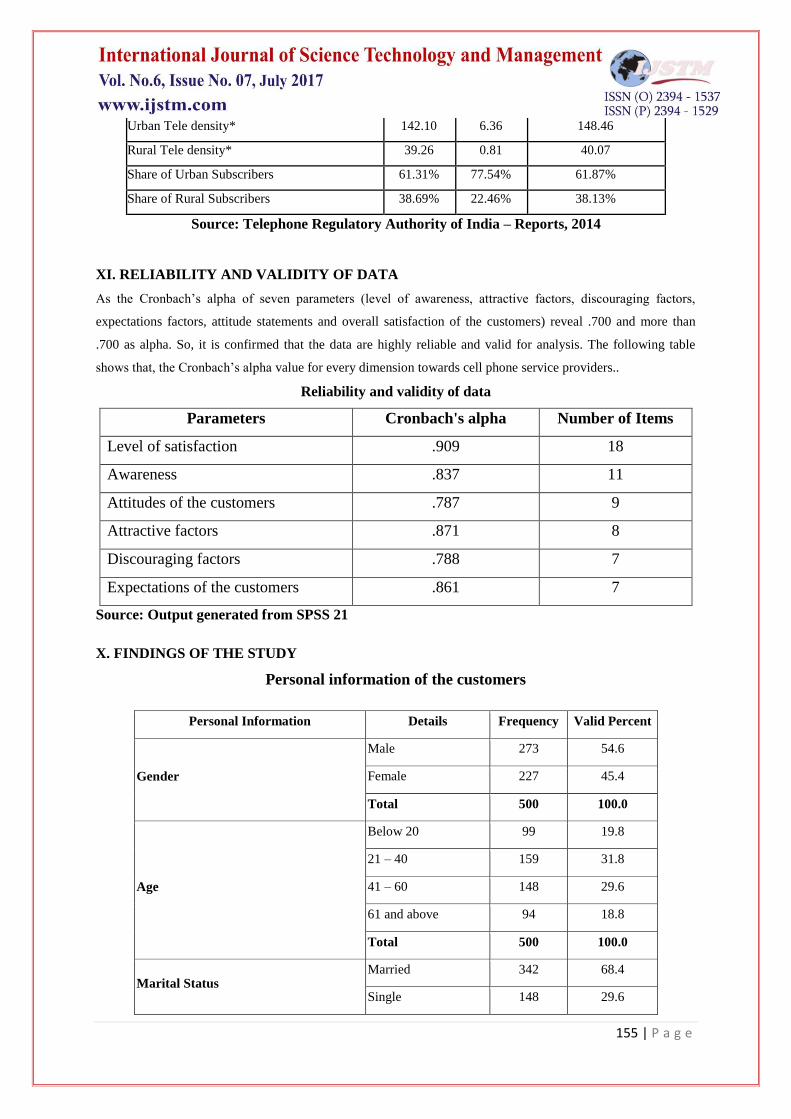
Urban Tele density* 142.10 6.36 148.46
Rural Tele density* 39.26 0.81 40.07
Share of Urban Subscribers 61.31% 77.54% 61.87%
Share of Rural Subscribers 38.69% 22.46% 38.13%
Source: Telephone Regulatory Authority of India – Reports, 2014
XI. RELIABILITY AND VALIDITY OF DATA
As the Cronbach’s alpha of seven parameters (level of awareness, attractive factors, discouraging factors,
expectations factors, attitude statements and overall satisfaction of the customers) reveal .700 and more than
.700 as alpha. So, it is confirmed that the data are highly reliable and valid for analysis. The following table
shows that, the Cronbach’s alpha value for every dimension towards cell phone service providers..
Reliability and validity of data
Parameters Cronbach's alpha Number of Items
Level of satisfaction .909 18
Awareness .837 11
Attitudes of the customers .787 9
Attractive factors .871 8
Discouraging factors .788 7
Expectations of the customers .861 7
Source: Output generated from SPSS 21
X. FINDINGS OF THE STUDY
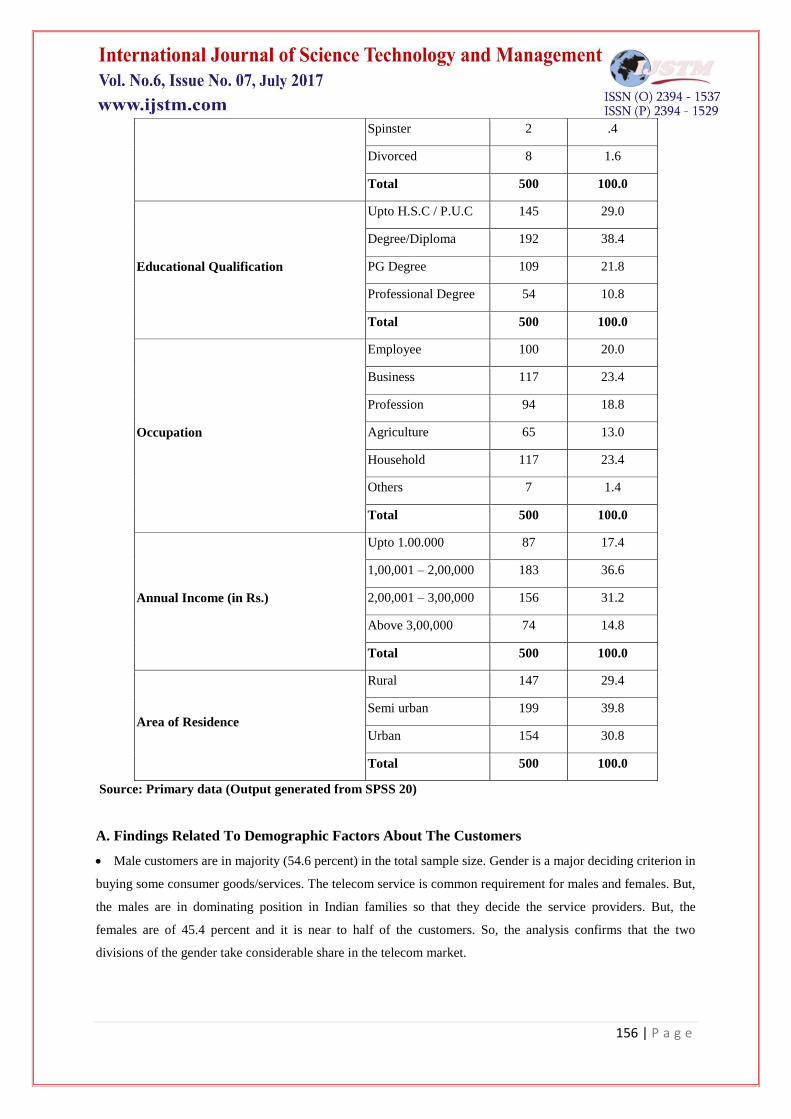
Personal information of the customers
Personal Information Details Frequency Valid Percent
Gender
Male 273 54.6
Female 227 45.4
Total 500 100.0
Age
Below 20 99 19.8
21 – 40 159 31.8
41 – 60 148 29.6
61 and above 94 18.8
Total 500 100.0
Marital Status Married 342 68.4
Single 148 29.6
156 | P a g e
Spinster 2 .4
Divorced 8 1.6
Total 500 100.0
Educational Qualification
Upto H.S.C / P.U.C 145 29.0
Degree/Diploma 192 38.4
PG Degree 109 21.8
Professional Degree 54 10.8
Total 500 100.0
Occupation
Employee 100 20.0
Business 117 23.4
Profession 94 18.8
Agriculture 65 13.0
Household 117 23.4
Others 7 1.4
Total 500 100.0
Annual Income (in Rs.)
Upto 1.00.000 87 17.4
1,00,001 – 2,00,000 183 36.6
2,00,001 – 3,00,000 156 31.2
Above 3,00,000 74 14.8
Total 500 100.0
Area of Residence
Rural 147 29.4
Semi urban 199 39.8
Urban 154 30.8
Total 500 100.0
Source: Primary data (Output generated from SPSS 20)
A. Findings Related To Demographic Factors About The Customers
Male customers are in majority (54.6 percent) in the total sample size. Gender is a major deciding criterion in
buying some consumer goods/services. The telecom service is common requirement for males and females. But,
the males are in dominating position in Indian families so that they decide the service providers. But, the
females are of 45.4 percent and it is near to half of the customers. So, the analysis confirms that the two
divisions of the gender take considerable share in the telecom market.
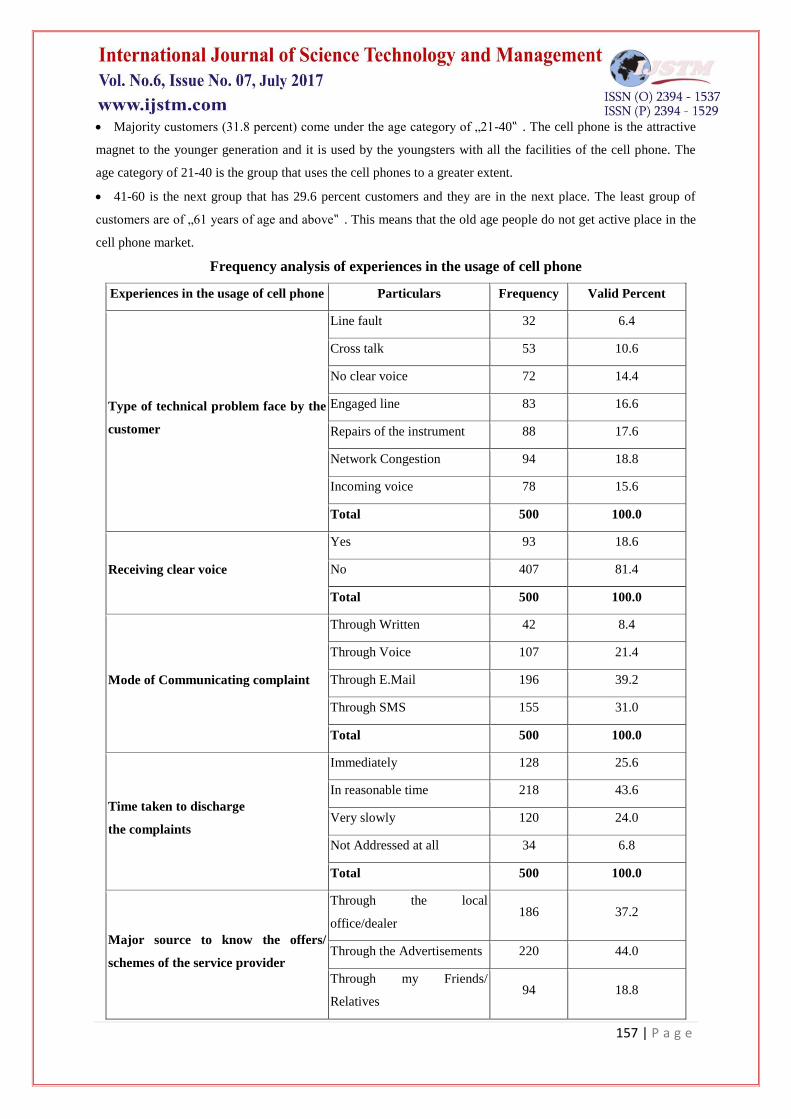
157 | P a g e
Majority customers (31.8 percent) come under the age category of „21-40‟ . The cell phone is the attractive
magnet to the younger generation and it is used by the youngsters with all the facilities of the cell phone. The
age category of 21-40 is the group that uses the cell phones to a greater extent.
41-60 is the next group that has 29.6 percent customers and they are in the next place. The least group of
customers are of „61 years of age and above‟ . This means that the old age people do not get active place in the
cell phone market.
Frequency analysis of experiences in the usage of cell phone
Experiences in the usage of cell phone Particulars Frequency Valid Percent
Type of technical problem face by the
customer
Line fault 32 6.4
Cross talk 53 10.6
No clear voice 72 14.4
Engaged line 83 16.6
Repairs of the instrument 88 17.6
Network Congestion 94 18.8
Incoming voice 78 15.6
Total 500 100.0
Receiving clear voice
Yes 93 18.6
No 407 81.4
Total 500 100.0
Mode of Communicating complaint
Through Written 42 8.4
Through Voice 107 21.4
Through E.Mail 196 39.2
Through SMS 155 31.0
Total 500 100.0
Time taken to discharge
the complaints
Immediately 128 25.6
In reasonable time 218 43.6
Very slowly 120 24.0
Not Addressed at all 34 6.8
Total 500 100.0
Major source to know the offers/
schemes of the service provider
Through the local
office/dealer 186 37.2
Through the Advertisements 220 44.0
Through my Friends/
Relatives 94 18.8
158 | P a g e
Experiences in the usage of cell phone Particulars Frequency Valid Percent
Type of technical problem face by the
customer
Line fault 32 6.4
Cross talk 53 10.6
No clear voice 72 14.4
Engaged line 83 16.6
Repairs of the instrument 88 17.6
Network Congestion 94 18.8
Incoming voice 78 15.6
Total 500 100.0
Source: Primary data (Output generated from SPSS 20)
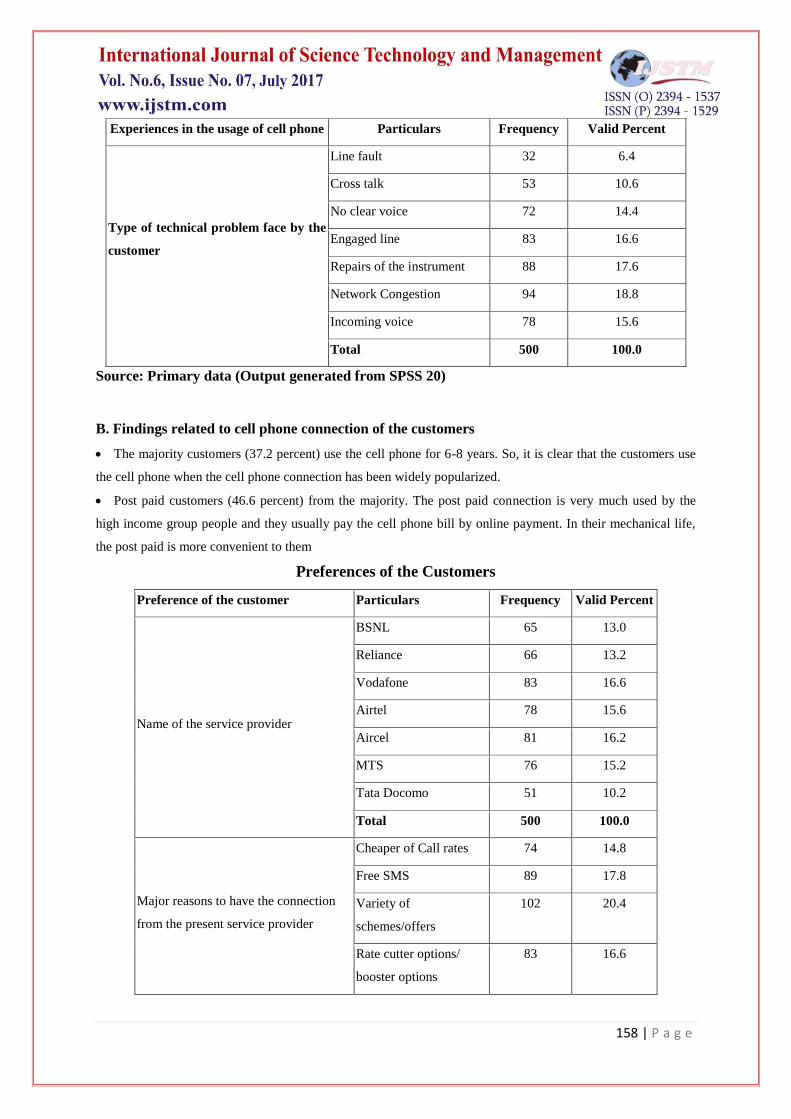
B. Findings related to cell phone connection of the customers
The majority customers (37.2 percent) use the cell phone for 6-8 years. So, it is clear that the customers use
the cell phone when the cell phone connection has been widely popularized.
Post paid customers (46.6 percent) from the majority. The post paid connection is very much used by the
high income group people and they usually pay the cell phone bill by online payment. In their mechanical life,
the post paid is more convenient to them
Preferences of the Customers
Preference of the customer Particulars Frequency Valid Percent
Name of the service provider
BSNL 65 13.0
Reliance 66 13.2
Vodafone 83 16.6
Airtel 78 15.6
Aircel 81 16.2
MTS 76 15.2
Tata Docomo 51 10.2
Total 500 100.0
Major reasons to have the connection
from the present service provider
Cheaper of Call rates 74 14.8
Free SMS 89 17.8
Variety of
schemes/offers
102 20.4
Rate cutter options/
booster options
83 16.6
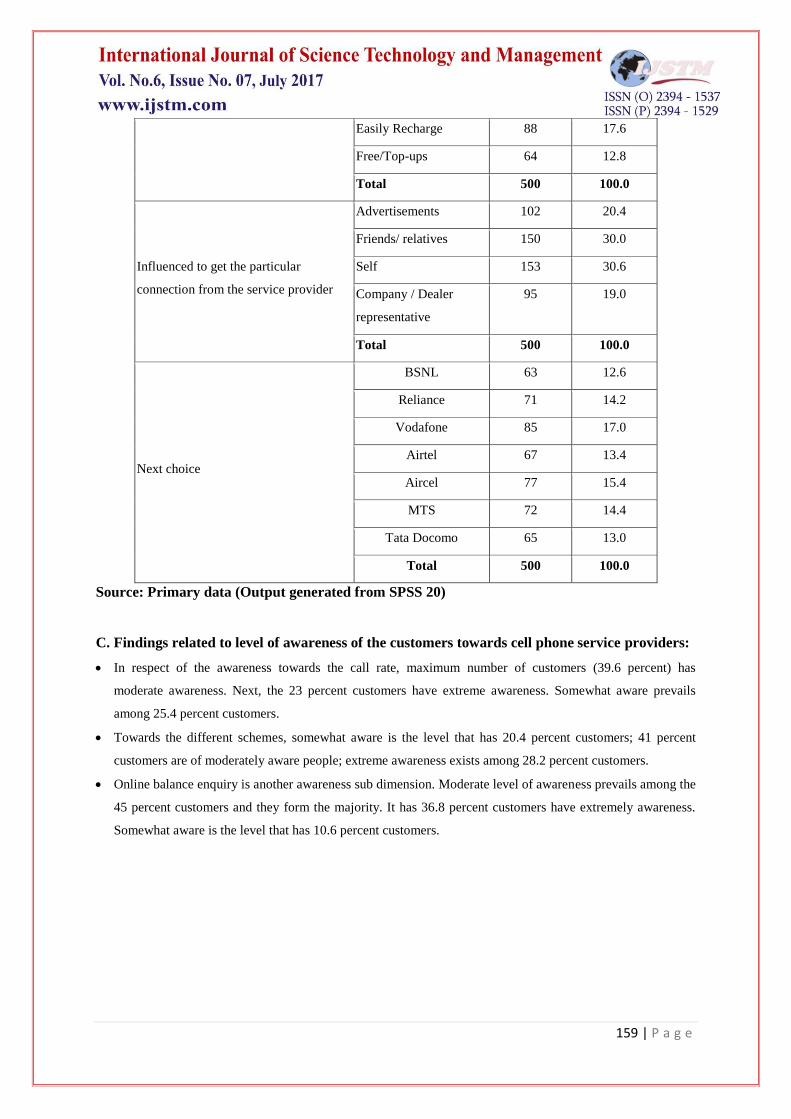
159 | P a g e
Easily Recharge 88 17.6
Free/Top-ups 64 12.8
Total 500 100.0
Influenced to get the particular
connection from the service provider
Advertisements 102 20.4
Friends/ relatives 150 30.0
Self 153 30.6
Company / Dealer
representative
95 19.0
Total 500 100.0
Next choice
BSNL 63 12.6
Reliance 71 14.2
Vodafone 85 17.0
Airtel 67 13.4
Aircel 77 15.4
MTS 72 14.4
Tata Docomo 65 13.0
Total 500 100.0
Source: Primary data (Output generated from SPSS 20)
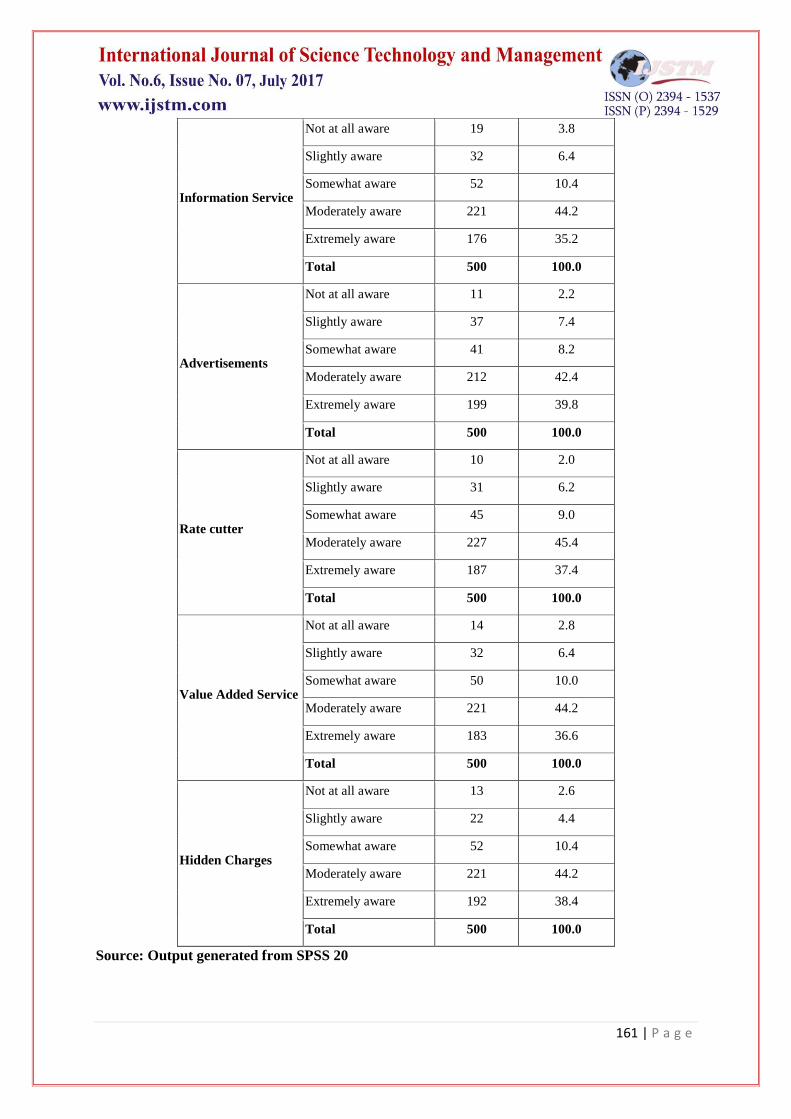
C. Findings related to level of awareness of the customers towards cell phone service providers:
In respect of the awareness towards the call rate, maximum number of customers (39.6 percent) has
moderate awareness. Next, the 23 percent customers have extreme awareness. Somewhat aware prevails
among 25.4 percent customers.
Towards the different schemes, somewhat aware is the level that has 20.4 percent customers; 41 percent
customers are of moderately aware people; extreme awareness exists among 28.2 percent customers.
Online balance enquiry is another awareness sub dimension. Moderate level of awareness prevails among the
45 percent customers and they form the majority. It has 36.8 percent customers have extremely awareness.
Somewhat aware is the level that has 10.6 percent customers.
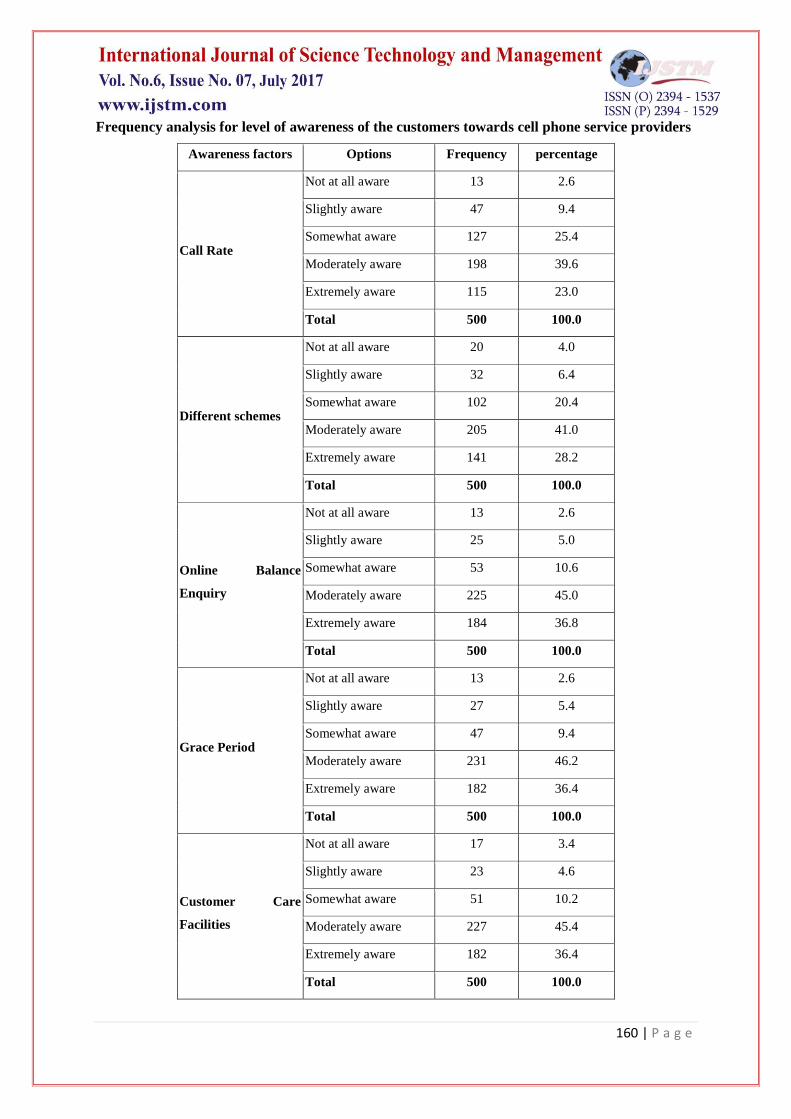
160 | P a g e
Frequency analysis for level of awareness of the customers towards cell phone service providers
Awareness factors Options Frequency percentage
Call Rate
Not at all aware 13 2.6
Slightly aware 47 9.4
Somewhat aware 127 25.4
Moderately aware 198 39.6
Extremely aware 115 23.0
Total 500 100.0
Different schemes
Not at all aware 20 4.0
Slightly aware 32 6.4
Somewhat aware 102 20.4
Moderately aware 205 41.0
Extremely aware 141 28.2
Total 500 100.0
Online Balance
Enquiry
Not at all aware 13 2.6
Slightly aware 25 5.0
Somewhat aware 53 10.6
Moderately aware 225 45.0
Extremely aware 184 36.8
Total 500 100.0
Grace Period
Not at all aware 13 2.6
Slightly aware 27 5.4
Somewhat aware 47 9.4
Moderately aware 231 46.2
Extremely aware 182 36.4
Total 500 100.0
Customer Care
Facilities
Not at all aware 17 3.4
Slightly aware 23 4.6
Somewhat aware 51 10.2
Moderately aware 227 45.4
Extremely aware 182 36.4
Total 500 100.0
161 | P a g e
Information Service
Not at all aware 19 3.8
Slightly aware 32 6.4
Somewhat aware 52 10.4
Moderately aware 221 44.2
Extremely aware 176 35.2
Total 500 100.0
Advertisements
Not at all aware 11 2.2
Slightly aware 37 7.4
Somewhat aware 41 8.2
Moderately aware 212 42.4
Extremely aware 199 39.8
Total 500 100.0
Rate cutter
Not at all aware 10 2.0
Slightly aware 31 6.2
Somewhat aware 45 9.0
Moderately aware 227 45.4
Extremely aware 187 37.4
Total 500 100.0
Value Added Service
Not at all aware 14 2.8
Slightly aware 32 6.4
Somewhat aware 50 10.0
Moderately aware 221 44.2
Extremely aware 183 36.6
Total 500 100.0
Hidden Charges
Not at all aware 13 2.6
Slightly aware 22 4.4
Somewhat aware 52 10.4
Moderately aware 221 44.2
Extremely aware 192 38.4
Total 500 100.0
Source: Output generated from SPSS 20
162 | P a g e
Findings related to attitude of the customers towards cell phone service providers
In respect of the attitude towards “Economy” (Usage of cell phone is always economy.) majority customers
(26.8 percent) agreed with slightly. They are followed by the agreed group (24.6 percent customers).
In respect of the attitude towards “Convenience” (Usage of cell phone is always more convenient than other
communication media) maximum number of customers (33.6 percent) agree with the statement.
In respect of the attitude towards “Full talk time”(Offer of full talk time is not a real concession.), 25 percent
customers agree with the statement and they form the majority.
In respect of the attitude towards “Hidden charges” (All service providers Charge hidden charges on the
customers.), 32.8 percent customers agree with the statement and they are of the majority.
In respect of the attitude towards „Shifting intention‟ (I have no intention to shift to other service provider.),
„agree‟ has the maximum number of customers (29.4 percent) and they are followed by the „slightly
agreed‟ group (27.8 percent customers.
In respect of the attitude towards „Customer care‟ (The service providers do not care about the customers‟
grievances.), 31.6 percent customers are of “slightly agreed‟ group. 31.2 percent customers agree with eh
statement.
Finding related to discouraging factors of the customers towards cell phone service providers:
In the case of delayed connectivity, majority customers (39.8 percent) agree with this aspect and 32 percent
customers agree with it. So, it is clear that the connectivity is delayed sometimes and it discourages the
customers
XI. SUGGESTIONS
In the highly competitive market of mobile telephony services, companies need to pay attention to
understand the customers‟ requirements empathetically. Further, they should give the utmost attention to
ensure good Network Quality and Efficiency because these are the main factor influencing customers‟
decision to purchase a particular mobile connection in case of the customers of different occupational groups
and gender.
Thus, mobile service providers should pay due attention to functional as well as technical quality of telecom
services to stay ahead of competitors. The service providers should target young customer group of upto 25
year of age by offering various free benefits along with Connection and Value Added Services.
Further, for the female customers the same benefits should be used to target them .While communicating and
promoting their products to the male customers, the mobile companies should highlight their Network
Quality and Efficiency, Charges for basic services and Efficient Roaming Services. Therefore, the companies
should formulate customized marketing strategies as per the preferences of male and female customer group
in order to influence their decision to choose a particular mobile service provider.
XII. CONCLUSION
This study concludes that the mobile companies have introduced various advanced Services like – voice mail,
video calling, call forwarding etc. However, these services are rarely used by the customers of different age,
163 | P a g e
income, occupation and gender. Also, these services are rarely used by the customers having mobile connection
of different service providers and using pre-paid and post-paid mobile connection. The companies need to find
out the reasons for this phenomenon and thereafter device appropriate pricing and promotional strategies to
increase their usage rate. The present study brings out that the usage pattern has an important role with the
income of the mobile telephony customers. The study indicated that among the various service quality
dimensions, efficient network connectivity are the most important factors contributing to the customers‟
perception of overall satisfaction and preference in mobile telephony. Therefore, the mobile service providers
have to take measures to improve the efficiency in their network connectivity.