Embed Size (px)
Citation preview
299mm
structural/institutional capital
human capital
social capital
A STU
DY
ON
CR
EATIV
ITY IN
DEX
gary chang
HOME AFFAIRS BUREAU, THE HONG KONG SPECIAL ADMINISTRATIVE REGION GOVERNMENT
A STUDY ON CREATIVITY INDEX
OUTSIDE JACKET
2000
165mm 9mm 165mm
299mm
157mm164mm 164mmENGLISH VERSION

��
Home Affairs Bureau, The Hong Kong Special Administrative Region Government
CONSULTANTCentre for Cultural Policy Research, The University of Hong Kong
A Study on Creativity Index

��
�
RESEARCH TEAM The Centre for Cultural Policy Research, The University of Hong Kong
Desmond HUI, Director
NG Chun-hung, Deputy Director
Patrick MOK, Consultant
Home Affairs Bureau, The Hong Kong Special Administrative Region Government
FONG Ngai, Assistant Secretary (Culture)
CHIN Wan-kan, Research Director
Christina YUEN, Senior Research Officer
�

A STUDY ON CREATIVITY INDEX ��
INTRODUCTION��
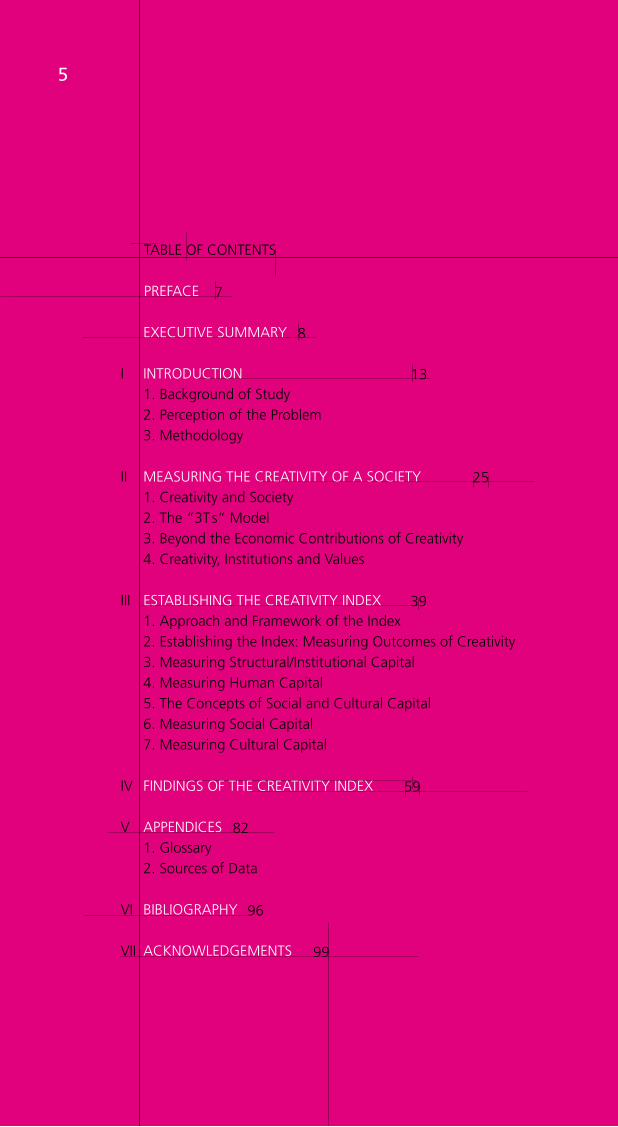
TABLE OF CONTENTS
PREFACE
EXECUTIVE SUMMARY
I INTRODUCTION 1. Background of Study 2. Perception of the Problem 3. Methodology
II MEASURING THE CREATIVITY OF A SOCIETY 1. Creativity and Society 2. The “3T s“ Model 3. Beyond the Economic Contributions of Creativity 4. Creativity, Institutions and Values
III ESTABLISHING THE CREATIVITY INDEX 1. Approach and Framework of the Index 2. Establishing the Index: Measuring Outcomes of Creativity 3. Measuring Structural/Institutional Capital 4. Measuring Human Capital 5. The Concepts of Social and Cultural Capital 6. Measuring Social Capital 7. Measuring Cultural Capital
IV FINDINGS OF THE CREATIVITY INDEX
V APPENDICES 1. Glossary 2. Sources of Data
VI BIBLIOGRAPHY
VII ACKNOWLEDGEMENTS
13
25
39
59
82
96
99
8
7

A STUDY ON CREATIVITY INDEX ��
INTRODUCTION��
One of the overwhelming trends of the 20th century is globalization, characterized by the free-flow of capital, technology and labour across the borders under ever-converging international standards to achieve the best arrangement of profits. This trend continues to gather momentum in the 21st century through the participation of new economies, digitalized communication and the broad use of the Internet. New ways of arranging business are bred. No matter which stage the economic and cultural development of a state or a city has reached, a government must pay heed to the impact of globalization and adapt to the changes.
To thrive in this new age, economies have to be prepared to cope with the flow and clustering of capital, talents and industries. Innovations in technologies, consumer experience and service provision, as well as the social institution and lifestyles which accommodate innovations, are of utmost importance. The Confucian Wang Yangming (1472-1528 A.D.) of the Ming dynasty advocated the consistency of knowing and doing in personal spiritual cultivation. By the same token, our action in the public sphere should be in-phase with the collection of information in order to understand ourselves and the outside world. We would then know our strengths and weaknesses and take appropriate actions. Starting with the local context and covering human, institutional, social and cultural capitals, the Study on Creativity Index assesses in a holistic way the capability of the Hong Kong community to innovate. Commissioned to an independent research institute of a university, the Study on Creativity Index will provide a useful reference to the government, civic organizations, the culture and arts sector, creative entrepreneurs, overseas investors and neighbouring state or city economies. The Index at this stage is a tool for self-discovery of Hong Kong. In future, we hope it could form a basis for mutual comparison and a bridge for long-term friendship in Asia.
Dr Patrick C P HoSecretary for Home AffairsThe Hong Kong Special Administrative Region Government
PREFACE
EXECUTIVE SUMMARY �
Objectives of the Creativity Index
In 2004, the HKSAR Government commissioned the Centre for Cultural Policy Research of the University of Hong Kong to devise a framework for a Creativity Index (CI).
Objectives of the study:• demonstrate the multifaceted manifestations of creativity in a
society;• illustrate the interplay of various factors that contribute to the
growth of creativity;• assess the macro socio-economic and cultural conditions that
harness creativity or impede the growth of creativity in our community;
• measure the creative vitality of an economy in the Asian region;
• construct an indexing system, which could serve as:- criteria for assessing the creative vitality of Hong Kong;- integrated indicator for sustainable growth in the creative
sector of the Hong Kong economy;- reference for overall policy-making and decision-making
for investment, traveling and residence in Hong Kong;- basis of international comparison.
Building Blocks of the Creativity Index – 5Cs
The CI builds on “5Cs” • outcomes of creativity• structural/institutional capital• human capital• social capital• cultural capital
The four forms of capital are mutually reinforcing.
They are multifaceted and dynamic determinants of the growth of creativity.
Accumulated effects of these determinants are the variegated outcomes of creativity.
Measuring the Outcomes of Creativity
Creative activities generate not only economic outputs, but also outcomes shared and transacted among the populace.
Economic outputs stand for the growth of creative economy, but other inventive outcomes present the vitality and vibrancy of creativity in a place.
�
Our framework measures• “economic contribution”,• “inventive activity of economic sector”, and• “non-economic returns” of creativity.
For instance, economic contribution of creative industries, size of working population engaged in the creative industries, trade value of the creative industries, economic contribution of e-commerce, inventive ability of business sector, innovative activity in terms of applications of patent, creative activity in the creative sector and in the arts and culture, etc.
Measuring Structural/Institutional Capital
These are conditions that provide the context in a community where creativity takes place.
They also determine the conditions of utilization and distribution of other forms of capital.
We measure eight types of societal conditions that are contributors to the growth of creativity in a community:• Legal system• Corruption• Freedom of expression• Information and communication technologies infrastructure• Social and cultural infrastructure• Community facilities• Financial infrastructure• Entrepreneurship
Measuring Human Capital
High mobility of human capital will facilitate cultural exchange, transfer of skills and knowledge as well as generation of new ideas in society.
Our “Human Capital” framework measures three sets of conditions in support of human capital development:• the extent of a community to provide a favorable context for
the development of “knowledge bank”- indicators include Research & Development (R&D)
expenditure and government expenditure in education• the growing community and availability of knowledge workers
- indicators include size of R&D personnel and number of population with higher degrees
• mobility of human capital and population- indicators include the numbers of transient population in
EXECUTIVE SUMMARY 10
terms of visitor arrivals, resident departures, emigrants as well as working visas per working population.
Measuring Social Capital
While technology and talent are indispensable assets of a creative economy, whether a city has a social milieu which attracts, mobilizes and sustains creativity is equally important.
Social capital, in terms of trust, reciprocity, cooperation and rich social networks are conducive to the enrichment of collective well-being, social expression and civic engagement. All these in turn enable individual and collective creativity to flourish.
We measure therefore the following aspects of “social capital”, including:• Generalized trust• Institutional trust• Reciprocity• Sense of efficacy• Cooperation• Acceptance of diversity and inclusiveness• Attitudes towards human rights• Attitudes towards foreign immigrants• Espousal of modern values• Self-expression• Participation in politics, and• Social participation including voluntary work, barriers to social
participation, membership of clubs and organizations and intensity of social contacts.
We also collect data on corporate and private donations as well as public sector’s expenditure in social welfare, indicating the levels of resources available for social capital development.
Measuring Cultural Capital
We believe a social environment conducive to cultural participation produces new ideas and expressions and hence enhances creativity in a broad sense.
In our study, cultural capital refers to the more specific activities and qualities relating to culture, the arts and creativity in everyday life.
We measure three broad aspects of cultural capital in a community:• public sector’s and corporations’ resources commitment to the
development of the arts and culture.• measures of cultural norms and values placed on creativity, the
arts, art education and intellectual property rights protection.• measures of the extent and level of cultural participation in a
community.
11
- indicators include patterns of engagement (such as utilisation, frequency and intensity) in arts and cultural activities.
Findings of the Creativity Index Study
The CI comprises 88 indicators tabulated from different data sources.
Since the data derived from the World Value Survey and the Creative Community Index study is only for 2004-2005, the limitation of historical comparison is overcome by applying the same data throughout the 6 year period with the assumption that people’s values would not change drastically during this span of time.
Historical data (1999-2004) could be used to chart the pattern of growth of the sub- and overall indices of the CI, using 2004 as the base year.
The Outcomes of Creativity Index (OCI) shows moderate growth for its three sub-indices, with a more impressive growth in the economic contribution of creativity.
The Structural/Institutional Capital Index (SICI) indicates a mixed result: while independence of legal system and freedom of expression decline and entrepreneurship becomes stagnant, this is offset by robust growth in ICT, social and financial infrastructures and hence the overall growth is positive.
The Human Capital Index (HCI) shows impressive growth in its three sub-indices, in particular, the R&D in different sectors. Hong Kong enjoys a strong position in the HCI.
The Social Capital Index (SCI) comprises 21 indicators and 4 have historical data for comparison. Among these, corporate donations increased drastically in 2003, contributing to a robust growth for the sub-index of development of social capital.
The Cultural Capital Index (CCI) also indicates growth pattern for the two sub-indices of cultural expenditure and participation, with particular growth in 2002 due to celebration of the 5th Anniversary of the establishment of the HKSAR.
The overall CI for Hong Kong during 1999-2004 shows a positive growth pattern, from an index figure of 75.96 in 1999 to 100 in 2004.

A STUDY ON CREATIVITY INDEX 1�

INTRODUCTION1�
INTRODUCTIONI.
A STUDY ON CREATIVITY INDEX 1�
1 Background of Study
1.1 The Study on Creativity Index (the Study) is commissioned by the Home Affairs Bureau of the Government of the Hong Kong Special Administrative Region (HAB). The Creativity Index (hereinafter referred to as the CI) will be used to assess and monitor Hong Kong's competitiveness in the creative age over time as well as for the purpose of comparing its creative vitality with its neighbours. The methodology can be adaptable and applicable to other neighbouring regions and Asian cities.
1.2 The Study serves the following purposes:
(a) As criteria for assessing the creative vitality of Hong Kong. (b) As an integrated indicator for sustainable growth in the
creative sector of the Hong Kong economy (as measurement for the impact of the creative sector on overall economic development).
(c) Prepare a database for the further development of the creative sector in Hong Kong.
(d) As an integrated indicator for the government's reference in overall policymaking on the development of the creative sector in Hong Kong.
(e) Provide data and advice for government bureaux/departments in improving policymaking and policy implementation, facilitate the assessment of achievements and strategic planning, and enhance the understanding of the current status of the creative sector in Hong Kong.
(f) Assess the effectiveness of government's support on the creative sector in Hong Kong.
(g) As a reference for the decision-making for investment, traveling and residence in Hong Kong.
(h) As a basis of comparative study for Hong Kong with its neighbouring regions (such as the Pearl River Delta) and Asian cities.
1.3 The scope of the Study is to cover the following:
(a) Research on International Creativity Indicatorsi. Study the current state of creativity indicators used
internationally and in the neighbouring regions.ii. Advise on the adaptability of the indicators in Hong Kong as
well as in neighbouring regions and Asian cities.
(b) Review of researches/studies relevant to the creative sectors in Hong Kong as well as in the neighbouring regions and Asian cities
INTRODUCTION1�
i. Review researches/studies relevant to the creative sectors in Hong Kong
ii. Review researches/studies relevant to the creative sectors in neighbouring regions and Asian cities.
(c) Consultation with experts/advisors in the creative sectorsi. Consult experts/advisors in the creative sectors in or outside
Hong Kong in devising the actual methodology used.
(d) Devising the actual methodology usedi. Finalising the actual methodology used in consultation with
Home Affairs Bureau.ii. Give a working definition for the creative sector in Hong Kong
applicable to this study.iii. Compile a list of indicators constituting the CI, taking into
account the creativity indicators used internationally and the results of researches/studies relevant to the creative sectors in Hong Kong as well as in the neighbouring regions and Asian cities. The Creativity Index compiled is to be applicable to the neighbouring regions and other Asian cities.
iv. Study the availability of data sources related to the compilation of creativity indicators.
(e) Compilation of Creativity Indexi. Perform data collection workii. Compile CI/Sub-Indices
A STUDY ON CREATIVITY INDEX 1�
� Perception of the Problem
Globalisation and Competitiveness
2.1 Globalisation has an impact on social and economic transformation in most of the city economies of the world. Legions of socio-economic processes now taking place in many world cities – such as the vibrant movement of international capital, ever-increasing mobility of talents and corporate workers, greater need for innovative and specialised services, and the interwoven and dynamic networks that connect the local to a wider geography of global markets – confirm this general premise. World cities now face formidable economic challenges in the global economy. They need to sharpen their own edges by offering distinctive products and creative services to the world market and to position and re-position themselves in the world economic chain of production. Meanwhile, they are eager to attract talents and foreign capital for sustainable economic development. The crux of these challenges is to maintain their own “competitiveness” in a more integrated and competitive world.
2.2 With the advancement of globalisation, the economy of a world city has developed from a service-based to a more specialised and knowledge-based economy in the past few decades. The rising “creative industries”, which deploy intellectual property and creativity for generating wealth and employment, are just an illuminating and compelling phenomenon of the changing economic structure of cities. From a broader perspective, there are many indicators – including the increasing portion of knowledge workers in the total working population, the general enhancement of educational qualification, increasing activities of scientific and artistic research or the more conducive environment in favor of innovation – that may reflect the ongoing development of a city’s competitiveness. These changes, no matter in terms of the rising industry sector or the importance of human capital in promoting economic development, pinpoint the ever-changing nature of the servicing economy of world cities.
2.3 Hong Kong has earned a distinctive position in the economic map of the world. The urban economist Saskia Sassen has cited our city as one of the international financial centres, whose specialised operations in global capital market will likely be strengthened in the digital era.1 In 2005, Hong Kong was named the world’s freest economy by the Heritage Foundation/Wall Street Journal’s “Index of Economic Freedom”.2 Its GDP per head in 2003 accounted for US$ 27,700, indicating that the city’s capacity in producing wealth was
2 http://www.heritage.org/research/features/index/countries.cfm.
1 Sakia Sassen (1999), chapter 5.
INTRODUCTION1�
ranked second highest in Asia only after Japan.3
2.4 Conventional measurements like those mentioned above for evaluating Hong Kong’s position in the world economy are particularly useful in reviewing the city’s macro economic environment and its long-term growth. These indicators refer to the GDP, annual economic growth, amount of public expenses, foreign-exchange reserves, cost of living or unemployment rate, or the economic competitiveness of Hong Kong among world cities. However, they are far from adequate to reveal the changing nature of the underlying forces on which the city’s economy relies - “knowledge”, “information” and “creativity” – different forms of intangible assets that a city could capitalise on for its economic growth in the age of globalisation.
Creativity as Index for Measuring Competitiveness
2.5 One may expect that, as Hong Kong’s economy grows more complex, there is a strong demand for developing a conceptual tool that enables us to capture the fundamental characteristics of its economic development in recent years and in the future. In addition, the tool should also be able to demonstrate the dynamic relationship between the city’s economic vitality and its competitive cores. In short, in devising or collecting a set of indicators to measure Hong Kong’s creativity, one should consider that:
(a) the indicators shall reveal the emerging economic nature of world cities (such as “knowledge-based” or “information-based” economic structure);
(b) the indicators shall pinpoint the competitive cores that contribute to the development of world cities;
(c) the indicators shall reveal the relevance of creativity and creative industries to the development of world cities;
(d) the compilation of indicators shall build on the recognised benchmarking of international indices so that the results could be compared with international standards; and
(e) the indicators are applicable to neighbouring regions and other major Asian cities.
2.6 In sum, the Creativity Index should not only reflect the on-going development and ever-changing nature of world cities, but also demonstrate a more focusing comparison on the competitiveness of world cities in the age of the knowledge-based economy.
3 Economist Intelligence Unit (2004), Country Reports.
A STUDY ON CREATIVITY INDEX 1�
� Methodology
Precedent Studies
3.1 There are some existing studies on Creativity Index that may be useful and relevant to our proposed investigation. Of these three are particularly worthy of mention: Richard Florida’s pioneering work The Rise of the Creative Class (2002) and his subsequent collaboration with Irene Tinagli on Europe in the Creative Age (2004), as well as the Creative Community Index (2002) directed by John Kreidler of the Cultural Initiatives for Silicon Valley.
3.2 We will examine Florida’s work in more details in Chapter II, and give only a brief explanation here: Florida argues that a place’s competitiveness could be found in its capacity of promoting innovation, attracting talents and maintaining conducive environment in favor of creativity. In The Rise of Creative Class, he compiles a “Creativity Index” based on the combination of the following: the “High-Tech Index”, “Innovation Index”, a measure of the size of the “Creative Class” and the “Composite Diversity Index” (this last one includes the sub-indices of “Gay Index”, “Bohemian Index”, “Talent Index” and “Melting Pot Index”).4 In an updated work collaborated with Irene Tinagli (2004), Florida articulates a “Euro-Creativity Index” by extending his previous framework to the European context. The “Euro-Creativity” comprises two indices – the “Technology Index” and “Talent Index” compiled in a similar fashion to those in The Rise of Creative Class – and a third new category, the “Tolerance Index”, which is constructed and applied to the European context.5
3.3 Besides being a composite index of the Euro-Creative Class Index, which measures the population size of creative workers in 13 EU nations, Florida’s Euro-Creativity Index comprises the sub-indices of the “3Ts” – the “Euro-Talent Index”, “Euro-Technology Index” and “Euro-Tolerance Index”. The Talent Index measures two factors, including the population of degree holders and the number of research scientists and engineers while the Technology index measures the number of patent applications in a country and R&D expenditure as a percent of GDP. Finally, the Tolerance Index measures values and attitudes derived from the findings of the “World Values Survey” conducted by Ronald Inglehart (2000).
Building the Creativity Index
3.4 Comparable data about the population size of creative class, human capital and R&D expenditures could also be found in the existing database of the Hong Kong Census and Statistical Department. Therefore, the key components of Florida’s framework are adaptable
5 Due to unavailability of data in Europe, the Euro-Tolerance Index differs from the “Composite Diversity Index” adopted in Florida (2002); see Florida and Tinagli (2004): 25-27.
4 Richard Florida (2002), Appendices A and B.
INTRODUCTION1�
to the construction of a Creativity Index.
3.5 However, the third T raised by Florida – Tolerance Index – though innovative and important for a study of this nature, is quite difficult to construct. The index captures the less tangible but crucial aspect in assessing the creative edge of a world city. It has now been widely acknowledged that while technology and talent are indispensable assets of a creative economy, whether a city has a cultural milieu which attracts, mobilises and sustains creativity is equally important. Florida’s study made use of the findings of the World Values Survey to construct an index which taps and compares selected European nations’ value preferences concerning diversity, openness and self-expression. The resultant scores reveal that a high level of ‘tolerance” is closely associated with other indices on talent and technology as well as the overall economic dynamism of a nation.
3.6 We develop a similar version of a “Tolerance Index” for measuring Hong Kong’s performance and potential in this respect. There are various existing studies in Hong Kong which tap related issues of people’s values in terms of diversity, tolerance and self-expression, most notably studies on the continuing series of social indicators jointly conducted by three local universities since 1988.6 However, to ensure the international comparability of the ‘Tolerance Index’, we need to build a more consistent set of instruments to measure the values of Hong Kong residents.
3.7 We therefore draw on the World Values Survey to devise a set of format and questions pertinent to our local conditions. Because comparable local data of such nature and rigor are absent at the moment, we conduct a fresh survey to gauge these values among local residents. The results from the survey will help us construct and calculate a “Tolerance Index” that serves as a baseline for assessing the potential of Hong Kong in sustaining a cultural environment to attract and mobilise creative talents. The index will also shed light on how Hong Kong compares with global competitors in the long run.
3.8 Towards this end, we carry out a face-to-face territory-wide survey of around 1,200 residents of Hong Kong, gauging their values on a range of issues regarding diversity, openness and self-expression. We have liaised with the World Values Survey team headed by Ronald Inglehart at the University of Michigan to make use of their questionnaire and to access the relevant data. The results can be directly compared to highly similar data sets for the 65 nations/places (including those in the Asian region) under the rubric of the World Values Survey as well as the Euro-Creativity Index produced by Florida and Tinagli.
6 Lau Siu Kai et al (1988-2003) and also http://www.cuhk.edu.hk/hkiaps/INDICA/soc5.htm.
A STUDY ON CREATIVITY INDEX �0
Refinement of Models
3.9 We propose to improve on Florida’s framework and to extend his scope of indicators by comparing with other international benchmarks on competitive and creativity indices. The study will scrutinise the components of the Creativity Index and endeavor to enrich the components so as to enable it to reflect more accurately the vitality, pervasiveness and dynamics of creativity in our city economy.
3.10 The World Economic Forum’s (WEF) “Global Competitiveness Report” (GCR) and “Global Information Technology Report” (GITR) have devised different analytical frameworks in examining the competitiveness of individual countries. These analytical frameworks will also be useful for setting up the Creativity Index. The GITR, in particular, constructs a “Network Readiness Index” to examine a country’s pace and development towards information society. Apart from these studies, the Asia Pacific Economic Co-operation (APEC), the Organisation for Economic Co-operation and Development (OECD) and the UNESCO have in recent years articulated qualitative and quantitative models for measuring and monitoring the world trend of “new economy”, “information economy”, or the “information and knowledge societies”.7
3.11 These references on information or knowledge economy would be highly relevant to our discussion about the Creativity Index. We will examine: i) how these different reference frameworks would shed light on the nature of Hong Kong’s changing economic structure, and ii) how they supplement each other to delineate the possible scope and the architecture of a Creativity Index.
3.12 Moreover, Florida’s Euro-Creativity Index can be further improved by adding new indicators or sub-indices, which are more relevant to reveal the economic and socio-cultural parameters of the creative sector in a society. For instance, the Euro-Creativity Index has computed the rating of creative class as one of the key components, but it does not give any rating to the value of creative or cultural industries. Nevertheless, these rising industry sectors are so important to the formation of a creative economy in a society, and therefore their shares of national economy should be duly reflected in the Creativity Index.
3.13 Recently, the regional headquarters of UNESCO in Bangkok has embarked on a study to develop a new set of indicators for measuring the “drivers” of cultural industries for Asia and the Pacific.8 The UNESCO indicators will consist of a set of drivers in relation to human
7 APEC (2002), The New Economy in APEC; OECD (2002), Measuring the Information Society; UNESCO Institute for Statistics (2003), Measuring and Monitoring the Information and Knowledge Societies: A Statistical Challenge.
8 This was developed in a series of technical meetings on data collection for cultural industries at the UNESCO Bangkok office: Internal Document for the 3rd Technical Meeting on December 6-7, 2004.
INTRODUCTION�1
capital (such as general education level, education and vocational training in creative skills and professions, creative manpower, etc.), technological development (such as innovative capability, availability of information infrastructure, etc.), market demand (such as purchasing power of the population, use of creative goods and services by other sectors’ production, domestic consumption patterns and exports) and infrastructure (including legal, institutional and financial).
3.14 There are other factors that could be turned into meaningful indicators for benchmarking the vitality and vibrancy of creativity in a city economy. As Charles Landry suggests, the “cycle of creativity” involves more complicated issues and elements that cannot be adequately and clearly reflected in educational qualifications. In depicting the cycle of creativity, Landry mentions a five-stage cycle from “enhancing ideas-generating capacity”, “turning ideas into practice”, “networking and circulating ideas”, “building platforms for delivery” to “disseminating ideas to markets and audiences”.9 At each stage, the access to and availability of institutional supports (such as family, schools and community, etc.) and cultural values and resources (such as heritage assets, cultural beliefs or practices, etc.) could significantly promote and sustain creativity in a place. The challenge of this study is to capture the characteristics of these socio-cultural parameters that are contributory to the growth of creativity and to operationalise them in quantitative terms so that they could form part of the Creativity Index.
3.15 The “Creative Community Index”, suggested by the Cultural Initiatives Silicon Valley, pinpoints the value of cultural infrastructure, social connectedness and cultural participation as well as cultural policies and investment in promoting and sustaining creativity. The “Creative Community Index” is largely compiled on the basis of opinion surveys that measure how the arts and culture operate in Silicon Valley and contribute to the business and technological innovation of the place.10
3.16 Finally, there is also relevance from the work of Colin Mercer, whose research in constructing a full set of cultural indicators for Hong Kong cannot be ignored in considering a Creativity Index.11 His attempt to incorporate the idea of value chain in the data collection framework for measuring cultural vitality and cultural participation sheds light on our discussion of cultural capital.
9 Charles Landry (2000): 224-5.
10 Cultural Initiatives Silicon Valley (2002), Creative Community Index: Measuring Progress Toward a Vibrant Silicon Valley.
11 Colin Mercer’s participation in the “Hong Kong Arts and Cultural Indicators” study commissioned by the HKADC is duly noted. His research can be found in Colin Mercer (2002), Towards Cultural Citizenship: Tools for Cultural Policy and Development.
A STUDY ON CREATIVITY INDEX ��
International and Regional Benchmarking
3.17 Once the scope and key components of the Creativity Index have been devised, the study will compare the proposed Index with other indicators that have been adopted to review the creative sectors in the neighbouring regions and cities.
3.18 The study will examine relevant studies on creative sectors and creative/cultural industries in neighbouring regions and cities, including e.g. a recent study entitled “Economic Contributions of Singapore’s Creative Industries”, in which the Ministry of Trade and Industry of Singapore has devised a benchmarking scheme (with 9 indicators) to compare the “creative capabilities” of Australia, Hong Kong, Singapore, Britain and the United States.12 Although some of these studies on city competitiveness differ from the one focusing on creative economy, they from time to time provide useful information to devise a regional framework for comparison.
3.19 Our study endeavors to create a Creativity Index that serves to reveal Hong Kong’s performance and potential over the years. It could form a basis for international and regional comparisons and further applications. We are to carry out each part of the study by i) collating existing indices, constructing new index, collect documentary data according to the new composite/enriched index; ii) by liaising with World Values Survey Team, constructing questionnaire, conducting survey, analyzing results and feeding them into our Creativity Index; and iii) by performing score calculation, international and regional comparisons if possible.
12 Toh Mun Heng, Adrian Choo, Terence Ho and Economics Division of Ministry of Trade and Industry (2003), Economic Contributions of Singapore’s Creative Industries. Other studies to be reviewed include: A Blue Book on Shenzhen’s Cultural Development (2003) and the two-volume study of creative cluster in Australia. Besides, there are growing studies on the competitive edge of cities in China, among which is An Economic Development Bluebook of Shanghai: The Creative City (2004).

INTRODUCTION��
MEASURING THE CREATIVITY OF A SOCIETY

A STUDY ON CREATIVITY INDEX ��
INTRODUCTION��
MEASURING THE CREATIVITY OF A SOCIETY
II.
A STUDY ON CREATIVITY INDEX ��
1 Creativity and Society
1.1 Creativity is central to human activity. As a core ability of mankind, it has been and continues to be our intangible asset to create something new, innovative and valuable. Creativity has been a subject of research to psychologists, sociologists and cultural theorists who are interested in studying the origins of the creative mind and creative activities particularly within the domains of the arts and culture (M. A. Boden, 2004). Recently there has been growing interests among economists in the research of creativity and a growing body of literature in which creativity is viewed as generator of innovation and source of entrepreneurship (Nelson and Winter, 1982).
1.2 The discourse in creativity has even gone beyond academic research and entered into the policy-making agenda of national and global importance. International organisations and policymakers in the public sector have placed increasing concern on the changing structure of the global economy where creative products and services form substantial portions of international trade. In addition, the rise of the creative economy or the creative sector in individual countries has become a noticeable phenomenon (UNESCO, 2000; Howkins, 2001). In summary, creativity has been recognised as an economic driver for generating wealth and employment, sustainable development of world cities, technological changes, business innovation and enhancement of competitiveness of individual cities and countries (Landry, 2000; DCMS, 2004, 2002, 2001).
1.3 Creativity is present undoubtedly in many aspects of human life. What seems novel to us in this recent craze on creativity, as Howkins says, are perhaps the rediscovered relationships of creativity in economic production, scientific and business innovation, personal and social development as well as a wide range of socio-economic aspects, which would shed light on how we live in the 21st century.
1.4 There is a strong demand among both developed and developing countries for devising analytical tools to measure a country's, city's or community's creativity. A new frontier of research has thus been opened, and more dedicated efforts are required in developing new indicators to evaluate the changing nature of society and to examine different development paths of individual societies.
1.5 Contrary to the common assumption that creativity is a spontaneous activity that happens inside our brain while activities such as handling tools, exchanging ideas in discussion or acquiring
MEASURING THE CREATIVITY OF A SOCIETY��
and transforming domain knowledge are peripheral to the "internal mental process" (Bryan Lawson, 1980), creativity takes place indeed in the interaction between a person’s thoughts and a socio-cultural context (M. Csikszentmihalyi, 1996). Interaction with other people, institutions and societal structures that embody knowledge and resources are therefore important contributors to the creative act.
1.6 The fact that creativity lives in a social context and its manifestation takes multiple forms pinpoints two salient features of creativity. First, creative activities take place in a context where social interaction is part of the process harnessing or barring creativity. That means various social, cultural or institutional factors could be contributors to the growth of creativity. Second, creativity is not a relative value, but something that could be established by external standards recognised by the community. Creativity shown in economic production and in cultural domains, for example, could be valued and appreciated by the community while creative innovation in science or human science could be recognised by the scientific and academic communities. This means "social creativity" is measurable and quantifiable although
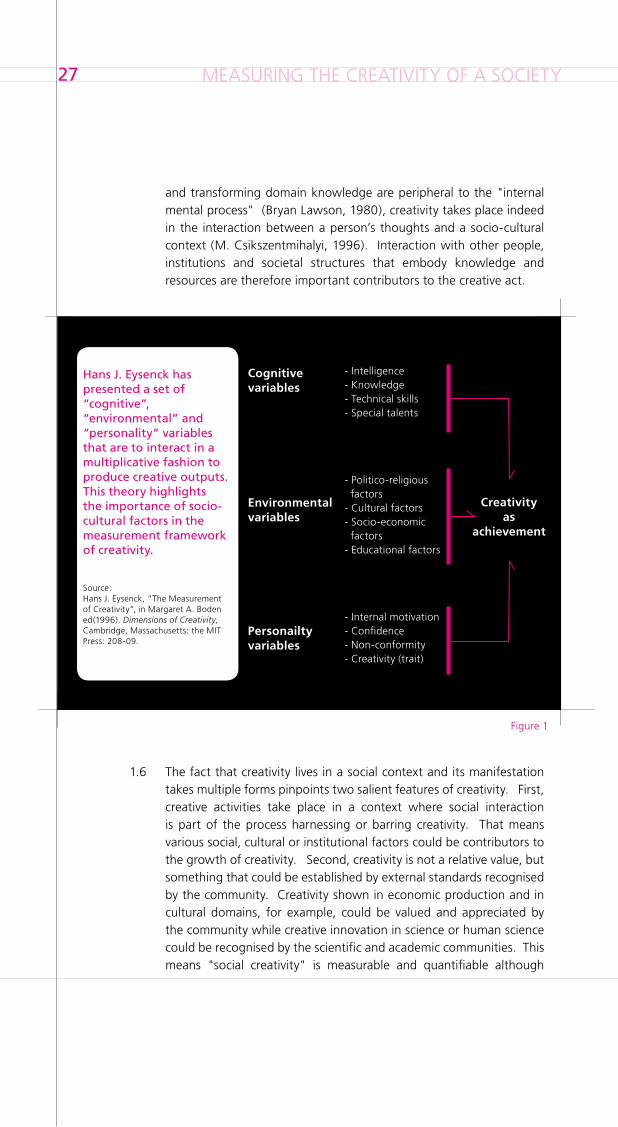
Hans J. Eysenck has presented a set of “cognitive”, “environmental” and “personality” variables that are to interact in a multiplicative fashion to produce creative outputs. This theory highlights the importance of socio-cultural factors in the measurement framework of creativity.
Source:Hans J. Eysenck, “The Measurement of Creativity”, in Margaret A. Boden ed(1996). Dimensions of Creativity, Cambridge, Massachusetts: the MIT Press: 208-09.
Cognitive variables
Environmental variables
Personailty variables
Creativity as
achievement
- Intelligence- Knowledge- Technical skills- Special talents
- Politico-religious factors- Cultural factors- Socio-economic factors- Educational factors
- Internal motivation- Confidence- Non-conformity- Creativity (trait)
Figure 1
A STUDY ON CREATIVITY INDEX ��
"daily-life creativity" is a general ability found elsewhere in our life but difficult to measure.
1.7 From an economic point of view, although one may argue that creativity is a measurable social process, it is not clear how the relationships between creativity and socio-economic development could be established. In particular, to what extent creativity contributes to economic growth, and how far enhancement of creativity comes with social and cultural configurations in society are the topics yet to be studied.
13 More elaborate analyses can be found in Chapters 13 to 14 of The Rise of the Creative Class.
14 Ibid., Chapter 14 and Appendix A. Another reference of Florida’s thesis on the relationships between bohemia, human capital and high-technology industry is found in “Bohemia and Eco-nomic Geography”, Journal of Economic Geography, 2 (2002): 55-71.
MEASURING THE CREATIVITY OF A SOCIETY��
� The “�Ts“ Model
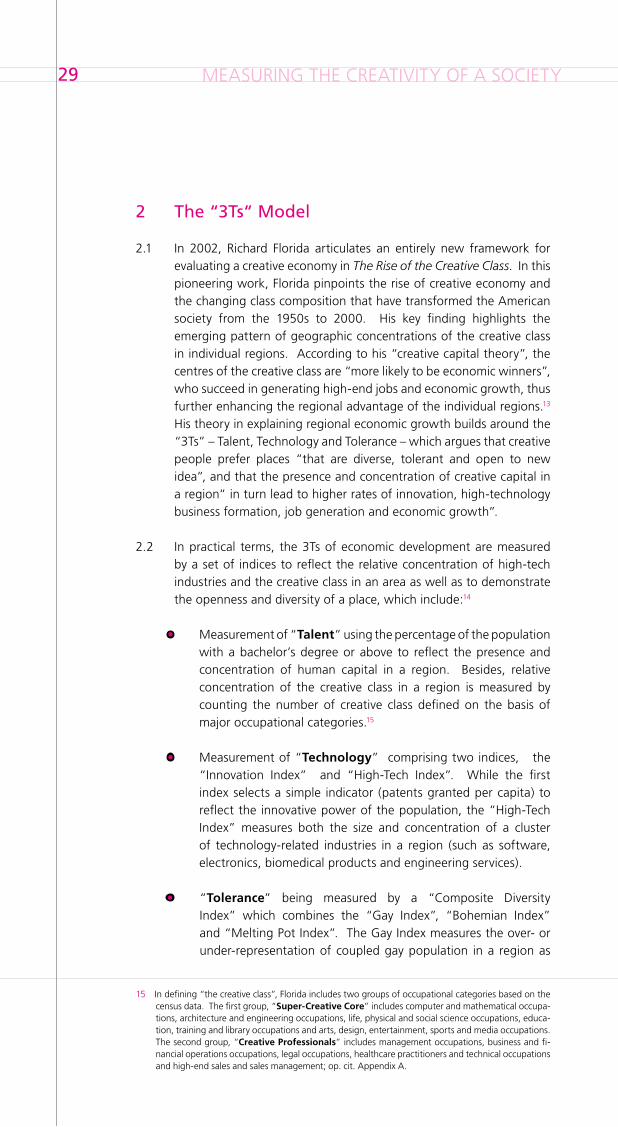
2.1 In 2002, Richard Florida articulates an entirely new framework for evaluating a creative economy in The Rise of the Creative Class. In this pioneering work, Florida pinpoints the rise of creative economy and the changing class composition that have transformed the American society from the 1950s to 2000. His key finding highlights the emerging pattern of geographic concentrations of the creative class in individual regions. According to his “creative capital theory”, the centres of the creative class are “more likely to be economic winners”, who succeed in generating high-end jobs and economic growth, thus further enhancing the regional advantage of the individual regions.13
His theory in explaining regional economic growth builds around the “3Ts” – Talent, Technology and Tolerance – which argues that creative people prefer places “that are diverse, tolerant and open to new idea”, and that the presence and concentration of creative capital in a region“ in turn lead to higher rates of innovation, high-technology business formation, job generation and economic growth”.
2.2 In practical terms, the 3Ts of economic development are measured by a set of indices to reflect the relative concentration of high-tech industries and the creative class in an area as well as to demonstrate the openness and diversity of a place, which include:14
• Measurement of “Talent” using the percentage of the population with a bachelor’s degree or above to reflect the presence and concentration of human capital in a region. Besides, relative concentration of the creative class in a region is measured by counting the number of creative class defined on the basis of major occupational categories.15
• Measurement of “Technology” comprising two indices, the “Innovation Index” and “High-Tech Index”. While the first index selects a simple indicator (patents granted per capita) to reflect the innovative power of the population, the “High-Tech Index” measures both the size and concentration of a cluster of technology-related industries in a region (such as software, electronics, biomedical products and engineering services).
• “Tolerance” being measured by a “Composite Diversity Index” which combines the “Gay Index”, “Bohemian Index” and “Melting Pot Index”. The Gay Index measures the over- or under-representation of coupled gay population in a region as
15 In defining “the creative class”, Florida includes two groups of occupational categories based on the census data. The first group, “Super-Creative Core” includes computer and mathematical occupa-tions, architecture and engineering occupations, life, physical and social science occupations, educa-tion, training and library occupations and arts, design, entertainment, sports and media occupations. The second group, “Creative Professionals” includes management occupations, business and fi-nancial operations occupations, legal occupations, healthcare practitioners and technical occupations and high-end sales and sales management; op. cit. Appendix A.
A STUDY ON CREATIVITY INDEX �0
an indirect measure of the openness and social tolerance of a given region. The Bohemian Index counts the relative population of artistically creative people in a region. It intends to provide a direct measure of producers of cultural and creative assets in an area and presupposes that the presence of this group of creative people stands for the diversity in lifestyle and robustness of creative activities. The Melting Pot Index measures the relative percentage of foreign-born people in a region. The last index is another means to measure the openness towards immigrants or outsiders in a region, whose presence can be regarded as a new driver of economic growth.
2.3 In a recent work, Florida and Tinagli apply the “3Ts” framework to the European context (Florida and Tinagli 2004). The study develops the “Euro-Creativity Index” (ECI) based on the analytical framework advanced in The Rise of the Creative Class and compares 14 European, Scandinavian and Nordic countries with the United States. Although measures of the “3Ts” in the European context differ from the indicators in The Rise of the Creative Class, the central tenet of the Euro-Study keeps the key argument that competitiveness of a country relies on its ability to attract, retain and develop creative people.
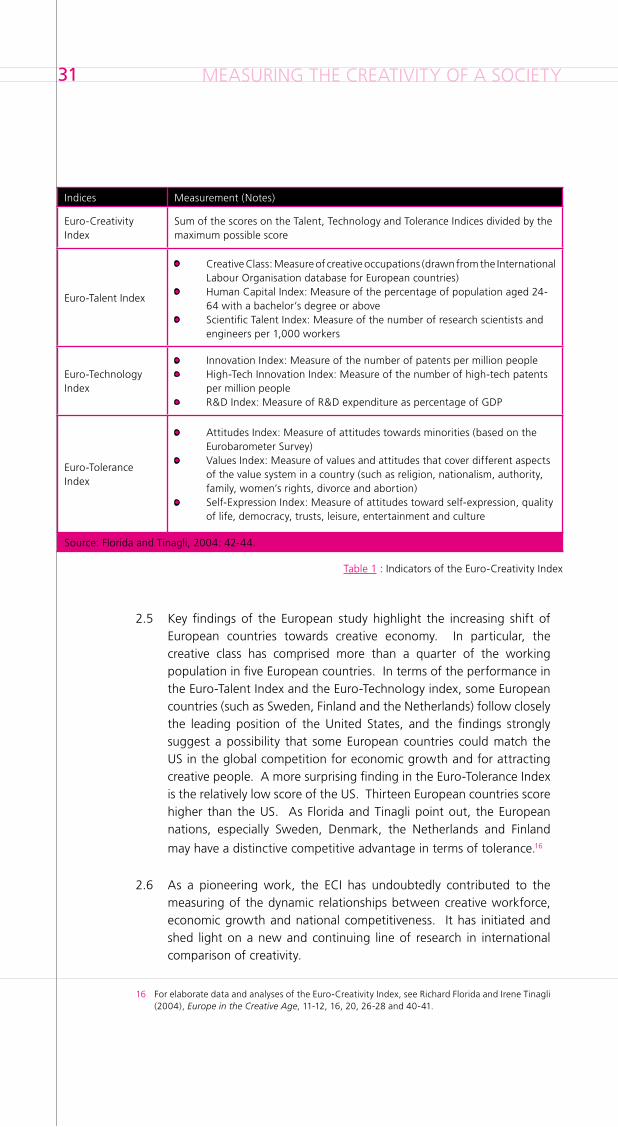
2.4 Composition of the ECI differs insignificantly from the “Creativity Index” advanced in The Rise of the Creative Class. The following table summarizes the composing indicators of the ECI.
Highlights of Florida’s Findings
By employing these indexing tools, 268 regions in the United States are ranked in terms of the “Talent Index”, “Technology Index”, “Tolerance Index”, and an overall rank (“Creativity Index”) is given to each region, which combines the first three indices with the measure of the creative class. For instance, among the 41 regions with over 1 million in population, San Francisco ranks highest in the “Technology Index” and “Tolerance Index” and fifth in the “Talent Index”. San Francisco also gets the highest score in the overall ranking of the “Creativity Index”.
Source: Richard Florida, The Rise of the Creative Class, 251; for a full list of Florida’s ranking, see Appendix 1.
MEASURING THE CREATIVITY OF A SOCIETY�1
2.5 Key findings of the European study highlight the increasing shift of European countries towards creative economy. In particular, the creative class has comprised more than a quarter of the working population in five European countries. In terms of the performance in the Euro-Talent Index and the Euro-Technology index, some European countries (such as Sweden, Finland and the Netherlands) follow closely the leading position of the United States, and the findings strongly suggest a possibility that some European countries could match the US in the global competition for economic growth and for attracting creative people. A more surprising finding in the Euro-Tolerance Index is the relatively low score of the US. Thirteen European countries score higher than the US. As Florida and Tinagli point out, the European nations, especially Sweden, Denmark, the Netherlands and Finland
may have a distinctive competitive advantage in terms of tolerance.16
2.6 As a pioneering work, the ECI has undoubtedly contributed to the measuring of the dynamic relationships between creative workforce, economic growth and national competitiveness. It has initiated and shed light on a new and continuing line of research in international comparison of creativity.
Indices Measurement (Notes)
Euro-Creativity Index
Sum of the scores on the Talent, Technology and Tolerance Indices divided by the maximum possible score
Euro-Talent Index
• Creative Class: Measure of creative occupations (drawn from the International Labour Organisation database for European countries)
• Human Capital Index: Measure of the percentage of population aged 24-64 with a bachelor’s degree or above
• Scientific Talent Index: Measure of the number of research scientists and engineers per 1,000 workers
Euro-Technology Index
• Innovation Index: Measure of the number of patents per million people• High-Tech Innovation Index: Measure of the number of high-tech patents
per million people• R&D Index: Measure of R&D expenditure as percentage of GDP
Euro-Tolerance Index
• Attitudes Index: Measure of attitudes towards minorities (based on the Eurobarometer Survey)
• Values Index: Measure of values and attitudes that cover different aspects of the value system in a country (such as religion, nationalism, authority, family, women’s rights, divorce and abortion)
• Self-Expression Index: Measure of attitudes toward self-expression, quality of life, democracy, trusts, leisure, entertainment and culture
Source: Florida and Tinagli, 2004: 42-44.
Table 1 : Indicators of the Euro-Creativity Index
16 For elaborate data and analyses of the Euro-Creativity Index, see Richard Florida and Irene Tinagli (2004), Europe in the Creative Age, 11-12, 16, 20, 26-28 and 40-41.
A STUDY ON CREATIVITY INDEX ��
� Beyond Economic Contributions of Creativity
3.1 The Euro-Creativity Index and the work of Florida have contributed significantly to our understanding of creativity and economy. However, we believe that the overall assessment of creativity of a country (or city) should be much broader in scope and should certainly go beyond economic measures. In the following sections we will explore other indicators that could measure the diverse outcomes of creativity in a society.
3.2 We put forward an argument that the nurture of creativity in a society is attributed to many factors and its outcome manifested in many forms. Our framework aims to measure creativity in a society not only in terms of economic contribution but also the various manifestations and diversities of inventive activities. It also articulates a more comprehensive analysis in explaining the dynamics between the growth of creativity, institutions and socio-cultural values which might be different among the developed and developing countries.
3.3 The Euro-Creativity Index and Creative Capital Theory are frameworks to test the hypothesis whether high levels of the creative capital, technological development and social tolerance do promote economic growth. We believe that creativity as a driver of our local economy may lead to different paths of economic development. While the relative concentration of the creative class correlates with the growth of high-tech industries may be true in Europe or the United States, the dynamic relationship between economic development and creativity in the Asian context may be different.
3.4 A question could be asked: are the measures of high-tech industries and their correlation with the creative class the only indicators to reflect the diverse economic benefits as a result of creativity in a society? In other words, creativity may unleash chains of economic production that could result in variegated outcomes. Economic development of some countries may depend on innovation in the technology sectors while others on a balanced mix of creative / cultural industries and servicing industries or manufacturing of creative goods or delivery of creative services.
3.5 The economic conditions conducive or unfavorable to the “economic production of creativity” may be significantly different among individual countries. This divergence in economic condition is a determinant factor that shapes the economic development of Asian countries. Take the role of Small-and-Medium Enterprises (SMEs) as an example, some scholars have pointed out that adaptable SMEs in Southeast Asia and East Asia are the source of entrepreneurship.
MEASURING THE CREATIVITY OF A SOCIETY��
Their economic importance in promoting economic growth in the Post Asian Financial Crisis is noticeable (Hew, Denis and Loi Wee Nee, 2004).
3.6 The economic slowdown since 1997-98 has resulted in a striking retreat of Foreign Direct Investment (FDI) from Asia, which has undermined the vitality of many Southeast Asian countries heavily dependent on FDI for their development of local manufacturing industries. However, SMEs in some Asian countries have rebounded and demonstrated rapid recovery from the crisis (Sandee, Henry and Jan ter Wengel, 2004). The entrepreneurship and vitality of SMEs and the relative change of FDI in Asia are the enduring features of the Asian economic growth. We believe these factors will remain as determinants of the development of creative economy in the region in future.
3.7 Outputs of creative act measured in non-monetary terms are important signals of the vibrancy of creativity in general. The overall increase in creativity of a country should benefit social, cultural and economic sectors as a whole, and therefore, the increase of creative production would result not just in economic products and services, but material and non-material values that are central to social and economic life of the population.
3.8 These non-monetary creative outcomes include the production of music, songs, lyrics, books, periodicals, films, inventions, design, artifacts, arts and cultural programmes as well as a wide range of creative activities which could produce intangible value equivalent to that of “public goods”, embodying knowledge, inspirations, aesthetics and symbolic meaning beneficial to the social and cultural development of creative minds and abilities.
A STUDY ON CREATIVITY INDEX ��
� Creativity, Institutions and Values
4.1 In the framework of the Euro-Creativity Index and Creative Capital Theory, the “3Ts” are mutually reinforcing. Put briefly, as Florida may argue, high level of diversity and social acceptance of outsiders will attract more talents to a place, thus creating a conducive environment to new ideas and innovation. This general idea holds true, but the social process embracing creativity is more complicated that a number of social, cultural and institutional factors may harness, sustain or constrain creativity. The increase of creativity in a society and the relative advantage of one region over the others could be attributed to the interplay of various determinants including the human, institutional, social and cultural factors. These variables work together as a milieu to determine the growth of creativity.
4.2 It is generally agreed that some institutional or infrastructural conditions are vital to the socio-economic development of a country. The role of information and communication technologies (ICT), for instance, is recognised as a major source of economic and social change (OECD, 2002). Other institutional factors such as labour productivity, corporate governance, structure of financial market and legal system as well as public policies have long been regarded as determinants of competitiveness of a country (Schwab and Porter, 2003).
4.3 We believe that any framework in explaining the growth of creativity should include some of these institutional factors into consideration. The reason is simple. It would be hard to argue that creativity can prosper in a society if there is weak protection and enforcement of intellectual property rights. It is also dubious that creative ideas could turn into valuable goods and services if the financial, economic and social structures of a society work against them. In short, creativity needs the institutional backup and support to thrive and prosper.
4.4 As regards “social” and “cultural” capital, they are not highly valued in Florida’s Creative Capital Theory. In The Rise of the Creative Class, he rejects the notion of “social capital” to be a useful concept to explain economic growth. According to Florida, a community with high levels of social capital (defined in terms of reciprocity, mutual respect, trust and civic-mindedness) could badly generate economic prosperity. And he concludes that “our evolving communities and emerging society are marked by a greater diversity of friendships, more individualistic pursuits and weaker ties within the community”, and “[places] with dense ties and high levels of traditional social capital provide advantages to insiders and thus promote stability, whereas places with looser
MEASURING THE CREATIVITY OF A SOCIETY��
networks and weaker ties are more open to newcomers and thus promote novel combinations of resources and ideas.”17
4.5 There are different forms of social capital. What Florida objects to is the approach of social capital advanced by Putnam (Putnam, 1993 and 2000). The notion of social capital is actually still evolving, and there are always different emphases on its components. For instance, in a recent study of the Saquaro Seminar Project, the report places high value of social capital on trust towards outsiders, trust between different ethnic groups, leadership, diversity of social networks and ties as well as equality and civic participation (Saquaro Seminar, 2001). Some of these values should be endorsed by the Creative Capital Theory for Florida and his empirical tests indeed depend very much on the World Values Survey which also incorporates a lot of indicators on attitudes towards social diversity and acceptance.
4.6 We do recognise effective norms can constitute a powerful form of social capital that may reduce innovativeness than harness creativity (Coleman, 2000). Our subscription to the social capital theory will be highly selective: those components of social capital highly valued in terms of diversity, social inclusiveness, trust and mutual co-operation will be more receptive in our framework.
4.7 We believe cultural capital also contributes to the growth of creativity, which refers to the value placed on the arts and culture as well as practices that promote creative acts. It also means personal abilities nurtured and articulated in the course of cultural participation. Cultural value and practices are always twins of creativity, and there is a strong correlation between the process of creation and cultural inputs (Graham, 2002; Mercer, 2002; Evans, 2001). We subscribe to the view that high levels of cultural capital in a community would sow the seeds of creativity and innovation. As a recent study on the cultural development of Silicon Valley shows, cultural assets (cultural amenities) provide a basis for public participation in the arts and culture, and the “accumulated results of this participation are measurable outcomes, such as increased feelings of connectedness to neighbours or heightened sense of community identification as a result of living in an aesthetically inspiring environment.” (Cultural Initiatives Silicon Valley, 2003).
4.8 We could put the preceding discussion in an Asian perspective. The institutional settings in support of innovation and creativity in Asia could be different from the developed countries in the West: there are observable differences such as in the financial and labour
17 Richard Florida (2002), 269 and 273.
A STUDY ON CREATIVITY INDEX ��
markets, infrastructural settings in ICT, educational or legal system that support the growth of creativity. Asian values, defined in terms of family values, social networks and attitudes towards self-expression, neighbourhood, diversity, freedom, the arts and culture, etc. are remarkably different not only between the developed and developing countries but also within the region itself. This implies that the interplay of the various factors (human, institutional, social and cultural) in Asian countries may generate a diverse pattern of growth in creativity. This Asian factor, however, has not been fully addressed in any existing model of creativity index, and that highlights our task to construct an alternative framework for measuring creativity that would work also for societies in this region.

MEASURING THE CREATIVITY OF A SOCIETY��

A STUDY ON CREATIVITY INDEX ��
ESTABLISHING THE CREATIVITY INDEX��
ESTABLISHING THE CREATIVITY INDEX
III.
A STUDY ON CREATIVITY INDEX �0
1 Approach and Framework of the Creativity Index
1.1 The Creativity Index (CI) is a new statistical framework for measuring the status of creativity and the determinants of the growth of creativity in a place. It is not merely a measurement of the economic outcomes of creativity, but also the flow of creative activities and the relative strength of determinant factors that contribute to the growth of creativity. The Creativity Index builds on various theoretical foundations, including the “Creative Capital Theory” advanced by Richard Florida and the conceptual frameworks derived from human, social and cultural capital.
1.2 The point of departure for building the CI starts from a simple idea that a creative act can be mapped by using and applying the conception of a “cycle of creative activity”. The ability to create and make something new and valuable is an internal process of social actors. That means individual persons, private corporations and agents in public sector could develop their own skills, knowledge and resources in and devote their time and commitment to different forms of creative activities. This forms our basic argument that creativity is a social process continuously shaped and constrained by the values, norms, practices and structures of “Social Capital”, “Cultural Capital” as well as the development of “Human Capital”. While the ability to create is embedded in the contexts of three forms of capital, its articulation would be promoted or constrained by the availability and accessibility of facilities, institutions, market and social enablers, or in short the “Structural/Institutional Capital”. The accumulated effects and interplay of these different forms of capital are the “Outcomes of Creativity” which could be measured in terms of economic outputs, incentive activities and any other forms of creative goods, services and achievements.
1.3 The basic idea of the 5Cs forming the Creativity Index can be portrayed in the following diagram.
1.4 This framework defines the scope of the CI, introduces important concepts and organises them into a logical structure. Key features of this model are:
• Four forms of capital (structural/institutional, human, social and cultural) are the determinants of growth of creativity.
• Accumulated effects of the interplay of these determinants are the manifestations of creativity in terms of outcomes or outputs.
ESTABLISHING THE CREATIVITY INDEX�1
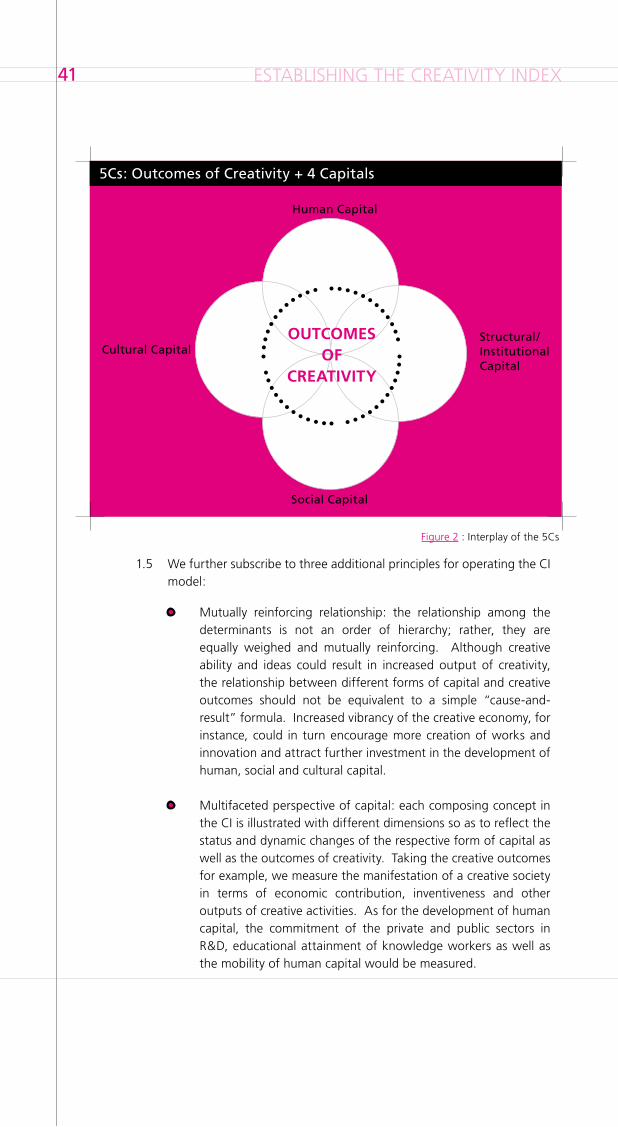
1.5 We further subscribe to three additional principles for operating the CI model:
• Mutually reinforcing relationship: the relationship among the determinants is not an order of hierarchy; rather, they are equally weighed and mutually reinforcing. Although creative ability and ideas could result in increased output of creativity, the relationship between different forms of capital and creative outcomes should not be equivalent to a simple “cause-and-result” formula. Increased vibrancy of the creative economy, for instance, could in turn encourage more creation of works and innovation and attract further investment in the development of human, social and cultural capital.
• Multifaceted perspective of capital: each composing concept in the CI is illustrated with different dimensions so as to reflect the status and dynamic changes of the respective form of capital as well as the outcomes of creativity. Taking the creative outcomes for example, we measure the manifestation of a creative society in terms of economic contribution, inventiveness and other outputs of creative activities. As for the development of human capital, the commitment of the private and public sectors in R&D, educational attainment of knowledge workers as well as the mobility of human capital would be measured.
Human Capital
Social Capital
Structural/Institutional Capital
Cultural Capital
Figure 2 : Interplay of the 5Cs
OUTCOMESOF
CREATIVITY
�Cs: Outcomes of Creativity + � Capitals
A STUDY ON CREATIVITY INDEX ��
• Dynamic relationships between creativity, economy and society: the CI is devised to capture different aspects of creativity and their impacts on local economy and society. It provides analysts and policy makers with a tool to evaluate the performance of a creative society in terms of its outcomes and to examine the relative strengths and weaknesses in the factorial development of major contributors that promote the growth of creativity.
1.6 The indicators of the CI are validated statistically by the Principal Component Analysis (PCA), a method to establish the correlation and integrity of the CI and its sub-indices. This report presents only the components and findings of the CI while details of the statistical validation, computing and modeling methods used will be reported separately.
ESTABLISHING THE CREATIVITY INDEX��
� Establishing the Creativity Index: Measuring Outcomes of Creativity
2.1 The Creativity Index identifies five broad domains related to the outcomes of creativity and contributors which are determinants of the growth of creativity. In the following sub-sections, we will introduce major concepts adopted in our framework, justify their relevance and present the proposed indicators that comprise the CI.
2.2 Creative activities and innovations generate not only economic outputs measured in terms of performance indicators (such as value-added to GDP, value of trade, etc.), but also outcomes shared and transacted among the populace. While economic outputs stand for the growth of creative economy and its potential of generating wealth and employment, other inventive outcomes present the general landscape, vitality and vibrancy of creative activities in a community. These two aspects of creative outputs, delineated in terms of economic and non-economic achievements, represent broadly the levels of creativity attained in the society.
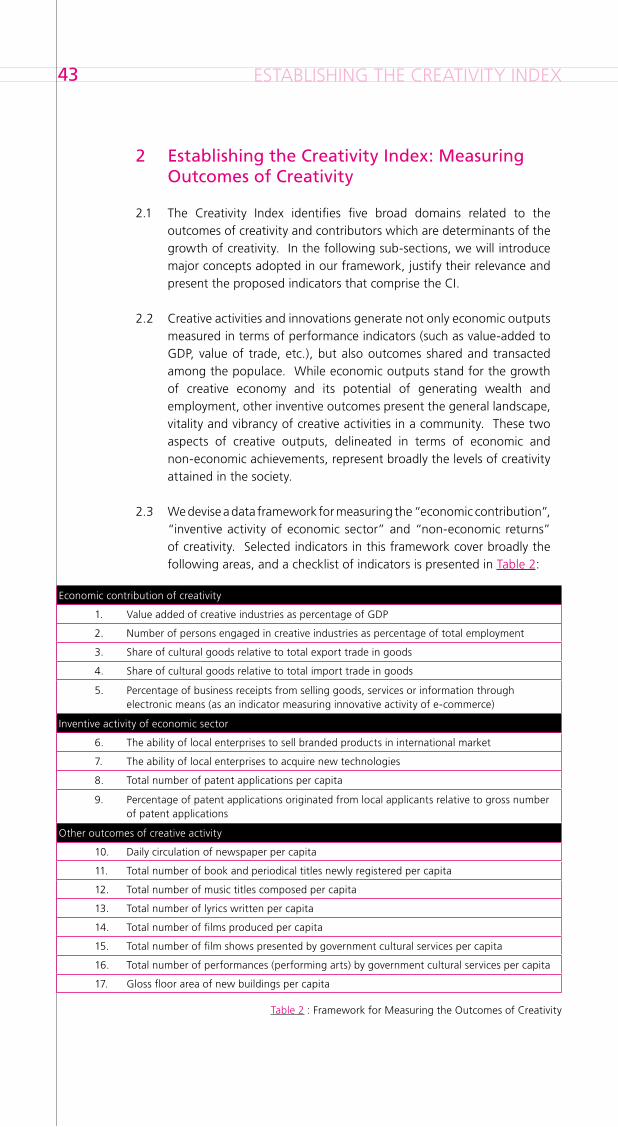
2.3 We devise a data framework for measuring the “economic contribution”, “inventive activity of economic sector” and “non-economic returns” of creativity. Selected indicators in this framework cover broadly the following areas, and a checklist of indicators is presented in Table 2:
Table 2 : Framework for Measuring the Outcomes of Creativity
Economic contribution of creativity
1. Value added of creative industries as percentage of GDP
2. Number of persons engaged in creative industries as percentage of total employment
3. Share of cultural goods relative to total export trade in goods
4. Share of cultural goods relative to total import trade in goods
5. Percentage of business receipts from selling goods, services or information through electronic means (as an indicator measuring innovative activity of e-commerce)
Inventive activity of economic sector
6. The ability of local enterprises to sell branded products in international market
7. The ability of local enterprises to acquire new technologies
8. Total number of patent applications per capita
9. Percentage of patent applications originated from local applicants relative to gross number of patent applications
Other outcomes of creative activity
10. Daily circulation of newspaper per capita
11. Total number of book and periodical titles newly registered per capita
12. Total number of music titles composed per capita
13. Total number of lyrics written per capita
14. Total number of films produced per capita
15. Total number of film shows presented by government cultural services per capita
16. Total number of performances (performing arts) by government cultural services per capita
17. Gloss floor area of new buildings per capita
A STUDY ON CREATIVITY INDEX ��
2.4 Key areas covered by the indicators are:
• Economic contribution of creative industries • Size of working population engaged in the creative industries • Trade value of the creative industries • Economic contribution of e-commerce • Inventive ability of business sector • Innovation activity in terms of applications of patent
• Creativity activity (non-economic indicators) in the creative sector and in arts and culture
2.5 There are 17 indicators comprising 3 sub-indices of the “Outcomes of Creativity Index” (OCI). Indicators 1 to 5 measure the relative share of creative industries, cultural trade and the economic returns driven by electronic commerce in local economy. These indicators are the benchmarks of the vitality and sustainability of a creative economy. Creativity not only creates wealth but could also be the economic activity of knowledge creation, diffusion and adaptation, or a process of creating new values on products and services. Indicators 6 to 9 therefore measure the brand-building ability of local enterprises, the extent of technology diffusion in local firms as well as knowledge creation in terms of patent applications. Besides, the OCI takes non-economic returns of creativity into consideration. It includes 8 indicators (from 10-17), measuring the quantity of inventive activities including the outputs of media production, books & literature, music, film, performing arts and architecture.
ESTABLISHING THE CREATIVITY INDEX��
� Measuring Structural/Institutional Capital
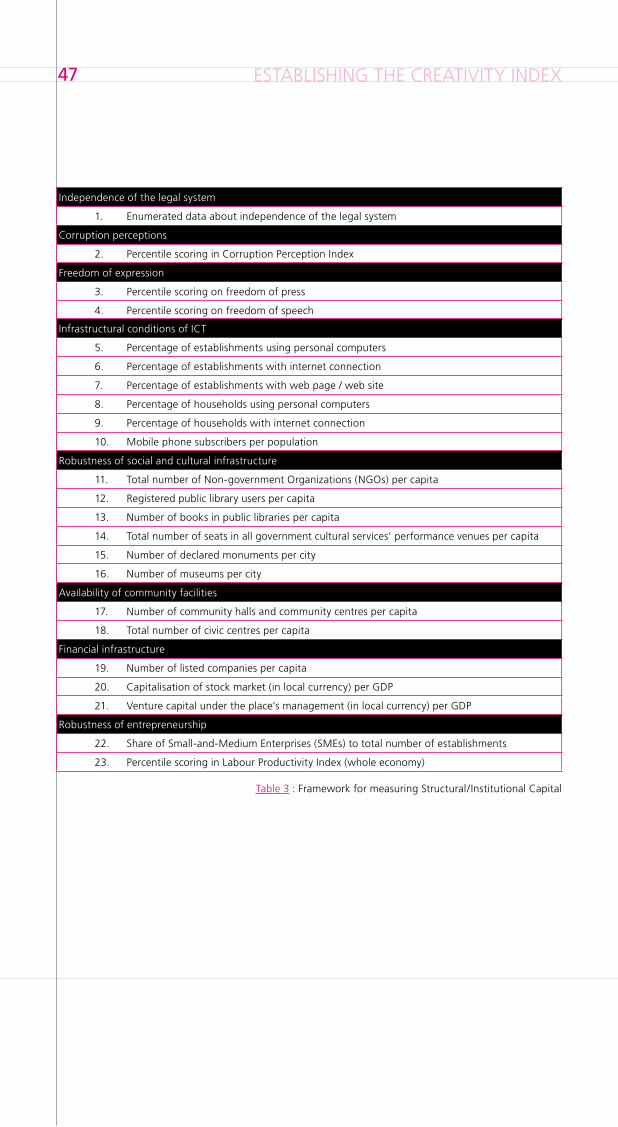
3.1 The CI framework identifies eight types of societal conditions – “legal system”, “corruption”, “freedom of expression”, “information and communication technologies (ICT) infrastructure”, “social and cultural infrastructure”, “community facilities”, and “financial infrastructure” as well as “entrepreneurship” – which comprise the “Structural/Institutional Capital Index” (SICI). It is recognised that these socio-economic and cultural conditions provide the context in a community where creativity takes place. More importantly, they provide the context for the development and protection of creativity as well as determining the conditions of utilisation and distribution of other forms of capital.
3.2 Some sets of indicators in the “Structural/Institutional Capital” framework have been recognised and used in international studies for the comparison of national competitiveness while others are interdependent on other forms of capital. For instance, indicators adopted for measuring “legal system” and “freedom of expression” have been used in the Global Competitiveness Report, and indicators on ICT infrastructure are some of the measures proposed by the OECD for measuring the emerging information economy.
3.3 The measures of legal institution, perceptions of corruption and freedom of expression are also relevant, and they form three sub-indices of the SICI. An independent legal system is imperative for dispute resolution and rights protection, and both elements are vital to the smooth operation of commercial activities. Due to the lack of local data, the current framework of SICI has not included any measure on the protection of intellectual property rights but its importance is reckoned to be included in the future. Corruption is a menace to economic growth, and it would undermine the social and economic fabric of a society by endangering the culture of meritocracy and fair competition. Perceptions of corruption in a place therefore provide us with indirect measurement of the negative impact brought by corruption. These societal conditions, in addition to a robust environment that favors freedom of expression, are vital to any creative production in the economy. All in all, measures of legal institutions and the status of freedom of expression demonstrate the regulatory and institutional standards in which exchange of ideas, access to information and social participation take place.
3.4 Our framework also includes a set of sub-indices on “ICT infrastructure”, “social and cultural infrastructure”, “community facilities”, “financial infrastructure” and “entrepreneurship”. Social and cultural facilities or institutions such as the vitality of NGOs and cultural facilities such as
A STUDY ON CREATIVITY INDEX ��
public libraries, performance venues or museums are the spaces where social and cultural activities take place. Their availability and extent of use in a community is an important condition for the development of social and cultural capital. By the same token, penetration of computers and access to internet in household and in the commercial world are facilities available for social contacts, dissemination of information and exchange of ideas. A place with poor set-up of these facilities will constrain the social and cultural participation and hence creative activities in general while the opposite may imply greater chance to use and more favorable physical conditions for the development of creativity.
3.5 Entrepreneurship and financial infrastructure are two important variables shaping the economic environment of creative economy. As we argued previously, the dominant presence of SMEs in Asia provides a context where entrepreneurship nurtures, and where Asian companies develop large extent of adaptability and flexibility in business operation. This condition may fit into the emerging structure of creative economy, in which small-and-medium firms specialised on production of symbolic goods or offering value-added services mushroom. Developing structure of financial markets in Asia also plays a key role in promoting the creative economy. Financial resources are fuel of economic innovation and production. The vitality and development of high-tech industries, ICT or creative industries in the region depends very much on the flow of these resources. Although our data does not support a direct measure of financial investment in these sectors, an overall measure of financial infrastructure in terms of capitalisation in stock market and size of venture capital funds could provide us with some general measures on the macro financial environment for the growth of creative economy.
3.6 A checklist of indicators for the “Structural/Institutional Capital Index” is presented in Table 3:
ESTABLISHING THE CREATIVITY INDEX��
Table 3 : Framework for measuring Structural/Institutional Capital
Independence of the legal system
1. Enumerated data about independence of the legal system
Corruption perceptions
2. Percentile scoring in Corruption Perception Index
Freedom of expression
3. Percentile scoring on freedom of press
4. Percentile scoring on freedom of speech
Infrastructural conditions of ICT
5. Percentage of establishments using personal computers
6. Percentage of establishments with internet connection
7. Percentage of establishments with web page / web site
8. Percentage of households using personal computers
9. Percentage of households with internet connection
10. Mobile phone subscribers per population
Robustness of social and cultural infrastructure
11. Total number of Non-government Organizations (NGOs) per capita
12. Registered public library users per capita
13. Number of books in public libraries per capita
14. Total number of seats in all government cultural services’ performance venues per capita
15. Number of declared monuments per city
16. Number of museums per city
Availability of community facilities
17. Number of community halls and community centres per capita
18. Total number of civic centres per capita
Financial infrastructure
19. Number of listed companies per capita
20. Capitalisation of stock market (in local currency) per GDP
21. Venture capital under the place’s management (in local currency) per GDP
Robustness of entrepreneurship
22. Share of Small-and-Medium Enterprises (SMEs) to total number of establishments
23. Percentile scoring in Labour Productivity Index (whole economy)
A STUDY ON CREATIVITY INDEX ��
� Measuring Human Capital
4.1 Investment in human capital has long been recognised as an effective factor to promote economic growth. In studies of a broad set of countries including developed and developing countries, standard measures of human capital based on educational attainment seems to suggest a positive effect on countries’ GDP in the short run and on economic growth in the long run (Barro, 2001).18 Richard Florida even argues that the concentration of the creative class in a region attracts more “talents” (defined in terms of persons with higher educational attainment) and in turn, promotes further economic prosperity.
4.2 We support the premise that human capital is crucial to the growth of economy. Therefore, our “Human Capital Index” (HCI) takes into account R&D expenditure, the size of R&D personnel and groups of population with higher educational qualification as the key indicators to show a community’s investment in innovation activity and to demonstrate the levels of achievement in human capital development.
4.3 We add some new indicators in the framework to reflect the multifaceted aspects of human capital development. A set of indicators on population movement is established in our framework. Mobility of human capital forms one aspect of this movement. As we believe, high levels of transient population (in terms of foreign workers) will facilitate cultural exchange, transfer of skills and knowledge as well as generation of new ideas. Arrivals, resident departures and number of emigrants, on the other hand, show another aspect of population movement. It is generally recognised that number of arrivals is a strong indicator of tourism, which may imply the attractiveness and hospitality of a place and likewise, conditions conducive to international cultural exchange. Similarly, outgoing population (such as resident departures or emigrants) could be a suggestive indicator of cultural exchange and greater international exposure.
4.4 In short, the “Human Capital Index” comprises three sub-indices. Firstly, by measuring R&D expenditure and government expenditure in education, we examine the extent of a community to provide a favorable context for the development of “knowledge bank”. Secondly, by measuring the size of R&D personnel and number of population with higher degrees, this sub-index indicates the growing community and availability of knowledge workers. Finally, we subscribe to the view that mobility of human capital and population can indicate various social conditions conducive to cultural exchange, exchange of skills and knowledge and international exposure. These qualities of human capital development will reinforce the strength of other forms of capital and contribute to the growth of collective creativity.
18 Another reference on human capital research is Serge Coulombe, Jean-François Tremblay, and Sylvie Marchand(2004), International Adult Literacy Survey: Literacy Scores, Human Capital and Growth Across Fourteen OECD countries, Canada: Statistics Canada.
ESTABLISHING THE CREATIVITY INDEX��
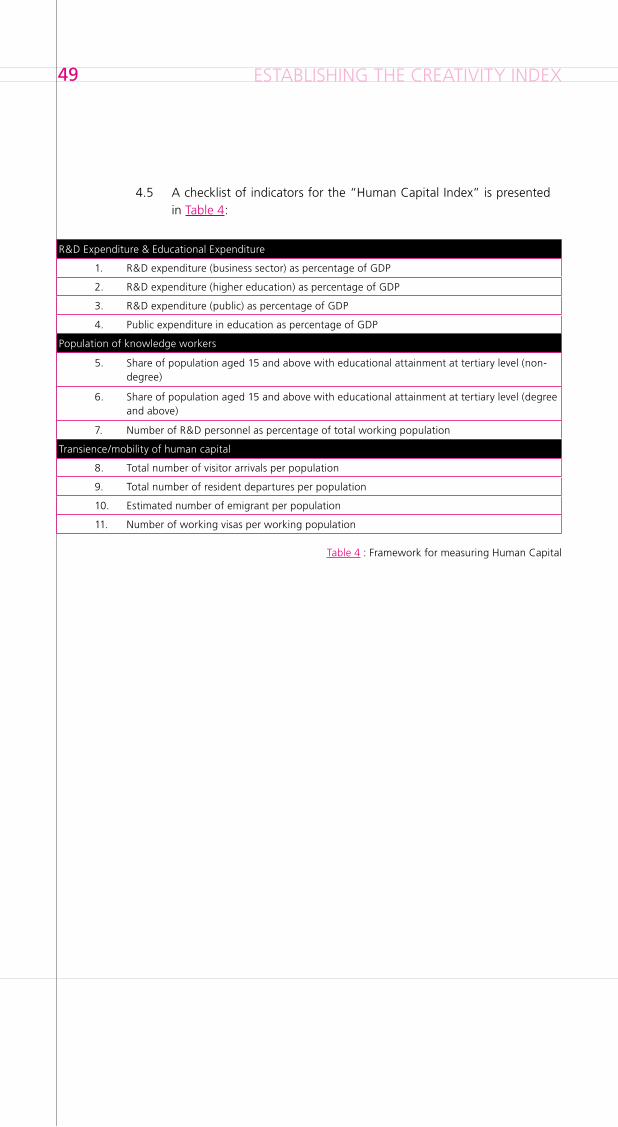
4.5 A checklist of indicators for the “Human Capital Index” is presented in Table 4:
R&D Expenditure & Educational Expenditure
1. R&D expenditure (business sector) as percentage of GDP
2. R&D expenditure (higher education) as percentage of GDP
3. R&D expenditure (public) as percentage of GDP
4. Public expenditure in education as percentage of GDP
Population of knowledge workers
5. Share of population aged 15 and above with educational attainment at tertiary level (non-degree)
6. Share of population aged 15 and above with educational attainment at tertiary level (degree and above)
7. Number of R&D personnel as percentage of total working population
Transience/mobility of human capital
8. Total number of visitor arrivals per population
9. Total number of resident departures per population
10. Estimated number of emigrant per population
11. Number of working visas per working population
Table 4 : Framework for measuring Human Capital
A STUDY ON CREATIVITY INDEX �0
� The Concepts of Social and Cultural Capital
5.1 We believe the third T raised by Florida – Tolerance Index – is innovative and important for a study of this nature. The index captures the less tangible, but crucial aspect in assessing the creative edge of a world city. It has now been widely acknowledged that while technology and talent are indispensable assets of a creative economy, whether a city has a cultural milieu which attracts, mobilises and sustains creativity is equally important. Florida and Tinagli’s study made use of the findings of the World Values Survey to construct an index that taps and compares selected European nations’ value preferences concerning diversity, openness and self-expression. The resultant scores reveal that a high level of ‘tolerance” is closely associated with other indices on talent and technology as well as the overall economic dynamism of a nation.
5.2 We develop a similar version of the “tolerance index” for measuring Hong Kong’s performance and potential in this respect. We also seek to expand on the index by making a conceptual distinction between two aspects of the social milieu that help generate and sustain creativity.
5.3 The first aspect pertains to what many scholars call “social capital”. This refers to the social networks that people in a place are enmeshed in. It has been demonstrated by waves of studies in various countries since the 1970s that trust, reciprocity, information, and cooperation associated with rich social networks are conducive to a heightened sense of collective well-being, social expression and civic engagement. All these in turn enable individual and collective creativity to flourish. In the words of Putnam, “social capital creates value for the people who are connected”. We shall, mainly through the World Values Survey, gauge Hong Kong people’s norms and values with regard to social network and their actual patterns of social participation. In particular, we shall collect data and create indices on the following areas:
• Generalised trust• Institutional trust• Reciprocity• Sense of efficacy• Cooperation• Acceptance of diversity and inclusiveness• Attitudes towards human rights• Attitudes towards foreign immigrants• Espousal of modern values• Self-expression• Participation in politics• Social participation including voluntary work, barriers to social
ESTABLISHING THE CREATIVITY INDEX�1
participation, membership of clubs and organizations and intensity of social contacts.
5.4 As mentioned above, the study of social capital is relatively well established in various parts of the world. Researchers commonly agree that the above selected areas constitute the core aspects of people’s life that reveal the quality of the social capital within a community.19
5.5 The second aspect of the social milieu conducive to creativity pertains to “cultural capital”. The term has been variously defined and used in scholarly literature. The notion of cultural capital outlined by the sociologist Pierre Bourdieu means the “cultivated disposition and cultural competence” that are revealed in the nature of the cultural goods consumed, and in the way they are consumed (Bourdieu, 1979). It refers to cultural practices and preferences in a group of social agents whose cultural propensity links closely with educational capital, tastes, social breeding and social origins. However, the term has been enriched with new meanings and interpretations in recent decades. Colin Mercer, for example, puts forward a new framework to review the social and cultural fabric of contemporary society, in which cultural capital is viewed as resource for problem solving and a driver for creation as well as ways of cultural consumption or participation. In the Creative Community Index study carried out by Cultural Initiatives Silicon Valley, the notion of cultural capital refers to the more specific activities and qualities relating to culture, the arts and creativity in everyday life.20
5.6 In this study we adopt the new interpretation of cultural capital advanced by Mercer and the Creative Community Index study, which is concerned with the degree in which people in community value creative activities not directly related to economic returns. Such creative activities often manifest themselves in but are not confined to, different forms of arts and performance, as an attitude to innovation can reveal itself in the everyday life context of work and social activities. The assumption is that, following the Silicon Valley Study, cultural participation can produce new ideas and expressions and hence enhance creativity in a broad sense. A community has large cultural capital and hence creative potential, if its people value different forms of arts and cultural activities and have wide access to them, if they are able to invest time and effort in such activities, and are eager and able to cultivate among the younger generation an embracement of the arts and culture.
5.7 Through a combination of data sources and types, we create in this study indices pertaining to the norms and values towards the patterns
19 For relevant studies on social capital, see the Social Capital Community benchmark Survey conducted by John F. Kennedy School of Government at Harvard University (http://www.cfsv.org/communitysurvey/); and Robert Putnam’s related work (http://www.bowlingalone.com/socialcapital.php3); the sources listed in Management Alternatives Pty Ltd Australia (http://www.mapl.com.au/A13.htm), and The World Values Survey led by Ronald Inglehart at University of Michigan (http://www.worldvaluessurvey.org/organization/index.html).
20 Cultural Initiatives Silicon Valley (2003). Creativity Community Index Study: Measuring Progress Toward A Vibrant Silicon Valley (http://www.ci-sv.org/index.shtml).
A STUDY ON CREATIVITY INDEX ��
of participation in arts and cultural activities. We gauge in particular the value that Hong Kong people place on creative activity, on the arts and culture in their personal development, and their assessment on whether their social milieu including work, community, and government acts are conducive to their cultural and creative pursuit. We also gather data relating to actual form and extent of participation in arts and cultural activities by different sections of the population.
ESTABLISHING THE CREATIVITY INDEX��
� Measuring Social Capital
6.1 Most of the data on social capital and cultural capital relate to the values and norms held by the population. The best method to tap such data is a social survey, which is a well-established practice among scholars working on related issues. We conduct a fresh survey to gauge such values among local residents. To ensure the international comparability of the indices, we draw on the World Values Survey’s format and questions, revise and enrich them where necessary to make them pertinent to local conditions. We carry out a face-to-face territory-wide survey of around 1,200 residents of Hong Kong, tapping their values and practices with regard to the dimensions of social and cultural capital discussed above. We have liaised with the World Values Survey team headed by Ronald Inglehart at the University of Michigan to make use of the questionnaire and access the relevant data.
6.2 The results can hence be directly compared to highly similar data sets for the 65 nations/places (including those in the Asian region) under the rubric of the World Values Survey as well as the Euro-Creativity index produced by Florida and Tinagli. The results from the survey will help us construct indices of social and cultural capital that serve as a baseline for assessing the potential of Hong Kong in sustaining a social and cultural environment that nurtures, attracts and mobilises creative talents. The resultant index will also shed light on how Hong Kong compares with its Asian neighbours and global partners and competitors in the long run.
6.3 Apart from the measures of people’s norms, values and their social participation, our data framework captures the development of social capital in a community by measuring charitable donations as well as public sector’s expenditure in social welfare. These indicators will not only tell the levels of resources available for social capital development, but also demonstrate the commitment of public sector, corporations and individuals to the development of social capital. We present the indicators for the “Social Capital Index” (SCI) in Table 5.
A STUDY ON CREATIVITY INDEX ��
Development of social capital
1. Amount of approved charitable donations allowed under Salaries Tax (in local currency) as percentage of GDP
2. Amount of approved charitable donations allowed under Profits Tax (in local currency) as percentage of GDP
3. Expenditure on “social welfare” as percentage of total public expenditure
Network quality: norms & values from World Value Survey
4. Indicators on generalized trust
5. Indicators on institutional trust
6. Indicators on reciprocity
7. Indicators on sense of efficacy (on control)
8. Indicators on cooperation
9. Indicators on attitude towards diversity
10. Indicators on acceptance of diversity
11. Indicators on attitude towards human rights
12. Attitude towards rights and wrongs of foreign immigrants
13. Attitude towards foreigners’ life style
14. Indicators on modern versus traditional values
15. Indicators on self-expression versus survival
Network quality: social participation from World Value Survey
16. Interest in public affairs
17. Participation in social organization
18. Social contact with acquaintance
19. Social contact with community
20. Indicators on sense of efficacy (on what you did)
21. Total number of volunteers per capita
Table 5 : Framework for measuring Social Capital
ESTABLISHING THE CREATIVITY INDEX��
� Measuring Cultural Capital
7.1 The data structure of Cultural Capital Index (CCI) is similar to the “Social Capital Index”, comprising a number of sub-indices measuring different aspects of cultural capital from the public sector’s commitment to the development of the arts and culture, household expenses on cultural goods & services, values placed on creativity to cultural participation and consumption. Since data on disposable personal income in the arts and culture is not available, we use a substitute - household expenses on selected categories of cultural goods and services - to reflect the community’s investment in the arts and culture. Measures of cultural norms and values are largely confined to some general attitude towards creativity, value placed on the arts, art education and the issue of IP rights protection. Some measures of social and cultural capital are interdependent. For instance, attitude towards diversity and variables of self-expression are invariably essential quality of cultural capital, but they are also important elements in other forms of capital. Lastly, measures of cultural participation cover a wide range of cultural consumption which are not in economic terms, but are patterns of engagement (such as utilisation, frequency and intensity) in arts and cultural activities.
Cultural expenditure
1. Expenditure on “the arts & culture” as percentage of total public expenditure
2. Household expenses on designated cultural goods & services as percentage of total household expenses
Network quality: norms & values
Attitude towards arts, cultural and creative activities
3. Value placed on creative activity
4. Value placed on school-aged children’s creative activity
5. Value placed on arts and cultural activities
6. Value placed on school-aged children’s art and cultural activities
7. Community leader to be a strong advocate for advancing the arts and culture of the place
Environmental factors for cultural and creative activities
8. Evaluation on milieu that encourages creative activities
9. Evaluation of milieu that encourages cultural participation
10. Value placed on the morality to buy pirated or counterfeit goods
Network quality: cultural participation
11. Number of library books borrowed per year per population
12. Royalty fees paid to copyright fees collecting agents (excluding revenue from overseas) (in local currency) per population
13. Average hours per week spent on internet for personal use as percentage of 168 hours
14. Number of visits to government cultural services’ museums per population
15. Number of attendance to performances by government cultural services per population
16. Number of attendance to film and video shows presented by government cultural services per population
Table 6 : Framework for measuring Cultural Capital
A STUDY ON CREATIVITY INDEX ��
7.2 Cultural participation could take place in many forms. The group of indicators included in Table 6 of the Cultural Capital Index (CCI) only chooses those indicators with historical data available from 1999 to 2004. Due to this limitation, a number of indicators which are theoretically established but not yet supported by historical data have been dropped in our overall framework. They include, for example, participation rate of population attending a particular form of cultural activity, average hours per day of television viewing and radio listening. We recommend that regular survey on cultural participation should be conducted in future, which would significantly improve the scope and quality of data collection for measuring cultural participation in Hong Kong.

ESTABLISHING THE CREATIVITY INDEX��

A STUDY ON CREATIVITY INDEX ��
FINDINGS OF THE CREATIVITY INDEX��
FINDINGS OF THE CREATIVITYINDEX
IV.
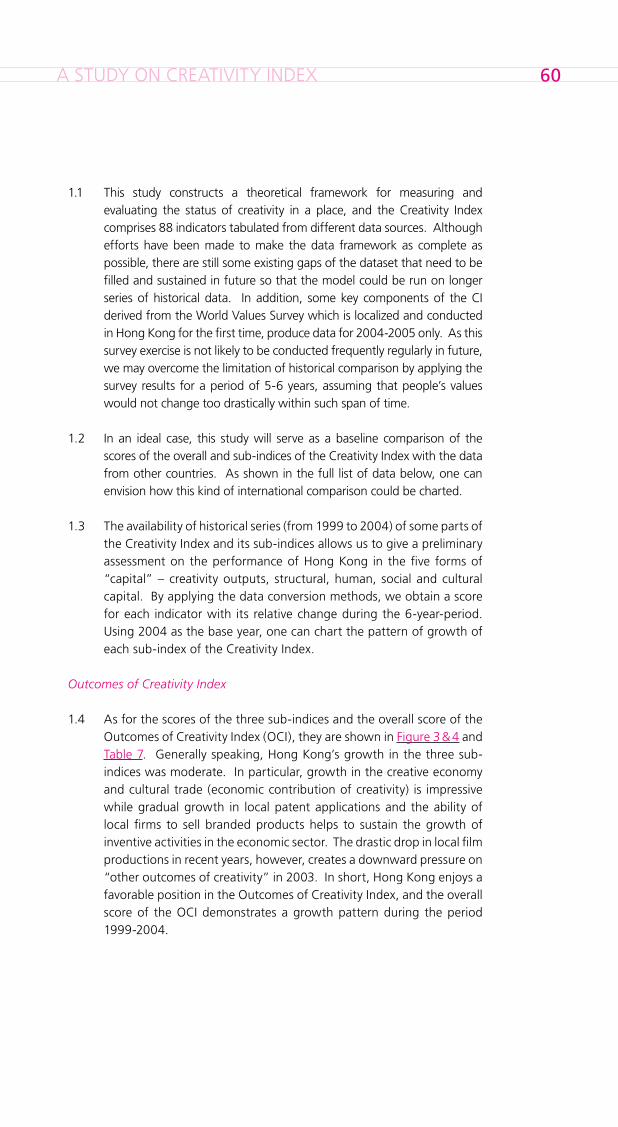
A STUDY ON CREATIVITY INDEX �0
1.1 This study constructs a theoretical framework for measuring and evaluating the status of creativity in a place, and the Creativity Index comprises 88 indicators tabulated from different data sources. Although efforts have been made to make the data framework as complete as possible, there are still some existing gaps of the dataset that need to be filled and sustained in future so that the model could be run on longer series of historical data. In addition, some key components of the CI derived from the World Values Survey which is localized and conducted in Hong Kong for the first time, produce data for 2004-2005 only. As this survey exercise is not likely to be conducted frequently regularly in future, we may overcome the limitation of historical comparison by applying the survey results for a period of 5-6 years, assuming that people’s values would not change too drastically within such span of time.
1.2 In an ideal case, this study will serve as a baseline comparison of the scores of the overall and sub-indices of the Creativity Index with the data from other countries. As shown in the full list of data below, one can envision how this kind of international comparison could be charted.
1.3 The availability of historical series (from 1999 to 2004) of some parts of the Creativity Index and its sub-indices allows us to give a preliminary assessment on the performance of Hong Kong in the five forms of “capital” – creativity outputs, structural, human, social and cultural capital. By applying the data conversion methods, we obtain a score for each indicator with its relative change during the 6-year-period. Using 2004 as the base year, one can chart the pattern of growth of each sub-index of the Creativity Index.
Outcomes of Creativity Index
1.4 As for the scores of the three sub-indices and the overall score of the Outcomes of Creativity Index (OCI), they are shown in Figure 3 & 4 and Table 7. Generally speaking, Hong Kong’s growth in the three sub-indices was moderate. In particular, growth in the creative economy and cultural trade (economic contribution of creativity) is impressive while gradual growth in local patent applications and the ability of local firms to sell branded products helps to sustain the growth of inventive activities in the economic sector. The drastic drop in local film productions in recent years, however, creates a downward pressure on “other outcomes of creativity” in 2003. In short, Hong Kong enjoys a favorable position in the Outcomes of Creativity Index, and the overall score of the OCI demonstrates a growth pattern during the period 1999-2004.
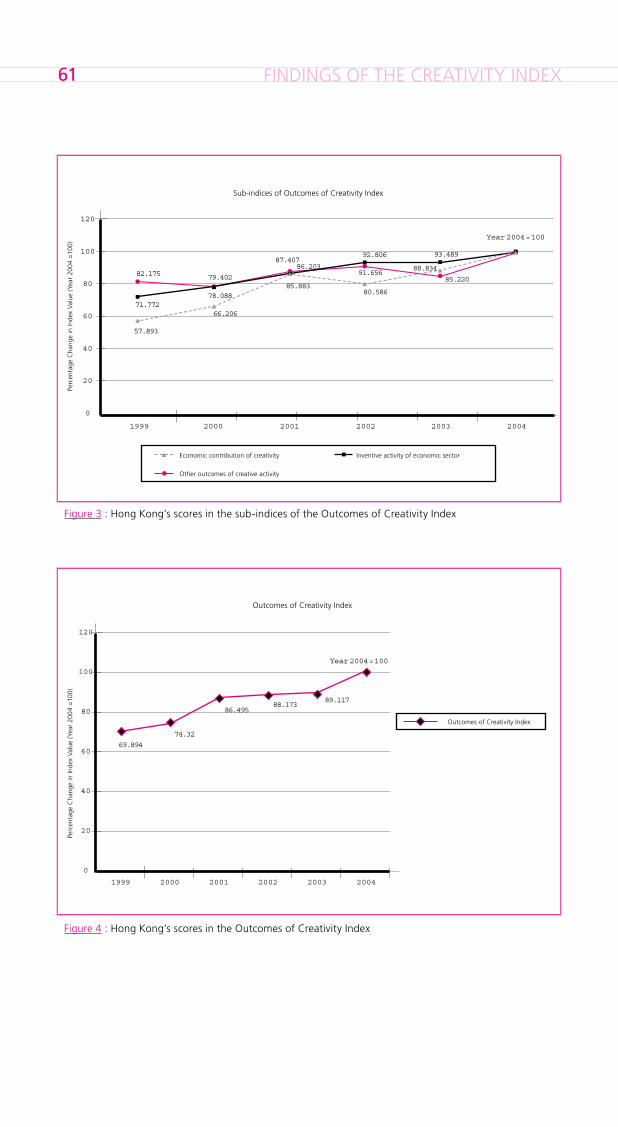
FINDINGS OF THE CREATIVITY INDEX�1
Figure 4 : Hong Kong’s scores in the Outcomes of Creativity Index
120
100
0
20
40
60
80
1999 2000 2001 2002 2003 2004
Outcomes of Creativity Index
Outcomes of Creativity Index
Year 2004 = 100
89.11788.173
86.495
74.32
69.894
Figure 3 : Hong Kong’s scores in the sub-indices of the Outcomes of Creativity Index
120
100
0
20
40
60
80
1999 2000 2001 2002 2003 2004
82.175
71.772
57.893
66.206
78.088
79.402
87.40786.203
85.883
92.806
91.656
80.586
93.489
88.834
85.220
Sub-indices of Outcomes of Creativity Index
Economic contribution of creativity Inventive activity of economic sector
Other outcomes of creative activity
Perc
enta
ge C
hang
e in
Inde
x Va
lue
(Yea
r 20
04 =
100)
Perc
enta
ge C
hang
e in
Inde
x Va
lue
(Yea
r 20
04 =
100)
Year 2004 = 100
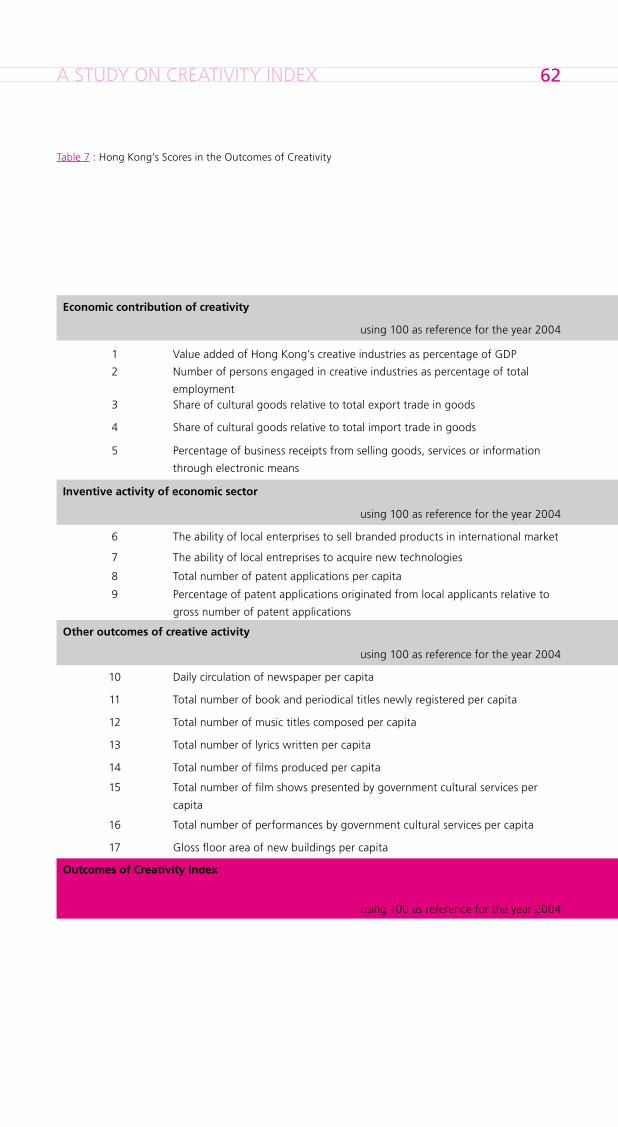
A STUDY ON CREATIVITY INDEX ��
2004 2003 2002 2001 2000 1999
Economic contribution of creativity 0.055124 0.048969 0.0444222 0.047342 0.036495 0.031913
using 100 as reference for the year 2004 100.000 88.834 80.586 85.883 66.206 57.893
1 Value added of Hong Kong’s creative industries as percentage of GDP 0.042656 0.041000 0.037314 0.036303 0.036249 0.032033
2 Number of persons engaged in creative industries as percentage of total
employment
0.052505
0.049253
0.052550
0.051339
0.047541
0.046886
3 Share of cultural goods relative to total export trade in goods 0.193889 0.188031 0.172819 0.176874 0.140297 0.134412
4 Share of cultural goods relative to total import trade in goods 0.178675 0.176563 0.176021 0.167767 0.157510 0.149061
5 Percentage of business receipts from selling goods, services or information
through electronic means
0.006560
0.004200
0.002900
0.004300
0.001700
0.001100
Inventive activity of economic sector 0.0713064 0.0666637 0.0661766 0.0614683 0.0556814 0.0511781
using 100 as reference for the year 2004 100.000 93.489 92.806 86.203 78.088 71.772
6 The ability of local enterprises to sell branded products in international market 0.650000 0.600000 0.575340 0.533333 0.518313 0.500000
7 The ability of local entreprises to acquire new technologies 0.716667 0.700000 0.707144 0.750000 0.690381 0.656667
8 Total number of patent applications per capita 0.001514 0.001396 0.001394 0.001372 0.001286 0.000941
9 Percentage of patent applications originated from local applicants relative to
gross number of patent applications
0.036657
0.033684
0.033816
0.026013
0.020889
0.022204
Other outcomes of creative activity 0.001839 0.001567 0.001685 0.001607 0.001460 0.001511
using 100 as reference for the year 2004 100.000 85.220 91.656 87.407 79.402 82.175
10 Daily circulation of newspaper per capita 0.284255 0.269670 0.265543 0.228584 0.238993 0.220035
11 Total number of book and periodical titles newly registered per capita 0.002016 0.001910 0.001754 0.001599 0.001456 0.001353
12 Total number of music titles composed per capita 0.000728 0.000571 0.000642 0.000602 0.000528 0.000585
13 Total number of lyrics written per capita 0.000674 0.000404 0.000321 0.000316 0.000243 0.000256
14 Total number of films produced per capita 0.000009 0.000008 0.000010 0.000019 0.000022 0.000022
15 Total number of film shows presented by government cultural services per
capita
0.000211
0.000156
0.000174
0.000139
0.000077
0.000095
16 Total number of performances by government cultural services per capita 0.000594 0.000583 0.000681 0.000593 0.000606 0.000621
17 Gloss floor area of new buildings per capita 0.412108 0.419967 0.571566 0.408364 0.449935 0.468955
Outcomes of Creativity Index 2004 2003 2002 2001 2000 1999
0.0193334 0.0172293 0.0170468 0.0167225 0.0143685 0.0135129
using 100 as reference for the year 2004 100.000 89.117 88.173 86.495 74.320 69.894
Table 7 : Hong Kong’s Scores in the Outcomes of Creativity
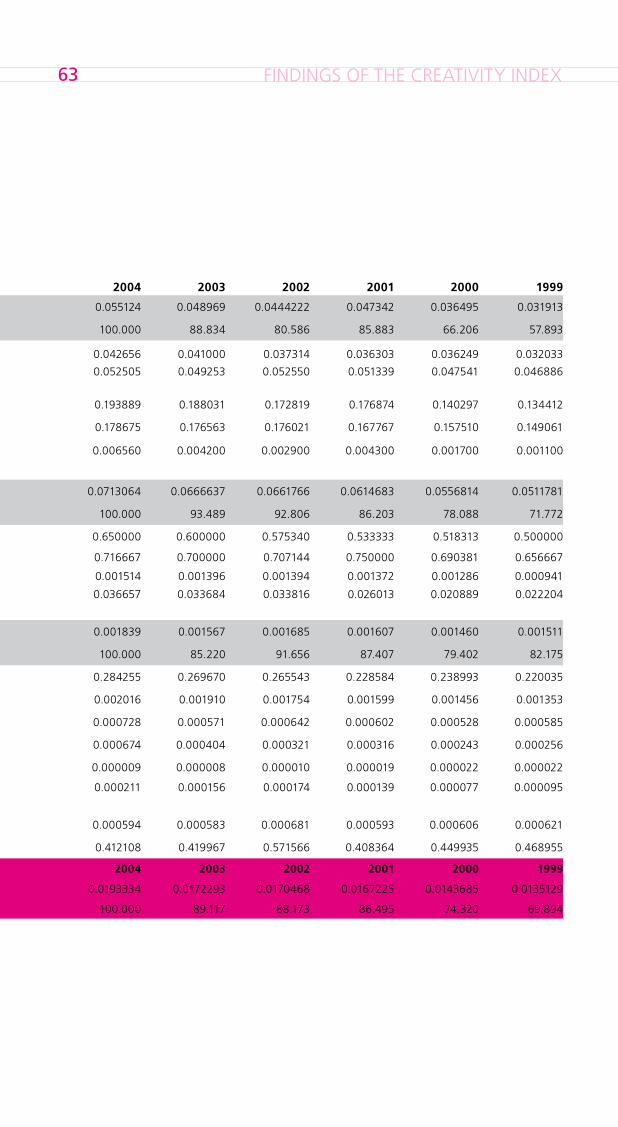
FINDINGS OF THE CREATIVITY INDEX��
2004 2003 2002 2001 2000 1999
Economic contribution of creativity 0.055124 0.048969 0.0444222 0.047342 0.036495 0.031913
using 100 as reference for the year 2004 100.000 88.834 80.586 85.883 66.206 57.893
1 Value added of Hong Kong’s creative industries as percentage of GDP 0.042656 0.041000 0.037314 0.036303 0.036249 0.032033
2 Number of persons engaged in creative industries as percentage of total
employment
0.052505
0.049253
0.052550
0.051339
0.047541
0.046886
3 Share of cultural goods relative to total export trade in goods 0.193889 0.188031 0.172819 0.176874 0.140297 0.134412
4 Share of cultural goods relative to total import trade in goods 0.178675 0.176563 0.176021 0.167767 0.157510 0.149061
5 Percentage of business receipts from selling goods, services or information
through electronic means
0.006560
0.004200
0.002900
0.004300
0.001700
0.001100
Inventive activity of economic sector 0.0713064 0.0666637 0.0661766 0.0614683 0.0556814 0.0511781
using 100 as reference for the year 2004 100.000 93.489 92.806 86.203 78.088 71.772
6 The ability of local enterprises to sell branded products in international market 0.650000 0.600000 0.575340 0.533333 0.518313 0.500000
7 The ability of local entreprises to acquire new technologies 0.716667 0.700000 0.707144 0.750000 0.690381 0.656667
8 Total number of patent applications per capita 0.001514 0.001396 0.001394 0.001372 0.001286 0.000941
9 Percentage of patent applications originated from local applicants relative to
gross number of patent applications
0.036657
0.033684
0.033816
0.026013
0.020889
0.022204
Other outcomes of creative activity 0.001839 0.001567 0.001685 0.001607 0.001460 0.001511
using 100 as reference for the year 2004 100.000 85.220 91.656 87.407 79.402 82.175
10 Daily circulation of newspaper per capita 0.284255 0.269670 0.265543 0.228584 0.238993 0.220035
11 Total number of book and periodical titles newly registered per capita 0.002016 0.001910 0.001754 0.001599 0.001456 0.001353
12 Total number of music titles composed per capita 0.000728 0.000571 0.000642 0.000602 0.000528 0.000585
13 Total number of lyrics written per capita 0.000674 0.000404 0.000321 0.000316 0.000243 0.000256
14 Total number of films produced per capita 0.000009 0.000008 0.000010 0.000019 0.000022 0.000022
15 Total number of film shows presented by government cultural services per
capita
0.000211
0.000156
0.000174
0.000139
0.000077
0.000095
16 Total number of performances by government cultural services per capita 0.000594 0.000583 0.000681 0.000593 0.000606 0.000621
17 Gloss floor area of new buildings per capita 0.412108 0.419967 0.571566 0.408364 0.449935 0.468955
Outcomes of Creativity Index 2004 2003 2002 2001 2000 1999
0.0193334 0.0172293 0.0170468 0.0167225 0.0143685 0.0135129
using 100 as reference for the year 2004 100.000 89.117 88.173 86.495 74.320 69.894
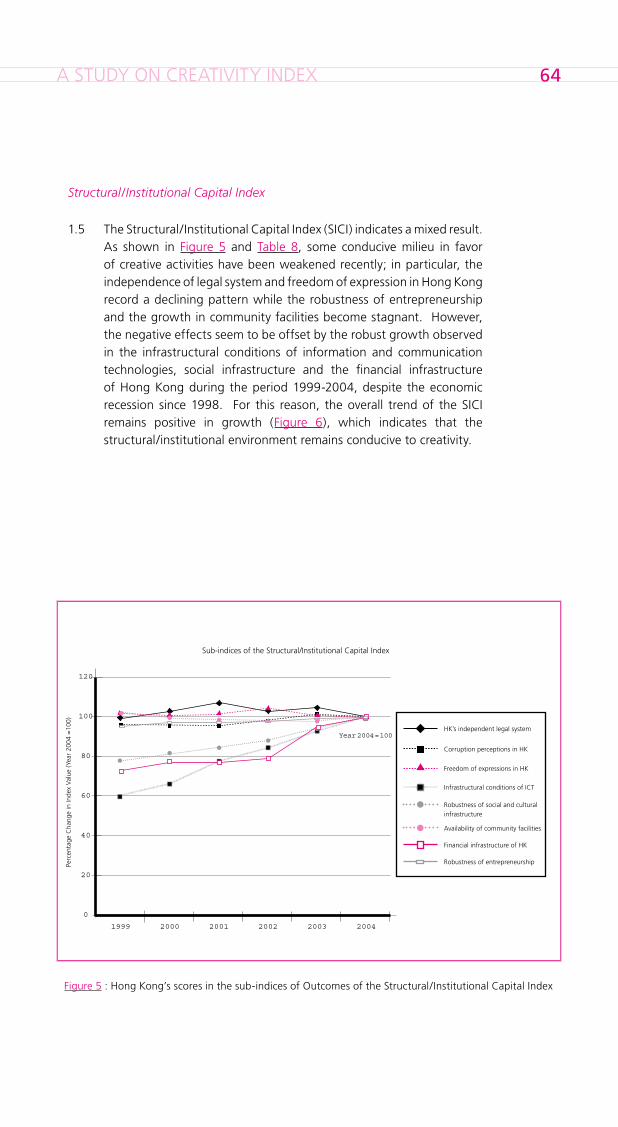
A STUDY ON CREATIVITY INDEX ��
Figure 5 : Hong Kong’s scores in the sub-indices of Outcomes of the Structural/Institutional Capital Index
120
100
0
20
40
60
80
1999 2000 2001 2002 2003 2004
Sub-indices of the Structural/Institutional Capital Index
Year 2004 = 100
Structural/Institutional Capital Index
1.5 The Structural/Institutional Capital Index (SICI) indicates a mixed result. As shown in Figure 5 and Table 8, some conducive milieu in favor of creative activities have been weakened recently; in particular, the independence of legal system and freedom of expression in Hong Kong record a declining pattern while the robustness of entrepreneurship and the growth in community facilities become stagnant. However, the negative effects seem to be offset by the robust growth observed in the infrastructural conditions of information and communication technologies, social infrastructure and the financial infrastructure of Hong Kong during the period 1999-2004, despite the economic recession since 1998. For this reason, the overall trend of the SICI remains positive in growth (Figure 6), which indicates that the structural/institutional environment remains conducive to creativity.
HK’s independent legal system
Corruption perceptions in HK
Freedom of expressions in HK
Infrastructural conditions of ICT
Robustness of social and cultural infrastructure
Availability of community facilities
Financial infrastructure of HK
Robustness of entrepreneurshipPerc
enta
ge C
hang
e in
Inde
x Va
lue
(Yea
r 20
04 =
100)
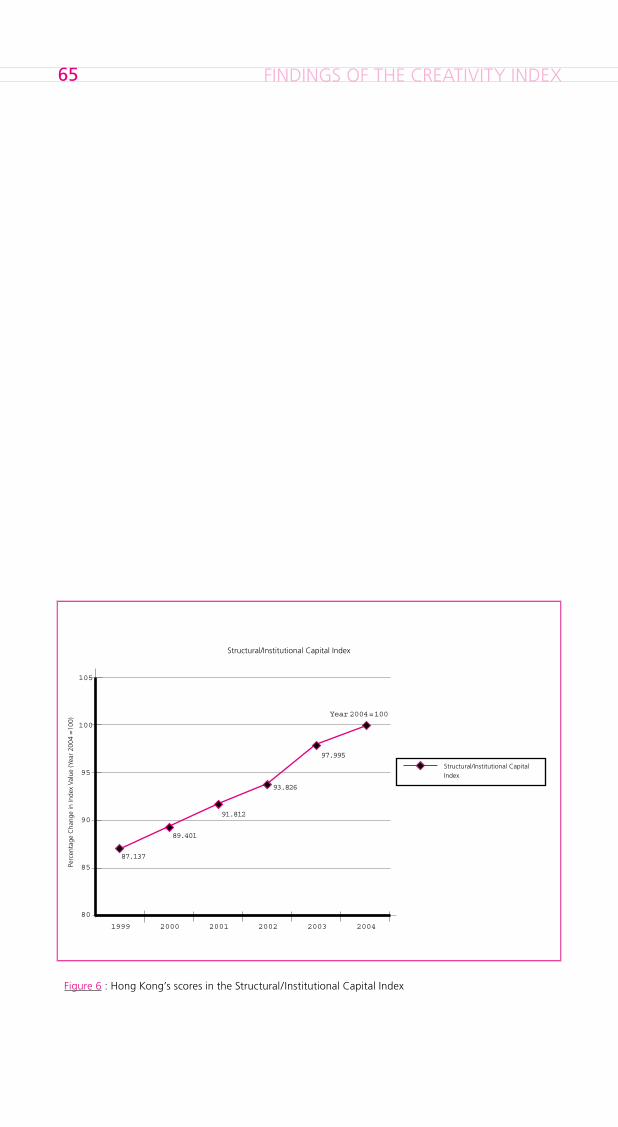
FINDINGS OF THE CREATIVITY INDEX��
Figure 6 : Hong Kong’s scores in the Structural/Institutional Capital Index
105
80
85
90
95
100
1999 2000 2001 2002 2003 2004
Structural/Institutional Capital Index
Structural/Institutional Capital Index
Year 2004 = 100
97.995
93.826
91.812
89.401
87.137
Perc
enta
ge C
hang
e in
Inde
x Va
lue
(Yea
r 20
04 =
100)
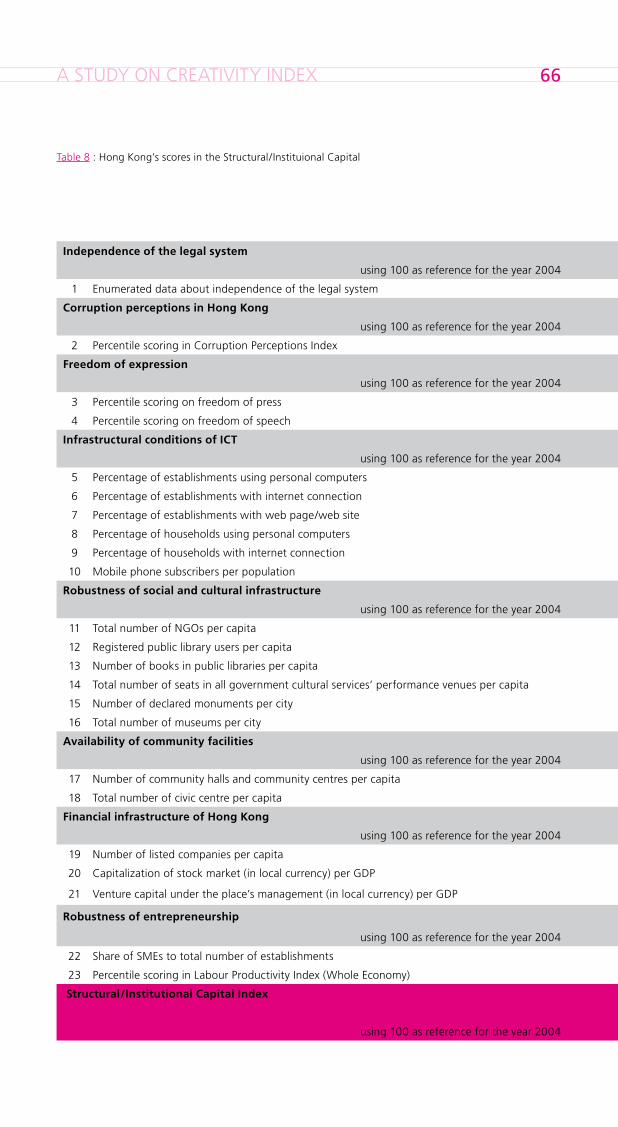
A STUDY ON CREATIVITY INDEX ��
Table 8 : Hong Kong’s scores in the Structural/Instituional Capital
2004 2003 2002 2001 2000 1999
Independence of the legal system 0.767000 0.800000 0.786000 0.817000 0.784000 0.762000
using 100 as reference for the year 2004 100.000 104.348 102.541 106.522 102.210 99.348
1 Enumerated data about independence of the legal system 0.766667 0.800000 0.786145 0.816667 0.783610 0.761667
Corruption perceptions in Hong Kong 0.896000 0.902000 0.871000 0.856000 0.854000 0.857000
using 100 as reference for the year 2004 100.000 100.634 97.260 95.504 95.323 95.681
2 Percentile scoring in Corruption Perceptions Index 0.895833 0.901515 0.871287 0.855556 0.853933 0.857143
Freedom of expression 0.707000 0.712000 0.738000 0.717000 0.711000 0.723000
using 100 as reference for the year 2004 100.000 100.680 104.355 101.501 100.616 102.240
3 Percentile scoring on freedom of press 0.713435 0.723518 0.737350 0.717473 0.712996 0.727492
4 Percentile scoring on freedom of speech 0.700382 0.700042 0.737973 0.717503 0.709477 0.717963
Infrastructural conditions of ICT 0.365000 0.338000 0.308000 0.281000 0.241000 0.219000
using 100 as reference for the year 2004 100.000 92.563 84.230 76.918 66.072 59.934
5 Percentage of establishments using personal computers 0.5840000 0.5480000 0.5450000 0.4970000 0.5150000 0.4835684
6 Percentage of establishments with internet connection 0.5040000 0.4750000 0.4420000 0.3720000 0.3730000 0.3334859
7 Percentage of establishments with web page/web site 0.1480000 0.1350000 0.1180000 0.1070000 0.0730000 0.0689585
8 Percentage of households using personal computers 0.7110000 0.6750000 0.6210000 0.6060000 0.4970000 0.4822370
9 Percentage of households with internet connection 0.6490000 0.6000000 0.5250000 0.4870000 0.3640000 0.3419490
10 Mobile phone subscribers per population 0.1183085 0.1050974 0.0916430 0.0843569 0.0779911 0.0601083
Robustness of social and cultural infrastructure 0.361400 0.342197 0.326933 0.312974 0.303798 0.291354
using 100 as reference for the year 2004 100.000 93.424 88.293 84.200 81.133 77.434
11 Total number of NGOs per capita 0.0003875 0.0003139 0.0002779 0.0002450 0.0002466 0.0002617
12 Registered public library users per capita 0.4539192 0.4332702 0.4082212 0.3764857 0.3706243 0.3457241
13 Number of books in public libraries per capita 1.4078747 1.3124657 1.2539193 1.2488543 1.1401399 1.1020156
14 Total number of seats in all government cultural services’ performance venues per capita 0.0047454 0.0048047 0.0048467 0.0047295 0.0047630 0.0046797
15 Number of declared monuments per city 79 78 77 75 72 69
16 Total number of museums per city 24 24 23 23 22 19
Availability of community facilities 0.00000505 0.00000494 0.00000494 0.00000496 0.00000503 0.00000517
using 100 as reference for the year 2004 100.000 97.821 97.821 98.261 99.568 102.247
17 Number of community halls and community centres per capita 0.0000116 0.0000111 0.0000111 0.0000112 0.0000115 0.0000116
18 Total number of civic centre per capita 0.0000022 0.0000022 0.0000022 0.0000022 0.0000022 0.0000023
Financial infrastructure of Hong Kong 0.013188 0.012511 0.010448 0.010155 0.010217 0.009599
using 100 as reference for the year 2004 100.000 94.864 79.221 77.002 77.469 72.783
19 Number of listed companies per capita 0.0001589 0.0001515 0.0001441 0.0001283 0.0001177 0.0001067
20 Capitalization of stock market (in local currency) per GDP 5.2745177 4.5472913 2.8948653 3.1075773 3.7738544 3.7997519
21 Venture capital under the place’s management (in local currency) per GDP 0.0027369 0.0028425 0.0027340 0.0026268 0.0024010 0.0021814
Robustness of entrepreneurship 1.022089 1.010261 0.997942 0.991639 0.993964 0.969946
using 100 as reference for the year 2004 100.000 98.843 97.638 97.021 97.248 94.898
22 Share of SMEs to total number of establishments 0.9810000 0.9820000 0.9840000 0.9820000 0.9820000 0.9830000
23 Percentile scoring in Labour Productivity Index (Whole Economy) 1.088422 1.050000 1.010000 0.993000 1.000000 0.928303
Structural/Institutional Capital Index 2004 2003 2002 2001 2000 1999
0.090151 0.088344 0.084585 0.082769 0.080596 0.078555
using 100 as reference for the year 2004 100.000 97.995 93.826 91.812 89.401 87.137
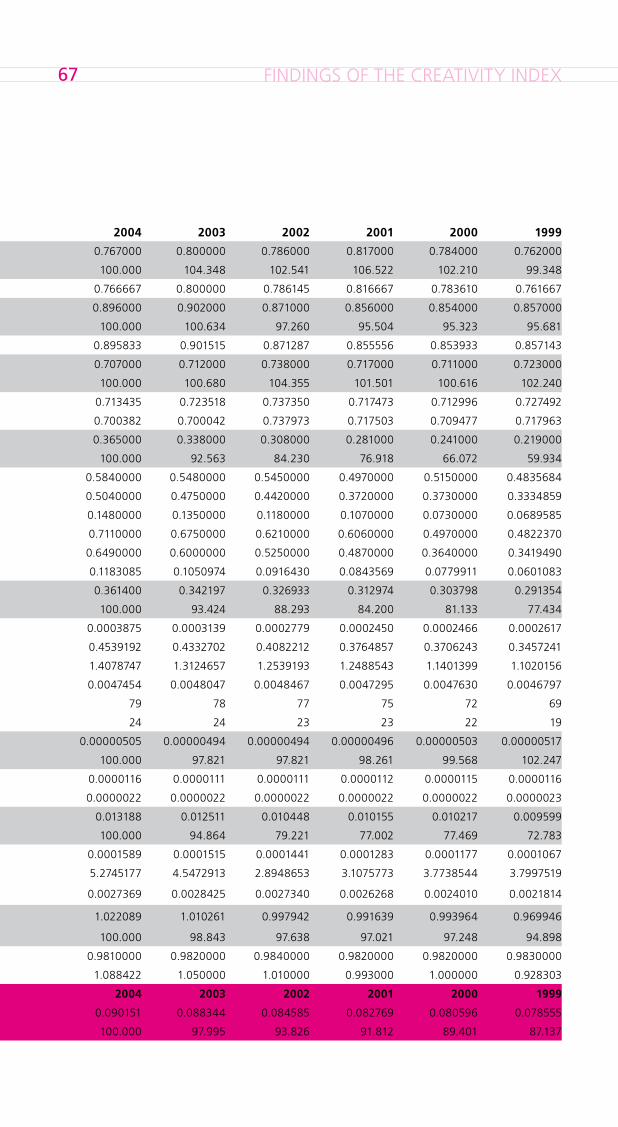
FINDINGS OF THE CREATIVITY INDEX��
2004 2003 2002 2001 2000 1999
Independence of the legal system 0.767000 0.800000 0.786000 0.817000 0.784000 0.762000
using 100 as reference for the year 2004 100.000 104.348 102.541 106.522 102.210 99.348
1 Enumerated data about independence of the legal system 0.766667 0.800000 0.786145 0.816667 0.783610 0.761667
Corruption perceptions in Hong Kong 0.896000 0.902000 0.871000 0.856000 0.854000 0.857000
using 100 as reference for the year 2004 100.000 100.634 97.260 95.504 95.323 95.681
2 Percentile scoring in Corruption Perceptions Index 0.895833 0.901515 0.871287 0.855556 0.853933 0.857143
Freedom of expression 0.707000 0.712000 0.738000 0.717000 0.711000 0.723000
using 100 as reference for the year 2004 100.000 100.680 104.355 101.501 100.616 102.240
3 Percentile scoring on freedom of press 0.713435 0.723518 0.737350 0.717473 0.712996 0.727492
4 Percentile scoring on freedom of speech 0.700382 0.700042 0.737973 0.717503 0.709477 0.717963
Infrastructural conditions of ICT 0.365000 0.338000 0.308000 0.281000 0.241000 0.219000
using 100 as reference for the year 2004 100.000 92.563 84.230 76.918 66.072 59.934
5 Percentage of establishments using personal computers 0.5840000 0.5480000 0.5450000 0.4970000 0.5150000 0.4835684
6 Percentage of establishments with internet connection 0.5040000 0.4750000 0.4420000 0.3720000 0.3730000 0.3334859
7 Percentage of establishments with web page/web site 0.1480000 0.1350000 0.1180000 0.1070000 0.0730000 0.0689585
8 Percentage of households using personal computers 0.7110000 0.6750000 0.6210000 0.6060000 0.4970000 0.4822370
9 Percentage of households with internet connection 0.6490000 0.6000000 0.5250000 0.4870000 0.3640000 0.3419490
10 Mobile phone subscribers per population 0.1183085 0.1050974 0.0916430 0.0843569 0.0779911 0.0601083
Robustness of social and cultural infrastructure 0.361400 0.342197 0.326933 0.312974 0.303798 0.291354
using 100 as reference for the year 2004 100.000 93.424 88.293 84.200 81.133 77.434
11 Total number of NGOs per capita 0.0003875 0.0003139 0.0002779 0.0002450 0.0002466 0.0002617
12 Registered public library users per capita 0.4539192 0.4332702 0.4082212 0.3764857 0.3706243 0.3457241
13 Number of books in public libraries per capita 1.4078747 1.3124657 1.2539193 1.2488543 1.1401399 1.1020156
14 Total number of seats in all government cultural services’ performance venues per capita 0.0047454 0.0048047 0.0048467 0.0047295 0.0047630 0.0046797
15 Number of declared monuments per city 79 78 77 75 72 69
16 Total number of museums per city 24 24 23 23 22 19
Availability of community facilities 0.00000505 0.00000494 0.00000494 0.00000496 0.00000503 0.00000517
using 100 as reference for the year 2004 100.000 97.821 97.821 98.261 99.568 102.247
17 Number of community halls and community centres per capita 0.0000116 0.0000111 0.0000111 0.0000112 0.0000115 0.0000116
18 Total number of civic centre per capita 0.0000022 0.0000022 0.0000022 0.0000022 0.0000022 0.0000023
Financial infrastructure of Hong Kong 0.013188 0.012511 0.010448 0.010155 0.010217 0.009599
using 100 as reference for the year 2004 100.000 94.864 79.221 77.002 77.469 72.783
19 Number of listed companies per capita 0.0001589 0.0001515 0.0001441 0.0001283 0.0001177 0.0001067
20 Capitalization of stock market (in local currency) per GDP 5.2745177 4.5472913 2.8948653 3.1075773 3.7738544 3.7997519
21 Venture capital under the place’s management (in local currency) per GDP 0.0027369 0.0028425 0.0027340 0.0026268 0.0024010 0.0021814
Robustness of entrepreneurship 1.022089 1.010261 0.997942 0.991639 0.993964 0.969946
using 100 as reference for the year 2004 100.000 98.843 97.638 97.021 97.248 94.898
22 Share of SMEs to total number of establishments 0.9810000 0.9820000 0.9840000 0.9820000 0.9820000 0.9830000
23 Percentile scoring in Labour Productivity Index (Whole Economy) 1.088422 1.050000 1.010000 0.993000 1.000000 0.928303
Structural/Institutional Capital Index 2004 2003 2002 2001 2000 1999
0.090151 0.088344 0.084585 0.082769 0.080596 0.078555
using 100 as reference for the year 2004 100.000 97.995 93.826 91.812 89.401 87.137
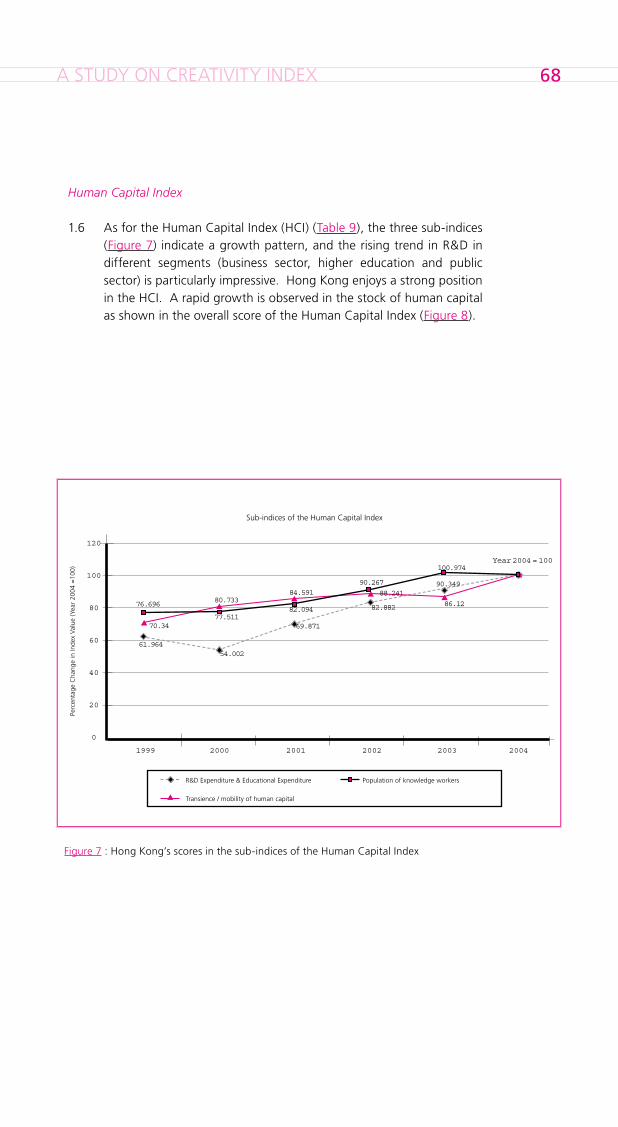
A STUDY ON CREATIVITY INDEX ��
Human Capital Index
1.6 As for the Human Capital Index (HCI) (Table 9), the three sub-indices (Figure 7) indicate a growth pattern, and the rising trend in R&D in different segments (business sector, higher education and public sector) is particularly impressive. Hong Kong enjoys a strong position in the HCI. A rapid growth is observed in the stock of human capital as shown in the overall score of the Human Capital Index (Figure 8).
Figure 7 : Hong Kong’s scores in the sub-indices of the Human Capital Index
120
100
0
20
40
60
80
1999 2000 2001 2002 2003 2004
Sub-indices of the Human Capital Index
R&D Expenditure & Educational Expenditure Population of knowledge workers
Transience / mobility of human capital
61.96454.002
69.871
82.882 86.12
90.349
100.974
90.26784.591
82.09480.733
77.511
76.696
70.34
88.241
Year 2004 = 100
Perc
enta
ge C
hang
e in
Inde
x Va
lue
(Yea
r 20
04 =
100)
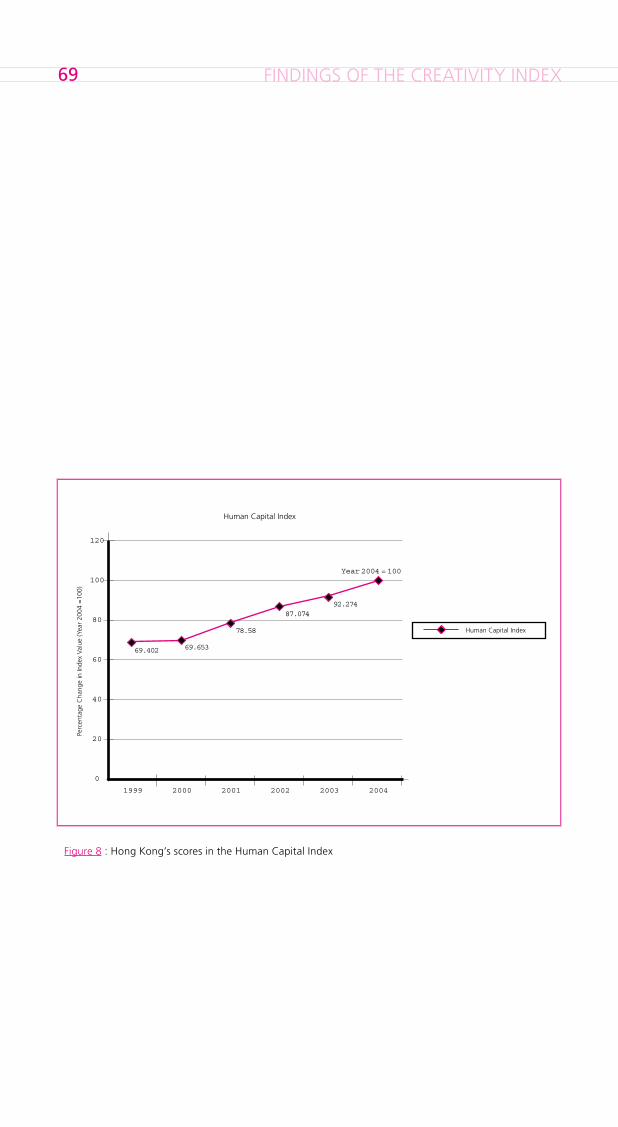
FINDINGS OF THE CREATIVITY INDEX��
Figure 8 : Hong Kong’s scores in the Human Capital Index
120
100
0
20
40
60
80
1999 2000 2001 2002 2003 2004
Human Capital Index
Human Capital Index
Year 2004 = 100
92.27487.074
78.58
69.65369.402
Perc
enta
ge C
hang
e in
Inde
x Va
lue
(Yea
r 20
04 =
100)
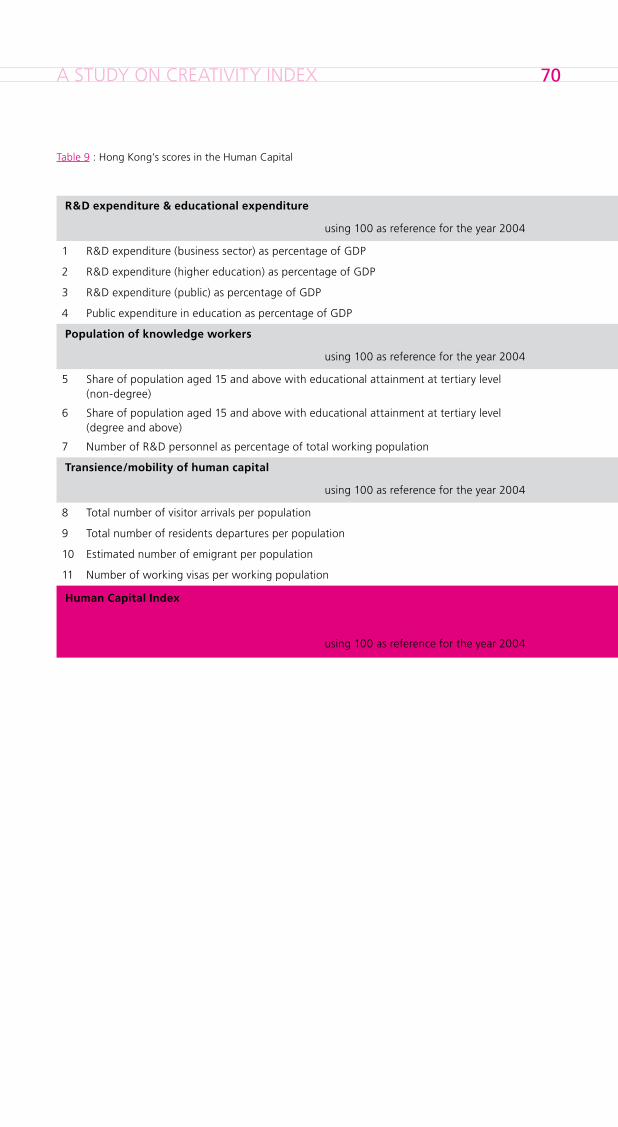
A STUDY ON CREATIVITY INDEX �0
Table 9 : Hong Kong’s scores in the Human Capital
2004 2003 2002 2001 2000 1999
R&D expenditure & educational expenditure 0.003421 0.003091 0.002836 0.002391 0.001848 0.002120
using 100 as reference for the year 2004 100.000 90.349 82.882 69.871 54.002 61.964
1 R&D expenditure (business sector) as percentage of GDP 0.003549 0.002906 0.002009 0.001640 0.000867 0.001130
2 R&D expenditure (higher education) as percentage of GDP 0.004073 0.003931 0.003849 0.003817 0.003873 0.003464
3 R&D expenditure (public) as percentage of GDP 0.000202 0.000170 0.000190 0.000124 0.000087 0.000129
4 Public expenditure in education as percentage of GDP 0.047000 0.047000 0.044000 0.042000 0.040000 0.040000
Population of knowledge workers 0.037607 0.037973 0.033946 0.030873 0.029149 0.028843
using 100 as reference for the year 2004 100.000 100.974 90.267 82.094 77.511 76.696
5 Share of population aged 15 and above with educational attainment at tertiary level (non-degree)
0.072000 0.078000 0.076000 0.070000 0.071000 0.069000
6 Share of population aged 15 and above with educational attainment at tertiary level (degree and above)
0.138000 0.134000 0.129000 0.124000 0.114000 0.107000
7 Number of R&D personnel as percentage of total working population 0.005353 0.005239 0.003990 0.003390 0.003060 0.003250
Transience/mobility of human capital 3.689164 3.177093 3.255354 3.120702 2.978356 2.594962
using 100 as reference for the year 2004 100.000 86.120 88.241 84.591 80.733 70.340
8 Total number of visitor arrivals per population 3.163024 2.269676 2.441223 2.030675 1.945836 1.706682
9 Total number of residents departures per population 9.992522 8.901756 9.510637 9.039191 8.776141 8.006459
10 Estimated number of emigrant per population 0.001421 0.001402 0.001547 0.001568 0.001773 0.001943
11 Number of working visas per working population 0.008329 0.007072 0.007484 0.008103 0.008170 0.006449
Human Capital Index 2004 2003 2002 2001 2000 1999
0.078007 0.071981 0.067924 0.061298 0.054335 0.054139
using 100 as reference for the year 2004 100.000 92.274 87.074 78.580 69.653 69.402
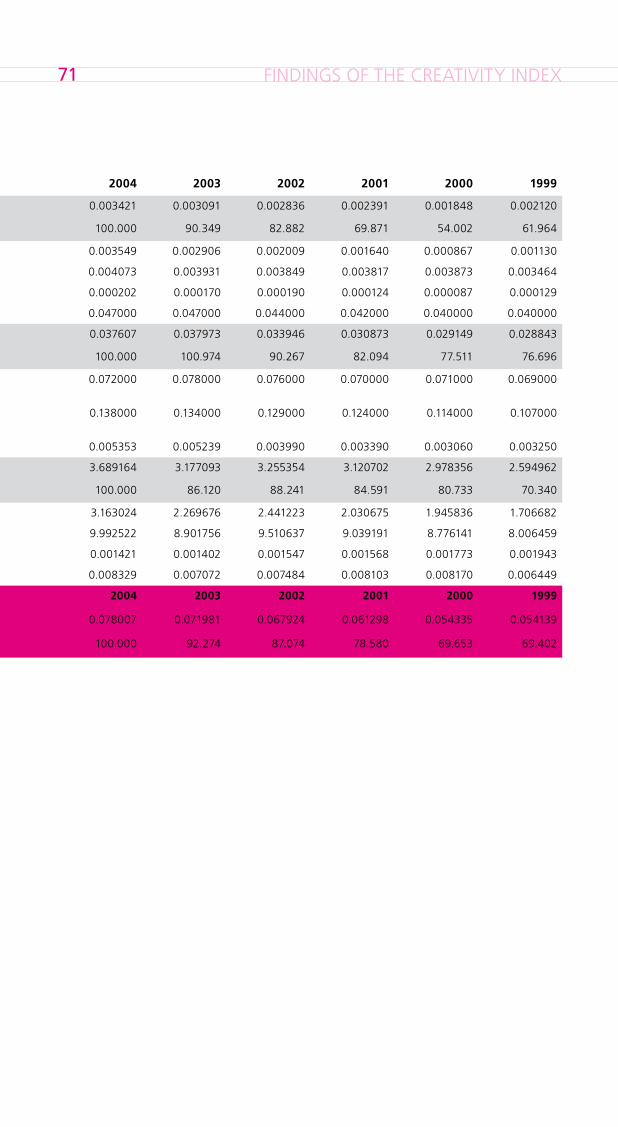
FINDINGS OF THE CREATIVITY INDEX�1
2004 2003 2002 2001 2000 1999
R&D expenditure & educational expenditure 0.003421 0.003091 0.002836 0.002391 0.001848 0.002120
using 100 as reference for the year 2004 100.000 90.349 82.882 69.871 54.002 61.964
1 R&D expenditure (business sector) as percentage of GDP 0.003549 0.002906 0.002009 0.001640 0.000867 0.001130
2 R&D expenditure (higher education) as percentage of GDP 0.004073 0.003931 0.003849 0.003817 0.003873 0.003464
3 R&D expenditure (public) as percentage of GDP 0.000202 0.000170 0.000190 0.000124 0.000087 0.000129
4 Public expenditure in education as percentage of GDP 0.047000 0.047000 0.044000 0.042000 0.040000 0.040000
Population of knowledge workers 0.037607 0.037973 0.033946 0.030873 0.029149 0.028843
using 100 as reference for the year 2004 100.000 100.974 90.267 82.094 77.511 76.696
5 Share of population aged 15 and above with educational attainment at tertiary level (non-degree)
0.072000 0.078000 0.076000 0.070000 0.071000 0.069000
6 Share of population aged 15 and above with educational attainment at tertiary level (degree and above)
0.138000 0.134000 0.129000 0.124000 0.114000 0.107000
7 Number of R&D personnel as percentage of total working population 0.005353 0.005239 0.003990 0.003390 0.003060 0.003250
Transience/mobility of human capital 3.689164 3.177093 3.255354 3.120702 2.978356 2.594962
using 100 as reference for the year 2004 100.000 86.120 88.241 84.591 80.733 70.340
8 Total number of visitor arrivals per population 3.163024 2.269676 2.441223 2.030675 1.945836 1.706682
9 Total number of residents departures per population 9.992522 8.901756 9.510637 9.039191 8.776141 8.006459
10 Estimated number of emigrant per population 0.001421 0.001402 0.001547 0.001568 0.001773 0.001943
11 Number of working visas per working population 0.008329 0.007072 0.007484 0.008103 0.008170 0.006449
Human Capital Index 2004 2003 2002 2001 2000 1999
0.078007 0.071981 0.067924 0.061298 0.054335 0.054139
using 100 as reference for the year 2004 100.000 92.274 87.074 78.580 69.653 69.402
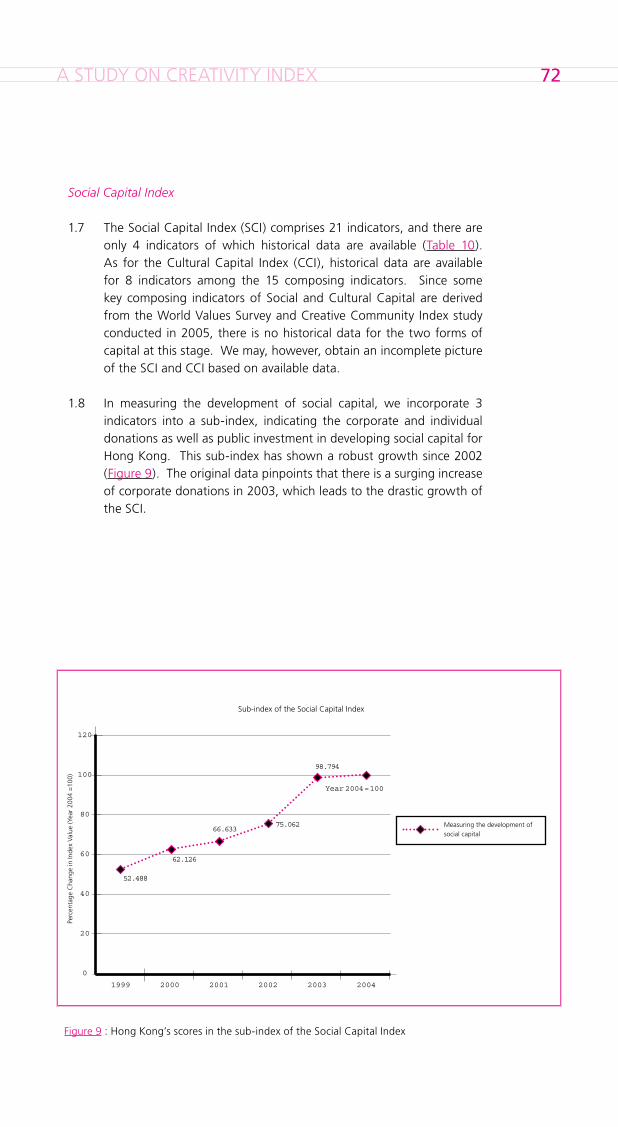
A STUDY ON CREATIVITY INDEX ��
Figure 9 : Hong Kong’s scores in the sub-index of the Social Capital Index
120
100
0
20
40
60
80
1999 2000 2001 2002 2003 2004
Measuring the development of social capital
Sub-index of the Social Capital Index
Year 2004 = 100
98.794
75.06266.633
62.126
52.488
Social Capital Index
1.7 The Social Capital Index (SCI) comprises 21 indicators, and there are only 4 indicators of which historical data are available (Table 10). As for the Cultural Capital Index (CCI), historical data are available for 8 indicators among the 15 composing indicators. Since some key composing indicators of Social and Cultural Capital are derived from the World Values Survey and Creative Community Index study conducted in 2005, there is no historical data for the two forms of capital at this stage. We may, however, obtain an incomplete picture of the SCI and CCI based on available data.
1.8 In measuring the development of social capital, we incorporate 3 indicators into a sub-index, indicating the corporate and individual donations as well as public investment in developing social capital for Hong Kong. This sub-index has shown a robust growth since 2002 (Figure 9). The original data pinpoints that there is a surging increase of corporate donations in 2003, which leads to the drastic growth of the SCI.
Perc
enta
ge C
hang
e in
Inde
x Va
lue
(Yea
r 20
04 =
100)
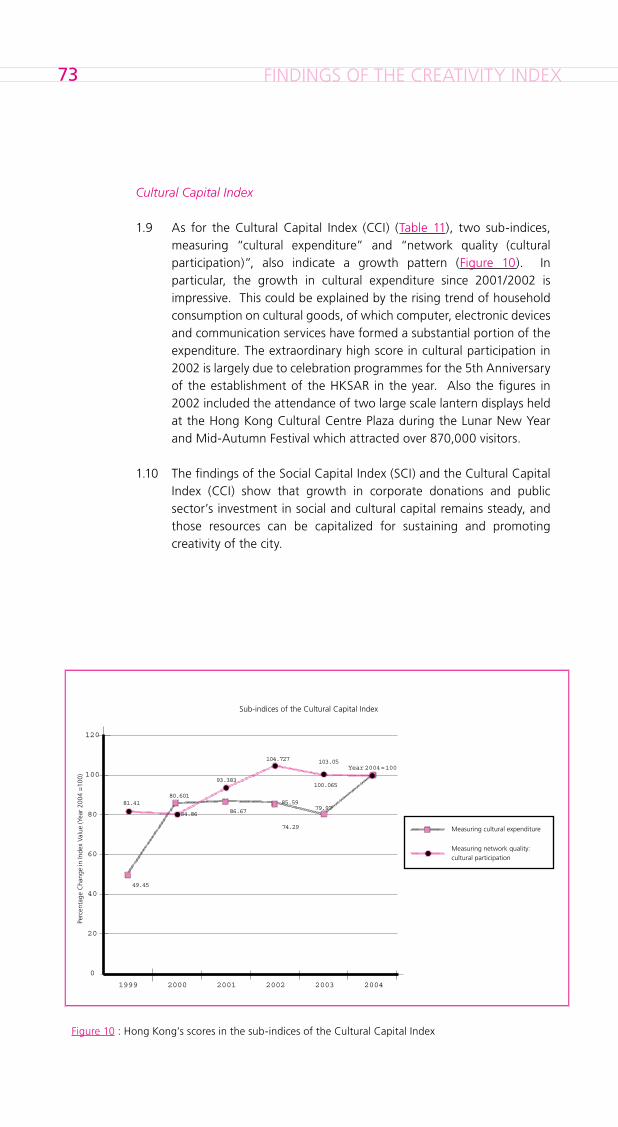
FINDINGS OF THE CREATIVITY INDEX��
Cultural Capital Index
1.9 As for the Cultural Capital Index (CCI) (Table 11), two sub-indices, measuring “cultural expenditure” and “network quality (cultural participation)”, also indicate a growth pattern (Figure 10). In particular, the growth in cultural expenditure since 2001/2002 is impressive. This could be explained by the rising trend of household consumption on cultural goods, of which computer, electronic devices and communication services have formed a substantial portion of the expenditure. The extraordinary high score in cultural participation in 2002 is largely due to celebration programmes for the 5th Anniversary of the establishment of the HKSAR in the year. Also the figures in 2002 included the attendance of two large scale lantern displays held at the Hong Kong Cultural Centre Plaza during the Lunar New Year and Mid-Autumn Festival which attracted over 870,000 visitors.
1.10 The findings of the Social Capital Index (SCI) and the Cultural Capital Index (CCI) show that growth in corporate donations and public sector’s investment in social and cultural capital remains steady, and those resources can be capitalized for sustaining and promoting creativity of the city.
Figure 10 : Hong Kong’s scores in the sub-indices of the Cultural Capital Index
120
100
0
20
40
60
80
1999 2000 2001 2002 2003 2004
Measuring cultural expenditure
Sub-indices of the Cultural Capital Index
Year 2004 = 100103.05
74.29
86.6784.86
49.45
Measuring network quality: cultural participation
81.4180.601
93.383
104.727
100.065
85.5979.97
Perc
enta
ge C
hang
e in
Inde
x Va
lue
(Yea
r 20
04 =
100)
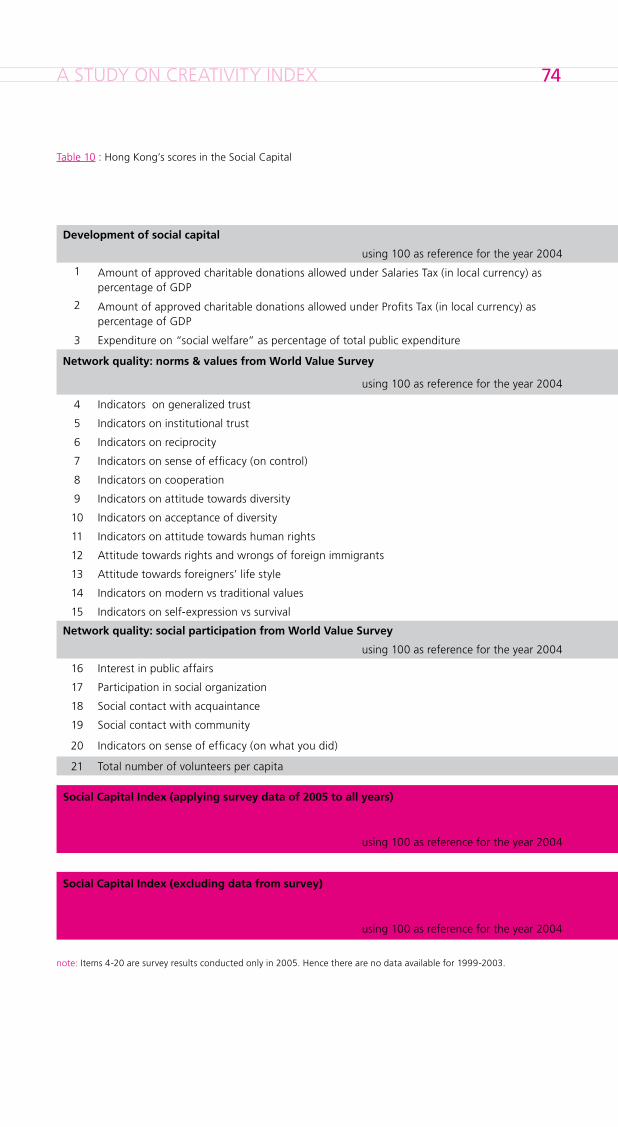
A STUDY ON CREATIVITY INDEX ��
2004 2003 2002 2001 2000 1999
Development of social capital 0.007195 0.007414 0.005345 0.005550 0.005370 0.004980
using 100 as reference for the year 2004 100.000 103.050 74.290 77.140 74.640 69.220
1 Amount of approved charitable donations allowed under Salaries Tax (in local currency) as percentage of GDP
0.002501 0.002369 0.001884 0.001788 0.001614 0.001485
2 Amount of approved charitable donations allowed under Profits Tax (in local currency) as percentage of GDP
0.000897 0.001049 0.000513 0.000646 0.000644 0.000562
3 Expenditure on “social welfare” as percentage of total public expenditure 0.166000 0.164000 0.158000 0.148000 0.149000 0.148000
Network quality: norms & values from World Value Survey 0.537067
using 100 as reference for the year 2004 100.000
4 Indicators on generalized trust 0.745000
5 Indicators on institutional trust 0.529472
6 Indicators on reciprocity 0.599833
7 Indicators on sense of efficacy (on control) 0.459111
8 Indicators on cooperation 0.645667
9 Indicators on attitude towards diversity 0.308556
10 Indicators on acceptance of diversity 0.447800
11 Indicators on attitude towards human rights 0.635000
12 Attitude towards rights and wrongs of foreign immigrants 0.589733
13 Attitude towards foreigners’ life style 0.555000
14 Indicators on modern vs traditional values 0.534890
15 Indicators on self-expression vs survival 0.394746
Network quality: social participation from World Value Survey 0.319996
using 100 as reference for the year 2004 100.000
16 Interest in public affairs 0.717125
17 Participation in social organization 0.029857
18 Social contact with acquaintance 0.630500
19 Social contact with community 0.146833
20 Indicators on sense of efficacy (on what you did) 0.075667
21 Total number of volunteers per capita 0.068284 0.064673 0.051786 0.039302 0.035308 0.027177
Social Capital Index (applying survey data of 2005 to all years) 2004 2003 2002 2001 2000 1999
0.095857 0.095277 0.083049 0.078247 0.075554 0.069447
using 100 as reference for the year 2004 100.000 99.395 86.638 81.629 78.820 72.449
Social Capital Index (excluding data from survey) 2004 2003 2002 2001 2000 1999
0.022165 0.021897 0.016637 0.014769 0.013770 0.011634
using 100 as reference for the year 2004 100.000 98.794 75.062 66.633 62.126 52.488
Table 10 : Hong Kong’s scores in the Social Capital
note: Items 4-20 are survey results conducted only in 2005. Hence there are no data available for 1999-2003.
FINDINGS OF THE CREATIVITY INDEX��
2004 2003 2002 2001 2000 1999
Development of social capital 0.007195 0.007414 0.005345 0.005550 0.005370 0.004980
using 100 as reference for the year 2004 100.000 103.050 74.290 77.140 74.640 69.220
1 Amount of approved charitable donations allowed under Salaries Tax (in local currency) as percentage of GDP
0.002501 0.002369 0.001884 0.001788 0.001614 0.001485
2 Amount of approved charitable donations allowed under Profits Tax (in local currency) as percentage of GDP
0.000897 0.001049 0.000513 0.000646 0.000644 0.000562
3 Expenditure on “social welfare” as percentage of total public expenditure 0.166000 0.164000 0.158000 0.148000 0.149000 0.148000
Network quality: norms & values from World Value Survey 0.537067
using 100 as reference for the year 2004 100.000
4 Indicators on generalized trust 0.745000
5 Indicators on institutional trust 0.529472
6 Indicators on reciprocity 0.599833
7 Indicators on sense of efficacy (on control) 0.459111
8 Indicators on cooperation 0.645667
9 Indicators on attitude towards diversity 0.308556
10 Indicators on acceptance of diversity 0.447800
11 Indicators on attitude towards human rights 0.635000
12 Attitude towards rights and wrongs of foreign immigrants 0.589733
13 Attitude towards foreigners’ life style 0.555000
14 Indicators on modern vs traditional values 0.534890
15 Indicators on self-expression vs survival 0.394746
Network quality: social participation from World Value Survey 0.319996
using 100 as reference for the year 2004 100.000
16 Interest in public affairs 0.717125
17 Participation in social organization 0.029857
18 Social contact with acquaintance 0.630500
19 Social contact with community 0.146833
20 Indicators on sense of efficacy (on what you did) 0.075667
21 Total number of volunteers per capita 0.068284 0.064673 0.051786 0.039302 0.035308 0.027177
Social Capital Index (applying survey data of 2005 to all years) 2004 2003 2002 2001 2000 1999
0.095857 0.095277 0.083049 0.078247 0.075554 0.069447
using 100 as reference for the year 2004 100.000 99.395 86.638 81.629 78.820 72.449
Social Capital Index (excluding data from survey) 2004 2003 2002 2001 2000 1999
0.022165 0.021897 0.016637 0.014769 0.013770 0.011634
using 100 as reference for the year 2004 100.000 98.794 75.062 66.633 62.126 52.488
A STUDY ON CREATIVITY INDEX ��
Table 11 : Hong Kong’s scores in the Cultural Capital
2004 2003 2002 2001 2000 1999
Cultural expenditure 0.038704 0.03095 0.033127 0.033545 0.032845 0.019137
using 100 as reference for the year 2004 100.000 79.970 85.590 86.670 84.860 49.450
1 Expenditure on “arts & culture” as percentage of total public expenditure 0.016107 0.010300 0.011800 0.012100 0.011600 0.004200
2 Household expenses on designated cultural goods & services as percentage of total household expenses
0.093000 0.093000 0.093000 0.093000 0.093000 0.087200
Attitude towards arts, cultural and creative activities 0.506375
using 100 as reference for the year 2004 100.000
3 Value placed on creative activity 0.536375
4 Value placed on school-aged children’s creative activity 0.718750
5 Value placed on arts and cultural activities 0.495750
6 Value placed on school-aged children’s arts and cultural activities 0.707500
7 Community leader to be a strong advocate for advancing the art and culture of the place 0.073500
Environmental factors for cultural and creative activities 0.532313
using 100 as reference for the year 2004 100.000
8 Evaluation on milieu that encourages creative activities 0.531500
9 Evaluation of milieu that encourages cultural participation 0.533125
10 Value placed on the morality to buy pirated or counterfeit goods 0.618162 0.618195 0.605061 0.602314 0.584525 0.565784
Network quality: cultural participation 0.740849 0.741331 0.775872 0.691824 0.597129 0.603124
using 100 as reference for the year 2004 100.000 100.065 104.727 93.383 80.601 81.410
11 Number of library books borrowed per year per population 8.309912 7.903910 7.181443 5.839981 4.842064 4.414392
12 Royalty fees paid to copyright fees collecting agents (excl. revenue from overseas) (in local currency) per population
15.520062 15.032386 16.355314 16.773095 16.090952 16.039289
13 Average hours per week spent on internet for personal use as percentage of 168 hours 0.161310 0.157738 0.141667 0.137500 0.131548 0.123542
14 Number of visits to government cultural services’ museums per population 0.674353 0.684109 0.620386 0.628495 0.508232 0.509874
15 Number of attendance to performances by government cultural services per population 0.319441 0.356053 0.543610 0.343176 0.344996 0.387380
16 Number of attendance to film and video shows presented by government cultural services per population
0.036894 0.036360 0.038874 0.037742 0.025225 0.027859
Cultural Capital Index (applying survey data of 2005 to all years) 2004 2003 2002 2001 2000 1999
0.422910 0.404461 0.411070 0.404865 0.393232 0.351092
using 100 as reference for the year 2004 100.000 95.637 97.200 95.733 92.982 83.018
Cultural Capital Index (excluding data from survey) 2004 2003 2002 2001 2000 1999
0.260732 0.242065 0.249607 0.240889 0.225483 0.186916
using 100 as reference for the year 2004 100.000 92.840 95.730 92.390 86.480 71.690
note: Items 4-10 are survey results conducted only in 2005. Hence there are no data available for 1999-2003.
FINDINGS OF THE CREATIVITY INDEX��
2004 2003 2002 2001 2000 1999
Cultural expenditure 0.038704 0.03095 0.033127 0.033545 0.032845 0.019137
using 100 as reference for the year 2004 100.000 79.970 85.590 86.670 84.860 49.450
1 Expenditure on “arts & culture” as percentage of total public expenditure 0.016107 0.010300 0.011800 0.012100 0.011600 0.004200
2 Household expenses on designated cultural goods & services as percentage of total household expenses
0.093000 0.093000 0.093000 0.093000 0.093000 0.087200
Attitude towards arts, cultural and creative activities 0.506375
using 100 as reference for the year 2004 100.000
3 Value placed on creative activity 0.536375
4 Value placed on school-aged children’s creative activity 0.718750
5 Value placed on arts and cultural activities 0.495750
6 Value placed on school-aged children’s arts and cultural activities 0.707500
7 Community leader to be a strong advocate for advancing the art and culture of the place 0.073500
Environmental factors for cultural and creative activities 0.532313
using 100 as reference for the year 2004 100.000
8 Evaluation on milieu that encourages creative activities 0.531500
9 Evaluation of milieu that encourages cultural participation 0.533125
10 Value placed on the morality to buy pirated or counterfeit goods 0.618162 0.618195 0.605061 0.602314 0.584525 0.565784
Network quality: cultural participation 0.740849 0.741331 0.775872 0.691824 0.597129 0.603124
using 100 as reference for the year 2004 100.000 100.065 104.727 93.383 80.601 81.410
11 Number of library books borrowed per year per population 8.309912 7.903910 7.181443 5.839981 4.842064 4.414392
12 Royalty fees paid to copyright fees collecting agents (excl. revenue from overseas) (in local currency) per population
15.520062 15.032386 16.355314 16.773095 16.090952 16.039289
13 Average hours per week spent on internet for personal use as percentage of 168 hours 0.161310 0.157738 0.141667 0.137500 0.131548 0.123542
14 Number of visits to government cultural services’ museums per population 0.674353 0.684109 0.620386 0.628495 0.508232 0.509874
15 Number of attendance to performances by government cultural services per population 0.319441 0.356053 0.543610 0.343176 0.344996 0.387380
16 Number of attendance to film and video shows presented by government cultural services per population
0.036894 0.036360 0.038874 0.037742 0.025225 0.027859
Cultural Capital Index (applying survey data of 2005 to all years) 2004 2003 2002 2001 2000 1999
0.422910 0.404461 0.411070 0.404865 0.393232 0.351092
using 100 as reference for the year 2004 100.000 95.637 97.200 95.733 92.982 83.018
Cultural Capital Index (excluding data from survey) 2004 2003 2002 2001 2000 1999
0.260732 0.242065 0.249607 0.240889 0.225483 0.186916
using 100 as reference for the year 2004 100.000 92.840 95.730 92.390 86.480 71.690
A STUDY ON CREATIVITY INDEX ��
Overall Creativity Index
1.11 Combing the five sub-indices, the overall Creativity Index (CI) for Hong Kong during 1999-2004 shows a positive growth pattern as in Figure 11 & 12 and Table 12.
Figure 11 : Hong Kong’s scores in the overall Creativity Index (excluding survey data)
120
100
0
20
40
60
80
1999 2000 2001 2002 2003 2004
69.232
Overall Creativity Index
Outcomes of Creativity Index
Structural/Institutional Capital Index
Human Capital Index
Social Capital Index (excluding survey data)
Cultural Capital Index (excluding survey data)
75.703
82.585
87.66
94133
Perc
enta
ge C
hang
e in
Inde
x Va
lue
(Yea
r 20
04 =
100)
Year 2004 = 100
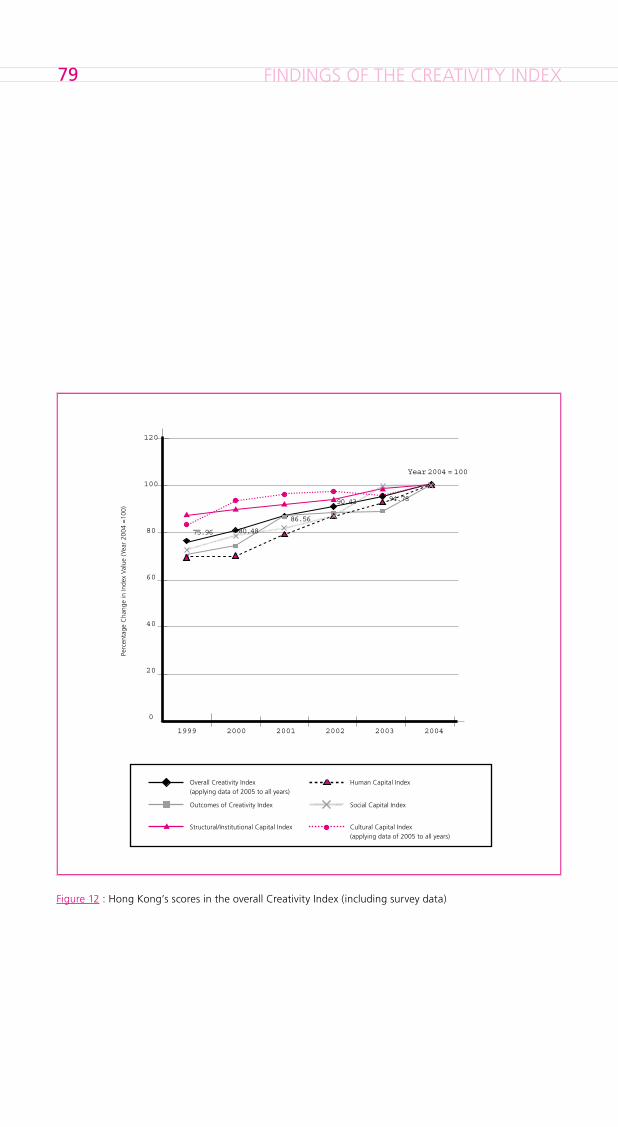
FINDINGS OF THE CREATIVITY INDEX��
Figure 12 : Hong Kong’s scores in the overall Creativity Index (including survey data)
120
100
0
20
40
60
80
1999 2000 2001 2002 2003 2004
Overall Creativity Index(applying data of 2005 to all years)
Outcomes of Creativity Index
Structural/Institutional Capital Index
Human Capital Index
Social Capital Index
Cultural Capital Index (applying data of 2005 to all years)
75.96 80.48
86.56
90.43 94.78
Perc
enta
ge C
hang
e in
Inde
x Va
lue
(Yea
r 20
04 =
100)
Year 2004 = 100
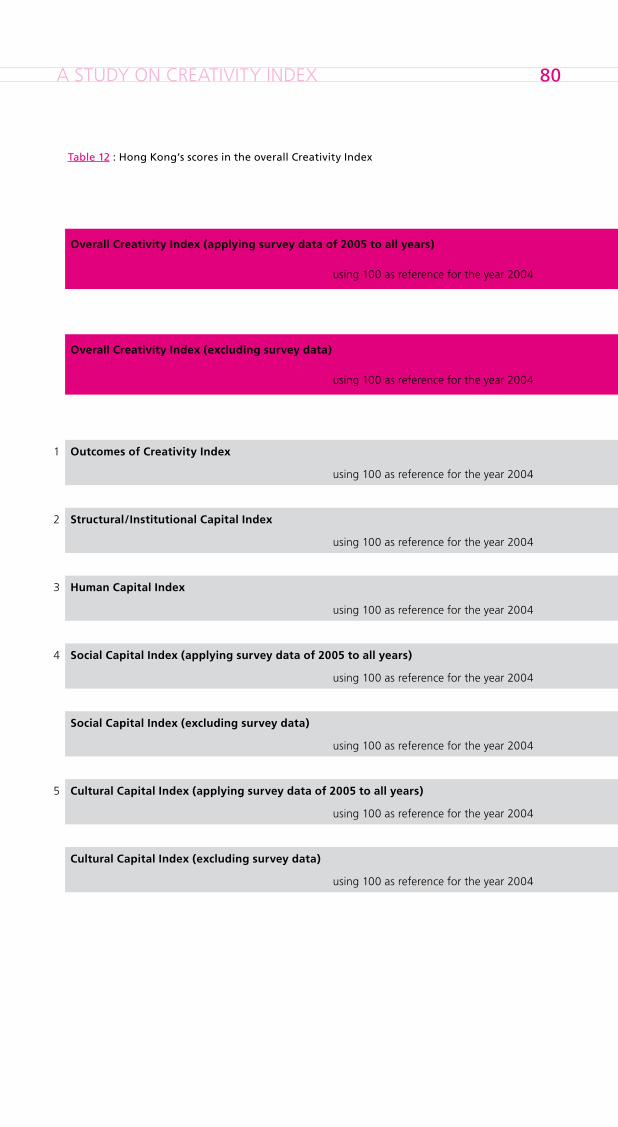
A STUDY ON CREATIVITY INDEX �0
Table 1� : Hong Kong’s scores in the overall Creativity Index
2004 2003 2002 2001 2000 1999
Overall Creativity Index (applying survey data of 2005 to all years) 0.088768 0.084160 0.080323 0.076892 0.071506 0.067500
using 100 as reference for the year 2004 100.000 94.809 90.430 86.560 80.480 75.960
2004 2003 2002 2001 2000 1999
Overall Creativity Index (excluding survey data) 0.060125 0.056597 0.052706 0.049654 0.045517 0.041626
using 100 as reference for the year 2004 100.000 94.133 87.660 82.585 75.703 69.232
2004 2003 2002 2001 2000 1999
1 Outcomes of Creativity Index 0.019333 0.017229 0.017047 0.016723 0.014369 0.013513
using 100 as reference for the year 2004 100.000 89.117 88.173 86.495 74.320 69.894
2 Structural/Institutional Capital Index 0.090151 0.088344 0.084585 0.082769 0.080596 0.078555
using 100 as reference for the year 2004 100.000 97.995 93.826 91.812 89.401 87.137
3 Human Capital Index 0.078007 0.071981 0.067924 0.061298 0.054335 0.054139
using 100 as reference for the year 2004 100.000 92.274 87.074 78.580 69.653 69.402
4 Social Capital Index (applying survey data of 2005 to all years) 0.095857 0.095277 0.083049 0.078247 0.075554 0.069447
using 100 as reference for the year 2004 100.000 99.395 86.638 81.629 78.820 72.449
Social Capital Index (excluding survey data) 0.022165 0.021897 0.016637 0.014769 0.013770 0.011634
using 100 as reference for the year 2004 100.000 98.794 75.062 66.633 62.126 52.488
5 Cultural Capital Index (applying survey data of 2005 to all years) 0.422910 0.404461 0.411070 0.404865 0.393232 0.351092
using 100 as reference for the year 2004 100.000 95.637468 97.200251 95.733114 92.982325 83.018173
Cultural Capital Index (excluding survey data) 0.260732 0.242065 0.249607 0.240889 0.225483 0.186916
using 100 as reference for the year 2004 100.000 92.840 95.730 92.390 86.480 71.690
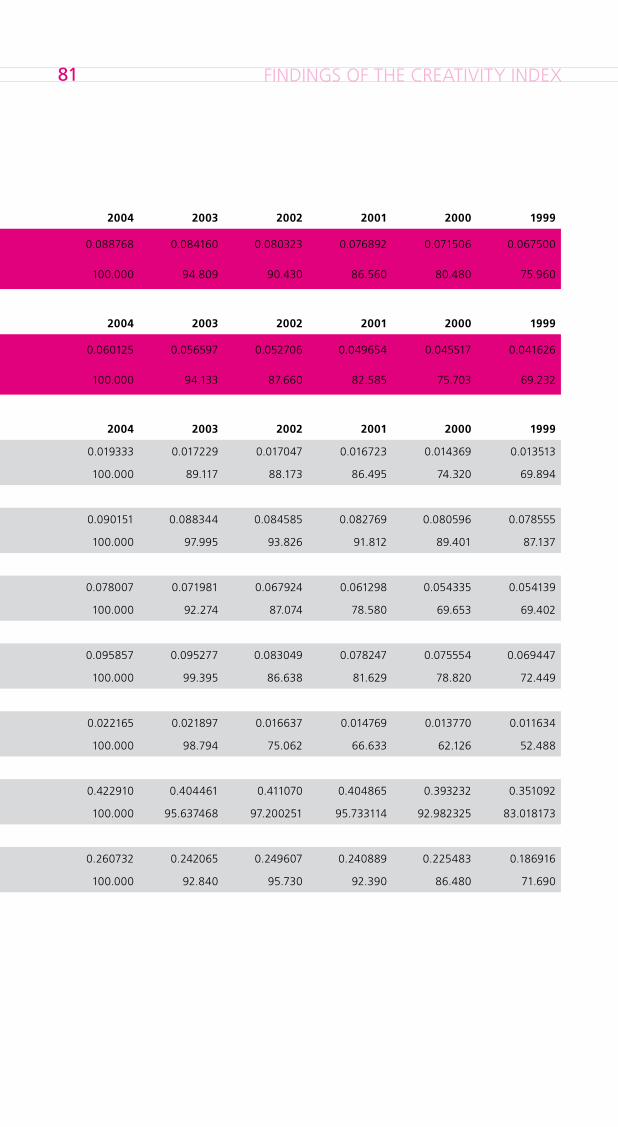
FINDINGS OF THE CREATIVITY INDEX�1
2004 2003 2002 2001 2000 1999
Overall Creativity Index (applying survey data of 2005 to all years) 0.088768 0.084160 0.080323 0.076892 0.071506 0.067500
using 100 as reference for the year 2004 100.000 94.809 90.430 86.560 80.480 75.960
2004 2003 2002 2001 2000 1999
Overall Creativity Index (excluding survey data) 0.060125 0.056597 0.052706 0.049654 0.045517 0.041626
using 100 as reference for the year 2004 100.000 94.133 87.660 82.585 75.703 69.232
2004 2003 2002 2001 2000 1999
1 Outcomes of Creativity Index 0.019333 0.017229 0.017047 0.016723 0.014369 0.013513
using 100 as reference for the year 2004 100.000 89.117 88.173 86.495 74.320 69.894
2 Structural/Institutional Capital Index 0.090151 0.088344 0.084585 0.082769 0.080596 0.078555
using 100 as reference for the year 2004 100.000 97.995 93.826 91.812 89.401 87.137
3 Human Capital Index 0.078007 0.071981 0.067924 0.061298 0.054335 0.054139
using 100 as reference for the year 2004 100.000 92.274 87.074 78.580 69.653 69.402
4 Social Capital Index (applying survey data of 2005 to all years) 0.095857 0.095277 0.083049 0.078247 0.075554 0.069447
using 100 as reference for the year 2004 100.000 99.395 86.638 81.629 78.820 72.449
Social Capital Index (excluding survey data) 0.022165 0.021897 0.016637 0.014769 0.013770 0.011634
using 100 as reference for the year 2004 100.000 98.794 75.062 66.633 62.126 52.488
5 Cultural Capital Index (applying survey data of 2005 to all years) 0.422910 0.404461 0.411070 0.404865 0.393232 0.351092
using 100 as reference for the year 2004 100.000 95.637468 97.200251 95.733114 92.982325 83.018173
Cultural Capital Index (excluding survey data) 0.260732 0.242065 0.249607 0.240889 0.225483 0.186916
using 100 as reference for the year 2004 100.000 92.840 95.730 92.390 86.480 71.690
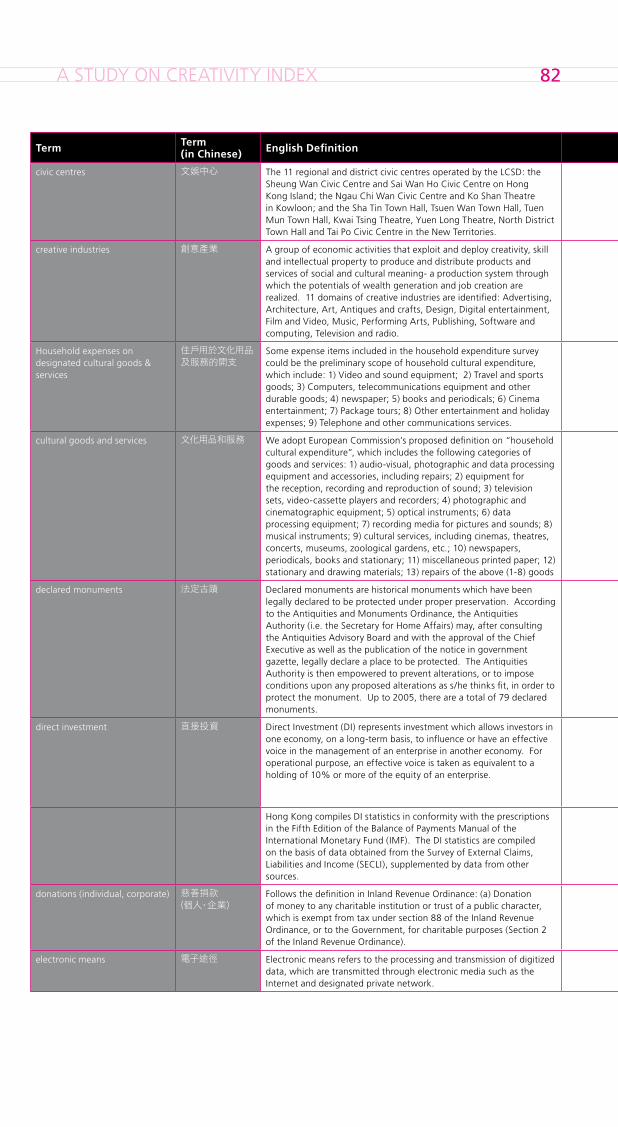
A STUDY ON CREATIVITY INDEX ��
Term Term (in Chinese) English Definition Chinese Definition Reference
civic centres 文娛中心 The 11 regional and district civic centres operated by the LCSD: the Sheung Wan Civic Centre and Sai Wan Ho Civic Centre on Hong Kong Island; the Ngau Chi Wan Civic Centre and Ko Shan Theatre in Kowloon; and the Sha Tin Town Hall, Tsuen Wan Town Hall, Tuen Mun Town Hall, Kwai Tsing Theatre, Yuen Long Theatre, North District Town Hall and Tai Po Civic Centre in the New Territories.
由康樂及文化事務署管理的11個區域文娛中心:港島 - 上環文娛中心、西灣河文娛中心;九龍 - 牛池灣文娛中心、高山劇場; 新界 - 沙田大會堂、荃灣大會堂、屯門大會堂、葵青劇院、元朗劇院、北區大會堂和大埔文娛中心。
Hong Kong Yearbook 2003 (http://www.info.gov.hk/yearbook/2003/english/chapter19/19_16.html)
creative industries 創意產業 A group of economic activities that exploit and deploy creativity, skill and intellectual property to produce and distribute products and services of social and cultural meaning- a production system through which the potentials of wealth generation and job creation are realized. 11 domains of creative industries are identified: Advertising, Architecture, Art, Antiques and crafts, Design, Digital entertainment, Film and Video, Music, Performing Arts, Publishing, Software and computing, Television and radio.
一個經濟活動群組,開拓和利用創意、技術和知識產權以生產並分配具有社會及文化意義的產興服務,更可望成為一個創造財富和就業的生產系統。創意產業的11個主要行業包括:廣告,建築,藝術品、古董及工藝品,設計,數碼娛樂,電影與錄像,音樂,表演藝術,出版,軟件與電子計算,電視與電台。
Baseline Study on Hong Kong’s Creative Industries (2003)
Household expenses on designated cultural goods & services
住戶用於文化用品及服務的開支
Some expense items included in the household expenditure survey could be the preliminary scope of household cultural expenditure, which include: 1) Video and sound equipment; 2) Travel and sports goods; 3) Computers, telecommunications equipment and other durable goods; 4) newspaper; 5) books and periodicals; 6) Cinema entertainment; 7) Package tours; 8) Other entertainment and holiday expenses; 9) Telephone and other communications services.
一些在住戶開支內的項目能作為住戶文化開支的初步範圍。它們包括:1)影音器材;2) 旅行及體育用品; 3) 電腦、通訊設備及其他耐用物品;4)報紙; 5)書籍及期刊; 6)電影娛樂; 7)旅遊; 8)其他娛樂開支及假期開支 及 9) 電話及其他通訊服務。
http://www.info.gov.hk/censtatd/eng/hkstat/fas/hes/hes_index.html
cultural goods and services 文化用品和服務 We adopt European Commission’s proposed definition on “household cultural expenditure”, which includes the following categories of goods and services: 1) audio-visual, photographic and data processing equipment and accessories, including repairs; 2) equipment for the reception, recording and reproduction of sound; 3) television sets, video-cassette players and recorders; 4) photographic and cinematographic equipment; 5) optical instruments; 6) data processing equipment; 7) recording media for pictures and sounds; 8) musical instruments; 9) cultural services, including cinemas, theatres, concerts, museums, zoological gardens, etc.; 10) newspapers, periodicals, books and stationary; 11) miscellaneous printed paper; 12) stationary and drawing materials; 13) repairs of the above (1-8) goods
我們採用了歐洲執行委員會提出的定義。”住戶文化開支”包括以下用品及服務:1)影音、攝影和資料處理器材和配件,包括維修;2)聲音接收、錄取和複製;3)電視機、卡式帶播放機和錄音機;4)攝影和電影拍攝器材;5)光學儀器;6)資料處理器材;7)圖像和聲音的錄取媒體;8)樂器;9)文化服務,包括電影院、劇場、音樂會、博物館、動物公園等;10)報紙、期刊、書籍和文具;11)各種印刷物品、12)文具及繪畫介質;13)第1-8項用品的維修服務。
declared monuments 法定古蹟 Declared monuments are historical monuments which have been legally declared to be protected under proper preservation. According to the Antiquities and Monuments Ordinance, the Antiquities Authority (i.e. the Secretary for Home Affairs) may, after consulting the Antiquities Advisory Board and with the approval of the Chief Executive as well as the publication of the notice in government gazette, legally declare a place to be protected. The Antiquities Authority is then empowered to prevent alterations, or to impose conditions upon any proposed alterations as s/he thinks fit, in order to protect the monument. Up to 2005, there are a total of 79 declared monuments.
法定古蹟為受法例保護的歷史古蹟。根據古物及古蹟條例,古物事務監督(即民政事務局局長)與古物諮詢委員會商討,並經行政長官批准及刊登憲報後,可宣布個別文物為法定古蹟,受法例保護。隨後,古物事務監督可阻止古蹟的任何改動,或酌情規定改動時必須遵守的條件,以便保護有關古蹟。到2005年為止,已宣布為法定古蹟的共有七十九項。
Antiquities and Monuments Office (http://www.amo.gov.hk/en/monuments.php, http://www.amo.gov.hk/b5/monuments.php)
direct investment 直接投資 Direct Investment (DI) represents investment which allows investors in one economy, on a long-term basis, to influence or have an effective voice in the management of an enterprise in another economy. For operational purpose, an effective voice is taken as equivalent to a holding of 10% or more of the equity of an enterprise.
直接投資是指一個經濟體系的投資者在另一經濟體系的企業所作的投資,而此等投資令該投資者能長期有效地影響有關企業的管理經營決定。在統計調查中,若投資者持有某一企業10%或以上的股本,便被視為能長期有效地影響有關企業的管理經營決定。
Census and Statistics Department, January 2003 issue of the Hong Kong Monthly Digest of Statistics, Feature Articles FA3 (http://www.info.gov.hk/censtatd/eng/interest/re-vised_description/di_index.html) http://www.info.gov.hk/censtatd/chinese/interest/re-vised_description/di_index.html
Hong Kong compiles DI statistics in conformity with the prescriptions in the Fifth Edition of the Balance of Payments Manual of the International Monetary Fund (IMF). The DI statistics are compiled on the basis of data obtained from the Survey of External Claims, Liabilities and Income (SECLI), supplemented by data from other sources.
香港是根據國際貨幣基金組織出版的國際收支平衡手冊(第五版)的規定編製直接投資統計數字。直接投資統計數字是根據「對外申索、負債及收益統計調查」所得的數據,輔以其他來源所得的資料編製而成。
donations (individual, corporate) 慈善捐款(個人,企業)
Follows the definition in Inland Revenue Ordinance: (a) Donation of money to any charitable institution or trust of a public character, which is exempt from tax under section 88 of the Inland Revenue Ordinance, or to the Government, for charitable purposes (Section 2 of the Inland Revenue Ordinance).
「認可慈善捐款」是指捐贈給根據《稅務條例》第88條獲豁免繳稅的屬公共性質的慈善機構或慈善信託作慈善用途的款項,或指捐贈給政府作慈善用途的款項。 (《稅務條例》第 2條)
Inland Revenue Department (“http://www.ird.gov.hk/eng/tax/ach.htm” and “http://www.ird.gov.hk/eng/tax/ind_acd.htm”) 稅務局─慈善捐款及獲豁免繳稅的慈善團體 http://www.ird.gov.hk/chi/tax/ach.htm
electronic means 電子途徑 Electronic means refers to the processing and transmission of digitized data, which are transmitted through electronic media such as the Internet and designated private network.
電子途徑是指以電子媒介 (例如互聯網及專用私人網絡等) 處理及傳送數碼數據。
http://www.info.gov.hk/censtatd/eng/hkstat/con-cepts_methods/cm_it.htm, http://www.info.gov.hk/censtatd/chinese/hkstat/concepts_methods/cm_it.htm
APPENDICES��: :GLOSSARY
Term Term (in Chinese) English Definition Chinese Definition Reference
civic centres 文娛中心 The 11 regional and district civic centres operated by the LCSD: the Sheung Wan Civic Centre and Sai Wan Ho Civic Centre on Hong Kong Island; the Ngau Chi Wan Civic Centre and Ko Shan Theatre in Kowloon; and the Sha Tin Town Hall, Tsuen Wan Town Hall, Tuen Mun Town Hall, Kwai Tsing Theatre, Yuen Long Theatre, North District Town Hall and Tai Po Civic Centre in the New Territories.
由康樂及文化事務署管理的11個區域文娛中心:港島 - 上環文娛中心、西灣河文娛中心;九龍 - 牛池灣文娛中心、高山劇場; 新界 - 沙田大會堂、荃灣大會堂、屯門大會堂、葵青劇院、元朗劇院、北區大會堂和大埔文娛中心。
Hong Kong Yearbook 2003 (http://www.info.gov.hk/yearbook/2003/english/chapter19/19_16.html)
creative industries 創意產業 A group of economic activities that exploit and deploy creativity, skill and intellectual property to produce and distribute products and services of social and cultural meaning- a production system through which the potentials of wealth generation and job creation are realized. 11 domains of creative industries are identified: Advertising, Architecture, Art, Antiques and crafts, Design, Digital entertainment, Film and Video, Music, Performing Arts, Publishing, Software and computing, Television and radio.
一個經濟活動群組,開拓和利用創意、技術和知識產權以生產並分配具有社會及文化意義的產興服務,更可望成為一個創造財富和就業的生產系統。創意產業的11個主要行業包括:廣告,建築,藝術品、古董及工藝品,設計,數碼娛樂,電影與錄像,音樂,表演藝術,出版,軟件與電子計算,電視與電台。
Baseline Study on Hong Kong’s Creative Industries (2003)
Household expenses on designated cultural goods & services
住戶用於文化用品及服務的開支
Some expense items included in the household expenditure survey could be the preliminary scope of household cultural expenditure, which include: 1) Video and sound equipment; 2) Travel and sports goods; 3) Computers, telecommunications equipment and other durable goods; 4) newspaper; 5) books and periodicals; 6) Cinema entertainment; 7) Package tours; 8) Other entertainment and holiday expenses; 9) Telephone and other communications services.
一些在住戶開支內的項目能作為住戶文化開支的初步範圍。它們包括:1)影音器材;2) 旅行及體育用品; 3) 電腦、通訊設備及其他耐用物品;4)報紙; 5)書籍及期刊; 6)電影娛樂; 7)旅遊; 8)其他娛樂開支及假期開支 及 9) 電話及其他通訊服務。
http://www.info.gov.hk/censtatd/eng/hkstat/fas/hes/hes_index.html
cultural goods and services 文化用品和服務 We adopt European Commission’s proposed definition on “household cultural expenditure”, which includes the following categories of goods and services: 1) audio-visual, photographic and data processing equipment and accessories, including repairs; 2) equipment for the reception, recording and reproduction of sound; 3) television sets, video-cassette players and recorders; 4) photographic and cinematographic equipment; 5) optical instruments; 6) data processing equipment; 7) recording media for pictures and sounds; 8) musical instruments; 9) cultural services, including cinemas, theatres, concerts, museums, zoological gardens, etc.; 10) newspapers, periodicals, books and stationary; 11) miscellaneous printed paper; 12) stationary and drawing materials; 13) repairs of the above (1-8) goods
我們採用了歐洲執行委員會提出的定義。”住戶文化開支”包括以下用品及服務:1)影音、攝影和資料處理器材和配件,包括維修;2)聲音接收、錄取和複製;3)電視機、卡式帶播放機和錄音機;4)攝影和電影拍攝器材;5)光學儀器;6)資料處理器材;7)圖像和聲音的錄取媒體;8)樂器;9)文化服務,包括電影院、劇場、音樂會、博物館、動物公園等;10)報紙、期刊、書籍和文具;11)各種印刷物品、12)文具及繪畫介質;13)第1-8項用品的維修服務。
declared monuments 法定古蹟 Declared monuments are historical monuments which have been legally declared to be protected under proper preservation. According to the Antiquities and Monuments Ordinance, the Antiquities Authority (i.e. the Secretary for Home Affairs) may, after consulting the Antiquities Advisory Board and with the approval of the Chief Executive as well as the publication of the notice in government gazette, legally declare a place to be protected. The Antiquities Authority is then empowered to prevent alterations, or to impose conditions upon any proposed alterations as s/he thinks fit, in order to protect the monument. Up to 2005, there are a total of 79 declared monuments.
法定古蹟為受法例保護的歷史古蹟。根據古物及古蹟條例,古物事務監督(即民政事務局局長)與古物諮詢委員會商討,並經行政長官批准及刊登憲報後,可宣布個別文物為法定古蹟,受法例保護。隨後,古物事務監督可阻止古蹟的任何改動,或酌情規定改動時必須遵守的條件,以便保護有關古蹟。到2005年為止,已宣布為法定古蹟的共有七十九項。
Antiquities and Monuments Office (http://www.amo.gov.hk/en/monuments.php, http://www.amo.gov.hk/b5/monuments.php)
direct investment 直接投資 Direct Investment (DI) represents investment which allows investors in one economy, on a long-term basis, to influence or have an effective voice in the management of an enterprise in another economy. For operational purpose, an effective voice is taken as equivalent to a holding of 10% or more of the equity of an enterprise.
直接投資是指一個經濟體系的投資者在另一經濟體系的企業所作的投資,而此等投資令該投資者能長期有效地影響有關企業的管理經營決定。在統計調查中,若投資者持有某一企業10%或以上的股本,便被視為能長期有效地影響有關企業的管理經營決定。
Census and Statistics Department, January 2003 issue of the Hong Kong Monthly Digest of Statistics, Feature Articles FA3 (http://www.info.gov.hk/censtatd/eng/interest/re-vised_description/di_index.html) http://www.info.gov.hk/censtatd/chinese/interest/re-vised_description/di_index.html
Hong Kong compiles DI statistics in conformity with the prescriptions in the Fifth Edition of the Balance of Payments Manual of the International Monetary Fund (IMF). The DI statistics are compiled on the basis of data obtained from the Survey of External Claims, Liabilities and Income (SECLI), supplemented by data from other sources.
香港是根據國際貨幣基金組織出版的國際收支平衡手冊(第五版)的規定編製直接投資統計數字。直接投資統計數字是根據「對外申索、負債及收益統計調查」所得的數據,輔以其他來源所得的資料編製而成。
donations (individual, corporate) 慈善捐款(個人,企業)
Follows the definition in Inland Revenue Ordinance: (a) Donation of money to any charitable institution or trust of a public character, which is exempt from tax under section 88 of the Inland Revenue Ordinance, or to the Government, for charitable purposes (Section 2 of the Inland Revenue Ordinance).
「認可慈善捐款」是指捐贈給根據《稅務條例》第88條獲豁免繳稅的屬公共性質的慈善機構或慈善信託作慈善用途的款項,或指捐贈給政府作慈善用途的款項。 (《稅務條例》第 2條)
Inland Revenue Department (“http://www.ird.gov.hk/eng/tax/ach.htm” and “http://www.ird.gov.hk/eng/tax/ind_acd.htm”) 稅務局─慈善捐款及獲豁免繳稅的慈善團體 http://www.ird.gov.hk/chi/tax/ach.htm
electronic means 電子途徑 Electronic means refers to the processing and transmission of digitized data, which are transmitted through electronic media such as the Internet and designated private network.
電子途徑是指以電子媒介 (例如互聯網及專用私人網絡等) 處理及傳送數碼數據。
http://www.info.gov.hk/censtatd/eng/hkstat/con-cepts_methods/cm_it.htm, http://www.info.gov.hk/censtatd/chinese/hkstat/concepts_methods/cm_it.htm
A STUDY ON CREATIVITY INDEX ��
establishments 機構單位 According to the Quarterly Survey of Employment and Vacancies (SEV), an establishment is defined as an economic unit, which engages, under a single ownership or control, in one or predominantly one kind of economic activity at a single physical location, e.g. an individual factory, workshop, retail shop and office. The industrial coverage is not complete. There are some economic activities not covered, viz. the entire agriculture and fishing sector; the construction sector except those manual workers at construction sites; hawkers and retail pitches except market stalls; taxis, public light buses, goods vehicles, barges, lighters and stevedoring services; public administration, religious organizations, authors and other independent artists, domestic helpers, and miscellaneous recreational and personal services.
機構單位是指在單一擁有權或控制權下,在單一地點從事一種或主要從事一種經濟活動的經濟單位,例如個別工廠、工場、零售店及辦公室。是項統計調查所包括的行業並不完整,部分經濟活動不包括在內,分別是整個農業及漁業;建造業 (建築地盤工人除外) ;小販及零售攤檔 (街市攤檔除外);的士、公共小巴、貨車、躉船、駁船及船上裝卸服務;公共行政、宗教組織、作家及其他獨立藝術工作者、家務助理及其他康樂和個人服務。
Hong Kong Annual Digest of Statistics 2004 《香港統計年刊》2004 , Concepts and Definitions 概念及定義, p. 14.
expenditure on arts and culture 文化藝術支出 According to the Government Budget, the Home Affairs Bureau (HAB) takes over the expenditure on arts and culture in Hong Kong. The budget is allocated to facilities provision and management, presentation of programmes and direct financial support to arts and culture organisations. The Government plays the role of enabler, supplier and venue manager through the Leisure and Cultural Services Department (LCSD), which is responsible for the provision of arts and cultural services in museums, libraries and performing arts venues. The Arts Development Council and the Academy of Performing Arts are also subvented by the HAB.
根據政府的財政預算,民政事務局掌管著香港文化藝術的支出。預算開支被用於設施的提供、主辦節目和對文化藝術團體的直接財政支持。政府的角色為一個推動者、供應者及場地管理者;並通過康樂及文化事務署提供在博物館、圖書館和表演藝術場地的文藝服務。藝術發展局和演藝學院也是由民政局資助的。
http://www.budget.gov.hk/2005/eng/head053.pdf, p.6
household 住戶 (General) Household consists of a group of persons who live together and make common provision for essentials for living. These persons need not be related. If a person makes provision for essentials for living without sharing with other persons, he/she is also regarded as a household. In this case, the household is a one-person household.
(家庭)住戶指一群住在一起即分享生活所需的人士,他們之間不一定有親戚關係。自己單獨安排生活所需的個別人士亦當為一戶,即「單人住戶」。
The Quarterly Report on General Household Survey by Census and Statistics Department 《綜合住戶統計調查按季統計報告》
inward direct investment 外來直接投資 Inward direct investment refers to direct investment in a Hong Kong enterprise by a non-Hong Kong resident. Typical examples of inward direct investment are multinational corporations’ branches and subsidiaries operating in Hong Kong.
外來直接投資是指境外居民在香港的企業所作的直接投資。跨國企業在香港經營的分行或附屬公司,是外來直接投資的典型例子。
Hong Kong Annual Digest of Statistics 2004 《香港統計年刊》2004, Concepts and Definitions 概念及定義, p. 386.
job-related training or retraining courses
與工作有關的培訓或再培訓課程
Types of job related/retraining courses include: 1. Management skills, 2. IT skills, 3. Language skills, 4. Job-specific skills, 5. Interpersonal and intrapersonal skills required for workplace, 6. China-related knowledge and world vision, 7. Other skills
與工作有關的培訓/再培訓課程類別包括:1)管理技能,2)資訊科技技能,3)語文技能,4)特定工作技能,5)工作間的人際及個人才能,6)有關中國的知識及世界視野,7)其他技能。
Thematic Household Survey Report No. 13 (Jul-Sep 2002) by Census and Statistics Department 《政府統計處主題性住戶統計調查第十三號報告書》
listed companies 上市公司 Listed companies refer to companies which are listed on the Main Board stock market and the Growth Enterprise Market (GEM). The Main Board is a market for capital formation by established companies with a profitable operating track record or companies meeting alternative financial standards to profit requirement. The Growth Enterprise Market is an alternative market established in November 1999 to provide capital formation opportunities for growth companies from all industries and of all sizes.
主 板 和 創 業 板 為 香 港 交 易 所 證 券 市 場 的 兩 個 交 易 平 台 。 主板為一般規模較大、成立時間較長,也具備一定盈利紀錄的公司、或符合盈利紀錄規定以外的兩項其他財務測試的公司提供集資市場。 創業板是於1999年11月設立的一個另類股票市場,旨在為不同行業及規模的增長性公司提供集資機會。
http://www.hkex.com.hk/invedu/faq/list_req.htm HKEx--Investor Education (Frequently Asked Questions--Listing Requirements Q14) http://www.hkex.com.hk/invedu/faq/list_req_c.htm 香港交易所--投資者教育 (常問問題--上市要求 Q14)
mobile population 流動居民 According to C&SD’s definition, mobile residents refer to Hong Kong Permanent Residents who had stayed in Hong Kong for at least one month but less than three months during the six months before or for at least one month but less than three months during the six months after the census moment, regardless of whether they were in Hong Kong or not at the census moment.
指在普查時刻前的六個月內,在港逗留最少一個月但少於三個月,或在普查時刻後的六個月內,在港逗留最少一個月但少於三個月的香港永久性居民,不論在普查時刻他們是否身在香港。
Concepts and Definitions for the 2001 Population Census (English:http://www.info.gov.hk/censtatd/eng/news/rev_stat/new_pop_est/pop_fa.htm) (Chinese:http://www.info.gov.hk/censtatd/chinese/news/rev_stat/new_pop_est/pop_fa.htm) (English:http://www.info.gov.hk/censtatd/chinese/hkstat/fas/01c/concept_01c.htm) (Chinese:http://www.info.gov.hk/censtatd/eng/hkstat/fas/01c/concept_01c.htm)
museums 博物館 Refers to the LCSD’s public museums and other museums listed on LCSD’s website, including Hong Kong Heritage Museum, Hong Kong Railway Museum, Sam Tung Uk Museum, Sheung Yiu Folk Museum, Hong Kong Film Archive, Hong Kong Museum of Art, Flagstaff House Museum of Teaware, Hong Kong Museum of History, Law Uk Folk Museum, Lei Cheng Uk Han Tomb Museum, Hong Kong Museum of Coastal Defense, Hong Kong Science Museum, Hong Kong Space Museum, Art Museum at the Chinese University of Hong Kong, Hong Kong Correctional Service Museum, Hong Kong Planning and Infrastructure Exhibition Gallery, Lions Nature Education Centre, Museum of Ethnology, Museum of Medical Sciences, Po Leung Kuk Museum, Police Museum, Racing Museum, Tung Wah Museum and University Museum and Art Gallery at the University of Hong Kong.
博物館包括康文署博物館和其他博物館 (根據康文署的網站),分別是香港文化博物館、香港鐵路博物館、三棟屋博物館、上窯民俗博物館、香港電影資料館、香港藝術館、茶具文物館、香港歷史博物館、羅屋民俗館、李鄭屋漢墓博物館、香港海防博物館、香港科學館、香港太空館、香港中文大學文物館、香港懲教博物館、香港規劃及基建展覽館、獅子會自然教育中心、人類民俗館、香港醫學博物館、保良局歷史博物館、警隊博物館、香港賽馬博物館、東華三院文物館、香港大學美術博物館。
Leisure and Cultural Services Department (http://www.lcsd.gov.hk/en/cs_mus_intro.php) 康樂及文化事務署 (http://www.lcsd.gov.hk/b5/cs_mus_intro.php) http://www.lcsd.gov.hk/b5/cs_mus_other.php http://www.lcsd.gov.hk/eng/cs_mus_other.php
NGOs 非政府組織 NGOs refer to the societies registered in the Licensing Office of Hong Kong Police Force. These non-government organizations include business/professional associations, charitable associations, community services organizations, cultural organizations, ethnic societies, political societies, sports organizations and recreational/social organizations.
非政府組織指在香港警務處牌照科登記的社團。這些非政府組織包括商業 / 專業協會、慈善協會、社區服務機構、文化團體、種族社團、政治團體、體育組織和康樂 / 社會組織。
Licensing Office, Hong Kong Police Force: “Number of societies registered in the Licensing Office”
APPENDICES��: :GLOSSARY
establishments 機構單位 According to the Quarterly Survey of Employment and Vacancies (SEV), an establishment is defined as an economic unit, which engages, under a single ownership or control, in one or predominantly one kind of economic activity at a single physical location, e.g. an individual factory, workshop, retail shop and office. The industrial coverage is not complete. There are some economic activities not covered, viz. the entire agriculture and fishing sector; the construction sector except those manual workers at construction sites; hawkers and retail pitches except market stalls; taxis, public light buses, goods vehicles, barges, lighters and stevedoring services; public administration, religious organizations, authors and other independent artists, domestic helpers, and miscellaneous recreational and personal services.
機構單位是指在單一擁有權或控制權下,在單一地點從事一種或主要從事一種經濟活動的經濟單位,例如個別工廠、工場、零售店及辦公室。是項統計調查所包括的行業並不完整,部分經濟活動不包括在內,分別是整個農業及漁業;建造業 (建築地盤工人除外) ;小販及零售攤檔 (街市攤檔除外);的士、公共小巴、貨車、躉船、駁船及船上裝卸服務;公共行政、宗教組織、作家及其他獨立藝術工作者、家務助理及其他康樂和個人服務。
Hong Kong Annual Digest of Statistics 2004 《香港統計年刊》2004 , Concepts and Definitions 概念及定義, p. 14.
expenditure on arts and culture 文化藝術支出 According to the Government Budget, the Home Affairs Bureau (HAB) takes over the expenditure on arts and culture in Hong Kong. The budget is allocated to facilities provision and management, presentation of programmes and direct financial support to arts and culture organisations. The Government plays the role of enabler, supplier and venue manager through the Leisure and Cultural Services Department (LCSD), which is responsible for the provision of arts and cultural services in museums, libraries and performing arts venues. The Arts Development Council and the Academy of Performing Arts are also subvented by the HAB.
根據政府的財政預算,民政事務局掌管著香港文化藝術的支出。預算開支被用於設施的提供、主辦節目和對文化藝術團體的直接財政支持。政府的角色為一個推動者、供應者及場地管理者;並通過康樂及文化事務署提供在博物館、圖書館和表演藝術場地的文藝服務。藝術發展局和演藝學院也是由民政局資助的。
http://www.budget.gov.hk/2005/eng/head053.pdf, p.6
household 住戶 (General) Household consists of a group of persons who live together and make common provision for essentials for living. These persons need not be related. If a person makes provision for essentials for living without sharing with other persons, he/she is also regarded as a household. In this case, the household is a one-person household.
(家庭)住戶指一群住在一起即分享生活所需的人士,他們之間不一定有親戚關係。自己單獨安排生活所需的個別人士亦當為一戶,即「單人住戶」。
The Quarterly Report on General Household Survey by Census and Statistics Department 《綜合住戶統計調查按季統計報告》
inward direct investment 外來直接投資 Inward direct investment refers to direct investment in a Hong Kong enterprise by a non-Hong Kong resident. Typical examples of inward direct investment are multinational corporations’ branches and subsidiaries operating in Hong Kong.
外來直接投資是指境外居民在香港的企業所作的直接投資。跨國企業在香港經營的分行或附屬公司,是外來直接投資的典型例子。
Hong Kong Annual Digest of Statistics 2004 《香港統計年刊》2004, Concepts and Definitions 概念及定義, p. 386.
job-related training or retraining courses
與工作有關的培訓或再培訓課程
Types of job related/retraining courses include: 1. Management skills, 2. IT skills, 3. Language skills, 4. Job-specific skills, 5. Interpersonal and intrapersonal skills required for workplace, 6. China-related knowledge and world vision, 7. Other skills
與工作有關的培訓/再培訓課程類別包括:1)管理技能,2)資訊科技技能,3)語文技能,4)特定工作技能,5)工作間的人際及個人才能,6)有關中國的知識及世界視野,7)其他技能。
Thematic Household Survey Report No. 13 (Jul-Sep 2002) by Census and Statistics Department 《政府統計處主題性住戶統計調查第十三號報告書》
listed companies 上市公司 Listed companies refer to companies which are listed on the Main Board stock market and the Growth Enterprise Market (GEM). The Main Board is a market for capital formation by established companies with a profitable operating track record or companies meeting alternative financial standards to profit requirement. The Growth Enterprise Market is an alternative market established in November 1999 to provide capital formation opportunities for growth companies from all industries and of all sizes.
主 板 和 創 業 板 為 香 港 交 易 所 證 券 市 場 的 兩 個 交 易 平 台 。 主板為一般規模較大、成立時間較長,也具備一定盈利紀錄的公司、或符合盈利紀錄規定以外的兩項其他財務測試的公司提供集資市場。 創業板是於1999年11月設立的一個另類股票市場,旨在為不同行業及規模的增長性公司提供集資機會。
http://www.hkex.com.hk/invedu/faq/list_req.htm HKEx--Investor Education (Frequently Asked Questions--Listing Requirements Q14) http://www.hkex.com.hk/invedu/faq/list_req_c.htm 香港交易所--投資者教育 (常問問題--上市要求 Q14)
mobile population 流動居民 According to C&SD’s definition, mobile residents refer to Hong Kong Permanent Residents who had stayed in Hong Kong for at least one month but less than three months during the six months before or for at least one month but less than three months during the six months after the census moment, regardless of whether they were in Hong Kong or not at the census moment.
指在普查時刻前的六個月內,在港逗留最少一個月但少於三個月,或在普查時刻後的六個月內,在港逗留最少一個月但少於三個月的香港永久性居民,不論在普查時刻他們是否身在香港。
Concepts and Definitions for the 2001 Population Census (English:http://www.info.gov.hk/censtatd/eng/news/rev_stat/new_pop_est/pop_fa.htm) (Chinese:http://www.info.gov.hk/censtatd/chinese/news/rev_stat/new_pop_est/pop_fa.htm) (English:http://www.info.gov.hk/censtatd/chinese/hkstat/fas/01c/concept_01c.htm) (Chinese:http://www.info.gov.hk/censtatd/eng/hkstat/fas/01c/concept_01c.htm)
museums 博物館 Refers to the LCSD’s public museums and other museums listed on LCSD’s website, including Hong Kong Heritage Museum, Hong Kong Railway Museum, Sam Tung Uk Museum, Sheung Yiu Folk Museum, Hong Kong Film Archive, Hong Kong Museum of Art, Flagstaff House Museum of Teaware, Hong Kong Museum of History, Law Uk Folk Museum, Lei Cheng Uk Han Tomb Museum, Hong Kong Museum of Coastal Defense, Hong Kong Science Museum, Hong Kong Space Museum, Art Museum at the Chinese University of Hong Kong, Hong Kong Correctional Service Museum, Hong Kong Planning and Infrastructure Exhibition Gallery, Lions Nature Education Centre, Museum of Ethnology, Museum of Medical Sciences, Po Leung Kuk Museum, Police Museum, Racing Museum, Tung Wah Museum and University Museum and Art Gallery at the University of Hong Kong.
博物館包括康文署博物館和其他博物館 (根據康文署的網站),分別是香港文化博物館、香港鐵路博物館、三棟屋博物館、上窯民俗博物館、香港電影資料館、香港藝術館、茶具文物館、香港歷史博物館、羅屋民俗館、李鄭屋漢墓博物館、香港海防博物館、香港科學館、香港太空館、香港中文大學文物館、香港懲教博物館、香港規劃及基建展覽館、獅子會自然教育中心、人類民俗館、香港醫學博物館、保良局歷史博物館、警隊博物館、香港賽馬博物館、東華三院文物館、香港大學美術博物館。
Leisure and Cultural Services Department (http://www.lcsd.gov.hk/en/cs_mus_intro.php) 康樂及文化事務署 (http://www.lcsd.gov.hk/b5/cs_mus_intro.php) http://www.lcsd.gov.hk/b5/cs_mus_other.php http://www.lcsd.gov.hk/eng/cs_mus_other.php
NGOs 非政府組織 NGOs refer to the societies registered in the Licensing Office of Hong Kong Police Force. These non-government organizations include business/professional associations, charitable associations, community services organizations, cultural organizations, ethnic societies, political societies, sports organizations and recreational/social organizations.
非政府組織指在香港警務處牌照科登記的社團。這些非政府組織包括商業 / 專業協會、慈善協會、社區服務機構、文化團體、種族社團、政治團體、體育組織和康樂 / 社會組織。
Licensing Office, Hong Kong Police Force: “Number of societies registered in the Licensing Office”
A STUDY ON CREATIVITY INDEX ��
patent applications 專利申請 Applications of patents are submitted to the Intellectual Property Department. Patents protect innovations developed by firms, institutions or individuals. A patent is a right in law conferred by a national or territorial official agency to an inventor. It gives the patent owner a monopoly of the invention and its industrial or commercial exploitation for a limited period and within a given territory. A patent can be bought/sold or transferred under a licence, either in whole or in part. There are two types of patent in the Hong Kong Special Administration Region, i.e. the standard patent and the short-term patent. Subject to payment of renewal fees, a standard patent in Hong Kong has a term of protection of up to 20 years, whereas a short-term patent has a maximum term of protection of 8 years.
專利的申請是向知識產權署提出申請的。專利保障由公司、機構或個人發展的創新物品。專利是由國家或地區的官方機構賦予發明人的法律權利。專利擁有人在限定期間和地區內,可享有有關發明的專利,並可就有關發明進行工業或商業方面的開發。專利的全部或部分可供買賣或經特許經營而轉讓。香港特別行政區設有兩類專利:標準專利及短期專利。在符合繳付續期費的規定下,香港標準專利有效期最長達20年,短期專利則最長達8年。
Intellectual Property Department, the government of the HKSAR, Hong Kong Monthly Digest of Statistics January 2003 《香港統計月刊》(二零零三年一月) English:http://www.ipd.gov.hk/eng/intellectual_property/patents/how_to_apply.htm*p3, Chinese:http://www.ipd.gov.hk/chi/intellectual_property/patents/how_to_apply.htm*p3
personal computer 個人電腦 Personal computer refers to a computer designed for individual use. Personal computer includes desktop computer, laptop/notebook computer and Personal Digital Assistant. Servers, workstations and terminals of mainframe or minicomputer are not included. Personal computers may be connected to form a Local Area network (LAN) or Wide Area network (WAN system).
個人電腦是指為個人使用而設的電腦,包括桌面電腦,便攜式電腦/筆記簿型電腦和個人數碼助理。不包括伺服器及用於主機或小型電腦的工作站和終端機。把個人電腦接駁一起可組成區域網絡或廣域網絡系統。
Annual Survey on Information Technology Usage and Penetration in the Business Sector for 2004, Census and Statistics Department 香港政府統計處《2004年資訊科技在工商業的使用情況和普及程度按年統計調查》
performance venues 表演場地 The following venues are included: LCSD’s “Performance Arts Venues”, including City Hall, Hong Kong Cultural Centre, Hong Kong Coliseum, Queen Elizabeth Stadium, Ngau Chi Wan Civic Centre, Sheung Wan Civic Centre, Sai Wan Ho Civic Centre, Ko Shan Theatre, Sha Tin Town Hall, Tsuen Wan Town Hall, Tuen Mun Town Hall, Kwai Tsing Theatre, Tai Po Civic Centre, North District Town Hall, Yuen Long Theatre; Other venues: Hong Kong Academy for Performing Arts, Hong Kong Arts Centre, Hong Kong Fringe Club
屬於康文署的表演場地包括香港大會堂、香港文化中心、香港體育館、伊利沙伯體育館、牛池灣文娛中心 、上環文娛中心、西灣河文娛中心、高山劇場、沙田大會堂、荃灣大會堂、屯門大會堂、葵青劇院、大埔文娛中心、北區大會堂及元朗劇院;
Leisure and Cultural Services Department English:http://www.lcsd.gov.hk/eng/cs_pa_venue.php 康樂及文化事務署Chinese:http://www.lcsd.gov.hk/b5/cs_pa_venue.php
public libraries 公共圖書館 The LCSD currently operates 70 public libraries, including eight mobile libraries.
香港的公共圖書館系統由康樂及文化事務署營辦。系統內共有70 所公共圖書館,其中八所是流動圖書館。
Hong Kong Yearbook 2003 (http://www.info.gov.hk/yearbook/2003/english/chapter19/19_16.html) (http://www.info.gov.hk/yearbook/2003/tc_chi/chapter19/19_16.html)
R&D expenditure 研究及發展 (研發)開支
Research and development (R&D) expenditure covers capital and current expenditures on R&D projects. Capital expenditure includes actual expenditure or investment in land, buildings and major equipment mainly for R&D activities during the reporting year. Current expenditure includes wages and salaries of R&D employees, cost of materials and supplies.
研究及發展 (研發) 開支涵蓋機構用於進行研發計劃的資本開支及經常開支。資本開支包括在填報年度內,為研發活動而投資在房地產及主要設備的實質開支。經常開支包括研發活動的僱員薪酬、原料及物料的成本。
Science and Technology: http://www.info.gov.hk/censtatd/eng/hkstat/concepts_methods/cm_it2_index.html 研究及發展: http://www.info.gov.hk/censtatd/chinese/hkstat/concepts_methods/cm_it2_index.html
R&D personnel 研究及發展人員數目
Persons engaged in R&D activities, regardless of whether they are in the business sector, the government sector or the higher education sector. R&D personnel cover researchers, technicians and other supporting staff (including postgraduate students). In line with international standard, the coverage of R&D personnel in the higher education sector has been enhanced by also incorporating full time “research postgraduate students” in the series. Prior to the enhancement, R&D personnel figures in that sector only covered “research related staff”which is defined as staff having devoted 80% or more of their time to research related activities. R&D activities refer to any creative work undertaken on a systematic basis in order to increase the stock of knowledge, including the knowledge of man, culture and society, and the use of this knowledge to devise new products/services/applications and to institute improvements of existing products/services/applications. They generally refer to activities with an element of novelty or innovation and can be conducted in such fields as physical sciences, engineering, medical sciences, social sciences or humanities.
研究及發展(研發)人員是指在工商機構、政府機構或高等教育機構從事研發活動的人員。研發人員包括研究員、技術員與其他輔助人員。為配合國際標準,已改良高等 教育機構研發人員的涵蓋範圍,在數列內加入了全時間「研究課程研究生」。在這改良之前,該等研發人員數字只包括「與研究有關的人員」,即是指用了80%或以上的工作時間進行與研究有關工作的員工。「研發活動」是指有系統的創意活動,目的是為增進知識,與及運用這些知識發明新產品、計劃新服務或提供新應用,以及改良現有產品、服務或應用。它們通常都帶有新穎或創新的元素,並可在各科學範疇,如自然科學、技術、工程學、醫學、社會科學或人文科學上進行。
研究及發展開支與研究及發展人員數目 http://www.info.gov.hk/censtatd/chinese/hkstat/fas/st/rd.htm Research and Development (R&D) expenditure and R&D personnel http://www.info.gov.hk/censtatd/eng/hkstat/fas/st/rd.htm 科技─研究及發展 http://www.info.gov.hk/censtatd/chinese/hkstat/concepts_methods/cm_it.htm, http://www.info.gov.hk/censtatd/chinese/hkstat/concepts_methods/cm_it2_index.htmlScience and Technology- Research and Development http://www.info.gov.hk/censtatd/eng/hkstat/concepts_methods/cm_it.htm, http://www.info.gov.hk/censtatd/eng/hkstat/concepts_methods/cm_it2_index.html
tertiary level education (degree and above)
專上教育(學位課程)
Tertiary level education (degree and above) includes all first degree, taught postgraduate and research postgraduate courses in local or non-local institutions.
包括本地及非本地教育機構的學士學位課程、授課形式深造課程及研究式深造課程。
2001 Population Census Main Report - Volume I 《2001年人口普查主要報告》
tertiary level education (non-degree)
專上教育 (非學位課程)
Tertiary level education (non-degree courses) include all higher diploma/endorsement certificate courses/associateship or equivalent courses in University/Institute of Vocational Education, other sub-degree(diploma/certificate/associate degree) courses in University, sub-degree(diploma/certificate) courses in other statutory or approved post-secondary colleges, diploma/certificate course in Hong Kong Institute of Education, nurse training courses and distance learning courses.
包括大學/專業教育學院的高級文憑/增修證書課程/院士銜或同等課程、大學的其他非學位(文憑/證書/副學士)課程、其他法定或認可的專上學院的非學位(文憑/證書)課程、其他專上學院的文憑/證書課程、香港教育學院文憑/證書課程、護士訓練課程及遙距課程。
2001 Population Census Main Report - Volume I 《2001年人口普查主要報告》
time use pattern 運用時間的模式 The daily patterns of time use of Hong Kong residents in various types of activities, such as voluntary work, social entertainment/ leisure/ recreational/ cultural activities, and sharing of housework among household members.
香港居民的運用時間模式包含多種活動,如義務工作、社交娛樂/消閒/康樂/文化活動,以及與家中成員分擔家務。
Census and Statistics Department, Thematic Household Survey Report No. 14 (2003) 政府統計處《主題性住戶統計調查第十四號報告書》(2003) http://www.gov.hk/censtatd/eng/hkstat/social_topics/ths14-ppsa.pdf
APPENDICES��: :GLOSSARY
patent applications 專利申請 Applications of patents are submitted to the Intellectual Property Department. Patents protect innovations developed by firms, institutions or individuals. A patent is a right in law conferred by a national or territorial official agency to an inventor. It gives the patent owner a monopoly of the invention and its industrial or commercial exploitation for a limited period and within a given territory. A patent can be bought/sold or transferred under a licence, either in whole or in part. There are two types of patent in the Hong Kong Special Administration Region, i.e. the standard patent and the short-term patent. Subject to payment of renewal fees, a standard patent in Hong Kong has a term of protection of up to 20 years, whereas a short-term patent has a maximum term of protection of 8 years.
專利的申請是向知識產權署提出申請的。專利保障由公司、機構或個人發展的創新物品。專利是由國家或地區的官方機構賦予發明人的法律權利。專利擁有人在限定期間和地區內,可享有有關發明的專利,並可就有關發明進行工業或商業方面的開發。專利的全部或部分可供買賣或經特許經營而轉讓。香港特別行政區設有兩類專利:標準專利及短期專利。在符合繳付續期費的規定下,香港標準專利有效期最長達20年,短期專利則最長達8年。
Intellectual Property Department, the government of the HKSAR, Hong Kong Monthly Digest of Statistics January 2003 《香港統計月刊》(二零零三年一月) English:http://www.ipd.gov.hk/eng/intellectual_property/patents/how_to_apply.htm*p3, Chinese:http://www.ipd.gov.hk/chi/intellectual_property/patents/how_to_apply.htm*p3
personal computer 個人電腦 Personal computer refers to a computer designed for individual use. Personal computer includes desktop computer, laptop/notebook computer and Personal Digital Assistant. Servers, workstations and terminals of mainframe or minicomputer are not included. Personal computers may be connected to form a Local Area network (LAN) or Wide Area network (WAN system).
個人電腦是指為個人使用而設的電腦,包括桌面電腦,便攜式電腦/筆記簿型電腦和個人數碼助理。不包括伺服器及用於主機或小型電腦的工作站和終端機。把個人電腦接駁一起可組成區域網絡或廣域網絡系統。
Annual Survey on Information Technology Usage and Penetration in the Business Sector for 2004, Census and Statistics Department 香港政府統計處《2004年資訊科技在工商業的使用情況和普及程度按年統計調查》
performance venues 表演場地 The following venues are included: LCSD’s “Performance Arts Venues”, including City Hall, Hong Kong Cultural Centre, Hong Kong Coliseum, Queen Elizabeth Stadium, Ngau Chi Wan Civic Centre, Sheung Wan Civic Centre, Sai Wan Ho Civic Centre, Ko Shan Theatre, Sha Tin Town Hall, Tsuen Wan Town Hall, Tuen Mun Town Hall, Kwai Tsing Theatre, Tai Po Civic Centre, North District Town Hall, Yuen Long Theatre; Other venues: Hong Kong Academy for Performing Arts, Hong Kong Arts Centre, Hong Kong Fringe Club
屬於康文署的表演場地包括香港大會堂、香港文化中心、香港體育館、伊利沙伯體育館、牛池灣文娛中心 、上環文娛中心、西灣河文娛中心、高山劇場、沙田大會堂、荃灣大會堂、屯門大會堂、葵青劇院、大埔文娛中心、北區大會堂及元朗劇院;
Leisure and Cultural Services Department English:http://www.lcsd.gov.hk/eng/cs_pa_venue.php 康樂及文化事務署Chinese:http://www.lcsd.gov.hk/b5/cs_pa_venue.php
public libraries 公共圖書館 The LCSD currently operates 70 public libraries, including eight mobile libraries.
香港的公共圖書館系統由康樂及文化事務署營辦。系統內共有70 所公共圖書館,其中八所是流動圖書館。
Hong Kong Yearbook 2003 (http://www.info.gov.hk/yearbook/2003/english/chapter19/19_16.html) (http://www.info.gov.hk/yearbook/2003/tc_chi/chapter19/19_16.html)
R&D expenditure 研究及發展 (研發)開支
Research and development (R&D) expenditure covers capital and current expenditures on R&D projects. Capital expenditure includes actual expenditure or investment in land, buildings and major equipment mainly for R&D activities during the reporting year. Current expenditure includes wages and salaries of R&D employees, cost of materials and supplies.
研究及發展 (研發) 開支涵蓋機構用於進行研發計劃的資本開支及經常開支。資本開支包括在填報年度內,為研發活動而投資在房地產及主要設備的實質開支。經常開支包括研發活動的僱員薪酬、原料及物料的成本。
Science and Technology: http://www.info.gov.hk/censtatd/eng/hkstat/concepts_methods/cm_it2_index.html 研究及發展: http://www.info.gov.hk/censtatd/chinese/hkstat/concepts_methods/cm_it2_index.html
R&D personnel 研究及發展人員數目
Persons engaged in R&D activities, regardless of whether they are in the business sector, the government sector or the higher education sector. R&D personnel cover researchers, technicians and other supporting staff (including postgraduate students). In line with international standard, the coverage of R&D personnel in the higher education sector has been enhanced by also incorporating full time “research postgraduate students” in the series. Prior to the enhancement, R&D personnel figures in that sector only covered “research related staff”which is defined as staff having devoted 80% or more of their time to research related activities. R&D activities refer to any creative work undertaken on a systematic basis in order to increase the stock of knowledge, including the knowledge of man, culture and society, and the use of this knowledge to devise new products/services/applications and to institute improvements of existing products/services/applications. They generally refer to activities with an element of novelty or innovation and can be conducted in such fields as physical sciences, engineering, medical sciences, social sciences or humanities.
研究及發展(研發)人員是指在工商機構、政府機構或高等教育機構從事研發活動的人員。研發人員包括研究員、技術員與其他輔助人員。為配合國際標準,已改良高等 教育機構研發人員的涵蓋範圍,在數列內加入了全時間「研究課程研究生」。在這改良之前,該等研發人員數字只包括「與研究有關的人員」,即是指用了80%或以上的工作時間進行與研究有關工作的員工。「研發活動」是指有系統的創意活動,目的是為增進知識,與及運用這些知識發明新產品、計劃新服務或提供新應用,以及改良現有產品、服務或應用。它們通常都帶有新穎或創新的元素,並可在各科學範疇,如自然科學、技術、工程學、醫學、社會科學或人文科學上進行。
研究及發展開支與研究及發展人員數目 http://www.info.gov.hk/censtatd/chinese/hkstat/fas/st/rd.htm Research and Development (R&D) expenditure and R&D personnel http://www.info.gov.hk/censtatd/eng/hkstat/fas/st/rd.htm 科技─研究及發展 http://www.info.gov.hk/censtatd/chinese/hkstat/concepts_methods/cm_it.htm, http://www.info.gov.hk/censtatd/chinese/hkstat/concepts_methods/cm_it2_index.htmlScience and Technology- Research and Development http://www.info.gov.hk/censtatd/eng/hkstat/concepts_methods/cm_it.htm, http://www.info.gov.hk/censtatd/eng/hkstat/concepts_methods/cm_it2_index.html
tertiary level education (degree and above)
專上教育(學位課程)
Tertiary level education (degree and above) includes all first degree, taught postgraduate and research postgraduate courses in local or non-local institutions.
包括本地及非本地教育機構的學士學位課程、授課形式深造課程及研究式深造課程。
2001 Population Census Main Report - Volume I 《2001年人口普查主要報告》
tertiary level education (non-degree)
專上教育 (非學位課程)
Tertiary level education (non-degree courses) include all higher diploma/endorsement certificate courses/associateship or equivalent courses in University/Institute of Vocational Education, other sub-degree(diploma/certificate/associate degree) courses in University, sub-degree(diploma/certificate) courses in other statutory or approved post-secondary colleges, diploma/certificate course in Hong Kong Institute of Education, nurse training courses and distance learning courses.
包括大學/專業教育學院的高級文憑/增修證書課程/院士銜或同等課程、大學的其他非學位(文憑/證書/副學士)課程、其他法定或認可的專上學院的非學位(文憑/證書)課程、其他專上學院的文憑/證書課程、香港教育學院文憑/證書課程、護士訓練課程及遙距課程。
2001 Population Census Main Report - Volume I 《2001年人口普查主要報告》
time use pattern 運用時間的模式 The daily patterns of time use of Hong Kong residents in various types of activities, such as voluntary work, social entertainment/ leisure/ recreational/ cultural activities, and sharing of housework among household members.
香港居民的運用時間模式包含多種活動,如義務工作、社交娛樂/消閒/康樂/文化活動,以及與家中成員分擔家務。
Census and Statistics Department, Thematic Household Survey Report No. 14 (2003) 政府統計處《主題性住戶統計調查第十四號報告書》(2003) http://www.gov.hk/censtatd/eng/hkstat/social_topics/ths14-ppsa.pdf
A STUDY ON CREATIVITY INDEX ��
venture capital 創業資本 Venture capital is a means of providing long term equity funding to young fast growing companies. It is often called “direct investment” or “ private equity investment”. Companies require funds to develop their business. Financial support can take the form of loans and/or equity capital. A company not listed on a stock exchange can obtain funds from banks or by issuing shares to private investors. Venture capital companies inject funds into the company in exchange for a proportion of its equity.
創業資本是一種提供長期募集資金,給予新成立、成長快的公司。它通常被稱為「直接投資」或「私人募集投資」。公司需要資金去發展業務。而財政上的支持可以借貸和/或募集的形式得到。一所沒有上市的公司可以向銀行貸款或發生股票予私人投資者。創業資本公司注入資金予這些公司,以換取其公司一部分的股份。
Hong Kong Venture Capital and Private Equity Association (http://www.hkvca.com.hk/2004/m2-set.htm)
visitor arrivals 訪港旅客 Visitor arrivals refer to arrivals by all-Hong Kong residents through immigration formalities.
訪港旅客指經辦理出入境手續抵港的非香港居民。 《香港統計年刊2004》, p. 186; Hong Kong Annual Digest of Statistics 2004, p.186
voluntary work 義務工作 Types of voluntary work include: 1. Clerical/computer work (e.g. copying, data entry, etc.) 2. Planning/organizing work (e.g. organizing community activities, chairing a meeting in the owners’ incorporation, etc.) 3. Work related to personal services/care giving/education (e.g. accompanying a person for medical services, teaching in interest classes, etc.) 4. Work related to cultural/recreational/sports/community activities (e.g. selling flags, giving performance without remuneration, serving as workers in community activities, etc.) 5. Others
義務工作類別包括:1)文書/電腦性質的工作(例如:抄寫、數據輸入等),2)策劃/組織性質的工作(例如:負責籌辦社區活動、主持業主立案法團會議等),3)個人服務/照顧/教育性的工作(例如:陪診、教興趣班等),4)文化/康樂/體育/社區性質的工作(例如:賣旗、義務表演、作社區表演活動工作人員等),5)其他。
Census and Statistics Department (2003). Thematic Household Survey Report No. 14, “Pattern of partici-pation in unpaid activities” 政府統計處《主題性住戶統計調查第十四號報告書》 (2003) “參與無籌活動的情況”
volunteers 義工 The nature of Volunteer Service was diversified into a wide variety in order to cope with the changing community needs. The types of services include: escorting, tutoring, visiting, arts and culture, recreational, sports, environmental protection, manual service, counseling, medical care, IT support and assist in international meetings etc. Types of service target including children, youth, elderly, patients, mentally handicapped, drug addicts, offenders, new immigrants and service organizations etc. Service duration can be in short or long terms depending on the need of a specific service and the needs of service recipients.
為了配合社會不同的需要 ,義務工作的服務種類亦趨多元化,常見的服務包括:護送、功課輔導、探訪、文化藝術、康樂、體育、環境保護 、勞動、 輔導、醫療護理、資訊科技技術支援及協助國際會議等 。 服務對象包括 :兒童 、青年、老人、病患人士、智障人士、戒毒人士、釋囚人士、新來港人士及協助服務機構等。 視乎服務性質及服務對象的需要 ,服務一般可分為一次過服期及長期服務。
Agency for Volunteer Service (English:http://www.avs.org.hk/pub/service_vol_e/transfer.php) (Chinese:http://www.avs.org.hk/pub/service_vol/transfer.php)
web page 網頁 Web page is an electronic document accessible in the Internet, which provides information in a textual, graphical or multimedia format.
網頁是一種可在互聯網上開啟的電子文件,提供文字、圖像或多媒體形式的資訊。
Annual Survey on Information Technology Usage and Penetration in the Business Sector for 2004, Census and Statistics Department香港政府統計處《2004資訊科技在工商業的使用情況和普及程度按年統計調查》
web site 網站 Web site is a related collection of Web pages that includes a beginning page called a home page. A Web site has an address (often unique) to facilitate the users to get their intended home page.
網站是一組以本頁為首頁的相關網頁。每一網站通常都有一個獨一無二的網上地址,以供用戶尋找所需的首網頁。
Annual Survey on Information Technology Usage and Penetration in the Business Sector for 2004, Census and Statistics Department 香港政府統計處《2004資訊科技在工商業的使用情況和普及程度按年統計調查》
working population 工作人口 The working population refers to persons aged 15 and over who should (a) be engaged in performing work for pay or profit during the seven days before the Census; or (b) have formal job attachment during the seven days before the Census. The working population can be distinguished into:
工作人口:工作人口指符合以下條件的十五歲及以上人士:1)在人口普查前七天內有從事工作以賺取薪 酬或利潤;或 2)在人口普查前七天內有一份正式工作。工作人口可劃分為:
Concepts and Definitions for the 2001 Population Census (English:http://www.info.gov.hk/censtatd/eng/hkstat/concepts_methods/cm_labour_index.html) (Chinese:http://www.info.gov.hk/censtatd/chinese/hkstat/concepts_method/cm_labour_index.html)
Employee: a person who works for an employer (private companies or government) for wage, salary, commission, tips or payment in kind. Domestic helpers, outworkers and paid family workers are also included here.
僱員:為賺取工資、薪金、佣金、小費或實物津貼而為僱主(私人公司或政府)工作, 包括家庭傭工、外發工和支薪家庭從業員。
Employer: a person who works for profit or fees in his/ her own business/profession and employs one or more persons to work for him/her.
僱主:從事本身業務/職業時為賺取利潤或費用而工作,最少僱用一人為其工作的人。
Self-employed: a person who works for profit or fees in his/her own business/profession, neither employed by someone nor employing others.
自營作業者:從事本身業務/職業時為賺取利潤或費用而工作,並沒有僱用他人或受僱於人的人。
Unpaid family worker: a person who works for no pay in a family business is also considered employed. Food and lodging and pocket money are not counted as pay.
無酬家庭從業員:為有關家庭生意工作但無收取報酬的人,亦算作就業人士。報酬不包括膳宿和零用錢。
APPENDICES��: :GLOSSARY
venture capital 創業資本 Venture capital is a means of providing long term equity funding to young fast growing companies. It is often called “direct investment” or “ private equity investment”. Companies require funds to develop their business. Financial support can take the form of loans and/or equity capital. A company not listed on a stock exchange can obtain funds from banks or by issuing shares to private investors. Venture capital companies inject funds into the company in exchange for a proportion of its equity.
創業資本是一種提供長期募集資金,給予新成立、成長快的公司。它通常被稱為「直接投資」或「私人募集投資」。公司需要資金去發展業務。而財政上的支持可以借貸和/或募集的形式得到。一所沒有上市的公司可以向銀行貸款或發生股票予私人投資者。創業資本公司注入資金予這些公司,以換取其公司一部分的股份。
Hong Kong Venture Capital and Private Equity Association (http://www.hkvca.com.hk/2004/m2-set.htm)
visitor arrivals 訪港旅客 Visitor arrivals refer to arrivals by all-Hong Kong residents through immigration formalities.
訪港旅客指經辦理出入境手續抵港的非香港居民。 《香港統計年刊2004》, p. 186; Hong Kong Annual Digest of Statistics 2004, p.186
voluntary work 義務工作 Types of voluntary work include: 1. Clerical/computer work (e.g. copying, data entry, etc.) 2. Planning/organizing work (e.g. organizing community activities, chairing a meeting in the owners’ incorporation, etc.) 3. Work related to personal services/care giving/education (e.g. accompanying a person for medical services, teaching in interest classes, etc.) 4. Work related to cultural/recreational/sports/community activities (e.g. selling flags, giving performance without remuneration, serving as workers in community activities, etc.) 5. Others
義務工作類別包括:1)文書/電腦性質的工作(例如:抄寫、數據輸入等),2)策劃/組織性質的工作(例如:負責籌辦社區活動、主持業主立案法團會議等),3)個人服務/照顧/教育性的工作(例如:陪診、教興趣班等),4)文化/康樂/體育/社區性質的工作(例如:賣旗、義務表演、作社區表演活動工作人員等),5)其他。
Census and Statistics Department (2003). Thematic Household Survey Report No. 14, “Pattern of partici-pation in unpaid activities” 政府統計處《主題性住戶統計調查第十四號報告書》 (2003) “參與無籌活動的情況”
volunteers 義工 The nature of Volunteer Service was diversified into a wide variety in order to cope with the changing community needs. The types of services include: escorting, tutoring, visiting, arts and culture, recreational, sports, environmental protection, manual service, counseling, medical care, IT support and assist in international meetings etc. Types of service target including children, youth, elderly, patients, mentally handicapped, drug addicts, offenders, new immigrants and service organizations etc. Service duration can be in short or long terms depending on the need of a specific service and the needs of service recipients.
為了配合社會不同的需要 ,義務工作的服務種類亦趨多元化,常見的服務包括:護送、功課輔導、探訪、文化藝術、康樂、體育、環境保護 、勞動、 輔導、醫療護理、資訊科技技術支援及協助國際會議等 。 服務對象包括 :兒童 、青年、老人、病患人士、智障人士、戒毒人士、釋囚人士、新來港人士及協助服務機構等。 視乎服務性質及服務對象的需要 ,服務一般可分為一次過服期及長期服務。
Agency for Volunteer Service (English:http://www.avs.org.hk/pub/service_vol_e/transfer.php) (Chinese:http://www.avs.org.hk/pub/service_vol/transfer.php)
web page 網頁 Web page is an electronic document accessible in the Internet, which provides information in a textual, graphical or multimedia format.
網頁是一種可在互聯網上開啟的電子文件,提供文字、圖像或多媒體形式的資訊。
Annual Survey on Information Technology Usage and Penetration in the Business Sector for 2004, Census and Statistics Department香港政府統計處《2004資訊科技在工商業的使用情況和普及程度按年統計調查》
web site 網站 Web site is a related collection of Web pages that includes a beginning page called a home page. A Web site has an address (often unique) to facilitate the users to get their intended home page.
網站是一組以本頁為首頁的相關網頁。每一網站通常都有一個獨一無二的網上地址,以供用戶尋找所需的首網頁。
Annual Survey on Information Technology Usage and Penetration in the Business Sector for 2004, Census and Statistics Department 香港政府統計處《2004資訊科技在工商業的使用情況和普及程度按年統計調查》
working population 工作人口 The working population refers to persons aged 15 and over who should (a) be engaged in performing work for pay or profit during the seven days before the Census; or (b) have formal job attachment during the seven days before the Census. The working population can be distinguished into:
工作人口:工作人口指符合以下條件的十五歲及以上人士:1)在人口普查前七天內有從事工作以賺取薪 酬或利潤;或 2)在人口普查前七天內有一份正式工作。工作人口可劃分為:
Concepts and Definitions for the 2001 Population Census (English:http://www.info.gov.hk/censtatd/eng/hkstat/concepts_methods/cm_labour_index.html) (Chinese:http://www.info.gov.hk/censtatd/chinese/hkstat/concepts_method/cm_labour_index.html)
Employee: a person who works for an employer (private companies or government) for wage, salary, commission, tips or payment in kind. Domestic helpers, outworkers and paid family workers are also included here.
僱員:為賺取工資、薪金、佣金、小費或實物津貼而為僱主(私人公司或政府)工作, 包括家庭傭工、外發工和支薪家庭從業員。
Employer: a person who works for profit or fees in his/ her own business/profession and employs one or more persons to work for him/her.
僱主:從事本身業務/職業時為賺取利潤或費用而工作,最少僱用一人為其工作的人。
Self-employed: a person who works for profit or fees in his/her own business/profession, neither employed by someone nor employing others.
自營作業者:從事本身業務/職業時為賺取利潤或費用而工作,並沒有僱用他人或受僱於人的人。
Unpaid family worker: a person who works for no pay in a family business is also considered employed. Food and lodging and pocket money are not counted as pay.
無酬家庭從業員:為有關家庭生意工作但無收取報酬的人,亦算作就業人士。報酬不包括膳宿和零用錢。
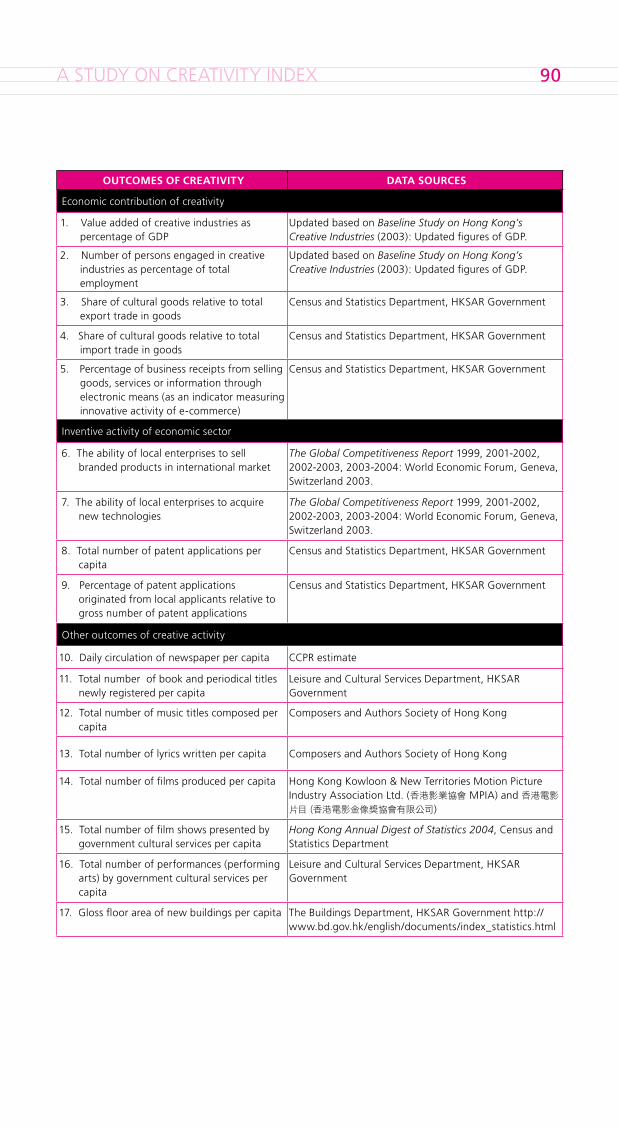
A STUDY ON CREATIVITY INDEX �0
OUTCOMES OF CREATIVITY DATA SOURCES
Economic contribution of creativity
1. Value added of creative industries as percentage of GDP
Updated based on Baseline Study on Hong Kong’s Creative Industries (2003): Updated figures of GDP.
2. Number of persons engaged in creative industries as percentage of total employment
Updated based on Baseline Study on Hong Kong’s Creative Industries (2003): Updated figures of GDP.
3. Share of cultural goods relative to total export trade in goods
Census and Statistics Department, HKSAR Government
4. Share of cultural goods relative to total import trade in goods
Census and Statistics Department, HKSAR Government
5. Percentage of business receipts from selling goods, services or information through electronic means (as an indicator measuring innovative activity of e-commerce)
Census and Statistics Department, HKSAR Government
Inventive activity of economic sector
6. The ability of local enterprises to sell branded products in international market
The Global Competitiveness Report 1999, 2001-2002, 2002-2003, 2003-2004: World Economic Forum, Geneva, Switzerland 2003.
7. The ability of local enterprises to acquire new technologies
The Global Competitiveness Report 1999, 2001-2002, 2002-2003, 2003-2004: World Economic Forum, Geneva, Switzerland 2003.
8. Total number of patent applications per capita
Census and Statistics Department, HKSAR Government
9. Percentage of patent applications originated from local applicants relative to gross number of patent applications
Census and Statistics Department, HKSAR Government
Other outcomes of creative activity
10. Daily circulation of newspaper per capita CCPR estimate
11. Total number of book and periodical titles newly registered per capita
Leisure and Cultural Services Department, HKSAR Government
12. Total number of music titles composed per capita
Composers and Authors Society of Hong Kong
13. Total number of lyrics written per capita Composers and Authors Society of Hong Kong
14. Total number of films produced per capita Hong Kong Kowloon & New Territories Motion Picture Industry Association Ltd. (香港影業協會 MPIA) and 香港電影
片目 (香港電影金像獎協會有限公司)
15. Total number of film shows presented by government cultural services per capita
Hong Kong Annual Digest of Statistics 2004, Census and Statistics Department
16. Total number of performances (performing arts) by government cultural services per capita
Leisure and Cultural Services Department, HKSAR Government
17. Gloss floor area of new buildings per capita The Buildings Department, HKSAR Government http://www.bd.gov.hk/english/documents/index_statistics.html
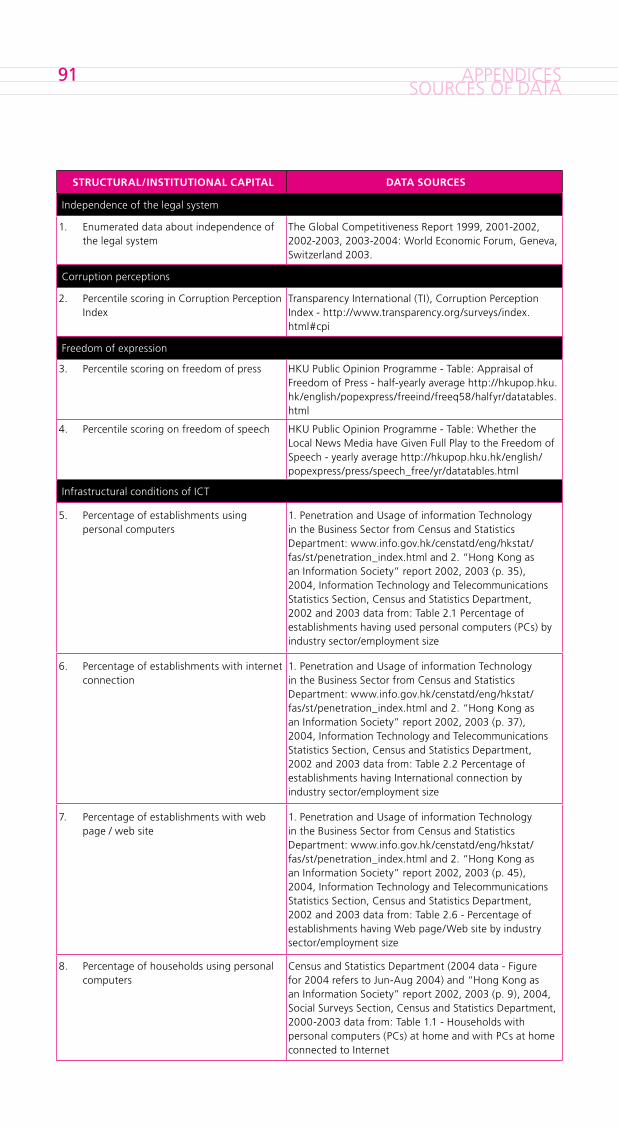
APPENDICES�1SOURCES OF DATA
STRUCTURAL/INSTITUTIONAL CAPITAL DATA SOURCES
Independence of the legal system
1. Enumerated data about independence of the legal system
The Global Competitiveness Report 1999, 2001-2002, 2002-2003, 2003-2004: World Economic Forum, Geneva, Switzerland 2003.
Corruption perceptions
2. Percentile scoring in Corruption Perception Index
Transparency International (TI), Corruption Perception Index - http://www.transparency.org/surveys/index.html#cpi
Freedom of expression
3. Percentile scoring on freedom of press HKU Public Opinion Programme - Table: Appraisal of Freedom of Press - half-yearly average http://hkupop.hku.hk/english/popexpress/freeind/freeq58/halfyr/datatables.html
4. Percentile scoring on freedom of speech HKU Public Opinion Programme - Table: Whether the Local News Media have Given Full Play to the Freedom of Speech - yearly average http://hkupop.hku.hk/english/popexpress/press/speech_free/yr/datatables.html
Infrastructural conditions of ICT
5. Percentage of establishments using personal computers
1. Penetration and Usage of information Technology in the Business Sector from Census and Statistics Department: www.info.gov.hk/censtatd/eng/hkstat/fas/st/penetration_index.html and 2. “Hong Kong as an Information Society” report 2002, 2003 (p. 35), 2004, Information Technology and Telecommunications Statistics Section, Census and Statistics Department, 2002 and 2003 data from: Table 2.1 Percentage of establishments having used personal computers (PCs) by industry sector/employment size
6. Percentage of establishments with internet connection
1. Penetration and Usage of information Technology in the Business Sector from Census and Statistics Department: www.info.gov.hk/censtatd/eng/hkstat/fas/st/penetration_index.html and 2. “Hong Kong as an Information Society” report 2002, 2003 (p. 37), 2004, Information Technology and Telecommunications Statistics Section, Census and Statistics Department, 2002 and 2003 data from: Table 2.2 Percentage of establishments having International connection by industry sector/employment size
7. Percentage of establishments with web page / web site
1. Penetration and Usage of information Technology in the Business Sector from Census and Statistics Department: www.info.gov.hk/censtatd/eng/hkstat/fas/st/penetration_index.html and 2. “Hong Kong as an Information Society” report 2002, 2003 (p. 45), 2004, Information Technology and Telecommunications Statistics Section, Census and Statistics Department, 2002 and 2003 data from: Table 2.6 - Percentage of establishments having Web page/Web site by industry sector/employment size
8. Percentage of households using personal computers
Census and Statistics Department (2004 data - Figure for 2004 refers to Jun-Aug 2004) and “Hong Kong as an Information Society” report 2002, 2003 (p. 9), 2004, Social Surveys Section, Census and Statistics Department, 2000-2003 data from: Table 1.1 - Households with personal computers (PCs) at home and with PCs at home connected to Internet
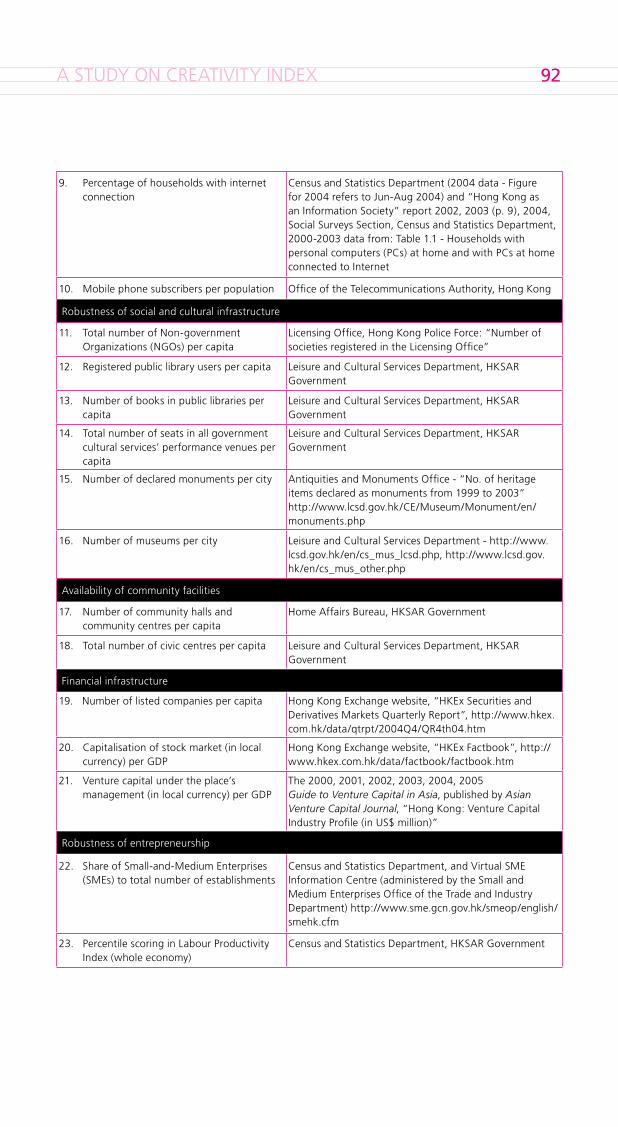
A STUDY ON CREATIVITY INDEX ��
9. Percentage of households with internet connection
Census and Statistics Department (2004 data - Figure for 2004 refers to Jun-Aug 2004) and “Hong Kong as an Information Society” report 2002, 2003 (p. 9), 2004, Social Surveys Section, Census and Statistics Department, 2000-2003 data from: Table 1.1 - Households with personal computers (PCs) at home and with PCs at home connected to Internet
10. Mobile phone subscribers per population Office of the Telecommunications Authority, Hong Kong
Robustness of social and cultural infrastructure
11. Total number of Non-government Organizations (NGOs) per capita
Licensing Office, Hong Kong Police Force: “Number of societies registered in the Licensing Office”
12. Registered public library users per capita Leisure and Cultural Services Department, HKSAR Government
13. Number of books in public libraries per capita
Leisure and Cultural Services Department, HKSAR Government
14. Total number of seats in all government cultural services’ performance venues per capita
Leisure and Cultural Services Department, HKSAR Government
15. Number of declared monuments per city Antiquities and Monuments Office - “No. of heritage items declared as monuments from 1999 to 2003” http://www.lcsd.gov.hk/CE/Museum/Monument/en/monuments.php
16. Number of museums per city Leisure and Cultural Services Department - http://www.lcsd.gov.hk/en/cs_mus_lcsd.php, http://www.lcsd.gov.hk/en/cs_mus_other.php
Availability of community facilities
17. Number of community halls and community centres per capita
Home Affairs Bureau, HKSAR Government
18. Total number of civic centres per capita Leisure and Cultural Services Department, HKSAR Government
Financial infrastructure
19. Number of listed companies per capita Hong Kong Exchange website, “HKEx Securities and Derivatives Markets Quarterly Report”, http://www.hkex.com.hk/data/qtrpt/2004Q4/QR4th04.htm
20. Capitalisation of stock market (in local currency) per GDP
Hong Kong Exchange website, “HKEx Factbook”, http://www.hkex.com.hk/data/factbook/factbook.htm
21. Venture capital under the place’s management (in local currency) per GDP
The 2000, 2001, 2002, 2003, 2004, 2005 Guide to Venture Capital in Asia, published by Asian Venture Capital Journal, “Hong Kong: Venture Capital Industry Profile (in US$ million)”
Robustness of entrepreneurship
22. Share of Small-and-Medium Enterprises (SMEs) to total number of establishments
Census and Statistics Department, and Virtual SME Information Centre (administered by the Small and Medium Enterprises Office of the Trade and Industry Department) http://www.sme.gcn.gov.hk/smeop/english/smehk.cfm
23. Percentile scoring in Labour Productivity Index (whole economy)
Census and Statistics Department, HKSAR Government
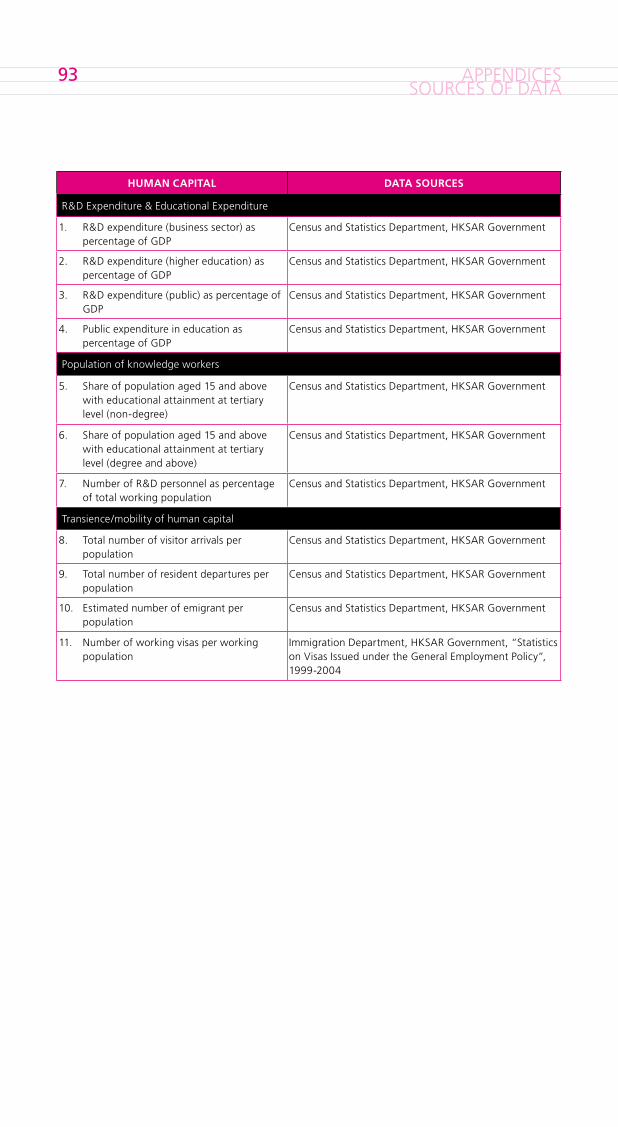
APPENDICES��SOURCES OF DATA
HUMAN CAPITAL DATA SOURCES
R&D Expenditure & Educational Expenditure
1. R&D expenditure (business sector) as percentage of GDP
Census and Statistics Department, HKSAR Government
2. R&D expenditure (higher education) as percentage of GDP
Census and Statistics Department, HKSAR Government
3. R&D expenditure (public) as percentage of GDP
Census and Statistics Department, HKSAR Government
4. Public expenditure in education as percentage of GDP
Census and Statistics Department, HKSAR Government
Population of knowledge workers
5. Share of population aged 15 and above with educational attainment at tertiary level (non-degree)
Census and Statistics Department, HKSAR Government
6. Share of population aged 15 and above with educational attainment at tertiary level (degree and above)
Census and Statistics Department, HKSAR Government
7. Number of R&D personnel as percentage of total working population
Census and Statistics Department, HKSAR Government
Transience/mobility of human capital
8. Total number of visitor arrivals per population
Census and Statistics Department, HKSAR Government
9. Total number of resident departures per population
Census and Statistics Department, HKSAR Government
10. Estimated number of emigrant per population
Census and Statistics Department, HKSAR Government
11. Number of working visas per working population
Immigration Department, HKSAR Government, “Statistics on Visas Issued under the General Employment Policy”, 1999-2004
A STUDY ON CREATIVITY INDEX ��
SOCIAL CAPITAL DATA SOURCES
Development of social capital
1. Amount of approved charitable donations allowed under Salaries Tax (in local currency) as percentage of GDP
Inland Revenue Department, HKSAR Government
2. Amount of approved charitable donations allowed under Profits Tax (in local currency) as percentage of GDP
Inland Revenue Department, HKSAR Government
3. Expenditure on “social welfare” as percentage of total public expenditure
Health, Welfare and Food Bureau, HKSAR Government
Network quality: norms & values
4. Indicators derived from World Value Survey on generalized trust
Survey conducted by CCPR with reference to World Value Survey http://wvs.isr.umich.edu
5. Indicators derived from World Value Survey on institutional trust
Survey conducted by CCPR with reference to World Value Survey http://wvs.isr.umich.edu
6. Indicators derived from World Value Survey on reciprocity
Survey conducted by CCPR with reference to World Value Survey http://wvs.isr.umich.edu
7. Indicators derived from World Value Survey on sense of efficacy (on control)
Survey conducted by CCPR with reference to World Value Survey http://wvs.isr.umich.edu
8. Indicators derived from World Value Survey on cooperation
Survey conducted by CCPR with reference to World Value Survey http://wvs.isr.umich.edu
9. Indicators derived from World Value Survey on attitude towards diversity
Survey conducted by CCPR with reference to World Value Survey http://wvs.isr.umich.edu
10. Indicators derived from World Value Survey on acceptance of diversity
Survey conducted by CCPR with reference to World Value Survey http://wvs.isr.umich.edu
11. Indicators derived from World Value Survey on attitude towards human rights
Survey conducted by CCPR with reference to World Value Survey http://wvs.isr.umich.edu
12. Attitude towards rights and wrongs of foreign immigrants
Survey conducted by CCPR with reference to World Value Survey http://wvs.isr.umich.edu
13. Attitude towards foreigners’ life style Survey conducted by CCPR with reference to World Value Survey http://wvs.isr.umich.edu
14. Indicators derived from World Value Survey on modern versus traditional values
Survey conducted by CCPR with reference to World Value Survey http://wvs.isr.umich.edu
15. Indicators derived from World Value Survey on self-expression versus survival
Survey conducted by CCPR with reference to World Value Survey http://wvs.isr.umich.edu
Network quality: social participation
16. Interest in public affairs Survey conducted by CCPR with reference to World Value Survey http://wvs.isr.umich.edu
17. Participation in social organization Survey conducted by CCPR with reference to World Value Survey http://wvs.isr.umich.edu
18. Social contact with acquaintance Survey conducted by CCPR with reference to World Value Survey http://wvs.isr.umich.edu
19. Social contact with community Survey conducted by CCPR with reference to World Value Survey http://wvs.isr.umich.edu
20. Indicators derived from World Value Survey on sense of efficacy
(on what you did)
Survey conducted by CCPR with reference to World Value Survey http://wvs.isr.umich.edu
21. Total number of volunteers per capita Volunteer Movement - Participating Organizations & Registered Volunteers http://www.volunteering-hk.org/english/aboutvs/vs_stat.html
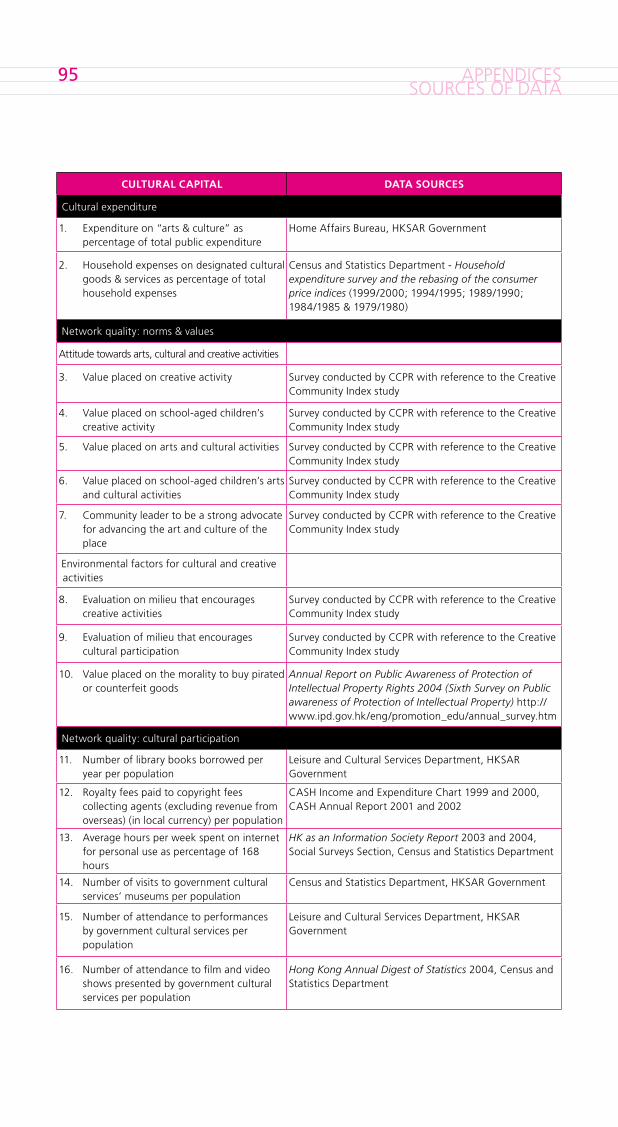
APPENDICES��SOURCES OF DATA
CULTURAL CAPITAL DATA SOURCES
Cultural expenditure
1. Expenditure on “arts & culture” as percentage of total public expenditure
Home Affairs Bureau, HKSAR Government
2. Household expenses on designated cultural goods & services as percentage of total household expenses
Census and Statistics Department - Household expenditure survey and the rebasing of the consumer price indices (1999/2000; 1994/1995; 1989/1990; 1984/1985 & 1979/1980)
Network quality: norms & values
Attitude towards arts, cultural and creative activities
3. Value placed on creative activity Survey conducted by CCPR with reference to the Creative Community Index study
4. Value placed on school-aged children’s creative activity
Survey conducted by CCPR with reference to the Creative Community Index study
5. Value placed on arts and cultural activities
Survey conducted by CCPR with reference to the Creative Community Index study
6. Value placed on school-aged children’s arts and cultural activities
Survey conducted by CCPR with reference to the Creative Community Index study
7. Community leader to be a strong advocate for advancing the art and culture of the place
Survey conducted by CCPR with reference to the Creative Community Index study
Environmental factors for cultural and creative activities
8. Evaluation on milieu that encourages creative activities
Survey conducted by CCPR with reference to the Creative Community Index study
9. Evaluation of milieu that encourages cultural participation
Survey conducted by CCPR with reference to the Creative Community Index study
10. Value placed on the morality to buy pirated or counterfeit goods
Annual Report on Public Awareness of Protection of Intellectual Property Rights 2004 (Sixth Survey on Public awareness of Protection of Intellectual Property) http://www.ipd.gov.hk/eng/promotion_edu/annual_survey.htm
Network quality: cultural participation
11. Number of library books borrowed per year per population
Leisure and Cultural Services Department, HKSAR Government
12. Royalty fees paid to copyright fees collecting agents (excluding revenue from overseas) (in local currency) per population
CASH Income and Expenditure Chart 1999 and 2000, CASH Annual Report 2001 and 2002
13. Average hours per week spent on internet for personal use as percentage of 168 hours
HK as an Information Society Report 2003 and 2004, Social Surveys Section, Census and Statistics Department
14. Number of visits to government cultural services’ museums per population
Census and Statistics Department, HKSAR Government
15. Number of attendance to performances by government cultural services per population
Leisure and Cultural Services Department, HKSAR Government
16. Number of attendance to film and video shows presented by government cultural services per population
Hong Kong Annual Digest of Statistics 2004, Census and Statistics Department
A STUDY ON CREATIVITY INDEX ��
APEC (2002). The New Economy in APEC: Innovations, Digital Divide and Policy. APEC Secretariat.
Barro, R. J. (2001). “Education and economic growth”. In Helliwell, J.F. ed., The Contribution of Human and Social Capital to Sustained Economic Growth and Well-Being, OECD, chapter 3: 14-41.
Boden, Margaret A. (2004). The Creative Mind Myths and Mechanisms. London: Routledge.
--- ed. (1996). Dimensions of Creativity. Cambridge, Massachusetts: the MIT Press
Bourdieu, Pierre (1979). Distinction: A Social Critique of the Judgement of Taste, translated by Richard Nice. London: Routledge.
Coleman, James S. (2000). “Social Capital in the Creation of Human Capital”. In Partha Dasgupta and Ismail Serageldin ed., Social Capital: A Multifaceted Perspective. Washington, D.C.: The World Bank.
Coulombe, Serge, Jean-François Tremblay, and Sylvie Marchand (2004). International Adult Literacy Survey: Literacy Scores, Human Capital and Growth Across Fourteen OECD countries. Canada: Statistics Canada.
Csikszentmihalyi, Mihaly (1996). Creativity: Flow and the Psychology of Discovery and Invention. New York: HarperCollins Publishers, Inc.
Cultural Initiatives Silicon Valley (2002). Creative Community Index: Measuring Progress Toward a Vibrant Silicon Valley. (http://www.ci-sv.org/index.shtml)
Cutler & Company (2002). Producing Digital Content: An Abridged Version of the September 2002 Report for the Department of Communications, Information Technologies and the Arts. Australia.
Department for Culture, Media and Sport (DCMS) (2004). “Creative Industries Economic Estimates”, Statistical Bulletin, August: 1-10.
--- (2004b). DCMS Evidence Toolkit –DET: Technical Report. London: DCMS.
--- (2002). Creative Industries Fact File.
--- (2001). Creative Industries Mapping Document.
Department of Communications, Information Technologies and the Arts and NOIE (2002). Creative Industries Cluster Study: Stage One Report. Australia.
Economist Intelligence Unit (2003). Country Reports.
Edwards, R.W. (2004). Measuring Social Capital: An Australian Framework and Indicators. Australia: Australian Bureau of Statistics.
Eurostat Working Papers (2000). Cultural Statistics in the EU: Final Report of the LEG. European Commission.
Evans, Graeme (2001). Cultural Planning: An Urban Renaissance? London and New York: Routledge.
Florida, Richard and Irene Tinagli (2004). Europe in the Creative Age. February
Florida, Richard (2002). The Rise of the Creative Class. New York: Basic Books.
--- “Bohemia and Economic Geography”, Journal of Economic Geography, 2: 55-71.
Graham, Brian (2002). “Heritage as Knowledge: Capital or Culture?” Urban Studies, vol.39, nos. 5-6: 1003-1017.
Hew, Denis and Loi Wee Nee ed. (2004). Entrepreneurship and SMEs in Southeast Asia. Singapore: Institute of Southeast Asian Studies.
Howkins, John (2001). The Creative Economy: How People Make Money from Ideas. London: Allen Lane, the Penguin Press.
IMD World Competitiveness Yearbook 2004.
Inglehart, R. and Baker, W. (2000). “Modernization, Cultural Change and the Persistence of Traditional Values,” American Sociological Review, February, Volume 65: 19-51.
International Federation of Arts Councils and Culture Agencies (2004). Statistical Indicators for Arts Policy: Discussion Paper. Australia: IFACCA.
Landry, Charles (2000). The Creative City: A Toolkit for Urban Innovation. London: Comedia.
BIBLIOGRAPHY��
Lau Siu Kai et al (1988-2003). Indicators of Social Development: Hong Kong. Hong Kong: Hong Kong Institute of Asia-Pacific Studies, the Chinese University of Hong Kong.
Lawson, Bryan (1980). How Designers Think. London: Architectural Press.
Mercer, Colin (2002). Towards Cultural Citizenships: Tools for Cultural Policy and Development. The Bank of Sweden Tercentenary Foundation.
Nelson, Richard R. and Winter, Sidney G. (1982). An Evolutionary Theory of Economic Change. Cambridge: Belknap Press of Harvard University Press.
OECD (2002). Measuring the Information Economy. France: OECD Publications.
Porter, M. E. (1990). The Competitive Advantage of Nations. Macmillan, London.
Putnam, Robert D. (2000). Bowling Alone: America’s Declining Social Capital. New York: Simon & Schuster.
--- Making Democracy Works: Civic Traditions in Modern Italy. Princeton, N. J: Princeton University Press.
Sandee, Henry and Jan ter Wengel (2004). “SMEs in Southeast Asia since the Asian Financial Crisis”. In Denis Hew and Loi Wee Nee eds., Entrepreneurship and SMEs in Southeast Asia. Singapore: Institute of Southeast Asian Studies: 24-39.
Sassen, Saskia (1994). Cities in a World Economy. Thousand Oaks [Calif.]: Pine Forge Press.
The Saguaro Seminar (2001). The Social Capital Community Benchmark Survey. www.cfsv.org/communitysurvey
Toh Mun Heng, Adrian Choo, Terence Ho and Economics Division of Ministry of Trade and Industry (2003). Economic Contributions of Singapore’s Creative Industries. Singapore.
UNESCO (2000). World Culture Report. UNESCO.
--- (1998). Our Creativity Diversity. UNESCO.
UNESCO Institute for Statistics (2003). Measuring and Monitoring the Information and Knowledge Societies: A Statistical Challenge.
UNESCO Institute for Statistics (2000). International flows of selected cultural goods 1980-98.
World Economic Forum (2004a). The Global Competitiveness Report 2003-2004. Oxford University Press.
--- (2004b). The Global Information Technology Report 2003-2004. Oxford University Press.
--- (2003). The Global Competitiveness Report 2002-2003. Oxford University Press.
尹繼佐主編(2004)《2004年上海經濟發展藍皮書:創新城市》。上海:上海社會科學院出版社。
財團法人台灣智庫 (2004) 《TWCI (Taiwan Culture Indicators): 建構兼具氣質與實質的永續台灣文化指標系統》。 台北:行政院文化建設委員會。
張曉明、胡惠林、章建剛主編 (2004)《2004年:中國文化產業發展報告》。 北京:社會科學文獻出版社。
彭立勛主編 (2003) 《2003年深圳文化發展藍皮書:文化體制改革與文化產業發展》。 北京:中國社會科學出版社。

����
���� ACKNOWLEDGEMENTS
We would like to acknowledge the following individuals in this study:
Honorary Advisor
Richard ENGELHARDT Regional Advisor for Culture in Asia and the Pacific, UNESCO
Consultants
YIP Hak Kwong Policy 21, Ltd., The University of Hong Kong
John BACON-SHONE Social Sciences Research Centre, The University of Hong Kong
Ronald INGELHART University of Michigan
John KREIDLER Cultural Initiatives Silicon Valley
Research Assistants
Colin KWOK Centre for Cultural Policy Research, The University of Hong Kong
Sylvia WONG Centre for Cultural Policy Research, The University of Hong Kong
Shing AU-YEUNG Centre for Cultural Policy Research, The University of Hong Kong
LEE Hang Ting Social Sciences Research Centre, The University of Hong Kong
We would also like to thank colleagues from the Census and Statistics Department of the Hong Kong Special Administrative Region Government for their help and advice in this study.
November 2005
100
Design & Production
MCCM Creations / Eileen NG
Design Consultant
Stanley WONG
Thanks to the following artists, designers, illustrators and photographers in
contributing their artworks and images to this publication
inside pages / John FUNG, Benny LAU, Hisun WONG, Douglas YOUNG
cover jacket / anothermountainman, Gary CHANG, LAU Ching Ping,
LAU Gukzik, William LIM, TSE Ming Chong, YEUNG Hok Tak
100


![Driving Traffic + Conversions With Creativity [Case Study]](https://img.pdfslide.us/doc/110x75/55baa939bb61eb7a4f8b4671/driving-traffic-conversions-with-creativity-case-study.jpg)