Embed Size (px)
Citation preview
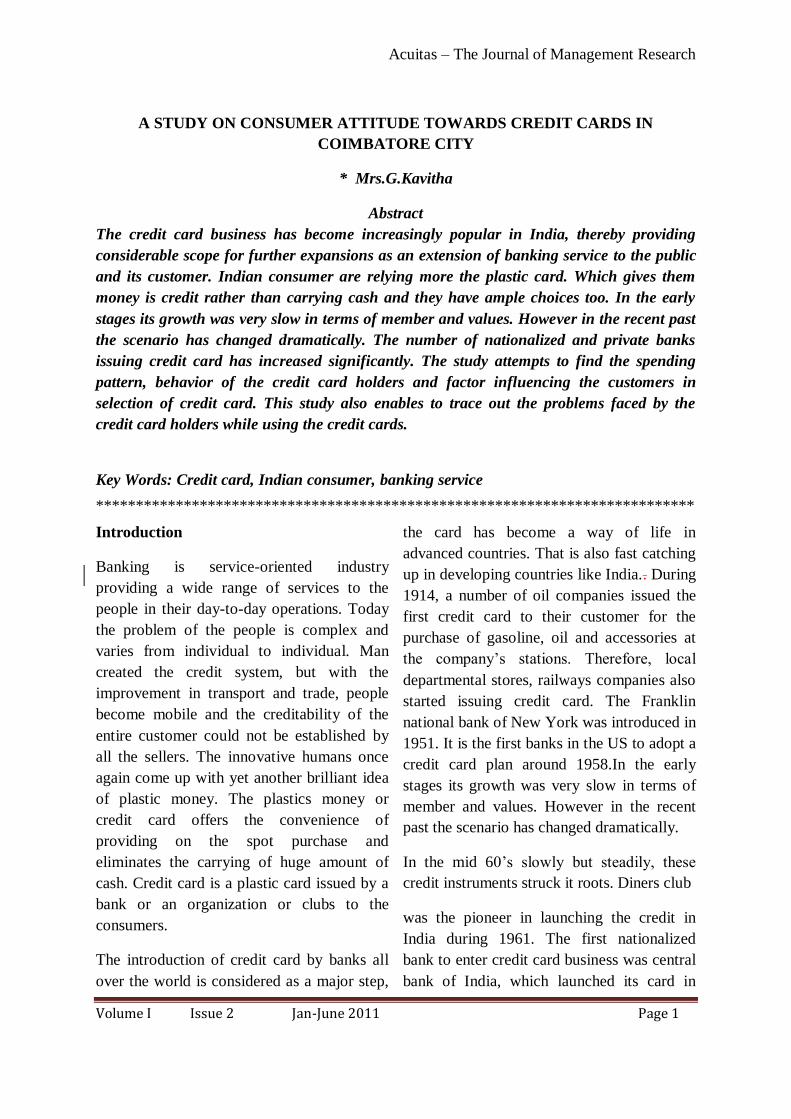
Acuitas – The Journal of Management Research
Volume I Issue 2 Jan-June 2011 Page 1
A STUDY ON CONSUMER ATTITUDE TOWARDS CREDIT CARDS IN
COIMBATORE CITY
* Mrs.G.Kavitha
Abstract
The credit card business has become increasingly popular in India, thereby providing
considerable scope for further expansions as an extension of banking service to the public
and its customer. Indian consumer are relying more the plastic card. Which gives them
money is credit rather than carrying cash and they have ample choices too. In the early
stages its growth was very slow in terms of member and values. However in the recent past
the scenario has changed dramatically. The number of nationalized and private banks
issuing credit card has increased significantly. The study attempts to find the spending
pattern, behavior of the credit card holders and factor influencing the customers in
selection of credit card. This study also enables to trace out the problems faced by the
credit card holders while using the credit cards.
Key Words: Credit card, Indian consumer, banking service
***************************************************************************
Introduction
Banking is service-oriented industry
providing a wide range of services to the
people in their day-to-day operations. Today
the problem of the people is complex and
varies from individual to individual. Man
created the credit system, but with the
improvement in transport and trade, people
become mobile and the creditability of the
entire customer could not be established by
all the sellers. The innovative humans once
again come up with yet another brilliant idea
of plastic money. The plastics money or
credit card offers the convenience of
providing on the spot purchase and
eliminates the carrying of huge amount of
cash. Credit card is a plastic card issued by a
bank or an organization or clubs to the
consumers.
The introduction of credit card by banks all
over the world is considered as a major step,
the card has become a way of life in
advanced countries. That is also fast catching
up in developing countries like India.. During
1914, a number of oil companies issued the
first credit card to their customer for the
purchase of gasoline, oil and accessories at
the company‟s stations. Therefore, local
departmental stores, railways companies also
started issuing credit card. The Franklin
national bank of New York was introduced in
1951. It is the first banks in the US to adopt a
credit card plan around 1958.In the early
stages its growth was very slow in terms of
member and values. However in the recent
past the scenario has changed dramatically.
In the mid 60‟s slowly but steadily, these
credit instruments struck it roots. Diners club
was the pioneer in launching the credit in
India during 1961. The first nationalized
bank to enter credit card business was central
bank of India, which launched its card in
Acuitas – The Journal of Management Research
Volume I Issue 2 Jan-June 2011 Page 2
august 1980.Andhra bank followed suit in
next year. They are the innovations in the
credit card business in India. Gradually other
banks adopted this scheme. The number of
nationalized and private banks issuing credit
card has increased significantly. Credit cards
are now not only an integral part of the
consumer life in metros, but even residents of
smaller cities and towns have taken to them.
This can be attributed to the aggressive
strategy of nationalized and private banks
promoting cards in smaller towns and cities.
The credit card business has become
increasingly popular in India, thereby
providing considerable scope for further
expansions as an extension of banking
service to its customer. Hence the study
attempts to find the spending pattern,
behavior and satisfaction of the credit card
holders. The study was also trace out the
problems faced by the credit card holders
while using the Credit Cards.
Objectives of The Study:
To study the frequency of usage and
utilization of credit cards.
To find level of satisfaction of credit
cardholders
To identify the problems faced by the
credit card holders.
Methodology:
The research was carried out in
Coimbatore city of Tamil Nadu. Convenient.
Sampling method was used to select the
sample. Sample size considered for this study
was 200 respondents.
Tools Used For Analysis:
The following tools are used for the
study,
1. Percentage analysis,
2. Chi-square test,
3. ANOVA (F-test),
4. T-test,
Findings of the Study
The findings of the study are presented in the following paragraphs.
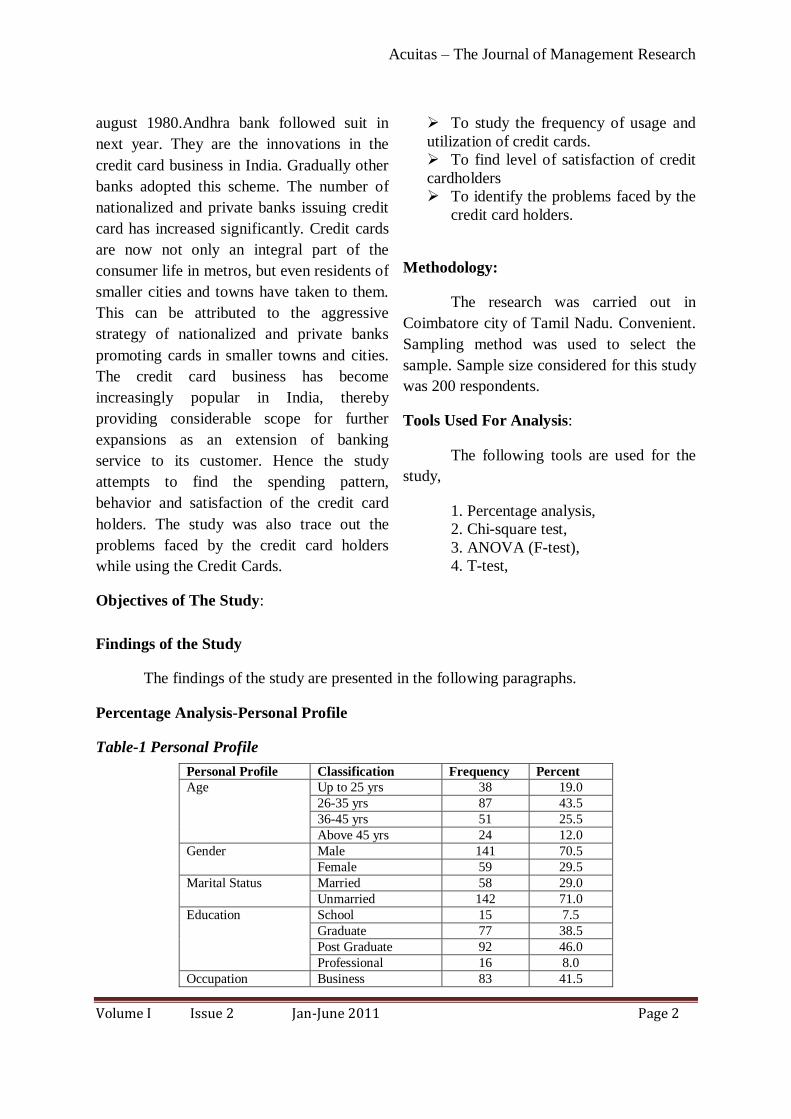
Percentage Analysis-Personal Profile
Table-1 Personal Profile
Personal Profile Classification Frequency Percent
Age Up to 25 yrs 38 19.0
26-35 yrs 87 43.5
36-45 yrs 51 25.5
Above 45 yrs 24 12.0
Gender Male 141 70.5
Female 59 29.5
Marital Status Married 58 29.0
Unmarried 142 71.0
Education School 15 7.5
Graduate 77 38.5
Post Graduate 92 46.0
Professional 16 8.0
Occupation Business 83 41.5
Acuitas – The Journal of Management Research
Volume I Issue 2 Jan-June 2011 Page 3
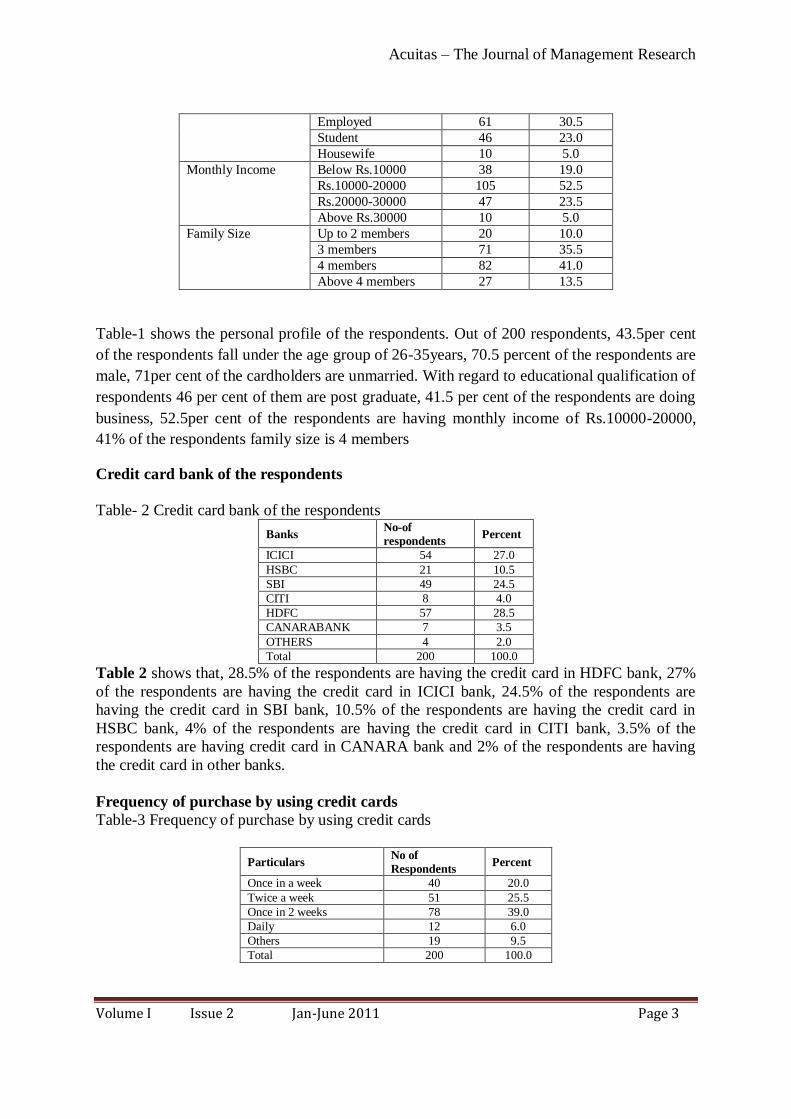
Employed 61 30.5
Student 46 23.0
Housewife 10 5.0
Monthly Income Below Rs.10000 38 19.0
Rs.10000-20000 105 52.5
Rs.20000-30000 47 23.5
Above Rs.30000 10 5.0
Family Size Up to 2 members 20 10.0
3 members 71 35.5
4 members 82 41.0
Above 4 members 27 13.5
Table-1 shows the personal profile of the respondents. Out of 200 respondents, 43.5per cent
of the respondents fall under the age group of 26-35years, 70.5 percent of the respondents are
male, 71per cent of the cardholders are unmarried. With regard to educational qualification of
respondents 46 per cent of them are post graduate, 41.5 per cent of the respondents are doing
business, 52.5per cent of the respondents are having monthly income of Rs.10000-20000,
41% of the respondents family size is 4 members
Credit card bank of the respondents
Table- 2 Credit card bank of the respondents
Banks No-of
respondents Percent
ICICI 54 27.0
HSBC 21 10.5
SBI 49 24.5
CITI 8 4.0
HDFC 57 28.5
CANARABANK 7 3.5
OTHERS 4 2.0
Total 200 100.0
Table 2 shows that, 28.5% of the respondents are having the credit card in HDFC bank, 27%
of the respondents are having the credit card in ICICI bank, 24.5% of the respondents are
having the credit card in SBI bank, 10.5% of the respondents are having the credit card in
HSBC bank, 4% of the respondents are having the credit card in CITI bank, 3.5% of the
respondents are having credit card in CANARA bank and 2% of the respondents are having
the credit card in other banks.
Frequency of purchase by using credit cards
Table-3 Frequency of purchase by using credit cards
Particulars No of
Respondents Percent
Once in a week 40 20.0
Twice a week 51 25.5
Once in 2 weeks 78 39.0
Daily 12 6.0
Others 19 9.5
Total 200 100.0
Acuitas – The Journal of Management Research
Volume I Issue 2 Jan-June 2011 Page 4
Table 3 shows that, 39% of the respondents make purchase by using credit card once in 2
weeks, 25.5% of the respondents make purchase using credit card twice a week, 20% of the
respondents make purchase using credit card once in a week, 9.5% of the respondents make
purchase using credit card when needed and 6% of the respondents make purchase using
credit card daily.
Types of utilisation of crédit cards
Table-4 Types of utilization of credit cards
Particulars No-of
respondents Percent
Durable/Non-durable 20 10.0
Hotel bills 28 14.0
Jewellery 31 15.5
Textile goods 42 21.0
Travel 5 2.5
All the above 74 37.0
Total 200 100.0
Table 4 shows that, 37% of the respondents utilize credit cards for multiple purposes, 21% of
the respondents utilize credit cards for textile goods, 15.5% of the respondents utilize credit
cards for jewellery, 14% of the respondents utilize credit cards for hotel bills, 10% of the
respondents utilize credit cards for durable/ non-durable goods and 2.5% of the respondents
utilize credit cards for travel.
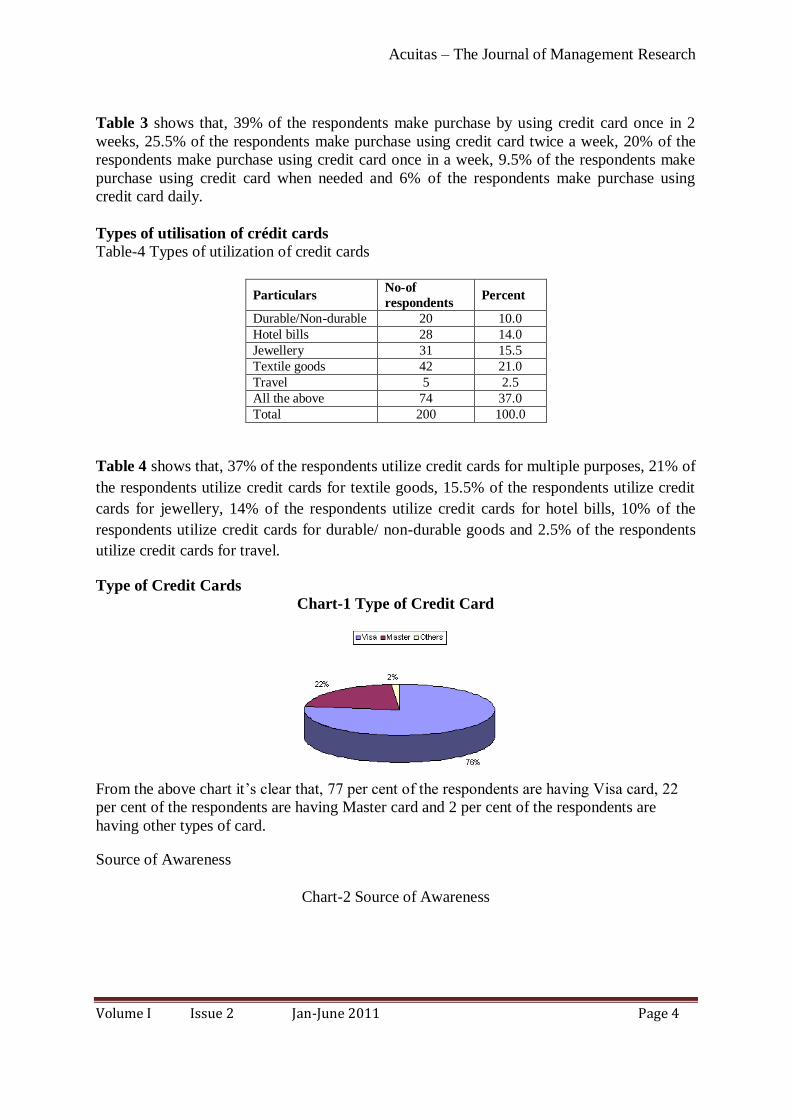
Type of Credit Cards
Chart-1 Type of Credit Card
From the above chart it‟s clear that, 77 per cent of the respondents are having Visa card, 22
per cent of the respondents are having Master card and 2 per cent of the respondents are
having other types of card.
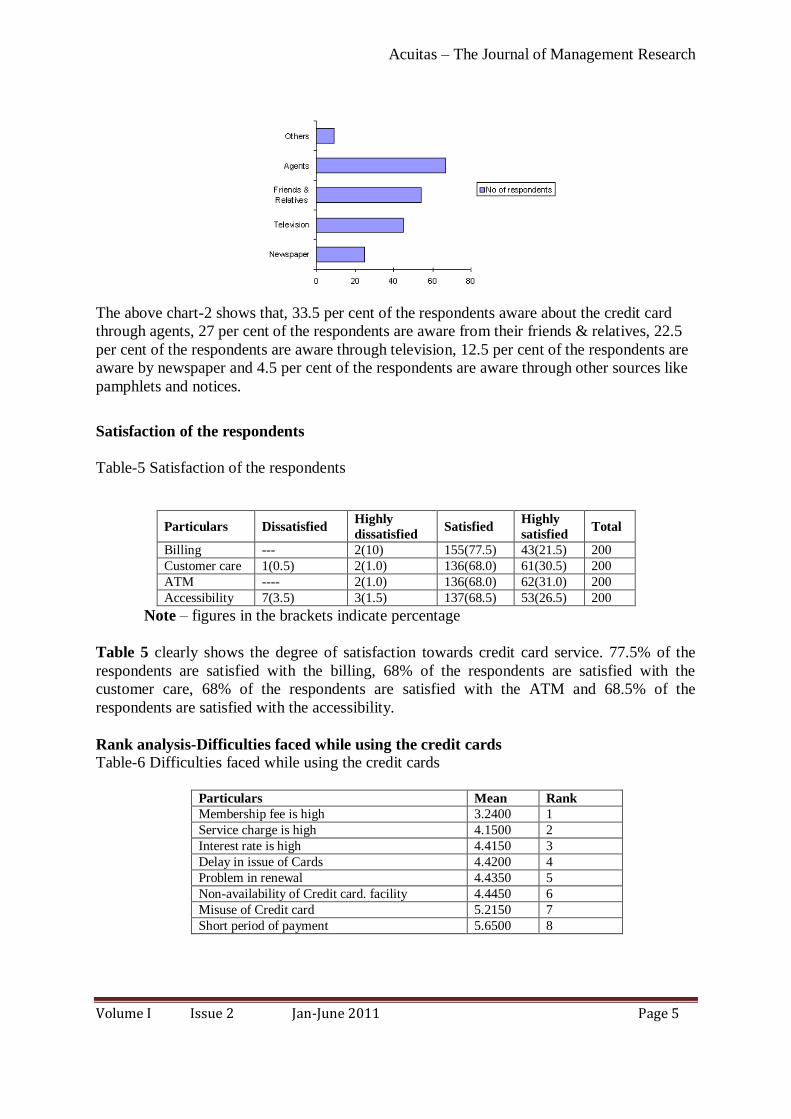
Source of Awareness
Chart-2 Source of Awareness
Acuitas – The Journal of Management Research
Volume I Issue 2 Jan-June 2011 Page 5
The above chart-2 shows that, 33.5 per cent of the respondents aware about the credit card
through agents, 27 per cent of the respondents are aware from their friends & relatives, 22.5
per cent of the respondents are aware through television, 12.5 per cent of the respondents are
aware by newspaper and 4.5 per cent of the respondents are aware through other sources like
pamphlets and notices.
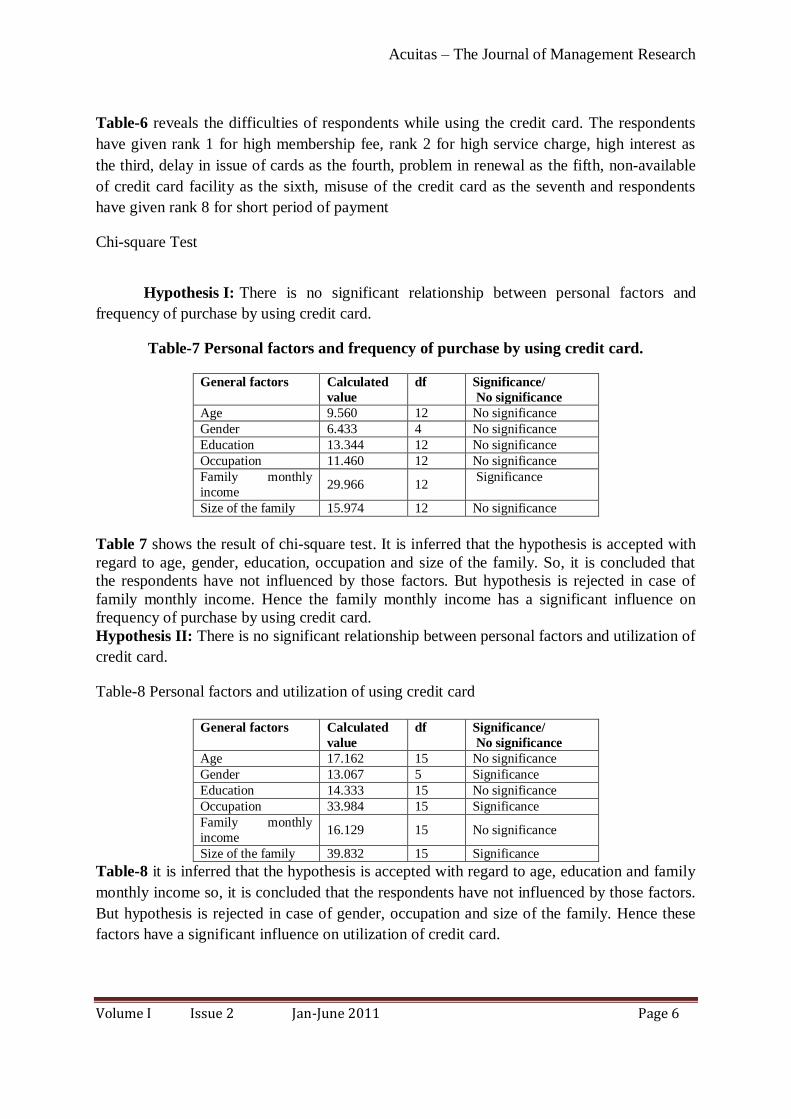
Satisfaction of the respondents
Table-5 Satisfaction of the respondents
Particulars Dissatisfied Highly
dissatisfied Satisfied
Highly
satisfied Total
Billing --- 2(10) 155(77.5) 43(21.5) 200
Customer care 1(0.5) 2(1.0) 136(68.0) 61(30.5) 200
ATM ---- 2(1.0) 136(68.0) 62(31.0) 200
Accessibility 7(3.5) 3(1.5) 137(68.5) 53(26.5) 200
Note – figures in the brackets indicate percentage
Table 5 clearly shows the degree of satisfaction towards credit card service. 77.5% of the
respondents are satisfied with the billing, 68% of the respondents are satisfied with the
customer care, 68% of the respondents are satisfied with the ATM and 68.5% of the
respondents are satisfied with the accessibility.
Rank analysis-Difficulties faced while using the credit cards
Table-6 Difficulties faced while using the credit cards
Particulars Mean Rank
Membership fee is high 3.2400 1
Service charge is high 4.1500 2
Interest rate is high 4.4150 3
Delay in issue of Cards 4.4200 4
Problem in renewal 4.4350 5
Non-availability of Credit card. facility 4.4450 6
Misuse of Credit card 5.2150 7
Short period of payment 5.6500 8
Acuitas – The Journal of Management Research
Volume I Issue 2 Jan-June 2011 Page 6
Table-6 reveals the difficulties of respondents while using the credit card. The respondents
have given rank 1 for high membership fee, rank 2 for high service charge, high interest as
the third, delay in issue of cards as the fourth, problem in renewal as the fifth, non-available
of credit card facility as the sixth, misuse of the credit card as the seventh and respondents
have given rank 8 for short period of payment
Chi-square Test
Hypothesis I: There is no significant relationship between personal factors and
frequency of purchase by using credit card.
Table-7 Personal factors and frequency of purchase by using credit card.
General factors Calculated
value
df Significance/
No significance
Age 9.560 12 No significance
Gender 6.433 4 No significance
Education 13.344 12 No significance
Occupation 11.460 12 No significance
Family monthly
income 29.966 12
Significance
Size of the family 15.974 12 No significance
Table 7 shows the result of chi-square test. It is inferred that the hypothesis is accepted with
regard to age, gender, education, occupation and size of the family. So, it is concluded that
the respondents have not influenced by those factors. But hypothesis is rejected in case of
family monthly income. Hence the family monthly income has a significant influence on
frequency of purchase by using credit card.
Hypothesis II: There is no significant relationship between personal factors and utilization of
credit card.
Table-8 Personal factors and utilization of using credit card
General factors Calculated
value
df Significance/
No significance
Age 17.162 15 No significance
Gender 13.067 5 Significance
Education 14.333 15 No significance
Occupation 33.984 15 Significance
Family monthly
income 16.129 15 No significance
Size of the family 39.832 15 Significance
Table-8 it is inferred that the hypothesis is accepted with regard to age, education and family
monthly income so, it is concluded that the respondents have not influenced by those factors.
But hypothesis is rejected in case of gender, occupation and size of the family. Hence these
factors have a significant influence on utilization of credit card.
Acuitas – The Journal of Management Research
Volume I Issue 2 Jan-June 2011 Page 7
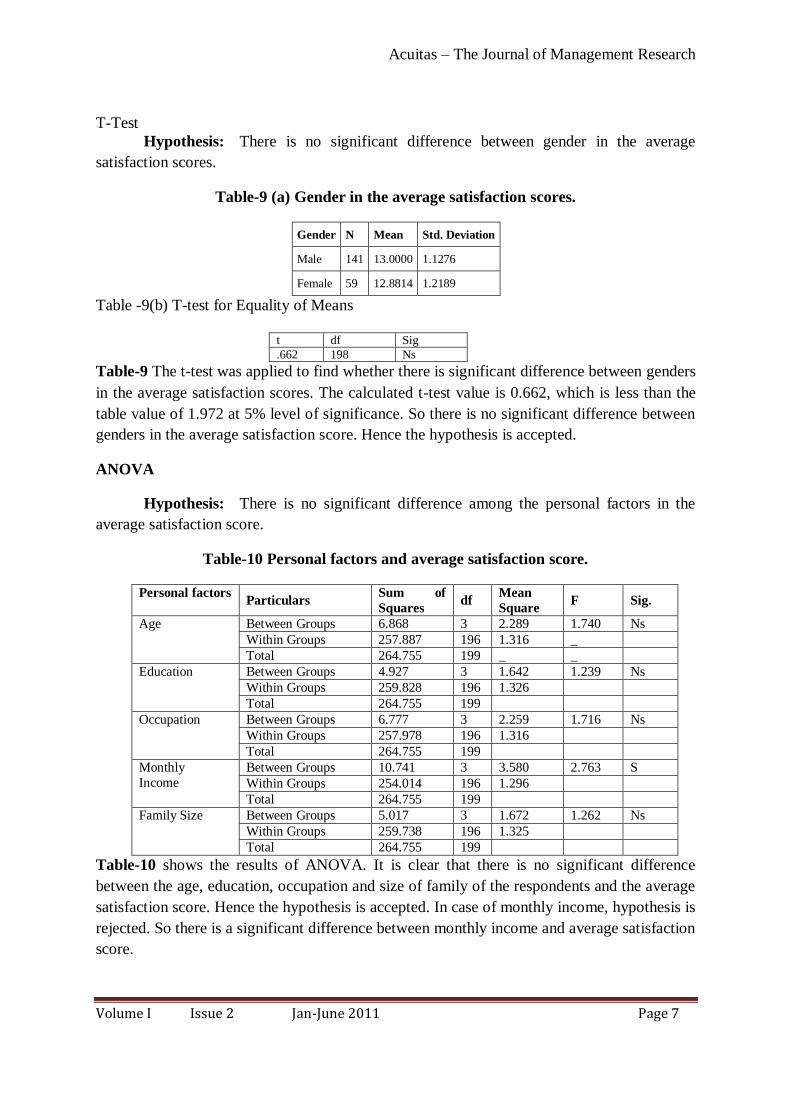
T-Test
Hypothesis: There is no significant difference between gender in the average
satisfaction scores.
Table-9 (a) Gender in the average satisfaction scores.
Gender N Mean Std. Deviation
Male 141 13.0000 1.1276
Female 59 12.8814 1.2189
Table -9(b) T-test for Equality of Means
t df Sig
.662 198 Ns
Table-9 The t-test was applied to find whether there is significant difference between genders
in the average satisfaction scores. The calculated t-test value is 0.662, which is less than the
table value of 1.972 at 5% level of significance. So there is no significant difference between
genders in the average satisfaction score. Hence the hypothesis is accepted.
ANOVA
Hypothesis: There is no significant difference among the personal factors in the
average satisfaction score.
Table-10 Personal factors and average satisfaction score.
Personal factors Particulars
Sum of
Squares df
Mean
Square F Sig.
Age Between Groups 6.868 3 2.289 1.740 Ns
Within Groups 257.887 196 1.316 _
Total 264.755 199 _ _
Education
Between Groups 4.927 3 1.642 1.239 Ns
Within Groups 259.828 196 1.326
Total 264.755 199
Occupation Between Groups 6.777 3 2.259 1.716 Ns
Within Groups 257.978 196 1.316
Total 264.755 199
Monthly
Income
Between Groups 10.741 3 3.580 2.763 S
Within Groups 254.014 196 1.296
Total 264.755 199
Family Size Between Groups 5.017 3 1.672 1.262 Ns
Within Groups 259.738 196 1.325
Total 264.755 199
Table-10 shows the results of ANOVA. It is clear that there is no significant difference
between the age, education, occupation and size of family of the respondents and the average
satisfaction score. Hence the hypothesis is accepted. In case of monthly income, hypothesis is
rejected. So there is a significant difference between monthly income and average satisfaction
score.
Acuitas – The Journal of Management Research
Volume I Issue 2 Jan-June 2011 Page 8
Conclusion
Gone are the days when credit card was the
dream of middle-income group. Now credit
card has been come affordable. But the
question is how for the customers are using
the credit card. The respondents are satisfied
with consumer care given by the banks. They
are facing a difficulty of high membership
fee and service charges levied by the banks.
Highest rates and service charges have made
the customers to use the cards very
occasionally and this has brought a negative
impact in the minds of the customers.
Measures like reduction of interest rate,
penalty fees would pave way for better
utilization. The study has given in depth
knowledge about the present scenario of
credit card. The study has also enabled to
understand the various problems faced by the
cardholders.
References
1. Abdul Muhmin and Umar (2007) „Credit card ownership and usage behaviour in Saudi Arabia. The impact of
demographics and attitude toward debt‟, Journal of financial services marketing, Vol.12 No.3 pg 219-234
2. Chan, R. (1997), “Demographic and attitudinal differences between active and inactive credit cardholders –
the case of Hong Kong”, International Journal of Bank Marketing, Vol. 15 No. 4, pg. 117-25.
3. Howcroft, B., Hamilton, R. and Hewer, P. (2002), “Consumer attitude and the usage and adoption of home-
based banking in the United Kingdom”, International Journal of Bank Marketing, Vol. 20 No. 3, pg. 111-21 4. Hun, C.J. (2005), “Credit card functions in mobile phones”, Business Times, B2.
5. Karjaluoto, J., Mattila, M. and Pento, T. (2002), “Factors underlying attitude formation towards online
banking in Finland”, International Journal of Bank Marketing, Vol. 20 No. 6,pg. 261-272.
6. Kaynak, E. and Harcar, T. (2001) „Consumer‟s attitudes and intentions towards credit card usage in an
advanced developing country‟, Journal of Financial Services Marketing, Vol. 6, No. 1, p. 24.
7. Metwally, M. M. (2003) „Attitudes of consumers in developing countries towards sing credit cards ‟, Journal
of International Marketing and Marketing Research, Vol. 28 No. 2 pg. 83 – 96.
8. Rick Fergusor (2006) „Using private label credit cards as a loyalty tool‟, Journal of consumer marketing,
Vol.23 No.7 pp 374-378
9.Slocum.J.W and Mathews H.L (1970)‟Social class and income as indicators of consumer credit behaviour‟,
The Journal of Marketing. Vol.34 April pg 69-74.
“The conventional definition of management is getting work done through people, but real
management is developing people through work. ~ Agha Hasan Abedi”
Author Details:
Mrs.G.Kavitha M.Com.,M.Phil., PGDCA., (PhD)
HOD Department of B.Com (e.com)
Mrs. M. RajaRajeswari M.Com., M.Phil.,
Lecturer, Department of B.Com(e-Com)
Acuitas – The Journal of Management Research
Volume I Issue 2 Jan-June 2011 Page 9
BINARY OPTIONS AND REAL ASSETS
* Tumellano Sebehela
Abstract
As real options is a novel idea, which draws its concepts and principles from different
disciplines, mainly from business administration, this paper conceptually links traits of
binary options and real options in the broader sense. On hedging real assets, it seems that
there is no clear hedging strategy that ideal; however, static hedging seems better as most
capital projects require huge capital injection and implementation of prudent risk
measures without incurring high costs. Furthermore, it can be inferred that binary options
have similar characteristics as capital projects, especially venture capital projects, and
research and development project. One such similar characteristic is that you receive more
capital injection into the project provided that the preceding stage was a „successful‟ one.
Therefore, similarity illustrated that binary option formulas can be used to value some
capital projects depending of prevailing circumstances.
Keywords: All or Nothing, Binary Options and Real Assets.
***************************************************************************
Introduction:
Binary Options
These are options whose payoff is either
fixed on some cash amount or asset or
nothing at all if a certain requirement is not
met. They are sometimes referred as to
digitals "all or nothing options" or bet
options. In essence the investor gets a
specified payoff when the stock price ends
above a strike price and nothing ends below
it. A fixed amount, generally denoted by Q, is
paid at time T when conditions are met.
Notation N(d2) in risk neutral world indicates
the probability of stock being above the strike
price. Four main types of binary options are:
the bet, asset or nothing, gap option and
super shares. Binary option can either be of
an American or European nature. Thus
American style option can be exercised any
time until maturity but the European style can
only be exercised at maturity.
However, this research report focuses only
the on European, all or nothing binary option.
They are cash settled with discontinuous
payoff. Binary options are simpler than other
exotic options but are very sensitive because
of their unique payoff patterns. Most binary
options are used in construction of structured
products. According to Tompkins (2006), one
known example is the construction of
supershares portfolio done by Mr. Hakansson
of University of California. Supershare is a
portfolio that allows the owner to get certain
dollar value, proportional to the assets of the
fund. Another key thing about this portfolio
is that the value of asset should lie between
the lower and upper values at expiration.
Acuitas – The Journal of Management Research
Volume I Issue 2 Jan-June 2011 Page 10
The rest of the paper is organised as follows,
section two is on pricing of binary options
with emphasis on cash or nothing and asset
or nothing, section explores dynamic hedging
and static hedging on binary options, section
four draws insights on binary options from
previous research papers, section five links
similarities between binary options and real
assets and the last section concludes the
paper.
Pricing of Binary Options
In all pricing of derivatives, it is assumed that
there are no arbitrage opportunities. Zhang
(1997:22) states that, “the arbitrage-free
argument, or no-arbitrage argument, has been
used to price all derivative securities”. Binary
option can be priced using Black-Scholes
(1973) model (BS). The standard binary
options are generally path dependent as it is
shown by Reiner and Rubinstein‟s (1991)
paper on pricing different options. Cox, Ross
and Rubinstein showed that a binomial tree
can be used price options especially asset-or-
nothing binaries. More importantly,
Rubinstein (1976) proved that arbitrage-free
pricing for BS works under the following
conditions; non-satiation, using a certain
volatility of the underlying asset, for markets;
there should be single-price law and marginal
utility of consumption and the stock price are
jointly log-normal.
The assumptions of the Black-Scholes-
Merton model (BSM) need to hold in order to
properly price all and put options. According
to BS, a derivative that can be priced at any
point in time, the following should hold; the
expected return from the underlying asset is
risk-free interest rate, r (i.e., assume =r),
calculate the expected payoff from the option
at its maturity and discount the expected
payoff at the risk-free interest rate.
Variables that are affected by risk
preferences of investors are not included in
this equation (this is both strength and
weakness). However, we know that an
investor has expected return () when taking
certain risk level. Thereafter, drops out
during derivation of the equation. Risk
neutral valuation is more artificial than
anything else. If we move back to a risk-
averse world from a risk neutral then
expected growth rate of spot price (S0) should
be taken into account and discount rate is
used for any payoffs from derivative changes.
The good thing is that there is offsetting
effect when the two changes occur. For
example, just like floating leg of the swap
curve. Cox and Ross in their study in 1976,
showed that you can find values of payoffs of
European call options by discounting at
maturity by the risk-free rate as long as the
long hedge position is constructed. Their
argument was based whenever constructed
portfolio, which has contingent claim and its
underlying in proportions and instantaneous
return on the portfolio is non-stochastic, risk-
neutral valuation relationship will result.
Cash or nothing
Cash or nothing can either be a put or call
option. This option pays a Q when the stock
price is below the exercise or strike price (Xt)
and nothing when is above the Xt. The
payoffs of cash or nothing for call and put
are: Ccash = Q exp(-rT)N(d2) and Pcash = Q
exp(-rT)N(-d2) respectively and Q is amount
of cash to be paid. Where 2d =
Acuitas – The Journal of Management Research
Volume I Issue 2 Jan-June 2011 Page 11
T
TrXS
)2
1()/ln( 2 as per BS model
(1973), where S is the stock price, X is the
strike price, r is the risk-free rate, T to
maturity of the option and is the standard
deviation. The gamma in cash or nothing
ranges between negative infinity and positive
infinity. For hedging purposes, more work
need to be done on cash or nothing. Only
initial option premium is paid by the option
holder for the bet.
Asset or Nothing
Asset or nothing can be a put option or call
option, same as cash or nothing. Basically, it
pays nothing when stock price ends below
stock price and pays amount equal to the
stock price itself if it ends up above the strike
price. The payoffs asset or nothing for call
and put are: Casset = S0exp (-qT) N(d1) and
Passet = S0exp (-qT) N(-d1) respectively. Note
that S0 in this case is the stock price that is
equivalent to the value of the asset. The rest
of variables mean the same thing as in the
case of cash or nothing-binary options, where
d1= T
TrXS
)2
1()/ln( 2 as per BS
model (1973). The variables mean the same
thing as in cash or nothing except q (thus
q=b-r) is the difference between risk-free
rate (usually denoted by r) per annum and
dividend yield per annum (usually denoted
by b). Generally, the asset used as underlying
is bought at zero. Greeks are undefined in
both cash or nothing and asset or nothing. For
asset or nothing, the option premium is paid
when contract is initiated.
Hedging of Binary Options
It seems that hedging of exotics is much
trickier than pricing them. Hedging exotics
requires extensive knowledge about of
advanced derivatives products and
mathematics. Zhang (1997:639) says that,
“applying the „no-free lunch‟ argument, we
may consider an additional difficulty in
hedging exotic options-the „trade-off‟ of the
additional convenience in using exotic
options to achieve specific objectives”.
Pricing and hedging of binary options goes
hand in hand. Despite being one of simplest
exotics, binary options are very difficult to
hedge. For example, cash or nothing (CON)
exhibits zero deltas for most underlying
assets; however they (deltas) can be anything
from zero to positive infinity around prices of
underlying assets. Delta jumps around
underlying prices creating undesirable shifts
in portfolio values including options. Various
risk managers developed different techniques
to deal with that problem (causing
undesirable shifts due to jumping) such as
method developed by Bowie and Carr (1994).
Their method, took portfolio replication into
account, considered portfolio with long
positions with infinite vanilla put options
with strike higher than targeted CON put
option. Mathematically, the method can be
written as follows:
PF (n) = n/2 (P(K+1/n)-P(K-1/n)), where K
is strike price of targeted CON put option
and n/2 is vanilla put options in a portfolio.
From that formula, they showed that it could
be re-written as follows when vanilla put
options approaches infinity:
Limit PF(n) = exp(-rT) N(-d(k))
n+∞
Acuitas – The Journal of Management Research
Volume I Issue 2 Jan-June 2011 Page 12
The key message behind the formula is that
hedging binary options can be done through
replication of the portfolio but it is not easy.
Dynamic Hedging
From BS model, we know that stocks (or
shares) represent a call option on the
company and gives the holder the right to sell
them, thus exercise put option sometime in
the future. This right can be replicated in a
portfolio with weighted risky stocks, risk-free
bonds or cash. Thus, an investor can own an
investment portfolio with weighted different
securities instead of having a call option on
the company.
Within this portfolio calculation, long
(representing short) delta amount of
underlying asset and short (representing long)
amount of risk-free bonds. Weights are
directly affected by parameters (spot of the
underlying, strike price of the option,
volatility of the underlying asset, time to
maturity of the option, interest rates and
payout rate of the underlying) that affect BS
model for pricing derivatives. Changes in
weights are due to changes of the value of
option. However, it should be noted that the
changes in option value is due to the decline
in option maturity and/or changes in the price
of the underlying asset. Resulting in a
portfolio is called „dynamic replicating
portfolio‟ as changes in weights are dynamic.
Hedging of dynamic portfolio is done
through dynamic delta of underlying asset
against long position in option. We know that
continuous hedging is almost impossible and
costly. Transaction costs are one of reasons
that lead to compromised dynamic hedging.
Static Hedging
Weights are fixed in a portfolio and no
adjustment is necessary when doing static
hedging. It seems that it (static hedge) was
motivated by limitations of dynamic hedging.
Derman, Ergner and Kani (1994, 1995) did a
lot of work on this type of hedge. There is a
lot of intuition in this method, based on the
fact that targeted option can be replicated by
vanilla options and underlying asset.
Therefore the price of target option should be
the same as the price of structured portfolio
of vanilla option. The need of not structuring
weights of portfolios and very small
transaction costs are some of the advantage
of this technique. However, there are
shortcomings of this technique as well; only
in special circumstances, can target portfolio
be replicated by a few vanilla options and
key assumption is that the perfect liquidity
for constituent vanilla options. Thus, a
number of vanilla options with different
strikes and maturities are hard to find as there
is no organized market for these instrument
(vanilla options).
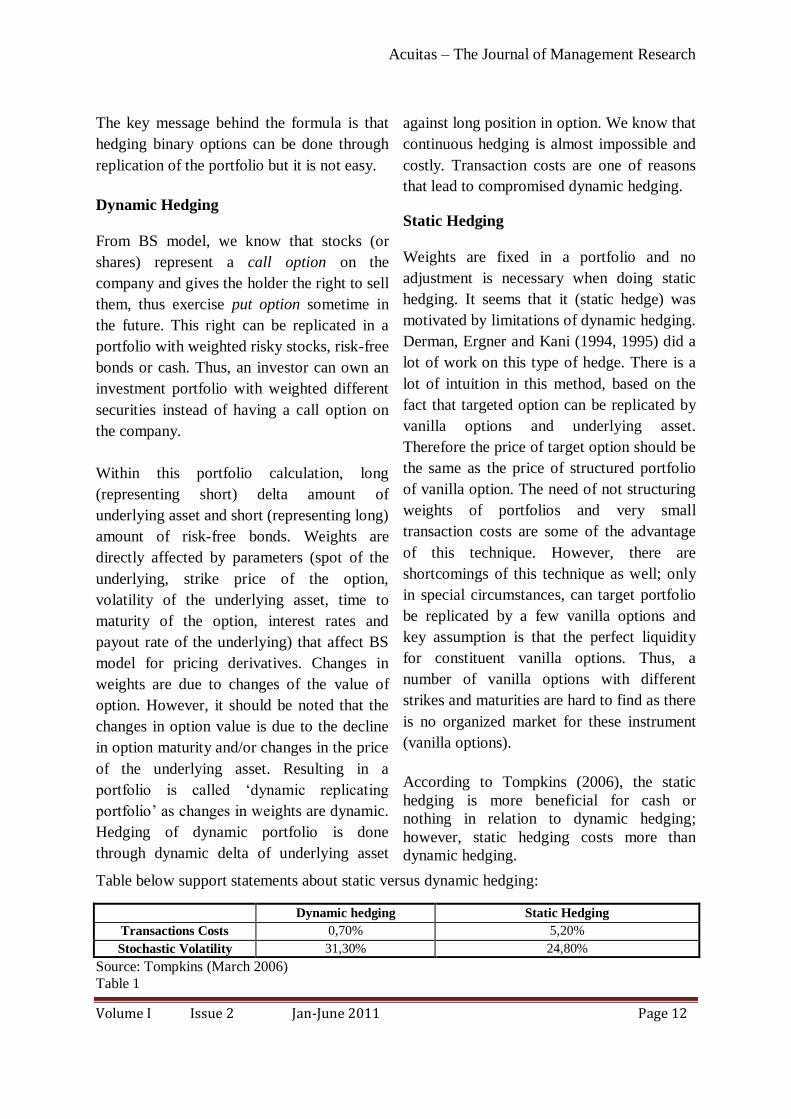
According to Tompkins (2006), the static
hedging is more beneficial for cash or
nothing in relation to dynamic hedging;
however, static hedging costs more than
dynamic hedging.
Table below support statements about static versus dynamic hedging:
Dynamic hedging Static Hedging
Transactions Costs 0,70% 5,20%
Stochastic Volatility 31,30% 24,80%
Source: Tompkins (March 2006)
Table 1
Acuitas – The Journal of Management Research
Volume I Issue 2 Jan-June 2011 Page 13
Insights on Binary Options
Recently, RBC Capital Markets division
issued articles about European binary options
(on both call and put) on currencies. Trader
whose currency position is appreciating
would buy a call to receive fixed payout as
long as the spot price lies above exercise
price. The key thing is that at expiration the
option should be in the money regardless of
what happened during life of the option.
Traders do a lot of adjustments on their
positions such that at expiration hopefully the
call will be in the money. Adjustments
include adding a one-touch feature and
instant one-touch feature. One touch feature
requires the writer to pay a certain amount at
maturity, should the spot trade at strike
during life of the contract. The latter requires
instant payout as soon as the spot touches the
strike. It is possible for traders to set four
option variables: payout amount, binary
strike, volatility and maturity. Strategic seller
calculates premium costs. The strategy
incorporates looking at a ratio of amount to
be paid and to be received. Traders who want
to have a higher payout by pushing the option
to in the money on expiration have to pay for
higher premium.
For the binary put option, everything is the
same as in the case of the call binary option
except that the trader will hold a view of
depreciating currency on his or her position.
Gorvett (1999) looked at development of new
structured products because of securitization
within insurance industry. Structured
products are designed according to what a
company what to transfer or eliminates from
its financials. One kind of structured product
designed with insurance industry is
catastrophe equity put. This product simply
gives the insurer the right to sell to investors
at agreed upon price in case a catastrophe
occurs. Thus sales takes place after a certain
catastrophic event has occurred. It is in this
regard that catastrophe equity put can be seen
as digital. Like all digitals, should nothing
happen, the insurer cannot exercise his or her
right to sell.
Glibitsky and Tompkins (2000) examined
complex binary barrier options. Their paper
shows that the payoffs of binary barrier
options as standard digital options. This is
due to the fact that their (standard digital
options and binary barrier options) payoffs
are only at the expiration date. However,
standard binary options„payoffs depend on
barrier being breached at anytime, while
binary barrier options are path dependent.
Both barrier and binary options trade over-
the-counter and are less expensive to other
corresponding regular options. At time
“zero”, barrier options (call and put) can be
calculated using the normal BS formula for
call and put.
Glibitsky and Tompkins (2000) say hedging
of barrier options can be done in many ways.
There is a choice between static and dynamic
hedging for barrier options. For static
hedging, the writer has to unwind his hedge
as soon as the triggered level is breached.
The more levels are triggered the more
unwinding is needed. Sometimes the
situation can force the writer to unwind when
the market is closed. In essence, the costs
increase with unwinding. Dynamic hedging
seems more problematic than static hedging
for barrier. Every time a new level is
triggered, the Greeks change signs and
sometimes changes might be continuous. The
Acuitas – The Journal of Management Research
Volume I Issue 2 Jan-June 2011 Page 14
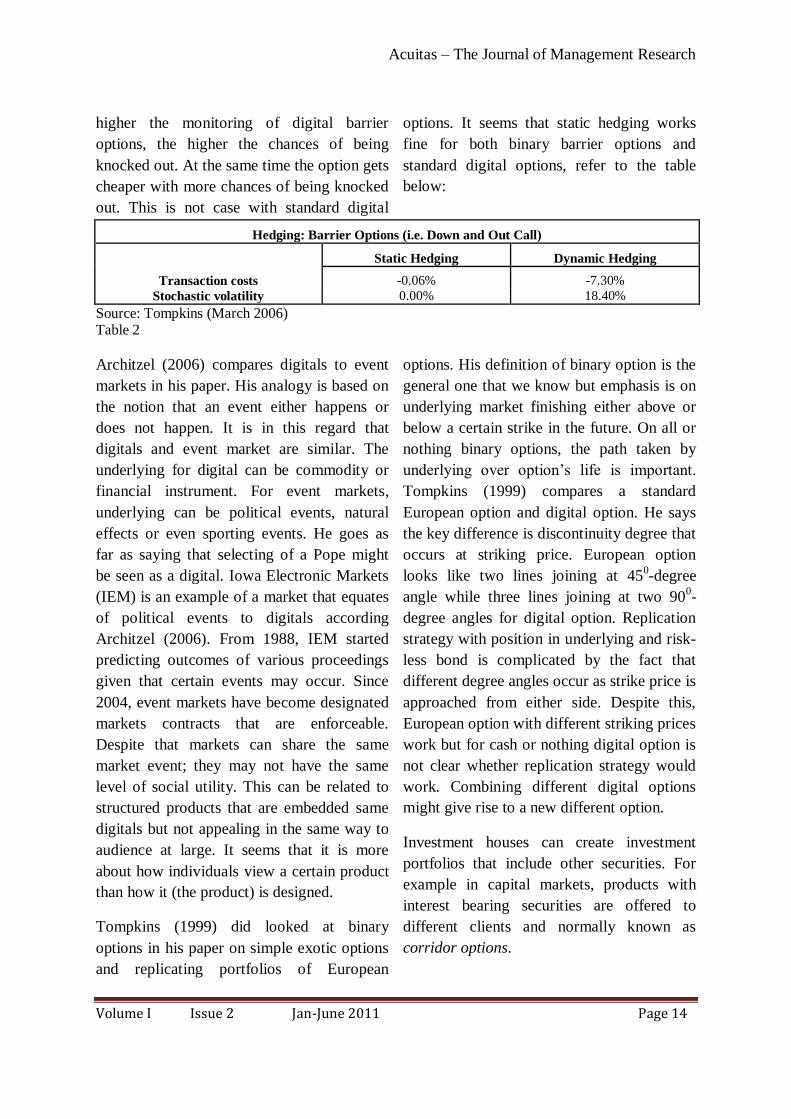
higher the monitoring of digital barrier
options, the higher the chances of being
knocked out. At the same time the option gets
cheaper with more chances of being knocked
out. This is not case with standard digital
options. It seems that static hedging works
fine for both binary barrier options and
standard digital options, refer to the table
below:
Hedging: Barrier Options (i.e. Down and Out Call)
Static Hedging Dynamic Hedging
Transaction costs -0.06% -7.30%
Stochastic volatility 0.00% 18.40%
Source: Tompkins (March 2006) Table 2
Architzel (2006) compares digitals to event
markets in his paper. His analogy is based on
the notion that an event either happens or
does not happen. It is in this regard that
digitals and event market are similar. The
underlying for digital can be commodity or
financial instrument. For event markets,
underlying can be political events, natural
effects or even sporting events. He goes as
far as saying that selecting of a Pope might
be seen as a digital. Iowa Electronic Markets
(IEM) is an example of a market that equates
of political events to digitals according
Architzel (2006). From 1988, IEM started
predicting outcomes of various proceedings
given that certain events may occur. Since
2004, event markets have become designated
markets contracts that are enforceable.
Despite that markets can share the same
market event; they may not have the same
level of social utility. This can be related to
structured products that are embedded same
digitals but not appealing in the same way to
audience at large. It seems that it is more
about how individuals view a certain product
than how it (the product) is designed.
Tompkins (1999) did looked at binary
options in his paper on simple exotic options
and replicating portfolios of European
options. His definition of binary option is the
general one that we know but emphasis is on
underlying market finishing either above or
below a certain strike in the future. On all or
nothing binary options, the path taken by
underlying over option‟s life is important.
Tompkins (1999) compares a standard
European option and digital option. He says
the key difference is discontinuity degree that
occurs at striking price. European option
looks like two lines joining at 450-degree
angle while three lines joining at two 900-
degree angles for digital option. Replication
strategy with position in underlying and risk-
less bond is complicated by the fact that
different degree angles occur as strike price is
approached from either side. Despite this,
European option with different striking prices
work but for cash or nothing digital option is
not clear whether replication strategy would
work. Combining different digital options
might give rise to a new different option.
Investment houses can create investment
portfolios that include other securities. For
example in capital markets, products with
interest bearing securities are offered to
different clients and normally known as
corridor options.
Acuitas – The Journal of Management Research
Volume I Issue 2 Jan-June 2011 Page 15
If the underlying is the only driver of the
payoff of the option then it is easy to price a
digital option. According to Tompkins
(1999), pricing is an extension of Black and
Scholes (BS) technique taking into account
that dividends have to be adjusted. Prices of
the bet and asset or nothing are the same
according Tompkins (1999) as it is shown
earlier in this paper.
Since pricing of digital options is an
extension of BS, one would expect that
strategy outlined by BS for European calls
would apply for hedging these products.
However, it seems not to be the case because
shapes of these products also resemble other
products. For example, figure 3 payoff of the
bet resemble shape of values taken by delta
of standard call option at expiration. It seems
that gamma of European call times payoff is
equal to the delta of the bet. Gamma of the
bet is close related to third order derivative of
the option to the underlying according
Tompkins (1999), which is called the speed
of the option. Popularity and availability of
these products should make possible to use
other hedging strategies that are not related to
BS.
Botteron (2003) looked embedded options
within start up in venture capital projects. He
says that each investment is triggered by
objectives of an investor. There are higher
losses when a project has reached advanced
stages of development than when it is a start
up. In my opinion, the loss at initial stages is
the amount initially invested. It is this regard,
that investor gets nothing when the venture
capital project goes sour than when it is
successful. Success is based on a certain
success of some future event. One option that
has similar charactertics to the last two
statements of this paragraph is the digitals or
binary options. Venture capital projects are
very risky but certainly attractive. These
projects should be structured and timed in
such a way that losses are minimal. Research
and development (R&D) is another area
where rewards of the project are contingent
on some future event. Non-occurrence of that
event leads to an investor not getting
anything. Initial capital (both in R&D and
venture capital) to me seems as the premium
paid to acquire an option. Having specific
stages within an investment taking in
conjunction possible success of the next stage
eliminates most unnecessary losses. The
project continues to the next stage when only
the current stage shows that the next stage
has probability of being successful. The
reward at different stages prior to the final
can be seen the indication of successes to the
next stage.
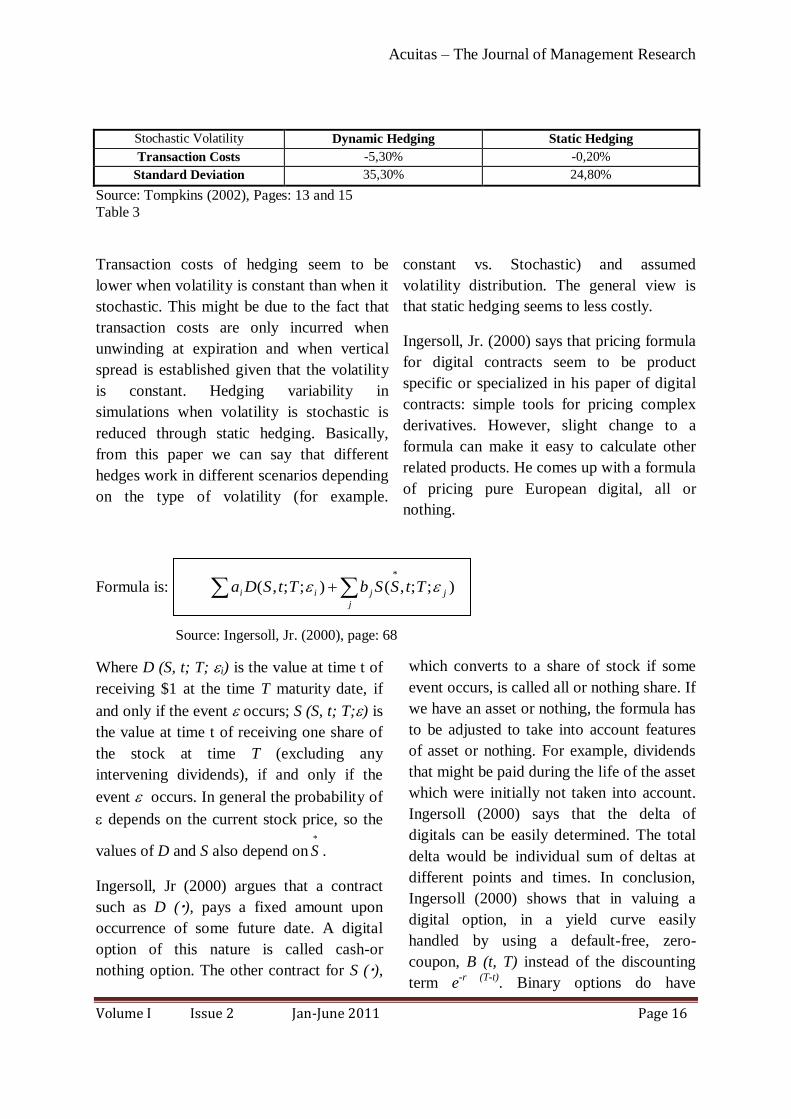
In his paper of static versus dynamic hedging
of exotic options: an evaluation of hedge
performance via simulation, Tompkins
(2002) did look at hedging for digital options.
Under digitals, he focused on the bet. He says
that on average, results of dynamic hedging
are more or less the same as Table1 (see
page: 6 of this paper) for European call
option. However, the real situation (for
example market scenarios) proves to be
volatile. According to Tompkins (2002), at
expiration of digital option, N(d2) approaches
the value of N(d1). It seems that gamma of
European call is related to delta of the digital
option as stated by Tompkins (2002). He
suggested that static hedging seem to be a
better option than dynamic hedging as shown
by the following results.
Acuitas – The Journal of Management Research
Volume I Issue 2 Jan-June 2011 Page 16
Stochastic Volatility Dynamic Hedging Static Hedging
Transaction Costs -5,30% -0,20%
Standard Deviation 35,30% 24,80%
Source: Tompkins (2002), Pages: 13 and 15
Table 3
Transaction costs of hedging seem to be
lower when volatility is constant than when it
stochastic. This might be due to the fact that
transaction costs are only incurred when
unwinding at expiration and when vertical
spread is established given that the volatility
is constant. Hedging variability in
simulations when volatility is stochastic is
reduced through static hedging. Basically,
from this paper we can say that different
hedges work in different scenarios depending
on the type of volatility (for example.
constant vs. Stochastic) and assumed
volatility distribution. The general view is
that static hedging seems to less costly.
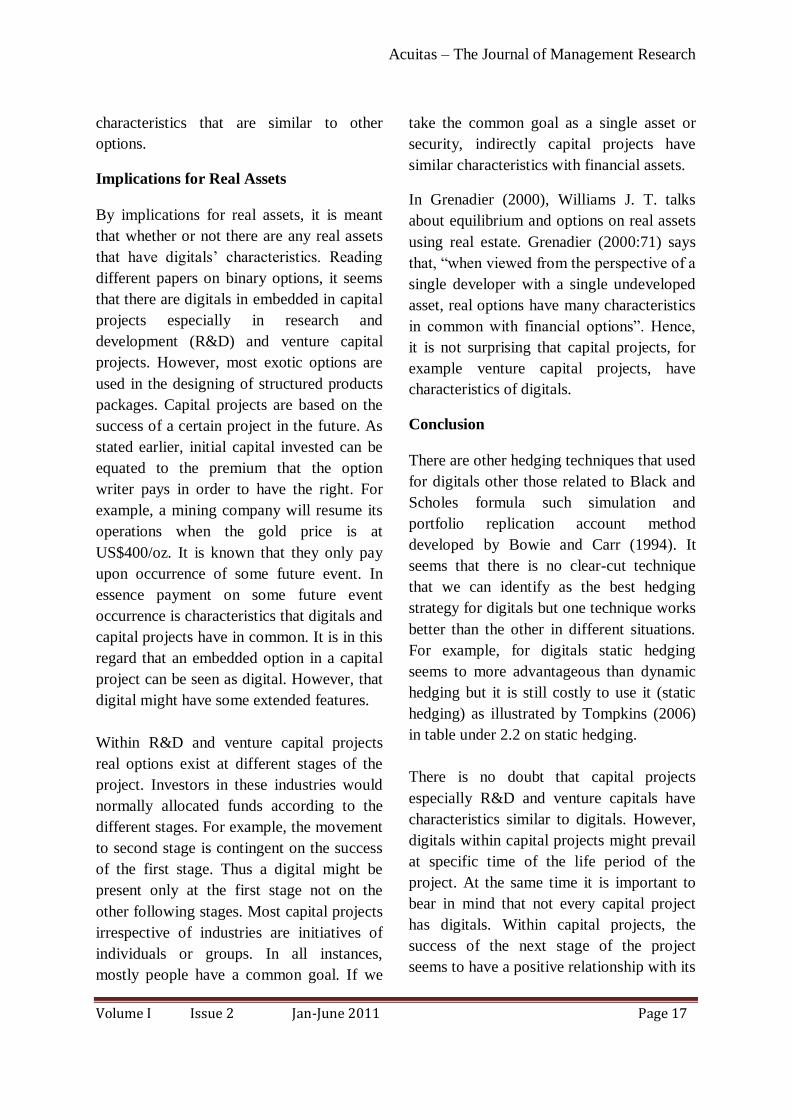
Ingersoll, Jr. (2000) says that pricing formula
for digital contracts seem to be product
specific or specialized in his paper of digital
contracts: simple tools for pricing complex
derivatives. However, slight change to a
formula can make it easy to calculate other
related products. He comes up with a formula
of pricing pure European digital, all or
nothing.
Formula is: );;,();;,(*
j
jjii TtSSbTtSDa
Source: Ingersoll, Jr. (2000), page: 68
Where D (S, t; T; i) is the value at time t of
receiving $1 at the time T maturity date, if
and only if the event occurs; S (S, t; T;) is
the value at time t of receiving one share of
the stock at time T (excluding any
intervening dividends), if and only if the
event occurs. In general the probability of
depends on the current stock price, so the
values of D and S also depend on*
S .
Ingersoll, Jr (2000) argues that a contract
such as D (), pays a fixed amount upon
occurrence of some future date. A digital
option of this nature is called cash-or
nothing option. The other contract for S (),
which converts to a share of stock if some
event occurs, is called all or nothing share. If
we have an asset or nothing, the formula has
to be adjusted to take into account features
of asset or nothing. For example, dividends
that might be paid during the life of the asset
which were initially not taken into account.
Ingersoll (2000) says that the delta of
digitals can be easily determined. The total
delta would be individual sum of deltas at
different points and times. In conclusion,
Ingersoll (2000) shows that in valuing a
digital option, in a yield curve easily
handled by using a default-free, zero-
coupon, B (t, T) instead of the discounting
term e-r (T-t)
. Binary options do have
Acuitas – The Journal of Management Research
Volume I Issue 2 Jan-June 2011 Page 17
characteristics that are similar to other
options.
Implications for Real Assets
By implications for real assets, it is meant
that whether or not there are any real assets
that have digitals‟ characteristics. Reading
different papers on binary options, it seems
that there are digitals in embedded in capital
projects especially in research and
development (R&D) and venture capital
projects. However, most exotic options are
used in the designing of structured products
packages. Capital projects are based on the
success of a certain project in the future. As
stated earlier, initial capital invested can be
equated to the premium that the option
writer pays in order to have the right. For
example, a mining company will resume its
operations when the gold price is at
US$400/oz. It is known that they only pay
upon occurrence of some future event. In
essence payment on some future event
occurrence is characteristics that digitals and
capital projects have in common. It is in this
regard that an embedded option in a capital
project can be seen as digital. However, that
digital might have some extended features.
Within R&D and venture capital projects
real options exist at different stages of the
project. Investors in these industries would
normally allocated funds according to the
different stages. For example, the movement
to second stage is contingent on the success
of the first stage. Thus a digital might be
present only at the first stage not on the
other following stages. Most capital projects
irrespective of industries are initiatives of
individuals or groups. In all instances,
mostly people have a common goal. If we
take the common goal as a single asset or
security, indirectly capital projects have
similar characteristics with financial assets.
In Grenadier (2000), Williams J. T. talks
about equilibrium and options on real assets
using real estate. Grenadier (2000:71) says
that, “when viewed from the perspective of a
single developer with a single undeveloped
asset, real options have many characteristics
in common with financial options”. Hence,
it is not surprising that capital projects, for
example venture capital projects, have
characteristics of digitals.
Conclusion
There are other hedging techniques that used
for digitals other those related to Black and
Scholes formula such simulation and
portfolio replication account method
developed by Bowie and Carr (1994). It
seems that there is no clear-cut technique
that we can identify as the best hedging
strategy for digitals but one technique works
better than the other in different situations.
For example, for digitals static hedging
seems to more advantageous than dynamic
hedging but it is still costly to use it (static
hedging) as illustrated by Tompkins (2006)
in table under 2.2 on static hedging.
There is no doubt that capital projects
especially R&D and venture capitals have
characteristics similar to digitals. However,
digitals within capital projects might prevail
at specific time of the life period of the
project. At the same time it is important to
bear in mind that not every capital project
has digitals. Within capital projects, the
success of the next stage of the project
seems to have a positive relationship with its
Acuitas – The Journal of Management Research
Volume I Issue 2 Jan-June 2011 Page 18
prior stage. Allocating capital at various
stages is one strategy of minimising risks
within capital projects. However, at the
moment digitals are mainly used in
designing structured products than in
valuations of capital projects.
Capital projects are different from each
other. Therefore, there is no asset that
exactly replicated another capital project.
The complexity and the size of projects,
makes sense that hedging to be applied per
stages. Stages generally take anything from
six months to a year or more. A lot of
valuations and due diligence are done so that
to have a good view of what will happen
over a reasonable period so that decisions
correspond to a particular period. It is in this
regard that static hedging seem reasonable
than dynamic hedging for capital projects.
References Architzel P. (Mar./Apr. 2006). Event Markets Evolve: Legal Certainty Needed. Futures Industry: 50-
53.
Botteron P and Casanova J.F. (May 2003). Start-ups Defined as Portfolios of Embedded Options.
Research Paper no.: 85, available from http://www.swissfinanceinstitute.ch/rp85.pdf. .
Glibitsky M. and Tompkins R. G. (Oct. 2000). “Complex Barrier Options”, Bank Archiv, 48 (10):
S.910-913.
Carr P., Ellis K. and Gupta V. (Jun. 1998). “Static Hedging of Exotic Options”. The Journal of
Finance, 53 (3): 1165-1190.
Gorvett R. W. (May 1999) Insurance Securitization: The Development of a New Asset Class.
Securitization of Risk, Casualty Actuarial Society Discussion Paper Program: 133-140.
Grenadier S. (2000). Game Choices. The Intersection of Real Options and Game Theory. First Edition.
Risk Books: London, UK.
Hull C. J. (2002). Options, Futures and Other Derivatives. International Edition. 5th Edition. Prentice
Hall, USA.
Hull C. J. (2000). Options, Futures and Other Derivatives. International Edition. 4th Edition. Prentice
Hall: USA.
http://www.riskglossary.com/link/binary_option.htm.
Ingersoll, Jr. J. E. (Jan. 2000). “Digital Contracts: Simple Tools for Pricing Complex Derivatives”. The
Journal of Business, 73 (1): 67-88.
RBC Capital Markets. Trade a Long Currency Position with a European Binary Call, 2002, available
from https://www.rbccm.com/fx/cid-204452.html.
RBC Capital Markets. Trade a Short Currency Position with a European Binary Put, 2002, available
from https://www.rbccm.com/fx/cid-204452.html.
Rubinstein M. (1999). Rubenstein on Derivatives: Futures, Options and Dynamic Strategies. 1st
Edition. Risk Publications: London, UK.
Tompkins R. G. (1999). “Simple Exotic Options and Replicating Portfolios of European Options”,
BankArchiv, 47(8): S. 617-628.
Tompkins R. G. (Sum 2002). “Static versus dynamic hedging of exotic options: An evaluation of hedge
performance via simulation”. The Journal of Risk Finance, 3 (4): 6-34.
Tompkins R.G. (Sum. 2006). Elective Course on Exotic Options. Frankfurt School of Finance and
Management, Frankfurt/Main: Germany.
Zhang G. P. (1997). Exotic Options: A Guide to Second Generation Options. 1st Edition. World Scientific Publishers: New Jersey: USA.
Author Name:
* Tumellano Sebehela, The University of Reading, Henley Business School, School of Real
Estate and Planning, Email: [email protected], Tel: +44(0)118 378 8175, Fax:
+44(0)118 378 8172 Reading, RG6 6UD United Kingdom
Acuitas – The Journal of Management Research
Volume I Issue 2 Jan-June 2011 Page 19
SOUTH AFRICAN EQUITIES MARKET AND STOCK MARKET
CRISIS
* Kagiso Madimabe
**Tumellano Sebehela
Abstract
The research report analyses performance of certain Johannesburg Securities (JSE)
Exchange of South Africa during financial market crisis. The essence of the study is to see
which stocks performed poorly and which stocks were resistant to the financial market
crisis. There seems to be no clear cut rule of thumb that says particular stocks within a
specific sector performs well; however, mid-caps indices have some resistance as their
constituents are mainly defensive stocks. The empirical studies illustrates that JSE
performed poorly overall and this kind perform is consistent with what many stock
exchanges experienced during financial crisis.
Key words: Defensive stocks, subprime mortgage financial crisis and equity performance.
JEL Classification: C1, G1, G2.
***************************************************************************
Introduction
Most studies on subprime mortgage financial
crisis confirmed that equities related
investments tend to perform poorly; however,
there might be exceptions in certain cases. It
seems that there is a psychological behaviour
problem on how one should react to his or
her existing investment portfolio as
illustrated by some empirical studies such as
Shiller (2000). Shiller (2000) went further to
state that during financial crisis time,
investors prefer to invest their wealth either
in cash or real assets such real estate. One
advantage of investing in real estate is that
while you earn periodical rentals on your
property, there is capital appreciation that
accrues over time on the property.
Although, real estate seems to be one asset
class that is favoured by most investors
during financial crisis; however, some
empirical studies do advocate investing in
other securities such as treasury bills as
explored by Patel and Zechauser (1987).
Furthermore, demand and supply of various
assets change during financial crisis periods
as indicated by the empirical study by Tong
and Wei (2008). In principle, the investment
manager should be able to best allocate
investment portfolios during crisis.
The rest of paper is organised as follows; the
second section explores explore some
variables‟ movements during financial crisis,
section three distinguishes between financial
and real assets, section four outlines on the
data used this empirical study, section five is
Acuitas – The Journal of Management Research
Volume I Issue 2 Jan-June 2011 Page 20
on empirical results and the last section
concludes the research report.
Literature Review
Some Indicators during Financial Crisis
Periods
Macroeconomic Environment agree
Macroeconomic variables such as real
exchange rate (influences the trading),
current account (relates to the level of
spending during a financial crisis), overall
growth of an economy (growth horizons
before, during, and after the crisis) give an
indication of an economy‟s strength,
weaknesses, and attractiveness. So far, it
seems that empirical studies on
macroeconomic state performance and
financial crisis explored mainly developed
markets with little emphasis on emerging
markets.
Quintos (2004) explored the extremal (it
means having a major impact or effect)
behaviour of emerging markets bonds in
relation to equities and bond returns of
developed markets. In her expedition to crack
the falsehood about how returns on emerging
markets fixed income investments are known
to behave like equity returns, she brings to
light the effect which an economy‟s size
(determined by the macroeconomic
composition) affects returns. Quintos (2004)
states emerging markets have got more risks
relative to developed ones in terms of
volatility, skewness and kurtosis as well as
extremely risk.
Kaminsky, Lizondo and Reinhart (1998)
analysed the ability of macroeconomic
variables to predict financial crisis. They
report that the extent to which a variable
deviates from its normal trend beyond a
certain threshold may be interpreted as the
power of that variable in predicting a crisis.
The rule of thumb is that high risk exposure
equals high rewards and consequently high
losses should a crisis occur.
Sentiments
Shiller (2000) distinguished between two
types of investor attitudes; first he describes
the bubble expectations as the perception of a
temporary uptrend by an investor which
prompts him or her to speculate on the
uptrend before the bubble bursts, then he
describes the investor confidence as the
feeling that nothing can go wrong with an
investment, that there is no need to worry.
Although, he attempts to find one, he agrees
that there is actually no reliable measure for
these variables. Through the use of
questionnaires, he was able to construct
indexes and monitor the variations and
effects among these factors of stock prices.
Results of Shiller‟s (2000) empirical study
were that, these factors as he defined them
for institutional investors, do vary through
time, but shows that, although these
variations are significant, they are minimal.
Focusing on financial crisis, Gyntelburg et al.
2008 investigated the effect that the investor
sentiments had on the company performances
and consequently the stock‟s performance.
Comparing the performance before and
during the crisis, they found that prior to the
financial crisis the stock prices were driven to
large extent by the local investor sentiments
and that during the crisis they were driven to
a considerable length by the foreign investor
sentiments.
Acuitas – The Journal of Management Research
Volume I Issue 2 Jan-June 2011 Page 21
Liquidity Preferences
The liquidity constraints become the most
worrying factor during financial crises.
Liquidity is a variable that is controlled by a
wide range of people at various levels and
various with time. The two stakeholders
mainly affected by this variable are the
governments and banks. Actions by these two
parties to protect their liquidity requirements
normally affect borrowers noticeably. High
liquidity pressures push the authority to raise
the required reserve ration which reduces the
amount of cash in circulation. Most of the
research papers on the financial crises
performance of the markets have liquidity
pressures as the underlying determining
factor of survival for the financial
corporations.
Government actions in times of financial
crises are centred on the liquidity tightening,
and this creates a lot of expectations build up
by the investors which ultimately influences
the markets. Tong and Wei (2008) explore on
the real effects of the subprime mortgage
crises, studied how the subprime crises may
spill-over from the financial sector to the real
economy and if the spill-over manifests itself
through the liquidity constraint as a supply-
side effect or through the reducing consumer
demand and confidence.
Furthermore, Tong and Wei (2008) compared
the liquidity effects on non-financial firms to
those on financial ones. Tong and Wei (2008)
concluded that liquidity is very important in
explaining cross firm differences in stock
price declines. This was found after applying
valuation measures including
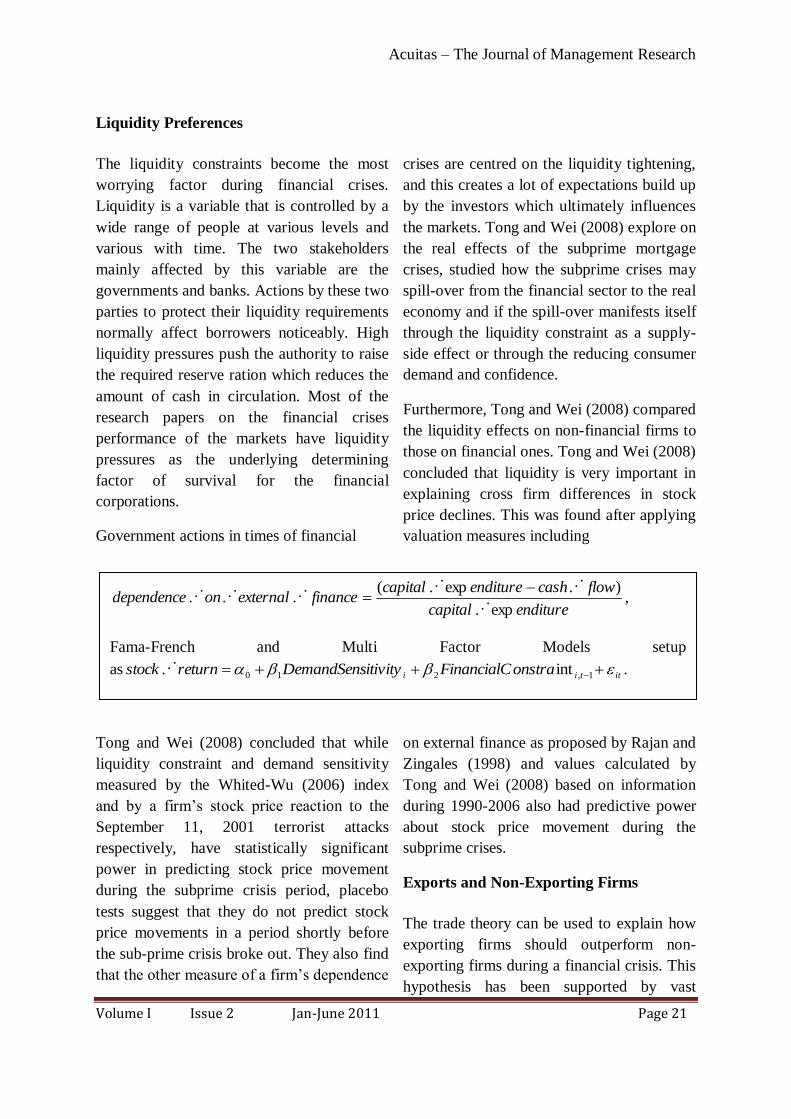
Tong and Wei (2008) concluded that while
liquidity constraint and demand sensitivity
measured by the Whited-Wu (2006) index
and by a firm‟s stock price reaction to the
September 11, 2001 terrorist attacks
respectively, have statistically significant
power in predicting stock price movement
during the subprime crisis period, placebo
tests suggest that they do not predict stock
price movements in a period shortly before
the sub-prime crisis broke out. They also find
that the other measure of a firm‟s dependence
on external finance as proposed by Rajan and
Zingales (1998) and values calculated by
Tong and Wei (2008) based on information
during 1990-2006 also had predictive power
about stock price movement during the
subprime crises.
Exports and Non-Exporting Firms
The trade theory can be used to explain how
exporting firms should outperform non-
exporting firms during a financial crisis. This
hypothesis has been supported by vast
enditurecapital
flowcashenditurecapitalfinanceexternalondependence
exp
)exp(
,
Fama-French and Multi Factor Models setup
as ittii onstraFinancialCitivityDemandSensreturnstock 1,210 int .
Acuitas – The Journal of Management Research
Volume I Issue 2 Jan-June 2011 Page 22
researches including publications by
Gyntelburg et al. 2008 and by Blalock et al.
2005. Gyntelburg et al. 2008 list three
conditions under which the hypothesis might
not hold and they are; where foreign leverage
effect outweighs the competitive urge
received from the situation, where there are
increased input costs through imported
inputs, and where the major trading
companies devalues their currencies to
lighten the exchange rate effect.
Gyntelburg et al. 2008 explain that the extent
to which an exporting firm will benefit from
a financial crisis as compared to a non-
exporting financial firm is affected by how
much the foreign debt cost increases relative
to how much it benefits from increased
competitiveness. Because input costs escalate
total costs, an exporting firm which imports
inputs may not be able to enjoy increased
opportunities, and as the previous currency
levels are matched, the possible benefits are
reduced. Although the research reveals that
the impact of these situations can
significantly affect the hypothesis, it still
concludes that local equity markets (i.e.
South East Asian markets) favoured
exporters in the periods leading to the
devaluations. They also found that equity
markets in other markets sample countries
reacted by favouring exporters immediately
after the devaluation of the Tai Baht.
Blalock et al. yes 2005 stated factors such as
the alternative sources of funding and the
leverage are affected directly affected by
financial crisis. Blalock et al. 2005 monitored
the value added, employment, and capital
level variations between these two types of
firms. In addition, Black et al. 2005explored
on how exporting firms do outperform non-
exporting firms during a financial mayhem. It
seemed that exporting firms enjoying a
reduced liquidity constraint as compared to
non-exporting ones. Exporting firms enjoy a
lesser liquidity constraint because of the
multiple sources of funding available to
them. Furthermore, exporting firms are able
to obtain funds through their foreign partners
or multinationals. This shows how type of
ownership influence positively in the
acquisition of finances for a firm. Foreign
owners are likely to put money into exporting
firms during a crisis than in an importing
firm. The cases they investigated as
differentiated by ownership, business
orientation, and performance could be
laddered in this manner; high returns [foreign
owned exporting firm, domestically owned
exporting firm and domestic owned (private
ownership) exporting firm) and low returns
[domestic owned (government ownership)
exporting firm].
Crisis Impact on Real and Financial Assets
Financial assets are assets whose values are
mainly affected by people‟s perceptions
within the financial markets while real assets‟
values are affected by financial market
fundamentals. Sometimes, market
commentators make a big mistake of using
financial market perceptions to evaluate
value changes of real assets despite the fact
that there are not many empirical studies
supporting the relationship between real and
financial assets.
Ketcham, Rubens and Yobaccio (1994)
analysed how real estate investment trusts
(REITs) can be used in inflation-hedging
strategic environment. REITs are listed real
estate instruments that derive their value
from physical properties. These properties
Acuitas – The Journal of Management Research
Volume I Issue 2 Jan-June 2011 Page 23
might be residential, commercial, retail or
industrial ones; however, there are a few
REITs made up of residential properties as
residential properties have the highest cost to
income ratio of all the properties. REITs are
positively correlated to equities and fixed
income securities as opposed to physical
properties as indicated by Acheampong et al.
2002 and O‟Neal and Page (2000).
In Ketcham et al. 1994, different types of
REITs (equity REITs, mortgage REITs and
hybrid REITs) had a high positive correlation
with government bonds, treasury bills and
common stocks as opposed to physical real
estate. Ketcham, Rubens and Yobaccio
(1994: 286) “Generally, the coefficients on
expected inflation are positive and near 1,
especially in the case of mortgage REITs.
This indicates that REITs offered some
hedging potential against expected inflation”.
Furthermore, the empirical study confirmed
that REITs irrespective of their underlyings,
are hedges against both expected and
unexpected inflation. In principle, financial
assets‟ movements are mostly influenced by
financial market perceptions as opposed to
financial market fundamentals.
Bond and Webb (1995), and Bond and Seiler
(1998) compared performance of real and
financial assets in relation to inflation
changes, while Patel and Zeckhauser (1987)
researched about the reaction of treasury bills
in relation to changes in inflation rates. Bond
and Webb (1995) stated that literature on the
inflation-hedging support that notion that real
assets act as an inflation hedge while
financial assets do not act as inflation hedge
instruments, while Bond and Seiler (1998)
stated a diversified investment portfolio
decreases volatility of the overall portfolio
during unforeseen financial market
conditions. The empirical study of Bond and
Webb (1995) was based on the
formula, QPVM ** , developed by the
Board of Governors of the Federal Reserve
System. In the formula, *P is the predicted
price level generated, M is the 2M money
supply, V is the long-run 2M velocity of
money, and Q is the level of real potential
output. It was assumed that *P is a critical
level that indicated whether investment
strategy is a simple-buy-and-hold approach to
investing in real estate properties.
In conclusion, Bond and Webb‟s (1995)
empirical study confirmed that real assets‟
values are affected by fundamentals while
financial assets‟ values are affected by
financial market perceptions. However, in
order for real estate to act as an inflation
hedge, the market supply and demand should
be in balance. Using the added variable
regression methodology (AVRM), Bond and
Seiler (1998) confirmed that residential
properties‟ returns are independent of
financial assets‟ movements. Bond and Seiler
(1998: 336) state “the results indicate that
both expected and unexpected inflation are
significant components of residential real
estate returns”. In interesting, Patel and
Zechhauser (1987:2) found that treasury bills
reduced inflation risk by about30% to 40%.
Devaney and Rayburn (1988) researched
about „when a house is more than home‟. In
principle, house according to Devaney and
Rayburn (1988) was a real asset investment
that the investor wants to own over a long
period of time. In essence, house ownership
is more like wealth accumulation as opposed
Acuitas – The Journal of Management Research
Volume I Issue 2 Jan-June 2011 Page 24
to a widely held view that houses are
acquired for consumption purpose.
Other than high rates of return that can be
earned from physical property investments,
physical properties can act as an inflation
hedge and has low correlation with most
financial assets. Therefore, when an investor
wants to diversify his or her investment
portfolio, inclusion of physical property in an
investment portfolio contributes to overall
diversification of an investment portfolio.
Devaney and Rayburn (1988) stated that
physical property investment were major
portion of investments in the United States of
America (USA). The empirical study was
based on data collected from single-unit
residential transactions for the city of
Memphis and Shelby County, Tennessee.
Analysis of variance (ANOVA) procedure
was used to indentify prices of extreme
values and discounted cash flows (DCFs)
methodology was used to calculated values
of various residential units at that time. The
correlation coefficients between submarkets
were calculated and ranged between 80.0 and
.00.1
The results indicated that all correlation
coefficients were significantly different from
zero and the microeconomic environment had
strong impact on local properties as opposed
to macroeconomic environment. Comparing
six portfolios of real estate, stocks, treasury
bills and treasury bonds; real estate had the
highest returns. Furthermore, efficient
frontier A )_( AEF (made up of all assets)
and efficient frontier B )_( BEF (made up of
all assets excluding real estate) showed
that AEF _ ‟s returns are higher
than BEF _ ‟s returns. Therefore, the
inclusion of real estate in one portfolio
enhanced its returns versus the other portfolio
that had no real estate included in it. In
conclusion, the returns on physical properties
were driven by fundamentals as opposed to
financial market perceptions.
Data
The following indices were downloaded from
I-Net Bridge data source; Johannesburg
Securities Exchange Top 40 )40(Top ,
Johannesburg Securities Exchange Resource
20 )20(Re s , Johannesburg Securities
Exchange Financial 15 )15(Fin ,
Johannesburg Securities Exchange Industrial
15 )15(IND , Johannesburg Securities
Exchange Small cap )_( CapSma and
Johannesburg Securities Exchange Medium
Cap )_( CapMid from January 1998 to
November 2008. The subprime mortgage
crisis started sometime in August 2007 and it
would be expected that could not withstand
the crisis‟ impact to under form that point the
stocks that could withstand the crisis to
perform steadily or better.
There are a lot of indigenous and exogenous
factors that affect indices in a lot of different
ways as such; it would not make sense to
compare the indices as they are. The ordinary
least squares (OLS) technique will be used to
estimate the residuals )( s of each index. The
following OLS formula will be used;
, where is the dependent
variable, JSE indices, is the beta of the
linear regression and is the independent
variable, similar related index to JSE indices.
In this case, JSE indices are seen as stock
movements that aggregate periodically and
similar related index are modelled by
different institutions, although some might
Acuitas – The Journal of Management Research
Volume I Issue 2 Jan-June 2011 Page 25
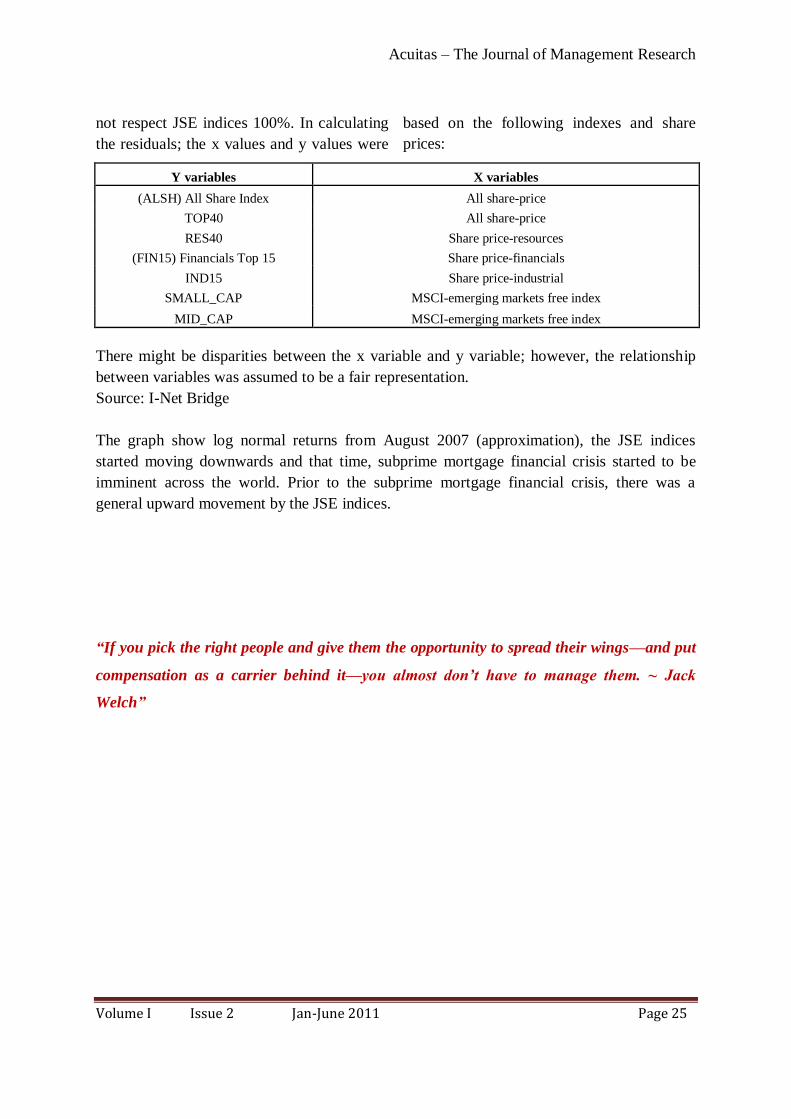
not respect JSE indices 100%. In calculating
the residuals; the x values and y values were
based on the following indexes and share
prices:
Y variables X variables
(ALSH) All Share Index All share-price
TOP40 All share-price
RES40 Share price-resources
(FIN15) Financials Top 15 Share price-financials
IND15 Share price-industrial
SMALL_CAP MSCI-emerging markets free index
MID_CAP MSCI-emerging markets free index
There might be disparities between the x variable and y variable; however, the relationship
between variables was assumed to be a fair representation.
Source: I-Net Bridge
The graph show log normal returns from August 2007 (approximation), the JSE indices
started moving downwards and that time, subprime mortgage financial crisis started to be
imminent across the world. Prior to the subprime mortgage financial crisis, there was a
general upward movement by the JSE indices.
“If you pick the right people and give them the opportunity to spread their wings—and put
compensation as a carrier behind it—you almost don‟t have to manage them. ~ Jack
Welch”
Acuitas – The Journal of Management Research
Volume I Issue 2 Jan-June 2011 Page 26
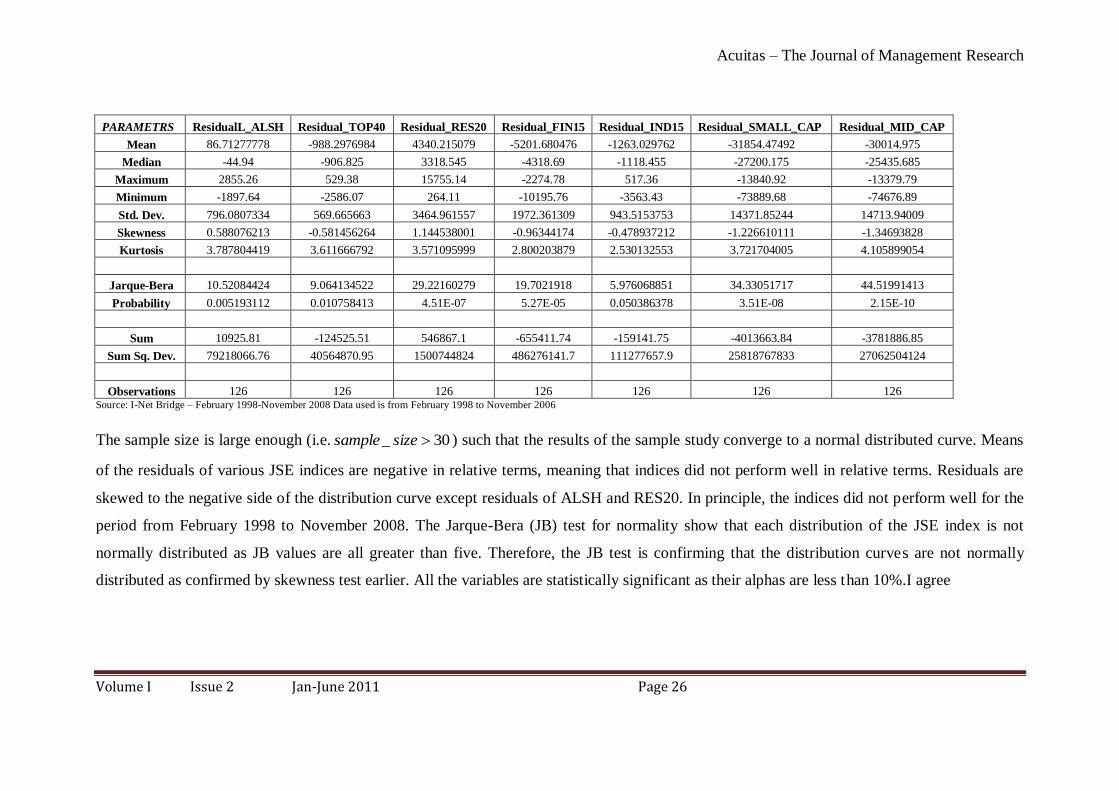
PARAMETRS ResidualL_ALSH Residual_TOP40 Residual_RES20 Residual_FIN15 Residual_IND15 Residual_SMALL_CAP Residual_MID_CAP
Mean 86.71277778 -988.2976984 4340.215079 -5201.680476 -1263.029762 -31854.47492 -30014.975
Median -44.94 -906.825 3318.545 -4318.69 -1118.455 -27200.175 -25435.685
Maximum 2855.26 529.38 15755.14 -2274.78 517.36 -13840.92 -13379.79
Minimum -1897.64 -2586.07 264.11 -10195.76 -3563.43 -73889.68 -74676.89
Std. Dev. 796.0807334 569.665663 3464.961557 1972.361309 943.5153753 14371.85244 14713.94009
Skewness 0.588076213 -0.581456264 1.144538001 -0.96344174 -0.478937212 -1.226610111 -1.34693828
Kurtosis 3.787804419 3.611666792 3.571095999 2.800203879 2.530132553 3.721704005 4.105899054
Jarque-Bera 10.52084424 9.064134522 29.22160279 19.7021918 5.976068851 34.33051717 44.51991413
Probability 0.005193112 0.010758413 4.51E-07 5.27E-05 0.050386378 3.51E-08 2.15E-10
Sum 10925.81 -124525.51 546867.1 -655411.74 -159141.75 -4013663.84 -3781886.85
Sum Sq. Dev. 79218066.76 40564870.95 1500744824 486276141.7 111277657.9 25818767833 27062504124
Observations 126 126 126 126 126 126 126 Source: I-Net Bridge – February 1998-November 2008 Data used is from February 1998 to November 2006
The sample size is large enough (i.e. 30_ sizesample ) such that the results of the sample study converge to a normal distributed curve. Means
of the residuals of various JSE indices are negative in relative terms, meaning that indices did not perform well in relative terms. Residuals are
skewed to the negative side of the distribution curve except residuals of ALSH and RES20. In principle, the indices did not perform well for the
period from February 1998 to November 2008. The Jarque-Bera (JB) test for normality show that each distribution of the JSE index is not
normally distributed as JB values are all greater than five. Therefore, the JB test is confirming that the distribution curves are not normally
distributed as confirmed by skewness test earlier. All the variables are statistically significant as their alphas are less than 10%.I agree
Acuitas – The Journal of Management Research
Volume I Issue 2 Jan-June 2011 Page 27
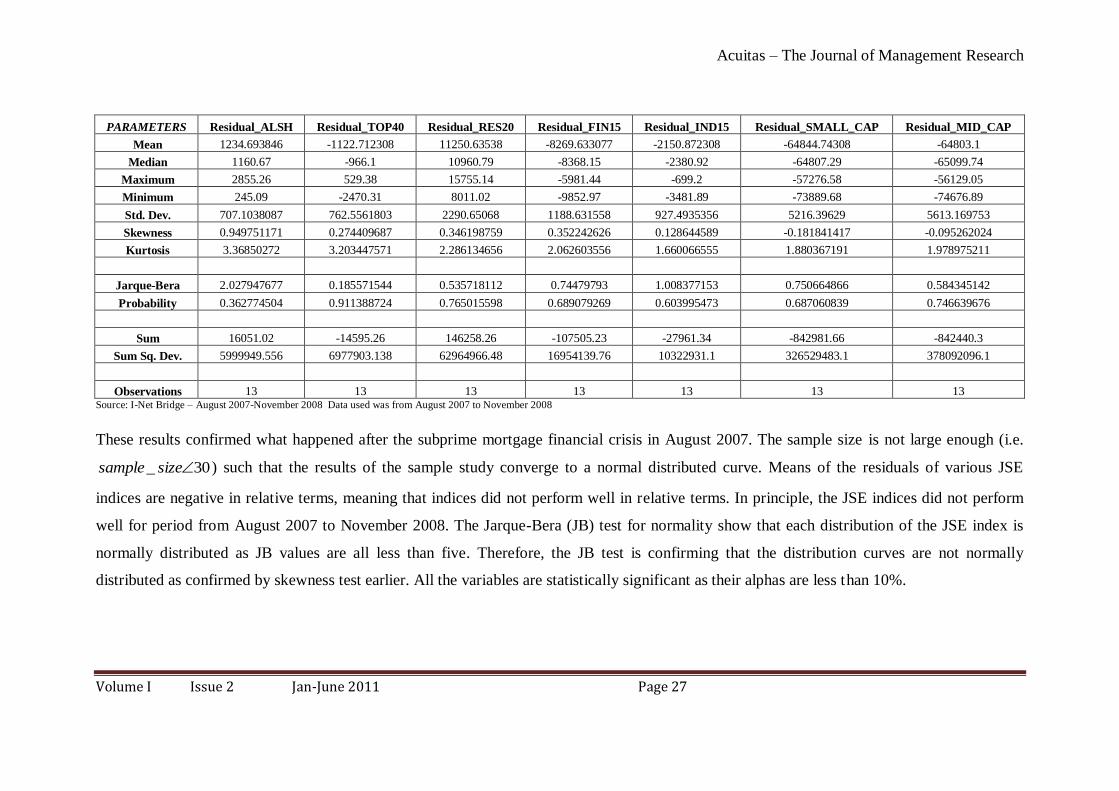
PARAMETERS Residual_ALSH Residual_TOP40 Residual_RES20 Residual_FIN15 Residual_IND15 Residual_SMALL_CAP Residual_MID_CAP
Mean 1234.693846 -1122.712308 11250.63538 -8269.633077 -2150.872308 -64844.74308 -64803.1
Median 1160.67 -966.1 10960.79 -8368.15 -2380.92 -64807.29 -65099.74
Maximum 2855.26 529.38 15755.14 -5981.44 -699.2 -57276.58 -56129.05
Minimum 245.09 -2470.31 8011.02 -9852.97 -3481.89 -73889.68 -74676.89
Std. Dev. 707.1038087 762.5561803 2290.65068 1188.631558 927.4935356 5216.39629 5613.169753
Skewness 0.949751171 0.274409687 0.346198759 0.352242626 0.128644589 -0.181841417 -0.095262024
Kurtosis 3.36850272 3.203447571 2.286134656 2.062603556 1.660066555 1.880367191 1.978975211
Jarque-Bera 2.027947677 0.185571544 0.535718112 0.74479793 1.008377153 0.750664866 0.584345142
Probability 0.362774504 0.911388724 0.765015598 0.689079269 0.603995473 0.687060839 0.746639676
Sum 16051.02 -14595.26 146258.26 -107505.23 -27961.34 -842981.66 -842440.3
Sum Sq. Dev. 5999949.556 6977903.138 62964966.48 16954139.76 10322931.1 326529483.1 378092096.1
Observations 13 13 13 13 13 13 13 Source: I-Net Bridge – August 2007-November 2008 Data used was from August 2007 to November 2008
These results confirmed what happened after the subprime mortgage financial crisis in August 2007. The sample size is not large enough (i.e.
30_ sizesample ) such that the results of the sample study converge to a normal distributed curve. Means of the residuals of various JSE
indices are negative in relative terms, meaning that indices did not perform well in relative terms. In principle, the JSE indices did not perform
well for period from August 2007 to November 2008. The Jarque-Bera (JB) test for normality show that each distribution of the JSE index is
normally distributed as JB values are all less than five. Therefore, the JB test is confirming that the distribution curves are not normally
distributed as confirmed by skewness test earlier. All the variables are statistically significant as their alphas are less than 10%.
Acuitas – The Journal of Management Research
Volume I Issue 2 Jan-June 2011 Page 28
Conclusion
The empirical studies show that the chosen JSE
indices did not perform well from February
1998 to November 2008 in relative terms and it
was worse after the subprime mortgage
financial crisis started looming. It seems that
the general norm that ‘cash is king’ during
financial market crisis seems to work as most
financial market indices were down just after
the crisis. The mid-caps index performed better
than the normal larger indices like the
resources and financials, one reason might be
that most mid-caps index are made up of
defensive stocks. As it would be expected,
during crisis periods mid-caps tend to show
resilience than more stocks because of their
defensive nature.
Overall, equities stocks perform poorly during
financial crisis due to stock market „noise‟ and
uncertainty brought by the stock market and
this is synonymous with findings of Blalock et
al. 2005 and Beltratti and Shiller (1993), and
Bond and Webb (1995) on equities‟
performance during financial. The JSE, just
like most stock exchange around the world
performed poorly overall.
References
Acheampong P., Hwa T. K. and Newell G. (2002). Listed Property Trusts in Malaysia. Journal of Real
Estate Literature, 10 (1): 279-298.
Beltratti A. E. and Shiller R. J. (1993). Actual and Warranted Relations between Asset Prices. Oxford Economic Papers 45: 387-402.
Blalock G., Gertler P. J. and Levine D. I. I. (2005). Financial Constraints on Investment in as Emerging
Market Crisis: An Empirical Investigation of Foreign Ownership. Center for International and
Development Economics Research, University of California, Berkeley: 1-37.
Bond M. T. and Webb J. R. (May 1995). Real Estate versus Financial Asset Returns and Inflation: Can a *P Trading Strategy improve REIT Investment Performance. The Journal of Real Estate Research, 10 (3):
327-334.
Devaney M. and Rayburn W. (Jun. 1988). When a House is more than a Home: Performance of the
Household Portfolio. The Journal of Real Estate Research, 3 (1): 75-85.
Gyntelberg J., Herrero A. G. and Tesei A. (Sep. 2008). The Asian Crisis: What did Local Stock Markets
Expect? BIS Working Papers, No. 261: 1-21.
Kaminsky G., Lizondo S. and Reinhart C. (1998). Leading Indicators of Currency Crises. IMF Staff Papers
45(1): 1-14.
Ketcham D. C., Rubens J. H. and Yobaccio E. (1995). The Inflation-Hedging Properties of Risk Assets:
The Case of REITs. The Journal of Real Estate Research, 10 (3): 279-296.
O‟Neal E. S. and Page D. E. (2000). Real Estate Mutual Funds: Abnormal Performance and Fund Characteristics. Journal of Real Estate Portfolio Management, 6 (3): 239-248.
Patel J. and Zeckhauser R. (Jul. 1987). Treasury Bill Futures as hedges against Inflation Risk. National
Bureau of Economic Research, Working Paper No. 2322: 1-36.
Quintos C. (Mar. 2004). Dating Breaks in the Extremal Behaviour of Financial Time Series. Simon School
of Business Working Paper No. FR 05-09: 1-40.
Rajan R. G. and Zingales L. (Jun. 1998). Financial Dependence and Growth. American Economic Review,
88 (3): 559-586.
Shiller R. J. (2000). Measuring Bubble Expectations and Investor Confidence. The Journal of Psychology
and Financial Markets, 1 (1): 49-60.
Acuitas – The Journal of Management Research
Volume I Issue 2 Jan-June 2011 Page 29
Tong H. and Wei S-J. (Jul. 2008). Real Effects of the Subprime Mortgage Crisis: Is it a Demand or a
Finance Shock? IMF Working Paper, WP/08/186: 1-36.
“Effective leadership is not about making speeches or being liked; leadership is defined by
results not attributes.” ~ Peter F. Drucker quotes
Author Details:
*Kagiso Madimabe, Final year Commerce Student at University of the Witwatersrand, School of
Economic and Business Sciences, 1 Jan Smuts Avenue, Braamfontein, 2000, Republic of South
Africa; ([email protected]).
**Tumellano Sebehela, Real Estate Finance PhD Student at Henley Business School, The
University of Reading, School of Real Estate and Planning, Whiteknights, Reading, RG6 6UD,
UK; [email protected] or [email protected].
Acuitas – The Journal of Management Research
Volume I Issue 2 Jan-June 2011 Page 30
GLOBAL RECESSION AHD HUMAN RESOURCE DEVELOPMENT
ITS MANAGEMENT CHALLENGES, STRATEGIES AND
OUTSOURCING
*S. Subramaniam
Abstract
Global recession is taking a heavy toll of the present human resource available and all the
organization is trying the retrench people in order to sustain in the market. It becomes
imperative on the part of the management to face the challenge of retaining human resource
talent and develop them. The Challenges for Management in this respect is retaining the best
human resource talent, creating trust in the mind of human resource, Getting maximum
productivity from the human resource available, facing high attrition rate & proper wage and
salary administration keeping an eye on cost cutting. In this regard the Management Strategy
will be creating an effective training module for human resource development, reward strategy
to retain human resource talent, pay hike to eligible employees, cost cutting. It is also very
important that some of the activities that organization is doing must be outsourced like
recruitment, process, & placement on contract basis.
Key Words: Global recession, effective training module and human resource development
******************************************************************************
Introduction
A global recession is a period of global
economic slowdown. The International
Monetary Fund (IMF) takes many factors into
account when defining a global recession, but
it states that global economic growth of 3
percent or less is "equivalent to a global
recession". By this measure, three periods
since 1985 qualify: 1990-1993, 1998 and
2001-2002.
America is the most effected country due to
global recession, which comes as a bad news
for India. India has most outsourcing deals
from the US. Even our exports to US have
increased over the years. Export for the month
of January declined by nearly 22 per cent.
Recessions are the result of reduction in the
demand of products in the global market.
Recession can also be associated with falling
prices known as deflation due to lack of
demand of products. Again, it could be the
result of inflation or a combination of
increasing prices and stagnant economic
growth in the west.
Recession in the West, especially the United
States, is a very bad news for our country. Our
companies in India have most outsourcing
Acuitas – The Journal of Management Research
Volume I Issue 2 Jan-June 2011 Page 31
deals from the US. Even our exports to US
have increased over the years. There is a
decline in the employment market due to the
recession in the West. There has been a
significant drop in the new hiring which is a
cause of great concern for us. Some
companies have laid off their employees and
there have been cut in promotions,
compensation and perks of the employees.
Companies in the private sector and
government sector are hesitant to take up new
projects. And they are working on existing
projects only. Projections indicate that up to
one crore persons could lose their jobs in the
correct fiscal ending March. The one crore
figure has been compiled by Federation of
Indian Export Organizations (FIEO), which
says that it has carried out an intensive survey.
The textile, garment and handicraft industry
are worse affected. Together, they are going to
lose four million jobs by April 2009,
according to the FIEO survey. There has also
been a decline in the tourist inflow lately. The
real estate has also a problem of tight liquidity
situations, where the developers are finding it
hard to raise finances.
In order to counter the recession period the
organizations operating in India must
concentrate on three aspects –
1. Human Resource Development.
2. Understanding challenges that the
management has to face.
3. Creating strategy to face these
challenges.
4. Outsourcing some of the objectives of
the organisation
Human Resource Development
Human Resource Development (HRD) is the
framework for helping employees develops
their personal and organizational skills,
knowledge, and abilities. Human Resource
Development includes such opportunities as
employee training, employee career
development, performance management and
development, coaching, mentoring, succession
planning, key employee identification, tuition
assistance, and organization development.
The focus of all aspects of Human Resource
Development is on developing the most
superior workforce so that the organization
and individual employees can accomplish
their work goals in service to customers.
Human Resource Development can be formal
such as in classroom training, a college
course, or an organizational planned change
effort. Or, Human Resource Development can
be informal as in employee coaching by a
manager. Healthy organizations believe in
Human Resource Development and cover all
of these bases.
Management challenges
Retaining the best human resource
talent – In the state of Global recession the
main problem than any organization faces is
removing non productive human resource
and retaining the best talent. In the present
situation when the awareness regarding
employee‟s rights and privileges are more, it
is very difficult to remove an employee.
Acuitas – The Journal of Management Research
Volume I Issue 2 Jan-June 2011 Page 32
On the other hand, retaining the best talent is
also very difficult since the competition is
fierce. Hence it is a challenge for the HR
Department to retain the best human resource
talent.
Creating trust in the mind of human
resource – During Recession period, a type
of fear comes in the mind of employees of
losing the job. This fear doesn‟t allow him to
concentrate on work and it suffers. It
becomes a challenge for the management to
keep the motivation high and to remove the
prevalent fear from the mind of the
employees.
It also very important that the motivation
should not lead to over confidence in such
case the employee might leave your
organization and join some other
organization with a better pay package.
Getting maximum productivity from
the human resource available – In
recession period since the demand for final
product is less, the production schedule is
curtailed. In such situation it becomes
important on the part of the supervisor to take
out maximum from each human resource
available as any wastage will result into
severe losses to the organization.
Facing high attrition rate - "A
reduction in the number of employees through
retirement, resignation or death" is known as
attrition. The rate of shrinkage in size or
number is called as attrition rate.
In the best of worlds, employees would love
their jobs, like their coworkers, work hard for
their employers, get paid well for their work,
have ample chances for advancement, and
flexible schedules so they could attend to
personal or family needs when necessary. And
never leave.
But then there's the real world. And in the
real world, employees, do leave, either
because they want more money, hate the
working conditions, hate their coworkers,
want a change, or because their spouse gets a
dream job in another state. So, what does that
entire turnover cost? And what employees
are likely to have the highest turnover? Who
is likely to stay the longest?
Proper Wage and Salary
administration keeping an eye on cost
cutting – The financial condition in the
recession period can be little problematic. In
such situation it becomes a challenge for the
management how to cater to the needs of the
employee. In India, if any organization fails
to give bonus on festivals results into lot of
chaos. It becomes a challenge for
management to give proper solution in this
condition.
Money matters in this condition and
generally organization opt for cost cutting
strategy. Cost cutting leads to bad employee
morale, lack of interest in work, adapting
slow work strategy, searching for part time
jobs, looking for some other source of
income etc.
Acuitas – The Journal of Management Research
Volume I Issue 2 Jan-June 2011 Page 33
Management strategy
Effective training module for human
resource development – To counter the
problems faced by HR Department, it
becomes imperative on the part of the
organization to introduce training
programmes that will enhance the efficiency
of the present employees so that they can be
more productive.
Training module should be created in such a
fashion so that the organization doesn‟t incur
huge financial burden. Financial burden
forces organization to implement training
programmes but that is not a good strategy if
you want to retain human talents.
Reward strategy to retain human
resource talent – Another strategy that the
management can adapt is reward strategy. In
recession period it is very difficult for
organization to implement monetary rewards
but they can implement non-monetary
reward. Non-monetary reward like
certificates, giving trophy or medals,
providing free education to wards, free
medical treatment for a certain period can be
a strategy to create trust in the eyes of
employee as well increase in efficiency.
Rewards also help to retain people since
rewards gives a positive signal to employees
from the management side. A positive effort
from the management part is a sure shot
strategy to retain human resource talent and
create loyalty amongst employees.
Pay hike to eligible employees –
Employees who show their capability
through their efforts related to their work,
management should provide salary increment
which will enhance their morale as well as
loyalty toward the organization.
Cost cutting – While implementing
cost cutting the management should make a
point that cutting is done only on those things
which are not vital for employees. If the
facilities of the employees are removed in
order to implement cost cutting it brings
anger and reduces efficiency level.
Outsourcing
Recruitment outsourcing – In period
of recession the management should
outsource things which are incurring huge
cost. For example if the recruitment is
outsourced then the organization has to pay
only when selected employees are installed in
the organization. It also becomes the
responsibility of the placement agency to
give good and reliable employees. In
recession period the recruitment is less hence
this cost can be saved.
Process outsourcing – During
production if the production manager thinks
that two of the process is incurring huge cost
to the organization then it can be done from
other agencies. This will help the
organization to control cost and get it done
on a much lesser price.
Acuitas – The Journal of Management Research
Volume I Issue 2 Jan-June 2011 Page 34
Appointing people from placement
agencies on contract basis – Nowadays it
has become a practice to appoint people on
contract basis. These employees are provided
by placement agency for a certain period of
time and they are not on the roll of the
organization hence the liability stays with the
placement agency.
Conclusion
Bo Bennett says, “As sure as the spring will
follow the winter, prosperity and economic
growth will follow recession”.
If this expectation is kept in the mind the
period of recession can be passed and the
organization can come with flying colors.
Recession is a period and it is not meant to
last longer than our life hence it is to be taken
with lot of optimism. If the organization is
optimistic then all positives can lead to
positive results and the prosperity is within
hand distance.
REFERENCES
1. Arthur, M., Khapova, S., and Wilderom, (2005), Career Success in a boundary less Career World, Journal of
Organizational Behavior, Vol. 26, pp.177-202.
2. Amanuel, G., and Susan, T., (2003), Aren't There Two Parties in an Employment Relationship? Antecedents and
Consequences of Organization, Journal of Organizational Behavior, Vol. 24, No. 5, pp. 585-99.
3. Au, Y., (1999), Intra-Cultural Variation: Evidence and Implications for International business, Journal of
International Business Studies, 30(4), 798-813. 4. Adler, J., (2002), International Dimensions of Organizational Behavior, 4th Ed, South-Western, 174-177.
5. Allen, T. and Katz, R., (2002), Managing Technical Professionals and Organizations, Sloan Management
Review, summer 54-55.
6. Au, Y., (1999), Intra-cultural variation, Evidence and Implications for international business, journal of
International Business Studies, 30(40,798-813.
7. Ambrose, L. and Kulik, T. (1999), Old friends, new faces, Motivation in the 1990s, Journal of Management,
25,231-237.
8. Blau, G., (2006), A Process Model for Understanding Victim Responses to Worksite/Function closure, Human
Resource Management Review,16, 12-28.
9. Stephen, V., and Anne, C, (2001), State-Trait Boredom: Relationships to Absenteeism, Tenure, and Job Satisfaction, Journal of Business and Psychology, Vol. 16, No. 2, pp. 317-27.
10.Batra, R., and Ahtola, O., (1990), Measuring the Hedonic and Utilitarian Sources of consumer attitudes,
Marketing letters,Vol. 2, No. 2, 159-70.
11. Cropanzano, R., Rupp, D., and Byrne, Z., (2003), The Relationship of Emotional Exhaustion to Work Attitudes,
Job Performance and Organizational Citizenship Behaviors, Journal of Applied Psychology, 88, pp. 160-169.
12. Chandon, P., Wansink, B., and Laurent, G., (2000), A benefit Congruency Framework of Sales Promotion
Effectiveness, Journal of Marketing, 64(October), 65-81.
13. Cascio, w.,(2002),Strategies For Responsible Restructuring, Academy of Management Executive, Vol.16, No. 3,
pp. 80-91.
14. Commings, G. and Worley, C., (2001), Organization Development and Change, 7th Ed, South-Western.
15. Gary, J.,(2006), The Essential Impact of Context on Organizational Behavior, Academy of Management Review,
Vol. 31, No. 2, pp. 386-408. 16. Gary, Latham., ( 2004), The Motivational Benefits of Goal-Setting, Academy of Management Executive, Vol.
18, No. 4, pp. 126-29.
17. Chadwick,C., Hunter, L., and Walston, S.,(2004), Effects of Downsizing Practices on the Performance of
Hospitals, Strategic Management Journal, Vol.25, No. 5, pp. 405-427.
Acuitas – The Journal of Management Research
Volume I Issue 2 Jan-June 2011 Page 35
18. Dane, E., and Pratt, G.,(2007), Exploring Intuition and Its Role in Managerial Decision Making, Academy of
Management Review, Vol. 32, No. 1, pp. 33-54.
19. Edmondson, A.,(2002), The Local and Variegated Nature of Learning in Organizations, Organizational Science,
Vol. 13, No. 2, pp.128-147. 20. Guangping,W., and Richard, N.,(2002), The effects of gob Autonomy, Customer Demandingness, and Trait
Competitiveness on Salesperson Learning, Self-efficacy, and Performance, Journal of Academy of Marketing
Science, Vol. 30, No. 3, pp. 217-229.
21. Hansen, T, (2002), Knowledge Networks: Explaining Effective Knowledge Sharing in Multiunit Companies,
Organization Science, Vol. 13, no.3, pp. 232-249.
22. Hofstede, G., (1991), Culture and Organizations, Software of the Mind. Berkshire England, McGraw-Hill Book
Company.
23. Hofstede, G., (1993), Cultural Constraints in Management Theory, Academy of Management Executive,
February, 7, 81-94.
24. Higgins, M, and McAllaster, C., (2002), Want innovation? Then use cultural artifacts that support it,
Organizational Dynamics, 31, 74-84. 25. Ivancevich, J., et.al, (2008), Organizational Behavior and Management, 8th Ed, McGraw-Hill, Irwin, p.33.
26. John, M., (2003), The Rated Importance, Scientific Validity, and Practical Usefulness of Organizational
Behavior Theories, A Quantitative Review, Academy of Management Learning and Education, Vol.2, No.3, pp.
250-69.
27. Joerg, D, et.al, (2003), The Impact of Community Violence and an Organization's Procedural Justice Climate on
Workplace Aggression, Academy of Management Journal, Vol. 46, No. 3, pp. 317-26.
28. Kayworth, T., and Dorothy, L.,(2002), Leadership Effectiveness in Global Virtual Teams, Journal of
MOTIVATIONS, Vol. 18, No. 3, pp. 7-40.
29. Lievens, F., and Highhouse, S., (2003), The Relation of Instrumental and Symbolic Attributes to a Company's
Attractiveness as an Employer, Personel Psychology, 56, pp.75-12.
30. Lee, C., and Bruvold, N., (2003), Creating Value for Employees: Investment in Employee Development,
International Journal of Human Resource Management, Vol.14, No. 6, pp. 981-1000. 31. Lenartowicz, T., and Roth, K., (1999), A framework for culture assessment, journal of International business
studies, 30(4), 781-98.
32. Latham, P.,(2001), the importance of understanding and changing employee outcome experiences for gaining
commitment to an organizational Coal, Personnel Psychology,54,707-716.
33. Lee, E et.al, (2002), Usefulness of Ethnicity in International Consumer Marketing, Journal of International
Consumer Marketing, 14, (4), 25-48.
34. Locke, E., (2000), Principles of Organizational Behavior, Blackwell, Oxford, England.
35. Meyer, E., (2001), Radical change, the quiet way (changing corporate culture), Harvard Business review,
October, 92-104.
36. Nakata, C., and Sivakumar, K., (2001), Instituting the marketing concept in a Multinational Setting, Journal of Academy of Marketing Science, 29(summer), 255-75.
37. Quinetta, R.,(2005), Shared and Configural Justice: A Social Network Model of Justice in Teams, Academy of
Management Review, Vol. 30, No. 3, pp. 595-607.
38. Richard, S., et.al., (2004), The Future of Work Motivation Theory, Academy Of Management Review, Vol. 29,
No. 3, pp. 379-87.
39. Robert, G.,(2003), Putting HR in Rotation, HR Magazine, Vol,48, No. 3, pp. 50-58.
40. Slaughter, J., et.al, (2004), Personality Trait Inferences about Organizations, Journal of Applied Psychology, 89,
pp. 85-103.
41. Simon, K., and Mark, U., (2002), Sales promotion Effectiveness, The Impact of Culture at an Ethnic-Group
Level, Working Paper, University of New South Wales, Australia.
42. Schermerhorn, J. et al., (2003), Organizational Behavior, John Wiley &Sons, Inc, USA.
43. Simone, G., et.al, (2004), Stressful Situations at Work and in Private Among Young Workers: An Event Sampling Approach, Social Indicators Research, Vol.67, No.1/2, pp. 11-49.
Acuitas – The Journal of Management Research
Volume I Issue 2 Jan-June 2011 Page 36
44. Spears, N., Lin, X., and Mowen, J.,(2001), Time orientation in the United State, China and Mexico,
Measurement and Insights for Promotional Strategy, Journal of International Consumer Marketing, Vol. 13, No.1,
pp. 57-75.
45. Tomer, J., (2001), Understanding High-Performance Work Systems, the joint contribution of Economics and HRM, Journal of Socio-Economics, 30, 63-73.
46. Uncle, M. and Kwok, S., (2002), Sales Promotion Effectiveness (working paper), School of Marketing,
University of New South Wales, Australia.
47. Usunier, J., (2000), Marketing Across Cultures, 3rd Ed, England, Prentice-Hall.
48. Wood, J., et.al, (2006), Organizational Behavior: Core Concepts and Application, John Wiley & Sons, Australia,
Ltd, p.319.
49. Yoo, B. et al., (2001), Measuring Cultural Values, Development and Validation of CVSCALE, working paper,
Georgia State University.
50. Yoo, B., and Donthu,N.,(2002), The effects of marketing education and individual cultural values on marketing
ethics of students, Journal of Marketing Education, 24(2),92-104.
51. Yoo, B., Donthu, N., and Lenartowicz, T., (2001), Measuring Cultural Values, Development and Validation of CVSCALE, working paper, Georgia State University.
"It is better to keep your mouth closed and let people think you are a fool than to open it
and remove all doubt." ~ Mark Twain
Authors Details:
S. Subramaniam, Assistant professor, Atrey layout, Nagpur – 440022
Phone – 0712 - 2249527
Email – [email protected]
Acuitas – The Journal of Management Research
Volume I Issue 2 Jan-June 2011 Page 37
LABOUR MANAGEMENT IN RUBBER HOLDINGS AND ESTATES OF
KANYAKUMARI DISTRICT
* Frank Sunil Justus .T
Abstract
The rubber plantation industry in India includes both well organized estates as well as small
holdings. Holdings refer to a rubber area contiguous or non-contiguous aggregating 20
hectares or less under a single ownership. Estates refer to land contiguous or non-contiguous
aggregating more than 20 hectare planted with rubber under a single ownership. The estate
sector tappers are provided with certain benefits made available to them under the Plantation
Labour Act. The holding tappers are provided certain benefits by the rubber board based on
Rubber Act. In this paper an attempt has been made to find out the satisfaction of holding and
estate tappers across four factors namely monetary factors, work conditions, welfare benefits
and health and hygiene factors. The reason for absenteeism has also been ranked based on
the opinion of tappers.
Key words: Rubber plantation, small holdings and non-contiguous aggregating
****************************************************************************
Introduction:
The rubber plantation industry in India includes
both well-organized estates and scattered small
holdings. The size of rubber plantations in
India, as noted above, ranges from small
holdings of less than one hectare to big estates
of 10,000 hectares. The rubber plantation
industry employs about two lakh workers who
constitute a major portion of the total work
force in the whole plantation industry in the
country. India is the fifth largest producer of
rubber in the world. Holdings refer to a rubber
area contiguous or non-contiguous aggregating
20 hectares or less under a single ownership.
Estates refer to land contiguous or non-
contiguous aggregating more than 20 hectare
planted with rubber under a single ownership.
The Public Relations Report of United Planters
Association of South India (1998) reveals that
the plantation money gets distributed as 35.3
percent for labour, 5.7 percent for management
expenditure, 20.3 percent for upkeep 23
percent for taxes, 0.4 percent as reserve and 5.3
percent as dividends. Sajhau (1987) has stated
Acuitas – The Journal of Management Research
Volume I Issue 2 Jan-June 2011 Page 38
that in South India, the plantations form the
only segment of the agricultural sector which is
run as an organized industry. Krishnakumar
(2004) has revealed that rubber has significant
socio-economic relevance as about a million
growers are involved in the production of this
raw material in India, besides providing about
350000 jobs in the plantation sector.
Estate and Holding sector tappers
The estate sector tappers are provided with
certain benefits made available to them under
the Plantation Labour Act. The PLA has laid
regulations on the working time of each
category of workers. The employer has to
provide protective clothing against rain and
cold as per Section 17 of the PLA. Every
plantation worker is entitled to earned leave.
An adult worker will get one day earned leave
for every 20 days work during one year. Any
worker who has put in six months or more of
service is entitled to housing facilities within
the plantation. All workers are entitled to free
medical facilities for themselves and their
families. As the Plantation Labor Act is
applicable to area above 5 hectares under a
single ownership, the word holding in this
study represents area less than 5 hectares and in
the case of estate tappers, well organized
estates with area greater than 50 hectares has
been chosen.
Though the holding tappers do not get such
benefits as available through PLA, they have
some benefits allowed to them under Rubber
Act, 1947. The Rubber Act 1947 aptly lays
down securing better working conditions and
the provisions and improvement of amenities
and incentives for workers, as one of the basic
functions of the Rubber Board. The schemes
implemented by the board provide grant of
Educational stipend and Merit Award to
children of workers undergoing studies in
recognized courses, medical benefits and
insurance to tappers, assistance for construction
of residential houses and latrines etc.
Rubber Board Assistance for the year 2007
As of 2007 the total number of tappers who
have utilized the various rubber board schemes
are as under
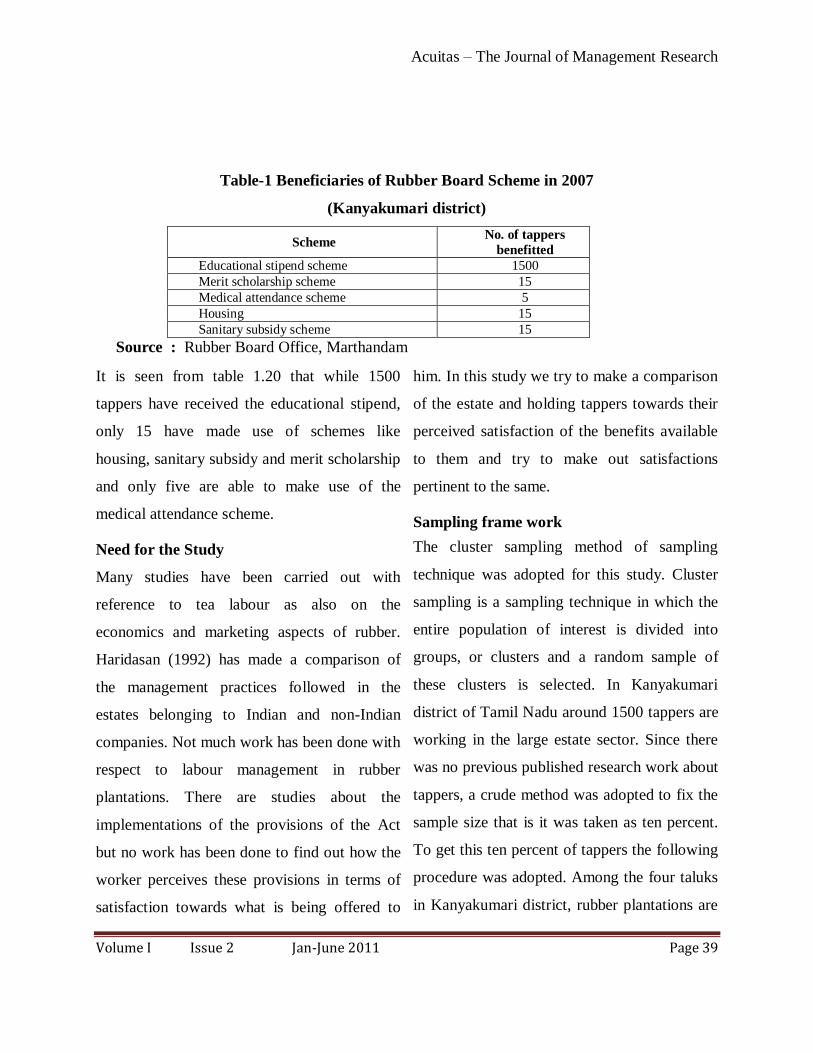
Acuitas – The Journal of Management Research
Volume I Issue 2 Jan-June 2011 Page 39
Table-1 Beneficiaries of Rubber Board Scheme in 2007
(Kanyakumari district)
Scheme No. of tappers
benefitted
Educational stipend scheme 1500
Merit scholarship scheme 15
Medical attendance scheme 5
Housing 15
Sanitary subsidy scheme 15
Source : Rubber Board Office, Marthandam
It is seen from table 1.20 that while 1500
tappers have received the educational stipend,
only 15 have made use of schemes like
housing, sanitary subsidy and merit scholarship
and only five are able to make use of the
medical attendance scheme.
Need for the Study
Many studies have been carried out with
reference to tea labour as also on the
economics and marketing aspects of rubber.
Haridasan (1992) has made a comparison of
the management practices followed in the
estates belonging to Indian and non-Indian
companies. Not much work has been done with
respect to labour management in rubber
plantations. There are studies about the
implementations of the provisions of the Act
but no work has been done to find out how the
worker perceives these provisions in terms of
satisfaction towards what is being offered to
him. In this study we try to make a comparison
of the estate and holding tappers towards their
perceived satisfaction of the benefits available
to them and try to make out satisfactions
pertinent to the same.
Sampling frame work
The cluster sampling method of sampling
technique was adopted for this study. Cluster
sampling is a sampling technique in which the
entire population of interest is divided into
groups, or clusters and a random sample of
these clusters is selected. In Kanyakumari
district of Tamil Nadu around 1500 tappers are
working in the large estate sector. Since there
was no previous published research work about
tappers, a crude method was adopted to fix the
sample size that is it was taken as ten percent.
To get this ten percent of tappers the following
procedure was adopted. Among the four taluks
in Kanyakumari district, rubber plantations are
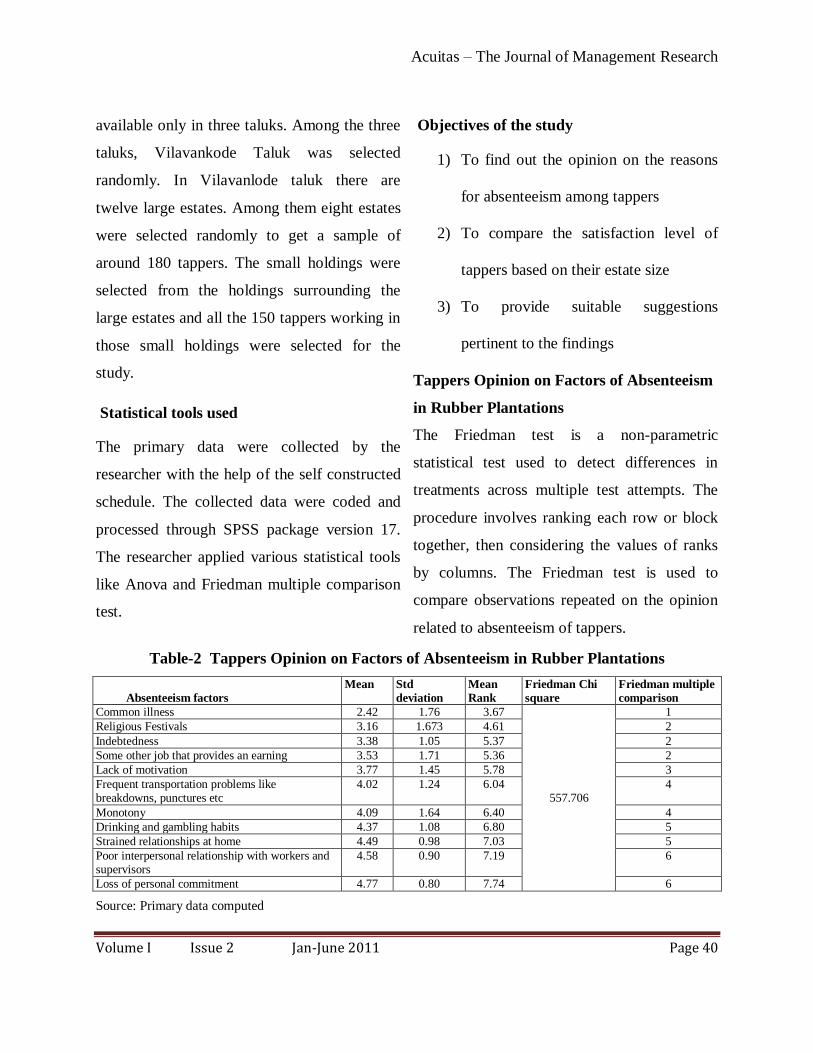
Acuitas – The Journal of Management Research
Volume I Issue 2 Jan-June 2011 Page 40
available only in three taluks. Among the three
taluks, Vilavankode Taluk was selected
randomly. In Vilavanlode taluk there are
twelve large estates. Among them eight estates
were selected randomly to get a sample of
around 180 tappers. The small holdings were
selected from the holdings surrounding the
large estates and all the 150 tappers working in
those small holdings were selected for the
study.
Statistical tools used
The primary data were collected by the
researcher with the help of the self constructed
schedule. The collected data were coded and
processed through SPSS package version 17.
The researcher applied various statistical tools
like Anova and Friedman multiple comparison
test.
Objectives of the study
1) To find out the opinion on the reasons
for absenteeism among tappers
2) To compare the satisfaction level of
tappers based on their estate size
3) To provide suitable suggestions
pertinent to the findings
Tappers Opinion on Factors of Absenteeism
in Rubber Plantations
The Friedman test is a non-parametric
statistical test used to detect differences in
treatments across multiple test attempts. The
procedure involves ranking each row or block
together, then considering the values of ranks
by columns. The Friedman test is used to
compare observations repeated on the opinion
related to absenteeism of tappers.
Table-2 Tappers Opinion on Factors of Absenteeism in Rubber Plantations
Absenteeism factors
Mean Std
deviation
Mean
Rank
Friedman Chi
square
Friedman multiple
comparison
Common illness 2.42 1.76 3.67
557.706
1
Religious Festivals 3.16 1.673 4.61 2
Indebtedness 3.38 1.05 5.37 2
Some other job that provides an earning 3.53 1.71 5.36 2
Lack of motivation 3.77 1.45 5.78 3
Frequent transportation problems like breakdowns, punctures etc
4.02 1.24 6.04 4
Monotony 4.09 1.64 6.40 4
Drinking and gambling habits 4.37 1.08 6.80 5
Strained relationships at home 4.49 0.98 7.03 5
Poor interpersonal relationship with workers and supervisors
4.58 0.90 7.19 6
Loss of personal commitment 4.77 0.80 7.74 6
Source: Primary data computed
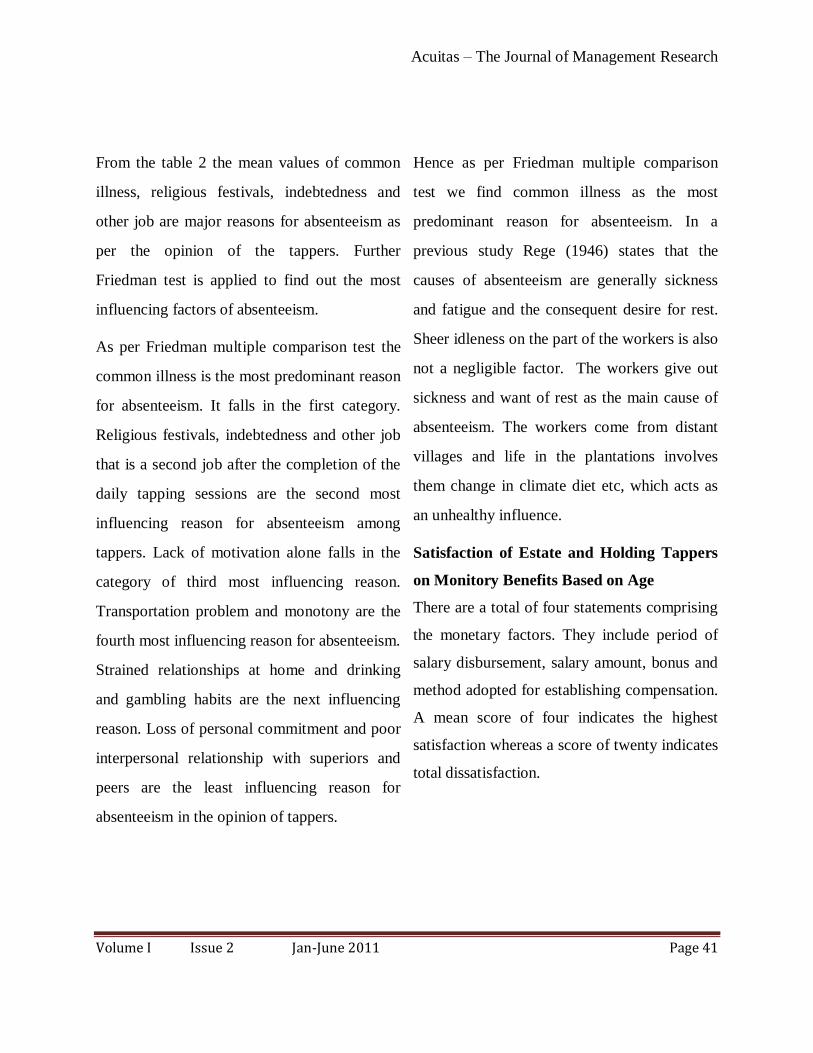
Acuitas – The Journal of Management Research
Volume I Issue 2 Jan-June 2011 Page 41
From the table 2 the mean values of common
illness, religious festivals, indebtedness and
other job are major reasons for absenteeism as
per the opinion of the tappers. Further
Friedman test is applied to find out the most
influencing factors of absenteeism.
As per Friedman multiple comparison test the
common illness is the most predominant reason
for absenteeism. It falls in the first category.
Religious festivals, indebtedness and other job
that is a second job after the completion of the
daily tapping sessions are the second most
influencing reason for absenteeism among
tappers. Lack of motivation alone falls in the
category of third most influencing reason.
Transportation problem and monotony are the
fourth most influencing reason for absenteeism.
Strained relationships at home and drinking
and gambling habits are the next influencing
reason. Loss of personal commitment and poor
interpersonal relationship with superiors and
peers are the least influencing reason for
absenteeism in the opinion of tappers.
Hence as per Friedman multiple comparison
test we find common illness as the most
predominant reason for absenteeism. In a
previous study Rege (1946) states that the
causes of absenteeism are generally sickness
and fatigue and the consequent desire for rest.
Sheer idleness on the part of the workers is also
not a negligible factor. The workers give out
sickness and want of rest as the main cause of
absenteeism. The workers come from distant
villages and life in the plantations involves
them change in climate diet etc, which acts as
an unhealthy influence.
Satisfaction of Estate and Holding Tappers
on Monitory Benefits Based on Age
There are a total of four statements comprising
the monetary factors. They include period of
salary disbursement, salary amount, bonus and
method adopted for establishing compensation.
A mean score of four indicates the highest
satisfaction whereas a score of twenty indicates
total dissatisfaction.
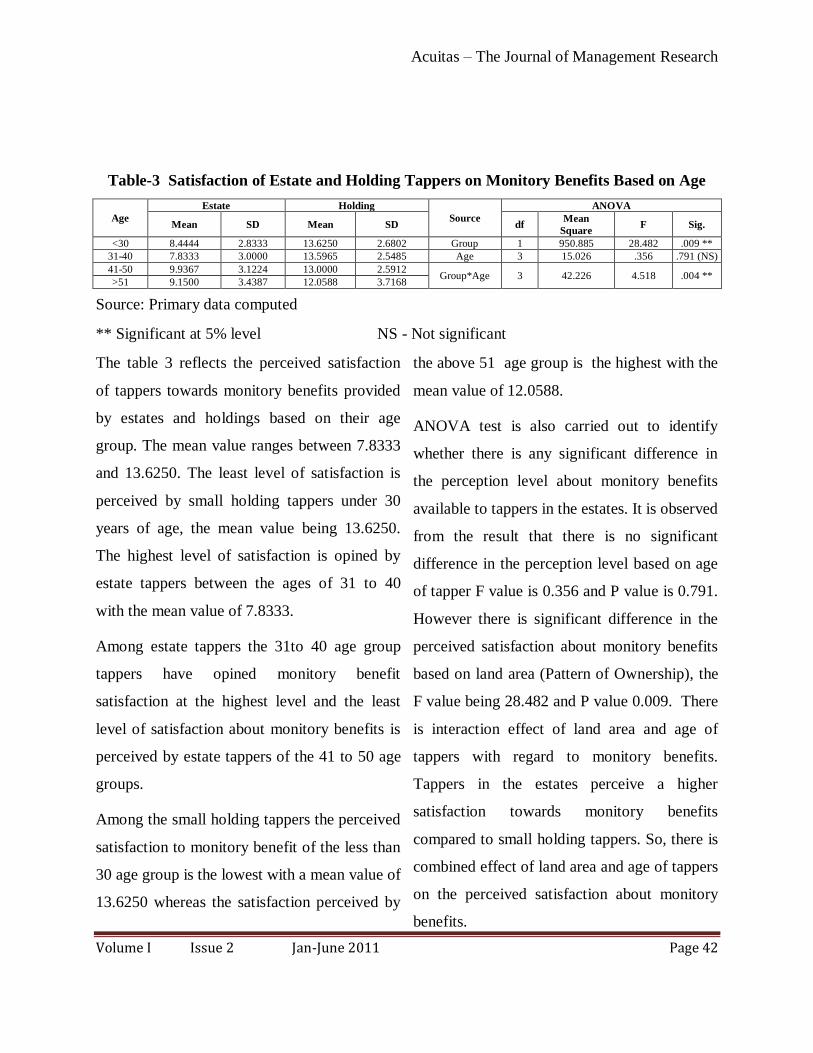
Acuitas – The Journal of Management Research
Volume I Issue 2 Jan-June 2011 Page 42
Table-3 Satisfaction of Estate and Holding Tappers on Monitory Benefits Based on Age
Age
Estate Holding
Source
ANOVA
Mean SD Mean SD df Mean
Square F Sig.
<30 8.4444 2.8333 13.6250 2.6802 Group 1 950.885 28.482 .009 **
31-40 7.8333 3.0000 13.5965 2.5485 Age 3 15.026 .356 .791 (NS)
41-50 9.9367 3.1224 13.0000 2.5912 Group*Age 3 42.226 4.518 .004 **
>51 9.1500 3.4387 12.0588 3.7168
Source: Primary data computed
** Significant at 5% level NS - Not significant
The table 3 reflects the perceived satisfaction
of tappers towards monitory benefits provided
by estates and holdings based on their age
group. The mean value ranges between 7.8333
and 13.6250. The least level of satisfaction is
perceived by small holding tappers under 30
years of age, the mean value being 13.6250.
The highest level of satisfaction is opined by
estate tappers between the ages of 31 to 40
with the mean value of 7.8333.
Among estate tappers the 31to 40 age group
tappers have opined monitory benefit
satisfaction at the highest level and the least
level of satisfaction about monitory benefits is
perceived by estate tappers of the 41 to 50 age
groups.
Among the small holding tappers the perceived
satisfaction to monitory benefit of the less than
30 age group is the lowest with a mean value of
13.6250 whereas the satisfaction perceived by
the above 51 age group is the highest with the
mean value of 12.0588.
ANOVA test is also carried out to identify
whether there is any significant difference in
the perception level about monitory benefits
available to tappers in the estates. It is observed
from the result that there is no significant
difference in the perception level based on age
of tapper F value is 0.356 and P value is 0.791.
However there is significant difference in the
perceived satisfaction about monitory benefits
based on land area (Pattern of Ownership), the
F value being 28.482 and P value 0.009. There
is interaction effect of land area and age of
tappers with regard to monitory benefits.
Tappers in the estates perceive a higher
satisfaction towards monitory benefits
compared to small holding tappers. So, there is
combined effect of land area and age of tappers
on the perceived satisfaction about monitory
benefits.
Acuitas – The Journal of Management Research
Volume I Issue 2 Jan-June 2011 Page 43
International Labour Organization report
(1965) has indicated that plantation managers
put young workers on tapping job on the
grounds that their fingers are suppler and that
they learn quicker and do the job better than
old persons.
The Royal Commission (1929) observes that if
the attractions of tea garden life in Assam are
increased, the result should be that recruits will
offer themselves at the depot without the
intervention of any intermediary.
Small holding tappers of age less than 30 are
the most dissatisfied based on monetary
factors. In an earlier study on small holdings,
Pothen et al. (2000), opines that in small
holdings workers do not prefer to be tappers in
rubber plantations as the wage rates are lower
compared to that of casual labour elsewhere, at
a tapping task of 300 trees per tapper. The
opportunity cost of a tapper is higher since he
has to start work during the early hours of the
day and is engaged up to sunset although the
actual working hours may be less than eight
hours with higher extent of leisure in between.
Further there is the monotony of working alone
and loss of working days during the rainy and
summer seasons.
It is found that cent percent of small holdings
have working days less than 251 days of which
30 percent has less than 201 days and 80
percent has less than 231 days. This means that
they do not get paid for more than 120 days in
a year which is a period of three months.
Satisfaction of Estate and Holding Tappers
on Work Conditions Based on the Nativity
of Tappers
There are a total of seven statements
comprising the work conditions. They include
drinking water provisions, working hours,
responsibilities, work pattern, work tools
provision, local transport facilities and
grievance procedure. A mean score of seven
indicates the highest satisfaction whereas a
score of thirty five indicates total
dissatisfaction.
"Destiny is not a matter of chance, but of choice. Not something to wish for, but to attain"
~ William Jennings Bryan

Acuitas – The Journal of Management Research
Volume I Issue 2 Jan-June 2011 Page 44
Table-4 Satisfaction of Estate and Holding Tappers on Work Conditions Based on the
Nativity of Tappers
Nativity of
tapper
Estate Holding
Source
ANOVA
Mean SD Mean SD df Mean
Square F Sig.
Immigrant 11.5882 3.5542 18.9000 3.1780 Group 1 753.696 12.351 .176 (NS)
Actual population
13.8204 7.6089 17.8929 6.9050
Nativity of
tapper 1 8.727 .143
.770
(NS)
Group*Nativity of tapper
1 61.021 1.218 .271 (NS)
Source: Primary data computed NS- Not significant
The table 4 reflects the opinion of tappers
towards work conditions existing in the estates
and holdings based on their nativities. The
mean value ranges between 11.5882 and
18.9000. The highest level of satisfaction is
perceived by immigrant tappers of large
estates. The lowest level of satisfaction is
opined by immigrant tappers of small holding
with the mean value of 18.9000.
The immigrant tappers of estate have opined
work condition at the highest level with the
mean value 11.5882 and the least level of
satisfaction about work condition is opined by
native tappers with a mean value of 13.8204
The native holding tappers have opined a
greatest satisfaction to work condition
compared to immigrant small holding tappers
who have opined a lowers satisfaction.
ANOVA test is also carried out to identify
whether there is any significant difference in
the perception level about work condition in
the estates. It is observed from the result that
there is no significant difference in the
perception level based on nativity of tappers. (F
value is .143 and P value is 0.770). Similarly
there is no significant difference in the
perceived satisfaction about work condition
based on land area. There is no interaction
effect of land area and nativity of tappers with
regard to work condition.
The immigrants having relocated, their chances
of looking at other jobs are quiet restricted.
They seem to concentrate on the single work at
hand while the actual population multi task.
The immigrant tappers in the estate sector are
provided with plantation quarters, stay as one
big plantation community and are also
provided benefits as per plantation Act.

Acuitas – The Journal of Management Research
Volume I Issue 2 Jan-June 2011 Page 45
Bhadra (1992) has indicated that plantation all
over the world is survived on imported
labourers who are comparatively cheaper than
the local labourers. The immigrant labourers
become an inseparable part of the plantation
system. Plantation is by and large associated
with a resident labour force which is of alien
origin.
Justus et al. (2009) have stated that one is in a
great place to work if one trusts the people he
works for, takes pride in the work he does and
enjoy the company of the people he works
with.
Satisfaction of Estate and Holding Tappers
on Health and Hygiene Factors Based on
Gender
There are a total of three statements comprising
the health and hygiene factors. They include
water facility in housing area, sanitary facilities
in plantations and street light and sanitation in
housing area. A mean score of three indicates
the highest satisfaction whereas a score of
fifteen indicates total dissatisfaction.
Table-5 Satisfaction of Estate and Holding Tappers on Health and Hygiene Factors Based
on Gender
Gender Estate Holding Source ANOVA
Mean SD Mean SD df Mean square F Sig.
Male 6.7931 3.3388 9.1007 2.5594 Group 1 44.142 5.002 .026**
Gender 1 .317 .036 0.850(NS)
Female 5.3000 1.2516 10.0000 2.5518 Group * Gender 1 5.145 0.583 0.446 (NS)
Source: Primary data computed
** Significant at 5 % level NS- Not significant
The table 5 reflects the opinion of tappers
towards health and hygiene factors available at
large estates and small holdings based on their
gender. The mean value ranges between 5.3000
and 10.0000. The least level of satisfaction is
perceived by female tappers of small holdings
the mean value being 10.0000. The maximum
level of satisfaction is opined by women
tappers of large estates with the mean value of
5.3000.
Among estate tappers, female tappers have
opined a higher satisfaction towards health and
hygiene factors with the mean value 5.3000
and male tappers have lesser perceived
Acuitas – The Journal of Management Research
Volume I Issue 2 Jan-June 2011 Page 46
satisfaction about factors of health and
hygiene.
Again among holding tappers, the female
tappers have opined a lower satisfaction to
health and hygiene factors compared to male
tappers, the mean value being 10.0000.
ANOVA test is also carried out to identify
whether there is any significant difference in
the perception level about health and hygiene
among rubber tappers. It is observed from the
result that there is no significant difference in
the perception level based on gender, the F
value being .036 and P value 0.850. But there
is significant difference in the perception about
health and hygiene based on land area, the F
value being 5.002 and P value is 0.026. There
is no interaction effect of land area and gender
of tappers with regard to health and hygiene
factors.
Female tappers are more satisfied than male
tappers in the case of health and hygiene
factors.
Bhowmik (1996) has indicated that water
sources have a close bearing on women‟s lives.
Women are the major users of water, in the
sense that they take the major responsibility for
those tasks that involve the use of water.
Where water sources are available within easy
reach of dwellings, the burden on women‟s
lives are eased and not only do they have more
free time but also better health.
Satisfaction of Estate and Holding Tappers
on Welfare Factors Based on Religion
There are a total of four statements that
constitutes the frame work for the opinion of
the tappers with regard to welfare factors. They
include the availability of education facilities,
education stipend scheme, education
scholarship scheme and housing subsidy
scheme. A mean score of four indicates the
highest satisfaction whereas a score of twenty
indicates total dissatisfaction.
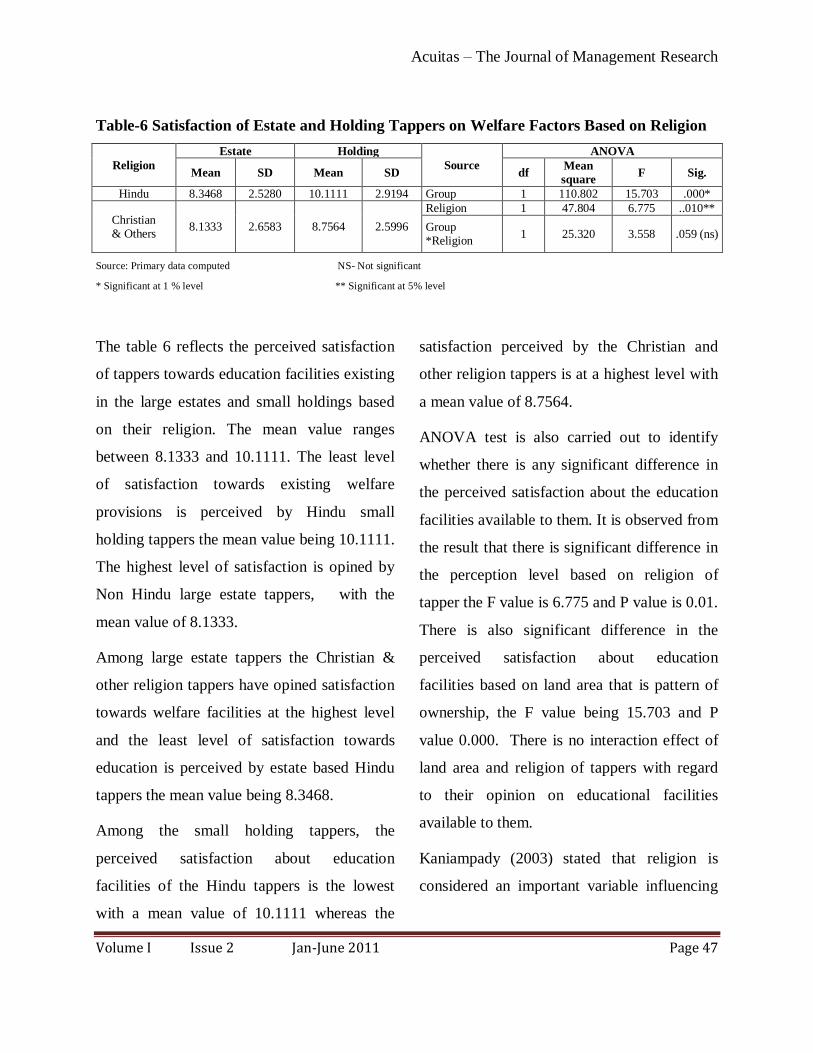
Acuitas – The Journal of Management Research
Volume I Issue 2 Jan-June 2011 Page 47
Table-6 Satisfaction of Estate and Holding Tappers on Welfare Factors Based on Religion
Religion
Estate Holding
Source
ANOVA
Mean SD Mean SD df Mean
square F Sig.
Hindu 8.3468 2.5280 10.1111 2.9194 Group 1 110.802 15.703 .000*
Christian & Others
8.1333 2.6583 8.7564 2.5996
Religion 1 47.804 6.775 ..010**
Group *Religion
1 25.320 3.558 .059 (ns)
Source: Primary data computed NS- Not significant
* Significant at 1 % level ** Significant at 5% level
The table 6 reflects the perceived satisfaction
of tappers towards education facilities existing
in the large estates and small holdings based
on their religion. The mean value ranges
between 8.1333 and 10.1111. The least level
of satisfaction towards existing welfare
provisions is perceived by Hindu small
holding tappers the mean value being 10.1111.
The highest level of satisfaction is opined by
Non Hindu large estate tappers, with the
mean value of 8.1333.
Among large estate tappers the Christian &
other religion tappers have opined satisfaction
towards welfare facilities at the highest level
and the least level of satisfaction towards
education is perceived by estate based Hindu
tappers the mean value being 8.3468.
Among the small holding tappers, the
perceived satisfaction about education
facilities of the Hindu tappers is the lowest
with a mean value of 10.1111 whereas the
satisfaction perceived by the Christian and
other religion tappers is at a highest level with
a mean value of 8.7564.
ANOVA test is also carried out to identify
whether there is any significant difference in
the perceived satisfaction about the education
facilities available to them. It is observed from
the result that there is significant difference in
the perception level based on religion of
tapper the F value is 6.775 and P value is 0.01.
There is also significant difference in the
perceived satisfaction about education
facilities based on land area that is pattern of
ownership, the F value being 15.703 and P
value 0.000. There is no interaction effect of
land area and religion of tappers with regard
to their opinion on educational facilities
available to them.
Kaniampady
(2003)
stated that religion is
considered an important variable influencing

Acuitas – The Journal of Management Research
Volume I Issue 2 Jan-June 2011 Page 48
the status of women working in the tea
plantation.
Among the tappers of Kanyakumari district
there is no difference on the attitude towards
children‟s education between a boy and a girl
and the emphasis is on providing education to
them to the best capability of the tappers.
From the study it is found that 29 percent of
Hindu tappers send their children to private
schools while 31 percent of Christian and
other religion tappers send their children to
private schools. Only 2.2 percent of Christian
and other religion tappers send their children
to estate school while 10.2 percent of Hindu
tappers send their children to Schools run by
estate management. While 18.2 percent of
small holding tappers send their children to
private schools 38.6 percent of estate tappers
send their children to private schools.
Satisfaction of Estate and Holding
Tappers on Welfare factors based on the
Number of Children
There are a total of four statements that
constitutes the frame work for the opinion of
the tappers with regard to welfare factors.
They include the availability of education
facilities, education stipend scheme,
education scholarship scheme and housing
subsidy scheme. A mean score of four
indicates the highest satisfaction whereas a
score of twenty indicates total
dissatisfaction.
Table-7 Satisfaction of Estate and Holding Tappers on Welfare factors based on the
Number of Children
Children
Estate Holding
Source
ANOVA
Mean SD Mean SD df Mean square F Sig.
Up to 2
8.3250 2.5077 9.6757 2.7836 Group 1 26.765 3.738 .054 (NS)
Children 1 24.310 3.395 .066 (NS)
3 & above 8.3390 2.7456 8.3571 2.7917 Group *children
1 25.364 3.542 .061 (NS)
Source: Primary data computed NS- Not significant

Acuitas – The Journal of Management Research
Volume I Issue 2 Jan-June 2011 Page 49
The table 7 reflects the perceived satisfaction
of tappers towards education facilities existing
in the estates and holdings based on number of
children. The mean value ranges between
8.3250 and 9.6757. The least level of
satisfaction towards existing welfare factors is
perceived by small holding tappers with up to
two children the mean value is 9.6751. The
highest level of satisfaction is opined by large
estate tappers with up to two children, the
mean value being 8.3250
Among estate tappers those with up to two
children have opined satisfaction towards
educational facilities at a higher level and a
lesser level of satisfaction towards education is
perceived by estate based tappers with above
two children the mean value being 8.3390.
Among the holding tappers, the perceived
satisfaction about education facilities of tappers
with up to two children is lower with a mean
value of 9.6757 whereas the satisfaction
perceived by tappers with more than two
children is at a higher level with a mean value
of 8.3571.
ANOVA test is carried out to identify whether
there is any significant difference in the
perceived satisfaction about the education
facilities available to them. It is observed from
the result that there is no significant difference
in the perception level based on the number of
children of tappers, the F value being 3.395 and
P value 0.066. There is no significant
difference in the perceived satisfaction about
education facilities based on land area (Pattern
of Ownership), the F value being 3.738 and P
value 0.054. There is no interaction effect of
land area and the number of children of tappers
with regard to their opinion on educational
facilities available to them.
The Royal Commission (1929) recommended
that education of the industrial worker should
receive special attention and that employers
should try to develop the education of their
workers children.
Bhowmik (2002) has indicated that, lack of
proper education of the children of plantation
workers is bound to affect their occupational
mobility in the future.
The awareness about education is high with the
tappers and all of them provide good education
for their children. Estate tappers with two
children are more satisfied as they can afford
more for the education of their children. As
estate tappers have allegiance to union they
submit the forms in groups and are able to get
the education stipend schemes provided by the
rubber board easily as compared to small
holding tappers. Moreover they are provided a

Acuitas – The Journal of Management Research
Volume I Issue 2 Jan-June 2011 Page 50
school fee advance by the estate management.
It is also seen in this study that while 37 % of
estate tappers send their children to private
schools only 16.7 % of holding tappers send
their children to private schools. The small
holding tappers do not have terminal benefits
and hence may look at the future earning
potential of the present day education of
children and hence are more satisfied in the
case of more than two children.
Findings of the Study
While ranking the reasons of absenteeism
based on the opinion of tappers common illness
is the most predominant reason for
absenteeism. Religious festivals, Indebtedness
and other job are the second most influencing
reason for absenteeism among tappers. Lack of
motivation alone falls in the category of third
most influencing reason. Transportation
problem and monotony are the next most
influencing reasons for absenteeism. Strained
relationship at home and drinking or gambling
habits are the next influencing reason. Loss of
personal commitment and poor inter personal
relationship with superiors or peers are least
influencing reason for absenteeism in the
opinion off tappers.
Among large estate tappers the 31 to 40 age
group tappers have opined monitory benefit
satisfaction at the highest level and the least
level of satisfaction about monitory benefits is
perceived by estate tappers of the 41 to 50 age
groups. Among the small holding tappers the
perceived satisfaction to monitory benefit of
the less than 30 age group is the lowest.
The immigrant tappers of large estates have
opined satisfaction towards work condition at
the highest level. The native small holding
tappers have opined a greatest satisfaction to
work condition compared to immigrant small
holding tappers.
Among the tappers of large estate, female
tappers have opined a higher satisfaction
towards health and hygiene and male tappers
have lesser perceived satisfaction about health
and hygiene factors.
Estate tappers with two children are more
satisfied as they can afford more for the
education of their children.
Suggestions
Monetary factors
Wage
The wages of estate tappers are being
revised once in three years. Rubber being an
item whose prices fluctuate the period of
revision can be brought to once a year which
will make the wage more realistic to rubber
prices.
Acuitas – The Journal of Management Research
Volume I Issue 2 Jan-June 2011 Page 51
The estates should pay the bonus at the
stipulated time. It is often the delayed payment
of bonus rather than the quantum that causes
dissatisfaction among tappers.
The small holding owners pay the
tappers on a per tree basis. At least in times of
high rubber prices there should be a
production linked bonus. This will motivate
the tapper to get the maximum yield.
Indebtedness has come out as a major
cause of absenteeism in small holdings. It is
found that cent percent of small holdings have
working days less than 251 days of which
thirty percent has less than 201 days and 80
percent has less than 231 days. This means
they do not get paid for more than 120 days in
a year which totals to more than three months.
This indicates the cause of indebtedness and
the relevance of other jobs. The holding
tappers should be trained in plantation related
activities like bee keeping which can provide
them an income. The holdings should also
provide them head lights which can be used to
begin the work as early as 4 a.m. in the
morning enabling them to have a suitable
other job also. It has also been observed that
rain guard protected plantations can have
tapping days as high as 320.
Health and Hygiene factors
Table 1 clearly indicates that schemes
like medical attendance scheme are not
utilized properly because of operational
inconvenience. In a district where disease like
chikungunya is prevalent, the fact that only
five tappers have availed the medical scheme
proves that though the scheme is available, it
has not reached the tappers in a proper way.
The schemes should be made tapper friendly.
The tapper needs to be authorized either by
the owner of the holding, the rubber producer
society president or the rubber board
extension officer to get the benefit of this
scheme which is in no way practical.. The
rubber board themselves can maintain a list of
registered tappers. Based on the details of
hospital visit the tappers should be able to
make their medical claim.
The estate managements should come
forward to get in touch with local voluntary
organizations to conduct free health camps in
those areas where the tappers live as a
community. This kind of preventive health
care is a necessity for workers living in
isolated locations.
Working Conditions
Tapping Task
The increase in tapping task can be
achieved by introducing more collection
Acuitas – The Journal of Management Research
Volume I Issue 2 Jan-June 2011 Page 52
points and assisted collection. Under the
system of assisted collection the responsibility
of carrying latex to the weighing shed is
entrusted to another person or a vehicle is
provided by the estate for the purpose. As a
result the tapper gets more time to tap a few
more trees. Tapping is a skilled job whereas
carrying the latex is an unskilled job. By
increasing the collection points within the
estate, the distance to be traveled by the tapper
for weighing the latex is reduced and therefore
he can tap some more trees in that time .
Welfare facilities
1. Education
The managements and rubber board can
come together and think of starting vocational
schools and also ITI institutes, as getting jobs
for the children of plantation workers remain a
big question mark in the minds of tappers. This
will make the workers stress free and enable
them to concentrate on their work.
2. Festival Holidays
Certain holidays which the tappers
consider as important (like the Tamil festival
Pongal in the particular year of the study) do
not come under the Festival Holiday list. Hence
a one or two day restricted holiday can be
considered which the tapper can utilize as a
holiday for a festival of their choice. This will
reduce tapper absenteeism related to festivals.
3. Motivation
The estate management can select the
best tapping block every month and provide the
tapper responsible for that block a cash
incentive. This not only motivates the tapper
but instills a sense of responsibility among
tappers and in the long improves the quality of
tree as well as tapping. This is the other way
round of the present system where in certain
estates the managers go round the estates daily
and in case of erratic tapping the tappers get
punished. The rubber board can also conduct
and provide cash incentives to holding tappers
associated with best maintained blocks selected
by rubber board officials at least among those
plantations where planting subsidy has been
given. This will motivate the tappers and may
also encourage youngsters to look upon tapping
as a profession. This will also give an idea
tothe board how the plantations for which
subsidy has been provided, are maintained.
4. Women in plantation
Family labour is at the moment
available in rubber estates where the tappers
are exclusively Sri Lankan repatriates. If bus
provisions are provided and if assisted
collection is also introduced more women can
Acuitas – The Journal of Management Research
Volume I Issue 2 Jan-June 2011 Page 53
be attracted to the job. This will solve the
problem of tapper shortage which might
become a reality as the tapper age is slanting
upwards. This will also improve the family
income of tappers.
Conclusion
The rubber tree contributes to absorbing
Carbon dioxide from the atmosphere. The
average rate of photosynthetic carbon fixation
is about 1150 gm/m2/yr. An area of 10 million
hectares under rubber, worldwide would fix
about 115 million tonnes of carbon annually
which is substantial. This much amount of
plantation produces approximately 7 million
tonnes of natural rubber. It can be well
understood that the amount of carbon removed
from atmosphere by natural rubber plants to
make 7 million tonnes of natural rubber to the
amount of carbon emitted into the atmosphere
by synthetic rubber factories to produce an
equivalent quantity of synthetic rubber. Hence
natural rubber contributes so much to the
environment compared to synthetic rubber.
Justus (Sept. 2007) states that the labour force
is a major plantation asset and if they are to be
kept at an optimum productive level the
management certainly needs to take interest in
their life at home, life in the community and
their relationship at the place of work. The soul
of the rubber plantation is both the tree and the
tapper and both should be well guarded if India
is to come out as a big player in the natural
rubber arena.
Bibliography
National Commission on Labour. Report of the Royal Commission on Labour in India. New Delhi: Government of
India, 1929.
Bhadra, Mita. Women Workers of Tea Plantations in India. New Delhi: Heritage Publishers, 1992.
Bhowmik, Sharit, Virginius Xaxa, and M.A. Kalam. Tea Plantation Labour in India. New Delhi: Friedrich Ebert
Stiftung, 1996
Bhowmik K Sharit. “Productivity and Labour Standards in Tea Plantation Sector in India.” Role of social dialogue.
Ed. Sivananthiran A and CS. Venkataratnam. ILO, 2002.
International Labour Organization. Plantation Workers - Conditions of Work and Standard of Living. Geneva: International Labour Office, 1965.
Justus, Frank Sunil T, and M Ramesh. “Rubber Plantation Workers Management and Legislations – An Indian
Management Perspective.” M-Infiniti. 2.1 Sep. 2007.
---. “Employee Engagement Towards Retention – Insights from the Real World.” HRM Review. Mar. 2009.
Kaniampady, Elizabeth F.M.A. Status of Women Working in the Tea Plantations. New Delhi: Akansha Publishing
House, 2003.
Krishnakumar. A.K. “Participatory Approaches in Rubber Development Programmes – A Review.”
Indian/International Rubber Journal. 7.46 Jul.-Aug. 2004.
National Commission on Labour. Report of the Royal Commission on Labour in India. New Delhi: Government of
India, 1929.
Public Relations Department. Plantations in Indian Economy. Coonoor: The United Planters Association of South
India, 1998.
Acuitas – The Journal of Management Research
Volume I Issue 2 Jan-June 2011 Page 54
Pothen, Jacob, Toms Joseph and KT George. “Plantation Management.” Natural Rubber: Agro Management and
Crop Processing. Ed. PJ George and C Kuruvilla Jacob. Kottayam: Rubber Research Institute of India,
2000.
Rege, D.V. “Report on an Enquiry in to Conditions of Labour in Plantations in India.” Labour Investigation Committee. Government of India, New Delhi: Manager of Publications, 1946.
Sajhau, Jean Paul and Jurgenvon Murall. Plantation and Plantation Workers. Geneva: ILO, 1987.
"When all think alike, then no one is thinking." ~ Walter Lippman
Author Details:
Frank Sunil Justus .T, Lecturer, Dept. of Business Administration, Annamalai University,
Annamalai Nagar – 608 002 Tamil Nadu
Mobile: (+91) 98426 61753, Email: [email protected]
Acuitas – The Journal of Management Research
Volume I Issue 2 Jan-June 2011 Page 55
INNOVATIVE HRM STRATEGIES-A DEVICE TO OPTIMIZE BOTTOM-
LINE
* Sarwath Khizrana
Abstract:
This paper ponders upon some strategies that hurt innovation. In addition, based on some of
the cases of past recession-hit companies, it also identifies some practical and widely
applicable strategies of HRM function that companies can tag on to overcome these barriers
and stop innovation halting. Many of the companies today dangle their innovation efforts
until the worst of the hurricane blows over. And by the time the economy recovers, they may
loose the precious opportunities to competitors .They will face daunting challenges and
turmoil‟s if they don‟t find creative ways to keep their innovation process initiatives moving
during the darkest days of the downturn.
Key words: Innovation, Team work, and performance culture
*****************************************************************************
Introduction:
“Reinvent yourself.” it‟s a card that
sometimes gets played during tough economic
times.
In the current economic climate, particularly
investing long term in ideas that might drop, or
not produce profitable return immediately is
devastating. Remaining fanatical to innovation
despite short-range market conditions is
undoubtedly not always effortless, but has been
a proven success feature behind many of
leading businesses today. There is significant
business value to gain using innovation as a
powerful tool for bottom line optimization.
There are often many cultural and
organizational issues that can cause unseen
barriers and prevent the necessary changes in
innovation focus.
Vaitheeswaran (2007) provides an excellent
example of how new processes led to wealth
creation in his description of the birth of the oil
industry. While the idea of drilling for minerals
was nothing new, in fact, the ancient Chinese
Acuitas – The Journal of Management Research
Volume I Issue 2 Jan-June 2011 Page 56
are known to have used drilling to extract salt
deposits, nobody thought of drilling for oil
until a certain Colonel Drake drilled a hole in
the ground in Pennsylvania in 1859. He struck
“black gold” creating a new industry and
ultimately, inventing the world as we know it
today. The planet would be facing
environmental problems if Drake had just left
the oil where it was, so that troubles actually
served as a trigger for new and exciting
innovations in the way we power our
industries. The same is during the times of
recession. Innovation and creativity are
generally considered to be critical
competencies for improving organizational
staying power (e.g. Amabile, 1988; Kanter,
1983; Tushman and O'Reilly, 1997;
Utterback, 1994; Woodman et al.,
1993).Innovation is the driver of performance,
growth and stock market valuation.
Companies must understand that innovation is
the core drivers of their value propositions. In
order to protect and expand revenue in a tough
economic climate, it is essential to deliver a
strong and well-differentiated value
proposition.
As the economy is slowing down. The sprawl
is enchanting a charge on businesses.
According to a recent national survey, 83
percent of CEOs believe, the economy is either
going to stay the same or decline over the next
12 months. (Lee Froschheiser, 2008).
Here the question arises, in these
challenging and turbulent times how can
today’s business leaders navigate the rough
tides? How to maintain the productivity by
bringing innovative HR practices?
From the last recession, it is realized that
Productivity comes from innovation.
Innovation comes from investment and
change.In the past, during hard economic
times; companies have focused on
implementing recession-proof strategies.
Winners always emerge out of recessions and
they usually beat their competitors on the basis
of something new.
Apple worked on iTunes, iPod and its retail
stores during the last recession and came out
swinging (Bruce Nussbaum, 2008)
The process of innovation in an organization is
a mostly positive process. HRM takes into
account consistency in flow of ideas, creativity,
Rousing leadership, authorised workers, and
creativity. Shooting down new ideas only hurts
the process, because it blocks the way to
getting to the right idea. In the last recession
Acuitas – The Journal of Management Research
Volume I Issue 2 Jan-June 2011 Page 57
about 800 companies went out of business that
had no business model and relevant HRM
innovative strategies (Tom Foremski.2009)
The companies are in a whirl ,sweating to save
the business .every day a new idea ,a new
strategy come into place to save the business
out of the meetings and discussions that are
taking place in thousand board room since the
recession wave have spread.. There are certain
strategies that may look immediately obliging
but will not reap benefits in a long run .they are
the strategies that hurt the business innovation.
HR Strategies that hurt innovation
Sacking the Talent
Companies are disregarding the magnitude of
talent It is the single most important variable in
innovation Companies consider that talent is
the quick way of cutting cost .So there is a roar
everywhere of cutting down the most valuable
assets of the Organizations.
This strategy of sacking the talent hurts the
innovation which was also experienced by a
past recession hit paper manufacturing
company in 1990‟s.A paper products
manufacturer had invested a large capital sum
to build a new state-of-the-art, automated
warehouse. The prime reason for this
innovative large capital investment was to
lower costs by reducing the number of
warehouse employees the reality proved to be
very different. Profits for the company actually
fell this led to a noticeable reduction in quality
of customer order fulfillment, resulting in a
loss of market share. Clearly, the paper
company‟s original investment strategy
backfired. This case proves that employees are
the greatest asset to any organization and are
the key to innovation.
Increasing pressure on talent by Slashing
Technology Costs.
Companies are already curbing investments in
technology to save money and putting more
pressure on people to achieve goals. This can
hamper the overall productivity.
Companies chopped its first-quarter earnings as
the slowdown in office equipment spending
badly hurt revenue and thwarted its cost-cutting
efforts. Ultimately the talent becomes unused.
For example In case of Xerox, the world's top
supplier of digital printer and document
management services, fell 20 percent after its
outlook made clear the toll that falling sales of
equipment and printer-based supplies is taking
on the company.
Acuitas – The Journal of Management Research
Volume I Issue 2 Jan-June 2011 Page 58
The companies who sustains are the ones who
made investments in technology and help
people to innovate continuously.
In the past recession, Apple survived because it
continued to invest. Steve Jobs hadn‟t reduced
research and development spending when
others in the industry had experienced a slow
down.
Sacking jobs by Stopping producing the
new product..
Saving money often means cutting back on
new products and services during an economic
downturn. This hurts companies when growth
returns and they have fewer offerings in the
marketplace to attract consumers. The
innovation that a human capital brings in no
longer can be a source for company‟s growth
and survival.
The company that constantly motivated and
retains talent for innovation in tough times with
new product development survives.
For Example, Unilever took advantage of this
when it launched a value washing
Detergent, surf during a recession. The result
was a 13% market share .Uniliver considers,
the most rewarding strategy is to innovate. It is
more important to innovate through a
recession, Apple is one of the only two
companies making money in the PC., Apple
also has a history of downsizing and
restructuring, but it has also chosen to innovate
through recession. Through innovation, Apple
has not only kept its pipeline robust, but – more
importantly – it has remained in front of its
customers. Apple always has a story to tell.
And it tells that story through new products.
New products are not only required to remain
relevant, they are signs of hope to Employees
Replacing the growth oriented leader by
cost cutter:
Sudden declines in revenues and profits often
lead boards to search for leaders and managers
with experience in pinching pennies. But
Penny-pinching CEOs don‟t have the skills to
grow, when growth returns.
Taking a broad perspective on recession there
are a variety of strategies that contribute to the
bottom line and help companies navigate
through recessions. But then it is the role of the
growth oriented high performing CEO‟s and
Managers to approach strategy from a broader
perspective, using alternatives beyond cost-
cutting and lay-offs. They should focus
resources on the longer-term mission and
Acuitas – The Journal of Management Research
Volume I Issue 2 Jan-June 2011 Page 59
success of the company. As recessions do not
last forever, it will be prudent to set up
innovative playbooks in advance for navigating
back to growth.
Stop rewarding the employees.
To save money and cut costs, managers change
the performance metrics .they stop rewarding
employees .In fact the employees should be
rewarded more for riskier new projects toward
sustaining safer older goals through innovation
in recession. Once the Risk-averse behavior
begins, it is hard to change.
Cutting back on outside consultancies
This is seen as a quick way to save money. But
it will hurt the company‟s competitive position
.Consultants can bring in outside innovation.
They know what companies across a broad
range of industries around the world are doing
to promote change.
Hack training Cost
The easiest way companies consider to save
money in short run is cutting on training and
executive development expenditures. But it
creates huge gaps in company capabilities and
bench depth. Past recession hit companies
faced such challenges when by not investing on
people during bad times and then find that they
don't have the talent to staff growth projects
when things turn around.
Cost-cuts of this nature usually have
unanticipated side-effects. They result in a loss
of morale in staff that can see the potential
margin. Implications but can do nothing about
it. They act to dampen innovation and
initiative.
All such strategies may have devastating
impact .Companies along with cutting on the
most valuable slices, can plan for new
innovative ideas for future and ways of
retaining it.
Strategies that supports innovation –The
Experiences of past recession hit companies.
Fortunately, many leading companies are still
very focused on innovation as a driver of
enriching company‟s value. This was
highlighted by the recent Aberdeen survey
titled “Product Innovation Agenda 2010:
Profiting from Innovation Today and
Tomorrow,” and is a big reason Invention
Machine's clients invest in products to help
drive their sustainable innovation initiatives
Acuitas – The Journal of Management Research
Volume I Issue 2 Jan-June 2011 Page 60
Even in the past recession, the companies that
focused on HR strategies for innovation drivers
survived the down turn successful.
Case of Colgate palmolive
Colgate-Palmolive achieved consistent
increases to their global revenues and profits in
prior downturns. This was done through
relevant and powerful HR management
innovative practices of innovative product
launches and increased advertising spending to
support their product sales, complemented by
improved acquisitions, divestitures, and
efficiency.
Colgate-Palmolive's unwavering
commitment to investing in product
development and growing both revenue and
profitability enabled it to outperform peers
with similar products in both the recessions.
In 1991, Colgate acquired the Murphy-Phoenix
company, bringing a unique product to its
portfolio that increase revenues and had
significant international potential (PR
Newswire, 1991). In 1992, it launched the
Stand-Up tube and positioned it as a cleaner,
environmentally friendly alternative to tubes
and pumps (Deveny, 1992). In the first quarter
of 2000, Colgate launched Total Fresh Stripe,
which strengthened its leading position in
toothpaste. The introduction of Speed Stick
clear antiperspirant and Palmolive Spring
Sensations dishwashing liquid also increased
market share during 2000While introducing
new product variations, Colgate also improved
its margins by consolidating manufacturing and
distribution, investing heavily to automate old
plants and getting rid of unrelated businesses
(Morgenson, 1991).
A second example of a successful business
launching new products during a recession is
Gillette’s introduction in 1990 of its Gillette
Sensor brand of shaving products. Since the
initial marketing of Gillette Sensor products,
more than 8 billion Sensor razor blade
cartridges and 400 million Sensor razors have
been sold. By 1997, a record 49 percent of
Gillette‟s sales came from new products
introduced in the previous five years. In the
same year, Gillette‟s annual R&D spending
had reached $212 million.
Taking a broad perspective on recession as
these brief examples illustrate, there are a
variety of innovative strategies that
Acuitas – The Journal of Management Research
Volume I Issue 2 Jan-June 2011 Page 61
contribute to the bottom line and help
companies navigate through recessions.
As the economic recession expands, many
companies are rethinking their strategies to
ensure that they will remain strong and vital.
Shortsighted attempts to improve bottom line
results at the expense of innovation and
product development by proper alignment of
HRM function will deliver more and deeper
harm to the organization that greatly outweighs
the short term benefits perceived. Pondering on
it some companies have come up with new
slogans like Toyota: Train idle workers to
improve quality and productivity, rather than
laying them off., Google: Freeze hiring and
curtail expansion to ride out the storm, GM:
Acquire your competitor to solidify your
position as number one.
Engaging the entire organization and
challenging people internally to come up with
ways in which the company can continue to
innovate. And then, appropriately rewarding
the people for their actions. This will also help
foster the all important positive attitude so that
the companies don‟t lose essential people
during a downturn.
Protect know-how
It is very important role for a HR function of a
company to protect the know-how in the
organization. As the recession poses challenges
of cutting the employees ,the manager has to
expect some level of fluctuations and build
enough strategies for smooth transition .New
innovative strategies like Process flow charts,
rotation of employees and shared responsibility
can keep up the company in safeguarding
certain know how‟s.
Necessity is the mother of invention
Innovation thrives when it has no other choice.
In this way, innovation is the most basic and
primal of human experiences.During tight
times, the employees could spend on coming
up with ways to innovate by focusing on what
ifs.
For example: Birth of Nescafe, world‟s first
instant coffee which was also a “Depression
era baby”. In 1930‟s when the Brazilian
Coffee Institute was sitting on a huge surplus
of coffee beans it implemented an innovative
Thinking, without scaking employees or
cutting costs. That a new product could help
increase consumption, a coffee that was soluble
in hot water is developed thereafter, and it
Acuitas – The Journal of Management Research
Volume I Issue 2 Jan-June 2011 Page 62
became a staple beverage of consumers
through the world most.
This kind of innovation could be done
efficiently by HRM function aligning and
cultivating good relationships with
stakeholders, to be more innovative in terms of
the products and services By listening to their
needs and ideas, it helps to strengthen the key
relationships that will help to pull people
through a difficult time when they could go
elsewhere because of cost pressures. In tough
times there's often an impulse in managers to
send everyone out searching under rocks for
new customers or verticals. This runs counter
to reality in a recession, it costs exponentially
more to lure a new customer than keep an
existing one.
Maintain high performance culture
The companies with the high performance
culture have the advantage in the recession. As
the employees in the high performance culture
organization are used to compete among them,
they can compete with the recession and it is
much easier to make them motivated for such a
fight. They will have challenging goals rather
than clearly defined goals.
Motivate and reinforce Team work
In the recessionary environment, employees
should discuss and share what everyone is
worrying about. They should unify to
overcome certain obstacles Company culture
needs to be fearless that it can weather
moderate recessions.
For Example. In 1993 Volkswagen, under
extreme economic pressure, was made rapid
progress on raising productivity and quality by
better teamwork in manufacturing: but all its
other functions remained resolutely immobile.(
Robert Heller on Sat, 2006)
Diversify and ramp-up research
Instead of investing more resources and longer
development timelines in a limited number of
“best” ideas brainstorming how to get more of
the ideas to market faster is beneficial Revisit
the good ideas files, and look from the
perspective of the leaner times to come.
Diversifying portfolio of products or services is
a tried and true method for managing risk.
Conclusion:
Looking at various experiences of various
companies that survived past recession‟s
Acuitas – The Journal of Management Research
Volume I Issue 2 Jan-June 2011 Page 63
Innovative HR practices proves to be the real
key to success. Recession is considered to be a
blessing in disguise for innovation .All HR
functions of companies have to make use of the
hidden facilitating factors in order to innovate
.In the recession times thee war for the talents
is less ,Many companies have the recruitment
freeze and the employees are less attracted in
the change of the employer. The fluctuation is
calmer as the employees want to have a bit of
stability in their lives. The talent have a chance
to get to attractive projects as the cost cutting
projects are valued and need the best talents
that innovates The company has to focus on its
internal costs, structure and the processes. It is
a big chance for the HRM Function to
implement innovative policies, procedures it is
important to keep talent, but it is more
important to shed the traits that bog a company
down, all that strategies that hurts innovation.
Most companies today will struggle just
accepting and acting on being the transparent
organization they need to be, but those that can
do it will find organizational renewal,
innovation, growth and profits as solid by
products.
Innovation is essentially setting up a culture
that encourages out of the box thinking,
openness, challenging status quo, spotting
opportunities and moving fast to seizing
opportunities. Its all for good and bad times
.Over all innovative HRM strategies might
serve better during a recession and help adjust
to changes in bold step and would protect
product / service value from being
commoditize.
References
Tushman, M. and O‟Reilly, C.A. III (1997), Winning Through Innovation: A Practical Guide to Leading
Organizational Change and Renewal, Harvard Business School Press, Boston,
MA.Utterback, J.M. (1994), Mastering the Dynamics of Innovation, Harvard Business School
Press,Boston,
O‟Reilly, C.A., Chatman, J. and Caldwell, D.F. (1991), “People and organizational culture: a profile
comparison approach to assessing person-organization fit”, Academy of Management Journal, Vol. 34 No.
3, pp. 487-516.
Kanter, R.M. (1983), The Change Masters: Innovation and Entrepreneurship in the American Corporation,
Simon & Schuster, New York, NY.
Jana, R. (2007), "Inside innovation: putting the i into HP", Business Week, ISSN 0007-7135, No.4060,
pp.11-16.
Singleton, S., Bester, D. (2007), "The innovation imperative", Admap, ISSN 0001-8295, Vol. 42 No.488,
pp.36-9.
Vaitheeswaran, V. (2007), "Something new under the sun", The Economist, ISSN 0013-0613, Vol. 385
No.8550, pp.3-17.
Acuitas – The Journal of Management Research
Volume I Issue 2 Jan-June 2011 Page 64
Innovation is more than just a good idea: creative thinking and strategic leadership,Strategic Direction
journal,28 (8),2008
Trudy.C.DiLiello,Jeffery .D.Houghton,(2006)Maximising organizational leadership capacity for
future:Toward a model of self leadership,innovation and creativity,Journal of managerial psycology,21(4).
Deveny, K. (1992), "Toothpaste makers tout new packaging", The Wall Street Journal, No.November 10.
Morgenson, G. (1991), "Is efficiency enough?", Forbes, No.March 18, .
PR Newswire (1991), "Colgate to acquire Murphy oil soap", No.July 2, .
http://www.mapconsulting.com/articles1-
159/RecessionProofYourLeadershipSevenStrategiestoLeadThroughtheEconomicSlowdown
Bruce Nussbaum,””Worst Innovation Mistakes In a Recession “
http://www.bluelarix.com/backgrounds/articles/worst-innovation-mistakes-in-a-recession.html,
Businessweek
Tom Foremski “‟Thought Leader: A Conversation With Valley Veteran Bill Coleman About The Economy And The Business Of Disruption „Silicon valley watcher journal February 26, 2009
Robert Heller on Team Management: True leadership and teamwork
,Sat, 2006-07-08 21:18. http://www.thinkingmanagers.com/management/team-management.php
“Determine that the thing can and shall be done, and then we shall find the way.”
~Abraham Lincoln
Author Details:
Sarwath Khizrana,Researcher
MBA from 0smania University with HR& Marketing as specializations.
Presently she is working as research fellow at the centre to pursue PHD from
Osmania University on the theme: Leadership and Innovation.
Email: [email protected]