Embed Size (px)
Citation preview
1
Abstract Wall interference effects on a wind tunnel model at transonic speeds can be a significant source of measurement error. There are methods to correct the wind tunnel test results for the interference effects on the basis of wall pressure signatures. Such methods turned to be impractical to apply in the T-38 blowdown wind tunnel because of short run times. On the other hand, the settings of the variable porosity test-section walls of the T-38 were optimized to minimize the interference effects and, besides, those effects were expected to be small for the typical missile-like models usually tested in this wind tunnel. The magnitude of interference was ascertained through tests of an AGARD-B standard model in two test sections and comparison with reference results of the test of a negligible-blockage AGARD-B model in another wind tunnel. It was found that the results of the tests matched the reference results to within the combined uncertainty of the two measurements, or very close to them. The residual differences could be attributed to the differences between models. It was concluded that transonic tests of typical models at moderate angles of attack in the T-38 wind tunnel were practically interference free.
1 Introduction Wall-interference effect on the flow field around a wind-tunnel model is one of the main sources of accuracy error which affect the experimental data. With the introduction of the ventilated test section in wind tunnels for high-speed subsonic and transonic testing, consi-derable improvement in diminishing the wall-interference effects was achieved, [1]. Further improvements were brought by the introduction
of the adaptive-walls techniques, but, because of the complexity of the mechanisms needed for real-time computation and manipulation of test section walls, they have not come into general use. Therefore, a correction of wind tunnel results with respect to wall interference is generally needed.
Validity of the classical wall-interference correction methods is limited to low velocities and angles of attack. Besides, such methods are based on theoretical linear models that are not sufficiently representative [2] and their accuracy is not very good, as they do not account for the physical wind tunnel characteristics. Classical correction methods were extended to ventilated test sections in transonic testing [1]-[8], but, because of the complex nature of interference, a satisfactory general analytical solution to this problem for ventilated walls is yet to be achieved (Lombardi et al. [2]).
One of the often-used methods of experi-mentally acquiring the data needed for the computation of wall interference corrections in wind tunnel tests is the measurement of the velocity distribution on the test section wall boundaries. This is usually achieved by the measurement of the pressure distribution on the walls, but, depending on the chosen correction method, may be complicated in the presence of ventilated walls by the need to also measure the velocity component orthogonal to the walls. Unfortunately, as Lombardi et al. stated [2], the wall-interference correction procedures are often difficult to use in practice because of the uncertainties in the measurements of the wall quantities and for other reasons. This proved
A STUDY OF WALL-INTERFERENCE EFFECTS IN WIND-TUNNEL TESTING OF A STANDARD MODEL
AT TRANSONIC SPEEDS
Dijana Damljanović*, Djordje Vuković*, Goran Ocokoljić*, Jovan Isaković**, Boško Rašuo***
*Military Technical Institute (VTI), Belgrade, Serbia, ** College of Applied Engineering Studies, Belgrade, Serbia, *** University of Belgrade, Serbia
Keywords: transonic speeds, wall-interference, standard model
DIJANA DAMLJANOVIĆ, DJORDJE VUKOVIĆ, GORAN OCOKOLJIĆ, JOVAN ISAKOVIĆ, BOŠKO RAŠUO
2
true in the case of the T-38 trisonic wind tunnel of the Military Technical Institute (VTI) in Belgrade, Serbia. The walls of the transonic test section of this wind tunnel are equipped with rows of orifices for measurement of pressure distribution but it was found that, because of the limited run time of this blowdown-type wind tunnel, the operation of the Scanivalve pressure scanning system for obtaining wall-interference data in 3D force-models tests would have an unacceptable impact on the productivity and cost of testing, and could be justified only in pressure-distribution and 2D tests.
The T-38 wind tunnel is used almost exclusively for testing of rockets and missiles at moderate angles of attack. As the length (and, therefore, overall size) of the models is limited by the constraints related to the geometry of the test section and the model support [9], and the majority of tested 3D models is slender and with small lifting surfaces, the expected magnitude of wall-interference effects is, contrary to 2D tests, [8], small and likely to be close to the uncertainty of measurements. Also, an optimization of wall-porosity settings on the basis of measured pressure distributions had been made during the commissioning of the wind tunnel in order to minimize the interference effects, [10]. Therefore, it was of interest to determine the validity of typical test results obtained in the T-38 wind tunnel without wall interference corrections. This was achieved by testing an AGARD-B standard model with 0.53%-blockage (as a representative of typical model shape and size for the T-38 wind tunnel) in the transonic speed range, and by comparison of results with interference-free results obtained in tests of a 0.15%-blockage AGARD-B model in another wind tunnel facility.
2 T-38 Transonic Test Section The T-38 test facility of VTI [11] is a blowdown-type pressurized wind tunnel with a 1.5 m × 1.5 m test section, Figure 1.
Mach range of the wind tunnel is 0.2 to 4, with Reynolds numbers up to 110×106 per metre. Mach number can be set and regulated to within 0.5% of the nominal value. Stagnation pressure in the test section can be maintained
between 1.1 bar and 15 bar, depending on Mach number, and regulated to within 0.3% of nominal value. In the transonic speed range, maximum stagnation pressure is about 6 bar. Run times are in the range from 6 s to 60 s, depending on Mach number and stagnation pressure (typical run time is about 20 s).
Model is supported in the test section by a tail sting mounted on a pitch-and-roll mecha-nism. The facility supports both step-by-step model movement and continuous movement of the model (sweep) during measurements.
The transonic test section is installed in tandem with the supersonic test section within the wind tunnel circuit, Figure 1. It consists of a 1.5 m × 1.5 × 4 m insert with perforated walls, enclosed in a plenum chamber connected to a blow-off system.
Fig. 1. The T-38 wind tunnel opened with transonic test section to be installed in tandem
within the circuit Mach number in the transonic range is
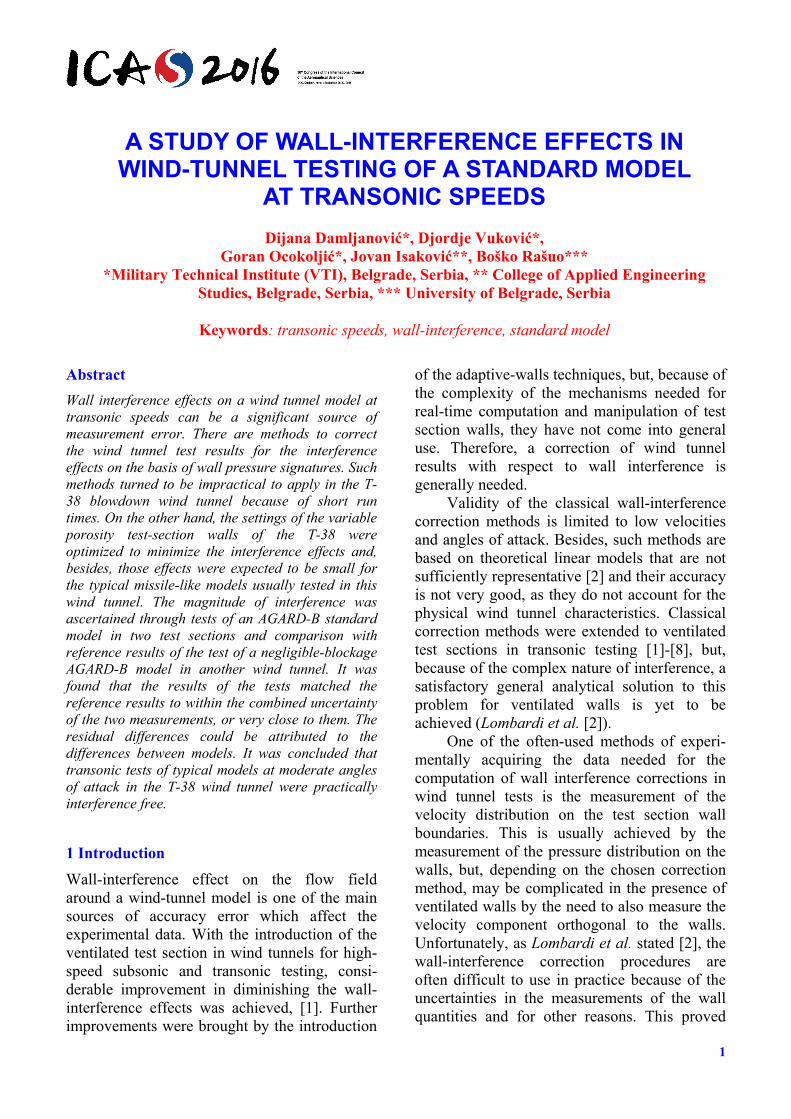
nominally set using either the second throat or the flexible nozzle contour, depending on whether the flow is to be subsonic or supersonic. Final Mach number trimming is done using a controlled-blow-off system (with ejector assist, if required) in which air reenters the circuit in the wide-angle diffuser just before the exhaust stack. Figure 2 shows a schematic of the circuit airline.
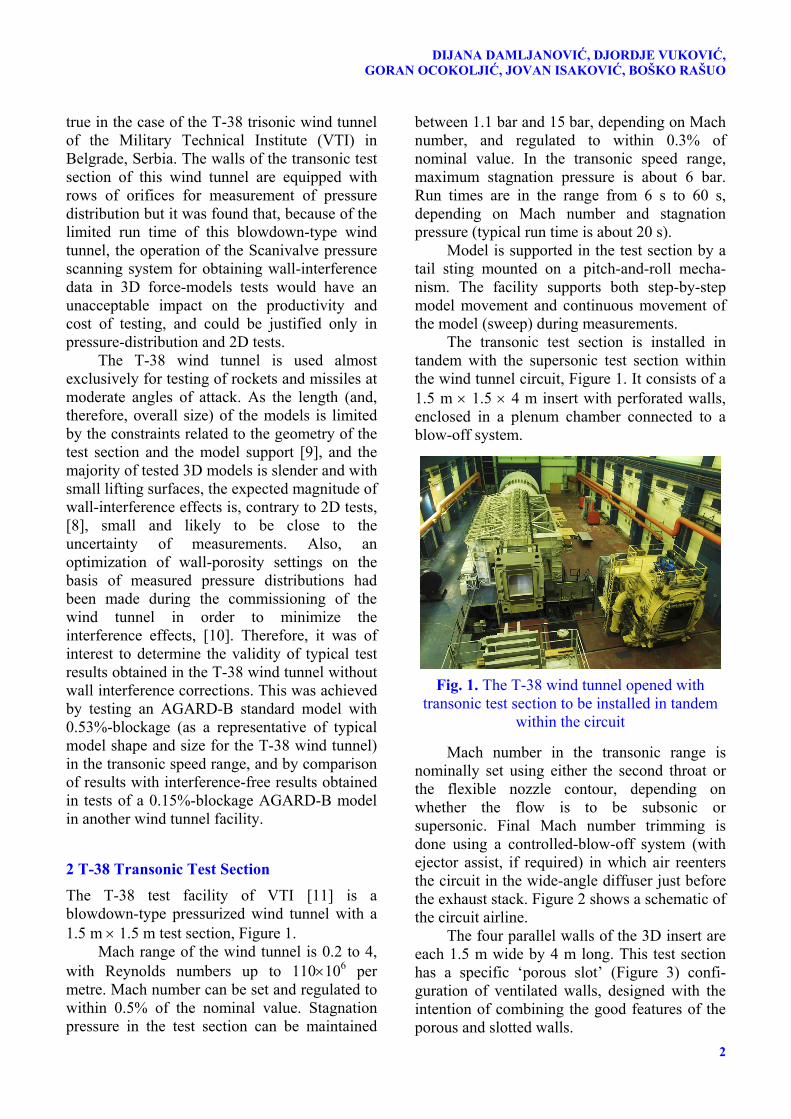
The four parallel walls of the 3D insert are each 1.5 m wide by 4 m long. This test section has a specific ‘porous slot’ (Figure 3) confi-guration of ventilated walls, designed with the intention of combining the good features of the porous and slotted walls.
3
A STUDY OF WALL-INTERFERENCE EFFECTS IN WIND-TUNNEL TESTING OF A STANDARD MODEL AT TRANSONIC SPEEDS
Fig. 2. Schematic of the T-38 wind-tunnel
Fig. 3. Schematic of the ventilated test section wall in the T-38 wind-tunnel
Each wall consists of a pair of perforated
plates with holes inclined 60° to the vertical. Porosity of the ventilated walls can be varied from 1.5% to 8% by manually sliding the wall backplates to throttle the hole openings. The hole size, the thickness of the plates and the hole patterns were determined according to recommendations of Goethert [12]. A splitter plate 2 mm thick is integral with each hole in the main wall plate and serves to reduce edgetone noise.
Figure 3 shows the hole geometry and the ’finger’ region where the porosity is gradually developed on a wall. A reference static-pressure orifice (‘ref.’ in Figure 3) located on the right sidewall wall is used for the measurement of the reference static pressure in the test section and a nearby orifice is used for control of nominal Mach number during a wind tunnel run.
3 Determination of the Optimum Porosity of the Ventilated Test-Section Walls in the T-38
The aerodynamic wall interference properties of the porous walls with inclined-holes were examined [10] during the initial fine-tuning of the T-38 wind tunnel. The degree of aerodynamic wall interference was ascertained for a range of wall porosity settings and Mach
numbers by measuring pressure distribution on a model with a typical 1% blockage and comparing it with pressure distribution measured on a geometrically similar model in a very-low-blockage (0.063%) test [13] carried out in the AEDC 16 ft wind-tunnel.
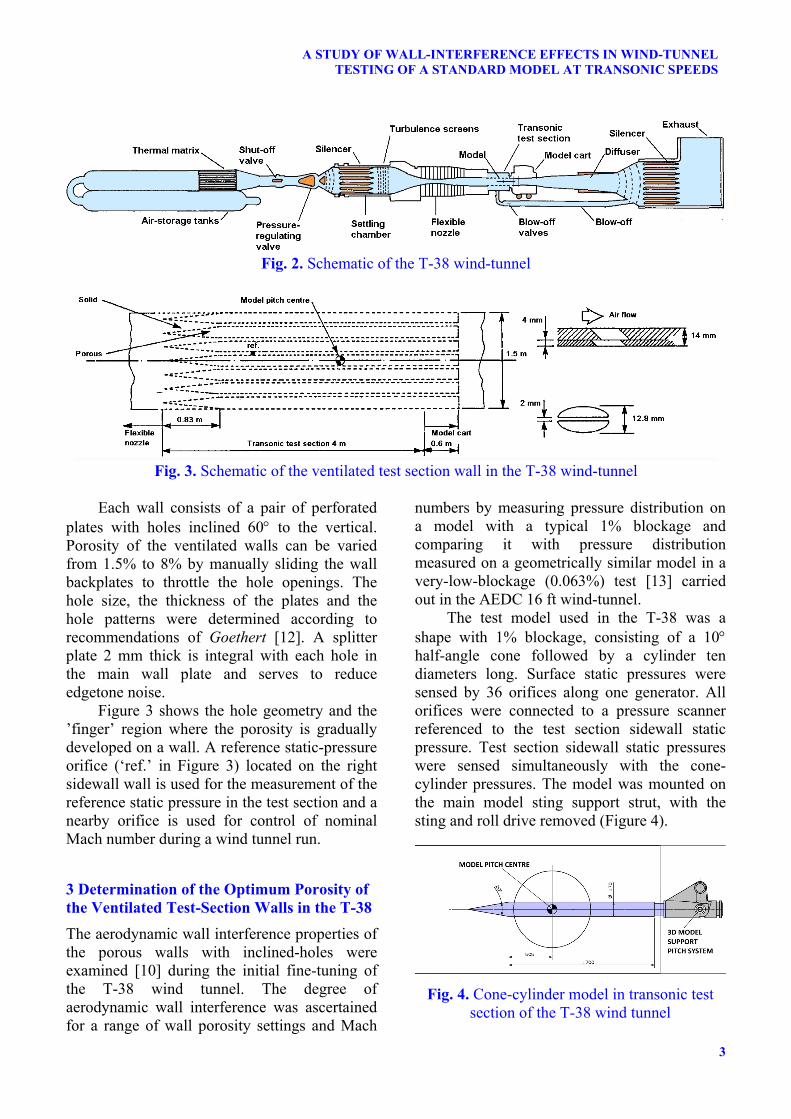
The test model used in the T-38 was a shape with 1% blockage, consisting of a 10° half-angle cone followed by a cylinder ten diameters long. Surface static pressures were sensed by 36 orifices along one generator. All orifices were connected to a pressure scanner referenced to the test section sidewall static pressure. Test section sidewall static pressures were sensed simultaneously with the cone-cylinder pressures. The model was mounted on the main model sting support strut, with the sting and roll drive removed (Figure 4).
Fig. 4. Cone-cylinder model in transonic test
section of the T-38 wind tunnel
DIJANA DAMLJANOVIĆ, DJORDJE VUKOVIĆ, GORAN OCOKOLJIĆ, JOVAN ISAKOVIĆ, BOŠKO RAŠUO
4
Tests were conducted at Mach numbers between 0.6 and 1.4. Reynolds number based on model diameter was 7.7×10⁶ at Mach 1. For all tests the model was held aligned with the flow, i.e. at zero pitch and yaw angles.
Optimum porosity of the perforated walls was determined by searching for the porosity setting that produced the longitudinal distribution of pressure on the model that was most similar to the pressure distribution measured on the reference model in the AEDC tests, which were assumed to be interference-free. Initial porosity setting was as recomme-nded for the AEDC 4ft wind tunnel [14]. Additional criterion for determining optimum porosity at Mach numbers above 1 was the cancellation of the bow shock waves reflected from the walls.
Porosity settings which resulted in pressure signatures most similar to the interference-free AEDC reference data were selected [10] as optimum for the T-38 wind tunnel for models with up to 1% blockage and were thereafter used in all transonic 3D tests in this wind tunnel.
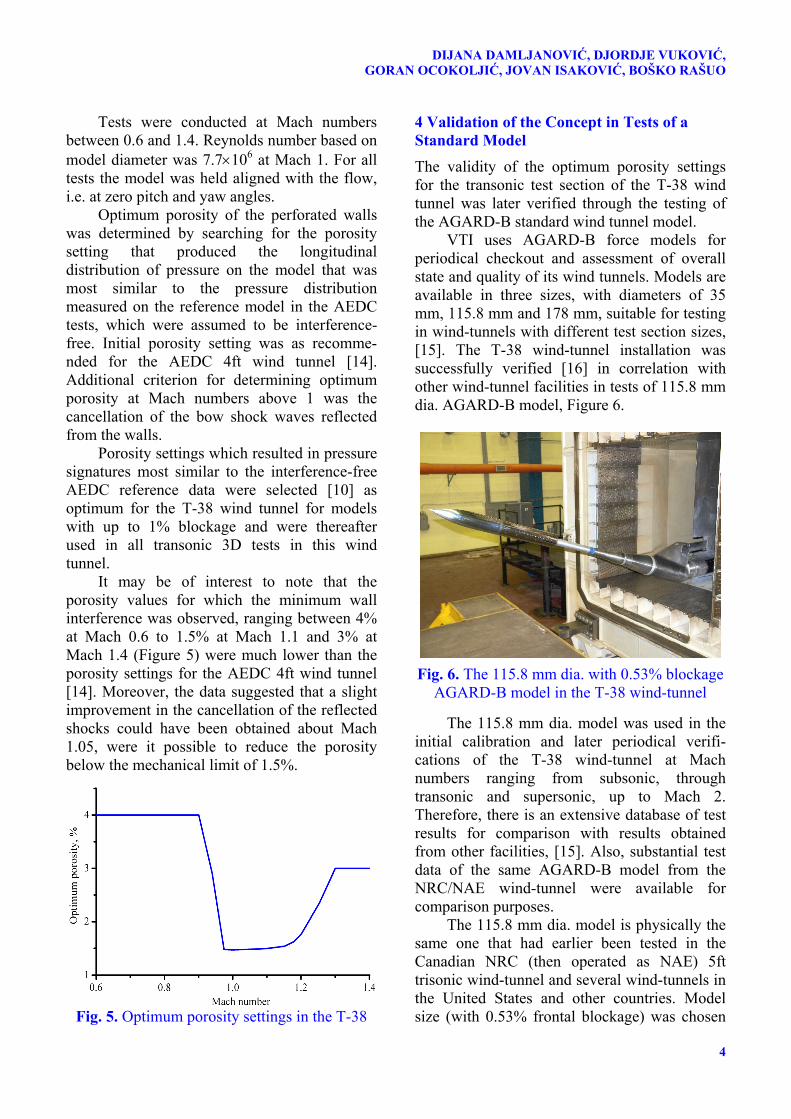
It may be of interest to note that the porosity values for which the minimum wall interference was observed, ranging between 4% at Mach 0.6 to 1.5% at Mach 1.1 and 3% at Mach 1.4 (Figure 5) were much lower than the porosity settings for the AEDC 4ft wind tunnel [14]. Moreover, the data suggested that a slight improvement in the cancellation of the reflected shocks could have been obtained about Mach 1.05, were it possible to reduce the porosity below the mechanical limit of 1.5%.
Fig. 5. Optimum porosity settings in the T-38
4 Validation of the Concept in Tests of a Standard Model The validity of the optimum porosity settings for the transonic test section of the T-38 wind tunnel was later verified through the testing of the AGARD-B standard wind tunnel model.
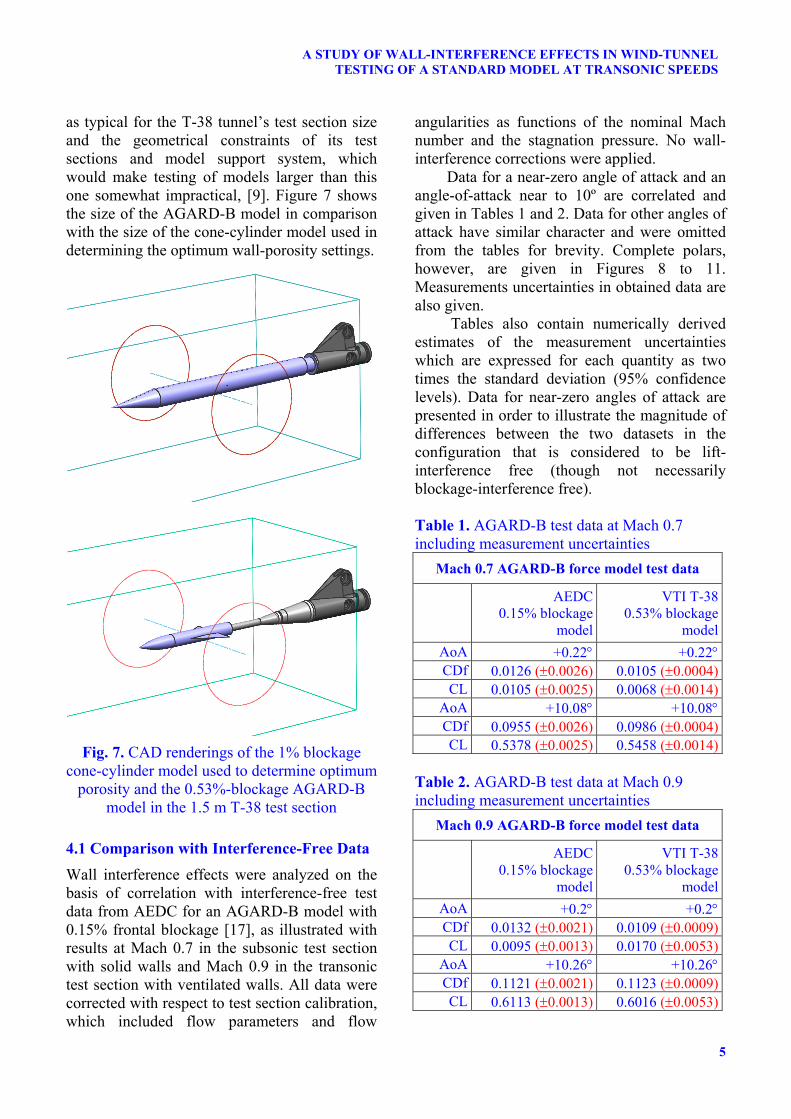
VTI uses AGARD-B force models for periodical checkout and assessment of overall state and quality of its wind tunnels. Models are available in three sizes, with diameters of 35 mm, 115.8 mm and 178 mm, suitable for testing in wind-tunnels with different test section sizes, [15]. The T-38 wind-tunnel installation was successfully verified [16] in correlation with other wind-tunnel facilities in tests of 115.8 mm dia. AGARD-B model, Figure 6.
Fig. 6. The 115.8 mm dia. with 0.53% blockage AGARD-B model in the T-38 wind-tunnel
The 115.8 mm dia. model was used in the
initial calibration and later periodical verifi-cations of the T-38 wind-tunnel at Mach numbers ranging from subsonic, through transonic and supersonic, up to Mach 2. Therefore, there is an extensive database of test results for comparison with results obtained from other facilities, [15]. Also, substantial test data of the same AGARD-B model from the NRC/NAE wind-tunnel were available for comparison purposes.
The 115.8 mm dia. model is physically the same one that had earlier been tested in the Canadian NRC (then operated as NAE) 5ft trisonic wind-tunnel and several wind-tunnels in the United States and other countries. Model size (with 0.53% frontal blockage) was chosen
5
A STUDY OF WALL-INTERFERENCE EFFECTS IN WIND-TUNNEL TESTING OF A STANDARD MODEL AT TRANSONIC SPEEDS
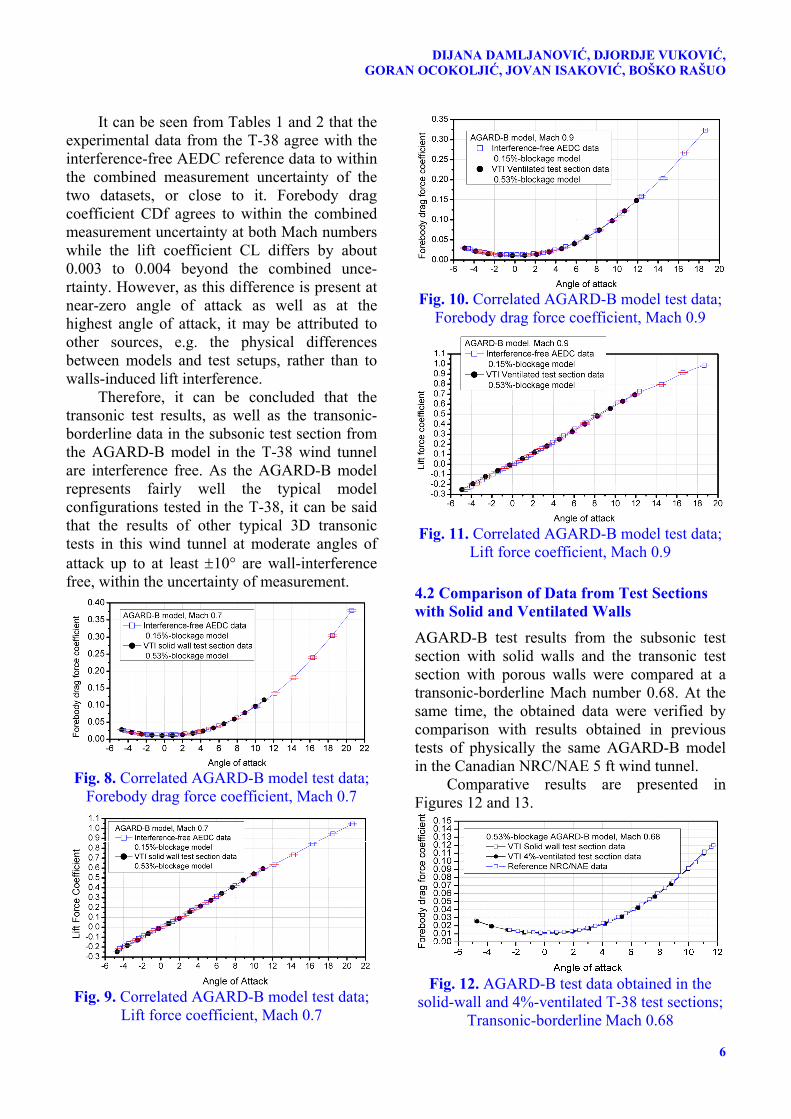
as typical for the T-38 tunnel’s test section size and the geometrical constraints of its test sections and model support system, which would make testing of models larger than this one somewhat impractical, [9]. Figure 7 shows the size of the AGARD-B model in comparison with the size of the cone-cylinder model used in determining the optimum wall-porosity settings.
Fig. 7. CAD renderings of the 1% blockage cone-cylinder model used to determine optimum
porosity and the 0.53%-blockage AGARD-B model in the 1.5 m T-38 test section
4.1 Comparison with Interference-Free Data Wall interference effects were analyzed on the basis of correlation with interference-free test data from AEDC for an AGARD-B model with 0.15% frontal blockage [17], as illustrated with results at Mach 0.7 in the subsonic test section with solid walls and Mach 0.9 in the transonic test section with ventilated walls. All data were corrected with respect to test section calibration, which included flow parameters and flow
angularities as functions of the nominal Mach number and the stagnation pressure. No wall-interference corrections were applied.
Data for a near-zero angle of attack and an angle-of-attack near to 10º are correlated and given in Tables 1 and 2. Data for other angles of attack have similar character and were omitted from the tables for brevity. Complete polars, however, are given in Figures 8 to 11. Measurements uncertainties in obtained data are also given.
Tables also contain numerically derived estimates of the measurement uncertainties which are expressed for each quantity as two times the standard deviation (95% confidence levels). Data for near-zero angles of attack are presented in order to illustrate the magnitude of differences between the two datasets in the configuration that is considered to be lift-interference free (though not necessarily blockage-interference free). Table 1. AGARD-B test data at Mach 0.7 including measurement uncertainties
Mach 0.7 AGARD-B force model test data
AEDC 0.15% blockage
model
VTI T-38 0.53% blockage
modelAoA +0.22° +0.22°CDf 0.0126 (±0.0026) 0.0105 (±0.0004)CL 0.0105 (±0.0025) 0.0068 (±0.0014)
AoA +10.08° +10.08°CDf 0.0955 (±0.0026) 0.0986 (±0.0004)CL 0.5378 (±0.0025) 0.5458 (±0.0014)
Table 2. AGARD-B test data at Mach 0.9 including measurement uncertainties
Mach 0.9 AGARD-B force model test data
AEDC 0.15% blockage
model
VTI T-38 0.53% blockage
modelAoA +0.2° +0.2°CDf 0.0132 (±0.0021) 0.0109 (±0.0009)CL 0.0095 (±0.0013) 0.0170 (±0.0053)
AoA +10.26° +10.26°CDf 0.1121 (±0.0021) 0.1123 (±0.0009)CL 0.6113 (±0.0013) 0.6016 (±0.0053)
DIJANA DAMLJANOVIĆ, DJORDJE VUKOVIĆ, GORAN OCOKOLJIĆ, JOVAN ISAKOVIĆ, BOŠKO RAŠUO
6
It can be seen from Tables 1 and 2 that the experimental data from the T-38 agree with the interference-free AEDC reference data to within the combined measurement uncertainty of the two datasets, or close to it. Forebody drag coefficient CDf agrees to within the combined measurement uncertainty at both Mach numbers while the lift coefficient CL differs by about 0.003 to 0.004 beyond the combined unce-rtainty. However, as this difference is present at near-zero angle of attack as well as at the highest angle of attack, it may be attributed to other sources, e.g. the physical differences between models and test setups, rather than to walls-induced lift interference.
Therefore, it can be concluded that the transonic test results, as well as the transonic-borderline data in the subsonic test section from the AGARD-B model in the T-38 wind tunnel are interference free. As the AGARD-B model represents fairly well the typical model configurations tested in the T-38, it can be said that the results of other typical 3D transonic tests in this wind tunnel at moderate angles of attack up to at least ±10° are wall-interference free, within the uncertainty of measurement.
Fig. 8. Correlated AGARD-B model test data;
Forebody drag force coefficient, Mach 0.7
Fig. 9. Correlated AGARD-B model test data;
Lift force coefficient, Mach 0.7
Fig. 10. Correlated AGARD-B model test data;
Forebody drag force coefficient, Mach 0.9
Fig. 11. Correlated AGARD-B model test data;
Lift force coefficient, Mach 0.9
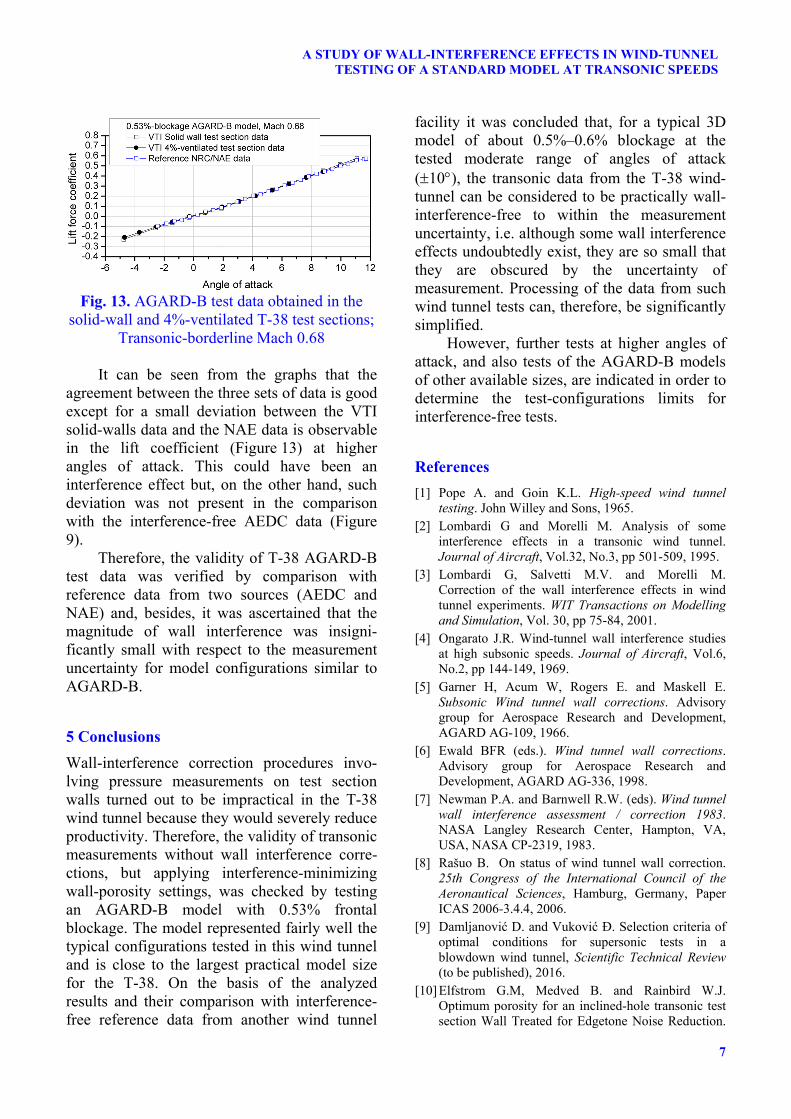
4.2 Comparison of Data from Test Sections with Solid and Ventilated Walls AGARD-B test results from the subsonic test section with solid walls and the transonic test section with porous walls were compared at a transonic-borderline Mach number 0.68. At the same time, the obtained data were verified by comparison with results obtained in previous tests of physically the same AGARD-B model in the Canadian NRC/NAE 5 ft wind tunnel.
Comparative results are presented in Figures 12 and 13.
Fig. 12. AGARD-B test data obtained in the
solid-wall and 4%-ventilated T-38 test sections; Transonic-borderline Mach 0.68
7
A STUDY OF WALL-INTERFERENCE EFFECTS IN WIND-TUNNEL TESTING OF A STANDARD MODEL AT TRANSONIC SPEEDS
Fig. 13. AGARD-B test data obtained in the
solid-wall and 4%-ventilated T-38 test sections; Transonic-borderline Mach 0.68
It can be seen from the graphs that the
agreement between the three sets of data is good except for a small deviation between the VTI solid-walls data and the NAE data is observable in the lift coefficient (Figure 13) at higher angles of attack. This could have been an interference effect but, on the other hand, such deviation was not present in the comparison with the interference-free AEDC data (Figure 9).
Therefore, the validity of T-38 AGARD-B test data was verified by comparison with reference data from two sources (AEDC and NAE) and, besides, it was ascertained that the magnitude of wall interference was insigni-ficantly small with respect to the measurement uncertainty for model configurations similar to AGARD-B.
5 Conclusions Wall-interference correction procedures invo-lving pressure measurements on test section walls turned out to be impractical in the T-38 wind tunnel because they would severely reduce productivity. Therefore, the validity of transonic measurements without wall interference corre-ctions, but applying interference-minimizing wall-porosity settings, was checked by testing an AGARD-B model with 0.53% frontal blockage. The model represented fairly well the typical configurations tested in this wind tunnel and is close to the largest practical model size for the T-38. On the basis of the analyzed results and their comparison with interference-free reference data from another wind tunnel
facility it was concluded that, for a typical 3D model of about 0.5%–0.6% blockage at the tested moderate range of angles of attack (±10°), the transonic data from the T-38 wind-tunnel can be considered to be practically wall-interference-free to within the measurement uncertainty, i.e. although some wall interference effects undoubtedly exist, they are so small that they are obscured by the uncertainty of measurement. Processing of the data from such wind tunnel tests can, therefore, be significantly simplified.
However, further tests at higher angles of attack, and also tests of the AGARD-B models of other available sizes, are indicated in order to determine the test-configurations limits for interference-free tests.
References [1] Pope A. and Goin K.L. High-speed wind tunnel
testing. John Willey and Sons, 1965. [2] Lombardi G and Morelli M. Analysis of some
interference effects in a transonic wind tunnel. Journal of Aircraft, Vol.32, No.3, pp 501-509, 1995.
[3] Lombardi G, Salvetti M.V. and Morelli M. Correction of the wall interference effects in wind tunnel experiments. WIT Transactions on Modelling and Simulation, Vol. 30, pp 75-84, 2001.
[4] Ongarato J.R. Wind-tunnel wall interference studies at high subsonic speeds. Journal of Aircraft, Vol.6, No.2, pp 144-149, 1969.
[5] Garner H, Acum W, Rogers E. and Maskell E. Subsonic Wind tunnel wall corrections. Advisory group for Aerospace Research and Development, AGARD AG-109, 1966.
[6] Ewald BFR (eds.). Wind tunnel wall corrections. Advisory group for Aerospace Research and Development, AGARD AG-336, 1998.
[7] Newman P.A. and Barnwell R.W. (eds). Wind tunnel wall interference assessment / correction 1983. NASA Langley Research Center, Hampton, VA, USA, NASA CP-2319, 1983.
[8] Rašuo B. On status of wind tunnel wall correction. 25th Congress of the International Council of the Aeronautical Sciences, Hamburg, Germany, Paper ICAS 2006-3.4.4, 2006.
[9] Damljanović D. and Vuković Đ. Selection criteria of optimal conditions for supersonic tests in a blowdown wind tunnel, Scientific Technical Review (to be published), 2016.
[10] Elfstrom G.M, Medved B. and Rainbird W.J. Optimum porosity for an inclined-hole transonic test section Wall Treated for Edgetone Noise Reduction.
DIJANA DAMLJANOVIĆ, DJORDJE VUKOVIĆ, GORAN OCOKOLJIĆ, JOVAN ISAKOVIĆ, BOŠKO RAŠUO
8
Proceedings of the 15th Aerodynamic Testing Conference, San Diego, CA, USA, Paper number AIAA-1988-2003, 1988.
[11] Elfstrom G.M. and Medved B. The Yugoslav 1.5m trisonic blowdown wind tunnel. A Collection of technical papers-14th AIAA Aerodynamic Testing Conference, West Palm Beach, US , AIAA 86-0746-CP, 1986.
[12] Goethert B.H. Transonic wind tunnel testing. Pergamon Press, New York, 1961.
[13] Hartley M.S. and Jacocks J.L. Static pressure distribution on various bodies of revolution at Mach numbers from 0.60 to 1.60. Arnold Engineering Development center, AEDC-TR-68-37, 1968.
[14] Jacocks J.L. Determination of optimum operating parameters for the AEDC PWT 4ft transonic tunnel with variable porosity test section walls. Arnold Engineerind Development Center, AEDC-TR-69-164, 1969.
[15] Damljanović D, Ocokoljić G. and Rašuo B. Standard AGARD-B wind-tunnel model testing in VTI. Proceedings of the 6th European Conference for Aeronautics and Space Sciences (EUCASS), Krakow, Poland, Paper number: 548, 2015.
[16] Damljanović D, Rašuo B. and Isaković J. T-38 wind tunnel data quality assurance based on testing of a standard model. Journal of Aircraft, Vol. 50, No. 4, pp 1141-1149, 2013.
[17] Anderson CF. An investigation of the aerodynamic characteristics of the Agard Model B for Mach numbers from 0.2 to 1.0. Arnold Engineering Development Center. AEDC-TR-70-100, 1970.
6 Contact Author Email Address mailto: [email protected]
Copyright Statement The authors confirm that they, and/or their company or organization, hold copyright on all of the original material included in this paper. The authors also confirm that they have obtained permission, from the copyright holder of any third party material included in this paper, to publish it as part of their paper. The authors confirm that they give permission, or have obtained permission from the copyright holder of this paper, for the publication and distribution of this paper as part of the ICAS proceedings or as individual off-prints from the proceedings.