Embed Size (px)
Citation preview
Department of Economics
A Study of the Relationship Between Health and Subjective Well-being in Parkinson’s Disease Patients
Patricia Cubí-Mollá1 City University London
Jane De Vries
GlaxoSmithKline PLC
Nancy Devlin
Office of Health Economics
Department of Economics
Discussion Paper Series
No. 13/12
1 Corresponding author: [email protected], Department of Economics,
City University, London Northampton Square, EC1V 0HB, UK
A Study of the Relationship Between Health and
Subjective Well-being in Parkinson’s Disease Patients
Patricia Cubí-Mollá1, Jane de Vries1,2 and Nancy Devlin1,3
1City University London 2GlaxoSmithKline PLC 3Office of Health Economics
July 2013
OHE Research Paper 13/05
Acknowledgements
The authors would like to thank Parkinson’s UK, in particular Lubna Arif-Schmitt, for granting its consent for this study, and to the members who kindly completed the
questionnaires and provided such a warm welcome at their local meetings.
We would also like to thank the EuroQol Group for permission to use the EQ-5D
instrument, and also Joanna Coast and Hareth Al-Janabi at Birmingham University, and staff at the PSSRU, Kent University for permission to use the ICECAP-A and ASCOT
instruments, respectively, although these results are not the focus of this paper.
Finally, thanks to Yan Feng and Paul Barnsley at OHE for their assistance with statistical analysis and advice on handling subjective well-being data, respectively, to Bernard van
den Berg (University of York) who assisted with initial advice; and to Martin Buxton for his detailed comments on an earlier version of this paper.
2
ABSTRACT
Objectives
In light of the apparent disconnect between traditional measures of societal well-being
such as GDP and reported levels of happiness, governments globally are turning their attention to alternative subjective measures of well-being (SWB) to aid policy decisions.
In the context of health, there is therefore growing interest in understanding how measures of health-related quality of life (HRQoL), widely used in health technology
appraisal, relates to SWB, and whether SWB could provide a sound basis for resource allocation decisions in health and other sectors in the future. This study investigates the
relationship between HRQoL, as measured by EQ-5D, and SWB in Parkinson’s disease
(PD) and the extent to which patients’ self-reported health can explain (part of) their SWB.
Methods
A paper questionnaire including EQ-5D, four key SWB questions taken from the Office for National Statistics Integrated Household Survey in England and other demographic
details was distributed to people with PD in the UK. Responses were used to estimate multiple regression models explaining SWB using each of the EQ-5D Index (UK weights),
EQ-5D dimensions and EQ-VAS and patient socio-demographic characteristics.
Results
276 questionnaires were distributed and 183 responses received. The EQ-5D Index was a moderate predictor of SWB (adjusted R2 range 0.19-0.38 in OLS models), but EQ-VAS
performed better (adjusted R2 range 0.32-0.49).
Combining EQ-VAS and EQ-5D dimensions, especially anxiety/depression and mobility,
and household status in some cases, yielded the best-fitting models (adjusted R2 range 0.40-0.52).
Conclusions
The findings imply that EQ-VAS and some dimensions of the EQ-5D, together with key
demographic data, could potentially be used to predict SWB, e.g. via mapping. However, further empirical research into the relationship between SWB and EQ-5D longitudinally,
and in different disease areas, is required to corroborate these findings, and further standardisation of SWB measures is recommended.
3
INTRODUCTION Recognition has grown that significantly increased gross domestic product (GDP), wealth and health in the Western world over the past 50 years has not increased levels of
happiness (Layard, 2005). As a result, governments across the world, including the UK government (HM Budget, 2010), and bodies such as the OECD (2011), have started to
look more closely at alternative ways of measuring the welfare of society, including various subjective measures of happiness, as a way of informing public policy decisions.
In the context of health, this has produced a growing interest in understanding how the measures of health-related quality of life (HRQoL), which are widely used to inform
decisions in health care, relate to happiness or subjective well-being (SWB), and whether
SWB could provide a sound basis for resource allocation decisions about health care in the future.
Advocates of SWB would argue that using SWB to value health improvements could in
theory address many of the limitations of measures of HRQoL and Quality Adjusted Life Years (QALYs). For example, SWB has the potential to be used more broadly as a
measure of benefit across different sectors (e.g. across health and social care services), as arguably increasing well-being should be the ultimate goal of most, if not all,
government policies whether in health or any other sector. SWB is, by definition,
subjective, and captures the individual’s own experience of their well-being. Thus, concerns about whether widely used measures of HRQoL—such as the EQ-5D—are
missing dimensions of health that are relevant to patients also is addressed, as individuals would implicitly include these in their own assessment of SWB. However, how
SWB relates to HRQoL, and particularly to the EQ-5D, has not been widely studied.
Subjective Well-being and Happiness
Although the importance of happiness in society is acknowledged as far back as the
ancient Greek philosophers, the “new science” of SWB, as Layard describes it (Layard, 2005), has emerged much more recently, over the past 40 years or so (Diener et al.,
1999). It has been expanded from the world of psychology into the realms of economic
decision theory by academics such as Nobel prize winner Daniel Kahneman.
The terms “happiness” and “subjective well-being” are often used interchangeably
(Helliwell, Layard and Sachs, 2012), although they are not identical according to most definitions. For example, happiness has been described as equivalent to life satisfaction,
quality of people’s lives (Helliwell, Layard and Sachs, 2012) or experienced utility (Dolan. 2009). On the other hand, SWB is frequently used as an umbrella term for how we feel
(“affective happiness”) and think (“evaluative happiness” or “rewardingness”) about life (Helliwell, Layard And Sachs, 2012). In this paper we view SWB as a broader concept
that encompasses both how we evaluate our lives and our level of satisfaction with life
and how worthwhile we consider it to be, as well as how we are feeling.
Measuring Subjective Well-being
Many different instruments have been developed to measure the various nuanced
definitions of SWB and associated states of positive affect. A comprehensive collection of the available instruments can be found at Helliwell, Layard and Sachs (2012), and
different guidelines providing advice on the collection and use of such instruments can be found at OECD (2013).
In the UK, subsequent to a public consultation and advice from academics, the following SWB questions on an ordinal scale of nought to ten were defined for inclusion in the
ongoing Integrated Household Survey beginning in April 2011 (ONS, 2011a):
1. Overall, how satisfied are you with your life nowadays? 2. Overall, to what extent do you feel that the things you do in your life are
worthwhile?
4
3. Overall, how happy did you feel yesterday?
4. On a scale where nought is “not at all anxious” and 10 is “completely anxious”, overall, how anxious did you feel yesterday?
Question 1 is intended to capture “evaluative happiness”. Question 2 represents the dimension of “rewardingness”. Question 3 and 4 may be the basis for the second
dimension (“affective happiness”) in terms of positive and negative affect (Helliwell, Layard And Sachs, 2012).
Subjective Well-being and Health
SWB is usually depicted as an intangible area where several factors come together, for instance income, social capital (trust in one’s community), day-to-day joys, quality of
governance and health (Helliwell, Layard And Sachs, 2012). Among the factors
influencing SWB, health obviously plays an important role. However, it is not entirely clear whether health determines SWB in the same way as (say) income, or if health
contributes to SWB more directly.
Even within the context of health, the QALY as a measure of outcome is not without
critique. For example, there is some debate in the literature about whose values should count when valuing health states to determine the appropriate quality adjustment in
QALYs (DeWit, Busschbach and de Charro, 2000; Brazier et al., 2005)—the patient’s or the public’s. EQ-5D value sets, following the conventions of cost effectiveness analysis,
have been derived from the preferences of the general public using stated preference
methods such the time trade-off (TTO).
However, such an approach does not take into account the phenomenon known as
“adaptation”, whereby individuals experiencing a health state can become adapted to it and learn to cope with impaired health over time such that it may less impact on HRQoL
than the general population valuing the state may forecast (Menzel et al., 2002). Nevertheless, attention-seeking conditions that are persistent and constant, such as
chronic severe pain or depression, cannot be adapted to and evidence suggests that these conditions may be under-valued by current valuation techniques when compared
to a SWB approach (Dolan, 2009).
The quality-adjustment in QALYs also attracts criticism due to its basis in stated preferences and decision utility, rather than experienced utility. In other words, the
choices we make based on predictions of what we think will improve our well-being do not always result in us actually experiencing greater well-being. This is partly due to a
focusing effect of asking people to state preferences, or as Schkade and Kahneman (2002) explain, “Nothing in life is quite as important as you think it is while you are
thinking about it”.
Finally, generic measures of HRQoL such as EQ-5D are sometimes criticised for not
containing all dimensions of HRQoL relevant to patients. While recent research has
shown that the EQ-5D works well as a measure of HRQoL in most health areas (Wailoo et al., 2010), it may nevertheless lack sensitivity in some disease areas.
The aim of this paper is to consider to what extent measures of health-related quality of life correlate with measures of SWB. That is, to what extent does health explain (part of)
SWB?
The population chosen for this analysis is Parkinson’s Disease (PD) patients. This patient
cohort is interesting for a number of reasons. First, no previous research explores how the UK SWB measures, used in the Integrated Household Survey (IHS) by the Office for
National Statistics (ONS) as described above, perform in this group of respondents.
Second, PD is a good example of a disease area for which the usual measures of HRQoL may fail to capture part of the wider impacts of the disease on SWB. For instance, SWB
determinants suggested by OECD (Helliwell, Layard and Sachs, 2012) as “having someone to count on in times of difficulty” or “trust in one’s community” may not be
captured by usual measures of health or utility. We will analyse the degree of correlation
5
of proxies for these determinants and SWB for PD patients, with and without controlling
for health related factors. If significant differences are found, this would be an indicator that the extent to which a disability affects subsequent well-being depends not just on
the severity of the disability, but also on other factors, and the extent to which patients are enabled in maintaining their social connections. If so, the paper would provide some
insights in the appropriateness of using HRQoL measures for health resource-allocation in the near term.
Methods
Objectives
The primary aim of this exploratory study was therefore to investigate the relationship between HRQoL (as measured by both the EQ-5D profile and patients’ overall rating of
their health on the Visual Analogue Scale or EQ-VAS) and SWB scores (on the four key ONS questions described above) in a given health condition, Parkinson’s disease.
PD is a progressive neurodegenerative disorder affecting approximately 120,000, or 1 in 500, people in the UK. PD was selected as the focus of this exploratory study because of
the broad range of symptoms and, therefore, health states experienced by people with the disease. The condition is characterized by disabling motor symptoms, including
tremor, rigidity and slowness of movement, often accompanied by non-motor symptoms
including pain, depression and anxiety, constipation and fatigue.
EQ-5D appears to work reasonably well as a measure of HRQoL in PD. Schrag, et al.
(2000) report that the EQ-5D index has good feasibility and validity in PD and that its five dimensions capture the aspects of life most affected by PD. However, there is
currently no evidence on how the UK SWB measures perform in PD patients, and thus no evidence on how EQ-5D and SWB are related on this group of respondents.
The Questionnaire
A paper questionnaire was developed for self-completion by individuals with a diagnosis of PD in the UK. The questionnaire included the following items.
1. Demographic questions (age range, sex, years since diagnosis, marital status,
employment status, household situation, education). Income data were not collected due to concerns that this might adversely impact the response rate. A tick-box
format was used for ease of completion.
2. The EQ-5D three-level instrument (EuroQol Group, 1990), including both the
patients’ self-reported health description on the five dimensions and three levels (their EQ-5D health profile), and the patient’s overall assessment of their health on a
visual analogue scale (the EQ-VAS, from 0–100, representing worst- and best-possible health respectively). The EQ-5D health profiles also can be summarised by a
single number representing the relative value of that health state on a scale
anchored at 1 (full health) and 0 (dead). The value set used for this purpose in this study is the UK value set reported by Dolan (1997).
3. The four SWB questions taken from the Integrated Household Survey, as shown in the introduction, and adapted from the verbal interviewer script into a written format
to enable self-completion.
Two versions of the questionnaire were developed, in which the order of the EQ-5D and
SWB questions were alternated to control for ordering effects.
6
Data Collection
Ethics consent for the study was obtained from the senate ethics committee of City
University London and approval was obtained from Parkinson’s UK to involve its members. Two strategies were used to contact potential participants:
1. Attendance at seven local Parkinson’s UK support group meetings and three
larger regional Parkinson’s UK forum meetings in the southeast of England where objectives of the research were presented and questions answered.
Questionnaires then were distributed to interested members
2. An email sent to the Parkinson’s UK’s on-line research network inviting interested members to request a questionnaire by post. Stamped, addressed envelopes
were provided for returns. Participants were assured that their responses would be anonymous and participation voluntary. The questionnaire took approximately
ten minutes to complete.
Analysis
Our concern is whether widely used measures of HRQoL, such as the EQ-5D, are missing dimensions of health that are relevant to patients that implicit in an individual’s own
assessment of SWB. We are interested in particular in analysing one of the SWB determinants suggested by OECD (Helliwell, Layard and Sachs, 2012), “having someone
to count on in times of difficulty”. To capture this, we use household composition as a proxy. Our hypothesis is that patients living alone will report lower SWB levels than
those living with partners or relatives, or in care homes, and that this effect is not captured by the HRQoL measures.
Index values were calculated for the EQ-5D profile data using UK general population
time-trade-off weights (Dolan, 1996). Participants’ responses were analysed using STATA 12. Initially descriptive statistics were performed on each of the independent
SWB variables and the dependent variables individually.
The SWB data collected are ordinal, i.e. ranked data, rather than cardinal in nature.
Since ordinal measures of health are one of the most commonly used indicators, a wide variety of techniques have been developed to make the responses suitable for different
regression analyses. The present study uses two different approaches1.
1. Direct assumption of the existence of a cardinal scale at the response level: the
SWB will be interpreted as a continuous value from 0 to 10 with ratio properties
(e.g. a difference between the categories 2 and 3 in a SWB measure equals the difference between the categories 4 and 5). This assumption is consistent with
the large number of categories in the SWB answers (11), and it supports the use of common parametric methods as ordinary least squares regression.
2. Projection of continuous, cardinal scales on ordinal measures: we assume the
existence of a latent, unobservable well-being variable that is distributed in a particular way across the different categories (e.g. changes in the degree of well-
being between two categories are explained in terms of changes in the values of
the latent variable). A typical example of this approach is the ordered probit/logit regression models, as can be found, for instance, in van Doorslaer and Jones
(2003).
Health measures of a general population sample usually have a skewed distribution with
the great majority of respondents reporting their health towards the high end of the scale. A similar outcome could be expected for well-being measures since (our
hypothesis is that) health is a key factor at explaining SWB. This study collects data from
1 A thorough discussion of the measurement scale of health variables can be found in Erreygers and van Ourti
(2011).
7
PD patients rather than the general population, but skewedness in the distribution of
most of the SWB variables still is apparent (see Figure 1). This suggests that SWB and EQ-5D values may better fit the assumption of a skewed distribution. To ensure that the
SWB variable (y) is skewed in the appropriate direction, we need to invert the 0-10 scale and derive a mirror-image “subjective unwell-being” variable (h, where h = 10- y) that
will more closely follow a standard log-normal distribution. A similar method has been applied to health (“ill-health”), e.g. in Cubí-Mollá and Herrero (2012).
Three regression models have been developed to analyse the explanatory power of health (using the EQ-5D profile data, the index weighted profile and EQ-VAS) for each of
the SWB questions, combined with socio-demographic variables as appropriate. For that
purpose, the interpretation of the coefficients will be the most interesting feature from our perspective. Therefore, other issues like retransformation methods for the analysis of
the expected values or issues related to truncation or censoring are ignored here.
The first model (OLS Normal) is the simple ordinary least squares (OLS) regression
where is the vector of covariates including the constant term. This model assumes
continuity in the SWB variable and the coefficients have an easy quantitative interpretation. However, the model rules out the existence of skewedness.
The second model (OLS LogNormal) consists of a modification of the first one, still assuming continuity in SWBm but now allowing for skewedness in the distribution (note
that the model is defined in terms of “subjective unwell-being”).
The third model (OPM) is an ordered probit model with well-being as a latent variable,
treating SWB as a categorical measure and assuming normal distribution of the error term, conditional to the covariates:
The results of the approaches are summarized and compared. The coefficients will be
used to investigate the relationship between HRQoL (EQ-5D and EQ-VAS) and SWB in PD.
RESULTS
Participants A total of 276 questionnaires were distributed and 183 participants responded (response
rate 66%). 106 (59%) of participants were male and 74 (41%) female, although incidence of PD is similar in men and women (Parkinson’s UK, 2011). 80% of
participants were over the age of 61, consistent with the mean age of onset of around 65. No participants under the age of 40 were recruited although 5-10% of people with
PD are diagnosed before this age. Thus, the cohort appears older than the PD population in the UK as a whole.
74% of participants were married, and 76% lived with a spouse or partner, representing relatively high levels of social support from informal carers. 47% of participants had a
recent diagnosis in the past five years, and a further 27% in the last six to ten years.
8
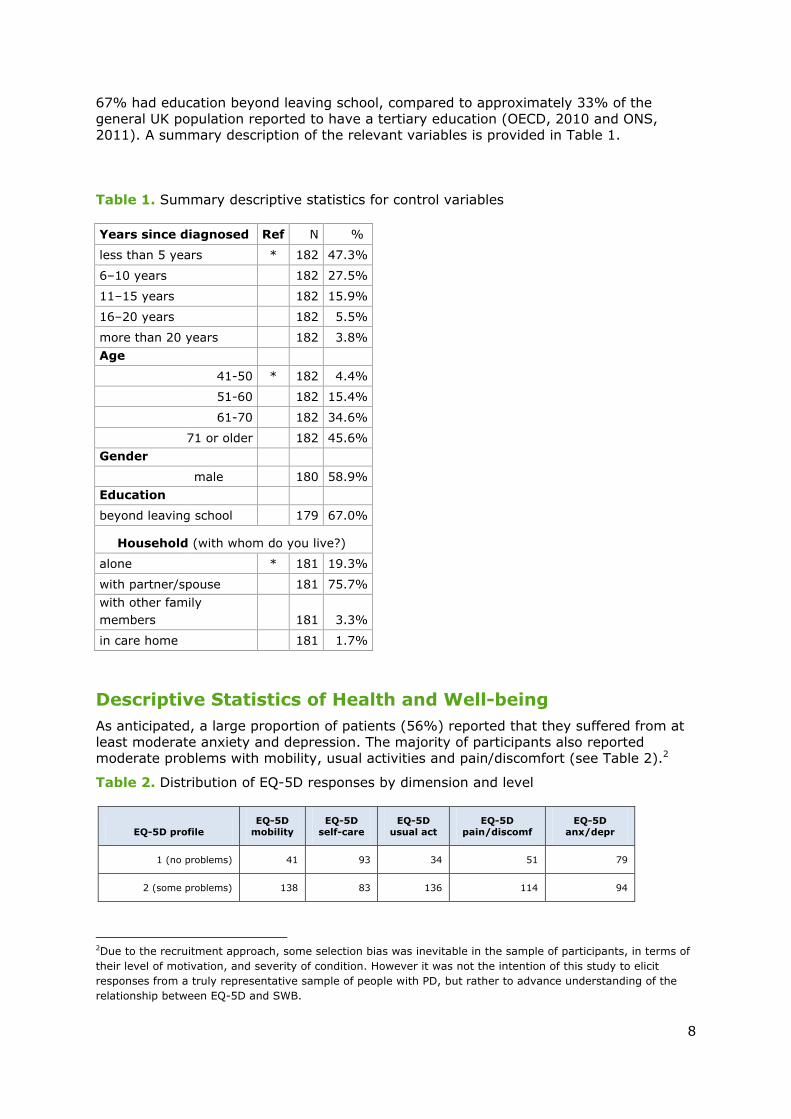
67% had education beyond leaving school, compared to approximately 33% of the
general UK population reported to have a tertiary education (OECD, 2010 and ONS, 2011). A summary description of the relevant variables is provided in Table 1.
Table 1. Summary descriptive statistics for control variables
Years since diagnosed Ref N %
less than 5 years * 182 47.3%
6–10 years 182 27.5%
11–15 years 182 15.9%
16–20 years 182 5.5%
more than 20 years 182 3.8%
Age
41-50 * 182 4.4%
51-60 182 15.4%
61-70 182 34.6%
71 or older 182 45.6%
Gender
male 180 58.9%
Education
beyond leaving school 179 67.0%
Household (with whom do you live?)
alone * 181 19.3%
with partner/spouse 181 75.7%
with other family
members 181 3.3%
in care home 181 1.7%
Descriptive Statistics of Health and Well-being
As anticipated, a large proportion of patients (56%) reported that they suffered from at
least moderate anxiety and depression. The majority of participants also reported moderate problems with mobility, usual activities and pain/discomfort (see Table 2).2
Table 2. Distribution of EQ-5D responses by dimension and level
EQ-5D profile EQ-5D
mobility EQ-5D
self-care EQ-5D
usual act EQ-5D
pain/discomf EQ-5D
anx/depr
1 (no problems) 41 93 34 51 79
2 (some problems) 138 83 136 114 94
2Due to the recruitment approach, some selection bias was inevitable in the sample of participants, in terms of
their level of motivation, and severity of condition. However it was not the intention of this study to elicit
responses from a truly representative sample of people with PD, but rather to advance understanding of the
relationship between EQ-5D and SWB.
9
3 (extreme problems) 1 5 11 16 8
Total 180 181 181 181 181
EQ-5D profile % EQ-5D
mobility EQ-5D
self-care EQ-5D
usual act EQ-5D
pain/discomf EQ-5D
anx/depr
1 (no problems) 23% 51% 19% 28% 44%
2 (some problems) 77% 46% 75% 63% 52%
3 (extreme problems) 1% 3% 6% 9% 4%
Total 100% 100% 100% 100% 100%
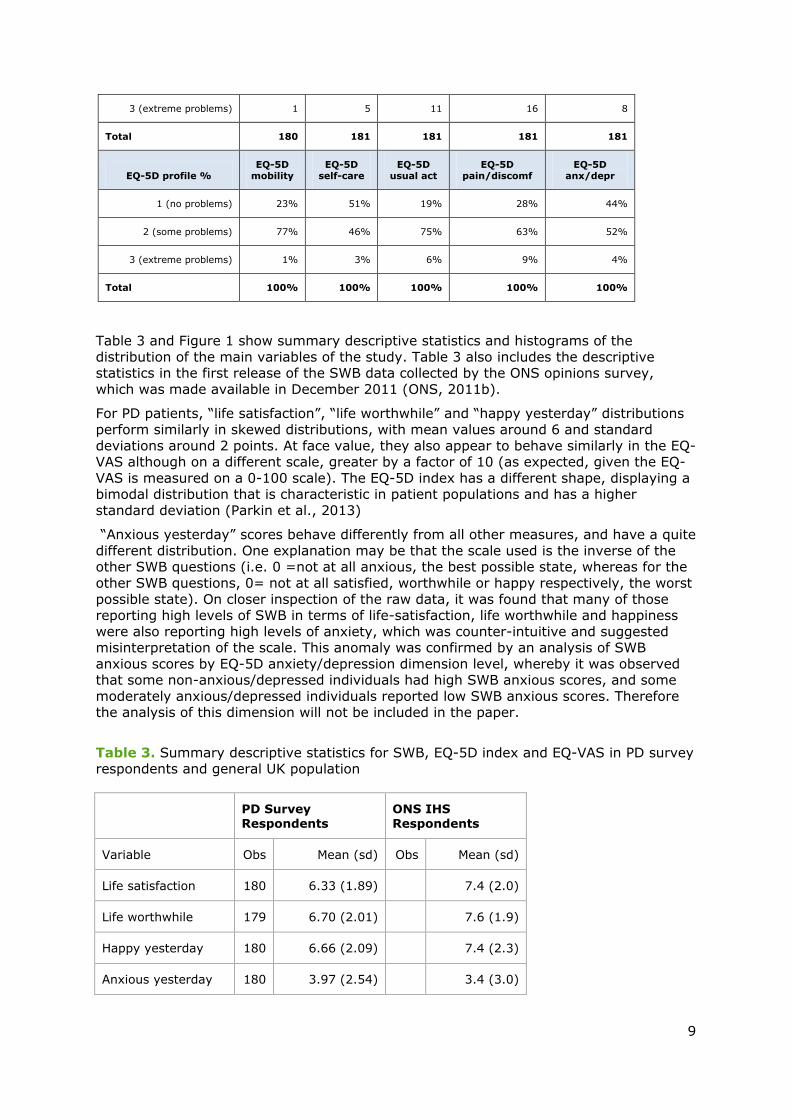
Table 3 and Figure 1 show summary descriptive statistics and histograms of the
distribution of the main variables of the study. Table 3 also includes the descriptive statistics in the first release of the SWB data collected by the ONS opinions survey,
which was made available in December 2011 (ONS, 2011b).
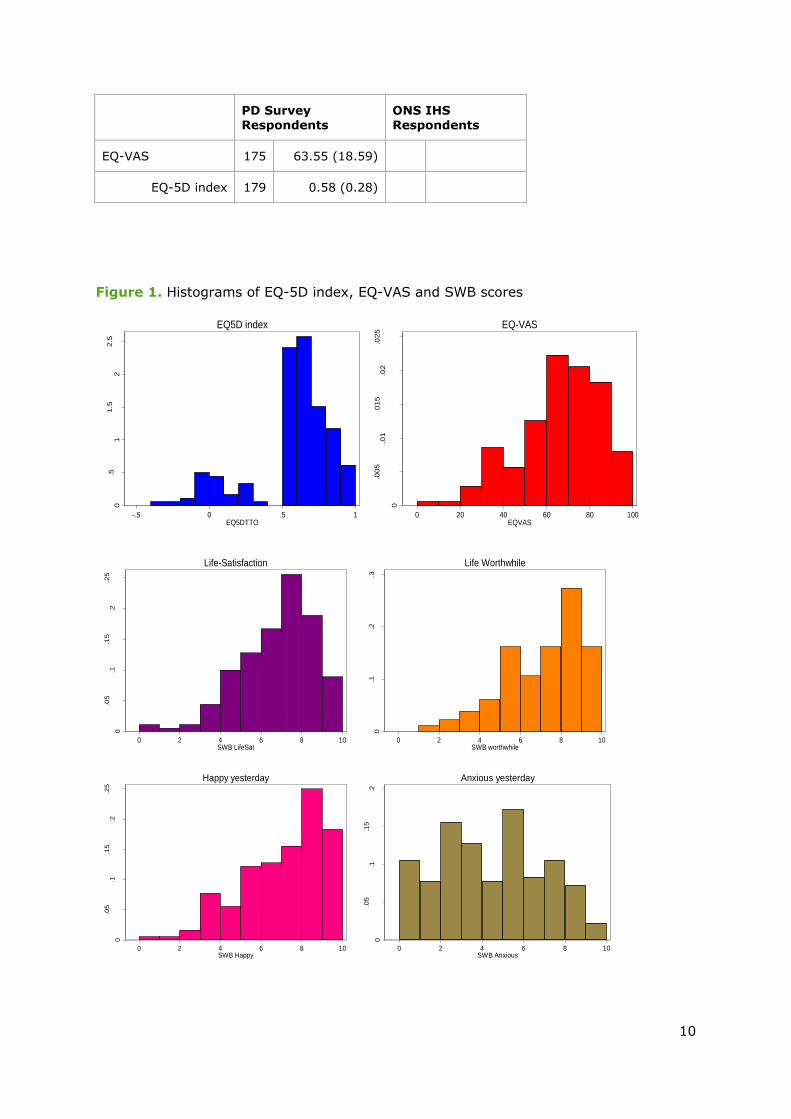
For PD patients, “life satisfaction”, “life worthwhile” and “happy yesterday” distributions
perform similarly in skewed distributions, with mean values around 6 and standard
deviations around 2 points. At face value, they also appear to behave similarly in the EQ-VAS although on a different scale, greater by a factor of 10 (as expected, given the EQ-
VAS is measured on a 0-100 scale). The EQ-5D index has a different shape, displaying a bimodal distribution that is characteristic in patient populations and has a higher
standard deviation (Parkin et al., 2013)
“Anxious yesterday” scores behave differently from all other measures, and have a quite
different distribution. One explanation may be that the scale used is the inverse of the other SWB questions (i.e. 0 =not at all anxious, the best possible state, whereas for the
other SWB questions, 0= not at all satisfied, worthwhile or happy respectively, the worst
possible state). On closer inspection of the raw data, it was found that many of those reporting high levels of SWB in terms of life-satisfaction, life worthwhile and happiness
were also reporting high levels of anxiety, which was counter-intuitive and suggested misinterpretation of the scale. This anomaly was confirmed by an analysis of SWB
anxious scores by EQ-5D anxiety/depression dimension level, whereby it was observed that some non-anxious/depressed individuals had high SWB anxious scores, and some
moderately anxious/depressed individuals reported low SWB anxious scores. Therefore the analysis of this dimension will not be included in the paper.
Table 3. Summary descriptive statistics for SWB, EQ-5D index and EQ-VAS in PD survey respondents and general UK population
PD Survey Respondents
ONS IHS Respondents
Variable Obs Mean (sd) Obs Mean (sd)
Life satisfaction 180 6.33 (1.89)
7.4 (2.0)
Life worthwhile 179 6.70 (2.01)
7.6 (1.9)
Happy yesterday 180 6.66 (2.09)
7.4 (2.3)
Anxious yesterday 180 3.97 (2.54) 3.4 (3.0)
10
PD Survey
Respondents
ONS IHS
Respondents
EQ-VAS 175 63.55 (18.59)
EQ-5D index 179 0.58 (0.28)
Figure 1. Histograms of EQ-5D index, EQ-VAS and SWB scores
0.5
11.5
22.5
De
nsity
-.5 0 .5 1EQ5DTTO
EQ5D index
0
.005
.01
.015
.02
.025
De
nsity
0 20 40 60 80 100EQVAS
EQ-VAS
0
.05
.1.1
5.2
.25
De
nsity
0 2 4 6 8 10SWB LifeSat
Life-Satisfaction
0.1
.2.3
De
nsity
0 2 4 6 8 10SWB worthwhile
Life Worthwhile
0
.05
.1.1
5.2
.25
De
nsity
0 2 4 6 8 10SWB Happy
Happy yesterday
0
.05
.1.1
5.2
De
nsity
0 2 4 6 8 10SWB Anxious
Anxious yesterday
11
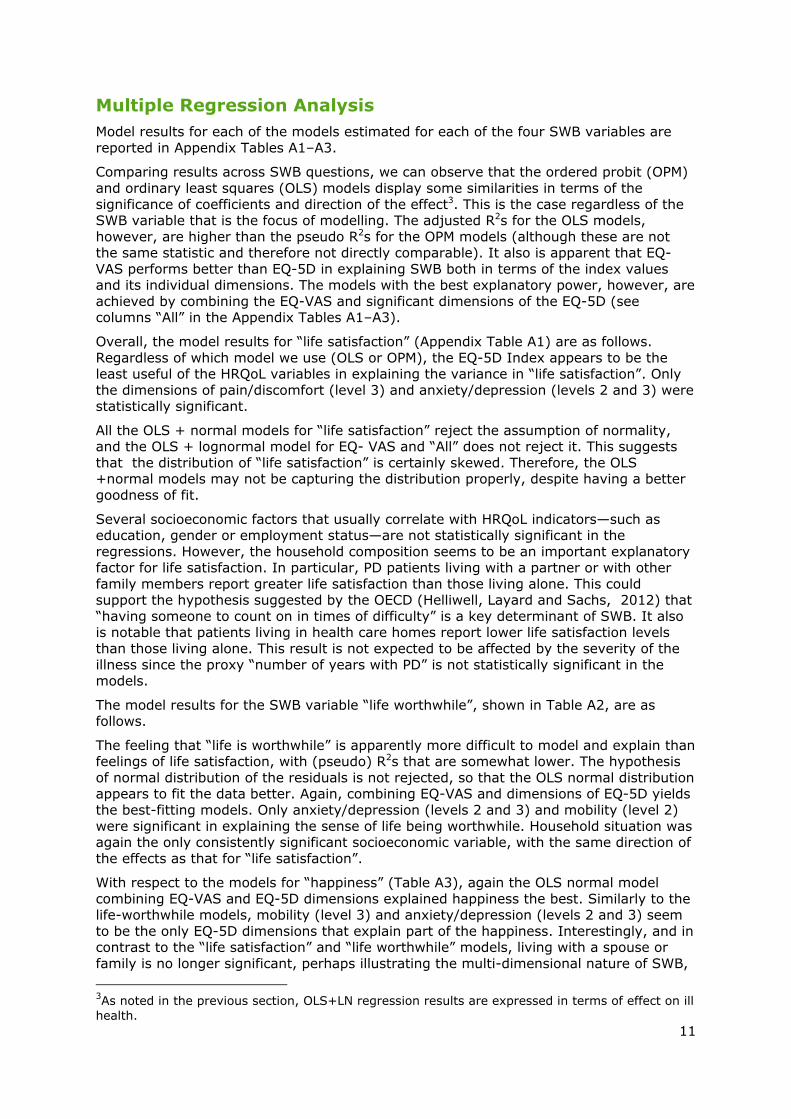
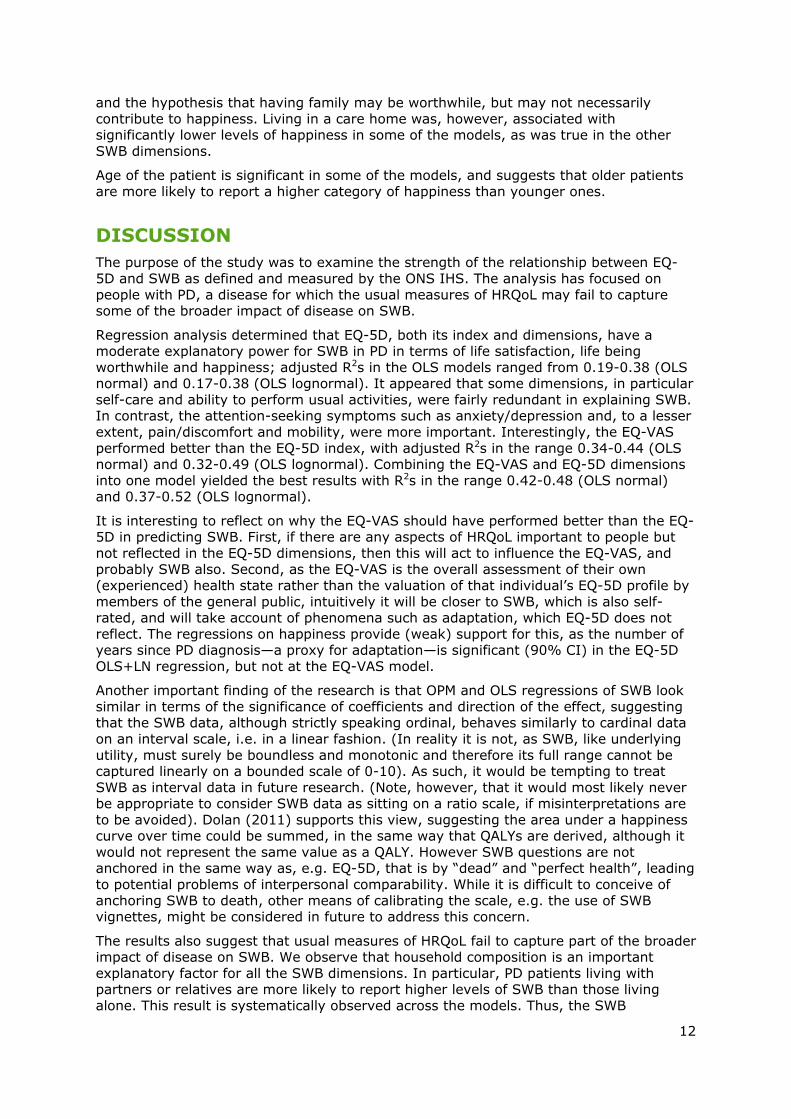
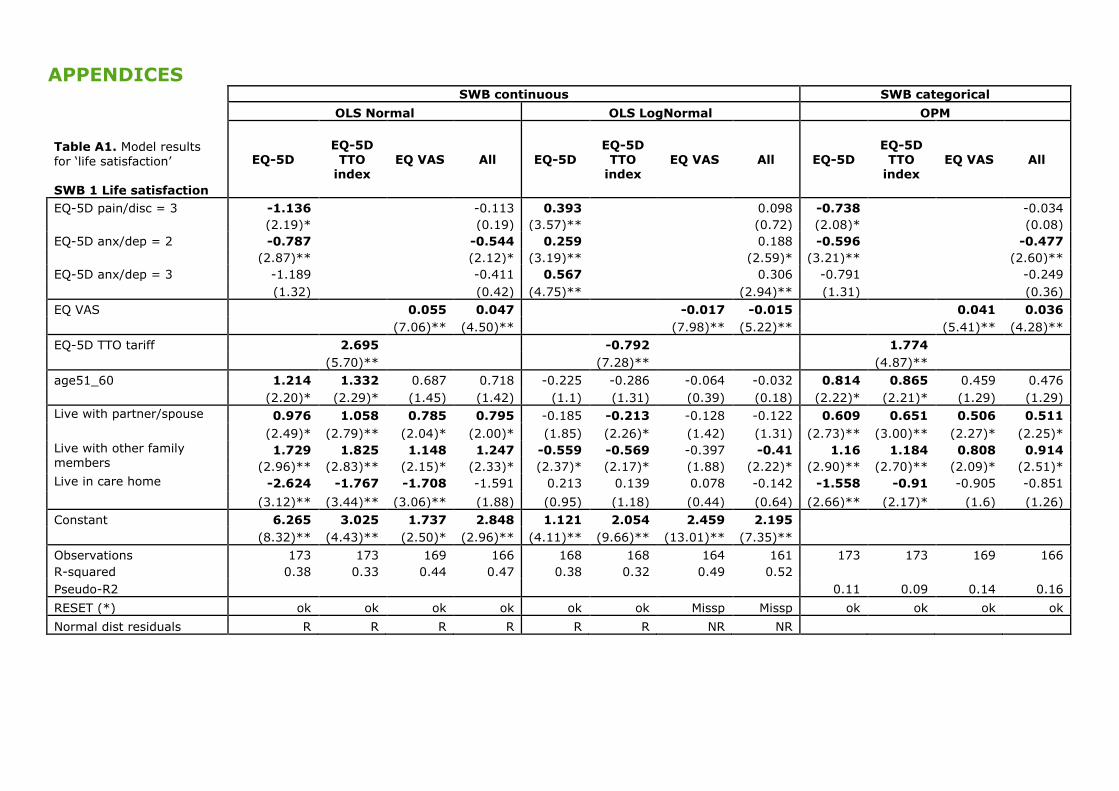
Multiple Regression Analysis
Model results for each of the models estimated for each of the four SWB variables are
reported in Appendix Tables A1–A3.
Comparing results across SWB questions, we can observe that the ordered probit (OPM)
and ordinary least squares (OLS) models display some similarities in terms of the
significance of coefficients and direction of the effect3. This is the case regardless of the SWB variable that is the focus of modelling. The adjusted R2s for the OLS models,
however, are higher than the pseudo R2s for the OPM models (although these are not the same statistic and therefore not directly comparable). It also is apparent that EQ-
VAS performs better than EQ-5D in explaining SWB both in terms of the index values and its individual dimensions. The models with the best explanatory power, however, are
achieved by combining the EQ-VAS and significant dimensions of the EQ-5D (see columns “All” in the Appendix Tables A1–A3).
Overall, the model results for “life satisfaction” (Appendix Table A1) are as follows.
Regardless of which model we use (OLS or OPM), the EQ-5D Index appears to be the least useful of the HRQoL variables in explaining the variance in “life satisfaction”. Only
the dimensions of pain/discomfort (level 3) and anxiety/depression (levels 2 and 3) were statistically significant.
All the OLS + normal models for “life satisfaction” reject the assumption of normality, and the OLS + lognormal model for EQ- VAS and “All” does not reject it. This suggests
that the distribution of “life satisfaction” is certainly skewed. Therefore, the OLS +normal models may not be capturing the distribution properly, despite having a better
goodness of fit.
Several socioeconomic factors that usually correlate with HRQoL indicators—such as education, gender or employment status—are not statistically significant in the
regressions. However, the household composition seems to be an important explanatory factor for life satisfaction. In particular, PD patients living with a partner or with other
family members report greater life satisfaction than those living alone. This could support the hypothesis suggested by the OECD (Helliwell, Layard and Sachs, 2012) that
“having someone to count on in times of difficulty” is a key determinant of SWB. It also is notable that patients living in health care homes report lower life satisfaction levels
than those living alone. This result is not expected to be affected by the severity of the
illness since the proxy “number of years with PD” is not statistically significant in the models.
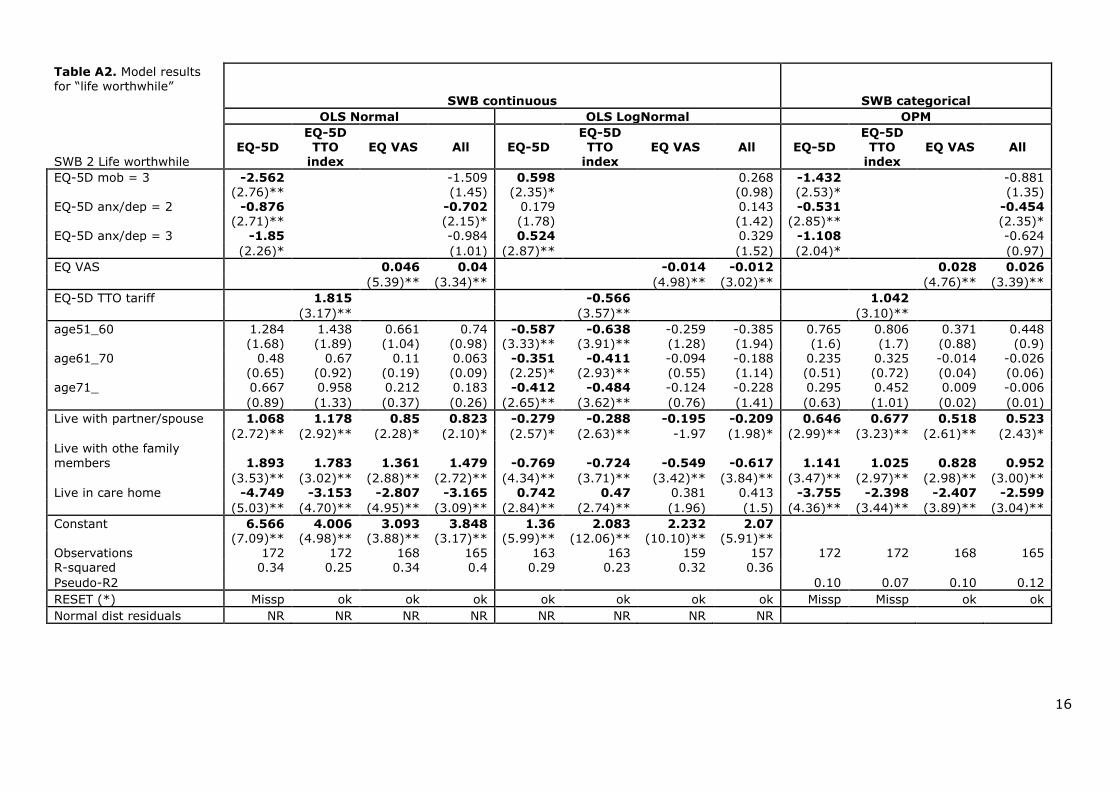
The model results for the SWB variable “life worthwhile”, shown in Table A2, are as follows.
The feeling that “life is worthwhile” is apparently more difficult to model and explain than feelings of life satisfaction, with (pseudo) R2s that are somewhat lower. The hypothesis
of normal distribution of the residuals is not rejected, so that the OLS normal distribution appears to fit the data better. Again, combining EQ-VAS and dimensions of EQ-5D yields
the best-fitting models. Only anxiety/depression (levels 2 and 3) and mobility (level 2)
were significant in explaining the sense of life being worthwhile. Household situation was again the only consistently significant socioeconomic variable, with the same direction of
the effects as that for “life satisfaction”.
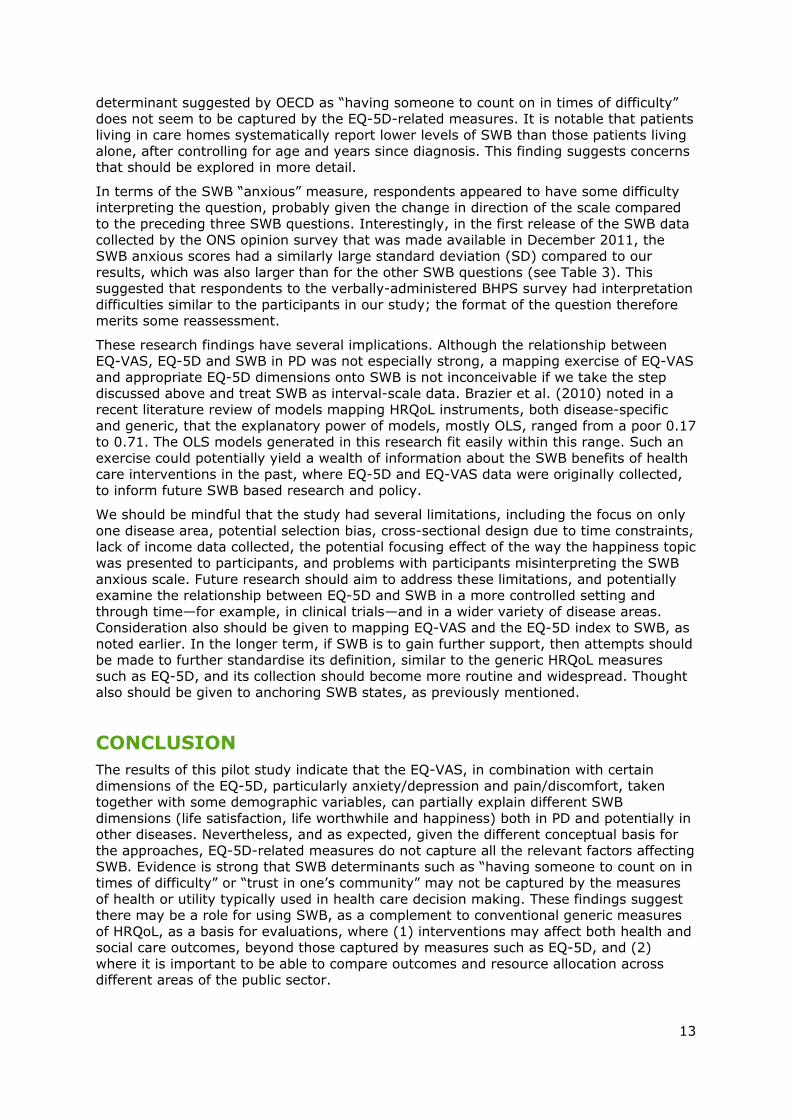
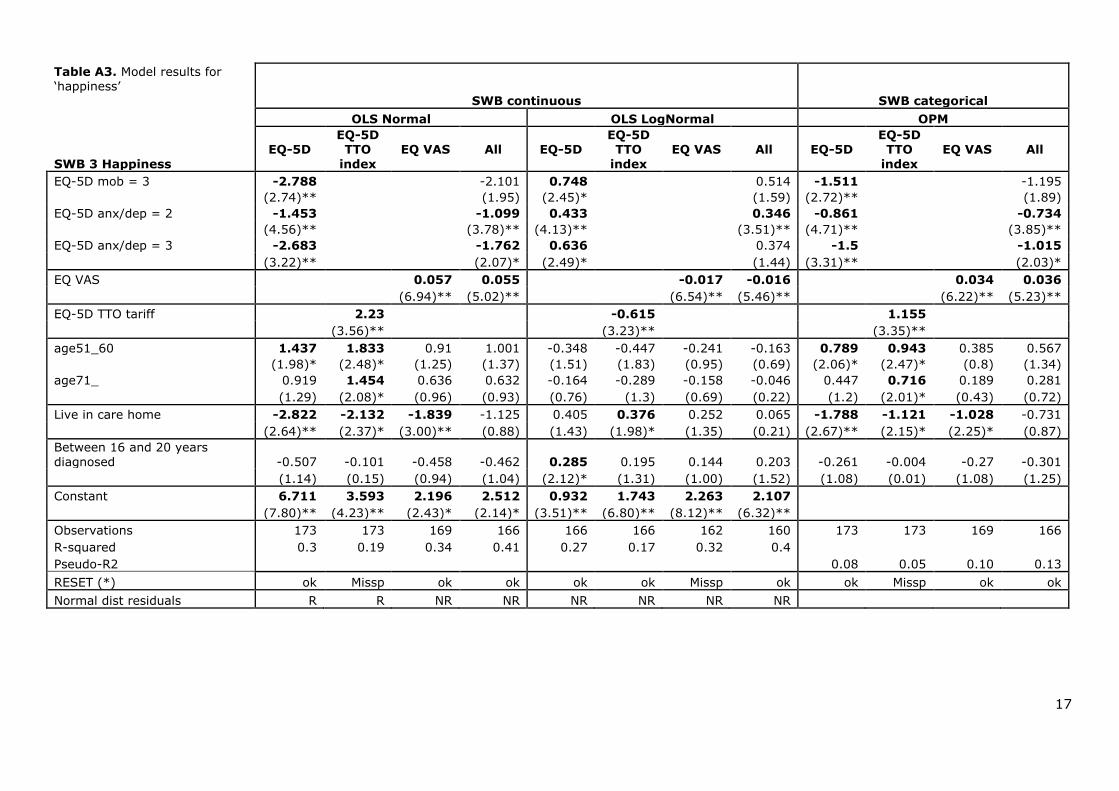
With respect to the models for “happiness” (Table A3), again the OLS normal model
combining EQ-VAS and EQ-5D dimensions explained happiness the best. Similarly to the life-worthwhile models, mobility (level 3) and anxiety/depression (levels 2 and 3) seem
to be the only EQ-5D dimensions that explain part of the happiness. Interestingly, and in contrast to the “life satisfaction” and “life worthwhile” models, living with a spouse or
family is no longer significant, perhaps illustrating the multi-dimensional nature of SWB,
3As noted in the previous section, OLS+LN regression results are expressed in terms of effect on ill
health.
12
and the hypothesis that having family may be worthwhile, but may not necessarily
contribute to happiness. Living in a care home was, however, associated with significantly lower levels of happiness in some of the models, as was true in the other
SWB dimensions.
Age of the patient is significant in some of the models, and suggests that older patients
are more likely to report a higher category of happiness than younger ones.
DISCUSSION
The purpose of the study was to examine the strength of the relationship between EQ-
5D and SWB as defined and measured by the ONS IHS. The analysis has focused on
people with PD, a disease for which the usual measures of HRQoL may fail to capture some of the broader impact of disease on SWB.
Regression analysis determined that EQ-5D, both its index and dimensions, have a moderate explanatory power for SWB in PD in terms of life satisfaction, life being
worthwhile and happiness; adjusted R2s in the OLS models ranged from 0.19-0.38 (OLS normal) and 0.17-0.38 (OLS lognormal). It appeared that some dimensions, in particular
self-care and ability to perform usual activities, were fairly redundant in explaining SWB. In contrast, the attention-seeking symptoms such as anxiety/depression and, to a lesser
extent, pain/discomfort and mobility, were more important. Interestingly, the EQ-VAS
performed better than the EQ-5D index, with adjusted R2s in the range 0.34-0.44 (OLS normal) and 0.32-0.49 (OLS lognormal). Combining the EQ-VAS and EQ-5D dimensions
into one model yielded the best results with R2s in the range 0.42-0.48 (OLS normal) and 0.37-0.52 (OLS lognormal).
It is interesting to reflect on why the EQ-VAS should have performed better than the EQ-5D in predicting SWB. First, if there are any aspects of HRQoL important to people but
not reflected in the EQ-5D dimensions, then this will act to influence the EQ-VAS, and probably SWB also. Second, as the EQ-VAS is the overall assessment of their own
(experienced) health state rather than the valuation of that individual’s EQ-5D profile by
members of the general public, intuitively it will be closer to SWB, which is also self-rated, and will take account of phenomena such as adaptation, which EQ-5D does not
reflect. The regressions on happiness provide (weak) support for this, as the number of years since PD diagnosis—a proxy for adaptation—is significant (90% CI) in the EQ-5D
OLS+LN regression, but not at the EQ-VAS model.
Another important finding of the research is that OPM and OLS regressions of SWB look
similar in terms of the significance of coefficients and direction of the effect, suggesting that the SWB data, although strictly speaking ordinal, behaves similarly to cardinal data
on an interval scale, i.e. in a linear fashion. (In reality it is not, as SWB, like underlying
utility, must surely be boundless and monotonic and therefore its full range cannot be captured linearly on a bounded scale of 0-10). As such, it would be tempting to treat
SWB as interval data in future research. (Note, however, that it would most likely never be appropriate to consider SWB data as sitting on a ratio scale, if misinterpretations are
to be avoided). Dolan (2011) supports this view, suggesting the area under a happiness curve over time could be summed, in the same way that QALYs are derived, although it
would not represent the same value as a QALY. However SWB questions are not anchored in the same way as, e.g. EQ-5D, that is by “dead” and “perfect health”, leading
to potential problems of interpersonal comparability. While it is difficult to conceive of
anchoring SWB to death, other means of calibrating the scale, e.g. the use of SWB vignettes, might be considered in future to address this concern.
The results also suggest that usual measures of HRQoL fail to capture part of the broader impact of disease on SWB. We observe that household composition is an important
explanatory factor for all the SWB dimensions. In particular, PD patients living with partners or relatives are more likely to report higher levels of SWB than those living
alone. This result is systematically observed across the models. Thus, the SWB
13
determinant suggested by OECD as “having someone to count on in times of difficulty”
does not seem to be captured by the EQ-5D-related measures. It is notable that patients living in care homes systematically report lower levels of SWB than those patients living
alone, after controlling for age and years since diagnosis. This finding suggests concerns that should be explored in more detail.
In terms of the SWB “anxious” measure, respondents appeared to have some difficulty interpreting the question, probably given the change in direction of the scale compared
to the preceding three SWB questions. Interestingly, in the first release of the SWB data collected by the ONS opinion survey that was made available in December 2011, the
SWB anxious scores had a similarly large standard deviation (SD) compared to our
results, which was also larger than for the other SWB questions (see Table 3). This suggested that respondents to the verbally-administered BHPS survey had interpretation
difficulties similar to the participants in our study; the format of the question therefore merits some reassessment.
These research findings have several implications. Although the relationship between EQ-VAS, EQ-5D and SWB in PD was not especially strong, a mapping exercise of EQ-VAS
and appropriate EQ-5D dimensions onto SWB is not inconceivable if we take the step discussed above and treat SWB as interval-scale data. Brazier et al. (2010) noted in a
recent literature review of models mapping HRQoL instruments, both disease-specific
and generic, that the explanatory power of models, mostly OLS, ranged from a poor 0.17 to 0.71. The OLS models generated in this research fit easily within this range. Such an
exercise could potentially yield a wealth of information about the SWB benefits of health care interventions in the past, where EQ-5D and EQ-VAS data were originally collected,
to inform future SWB based research and policy.
We should be mindful that the study had several limitations, including the focus on only
one disease area, potential selection bias, cross-sectional design due to time constraints, lack of income data collected, the potential focusing effect of the way the happiness topic
was presented to participants, and problems with participants misinterpreting the SWB
anxious scale. Future research should aim to address these limitations, and potentially examine the relationship between EQ-5D and SWB in a more controlled setting and
through time—for example, in clinical trials—and in a wider variety of disease areas. Consideration also should be given to mapping EQ-VAS and the EQ-5D index to SWB, as
noted earlier. In the longer term, if SWB is to gain further support, then attempts should be made to further standardise its definition, similar to the generic HRQoL measures
such as EQ-5D, and its collection should become more routine and widespread. Thought also should be given to anchoring SWB states, as previously mentioned.
CONCLUSION
The results of this pilot study indicate that the EQ-VAS, in combination with certain
dimensions of the EQ-5D, particularly anxiety/depression and pain/discomfort, taken together with some demographic variables, can partially explain different SWB
dimensions (life satisfaction, life worthwhile and happiness) both in PD and potentially in other diseases. Nevertheless, and as expected, given the different conceptual basis for
the approaches, EQ-5D-related measures do not capture all the relevant factors affecting SWB. Evidence is strong that SWB determinants such as “having someone to count on in
times of difficulty” or “trust in one’s community” may not be captured by the measures
of health or utility typically used in health care decision making. These findings suggest there may be a role for using SWB, as a complement to conventional generic measures
of HRQoL, as a basis for evaluations, where (1) interventions may affect both health and social care outcomes, beyond those captured by measures such as EQ-5D, and (2)
where it is important to be able to compare outcomes and resource allocation across different areas of the public sector.

14
As the interest in SWB as a policy tool gathers momentum, proxies for it may be
developed using existing data from generic HRQoL measures such as the EQ-5D profile and EQ-VAS. However, these conclusions require further substantiation through a larger
body of empirical research into SWB and EQ-5D/EQ-VAS, in other diseases and through time. SWB definitions and measures may require further standardisation and refinement
in order to ensure they provide a valid and appropriate basis for social policies.
APPENDICES
Table A1. Model results
for ‘life satisfaction’ SWB 1 Life satisfaction
SWB continuous SWB categorical
OLS Normal OLS LogNormal OPM
EQ-5D EQ-5D TTO
index EQ VAS All EQ-5D
EQ-5D TTO
index EQ VAS All EQ-5D
EQ-5D TTO
index EQ VAS All
EQ-5D pain/disc = 3 -1.136 -0.113 0.393 0.098 -0.738 -0.034
(2.19)* (0.19) (3.57)** (0.72) (2.08)* (0.08)
EQ-5D anx/dep = 2 -0.787 -0.544 0.259 0.188 -0.596 -0.477
(2.87)** (2.12)* (3.19)** (2.59)* (3.21)** (2.60)**
EQ-5D anx/dep = 3 -1.189 -0.411 0.567 0.306 -0.791 -0.249
(1.32) (0.42) (4.75)** (2.94)** (1.31) (0.36)
EQ VAS 0.055 0.047 -0.017 -0.015 0.041 0.036
(7.06)** (4.50)** (7.98)** (5.22)** (5.41)** (4.28)**
EQ-5D TTO tariff 2.695 -0.792 1.774
(5.70)** (7.28)** (4.87)**
age51_60 1.214 1.332 0.687 0.718 -0.225 -0.286 -0.064 -0.032 0.814 0.865 0.459 0.476
(2.20)* (2.29)* (1.45) (1.42) (1.1) (1.31) (0.39) (0.18) (2.22)* (2.21)* (1.29) (1.29)
Live with partner/spouse 0.976 1.058 0.785 0.795 -0.185 -0.213 -0.128 -0.122 0.609 0.651 0.506 0.511
(2.49)* (2.79)** (2.04)* (2.00)* (1.85) (2.26)* (1.42) (1.31) (2.73)** (3.00)** (2.27)* (2.25)*
Live with other family members
1.729 1.825 1.148 1.247 -0.559 -0.569 -0.397 -0.41 1.16 1.184 0.808 0.914
(2.96)** (2.83)** (2.15)* (2.33)* (2.37)* (2.17)* (1.88) (2.22)* (2.90)** (2.70)** (2.09)* (2.51)*
Live in care home -2.624 -1.767 -1.708 -1.591 0.213 0.139 0.078 -0.142 -1.558 -0.91 -0.905 -0.851
(3.12)** (3.44)** (3.06)** (1.88) (0.95) (1.18) (0.44) (0.64) (2.66)** (2.17)* (1.6) (1.26)
Constant 6.265 3.025 1.737 2.848 1.121 2.054 2.459 2.195
(8.32)** (4.43)** (2.50)* (2.96)** (4.11)** (9.66)** (13.01)** (7.35)**
Observations 173 173 169 166 168 168 164 161 173 173 169 166
R-squared 0.38 0.33 0.44 0.47 0.38 0.32 0.49 0.52
Pseudo-R2 0.11 0.09 0.14 0.16
RESET (*) ok ok ok ok ok ok Missp Missp ok ok ok ok
Normal dist residuals R R R R R R NR NR
16
Table A2. Model results for “life worthwhile”
SWB continuous SWB categorical
OLS Normal OLS LogNormal OPM
SWB 2 Life worthwhile EQ-5D
EQ-5D TTO
index EQ VAS All EQ-5D
EQ-5D TTO
index EQ VAS All EQ-5D
EQ-5D TTO
index EQ VAS All
EQ-5D mob = 3 -2.562 -1.509 0.598 0.268 -1.432 -0.881
(2.76)** (1.45) (2.35)* (0.98) (2.53)* (1.35) EQ-5D anx/dep = 2 -0.876 -0.702 0.179 0.143 -0.531 -0.454
(2.71)** (2.15)* (1.78) (1.42) (2.85)** (2.35)* EQ-5D anx/dep = 3 -1.85 -0.984 0.524 0.329 -1.108 -0.624
(2.26)* (1.01) (2.87)** (1.52) (2.04)* (0.97)
EQ VAS 0.046 0.04 -0.014 -0.012 0.028 0.026
(5.39)** (3.34)** (4.98)** (3.02)** (4.76)** (3.39)**
EQ-5D TTO tariff 1.815 -0.566 1.042
(3.17)** (3.57)** (3.10)**
age51_60 1.284 1.438 0.661 0.74 -0.587 -0.638 -0.259 -0.385 0.765 0.806 0.371 0.448
(1.68) (1.89) (1.04) (0.98) (3.33)** (3.91)** (1.28) (1.94) (1.6) (1.7) (0.88) (0.9) age61_70 0.48 0.67 0.11 0.063 -0.351 -0.411 -0.094 -0.188 0.235 0.325 -0.014 -0.026
(0.65) (0.92) (0.19) (0.09) (2.25)* (2.93)** (0.55) (1.14) (0.51) (0.72) (0.04) (0.06) age71_ 0.667 0.958 0.212 0.183 -0.412 -0.484 -0.124 -0.228 0.295 0.452 0.009 -0.006
(0.89) (1.33) (0.37) (0.26) (2.65)** (3.62)** (0.76) (1.41) (0.63) (1.01) (0.02) (0.01)
Live with partner/spouse 1.068 1.178 0.85 0.823 -0.279 -0.288 -0.195 -0.209 0.646 0.677 0.518 0.523
(2.72)** (2.92)** (2.28)* (2.10)* (2.57)* (2.63)** -1.97 (1.98)* (2.99)** (3.23)** (2.61)** (2.43)* Live with othe family
members 1.893 1.783 1.361 1.479 -0.769 -0.724 -0.549 -0.617 1.141 1.025 0.828 0.952
(3.53)** (3.02)** (2.88)** (2.72)** (4.34)** (3.71)** (3.42)** (3.84)** (3.47)** (2.97)** (2.98)** (3.00)** Live in care home -4.749 -3.153 -2.807 -3.165 0.742 0.47 0.381 0.413 -3.755 -2.398 -2.407 -2.599
(5.03)** (4.70)** (4.95)** (3.09)** (2.84)** (2.74)** (1.96) (1.5) (4.36)** (3.44)** (3.89)** (3.04)**
Constant 6.566 4.006 3.093 3.848 1.36 2.083 2.232 2.07
(7.09)** (4.98)** (3.88)** (3.17)** (5.99)** (12.06)** (10.10)** (5.91)**
Observations 172 172 168 165 163 163 159 157 172 172 168 165 R-squared 0.34 0.25 0.34 0.4 0.29 0.23 0.32 0.36
Pseudo-R2 0.10 0.07 0.10 0.12
RESET (*) Missp ok ok ok ok ok ok ok Missp Missp ok ok
Normal dist residuals NR NR NR NR NR NR NR NR
17
Table A3. Model results for ‘happiness’
SWB continuous SWB categorical
OLS Normal OLS LogNormal OPM
SWB 3 Happiness
EQ-5D EQ-5D TTO
index
EQ VAS All EQ-5D EQ-5D TTO
index
EQ VAS All EQ-5D EQ-5D TTO
index
EQ VAS All
EQ-5D mob = 3 -2.788 -2.101 0.748 0.514 -1.511 -1.195
(2.74)** (1.95) (2.45)* (1.59) (2.72)** (1.89)
EQ-5D anx/dep = 2 -1.453 -1.099 0.433 0.346 -0.861 -0.734
(4.56)** (3.78)** (4.13)** (3.51)** (4.71)** (3.85)**
EQ-5D anx/dep = 3 -2.683 -1.762 0.636 0.374 -1.5 -1.015
(3.22)** (2.07)* (2.49)* (1.44) (3.31)** (2.03)*
EQ VAS 0.057 0.055 -0.017 -0.016 0.034 0.036
(6.94)** (5.02)** (6.54)** (5.46)** (6.22)** (5.23)**
EQ-5D TTO tariff 2.23 -0.615 1.155
(3.56)** (3.23)** (3.35)**
age51_60 1.437 1.833 0.91 1.001 -0.348 -0.447 -0.241 -0.163 0.789 0.943 0.385 0.567
(1.98)* (2.48)* (1.25) (1.37) (1.51) (1.83) (0.95) (0.69) (2.06)* (2.47)* (0.8) (1.34)
age71_ 0.919 1.454 0.636 0.632 -0.164 -0.289 -0.158 -0.046 0.447 0.716 0.189 0.281
(1.29) (2.08)* (0.96) (0.93) (0.76) (1.3) (0.69) (0.22) (1.2) (2.01)* (0.43) (0.72)
Live in care home -2.822 -2.132 -1.839 -1.125 0.405 0.376 0.252 0.065 -1.788 -1.121 -1.028 -0.731
(2.64)** (2.37)* (3.00)** (0.88) (1.43) (1.98)* (1.35) (0.21) (2.67)** (2.15)* (2.25)* (0.87)
Between 16 and 20 years
diagnosed -0.507 -0.101 -0.458 -0.462 0.285 0.195 0.144 0.203 -0.261 -0.004 -0.27 -0.301
(1.14) (0.15) (0.94) (1.04) (2.12)* (1.31) (1.00) (1.52) (1.08) (0.01) (1.08) (1.25)
Constant 6.711 3.593 2.196 2.512 0.932 1.743 2.263 2.107
(7.80)** (4.23)** (2.43)* (2.14)* (3.51)** (6.80)** (8.12)** (6.32)**
Observations 173 173 169 166 166 166 162 160 173 173 169 166
R-squared 0.3 0.19 0.34 0.41 0.27 0.17 0.32 0.4
Pseudo-R2 0.08 0.05 0.10 0.13
RESET (*) ok Missp ok ok ok ok Missp ok ok Missp ok ok
Normal dist residuals R R NR NR NR NR NR NR
REFERENCES Brazier, J., Akehurst, R., Brennan, A., Dolan, P., Claxton, K., McCabe, C., Sculpher, M. and Tsuchiya, A. (2005) Should patients have a greater role in valuating health states?
Applied Health Economics and Health Policy. 4(4), 201-208.
Brazier, J.E., Yang, Y., Tsuchiya, A. and Rowen, D.L. (2010) A review of studies mapping (or cross walking) non-preference based measures of health to generic preference-based
measures. European Journal of Health Economics.11(2), 215-25.
Cubí-Mollá, P. and Herrero, C. (2012) Quality of life lost to non-fatal road traffic injuries.
Health Economics. 21(5), 528-550.
DeWit, G.A., Busschbach, J.J. and de Charro, F. (2000). Sensitivity and perspective in the valuation of health status: Whose values count? Health Economics. 9(3), 109-126.
Diener, E., Suh, E., M., Lucas, R.E. and Smith, H. L. (1999) Subjective well-being: Three
decades of progress. Psychological Bulletin. 125, 276-302.
Dolan, P. (1997) Modeling valuations for EuroQol health states. Medical Care. 35(11),
1095-1108.
Dolan, P. (2009) How does NICE value health? British Medical Journal. 339, b2577.
Dolan, P. (2011) Using Happiness to Value Health. London: Office of Health Economics.
Dolan, P., Gudex, C., Kind, P. and Williams, A., (1996). The time trade-off method: Results from a general population study. Health Economics. 5(2), 141–154.
Erreygers, G. and van Ourti, T. (2011) Measuring socioeconomic inequality in health, health care and health financing by means of rank-dependent indices: A recipe for good
practice. Journal of Health Economics. 30(4), 685-694.
EuroQol Group. (1990) EuroQol-: A new facility for the measurement of health-related quality of life. Health Policy. 16(3), 199-208.
Helliwell, J., Layard, R., and Sachs, J. eds. (2012) World happiness report. New York:
Earth Institute, Columbia University.
Menzel, P., Dolan, P., Richardson, J. and Olsen, J.A. (2002) The role of adaptation to
disability and disease in health state valuation: A preliminary normative analysis. Social Science and Medicine. 55(12), 2149-2158.
OECD. (2010) Key indicators on education: To what level have adults studied? Available
at http://www.oecd.org/document/55/0,3746,en_2649_37455_46349815_1_1_1_37455,0
0.html. [Accessed 21 July 2013].
OECD. (2011) How’s life? Measuring well-being. Available at:
http://www.oecd.org/document/10/0,3746,en_2649_201185_48791306_1_1_1_1,00.html. [Accessed 21 July 2013].
OECD. (2013) Guidelines on Measuring Subjective Well-Being. Paris: OECD Publishing.
ONS (Office for National Statistics). (2011b) Happiness measured 2011. Available at:
https://docs.google.com/spreadsheet/ccc?key=0AonYZs4MzlZbdDBwREJDT0lqZzJuY0dS
bklDZDY1TVE#gid=25. [Accessed 21 July 2013].
19
ONS (Office for National Statistics, Social and Vital Statistics Division). (2011a)
Integrated household survey. Colchester, Essex: UK Data Archive.
Parkin, D., Devlin, N. and Feng, Y. (2013) What determines the shape of an EQ-5D index distribution? Paper presented at the Health Economics Research Group meeting.
University of Exeter Medical School. 9-11 January 2013.
Schkade, D.A. and Kahneman, D. (1998) Does living in California make people happy? A focusing illusion in judgments of life satisfaction. Psychological Science. 9(5), 340-346.
Schrag, A., Selai, C., Jahanshahi, M. and Quinn, N.P. (2000) The EQ-5D—a generic quality of life measure—is a useful instrument to measure quality of life in patients with
Parkinson’s disease. Journal of Neurology, Neurosurgery and Psychiatry. 69(1), 67-73.
Van Doorslaer, E, and Jones, A.M. (2003) Inequalities in self-reported health: Validation of a new approach to measurement. Journal of Health Economics. 22, 61–87.
Wailoo, A., Davis, S. and Tosh, J. (2010) The incorporation of health benefits in cost
utility analysis using the EQ-5D. Report by the Decision Support Unit. Sheffield: School
of Health and Related Research, University of Sheffield.