Embed Size (px)
Citation preview
A STUDY OF THE RELATIONS BETWEEN THE MARKETING MIX AND CONSUMERS’ ATTITUDES AND BEHAVIORS: A CASE STUDY OF FOREIGN TOURISTS’
EXPENDITURE AT JATUJAK WEEKEND MARKET IN BANGKOK
A MASTER ’S PROJECT BY
DUANGKAMOL LOOKIN
Presented in Partial Fulfillment of the Requirements for the Master of Arts Degree in Business English for International Communication
at Srinakharinwirot University March 2007
การศึกษาความสัมพนัธระหวางกลยทุธทางการตลาดที่เกี่ยวของกับทศันคติและพฤติกรรมของผูบริโภค กรณีศึกษาการใชจายของนกัทองเทีย่วตางประเทศที่ตลาดนัดจตุจักร กรุงเทพมหานคร
บทคัดยอ ของ
ดวงกมล ลูกอินทร
เสนอตอบัณฑติวิทยาลัย มหาวทิยาลยัศรีนครินทรวิโรฒ เพื่อเปนสวนหนึ่งของการศึกษา ตามหลกัสูตรปริญญาศลิปศาสตรมหาบณัฑิต สาขาวชิาภาษาอังกฤษธุรกิจเพื่อการสื่อสารนานาชาต ิ
มีนาคม 2550

ดวงกมล ลูกอนิทร. (2549). การศึกษาความสัมพันธระหวางกลยุทธทางการตลาดที่เกีย่วของกับทัศนคติและ
พฤติกรรมของผูบริโภค กรณีศึกษาการใชจายของนักทองเที่ยวตางประเทศที่ตลาดนัดจตุจักร
กรุงเทพมหานคร. สารนพินธ ศศ.ม. (ภาษาอังกฤษธุรกิจเพื่อการสื่อสารนานาชาติ). กรุงเทพฯ : บัณฑิต
วิทยาลัย มหาวิทยาลัยศรีนครินทรวิโรฒ. อาจารยที่ปรึกษาสารนพินธ:
ผูชวยศาสตราจารย. ดร. อัมพร ศรีเสริมโภค.
สารนิพนธฉบับนี้มีวัตถุประสงคเพื่อศึกษาความสัมพันธระหวางกลยุทธทางการตลาดที่เกี่ยวของกับ
ทัศนคติและพฤติกรรมของผูบริโภคตอการใชจายของนักทองเที่ยวตางประเทศ ดังนี้ (1) ศึกษาถึง
ความสัมพันธระหวางกลยุทธทางการตลาด ทัศนคติ และ พฤติกรรมการใชจายของนักทองเที่ยวชาว
ตางประเทศ (2) วิเคราะหถึงทัศนคติและพฤติกรรมการใชจายของนักทองเที่ยวชาวตางประเทศภายใน
ตลาดนัดจตุจักร เครื่องมือที่ใชในการศึกษาคือ แบบสอบถามโดยใชวิธีในการสุมแจกนักทองเที่ยวจํานวน
50 คน ที่มีอายุตั้งแต 20 ป ข้ึนไป ผูวิจัยไดนําขอมูลที่ไดรับมาทําการวิเคราะหโดยการหาคารอยละ และ
การพรรณนาเชิงวิเคราะห ซึ่งผลการศึกษาพบวานักทองเที่ยวตางประเทศใหความสําคัญกับราคาที่
เหมาะสมและคุณภาพของผลิตภัณฑ พรอมทั้งใหความสําคัญกับกลยุทธทางดานตัวสินคา ราคา และ
สถานที่ เพื่อเปนปจจัยในการตัดสินใจซื้อสินคาภายในตลาดนัดจตุจักร การศึกษาในครั้งนี้ยังพบวาความ
พึงพอใจและความจงรักภักดีเปนปจจัยสําคัญในการกําหนดความตองการที่จะกลับมาใชจายของ
นักทองเที่ยวชาวตางประเทศอีกดวย ขอมูลนี้จัดทําขึ้นเพื่อชวยใหผูคาภายในตลาดนัดจตุจักรเขาใจถึง
ทัศนคติของนักทองเที่ยวชาวตางประเทศเพื่อกระตุนยอดจําหนายสินคาดวยเชนกัน
A STUDY OF THE RELATIONS BETWEEN THE MARKETING MIX AND CONSUMERS’ ATTITUDES AND BEHAVIORS: A CASE STUDY OF FOREIGN TOURISTS’
EXPENDITURE AT JATUJAK WEEKEND MARKET IN BANGKOK
AN ABSTRACT BY
DUANGKAMOL LOOKIN
Presented in Partial Fulfillment of the Requirements for the Master of Arts Degree in Business English for International Communication
At Srinakharinwirot University March 2007
Duangkamol Lookin. (2007). A Study of the Relations between the Marketing Mix and Consumers’ Attitudes and Behaviors: A Case Study of Foreign Tourists’ Expenditure at Jatujak Weekend Market in Bangkok. Master’s Project, M.A. (Business English for International Communication). Bangkok: Graduate School, Srinakharinwirot University. Project Advisor: Asst. Prof. Dr. Amporn Srisermbhok.
This study aimed to find out the Relations between the Marketing Mix, attitudes and
behaviors toward foreign tourists’ expenditure as the following (1) to find the relations between
the marketing mix that affect their behaviors toward their purchasing decision and (2) To
analyze foreigners’ attitudes and behaviors upon their expenses. Fifty foreign tourists aged
starting from 20 were selected randomly. The data collected were analyzed and presented in
percentage. The result indicated that most foreign tourists emphasized perceived marketing
attributes in terms of low prices. There had mixed prior on product, price and place mixed to
reach final purchasing decisions involving different types of products in the market. In addition,
satisfaction and loyalty would be the important factors and if this satisfaction met their
expectations, repeat visitation is likely to occur. This study helps make all vendors in the Market
understand foreign tourists’ attitudes toward their expenditure better.
A STUDY OF THE RELATIONS BETWEEN THE MARKETING MIX AND CONSUMERS’ ATTITUDES AND BEHAVIORS: A CASE STUDY OF FOREIGN TOURISTS’
EXPENDITURE AT JATUJAK WEEKEND MARKET IN BANGKOK
A MASTER ’S PROJECT BY
DUANGKAMOL LOOKIN
Presented in Partial Fulfillment of the Requirements for the
Master of Arts Degree in Business English for International Communication at Srinakharinwirot University
March 2007 Copyright 2007 by Srinakharinwirot University
The Master’s Project Advisor, Chair of Business English for International Communication Program and Oral Defense Committee have approved this Master’s project as partial fulfillment of the requirements of the Master of Arts Degree in Business English for International Communication of Srinakharinwirot University.
Project Advisor …………………………………………………………………………...
(Assistant Professor Dr. Amporn Srisermbhok)
Chair of Business English for International Communication Program ……………………………………………………………………………
(Assistant Professor Dr. Tipa Thep-Ackrapong)
Oral Defense Committee …………………………………………………………………………... Chair
(Assistant Professor Dr. Amporn Srisermbhok)
………………………………………………………………………...... Committee (Assistant Professor Penny Diskaprakai)
………………………………………………………………………...... Committee
(Dr. Aurapan Weerawong)
This Master’s Project has been approved as partial fulfillment of the requirements for the Master of Arts Degree in Business English for International Communication of Srinakharinwirot University.
………………………………………………... Dean of the Faculty of Humanities
(Associate Professor Chaleosri Pibulchol) March …….., 2007
ACKNOWLEDGEMENTS
I wish to express my deep gratitude to Asst. Prof. Dr. Amporn Srisermbhok, my advisor
for her kind guidance, valuable comments and encouragement throughout the study. I am very
grateful to Asst. Prof. Penny Diskaprakai, Dr. Aurapan Weerawong for their worthwhile
comments and suggestions.
I also would like to extend my thanks to Khun Piboon Chantarasrisopha, the staff at
Jatujak Weekend Market information center for providing valuable information.
A special thank goes to my beloved classmates for their sincere assistance and
encouragement throughout the study.
Finally, I am indepted to my parents for their love, profound understanding, and
encouragements during my study.
Duangkamol Lookin
TABLE OF CONTENTS
Chapter Page
1 INTRODUCTION Background……………………………………………………………………... 1 Research Questions…………………………………………………………... 4 Purpose of the study………………………………………………………...... 4 Significance of the study……………………………………………………… 4 Scope of the study…………………………………………………………...... 5 2 REVIEW OF LITERATURE……………………………………………….. 6 3 METHODOLOGY…………………………………………………………. 19 4 FINDINGS………………………………………………………………… 21 5 CONCLUSIONS AND DISCUSSION…………………………………… 45 BIBLIOGRAPHY………………………………….………...…………………
52
APPENDICES………………………………………………….……………... 56 Questionnaire …………………………………………………………………….. 55 Jatujak Weekend Market information…………………………………………… 62 VITAE………………………………………………………………………………….... 65
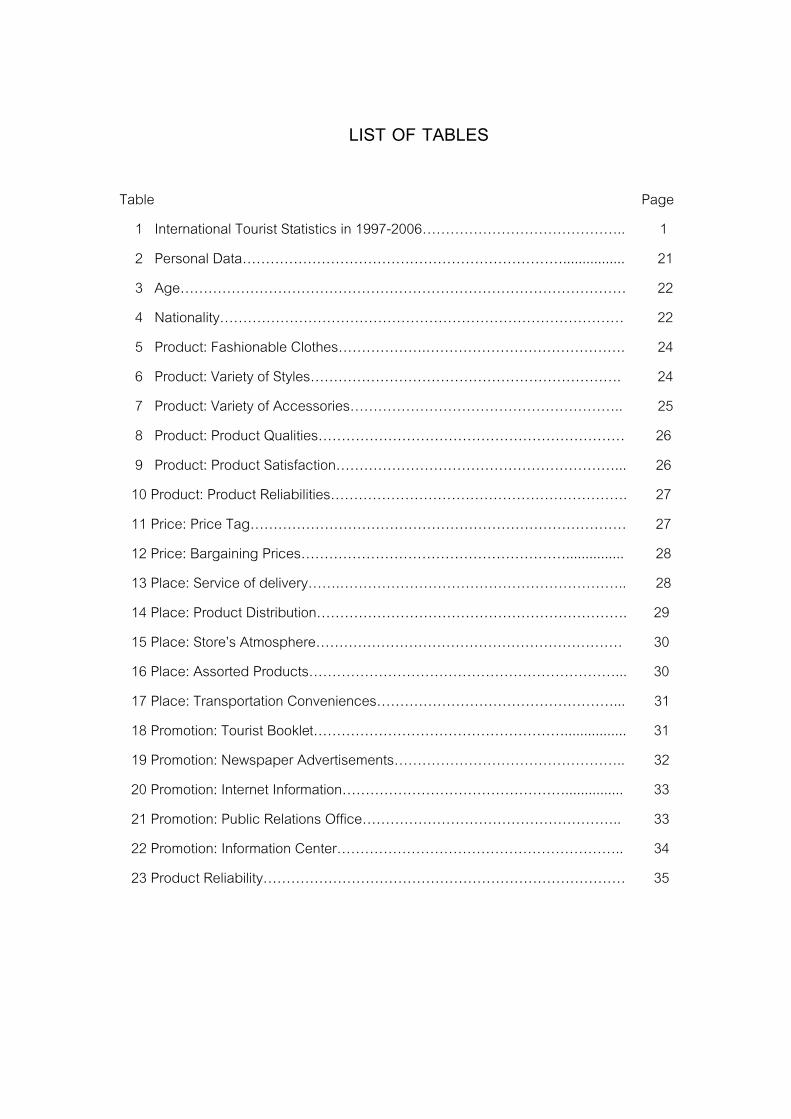
LIST OF TABLES
Table Page 1 International Tourist Statistics in 1997-2006…………………………………….. 1 2 Personal Data……………………………………………………………................ 21 3 Age…………………………………………………………………………………… 22 4 Nationality…………………………………………………………………………… 22 5 Product: Fashionable Clothes……………….……………………………………. 24 6 Product: Variety of Styles…………………………………………………………. 24 7 Product: Variety of Accessories………………………………………………….. 25 8 Product: Product Qualities………………………………………………………… 26 9 Product: Product Satisfaction……………………………………………………... 26 10 Product: Product Reliabilities………………………………………………………. 27 11 Price: Price Tag……………………………………………………………………… 27 12 Price: Bargaining Prices…………………………………………………............... 28 13 Place: Service of delivery…….…………………………………………………….. 28 14 Place: Product Distribution…………………………………………………………. 29 15 Place: Store’s Atmosphere………………………………………………………… 30 16 Place: Assorted Products…………………………………………………………... 30 17 Place: Transportation Conveniences……………………………………………... 31 18 Promotion: Tourist Booklet………………………………………………................ 31 19 Promotion: Newspaper Advertisements………………………………………….. 32 20 Promotion: Internet Information…………………………………………............... 33 21 Promotion: Public Relations Office……………………………………………….. 33 22 Promotion: Information Center…………………………………………………….. 34 23 Product Reliability…………………………………………………………………… 35
LIST OF TABLES(Continued)
Table Page 24 Low Cost……………………………………………………………........................ 35 25 Convenience………………………………………………………………………… 36 26 Product Value……………………………………………………………………….. 37 27 Product Design……………………………………………………………………... 37 28 Brand Imitation…………………………………………………………….............. 38 29 What kind of product did you buy the most?................................................... 39 30 Is this your first visit to Jatujak Weekend Market?............................................ 40 31 How often do you shop at Jatujak Weekend Market?...................................... 40 32 Do you have any specific shop in mind?......................................................... 41 33 What is your primary purpose to visit Jatujak Weekend Market ? …………… 41 34 Which factors influenced you to spend money?............................................. 42 35 What is the most important reason to shop at Jatujak Weekend Market?......................................................................................................
43
LIST OF FIGURE
Figure Page 1 The Tricomponent Attitude Model…………………………………….. 11 2 Consumer Decision Making………………………………………….... 17 3 A Three Dimensional Typology of The Market Relations………….. 47
CHAPTER 1
INTRODUCTION
Background
Thai government has planned the campaign to help boost Thailand’s reputation as
a world-class destination blessed with amazing shopping opportunities at equally
reasonable prices after an economic crisis in the middle of 1997. Thailand is one of the
leaders among developing Asian countries in international tourism business. Since the
1997 economic crisis, tourism has become a leading sector that has continued to
stimulate the otherwise sagging economy. Therefore, Thailand is launching a makeover to
position itself as Asia's shopping paradise to lure foreign tourists. The amount of foreign
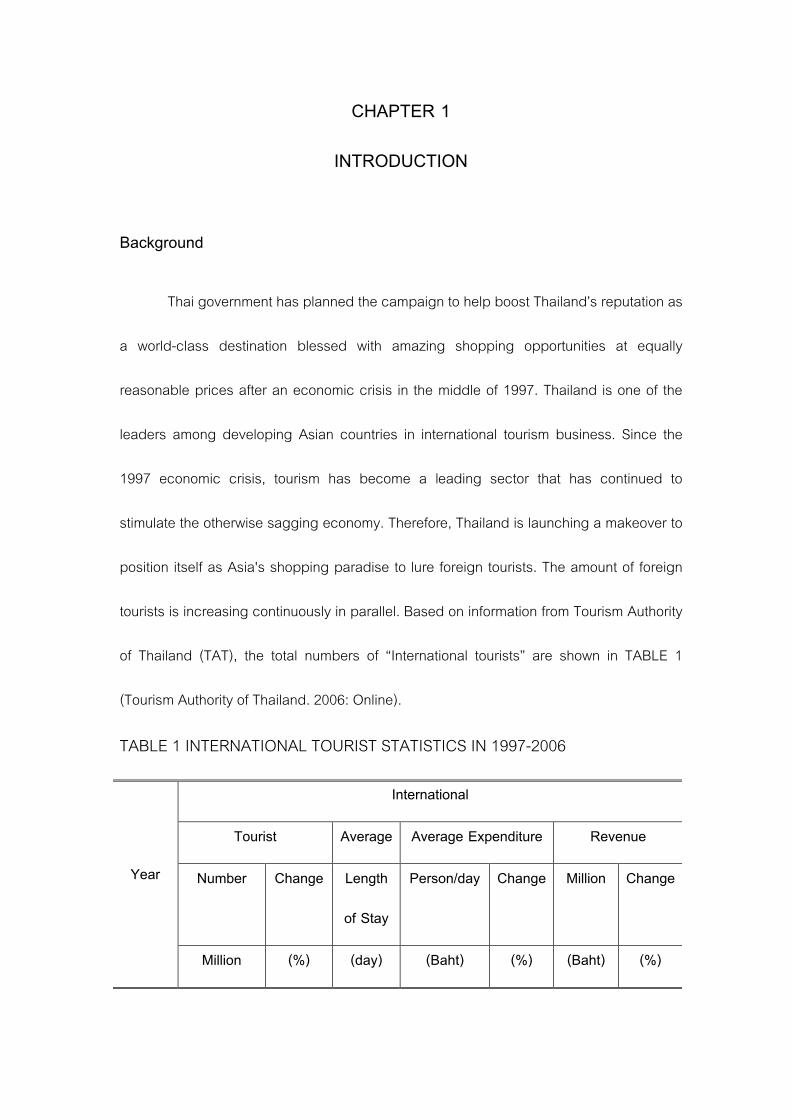
tourists is increasing continuously in parallel. Based on information from Tourism Authority
of Thailand (TAT), the total numbers of “International tourists” are shown in TABLE 1
(Tourism Authority of Thailand. 2006: Online).
TABLE 1 INTERNATIONAL TOURIST STATISTICS IN 1997-2006
International
Tourist Average Average Expenditure Revenue
Number Change Length
of Stay
Person/day Change Million Change
Year
Million (%) (day) (Baht) (%) (Baht) (%)
2
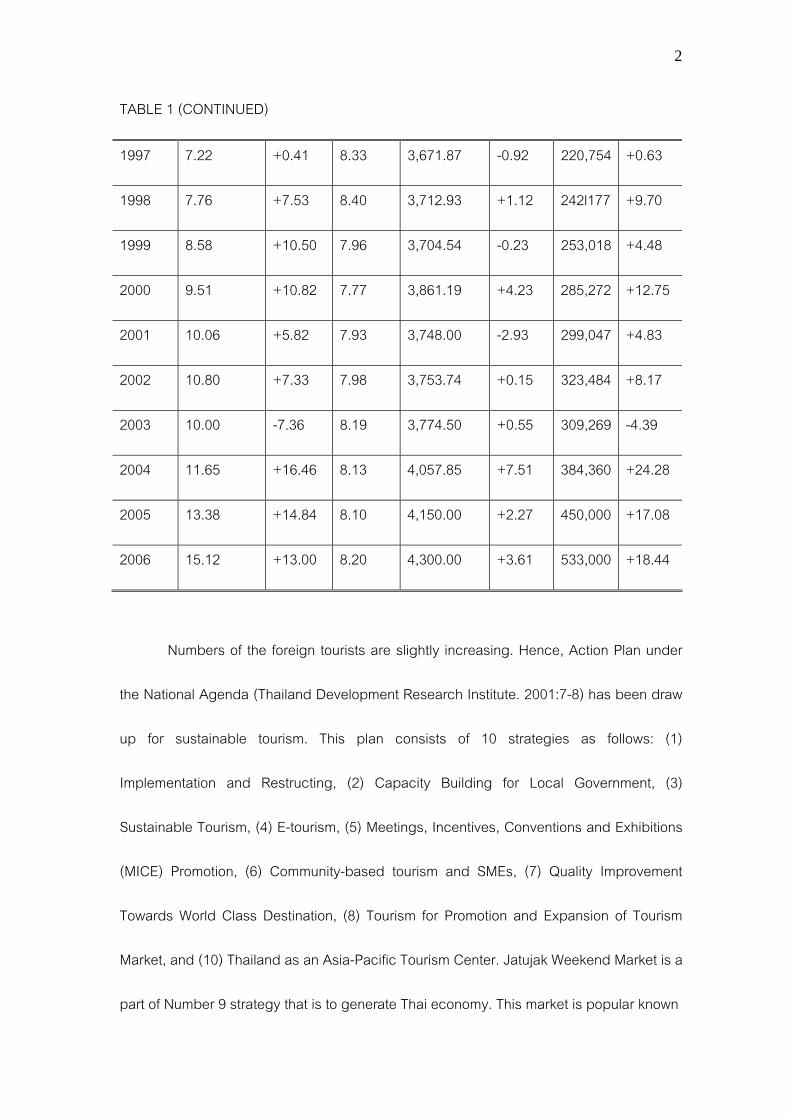
TABLE 1 (CONTINUED)
1997 7.22 +0.41 8.33 3,671.87 -0.92 220,754 +0.63
1998 7.76 +7.53 8.40 3,712.93 +1.12 242l177 +9.70
1999 8.58 +10.50 7.96 3,704.54 -0.23 253,018 +4.48
2000 9.51 +10.82 7.77 3,861.19 +4.23 285,272 +12.75
2001 10.06 +5.82 7.93 3,748.00 -2.93 299,047 +4.83
2002 10.80 +7.33 7.98 3,753.74 +0.15 323,484 +8.17
2003 10.00 -7.36 8.19 3,774.50 +0.55 309,269 -4.39
2004 11.65 +16.46 8.13 4,057.85 +7.51 384,360 +24.28
2005 13.38 +14.84 8.10 4,150.00 +2.27 450,000 +17.08
2006 15.12 +13.00 8.20 4,300.00 +3.61 533,000 +18.44
Numbers of the foreign tourists are slightly increasing. Hence, Action Plan under
the National Agenda (Thailand Development Research Institute. 2001:7-8) has been draw
up for sustainable tourism. This plan consists of 10 strategies as follows: (1)
Implementation and Restructing, (2) Capacity Building for Local Government, (3)
Sustainable Tourism, (4) E-tourism, (5) Meetings, Incentives, Conventions and Exhibitions
(MICE) Promotion, (6) Community-based tourism and SMEs, (7) Quality Improvement
Towards World Class Destination, (8) Tourism for Promotion and Expansion of Tourism
Market, and (10) Thailand as an Asia-Pacific Tourism Center. Jatujak Weekend Market is a
part of Number 9 strategy that is to generate Thai economy. This market is popular known
3
as JJ Market; it is the largest weekend market in Thailand and quite possibly the world. It
covers over 35 acres (142,000 m2) and contains upwards of 1,500 stalls. It is estimated
that the market receives between 200,000 and 300,000 visitors each day. Most stalls are
only open on Saturday and Sunday. The market offers a wide variety of products including
household items, clothing, Thai handicrafts, religious artifacts, collectibles, foods, and live
animals. Jatujak Weekend Market is adjacent to the Kampheangphet station of the mass
rapid transit (MRT) or about a 5-minute walk from the Mo Chit station (BTS). JJ Weekend
Market received its name from Jatujak Park, a public park which is situated next to the
market (Wikipedia. 2005: Online).
Jatujak weekend market is the largest market in the world. They are crowded with
visitors every weekend. It was found that the number of Thai people is sharply more than
foreign tourists. It is therefore interesting to investigate foreigners’ reacting in order to
take a serious action plan to generate foreigners’ attitudes and behaviors to help boost an
increasing number of foreign tourists in system. Because of their own unique cultures and
backgrounds, foreign tourists have different attitudes and behaviors comparing with Thai
people.
4
Research Questions
This research seeks to find answers to the two following research questions:
1. How do foreign tourists’ responses reflect Marketing Mix toward their
expenditure?
2. What influences the relations of tourists’ attitudes and their expenses
behaviors?
Purposes of the Study
This study has two main objectives:
1. To find out the relations between the marketing mix that affect their
behaviors toward their purchasing decision.
2. To analyze foreigners’ attitudes and behaviors upon their expenses
Significance of the study
This study is intended to discuss the relations between the marketing mix,
foreigners’ attitudes and behaviors toward their expenditure at Jatujak Weekend Market,
and explore foreigners’ attitudes and behaviors in order to generate their point of view.
Further, a better understanding of foreigners’ attitudes and behaviors will assist Thai
vendors to deal more effectively with the integration. The result of this study could be
implemented as recommendation for improving the qualities of the product and service at
Jatujak Weekend Market.
5
Scope of the study
This research involved all kinds of foreign tourists with different age groups
starting from age 20. The researcher selected 50 tourists randomly to answer the
questionnaire.
CHAPTER 2
REVIEW OF LITERATURE
In order to investigate the marketing mix, consumers’ attitudes and behaviors
toward foreign tourists’ expenditure at Jatujak Weekend Market in Bangkok, it is
important to understand foreigners’ attitudes and behaviors. This chapter examines the
literature related to the following:
1. The Weekend Market
2. The Marketing Mix
3. The Attitudes
4. The Consumer Behaviors
1. The Weekend Market
Thai people call the weekend market “Talat Nat Jatujak”. Talad Nat means a
market held at stated time in a specific place. Jatujak is the name of a public park
adjacent to the weekend market. Talad Nat took place in Thailand for the first time in
1948 during which the Government under the administration of Field Marshal
Pibulsonggram set a policy for all provinces to hold this type of markets for farmers to
sell their produce. It was also designed to provide people with an opportunity to buy a
wide range of products at the same place. In Bangkok Talat Nat was held each
Saturday and Sunday at Sanam Luang, a big piece of land in front of the Temple of the
Emerald Buddha and the Grand Palace. It was moved to the Saranrom Palace
7
compound for a certain period and then moved back to Sanam Luang again in 1958
(Pakaworawuth, 1990:37-38).
Characteristics Traditional Thai markets in Bangkok
Markets in Bangkok consist of day markets, night markets and floating markets
(Griffiths, 1999:98-99). Day markets are widely spread in Bangkok, but a well-known day
markets are Jatujak Weekend Market, Pratunam Market, Khong Thom Market,
Chinatown (Sampeang Market), and Padung Krung Kasem canal (Pak Khong Talad).
Pak Khlong market is a very large and busy wholesale market for fresh flowers
and vegetables. Many flower vendors throughout the city buy their stock here at night
and sell it on the following morning.
Pratunam market is situated nearby the intersection of Ratchaprarop and
Phetchaburi roads. It is very near to the Amari Watergate hotel. This is the best place in
Bangkok to buy cheap clothes, fabrics and textiles. Wholesalers and exporters buy
here, as well as individual consumers.
Night markets are at Rama 4 Road and Silom Rd., and they are known as Suan
Lum Night Bazaar, Saphan Bhut Night Market, Ratchada Night Bazarr and Patpong
Night Barzarr. Patpong night Bazarr is very popular with tourists, but there is not any real
good reason why. It was a combination of souvenirs, brand imitation items and cheap
clothes as in any tourist area in the city, but prices are way over the going rate.
Floating markets in Bangkok are a tourist attractions but it is possible to avoid
the worst commercialized markets by traveling outside the city. There are two floating
8
markets in Bangkok, the Talingchan floating markets and Khlong Bang Wiang market in
Thonburi. Moreover, the floating market which is located outside Bangkok is Damnoen
Saduak. This floating market is well worth visiting.
Fresh market Versus Supermarket
A fresh market is an outdoor space or large hall where vendors sell their goods
(Compact Oxford English Dictionary. 2006: Online). A fresh market usually offers
products at low prices by reducing margins. It provides of fresh products, clothes and
Thai handicrafts.
A supermarket is a store that sells a wide variety of food. A supermarket is larger
in size and has a wider selection than a traditional grocery store. Most supermarkets
also sell a variety of other household products that are consumed regularly (Wikipedia.
2006: Online).
There are many places to go shopping in Bangkok. The markets and large
shopping malls are spread out in Bangkok. Supermarkets are almost always the best
places to shop, but the amount of price sold is quite expensive. Nevertheless, many are
worth a visit for the experience even if foreign tourists do not plan to buy anything.
Fresh or Outdoor markets are reasonably priced, numerous, and the place to go
to for things like clothes, second hand, live animal ,Thai handicrafts and etc. which are
not available at supermarkets. Hygiene and cleanliness are also of a much lower
standard at the fresh or outdoor markets than supermarkets, but they are quicker and
more convenient if they have a lot of different items to buy.
9
The numerous large air-conditioned shopping malls and department stores are
popular places to shop, and they are the best places to find high quality merchandise
along with shops found in high-end hotels shopping arcades. In contrast with fresh or
outdoor markets like Jatujak weekend market, they have not had an air-conditioned.
They are still very popular markets because of a variety of products and services. Even
though the weather at Jatujak Weekend Market is very hot, this place is irresistible to
observe and shop.
A Charming of Jatujak Weekend Market
Jatujak Weekend Market is well-known as JJ market. This market has an
enormous section selling exotic orchids, potted plants an indoor/outdoor garden
accessories (Australian-New Zealand Women’s Group. 1994: 166). JJ Market grouped
each section as follows: Clothing and Accessories, Handicraft Product, Ceramics and
Pottery, Decorations and Furniture, Food and Beverage, Plant and Gardening tools, Art
and Gallery, Pet and Accessories, Books, Antique and Collection and Miscellaneous
and Used Clothing. JJ Market has interesting products from over Thailand as well as
things from far off lands. JJ market is also arranged an installation into zone A to P and
section 1 to 27.
2. The Marketing Mix
Kotler (1997: 92) stated that the marketing mix is the set of marketing tools that
the firm uses to pursue its marketing objectives in the target market.
The marketing mix consists of 4P’s: Product, Price, Place, and Promotion.
10
Pride and Ferrell (2003: 250) reveal that a product is goods, a service, or an idea
received in an exchange. Products which are provided at Jatujak Weekend Market are:
clothing and accessories, handicraft product, ceramics and pottery, decorations and
furniture, food and beverage, plant and gardening tools, art and gallery, pets and
accessories, books, antique and collection and also miscellaneous and used clothing.
Needham and Dransfield (1991: 77) define that price is the sum or consideration
or sacrifice for which a thing may be bought or attained. The amount of money for
buying product at Jatujak Weekend Market is between at least 5 baht to 50,000 baht.
Kotler (1997: 92) concludes that place is the various activities the company
undertakes to make the product accessible and available to target customers. The
place that mentioned earlier includes all sections, shops and land of Jatujak Weekend
Market.
Myers (1986:363) said that promotion is seen as a line function that is necessary
to get the work of the company done. These include advertising, sales promotion, and
personal selling. All vendors are involved with all kinds of those activities to encourage a
customer at Jatujak Weekend Market.
3. The Attitudes
Kotler and Armstrong (2004: 196) mention that the attitude is a person’s
consistently favorable or unfavorable evaluations, feeling, and tendencies toward an
object or idea.
11
Structural models of attitudes
To understand the relations between attitudes and behavior, the researcher have
sought to construct models that capture the dimensions of an attitude.
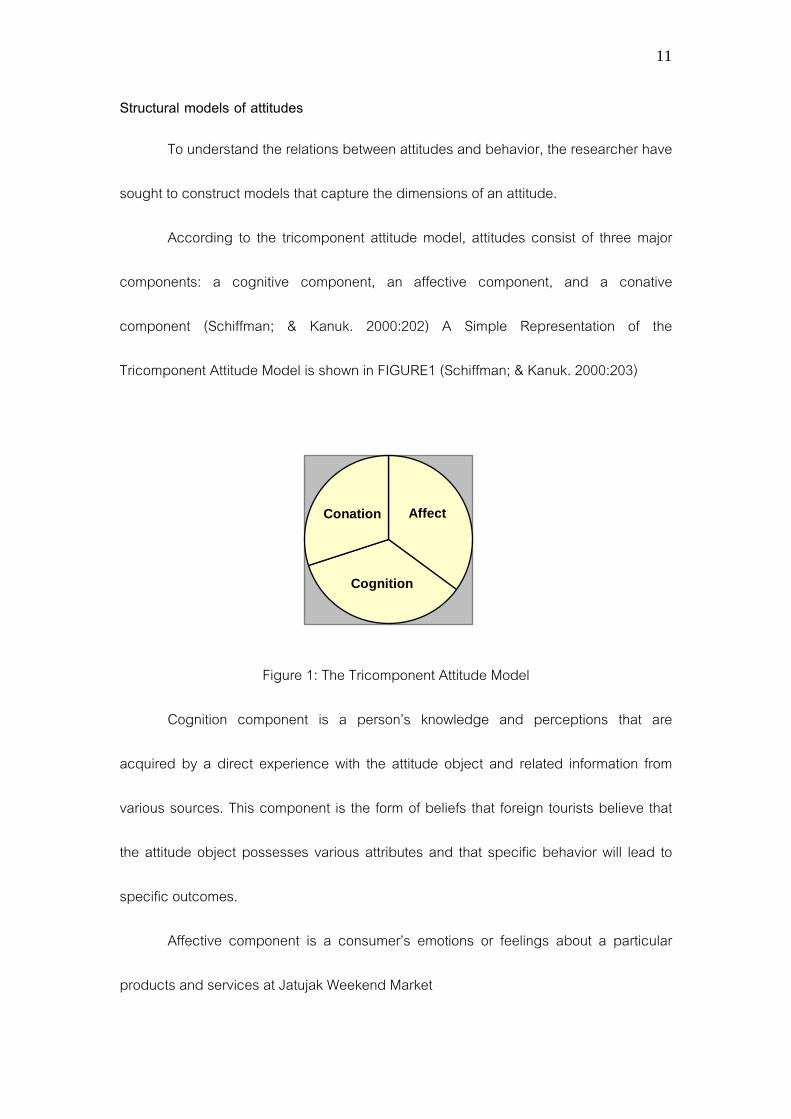
According to the tricomponent attitude model, attitudes consist of three major
components: a cognitive component, an affective component, and a conative
component (Schiffman; & Kanuk. 2000:202) A Simple Representation of the
Tricomponent Attitude Model is shown in FIGURE1 (Schiffman; & Kanuk. 2000:203)
AffectConation
Cognition
Figure 1: The Tricomponent Attitude Model
Cognition component is a person’s knowledge and perceptions that are
acquired by a direct experience with the attitude object and related information from
various sources. This component is the form of beliefs that foreign tourists believe that
the attitude object possesses various attributes and that specific behavior will lead to
specific outcomes.
Affective component is a consumer’s emotions or feelings about a particular
products and services at Jatujak Weekend Market
12
Conative component is the consumer’s intention to buy. It is also an individual
will to undertake a specific action or behave in a particular way with regard to the
attitude object. The conative component may include the actual behavior itself.
Attitude Formation
Moven ( 1993: 267) noted that attitude may be formed in two distinct ways. The
first is through direct information and hierarchy of effect (indirect formation).
Direct attitude information
Attitudes are formed directly through two mechanisms; conditioning
processes and mere exposure phenomenon.
- Conditioning Process
Attitudes may be created directly by using pleasing
pictures, such as a mountain waterfall or the sight of people communicating with friends
and their loved ones which is the stimulus that elicits the positive feelings. Also, attitudes
can be resulted from the positive and negative responses which act to reinforce or
punish the individual’s evaluation.
- Mere Exposure Effects
Another method through which positive feelings may be
formed is through repeated exposures with a stimulus. In short, the positive feelings
created from repeated exposures can occur without the person consciously knowing or
perceiving that the object is familiar. In contrast, the negative feelings could be created
from the exposure of negative stimulus (Moven. 1993: 270).
13
Indirect Formation (Hierarchies of effects) The term hierarchies of effects are
developed to explain the term in which attitude and behavior occur. However, this study
proposes only three major hierarchies which are: the high-involvement hierarchy, the
low-involvement hierarchy, and the experiential hierarchy.
- High-involvement Hierarchy The high-involvement hierarchy
is “a think before you act” hierarchy that people’s belief about objects occur first. Next,
people develop feeling toward the object. Finally, people engage in some behavior
relative to the object. To clarify this point, Moven (1993: 272) states that high-
involvement circumstances, it makes sense that consumers should first investigate a
product in order to learn about its characteristics. Based upon this information, they
evaluate it and form feeling and attitudes. If attitudes are positive, they may then
purchase the product.
- Low-involvement Hierarchy In low-involvement situations,
attitudes tend to occur after the behavior and the consumer reflects on how he or she
feels about it. It is through product or service used that attitudes are formed in low
involvement situations. When consumers have low involvement in decision, they tend to
engage in limited problem solving and move through low-involvement hierarchies that
consisting of belief’s formation, then behavior; and finally attitude formation. As a matter
of fact, attitude does not predict behavior because well-defined attitudes do not
generally precede behavior in this hierarchy (Asseal. 1998: 286).
14
- Experiential Hierarchy From the experiential perspective,
consumers may be viewed as engaging in behavior because of a strong desire to
obtain feelings or excitement. This can begin with a strong affective response. Behavior
follows the strong feelings. Finally, beliefs are developed in part to justify the behavior
(Asseal. 1998: 287).
Factors Influencing Attitudes in Predicting Behavior
Through the wide range the controversy about the ability of attitudes to predict
overt behavior, the theory of reasoned action proposes the two factors found to
influence the extent to which attitudes predict behaviors.
Intention to behave The theory of reasoned action proposes the idea that
a good predictor of behavior occur when the measurement of attitudes correspond to
the intention to behave. For example, if the behavior involves playing sports, the
question should mention to a specific kinds of actions, such as “Are you going to play
tennis?”, instead of asking broad areas of behavior like “Do you want to be fitter?”
Moreover, Moven (1993:280) suggests that the measure should include the time
parameter. The longer the time between attitude measurement and the time of the
behavior; the weaker the relation is.
15
Social pressure The desires of other people toward the purchase and the
consumer’s motivation to comply with these desires can play a significant role on
influencing the extent to which attitudes predict behavior. In other words, a person’s
intention to do something is founded on whether he or she has positive or negative
towards the behavior and whether or not that behavior is approved of by other people
approval.
In summary, the theory of reasoned action identifies the major factors influence
attitude predicting behavior. The first factor includes the intention to behave involving
the measurement of attitude corresponding to the intention to behave. The second factor
includes social pressure that results from the desire of other people toward the
purchase.
4. The Consumer Behaviors
Hawkins; Best and Coney (2001:7) view the consumer behavior as the
study of individuals, groups, or organizations and the processes they use to select,
secure, use, and dispose of products, services, experiences, or ideas to satisfy needs
and the impacts that these processes have on the consumer and society.
Hoyer and Maclnnis (2004:3) found that consumer behavior is the totality
of consumers’ decisions with respect to the acquisition, consumption, and disposition of
goods, services, time, and ideas by people over time.
16
Consumer decision making
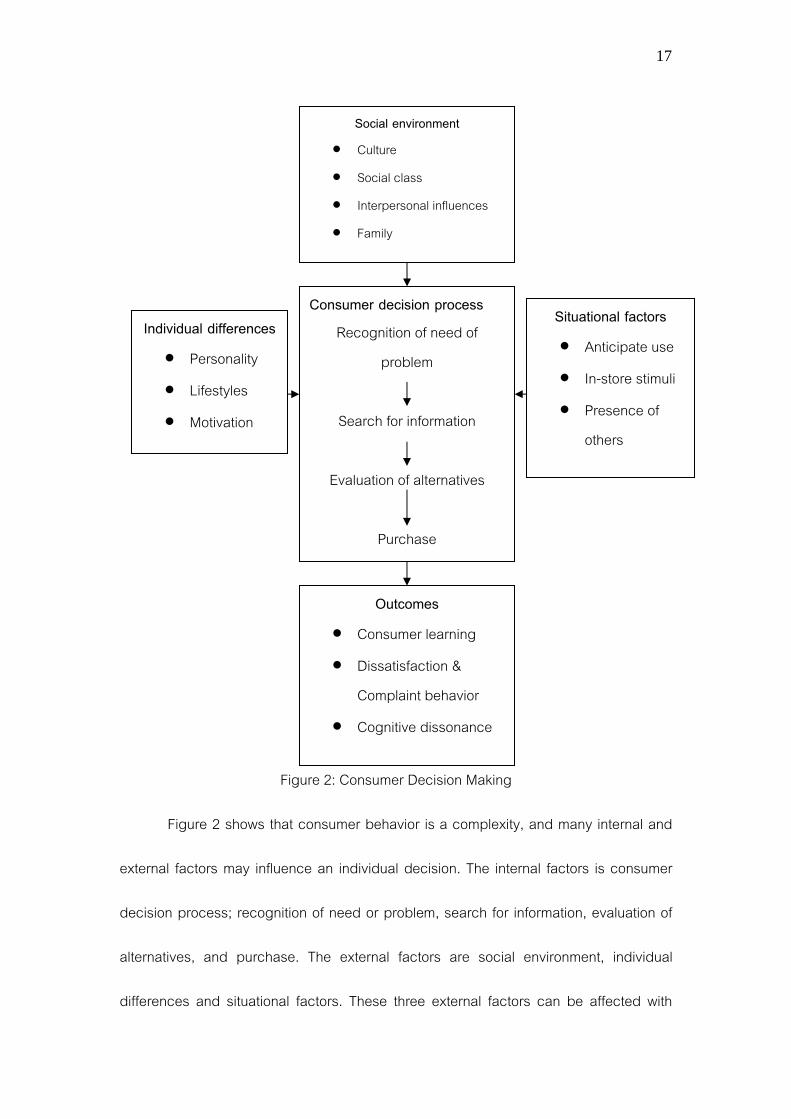
Bearden; Ingram and Laforge (1995: 108) conclude that a general model of
consumer decision making and influences assumes a conscious and logical decision-
making process: from recognition of a need or problem to information search to
evaluation of alternatives, and purchase. The figure of the consumer decision making is
below.
17
Social environment • Culture • Social class • Interpersonal influences • Family
Consumer decision process
Figure 2: Consumer Decision Making
Figure 2 shows that consumer behavior is a complexity, and many internal and
external factors may influence an individual decision. The internal factors is consumer
decision process; recognition of need or problem, search for information, evaluation of
alternatives, and purchase. The external factors are social environment, individual
differences and situational factors. These three external factors can be affected with
Situational factors Individual differences Recognition of need of problem
• Anticipate use • Personality • In-store stimuli • Lifestyles • Presence of
others Search for information
Evaluation of alternatives
Purchase
• Motivation
Outcomes • Consumer learning • Dissatisfaction &
Complaint behavior • Cognitive dissonance
18
consumer decision process and then becoming an outcomes.
The social environment directly affects an information consumer’s use in
decision making and product evaluations. This factor includes culture, subculture, social
class, family, and interpersonal or reference group.
The individual differences can influence consumer behavior. It includes
personality, lifestyle and motivation. Foreign tourists come from different background,
personality and psychographics. Therefore, this factor should be enhanced to satisfy
consumer’ needs and the motivations that generate them.
The situational factors involve purchases for a special occasion, time pressures,
unexpected expenses, and changed plan. This situational factor likely happens at
Jatujak Weekend Market because of the retail environment, atmospherics, location, the
assistance of Thai vendors, and in-store stimuli.
Consumer behavior outcomes consist of consumer learning, dissatisfaction and
complaint behavior, and cognitive dissonance. Consumer behavior does not end at
purchase if the products or services are dissatisfaction. Foreign tourists will learn from
their disappointment. Further, cognitive dissonance may occur over major choices, such
as expensive furniture, decoration, appliances.
CHAPTER 3
METHODOLOGY
There are two types of data: primary and secondary data. The primary data
came from a questionnaire distributed to fifty foreign tourists at Jatujak Weekend Market
in Bangkok. The secondary data were collected from books, textbooks, brochure and
internet.
Primary data
Population
The population in this study consisted of fifty foreign tourists who shopped at
Jatujak Weekend Market and were selected randomly to answer the questionnaires
regarding their attitudes and behaviors toward Jatujak Weekend Market.
Research tool
The research tool employed in this study was a questionnaire which had closed
and open-ended questions.
The questionnaire was consisted of 4 parts as follows:
Part 1: Personal Data
Part 2: Foreign tourists’ attitudes toward the Marketing mix
Part 3: Foreign tourists’ attitudes toward their expenditure at Jatujak
Weekend Market
Part 4: Foreign tourists’ behaviors toward their expenditure at Jatujak
Weekend Market
20
Data collection
The questionnaires were distributed to respondents in the middle of May 2006.
Fifty questionnaires were returned by the end of June 2006.
Secondary data
Secondary data came from a review of related research, books, textbook,
brochure, and Internet.
Data analysis
Data gathered from the questionnaires were examined and analyzed in line with
the research questions. Percentage was used for calculating and analyzing in tables
with a descriptive analysis. Base on the data collected, the researcher determined their
attitudes of the fifty foreign tourists’ at Jatujak Weekend Market in Bangkok toward their
expenditure, related studies and literatures are used descriptively to describe the
findings. The findings, conclusion, discussion, and recommendations for further study
are included in the following Chapter 4 and 5.
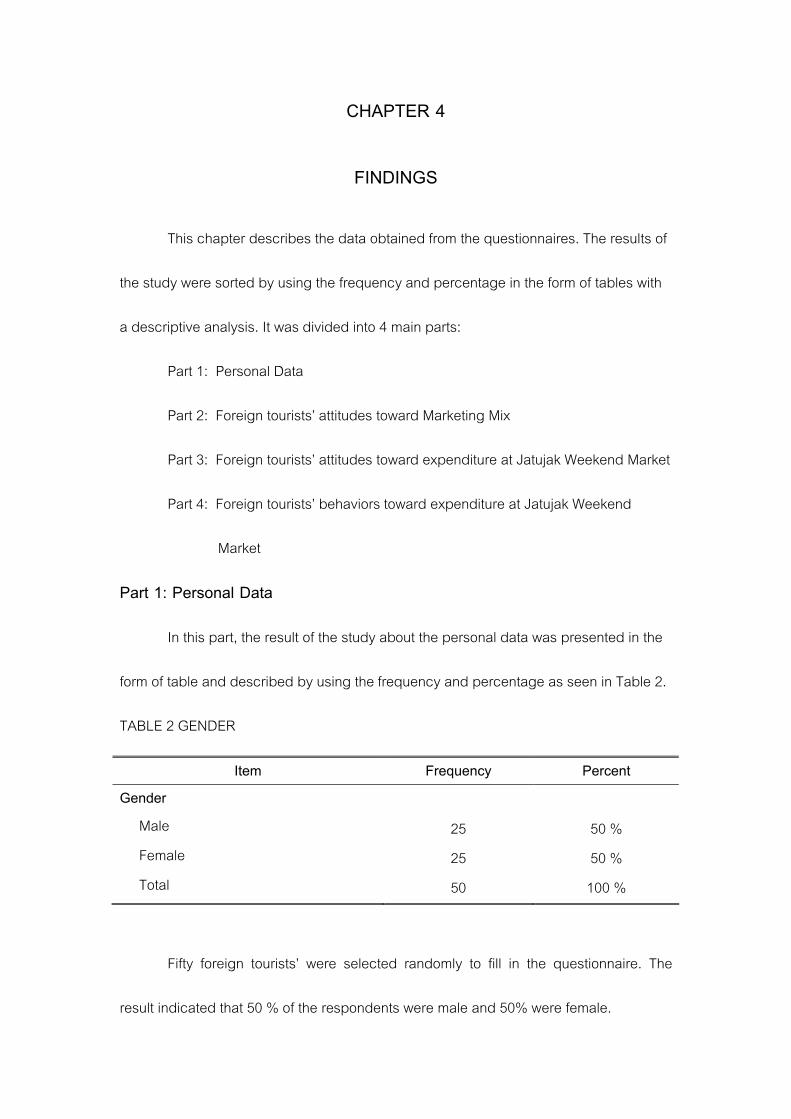
CHAPTER 4
FINDINGS
This chapter describes the data obtained from the questionnaires. The results of
the study were sorted by using the frequency and percentage in the form of tables with
a descriptive analysis. It was divided into 4 main parts:
Part 1: Personal Data
Part 2: Foreign tourists’ attitudes toward Marketing Mix
Part 3: Foreign tourists’ attitudes toward expenditure at Jatujak Weekend Market
Part 4: Foreign tourists’ behaviors toward expenditure at Jatujak Weekend
Market
Part 1: Personal Data
In this part, the result of the study about the personal data was presented in the
form of table and described by using the frequency and percentage as seen in Table 2.
TABLE 2 GENDER
Item Frequency Percent Gender Male Female Total
25 25 50
50 % 50 %
100 %
Fifty foreign tourists’ were selected randomly to fill in the questionnaire. The
result indicated that 50 % of the respondents were male and 50% were female.
22
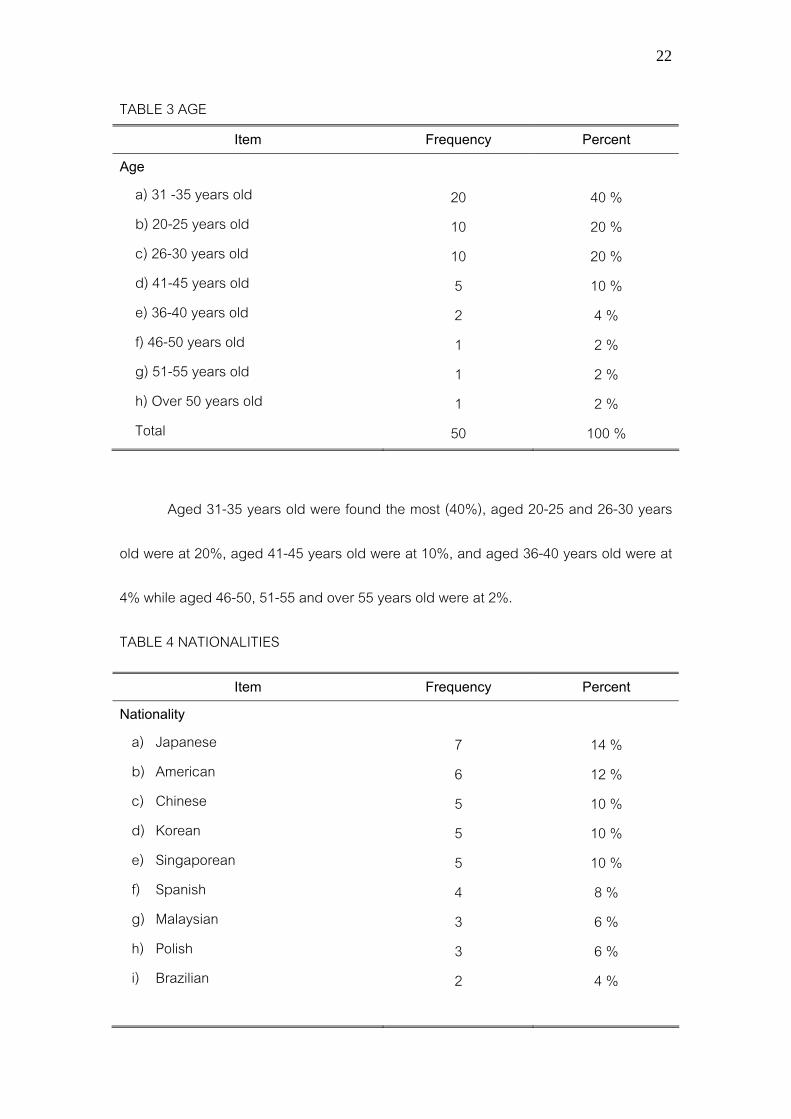
TABLE 3 AGE Item Frequency Percent
Age a) 31 -35 years old b) 20-25 years old c) 26-30 years old d) 41-45 years old e) 36-40 years old f) 46-50 years old g) 51-55 years old h) Over 50 years old Total
20 10 10 5 2 1 1 1
50
40 % 20 % 20 % 10 % 4 % 2 % 2 % 2 %
100 %
Aged 31-35 years old were found the most (40%), aged 20-25 and 26-30 years
old were at 20%, aged 41-45 years old were at 10%, and aged 36-40 years old were at
4% while aged 46-50, 51-55 and over 55 years old were at 2%.
TABLE 4 NATIONALITIES
Item Frequency Percent Nationality
a) Japanese b) American c) Chinese d) Korean e) Singaporean f) Spanish g) Malaysian h) Polish i) Brazilian
7 6 5 5 5 4 3 3 2
14 % 12 % 10 % 10 % 10 % 8 % 6 % 6 % 4 %
23
TABLE 4 NATIONALITIES (CONTINUED)
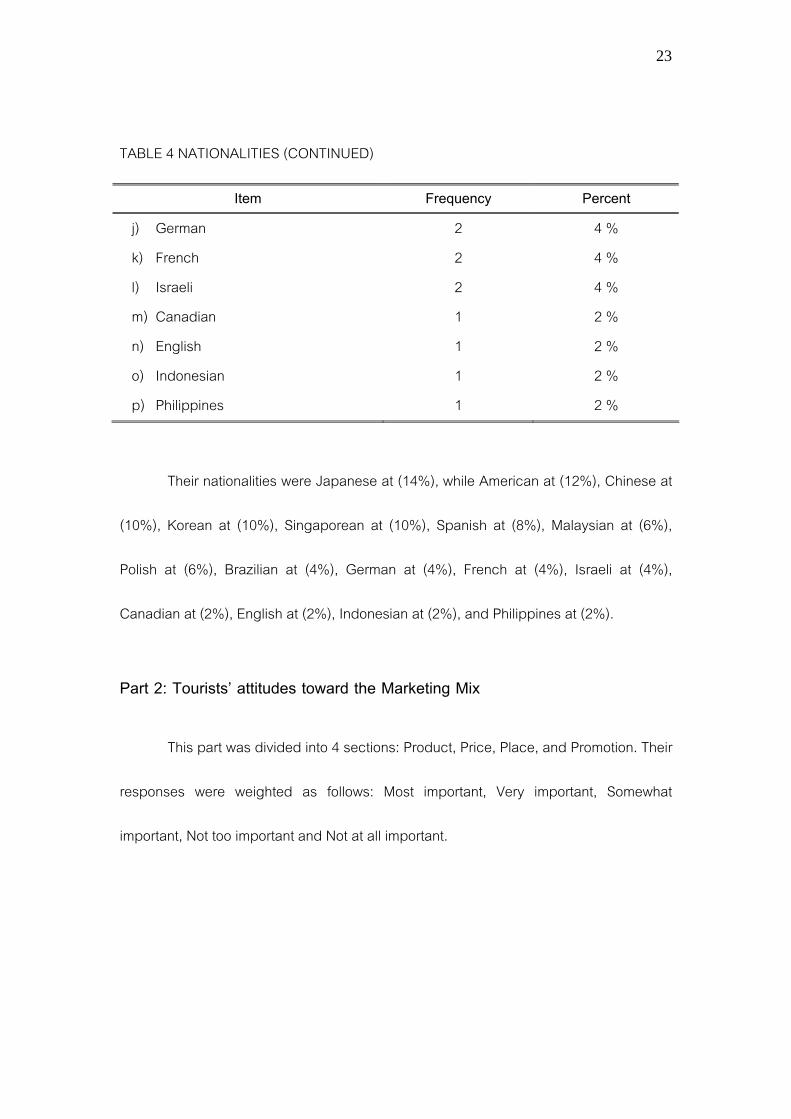
Item Frequency Percent j) German k) French l) Israeli m) Canadian n) English o) Indonesian p) Philippines
2 2 2 1 1 1 1
4 % 4 % 4 % 2 % 2 % 2 % 2 %
Their nationalities were Japanese at (14%), while American at (12%), Chinese at
(10%), Korean at (10%), Singaporean at (10%), Spanish at (8%), Malaysian at (6%),
Polish at (6%), Brazilian at (4%), German at (4%), French at (4%), Israeli at (4%),
Canadian at (2%), English at (2%), Indonesian at (2%), and Philippines at (2%).
Part 2: Tourists’ attitudes toward the Marketing Mix
This part was divided into 4 sections: Product, Price, Place, and Promotion. Their
responses were weighted as follows: Most important, Very important, Somewhat
important, Not too important and Not at all important.
24
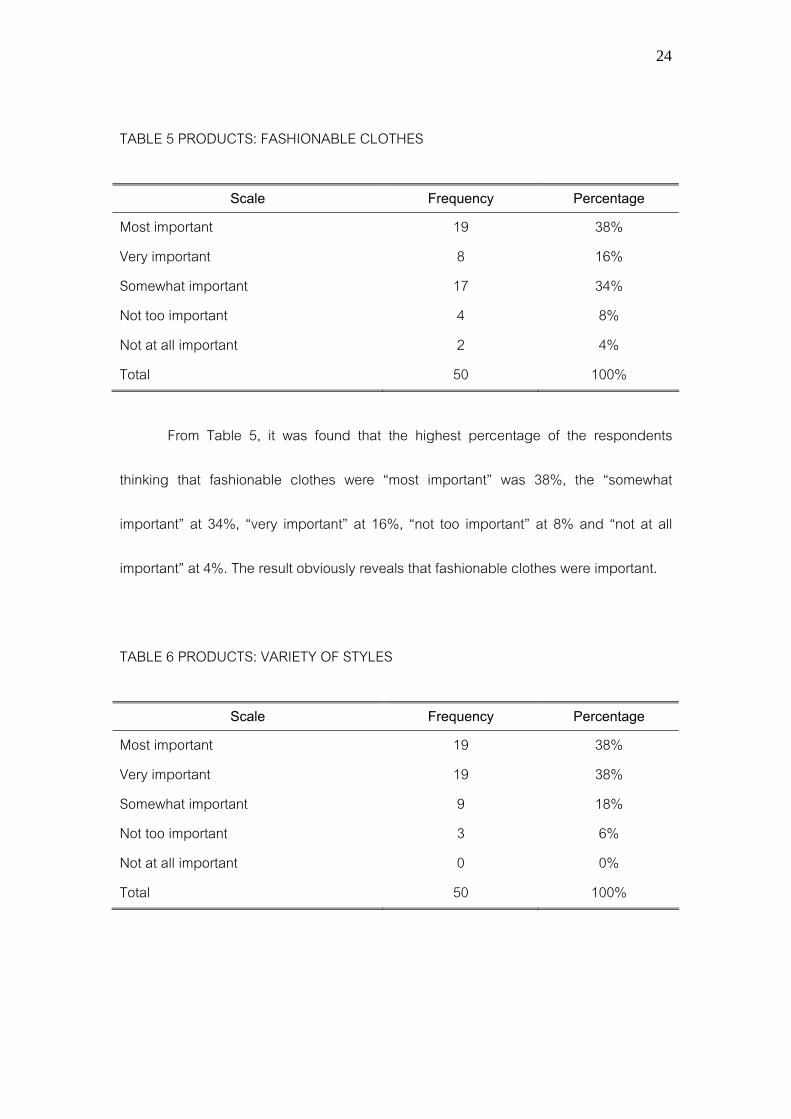
TABLE 5 PRODUCTS: FASHIONABLE CLOTHES
Scale Frequency Percentage Most important Very important Somewhat important Not too important Not at all important Total
19 8 17 4 2 50
38% 16% 34% 8% 4%
100% From Table 5, it was found that the highest percentage of the respondents
thinking that fashionable clothes were “most important” was 38%, the “somewhat
important” at 34%, “very important” at 16%, “not too important” at 8% and “not at all
important” at 4%. The result obviously reveals that fashionable clothes were important.
TABLE 6 PRODUCTS: VARIETY OF STYLES
Scale Frequency Percentage Most important Very important Somewhat important Not too important Not at all important Total
19 19 9 3 0 50
38% 38% 18% 6% 0%
100%
25
According to Table 6, the highest percentage of the respondents thinking that
variety of styles were “most important” and “very important” was the same at 38%,
“somewhat important” at 18% and “not too important” at 6%. The result reveals that most
of the respondents believed that they perceived various styles of products.
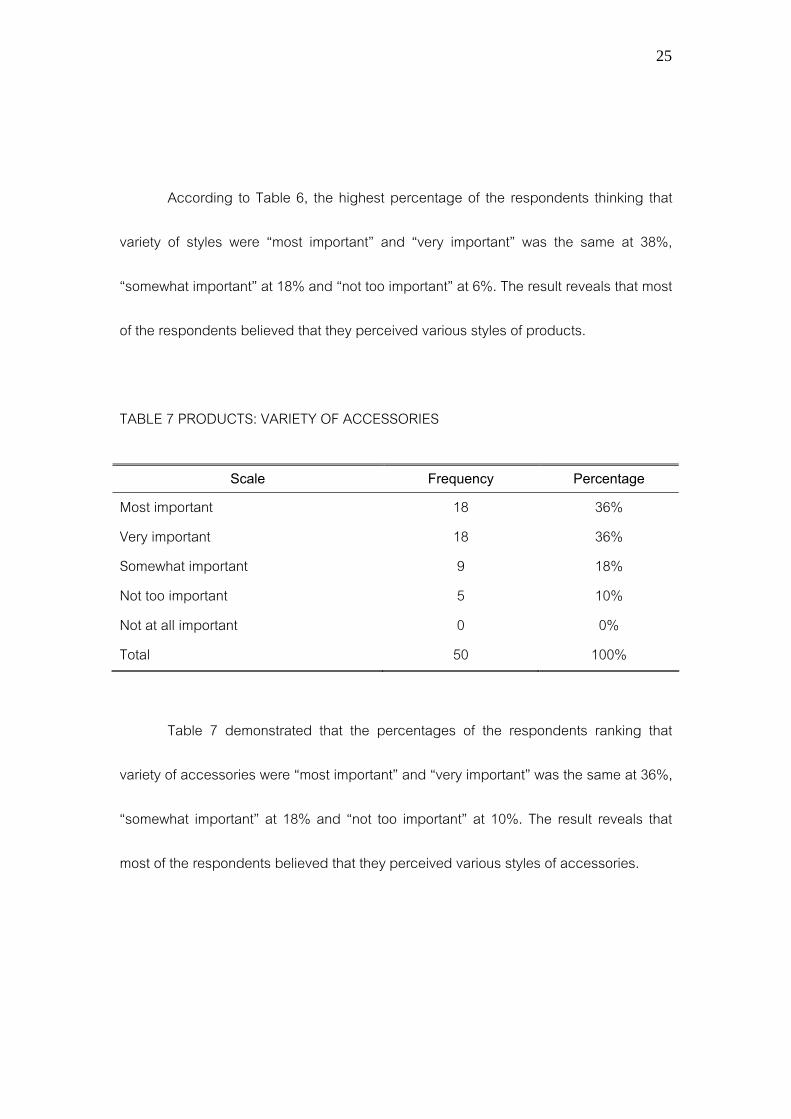
TABLE 7 PRODUCTS: VARIETY OF ACCESSORIES
Scale Frequency Percentage Most important Very important Somewhat important Not too important Not at all important Total
18 18 9 5 0 50
36% 36% 18% 10% 0%
100%
Table 7 demonstrated that the percentages of the respondents ranking that
variety of accessories were “most important” and “very important” was the same at 36%,
“somewhat important” at 18% and “not too important” at 10%. The result reveals that
most of the respondents believed that they perceived various styles of accessories.
26
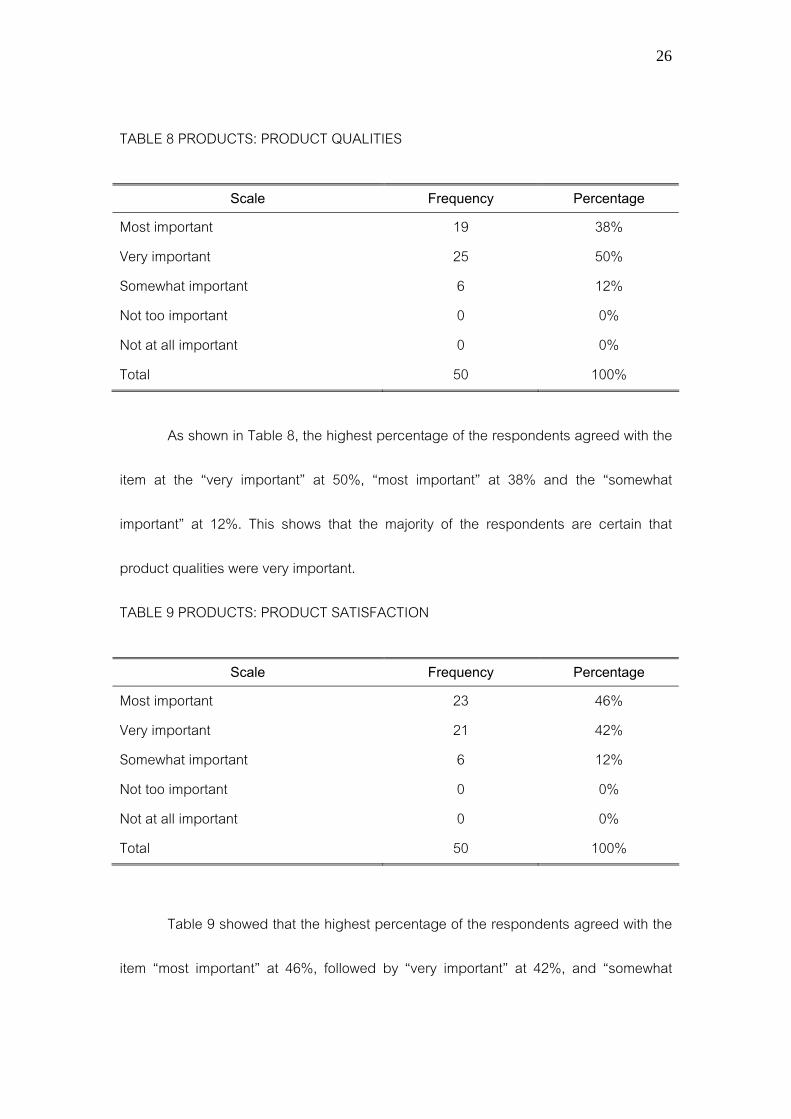
TABLE 8 PRODUCTS: PRODUCT QUALITIES
Scale Frequency Percentage Most important Very important Somewhat important Not too important Not at all important Total
19 25 6 0 0 50
38% 50% 12% 0% 0%
100% As shown in Table 8, the highest percentage of the respondents agreed with the
item at the “very important” at 50%, “most important” at 38% and the “somewhat
important” at 12%. This shows that the majority of the respondents are certain that
product qualities were very important.
TABLE 9 PRODUCTS: PRODUCT SATISFACTION
Scale Frequency Percentage Most important Very important Somewhat important Not too important Not at all important Total
23 21 6 0 0 50
46% 42% 12% 0% 0%
100%
Table 9 showed that the highest percentage of the respondents agreed with the
item “most important” at 46%, followed by “very important” at 42%, and “somewhat
27
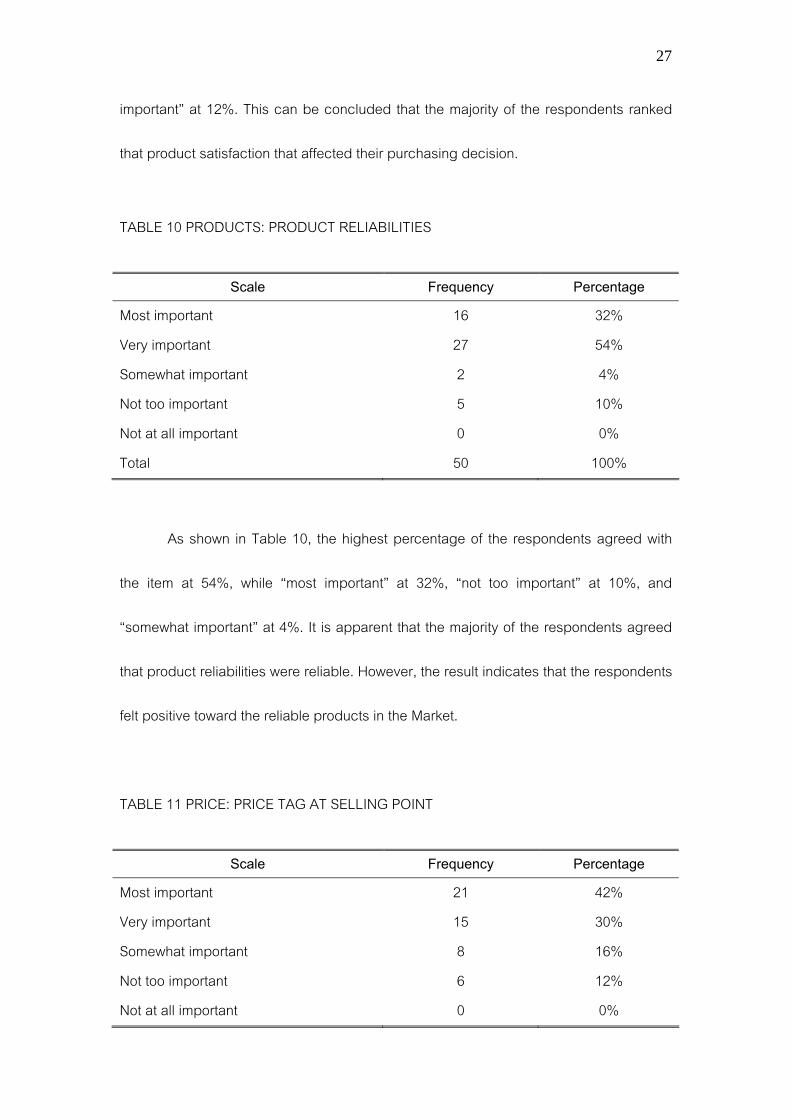
important” at 12%. This can be concluded that the majority of the respondents ranked
that product satisfaction that affected their purchasing decision.
TABLE 10 PRODUCTS: PRODUCT RELIABILITIES
Scale Frequency Percentage Most important Very important Somewhat important Not too important Not at all important Total
16 27 2 5 0 50
32% 54% 4% 10% 0%
100%
As shown in Table 10, the highest percentage of the respondents agreed with
the item at 54%, while “most important” at 32%, “not too important” at 10%, and
“somewhat important” at 4%. It is apparent that the majority of the respondents agreed
that product reliabilities were reliable. However, the result indicates that the respondents
felt positive toward the reliable products in the Market.
TABLE 11 PRICE: PRICE TAG AT SELLING POINT
Scale Frequency Percentage Most important Very important Somewhat important Not too important Not at all important
21 15 8 6 0
42% 30% 16% 12% 0%

28
Total 50 100% As seen in Table 11, it was found that the highest percentage of the respondents
agreed with the item at 42%, while “very important” at 30%, “somewhat important” at
16%, and “not too important” at 12%. The result reveals that the majority of the
respondents feel look at the price tag as part of their decision making.
TABLE 12: PRICE: BARGAINING PRICES
Scale Frequency Percentage Most important Very important Somewhat important Not too important Not at all important Total
17 16 13 4 0 50
34% 32% 26% 8% 0%
100%
According to Table 12, the highest percentage of the respondents agreed with
the item “most important” at 34%, “very important” at 32%, “somewhat important” at
26%, and “not too important” at 8%. The result reveals that the majority of the
respondents strongly believe that bargaining prices were most important to them.
TABLE 13: PLACE: SERVICE OF DELIVERY
Scale Frequency Percentage Most important Very important Somewhat important Not too important Not at all important
13 22 11 4 0
26% 44% 22% 8% 0%
29
Total 50 100%
From Table 13, it was apparent that the highest percentage of the respondents
agreed that “very important” at 44%, “most important” at 26%, “somewhat important” at
22%, and “not too important” at 8%. Therefore, it can be concluded that the majority of
the respondents positively believe that delivering service was very important.
TABLE 14: PLACE: PRODUCT DISTRIBUTION
Scale Frequency Percentage Most important Very important Somewhat important Not too important Not at all important Total
7 22 18 3 0 50
14% 44% 36% 6% 0%
100% As seen in Table 14, the highest percentage of the respondents agreed with the
item “very important” at 44%, “somewhat important” at 36%, “most important” at 14%,
and “not too important” at 6%. This shows that the majority of the respondents felt
moderately with the item. However, the result indicates that the respondents feel positive
towards the product display as shown in Table 14.
30
TABLE 15: PLACE: STORE’S ATMOSPHERE
Scale Frequency Percentage Most important Very important Somewhat important Not too important Not at all important Total
18 15 15 2 0 50
36% 30% 30% 4% 0%
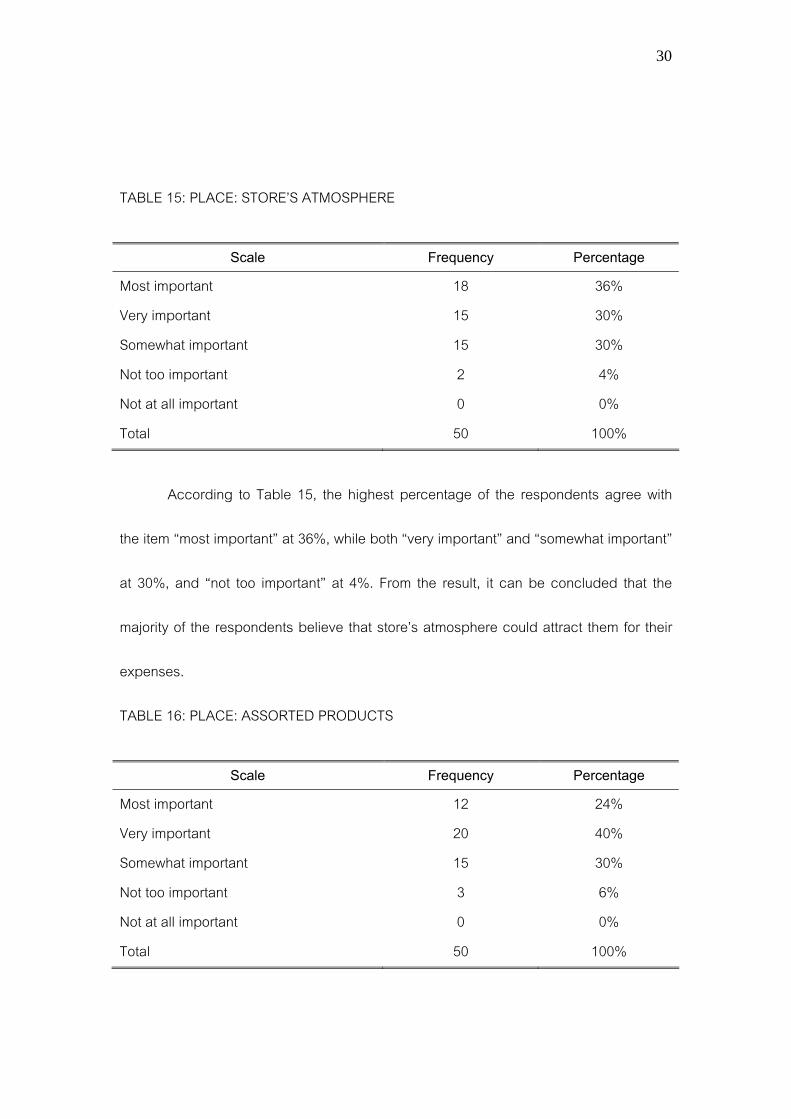
100% According to Table 15, the highest percentage of the respondents agree with
the item “most important” at 36%, while both “very important” and “somewhat important”
at 30%, and “not too important” at 4%. From the result, it can be concluded that the
majority of the respondents believe that store’s atmosphere could attract them for their
expenses.
TABLE 16: PLACE: ASSORTED PRODUCTS
Scale Frequency Percentage Most important Very important Somewhat important Not too important Not at all important Total
12 20 15 3 0 50
24% 40% 30% 6% 0%
100%
31
As shown in Table 16, the highest percentage of the respondents agreed with
the item “very important” at 40%, while “somewhat important” at 30%, “most important”
at 24%, and “not too important” at 6%. The result indicates that the majority of the
respondents believe that assorted products were very important.
TABLE 17: PLACE: TRANSPORTATION CONVENIENCES
Scale Frequency Percentage Most important Very important Somewhat important Not too important Not at all important Total
17 16 14 2 1 50
34% 32% 28% 4% 2%
100%
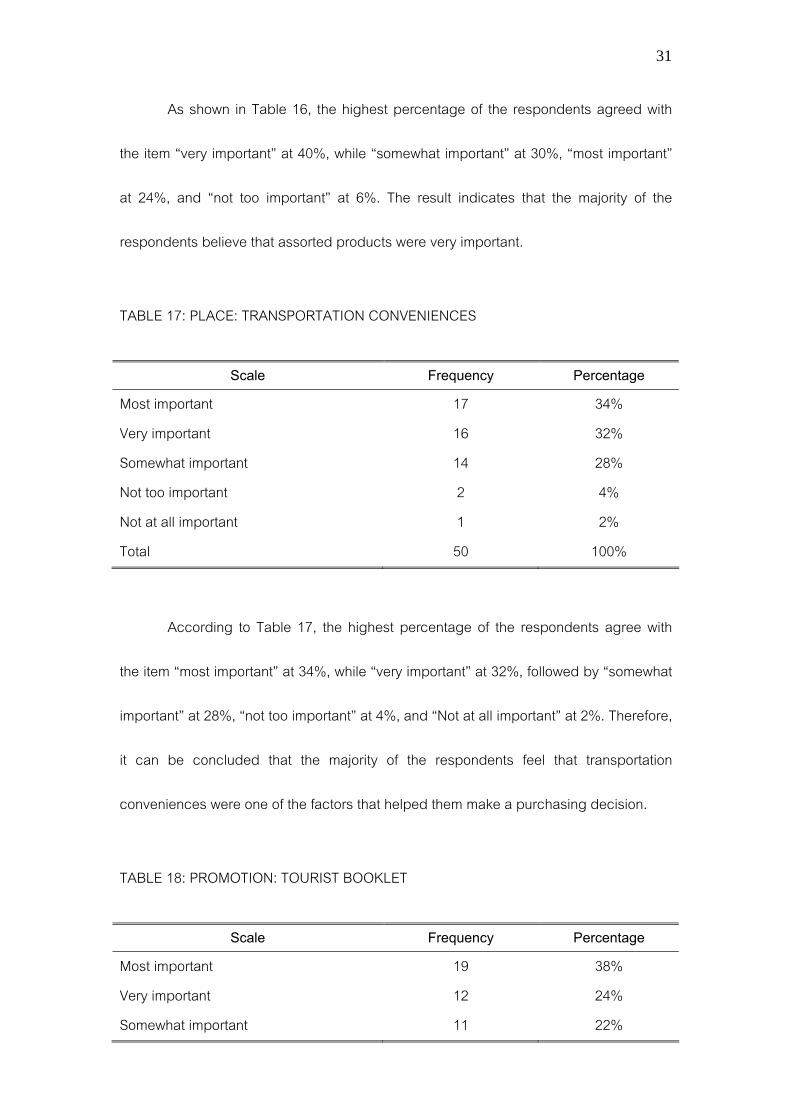
According to Table 17, the highest percentage of the respondents agree with
the item “most important” at 34%, while “very important” at 32%, followed by “somewhat
important” at 28%, “not too important” at 4%, and “Not at all important” at 2%. Therefore,
it can be concluded that the majority of the respondents feel that transportation
conveniences were one of the factors that helped them make a purchasing decision.
TABLE 18: PROMOTION: TOURIST BOOKLET
Scale Frequency Percentage Most important Very important Somewhat important
19 12 11
38% 24% 22%
32
Not too important Not at all important Total
6 2 50
12% 4%
100% From Table 18, it was apparent that the highest percentage of the respondents
agreed with the item “most important” at 38%, while “very important” at 24%, followed by
“somewhat important” at 22%, “not too important” at 12%, and “not at all important” at
4%. The result reveals that most respondents felt that tourist booklet was the most
important to them because it is easily to lead them to the store that they planned.
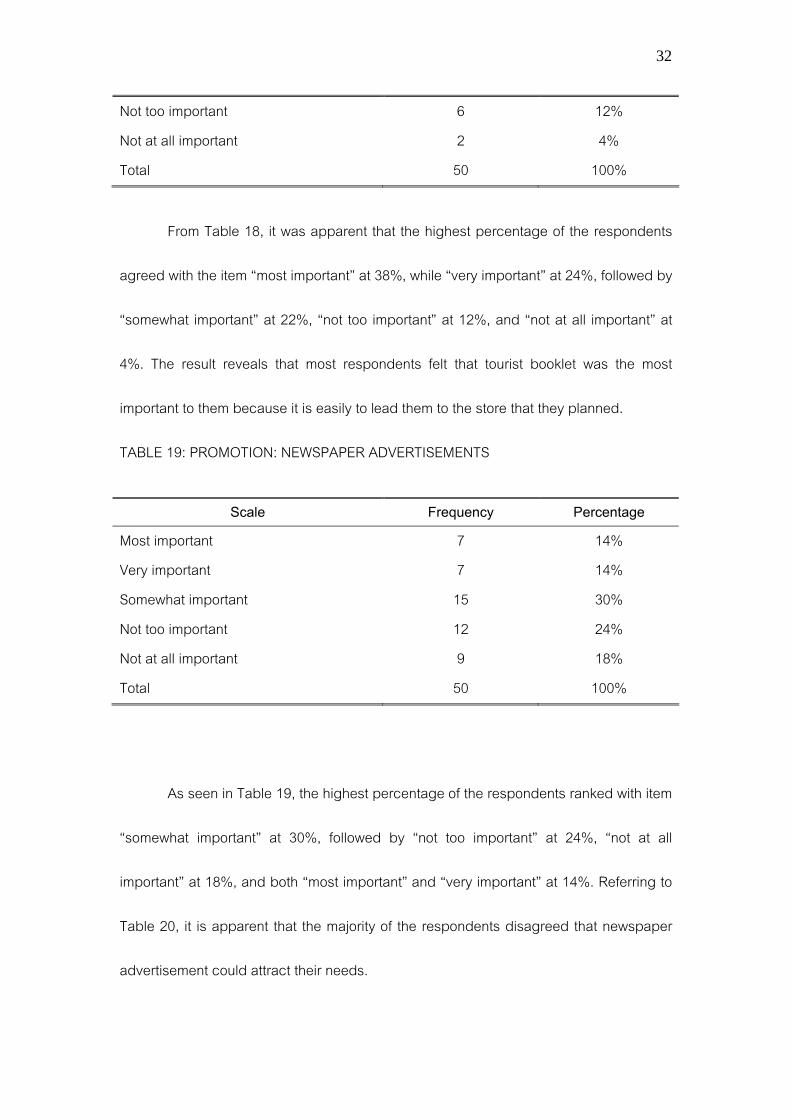
TABLE 19: PROMOTION: NEWSPAPER ADVERTISEMENTS
Scale Frequency Percentage Most important Very important Somewhat important Not too important Not at all important Total
7 7 15 12 9 50
14% 14% 30% 24% 18%
100%
As seen in Table 19, the highest percentage of the respondents ranked with item
“somewhat important” at 30%, followed by “not too important” at 24%, “not at all
important” at 18%, and both “most important” and “very important” at 14%. Referring to
Table 20, it is apparent that the majority of the respondents disagreed that newspaper
advertisement could attract their needs.
33
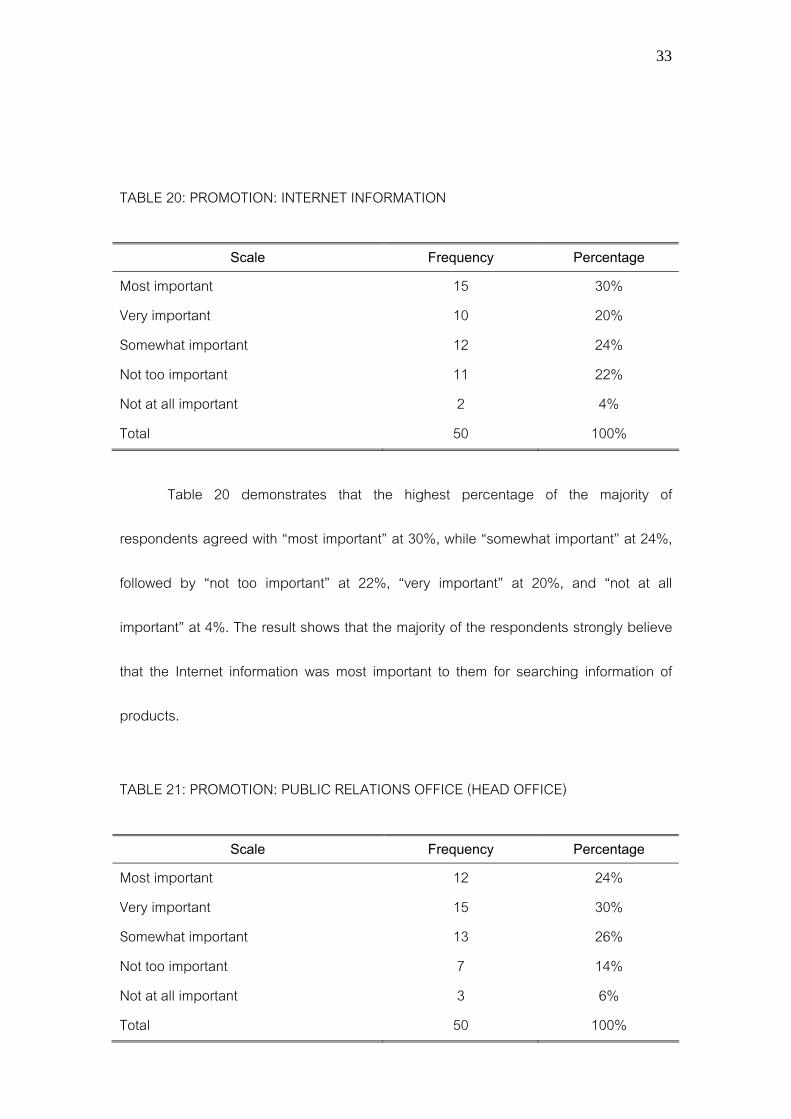
TABLE 20: PROMOTION: INTERNET INFORMATION
Scale Frequency Percentage Most important Very important Somewhat important Not too important Not at all important Total
15 10 12 11 2 50
30% 20% 24% 22% 4%
100% Table 20 demonstrates that the highest percentage of the majority of
respondents agreed with “most important” at 30%, while “somewhat important” at 24%,
followed by “not too important” at 22%, “very important” at 20%, and “not at all
important” at 4%. The result shows that the majority of the respondents strongly believe
that the Internet information was most important to them for searching information of
products.
TABLE 21: PROMOTION: PUBLIC RELATIONS OFFICE (HEAD OFFICE)
Scale Frequency Percentage Most important Very important Somewhat important Not too important Not at all important Total
12 15 13 7 3 50
24% 30% 26% 14% 6%
100%
34
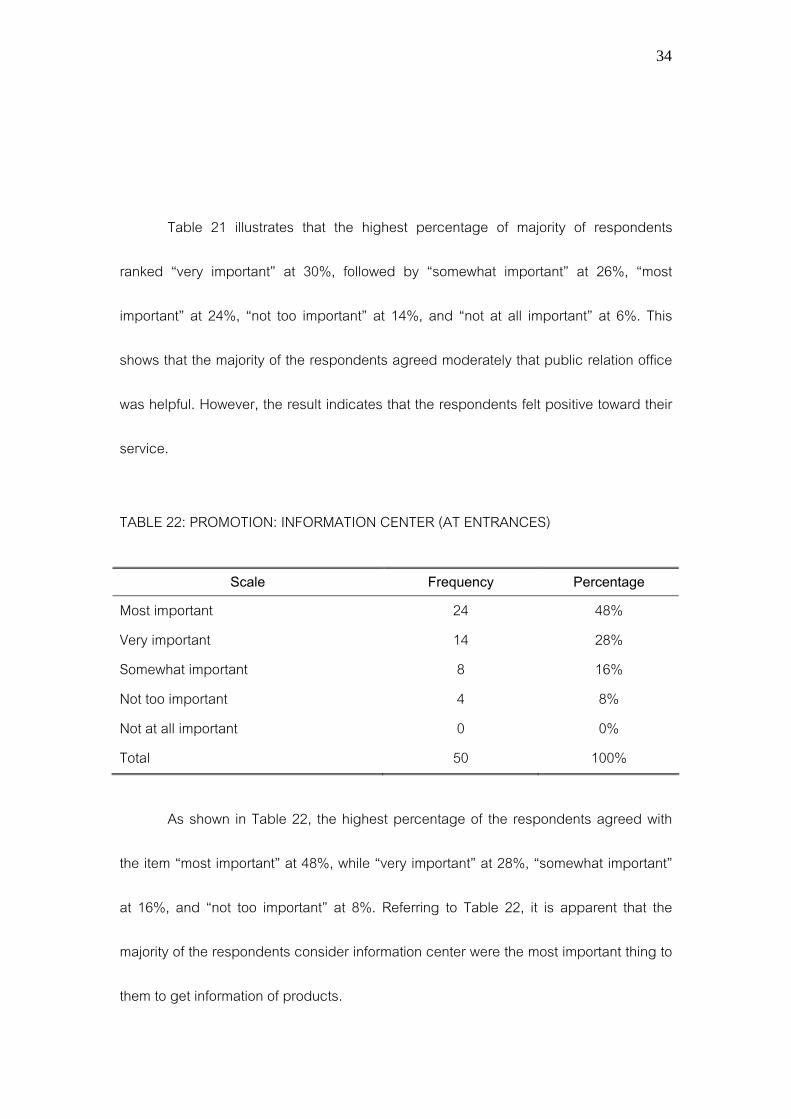
Table 21 illustrates that the highest percentage of majority of respondents
ranked “very important” at 30%, followed by “somewhat important” at 26%, “most
important” at 24%, “not too important” at 14%, and “not at all important” at 6%. This
shows that the majority of the respondents agreed moderately that public relation office
was helpful. However, the result indicates that the respondents felt positive toward their
service.
TABLE 22: PROMOTION: INFORMATION CENTER (AT ENTRANCES)
Scale Frequency Percentage Most important Very important Somewhat important Not too important Not at all important Total
24 14 8 4 0 50
48% 28% 16% 8% 0%
100% As shown in Table 22, the highest percentage of the respondents agreed with
the item “most important” at 48%, while “very important” at 28%, “somewhat important”
at 16%, and “not too important” at 8%. Referring to Table 22, it is apparent that the
majority of the respondents consider information center were the most important thing to
them to get information of products.
35
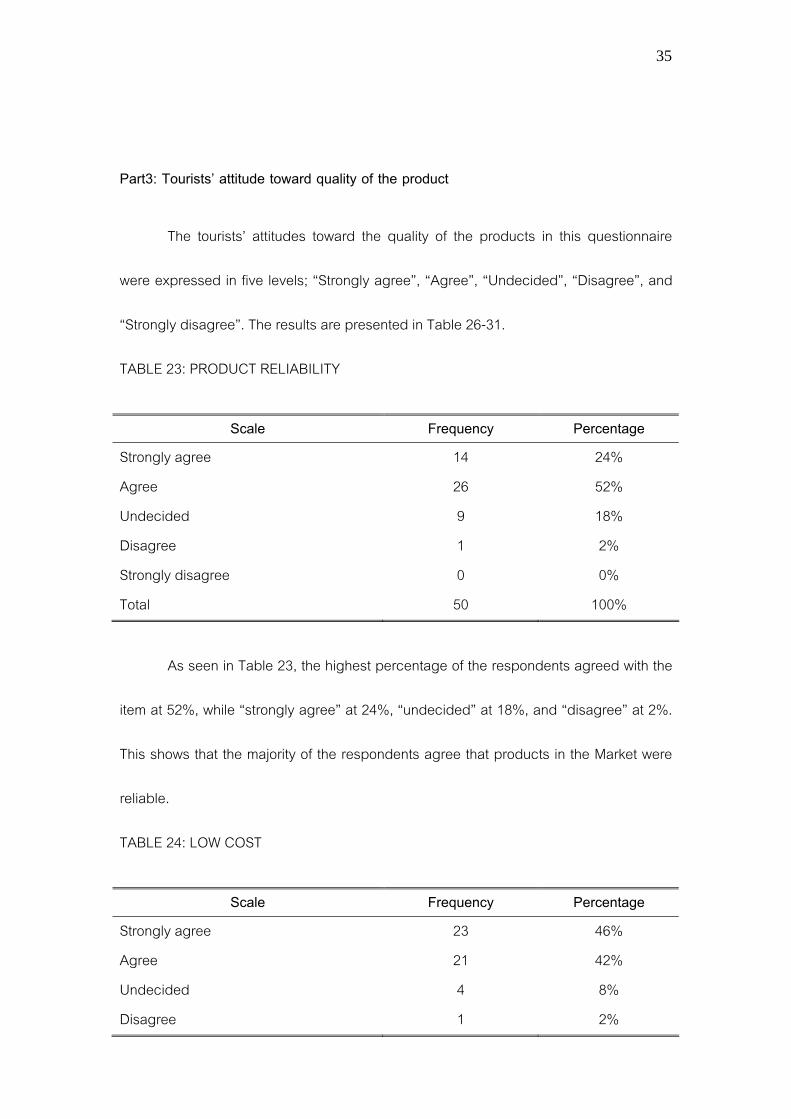
Part3: Tourists’ attitude toward quality of the product The tourists’ attitudes toward the quality of the products in this questionnaire
were expressed in five levels; “Strongly agree”, “Agree”, “Undecided”, “Disagree”, and
“Strongly disagree”. The results are presented in Table 26-31.
TABLE 23: PRODUCT RELIABILITY
Scale Frequency Percentage Strongly agree Agree Undecided Disagree Strongly disagree Total
14 26 9 1 0 50
24% 52% 18% 2% 0%
100%
As seen in Table 23, the highest percentage of the respondents agreed with the
item at 52%, while “strongly agree” at 24%, “undecided” at 18%, and “disagree” at 2%.
This shows that the majority of the respondents agree that products in the Market were
reliable.
TABLE 24: LOW COST
Scale Frequency Percentage Strongly agree Agree Undecided Disagree
23 21 4 1
46% 42% 8% 2%
36
Strongly disagree Total
1 50
2% 100%
Table 24 demonstrates that the highest percentage of the respondents
strongly agreed with the item at 52%, followed by “agree” at 42%, “undecided” at 8%,
and both “disagree” and “strongly disagree” at 2%. This shows that the majority of the
respondents strongly agree that products at this market were low cost.
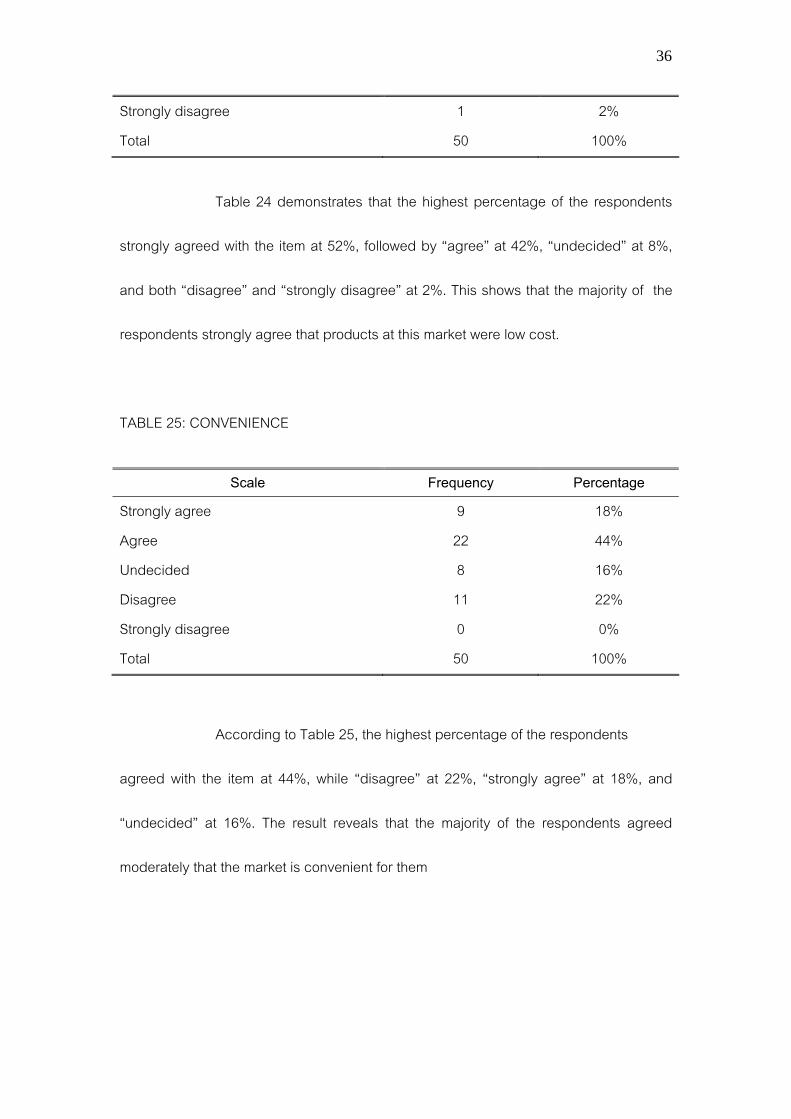
TABLE 25: CONVENIENCE
Scale Frequency Percentage Strongly agree Agree Undecided Disagree Strongly disagree Total
9 22 8 11 0 50
18% 44% 16% 22% 0%
100%
According to Table 25, the highest percentage of the respondents
agreed with the item at 44%, while “disagree” at 22%, “strongly agree” at 18%, and
“undecided” at 16%. The result reveals that the majority of the respondents agreed
moderately that the market is convenient for them
37
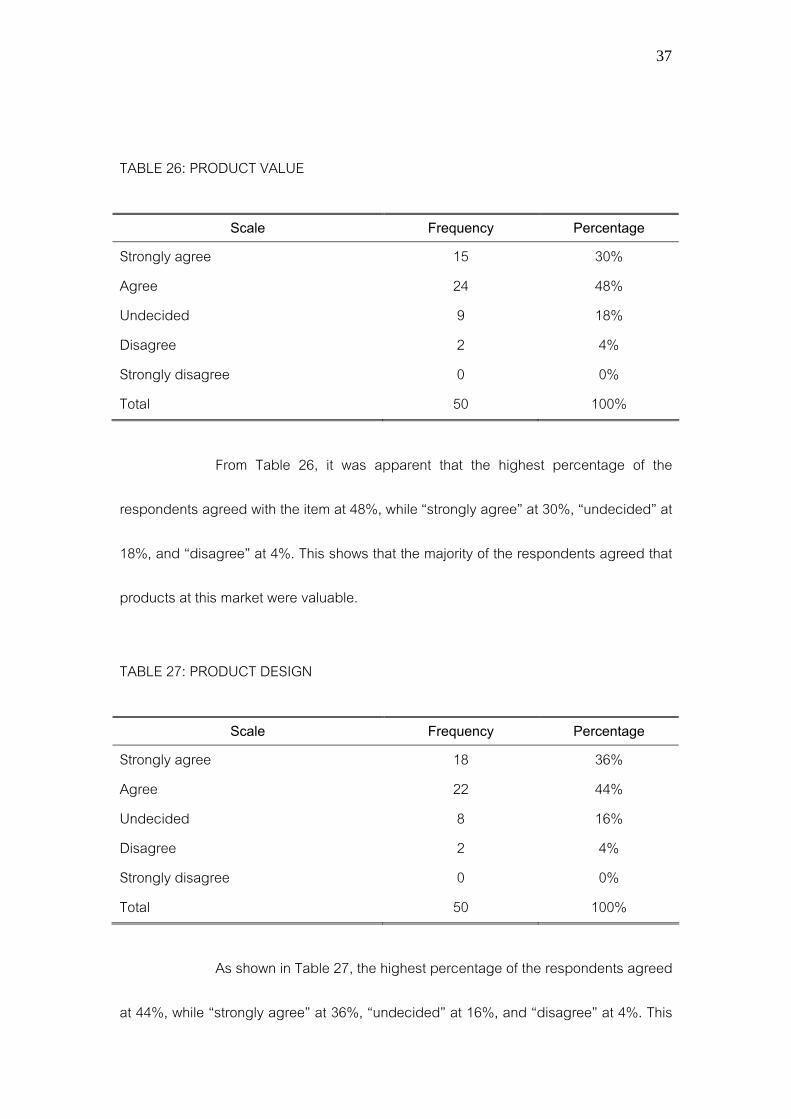
TABLE 26: PRODUCT VALUE
Scale Frequency Percentage Strongly agree Agree Undecided Disagree Strongly disagree Total
15 24 9 2 0 50
30% 48% 18% 4% 0%
100%
From Table 26, it was apparent that the highest percentage of the
respondents agreed with the item at 48%, while “strongly agree” at 30%, “undecided” at
18%, and “disagree” at 4%. This shows that the majority of the respondents agreed that
products at this market were valuable.
TABLE 27: PRODUCT DESIGN
Scale Frequency Percentage Strongly agree Agree Undecided Disagree Strongly disagree Total
18 22 8 2 0 50
36% 44% 16% 4% 0%
100%
As shown in Table 27, the highest percentage of the respondents agreed
at 44%, while “strongly agree” at 36%, “undecided” at 16%, and “disagree” at 4%. This
38
shows that the majority of respondents positively agreed that products at this market
had great design.
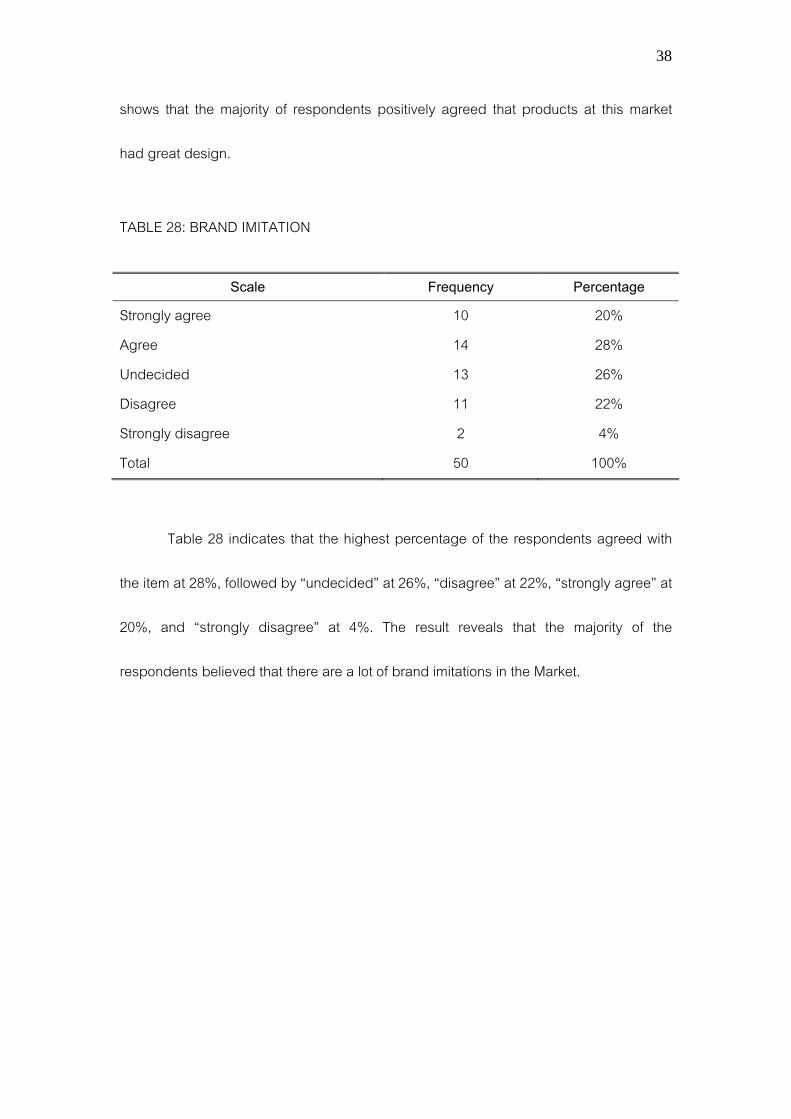
TABLE 28: BRAND IMITATION
Scale Frequency Percentage Strongly agree Agree Undecided Disagree Strongly disagree Total
10 14 13 11 2 50
20% 28% 26% 22% 4%
100%
Table 28 indicates that the highest percentage of the respondents agreed with
the item at 28%, followed by “undecided” at 26%, “disagree” at 22%, “strongly agree” at
20%, and “strongly disagree” at 4%. The result reveals that the majority of the
respondents believed that there are a lot of brand imitations in the Market.
39
Part4: Tourists’ Consumer Behavior toward their expenditure The findings presented below report the international tourists’ behavior toward
their expenditure at Jatujak Weekend Market.
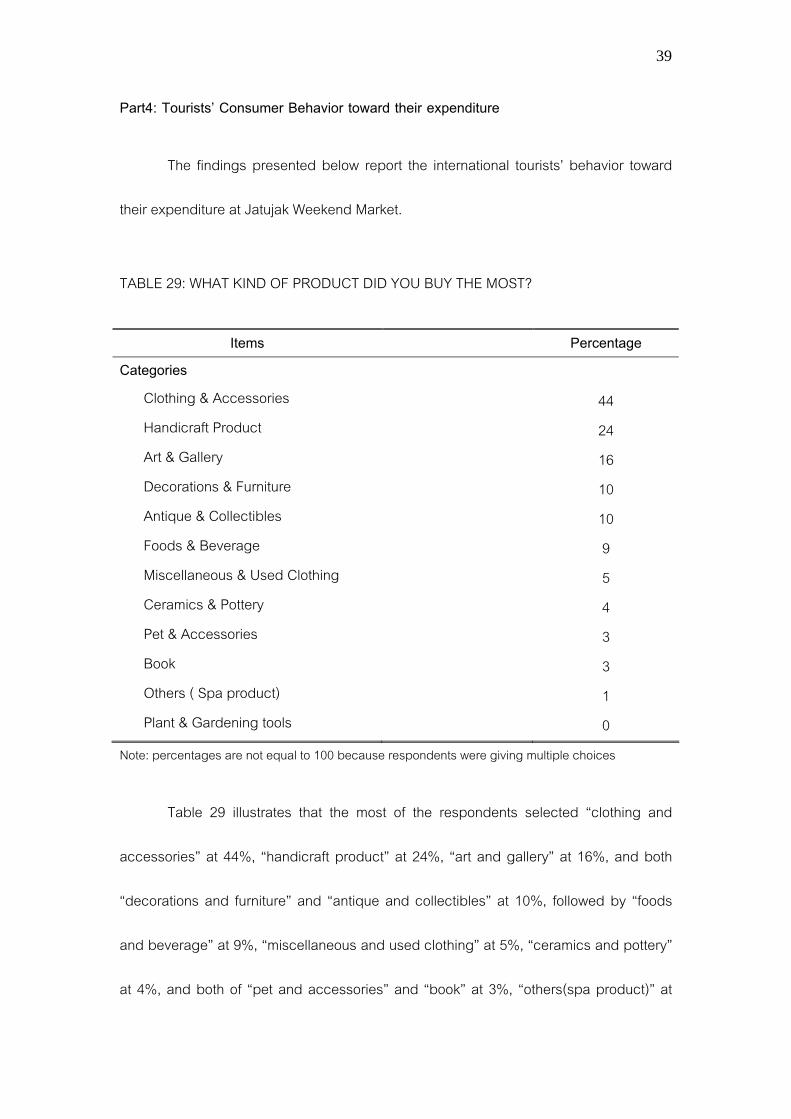
TABLE 29: WHAT KIND OF PRODUCT DID YOU BUY THE MOST?
Items Percentage Categories
Clothing & Accessories Handicraft Product Art & Gallery Decorations & Furniture Antique & Collectibles Foods & Beverage Miscellaneous & Used Clothing Ceramics & Pottery Pet & Accessories Book Others ( Spa product) Plant & Gardening tools
44 24 16 10 10 9 5 4 3 3 1 0
Note: percentages are not equal to 100 because respondents were giving multiple choices Table 29 illustrates that the most of the respondents selected “clothing and
accessories” at 44%, “handicraft product” at 24%, “art and gallery” at 16%, and both
“decorations and furniture” and “antique and collectibles” at 10%, followed by “foods
and beverage” at 9%, “miscellaneous and used clothing” at 5%, “ceramics and pottery”
at 4%, and both of “pet and accessories” and “book” at 3%, “others(spa product)” at
40
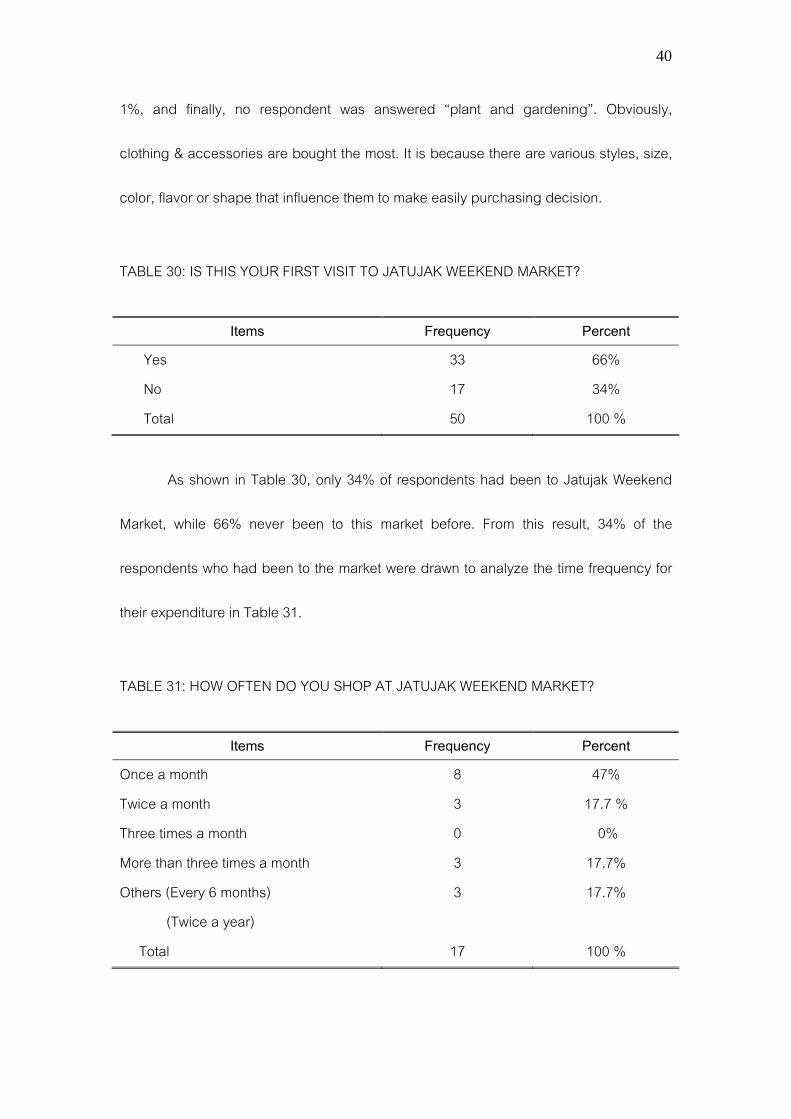
1%, and finally, no respondent was answered “plant and gardening”. Obviously,
clothing & accessories are bought the most. It is because there are various styles, size,
color, flavor or shape that influence them to make easily purchasing decision.
TABLE 30: IS THIS YOUR FIRST VISIT TO JATUJAK WEEKEND MARKET?
Items Frequency Percent Yes No Total
33 17 50
66% 34%
100 % As shown in Table 30, only 34% of respondents had been to Jatujak Weekend
Market, while 66% never been to this market before. From this result, 34% of the
respondents who had been to the market were drawn to analyze the time frequency for
their expenditure in Table 31.
TABLE 31: HOW OFTEN DO YOU SHOP AT JATUJAK WEEKEND MARKET?
Items Frequency Percent Once a month Twice a month Three times a month More than three times a month Others (Every 6 months) (Twice a year) Total
8 3 0 3 3
17
47% 17.7 %
0% 17.7% 17.7%
100 %
41
As seen in Table 31, the majority of respondents had been in this market at
“once month” at 47%, and “twice a month”, “more than three times a month” and “others
(every 6 months and twice a year) at 17.7% each. This can be concluded that the
majority of respondents certainly made a repeat visitation after their last visit.
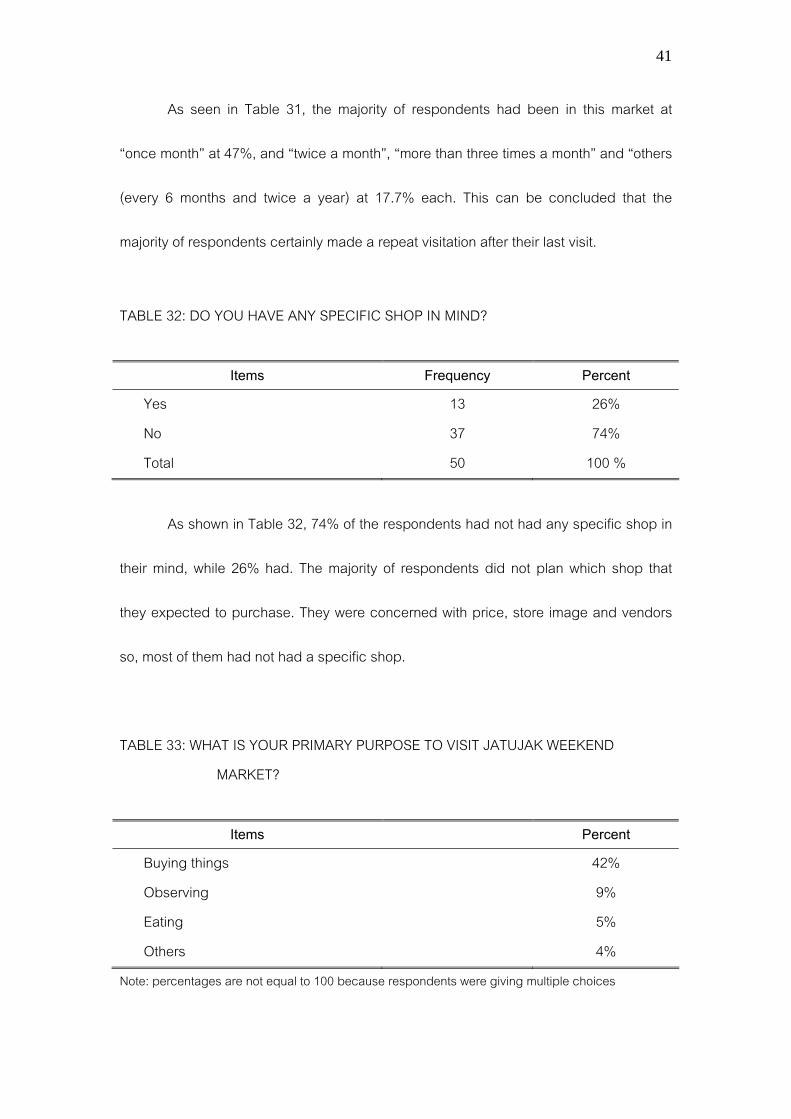
TABLE 32: DO YOU HAVE ANY SPECIFIC SHOP IN MIND?
Items Frequency Percent Yes No Total
13 37 50
26% 74%
100 % As shown in Table 32, 74% of the respondents had not had any specific shop in
their mind, while 26% had. The majority of respondents did not plan which shop that
they expected to purchase. They were concerned with price, store image and vendors
so, most of them had not had a specific shop.
TABLE 33: WHAT IS YOUR PRIMARY PURPOSE TO VISIT JATUJAK WEEKEND MARKET?
Items Percent Buying things Observing Eating Others
42% 9% 5% 4%
Note: percentages are not equal to 100 because respondents were giving multiple choices
42
Table 33 indicates that the primary purpose for the respondents to visit Jatujak
Weekend market was to buy things at 42%, while “observing” at 9%, “eating” at 5%, and
“others” at 4%. The majority of the respondents perceived “buying things” at the Market
that because there have a various style of product, reasonable prices, convenient place
and good promotion.
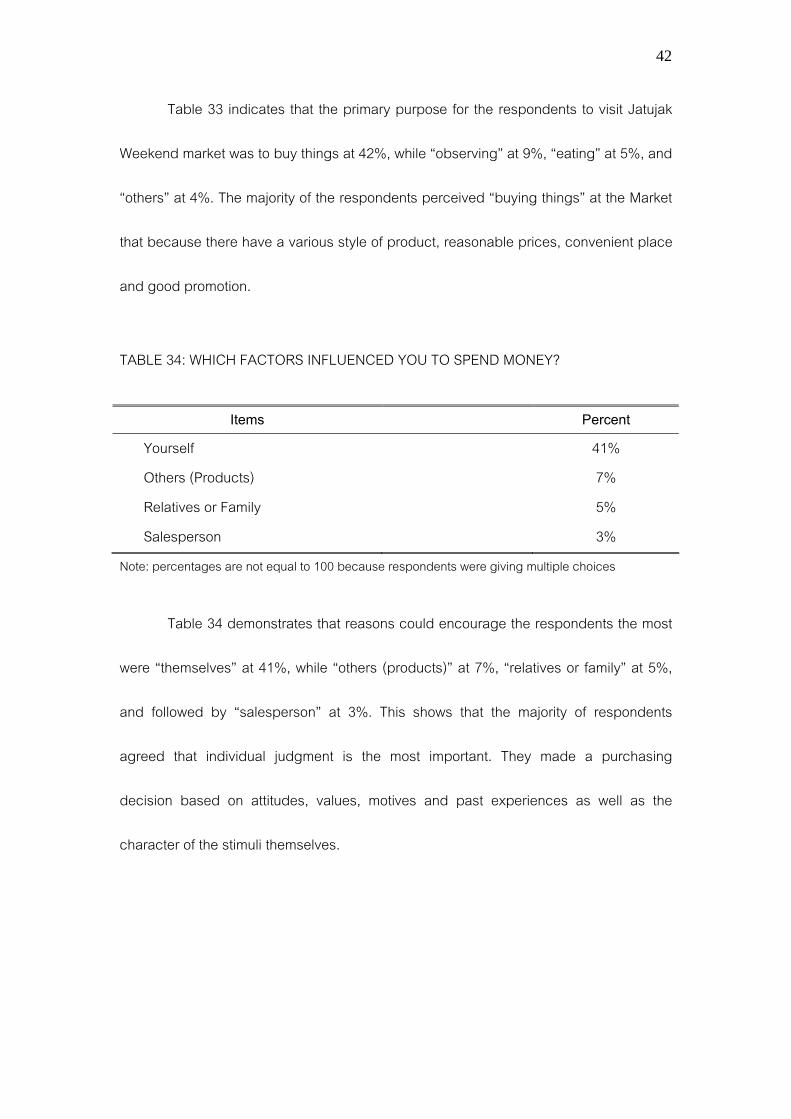
TABLE 34: WHICH FACTORS INFLUENCED YOU TO SPEND MONEY?
Items Percent Yourself Others (Products) Relatives or Family Salesperson
41% 7% 5% 3%
Note: percentages are not equal to 100 because respondents were giving multiple choices Table 34 demonstrates that reasons could encourage the respondents the most
were “themselves” at 41%, while “others (products)” at 7%, “relatives or family” at 5%,
and followed by “salesperson” at 3%. This shows that the majority of respondents
agreed that individual judgment is the most important. They made a purchasing
decision based on attitudes, values, motives and past experiences as well as the
character of the stimuli themselves.
43
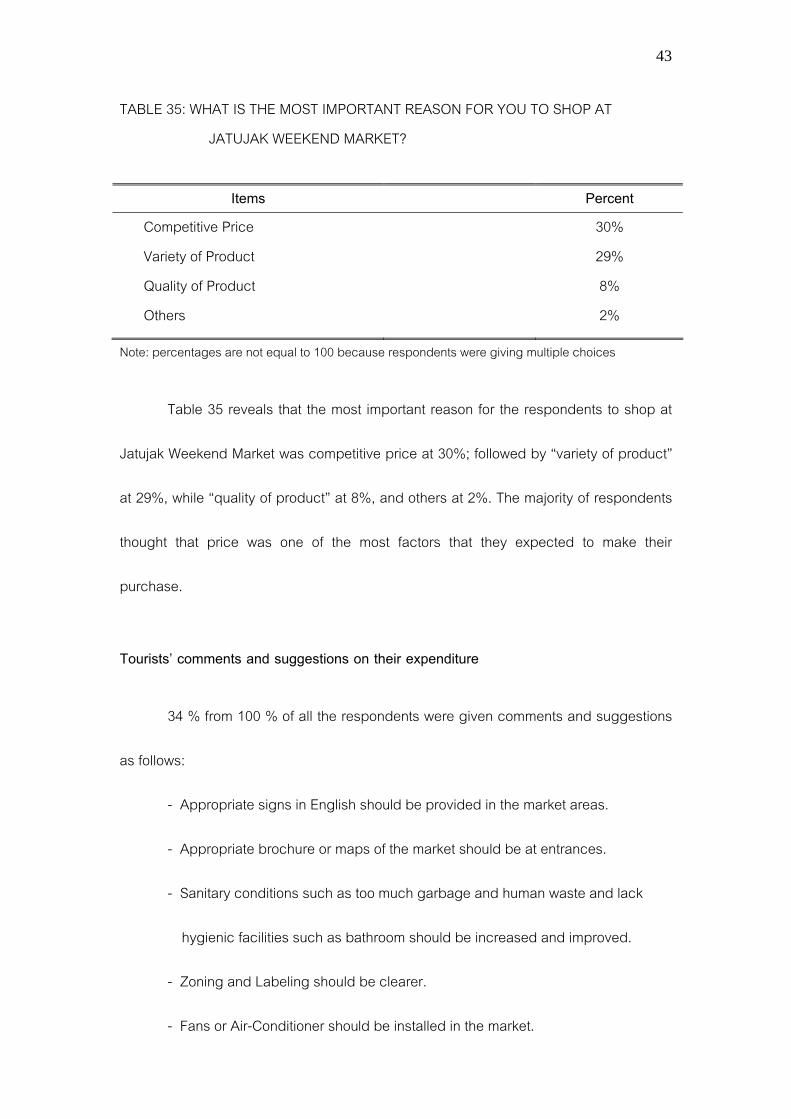
TABLE 35: WHAT IS THE MOST IMPORTANT REASON FOR YOU TO SHOP AT JATUJAK WEEKEND MARKET?
Items Percent Competitive Price Variety of Product Quality of Product Others
30% 29% 8% 2%
Note: percentages are not equal to 100 because respondents were giving multiple choices Table 35 reveals that the most important reason for the respondents to shop at
Jatujak Weekend Market was competitive price at 30%; followed by “variety of product”
at 29%, while “quality of product” at 8%, and others at 2%. The majority of respondents
thought that price was one of the most factors that they expected to make their
purchase.
Tourists’ comments and suggestions on their expenditure 34 % from 100 % of all the respondents were given comments and suggestions
as follows:
- Appropriate signs in English should be provided in the market areas.
- Appropriate brochure or maps of the market should be at entrances.
- Sanitary conditions such as too much garbage and human waste and lack
hygienic facilities such as bathroom should be increased and improved.
- Zoning and Labeling should be clearer.
- Fans or Air-Conditioner should be installed in the market.
44
- Security must be reassured.
- Online information should be provided.
- Numbered signboard of each shop should be clearer.
- Brand imitation should be eliminated.
- Quality of products should be improved.
- Environment in the market should be improved.
CHAPTER 5
CONCLUSIONS AND DISCUSSION
This chapter discusses the answers to the two research questions which are:
1. How do foreign tourists’ responses reflect Marketing Mix toward their
expenditure?
2. What influences the relations of tourists’ attitudes and their expenses
behaviors?
This is followed by conclusions, discussion, and recommendations for further
study.
Research Question 1
According to the Marketing Mix attitudes of foreign tourists, it was found that
they agreed with product, price, and place. In terms of products, they believed that
fashionable clothes, variety of styles, variety of accessories, and product satisfaction
could motivate them to buy. Also, price tag and bargaining prices were certainly helpful
to stimulate a greater interest and awareness of their expenses. Furthermore, they
agreed that good atmosphere and transportation conveniences could influence their
tourists’ expenses.
In contrast, the result also showed that promotion mixed does not help them
make a purchasing decision. Besides, tourist booklets, Internet information and
46
Information center only informed them about product information but, it did not motivate
them to buy a product.
Research Question 2
The answer to the second research question was low cost. Tourists believed that
low prices are the most important determinant of purchase. In general, people negotiate
all the time as well as foreign tourists did, they preferred bargaining prices to meet more
satisfactory results. Moreover, they agreed that internal factors (Evaluation of
alternatives) could help them making a purchasing decision because most of them were
selected clothing & accessories. This is because tourists would not say clothing &
accessories without trying them on.
Furthermore, the result indicated that an external factor such as In-store stimuli
could motivate them to make their purchase because In-store interiors provided a
physical environment consistent with the nature of the target market, the product line,
and the desired image of each shop. This is because most of the tourists did not have a
specific shop in mind, so they made a decision from In-store decoration. Finally, they
also believed that competitive prices were influential factors to stimulate their purchase
as well as their attitudes of expenses. They also felt that individual differences could
enhance their needs and motivation.
Discussion
It is obvious that Marketing Mix is as important as attitudes and behavior when
developing the marketing strategy of a particular area such as Jatujak Weekend Market.
47
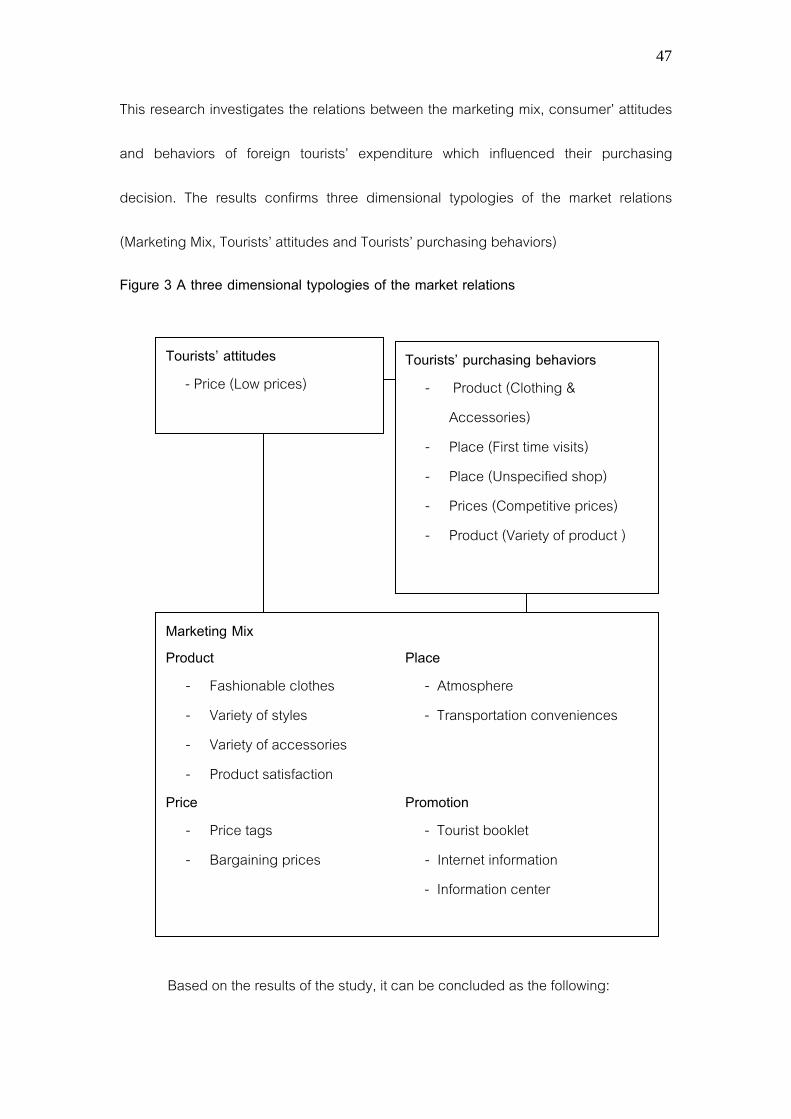
This research investigates the relations between the marketing mix, consumer’ attitudes
and behaviors of foreign tourists’ expenditure which influenced their purchasing
decision. The results confirms three dimensional typologies of the market relations
(Marketing Mix, Tourists’ attitudes and Tourists’ purchasing behaviors)
Figure 3 A three dimensional typologies of the market relations
Figure 3 A three dimensional typology of the market relationships
Marketing Mix Product Place
- Fashionable clothes - Atmosphere - Variety of styles - Transportation conveniences - Variety of accessories - Product satisfaction
Price Promotion - Price tags - Tourist booklet - Bargaining prices - Internet information
- Information center
Tourists’ purchasing behaviors - Product (Clothing &
Accessories) - Place (First time visits) - Place (Unspecified shop) - Prices (Competitive prices) - Product (Variety of product )
Tourists’ attitudes - Price (Low prices)
Based on the results of the study, it can be concluded as the following:
48
1. Foreign tourists’ attitudes toward Marketing Mix
The findings pointed out that foreign tourists emphasized perceived marketing
attributes in product, price, and place except promotion mixed which can be divided in
4 strategies as follows:
Product
Most of the tourists acquired to meet a perceived need. They generally buying
thing for need satisfaction, not physical product attributes to reach their purchasing
decision.
Price
This study shows that most of the tourists emphasized on price tag and
bargaining prices. They were often sensitive for price discount and special offers. And
also, they expected that the lower prices for the same product would result in more
sales than higher prices.
Place
This findings implied that most of the tourists not only wanted a better
environment but, also any other conveniences because a store’s atmosphere had some
influence on tourists’ moods and their willingness to visit. It also influences the
consumer’s judgments of the quality of the store and the store’s image. Moreover, a
49
positive mood induced while in the store can increase satisfaction with the store, and
can repeat visits and store loyalty.
Promotion
This study also shows that most foreign tourists’ obtained information from tourist
booklets, internet and information center. As Aaker (2004) said that promotion has
become the most important P to focus on.
In addition, the image of this market is word of mouth. Accordingly, Solomon
(2003:332) stated that “word of mouth” tends to be more reliable and trustworthy than
recommendation that we get through more formal marketing channels.
2. Foreign tourists’ attitudes toward their expenditure
This study demonstrates that low prices affect on tourists’ intention or
purchasing decision. In fact, low prices have an effect not only on tourists’ cognition
(knowledge and perception) but also on affective emotion or feelings. According to
cognitive component, the tourists acquired a direct experience with the attitude object
before making any purchasing decision (Schiffman and Kanuk, 200:203). Furthermore,
they made a decision from emotions or feelings about a particular product that is
valuable with reasonable prices. Moven also (1993:267) noted that if attitudes are
positive, they may then purchase the product.
50
3. Foreign tourists’ behaviors toward their expenditure
The study also reveals important factors: psychology, socio-psychological and
economics factors that are important in decision making. Psychological factors have
acted on foreign tourists’ determination to visitation. The socio-psychological factor is
the motivations that drive the individual expenditure. Also, the economic factor is to
ensure that the price level is consistent with the value of the product in the mind of the
target customer. This study also indicated that the influential factors of tourists’
purchasing decision included internal and external factors. They recognized of need or
problem first then evaluated the alternatives and later made a decision. In addition, they
believed that some of the external factors influenced them to make their purchase.
Finally, it is important to note that, shopping at Jatujak Market is an adventure in itself.
From section 1 to 27 bargaining is obligatory. Tourists can obtain a final figure ten to
thirty percent lower than the original asking price. Much depends upon tourist’ skills and
the vendor’s mood. With patience, and a board smile, they will not only get a better
price, they will also come to recognize shopping in Bangkok as an art form. This is
because why Jatujak Weekend Market is called as a unique market.

51
Recommendation for further studies As this study focuses only on the relations between marketing mix and
consumers’ attitudes and behaviors, other related studies should be undertaken to
explore other suggested topics as the following:
- A study of Traditional Thai Markets and Domestic Tourism.
- An Examination of Price Strategy to Enhance Competitive Markets.

BIBLIOGRAPHY
53
BIBLIOGRAPHY
Aaker A., David (2004). Strategic Market Management. 7th ed. USA:Wiley. Bearden, William O.; & Ingram, Thomas N.; & Laforge, Raymond W. (1995). Marketing:
Principles and Perspectives. Chicago: Richard D. Irwin. Hoyer D., Wayne; & Deborah, Maclnnis J. (2004): Consumer Behavior. 3rd ed. The
United State of America: Houghton Mifflin Company. Hawkins, I. Del; Roger, Best J.; & Coney, Kenneth A. (2001). Consumer Behavior:
Building Marketing Strategy. 8th ed. The United State of America: McGraw-Hill.
Kotler, Philip; & Armstrong, Gary.(2004). Principles of Marketing .10th ed.
New Jersey: Pearson Education. Kotler, Philip. (1997). Marketing: Principles and Perspectives. New Jersey: Pearson
Education. Loudon, David L.; & Bitta, Albert J. (1993). Consumer Behavior: Concepts and
Applications. 4th ed. USA: McGraw Hill. Myers, James H. (1986). Marketing. New York: McGraw-Hill. Needham, Dave; & Dransfield, Rob. (1991). Marketing: Everybody’s business.
Singapore: Heinemann Asia.
54
Pakaworawuth, Chamnong. (1990) Thailand illustrated: Chatuchak Weekend Market: Bangkok’s Popular Rendezvous for Vendors and Shoppers. Bangkok: Sri Muang Printing.
Pride, William M.; & Ferrell O.C. (2003). Marketing: Concepts and Strategies. 12th ed.
Boston: Houghton Mifflin. Peter, J. Paul; & Olson, Jerry C. (1994). Understanding Consumer Behavior. Boston:
Richard D. Irwin. Schiffman, Leon G.; & Kanuk, Leslie Lazar. (2000). Consumer Behavior. 7th ed. New
Jersey: Prentice Hall International. Schiffman, Leon G.; & Kanuk, Leslie Lazar. (2000). Consumer Behavior. 7th ed. New
Jersey: Prentice Hall International. Smith, P.R. (2003). Great Answers to Tough Marketing Questions. 2nd ed. London:
Kogan. Tourism Authority of Thailand (TAT). (2005, August 18). Tourism Statistics Retrieved March 15, 2006, from http://www2.tat.or.th/stat/web/static_index.php. Wikimedia Foundation. (2005, December 26). Wikipedia: The Free Encyclopedia.
Retrieved March 15, 2006, from http://en.wikipedia.org/wiki/ Chatuchak_Weekend_Market Wikimedia Foundation. (2006, March 17). Wikipedia: The Free Encyclopedia Retrieved March 15, 2006, from http://en.wikipedia.org/wiki/Supermarkets Oxford University Press. (2006). Compact Oxford English Dictionary. Retrieved March 15, 2006, from http://www.askoxford.com/concise_oed/market?view=uk.

55
Jatujak Guide. (2004). Jatujak Market image. Retrieved January 19, 2007, from
http://www.jatujakguide.com/main/jjmap.htmlJatujak Guide. (2004). History of Jatujak Market. Retrieved January 19, 2007, from http://www.answers.com/topic/chatuchak-weekend-market

APPENDIX
56
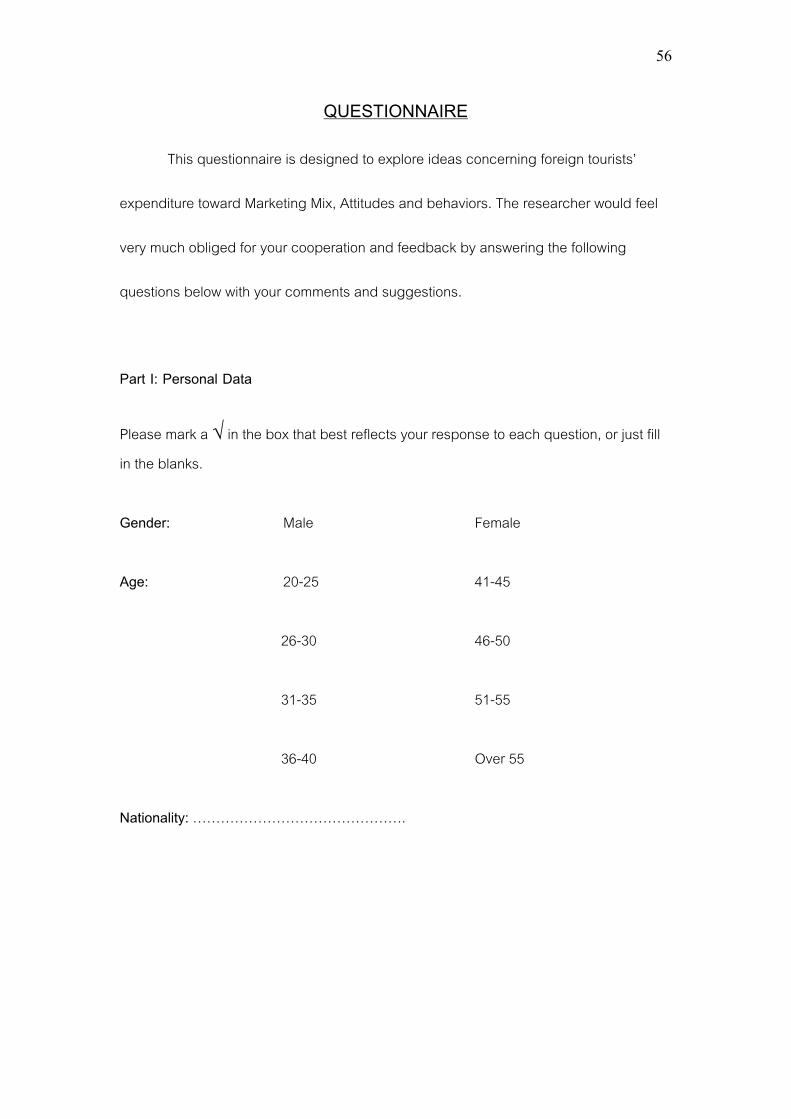
QUESTIONNAIRE
This questionnaire is designed to explore ideas concerning foreign tourists’
expenditure toward Marketing Mix, Attitudes and behaviors. The researcher would feel
very much obliged for your cooperation and feedback by answering the following
questions below with your comments and suggestions.
Part I: Personal Data
Please mark a √ in the box that best reflects your response to each question, or just fill in the blanks. Gender: � Male � Female
Age: � 20-25 � 41-45
� 26-30 � 46-50
� 31-35 � 51-55
� 36-40 � Over 55
Nationality: ……………………………………….
57
Part2: Foreign tourists’ attitudes toward Marketing Mix
Please mark a √ in the box that best reflects your response to each question.
Description Most important
Very important
Somewhat important
Not too important
Not at all important
Product 1. Fashionable Clothes
2. Variety of Styles 3. variety of Accessories 4. Product Qualities 5. Product Satisfaction 6. Product Reliabilities Price 7. Price Tag (selling point)
8. Bargaining Price Place 9. Service of delivery
10. Product distribution 11. Stores’ Atmosphere 12. Assorted Products 13. Transportation conveniences
Promotion 15. Tourist Booklet
16. Newspaper advertisements
17. Internet information 18. Public Relations Office (Head office)
58
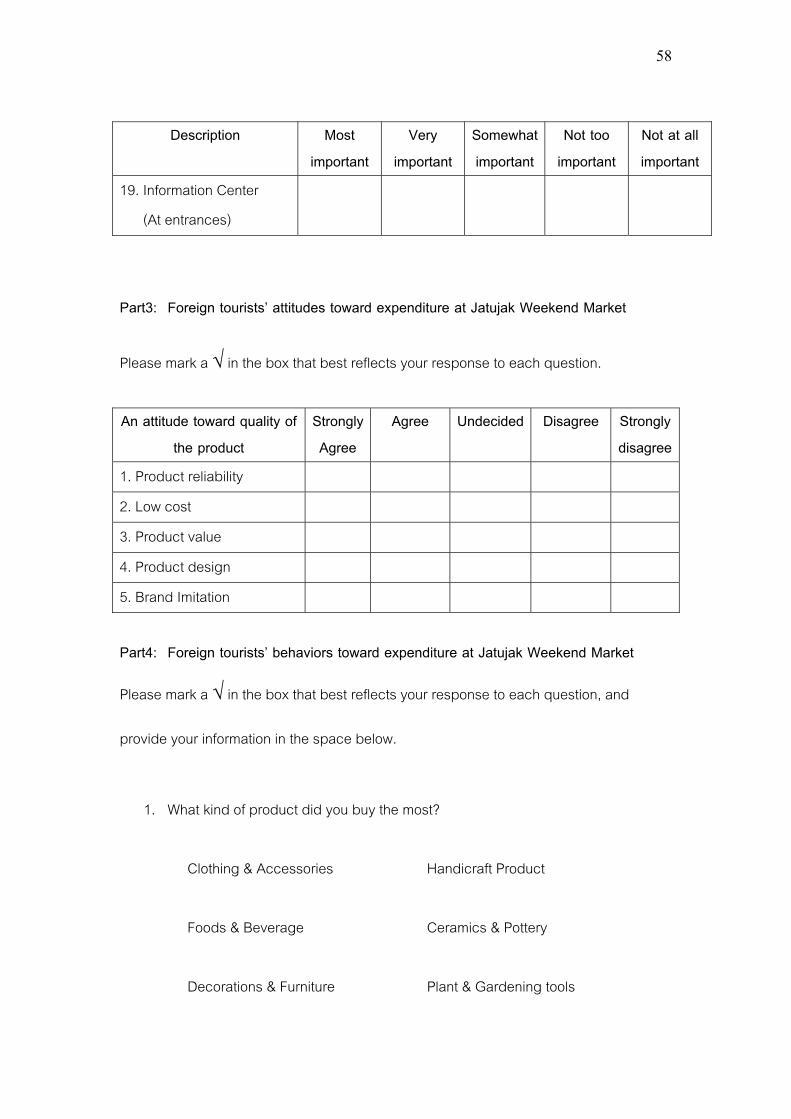
Description Most
important Very
important Somewhat important
Not too important
Not at all important
19. Information Center (At entrances)
Part3: Foreign tourists’ attitudes toward expenditure at Jatujak Weekend Market
Please mark a √ in the box that best reflects your response to each question. An attitude toward quality of
the product Strongly Agree
Agree Undecided Disagree Strongly disagree
1. Product reliability 2. Low cost 3. Product value 4. Product design 5. Brand Imitation Part4: Foreign tourists’ behaviors toward expenditure at Jatujak Weekend Market
Please mark a √ in the box that best reflects your response to each question, and
provide your information in the space below.
1. What kind of product did you buy the most?
� Clothing & Accessories � Handicraft Product
� Foods & Beverage � Ceramics & Pottery
� Decorations & Furniture � Plant & Gardening tools
59
� Art & Gallery � Pet & Accessories
� Book � Antique & Collectibles
� Miscellaneous & Used Clothing � Others (Please specify) ………………
2. Is this your first visit to Jatujak Weekend Market?
� Yes � No
3. If no, how often do you shop at Jatujak Weekend Market?
� Once a month � Twice a month
� Three times a month � More than three times a month
� Others…………………………..
4. Do you have any specific shop in mind?
� Yes � No
5. What is your primary purpose for you to visit Jatujak Weekend Market?
� Buying things � Eating
� Observing � Others (Please specify)…………………
60
6. Which factors influenced you to spend money?
� Salesperson � Yourself
� Relatives or family � Others (Please specify)……….
7. What is the most important reason to shop at Jatujak Weekend Market?
� Competitive Price � Variety of Product
� Quality of Product � Other (Please specify)………………..
Comments and Suggestions
………………………………………………………………………………………………………
………………………………………………………………………………………………………
………………………………………………………………………………………………………
………………………………………………………………………………………………………
………………………………………………………………
61
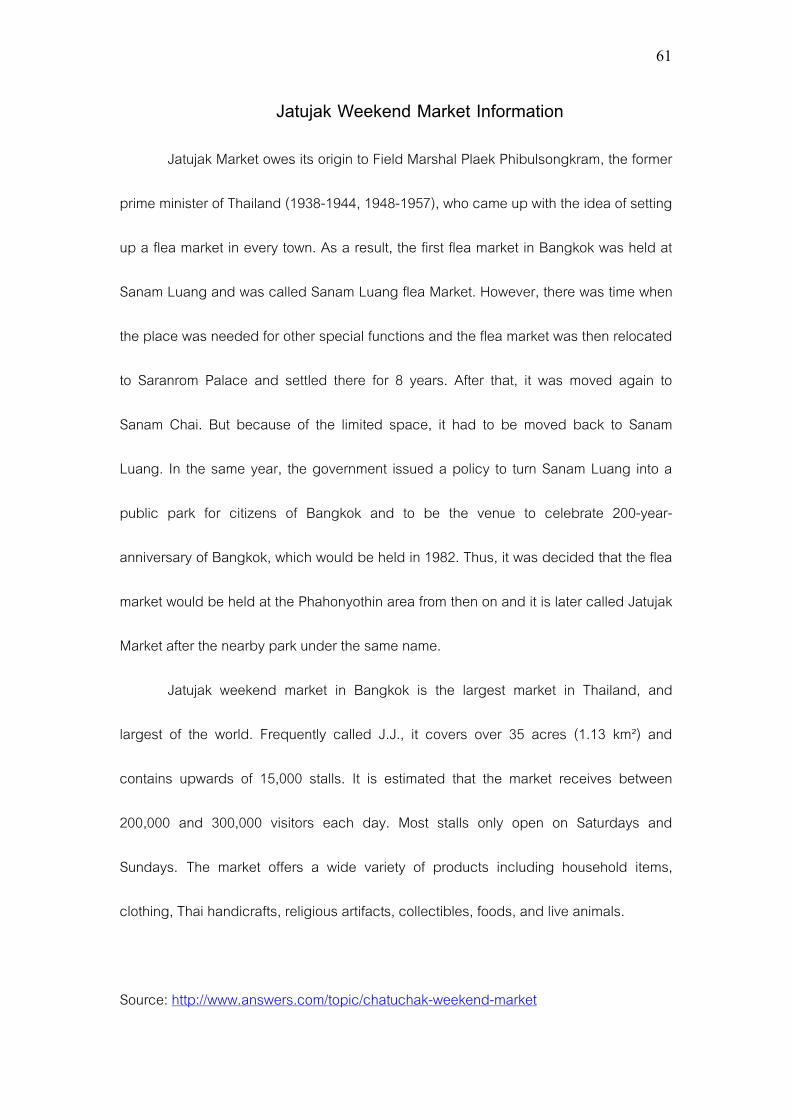
Jatujak Weekend Market Information
Jatujak Market owes its origin to Field Marshal Plaek Phibulsongkram, the former
prime minister of Thailand (1938-1944, 1948-1957), who came up with the idea of setting
up a flea market in every town. As a result, the first flea market in Bangkok was held at
Sanam Luang and was called Sanam Luang flea Market. However, there was time when
the place was needed for other special functions and the flea market was then relocated
to Saranrom Palace and settled there for 8 years. After that, it was moved again to
Sanam Chai. But because of the limited space, it had to be moved back to Sanam
Luang. In the same year, the government issued a policy to turn Sanam Luang into a
public park for citizens of Bangkok and to be the venue to celebrate 200-year-
anniversary of Bangkok, which would be held in 1982. Thus, it was decided that the flea
market would be held at the Phahonyothin area from then on and it is later called Jatujak
Market after the nearby park under the same name.
Jatujak weekend market in Bangkok is the largest market in Thailand, and
largest of the world. Frequently called J.J., it covers over 35 acres (1.13 km²) and
contains upwards of 15,000 stalls. It is estimated that the market receives between
200,000 and 300,000 visitors each day. Most stalls only open on Saturdays and
Sundays. The market offers a wide variety of products including household items,
clothing, Thai handicrafts, religious artifacts, collectibles, foods, and live animals.
Source: http://www.answers.com/topic/chatuchak-weekend-market
62
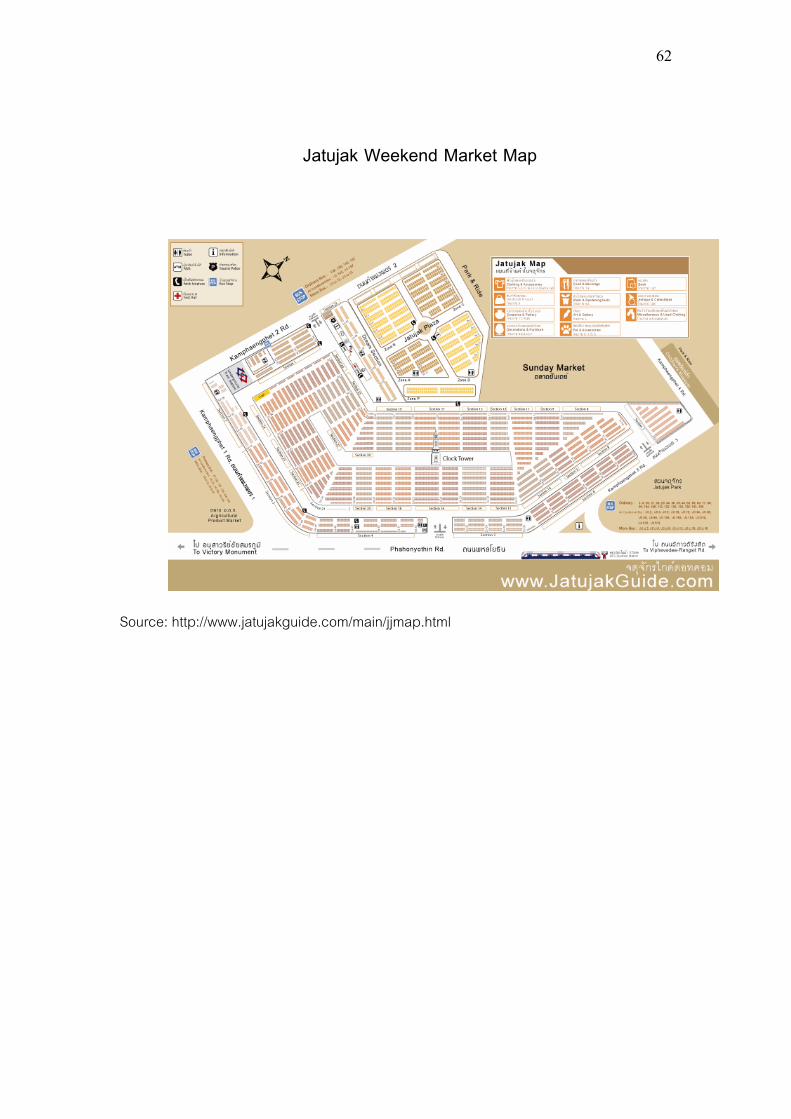
Jatujak Weekend Market Map
Source: http://www.jatujakguide.com/main/jjmap.html

VITAE
63
VITAE
Name: Miss Duangkamol Lookin Date of Birth: December 20, 1982 Place of Birth: Bangkok Address: 100/839 Srinakarin Road Bangmuang,
Samutprakan 10270 Educational Background:
2007 Master of Arts(Business English for International Communication), Department of Western Languages, Srinakarinwirot University
2003 Bachelor of Business Administration (Business English) Rajamangala Institute of Technology, Borpitpimuk Chakrawad Campus