Embed Size (px)
Citation preview
SSC-251!I
A STUDY OF SUBCRITICAL CRACK
IN SHIP STEELS
This document has been approved forpublicreleaseand sale;itsdistributionis unlimited.
GROWT~
SHIP STRUCTURE COMMITTEE
1975
MEMBER AGENCIES:Untted Stoles Coos! Guard
Now SK Sy,lm?, Command
M,litory Sealift Commond
Mar’time Adminktrotion
ArrK,icon 0.,,.” of Wpp,ng
SHIP STRUCTURE COMMITTEE
AN INTERAGENCY ADVISORYCOMMITTEE OEDICATEO TO NAPROVING
I
THE STRUCTURE OF SHIPS
ADDRESSCORRESPONDENCE TO:Secreto’yshipstructureConlm,lte.U.S. Comt Guord Hindquarter,
W.xhinglon, D.C, 20590 1
sR-209
1
Small discontinuities exist in any complex structure. Thesediscontinuities may grow by fatigue or stress corrosion to a critical
size during the service life of the structure. This could result inships leaking or even unstable crack propagation.
The Ship Structure Committee undertook a project to conducta critical survey and analysis of those conditions under which pre-existingflaws may grow in high-strength ship steels and weldments when subjectedto loading and environmental conditions of ship service.
The enclosed report contains the results of this study.Comments on this report or suggestions for other projects in the shipstructure area will be welcomed.
W. M. Benker tRear Admiral, U. S. Coast GuardChairman, Ship Structure Committee
SSC-251
FINAL TECHNICAL REPORT
on
Project SR-209, “Subcritical Crack Growth”
A STUDY OF SUBCRITICAL CRACK GROWTH IN SHIP STEELS
by
P. H. FrancisJ. Lankford, Jr. , andF. F. Lyle, Jr.
Southwest Research Institute
under
Department of the NavyNaval Ship Engineering CenterContract No. NOO024-73-C-5199
This document has been approved for public M leaseand sale; its distribution is unlimited.
U. S. Coast Guard HeadquartersWashington, D.C.
1975
——... —.—. —
ABSTRACT
This report presents an evaluation of crack initiation and sub-
critical crack growth in high-strength, low-alloy steels used in welded
ship structure. An interpretive review of the state-of-the-art is given,
emphasizing design tools that are availab~e and their potentiai for use in
fail safe or safe crack growth ship design philosophy. A crack initiation
and crack growth criterion is presented, which permits welded ship
structure to be designed with confidence that serious failures can be
avoided, while at the same time full use of the attractive static pro-
perties of HSLA steels can be exploited. The report also includes a
List of problem areas in need of further clarification in order to enhance
confidence in the proposed criterion.
ii
CONTENTS
LIST OF ILLUSTRATIONS
LIST OF TABLES
NOMENCLATURE
I. INTRODUCTION
II. SUBCRITICAL CRACK GROWTH IN SHIP STEELS
AND WELDMENTS
A. Crack Initiation in Ship Steels
1. Sources of Initiation
2. Influence of Surface and Flaw Geometry
3. Model for Crack Initiation
B. Crack Propagation in Ship Steels
1. Relation to Strength and Fracture Toughness
2. Influence of Microstructure
3. Crack Growth Theories
c. Crack Initiation in Welds and Heat Affected Zones
1. Sources of Initiation
2. Influence of Surface and Flaw Geometry
3. Models for Crack Initiation
D. Crack Propagation in Welds and Heat-Affected Zones
1. Factors Controlling Fatigue C rack Growth in
Welds and Heat-Affected Zones
2. Crack Growth Theories
E. Fatigue Damage Estimation
1. Cumulative Damage Analysis
2. Frequency and Temperature Effects
3. Multiaxial Stress Fatigue
4. Random Loads
5. Equivalence Between Sinusoidal and Random
Fat’:&ue Damage
. .c;” =NVI1+.ON~,f~;tiTAL. TO PI(; S }? E ! ,.,~.-~ F,:D TO $;T-l~/.-;ZITICAL
C RA(; K GROW-l H
A, Stress Corrosion Cracking
1. General Characteristics of SC(,;
2, Stt-css C,>rrosion ‘Iescln!i
3. ,SCC of SJIip Stct:ls in M:.rine. 13m.vi : ,nments
w
v
x
xi
2
2
2
4
67
8
13
16
21
22
26
29
30
30
32
38
38
40
41
42
5.,.
1’~ .
t :~-
TABLE OF CONTENTS (Cent’d)
,.
B. Corrosion Fatigue
1. General Characteristics of Corrosion Fatigue
2. Analysis of Fatigue Crack Growth
3. Crack Propagation BehaviOr Above KI~cc
4. Crack Propagation Behavior Bel Ow K1~cc
5. Factors Affecting Corrosion Fatigue Crack
Growth Rates
c. Control of Stress Corrosion Cracking and
Corrosion Fatigue
IV. CRACK INITIATION AND SUBCRITICAL CRACK
GROWTH CRITERION
A. General Principles Governing Ship Design with
HSLA Steels
B. Purpose of the Criterion
c. Rationale for Criterion
1. Technical Basis
2. Implications
D. Tentative Criterion for Fatigue Resistant Design
of Ships
E. Example
v. CONCLUSIONS AND RECOMMENDATIONS
A. Significance of C rack Initiation and Growth in
HSLA Ship Steels
B. Priority Problem Areas
57
57
58
60
64
69
76
83
83
84
85
85
101
103
108
111
111
113
VI. REFERENCES 116
APPENDIX 127
LIST OF ILLUSTRATIONS
2
3
4
5
6
7
8
9
10
11
12
%
Schematic S-N curves of initiation, propagation,
and total fatigue lives 3
Correlation of fatigue-crack-initiation life with the
parameter K1/fp for HY - 130 steel 5
Comparison of observed crack initiation in SAE
1015 mild steel notched plates with predicted values 7
Typical S-N fatigue curves for several ferrous and
nonferrous high-strength alloys 8
Summary of fatigue-crack-growth data for ferrite-
pearlite steels 9
Relationship between the index n and yield stress 10
Relationship between A (in equation ~~ = A AKn)
and yield stress 10
Log-log plot of fatigue crack growth rate (da/dN)
vs stres s-intensity factor range (AK) showing the
scatterband limits for a broad sample of high-
strength steels 12
Schematic illustration of the typical effect of
fracture toughness on fatigue life in crack
propagation 12
Schematic drawing showing relation of crack to
oriented fibered structure 14
Effect of stress intensity factor range on fatigue
crack propagation rate for banded Pearlite -ferrite
microstructure 15
Effect of stress intensity factor range on fatigue
crack propagation rate for banded Martens ite -
ferrite microstructure 15
v
LIST OF ILLUSTRATIONS (Cent’d)
EL&i!xE
13
14
15
16
17
18
19
20
21
23
24
Log-log plot of fatigue crack growth rate da/dN
as a function of the stress-intensity factor range
AK , under conditions of constant Kma.x
Schematic plot of crack growth rate per cycle
(As/AN) with respect to log (stress intensity
factor) showing the upper and lower limits ofstress intensity factor, Kc and Kth
Schematic illustration of failure by fatigue-crack
propagation
Summary of results relating to the effect of lack
of penetration on the fatigue strength of transverse
butt welds in mild steel
Summary of results obtained for mild steel butt
welds containing porosity tested under a tensile
mean stress of 19 ksi
The effect of defect length on the fatigue strength,
at 2 x 10⁶ cycles under pulsating tension loading,
of transverse butt welds containing slag inclusions
The relationship between reinforcement angle and
fatigue strength of transverse butt welds
Parent metal specimens used to study the effect
of ‘weld’ reinforcement shape
The effect of reinforcement shape found by Sanders,
et al. , in tests on parent metal specimens subjected
to alternating loading
Variation in c rack propa~ati.on rate and hardness
along the fatigue crack path through a mild steel
H. A.Z. at 75 deg to the t::sile axis
T.vo models for flawed wel. dmen.ts
T.pes of fla,v s found in w+, idmer.ts
18
18
21
23
24
25
27
28
28
3’?
34
36
LIS’T OF IL LIJ STRATION ,5 (,.. :],: :.)
X.wEs
25
26
27
28
29
30
31
32
33
34
35
36
37
38
Effect of initial flaw size on the crack propagation
life of a flawed l-in. -thick HY-130 weldment
Power spectral density plot
Stress equivalence factor
The three phases of structural failure by corrosion
Stress vs time-to-failure curves illustrating stress-
corrosion cracking threshold stresses in an acidified
3.57, NaCl + saturated with H2S for an alloy steel
heat treated to different hardness levels
Generalized stress-corrosion cracking resistance
of high-strength steels (1 -in. plates) in salt water
Stress intensity vs time-to-failure curve illustrating
stress-corrosion cracking threshold level
Stress-corrosion behavior of HY-130(T) steel in
laboratory studies
Effect of environment on fatigue properties of a
O. 35% carbon steel
Fatigue crack growth behavior of hypothetical steels
Comparison between static and tension-tension
fatigue crack growth rates as a function of the
static and mean stress intensity levels
Above K1~cc corrosion fatigue crack growth rate
behavior of 4340 steel for fully reversed sinusoidal
loading as a function of frequency
Air and salt water fatigue crack growth rate
behavior of 9 Ni-4 Co-O. 25 C steel
Air and salt water fatigue crack growth rate
behavior of 13 Cr-8 Ni-2 Mo PH stainless steel
37
43
46
48
49
51
52
56
59
61
62
63
65
65
vii
LIST OF ILLUSTRATIONS (Cent’d)
E.wzs
39
40
41
42
43
44
45
46
47
48
49
50
Air and salt water fatigue crack growth rate
behavior of 12 Ni ( 180) maraging steel
Below K1~cc corrosion fatigue crack growth rate
behavior as a function of frequency
Corrosion-fatigue crack-growth data as a function
of test frequency
Fatigue-crack-growth rates in air and in 3%
solution of sodium chloride bel Ow KI~cc fOr
various high-yield-strength steels
Relationship between D(t) and cyclic-stress
frequency in various steels subjected to sinusoidal
loading in 3% solution of sodium chloride
Fatigue crack growth rates in air under sinusoidal,
triangular, and square loads
Corrosion fatigue crack grOwth rates belOw K1~cc
under sinusoidal, triangular, and square loads
Relationship between D(t) and cyclic stress
frequency in 12Ni-5Cr-3Mo steel in 370 solution
of sodium chloride under sinusoidal, triangular,
and square loads
Corrosion fatigue crack growth rates in 12Ni-5Cr -
3M0 steel in 3% solution of sodium chloride under
various cyclic stress fluctuations with different
stress-time profiles
Effect of potential on corrosion fatigue life, two
stress levels
Various load-time profiles
Schematic illustration of the typical effect of
stress-ratio on fatigue-crack propagation
~ ,.
66
66
67
68
70
71
71
72
72
75
75
77
Viii
-.—--
Eb!!!E
51
52
53
54
55
56
57
58a
58b
59
60
61
62
LIST OF ILLUSTRATIONS (Cent’d)
Effect of removal of weld reinforcement on
axial-load fatigue strength of transversely
butt-welded 1 /4-in. -thick constructional alloy
steel plates (R = -1)
Typical AO-Nf curves for structural weldment
Typical crack growth data for welded steel plate
Au-Nf curves for Type 1 weldments
/lO-Nf curves for Type 2 weldments
Au-Nf curves for Type 3 weldments
Au-Nf curves for Type 4 weldments
AO-Nf curves for Type 5 weldments
Common geometries for Type 5 weldments
Au-Nf curves for Type 6 weldments
Gamma function
Crack initia~lon period, in service years, for
typical weldments
Crack propagation period, in service years, for
various initial flaw sizes
77
87
90
94
95
96
97
98
99
100
104
106
107
ix
3
4
5
6
7
8
—-- -- . . . . ..-_
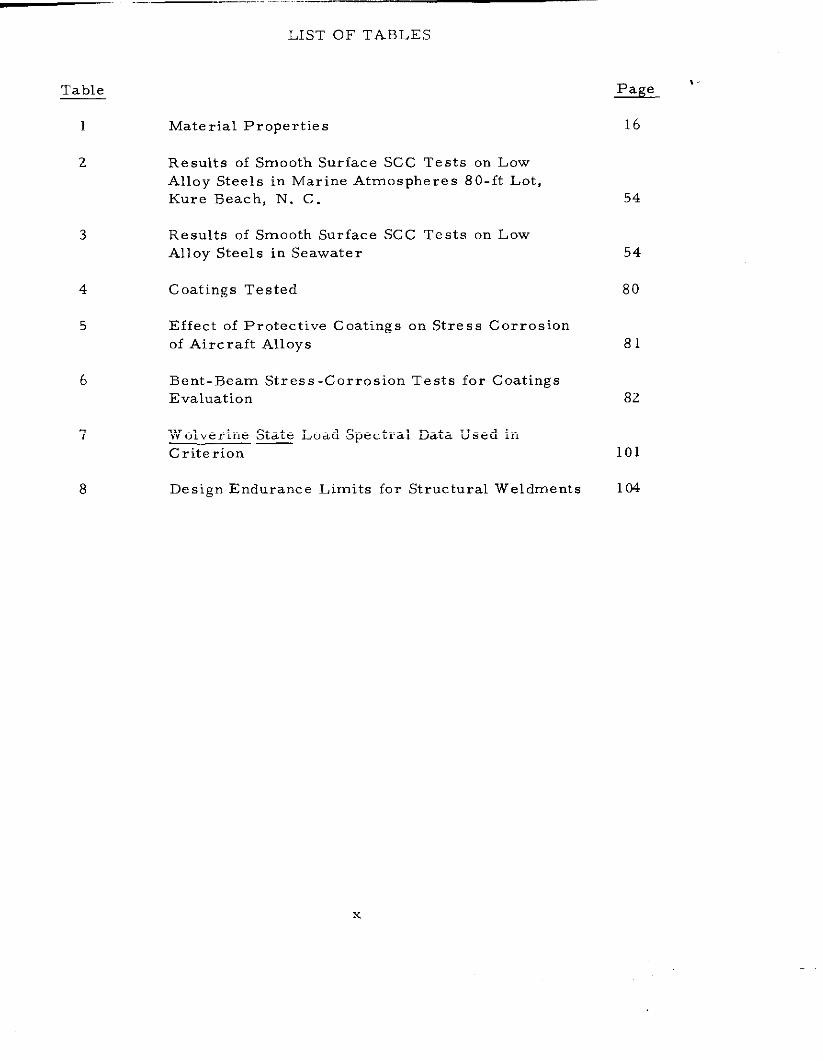
LIST OF TABLES
Table
1 Material Properties
2 Results of Smooth Surface SCC Tests on Low
Alloy Steels in Marine Atmospheres 80-ft Lot,
Kure Beach, N. C.
Results of Smooth Surface SCC Tests on Low
Alloy Steels in Seawater
Coatings Tested
Effect of Protective Coatings on Stress Corrosion
of Aircraft Alloys
Bent-Beam Stress-Corrosion Tests for Coatings
Evaluation
Wolverine State Load Spectral Data Used in
Criterion
Design Endurance Limits for Structural Weldments
2?2E’16
54
54
80
81
82
101
104
x
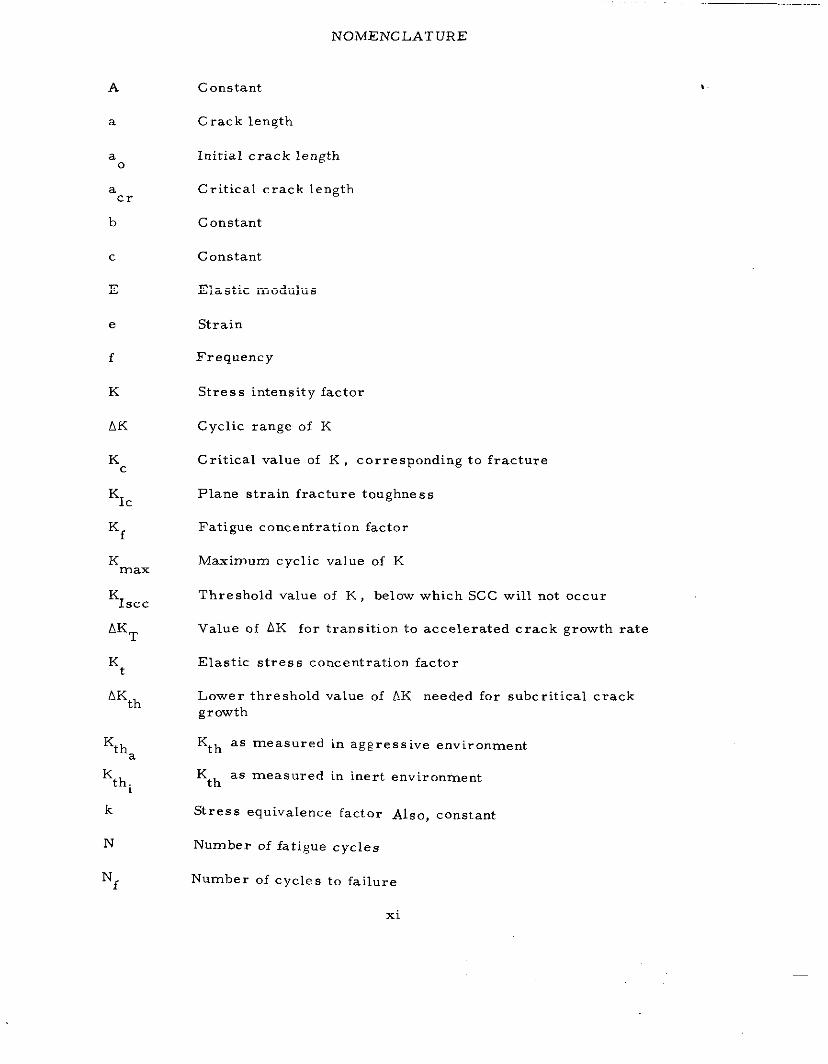
NOMENCLATURE
A
a
a0
acr
b
c
E
e
f
K
AK
Kc
KIc
‘f
Kmax
KIscc
AKT
Kt
AKth
‘tha
Kth
k
N
‘f
Constant
Crack length
Initial crack length
Critical crack length
Constant
Constant
Elastic modulus
Strain
Frequency
Stress intensity factor
Cyclic range of K
Critical value of K , corresponding to fracture
Plane strain fracture toughness
Fatigue concentration factor
Maximum cyclic value of K
Threshold value of K , below which SCC will not occur
Value of AK for transition to accelerated crack growth rate
Elastic stress concentration factor
Lower threshold value of AK needed for subcritical crack
growth
K th as measured in ag~ressive environment
Kth
as measured in inert environment
Stress equivalence factor Also, constant
Number of fatigue cycles
Number of cycles to failure
xi
—- - — —.. —..
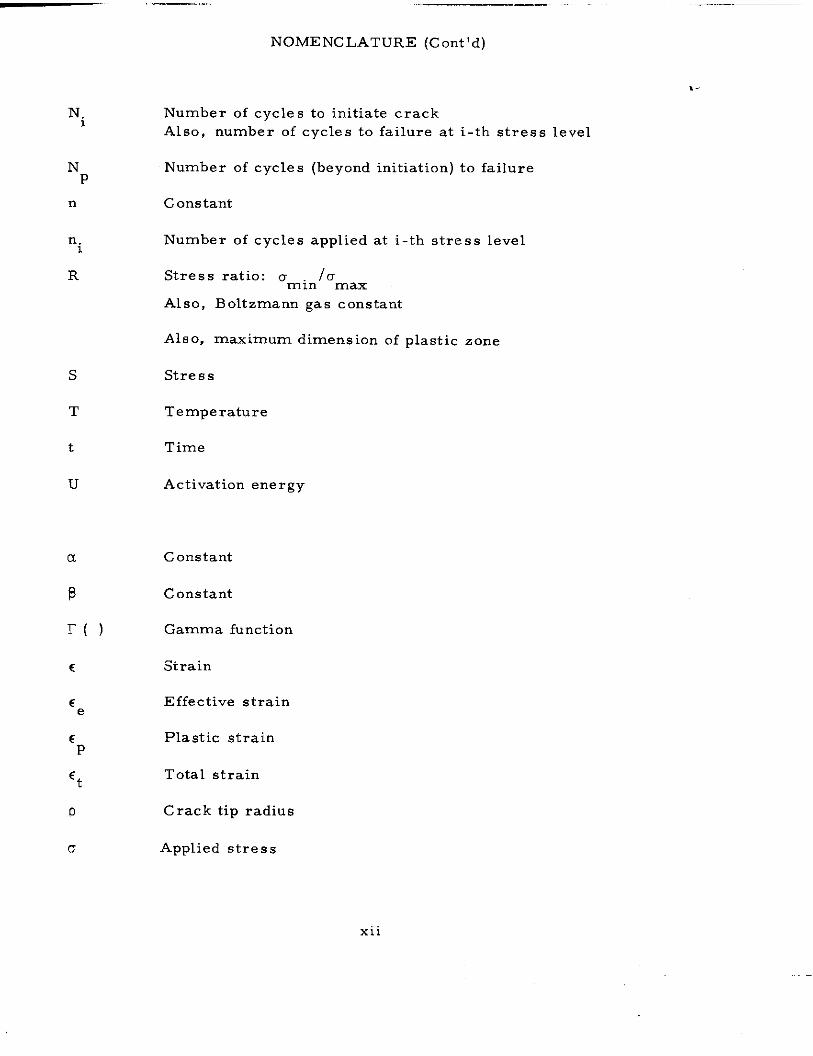
N.1
NP
n
n.1
R
s
T
t
u
a
ce
‘P
‘t
D
u
NOMENCLATURE (Cent’d)
,.
Number of cycles to initiate crack
Also, number of cycles to failure at i-th stress level
Number of cycles (beyond initiation) to failure
Constant
Number of cycles applied at i-th stress level
Stress ratio: uminrumax
Also, Boltzmann gas constant
Also, maximum dimens ion of plastic zone
Stress
Temperature
Time
Activation energy
Constant
Constant
Gamma function
Strain
Effective strain
Plastic strain
Total strain
Crack tip radius
Applied stress
xii
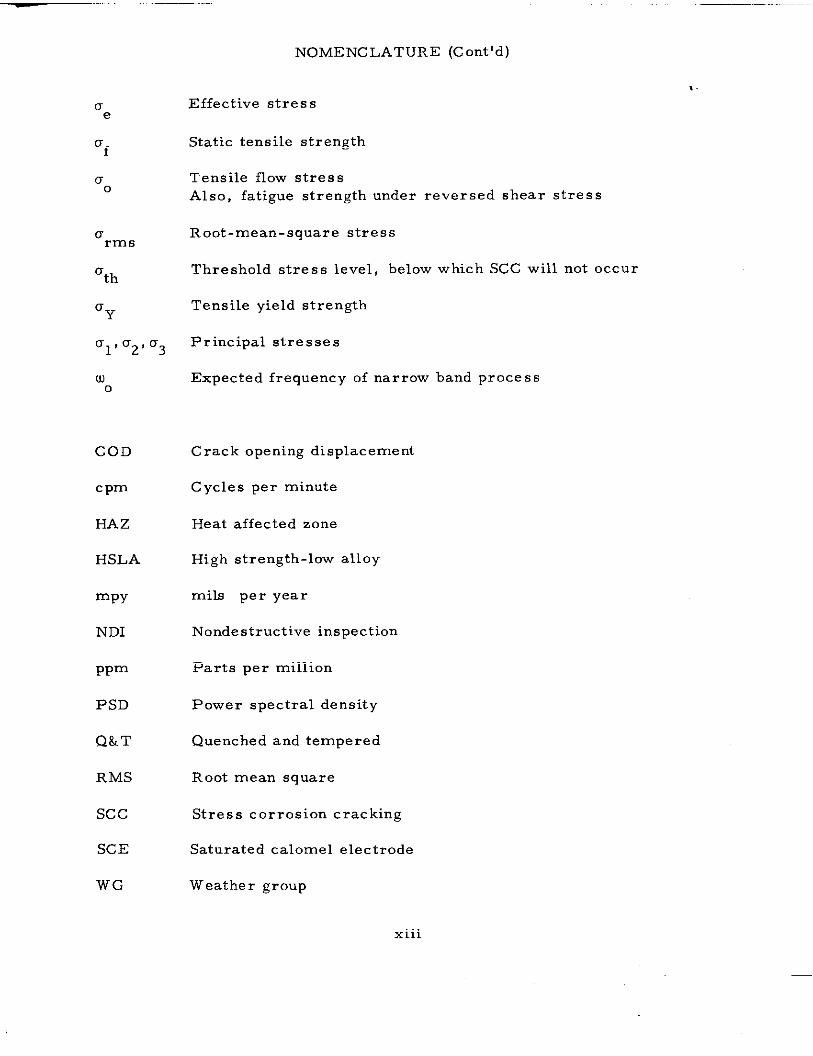
NOMENCLATURE (Cent’d)
u Effective stresse
‘fStatic tensile strength
c1 Tensile flow stress0
Also, fatigue strength under reversed shear stress
u Root-mean-square stressrms
‘thThreshold stress level, below which SCC will not occur
‘YTensile yield strength
‘1’’’03°3Principal stresses
w0
COD
c pm
FfAZ
HSLA
mPY
NDI
ppm
Ps13
Q&T
RMS
Sc c
SC E
WG
Expected frequency of narrow band process
Crack opening displacement
Cycles per minute
Heat affected zone
High strength-low alloy
roils per year
Nondestructive inspection
Parts per million
Power spectral density
Quenched and tempered
Root mean square
Stress corrosion cracking
Saturated calomel electrode
Weather group
X111
—--—.
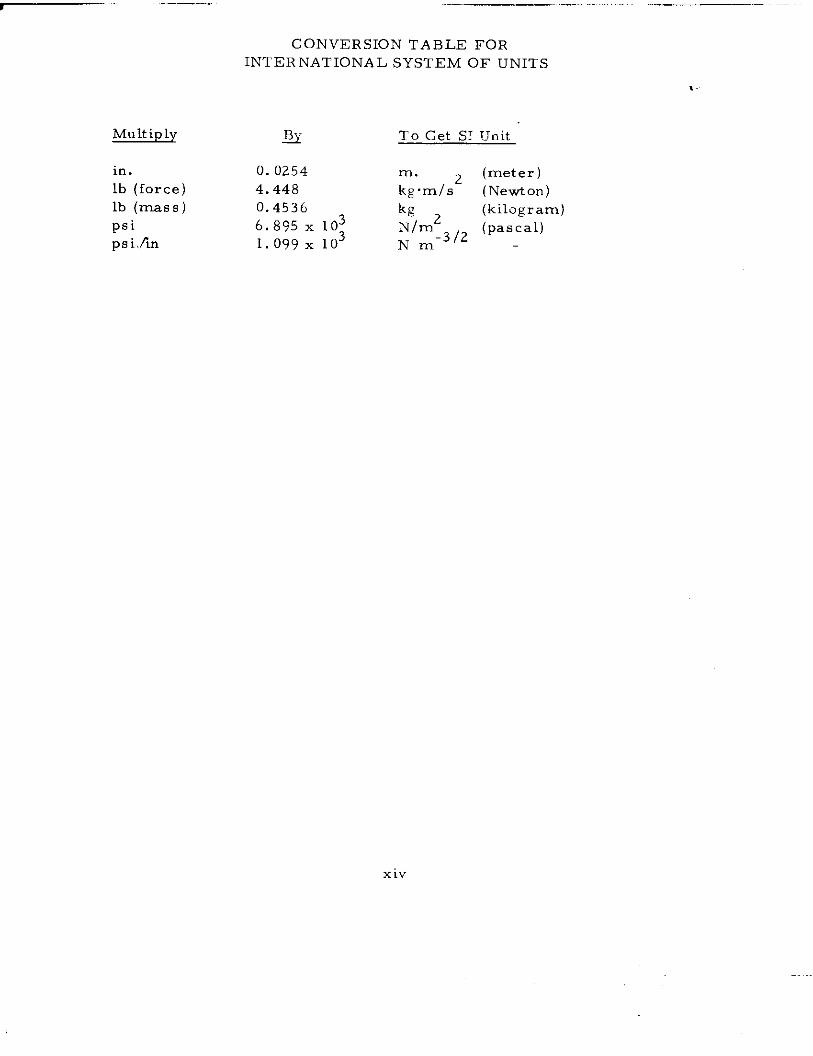
CONVERSION TABLE FOR
INTERNATIONAL SYSTEM OF UNITS
,.
Multiply BJ To Get S1 Unit
in. O. 0254 m. (meter)
lb (force) 4.448 kg. m/s2 (Newton)
lb (mass) 0.4536 kg (kilogram)
psi 6.895 X 10³ N/m2
psi,b 1.099X 10³ N rr-3/2 ‘pas~a’)
xiv
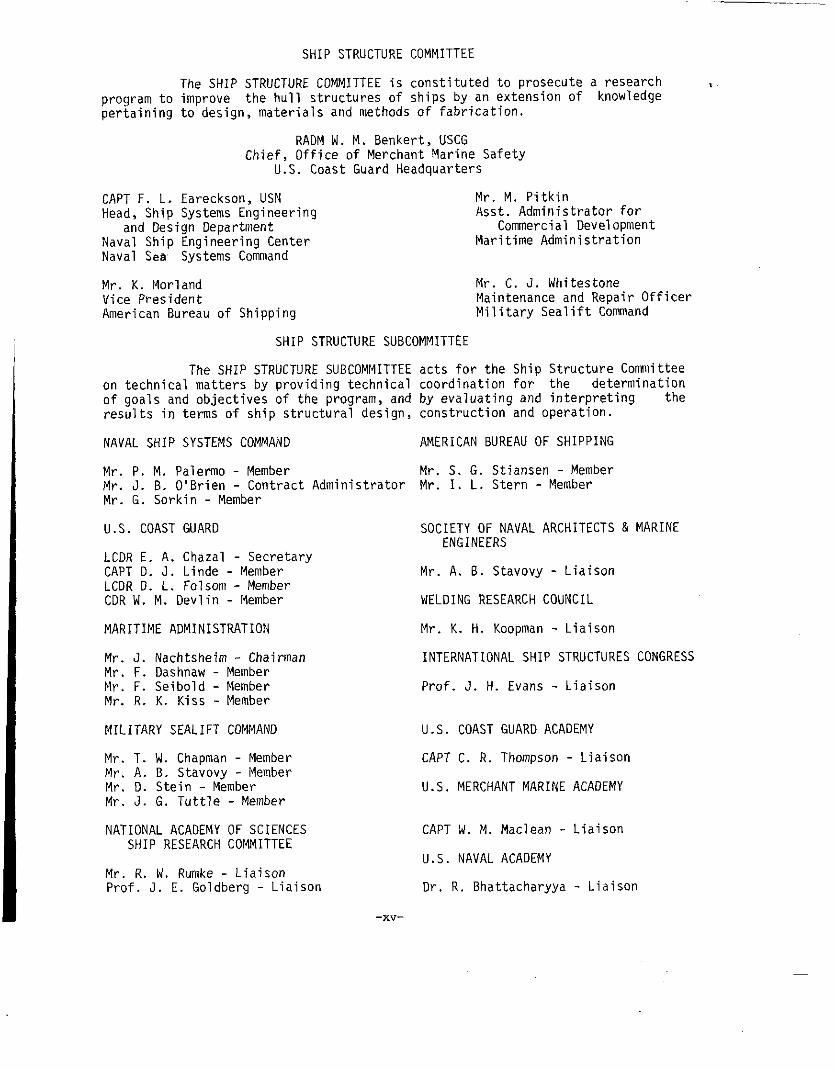
SHIP STRUCTURE
The SHIP STRUCTURE COMMITTEE is
..——.. _
COMMITTEE
constituted to prosecute a research ,.program to improve the hull structures of ships by an extension of knowledgepertaining to design, materials and methods of fabrication.
RADM W. M. Benkert, USCGChief, Office of Merchant Marine Safety
U.S. Coast Guard Headquarters
CAPT F. L. Eareckson, USN Mr. M. PitkinHead, Ship Systems Engineering Usst. Administrator for
and Design Department Commercial DevelopmentNaval Ship Engineering Center Maritime AdministrationNaval Sea Systems Command
Mr. K. Morland Mr. C. J. WhitestoneVice President Maintenance and Repair OfficerAmerican Bureau of Shipping Mi1itary Sealift Command
SHIP STRUCTURE SUBCOMMITTEE
The SHIP STRUCTURE SUBCOMMITTEE acts for the Ship Structure Conmlitteeon technical matters by providing technical coordination for the determinationof goals and objectives of the program, and by evaluating and interpreting theresults in terms of ship structural design, construction and operation.
NAVAL SHIP SYSTEMS COMMAND AMERICAN BUREAU OF SHIPPING
Mr. P. M. Palermo - MemberMr. J. B. O’Brien - Contract AdministratorMr. G. Sorkin - Member
U.S. COAST GUARD
LCDR E. A. Chazal - SecretaryCAPT D. J. Linde - MemberLCDR D. L. Folsom - MemberCDR W. M. Devlin - Member
MARITIME ADMINISTRATION
Mr. J. Nachtsheim - ChairmanMr. F. Dashnaw - MemberNr, F. Seibold - MemberMr. R. K. Kiss - Member
NIL ITARY SEALIFT COMMAND
Mr. T. W. Chapman - MemberMr. A. B. Stavovy - lMemberMr. D. Stein - MemberMr. J. G. Tuttle - Member
NATIONAL ACADEMY OF SCIENCESSHIP RESEARCH COMMITTEE
Mr. R. W. Rumke - LiaisonProf. J. E. Goldberg - Liaison
Mr. S. G. Stiansen - MemberMr. 1. L. Stern - Member
SOCIETY OF NAVAL ARCHITECTS & MARINEENGINEERS
Mr. A. 6. Stavovy - Liaison
WELDING RESEARCH COUNCIL
Mr. K. H. Koopman - Liaison
INTERNATIONAL SHIP STRUCTURES CONGRESS
Prof. J. H. Evans - Liaison
U.S. COAST GuARD ACADEMY
CAPT C. R. Thompson - Liaison
U.S. MERCHANT MARINE ACADEMY
CAPT W. M. Maclean - Liaison
U .S NAVAL ACADEMY
Dr. R. Bhattacharyya - Liaison

NOTES
, -
-xvi-
I. INTRODUCTION
This report constitutes the final report of Project SR-209, “AStudy
of Subcritical Crack Growth in Ship Steels. ‘r The stated purpose of this pro-
ject has been to:
!, . . . examine the several potential mechanisms exclu-
sive of brittle fracture by which cracks may form from
preexisting flaws and bywhlch cracks may grow, and
evaluate the importance of these mechanisms and their
consequence to the overall structural reliability of ships
constructed from high-strength steels. 11
With the prospect of high-strength, low-aUoy steels and their weldments (40-100 ksi tensile yield strengths) being selectively integrated into primary and
secondary ship structure, subcritical crack growth looms as a potentially
greater threat to ship structural reliability than formerly, when low.strength
steels and weldments were used exclusively. This research program madean in-depth study of the problem potential in using HSLA steels and weldments.
This was done in two steps. First, a critical assessment was made of theworld technical literature related to crack initiation and subcritical crack
growth in HSLA steels typical of those proposed for ship structural applica-
tion, including environmental factors. Second, this information was con-solidated into a practical criterion or methodology by which fail-safe structural
design maybe assured through realistic calculations of the crack initiation and
subcritical crack growth potential.
The remainder of this report consists of four technical chapters, plusthe references and an Appendix. Chapter II concerns crack initiation and sub-critical crack growth in ship steels and weldments, exclusive of environmen-
tal factors. This chapter addresses the initiation and growth processes in
terms of their micro structural causes and their phenomenological description,residual stress effects, and examines procedures for estimating initiation,growth, and cumulative damage. Chapter III addresses environmental factorsimportant to ship structure, particularly stress corrosion cracking, corro-
sion fatigue, and preventative techniques. Chapter IV presents a design cri-
terion for estimating crack initiation and subcritical crack growth lives in
welded ship structure, and elucidates its use by way of a detailed structural
design example. Chapter V summarizes the potential significance of crackinitiation and subcritical crack growth in ship steels, and presents a state-
ment of important problem areas in need of further study in order to strengthen
the proposed criterion. Following the references given in Chapter VI, the
Appendix provides background information related to ship steel and weldment
metallurgy, fabrication techniques, ship structural environments, and frac-
ture mechanics.
—
II. SUBCRITICAL CRACK GROWTH IN SHIP STEELSAND WELDMENTS
A. Crack Initiation in Ship Steels
1, Sources of Initiation
Crack initiation is the forerunner to subcritical crack growth
and means different things to different people. To a structural engineer,
crack initiation usually means the formation of a crack which is small withrespect to tbe critical size, but visible to the unaided eye. Once formed,
under suitable conditions of stress and time this crack will propagate sub-
critic al~y until it either arrests or triggers fast fracture. The materials
engineer, on the other band, views crack initiation as a local transformation
of tbe material, at the crystalline or subcrystalline level, in which micro-
surfaces are created. Another difference between these two viewpoints isthat the former considers crack initiation to be associated with tbe first
stages of growth from a preexisting geometric or material defect. The
materials engineer, however, is usually concerned with initiation as tbe
formation of a defect in an unflawed polycrystalline medium. Thus, the pre-
cise meaning of “crack initiation” depends upon one’s frame of reference,
and, ultimately, upon the means of observation.(l)
Crack initiation considerations are important simply for thereason that ignoring them can Lead to under predictions of fatigue life and
overly-conservative design. This is especially true in high-cycle fatigue,
where tbe crack initiation period occupies the greatest proportion of struc-
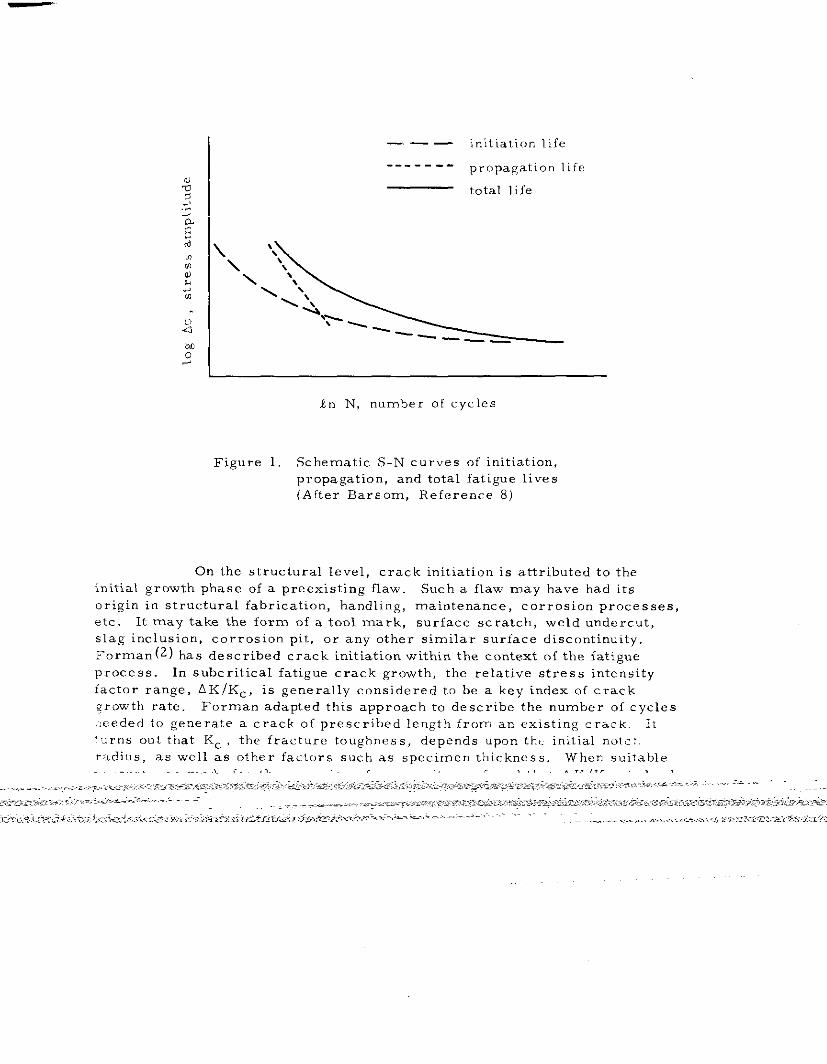
tural life. Figure 1 shows qualitatively the relative contribution of tbe crack
initiation period to total fatigue life for a structural steel. Tbe crack initia-tion period dominates in the high-cycle regime, provided no crack-like imper-fections are present to reduce or eliminate the initiation period in an actual
structural component.
Tbe current state-of-the-art regarding crack initiation is almostwholly descriptive, Few quantitative models are available which allow confi-
dent prediction of time or cycles-to-initiation as a function of mechanical
properties and loading conditions. This is true whether one considers initia-
tion to be flaw formation or initial growth of a preexisting flaw.
It is generally known that subcritical cracks will initiate at, orvery near to, the free surface of a structural component. Exceptions to this
rule will occur when there is a massi”e internal defect in tbe material, such
as a fold (over-roll) in plate steel or a slag inclusion in a weld region. Again,depending upon the viewpoint, initiation may be considered to be a process
activated on the structural scale or at the material micro mechanical level.
2
——— initiation life
------ - prc, pagation life
total life
?-n N, number of cycles
Figure 1. Schematic S-N curves of initiation,propagation, and total fatigue lives(After Barsom, Reference 8)
On the structural level, crack initiation is attributed to theinitial growth phase of a preexisting flaw. Such a flaw may have had itsorigin in structural fabrication, handling, maintenance, corrosion processes,
etc. It may take the form of a tool mark, surface scratch, weld undercut,slag inclusion, corrosion pit, or any other similar surface discontinuity.Forman(2) has described crack initiation within the context of the fatigue
process. In subcritical fatigue crack growth, the relative stress intensity
factor range, AK/Kc, is generally considered to be a key index of crack
qrowth rate. Forman adapted this approach to describe the number of cycles.eeded to generate a crack of prescribed length from an existing crack, It.,Jrn~ ““t that Kc , the fracture toughness, depends upon th,. initial note ?.rfidius, as well as other fa.turs such as specimen thickness, When suitableaccount was made for these various fac!ors, it was found that AK/K , irldeed,
described the experimental data (on 7075-T6 aluminum alloy) with a~ceptable
accuracy. This approach leads one to the conclusions that:
3
(a) cycles to crack initiation increases with cra’k tip rootradius and decreases with crack length; and
(b) the approach appears valid for a wide range of crack
initiation definitions.
2. Influence of Surface and Flaw Geometry
The particular configuration of a given flaw and its relation to
the applied stress field has a strong influence on the crack initiation period.
Some of the more important aspects are mentioned below. Very little quanti-
tative data are available, however, for comparison.
One of the most important effects is the relative orientation ofthe flaw with respect to the loading axis. If one considers a notch-like sur-
face defect, the initiation process will develop most rapidly if the plane of
the defect is oriented perpendicular to the direction of maximum tensile stress.
An existing flaw will not initiate a fatigue crack if the plane in which it lies is
parallel to this direction and there are no other stresses acting.
A second important factor is the root radius, or the “sharpness”
of the notch. In general, sharper notches accelerate crack initiation. For-man(2) has shown that fatigue crack initiation from a preexisting flaw depends
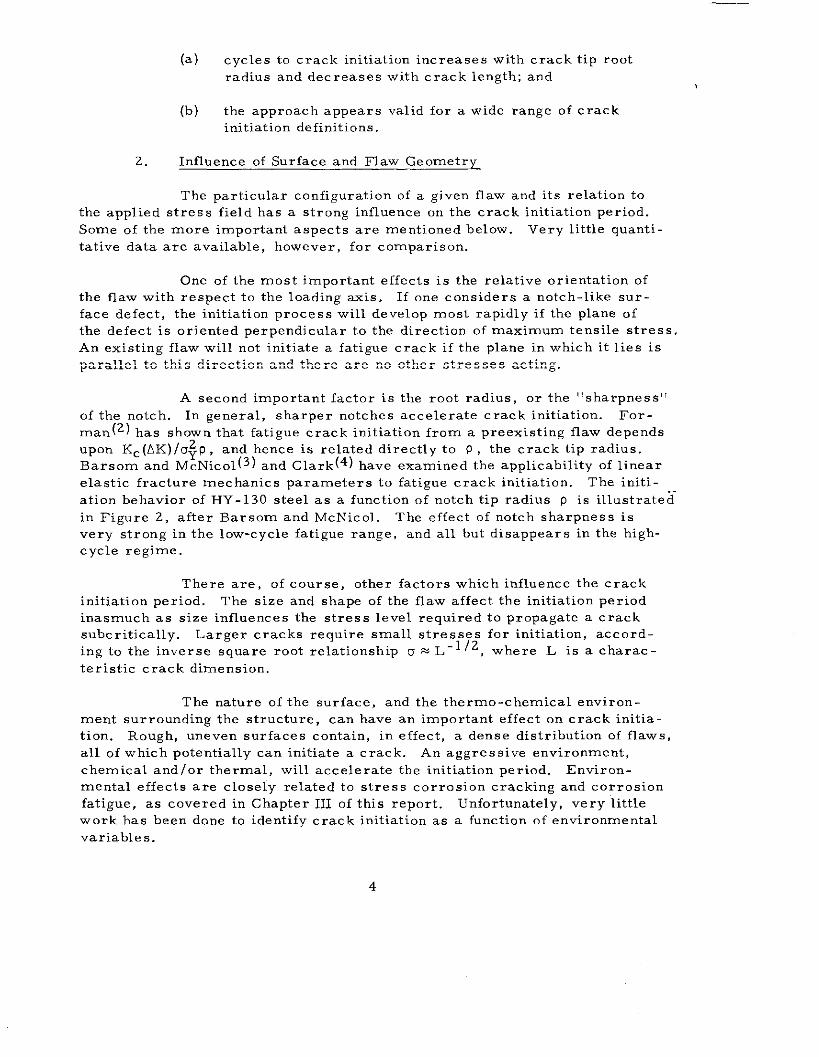
upOn Kc(AK)/u~P, and hence is related directly to P, the crack tip radius.Barsom and McNicol(3) and Clark(4) have examined the applicability of linear
elastic fracture mechanics parameters to fatigue crack initiation. The initi-
ation behavior of HY- 130 steel as a function of notch tip radius p is illustrate ~-
in Figure 2, after Barsom and McNicol. The effect of notch sharpness is
very strong in the low-cycle fatigue range, and all but disappears in the high-cycle regime.
There are, of course, other factors which influence the crack
initiation period. The size and shape of the flaw affect the initiation period
inasmuch as size influences the stress level required to propagate a cracksubcritically. Larger cracks require small stresses for initiation, accord-
ing to the inverse square root relationship u N L -1/2 , where L is a charac-
teristic crack dimension.
The nature of the surface, and the tbermo-chemical environ-
ment surrounding the structure, can have an important effect on crack initia-
tion. Rough, uneven surfaces contain, in effect, a dense distribution of flaws,
all of which potentially can initiate a crack. An aggressive environment,
chemical and /or thermal, will accelerate the initiation period. Environ-mental effects are closely related to stress corrosion cracking and corrosion
fatigue, as covered in Chapter III of this report. Unfortunately, very little
work bas been done to identify crack initiation as a function of environmental
variables.
mE 1 1 1 1 1 [ I I I 1 I I I 1 1 I I I 1 I 1 I 1 I
z “3
1000 –
41XI0-600 -
p , inch400 —
~: ‘no lg.+,
a
- 100 –600-
II400 60
40
2U0
1 inch =25.4mm
It2UI I I I 1 I I I I I I I I 1 I I I I
11 ! 1 ! I I
2 4 6 10 a 40 60 100 230 4W 600
FATIGUE-CRACK-INITIATIONCYCLE, N X 103
Figure 2, Correlation of fatigue-crack-initiation life with the parameter
K1/fb for HY-130 steel. (After Barsom and McNicol,Reference 3)
3. Model for Crack Initiation
This section describes a quantitative model for crack initiationproposed by Topper, Wetzel and Morrow,(5) and subsequently studied byGowda, et aI, (6) The procedure is based “pen Neuber’s notch stress analy -——sis and basically rests on the following equation:
Kf%mi =i-GRE (1)
where Kf is the known fatigue concentration factor: Kf = 1 + (Kt - 1)/(1 + a/o)
in which Kt is the usual elastic stress concentration factor, p the root radius
of the notch, and a is a material constant determined from long-life fatiguedata for sharply notched specimens in the manner described in Reference (5).
Also, AS and Ae are the net section stress and strain ranges applied to a
sharply notched member, and Ao and A< are the local stress and strain
ranges at the root of a blunt notch or in a smooth specimen. In Equation (1)
the left side represents the average mechanical state in a notched structure,
while tbe right side represents conditions local to the notch tip in an
ideal smooth specimen. Thus, tbe expression implies equal crack initiationperiods for notched and ummtched str”ct”ral elements, provided tbe net sec-
tion stresses in the sharply notched specimen are the same as the notch stresses
in the smooth specimen. This expression enables determination of fatiguecrack initiation lives of notched members using smooth specimen data, or
vice-versa. The method is limited to fatigue crack initiation under conditions
of zero mean stress.
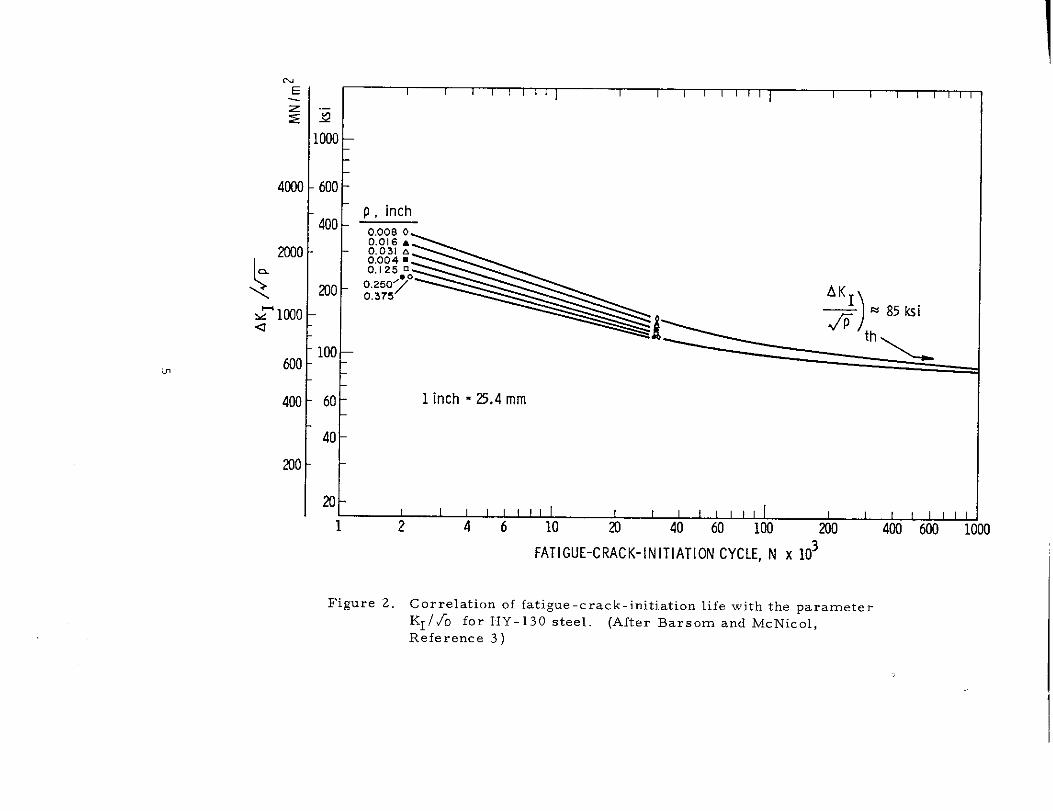
The procedure involves constructing a “master plot, “ or graph
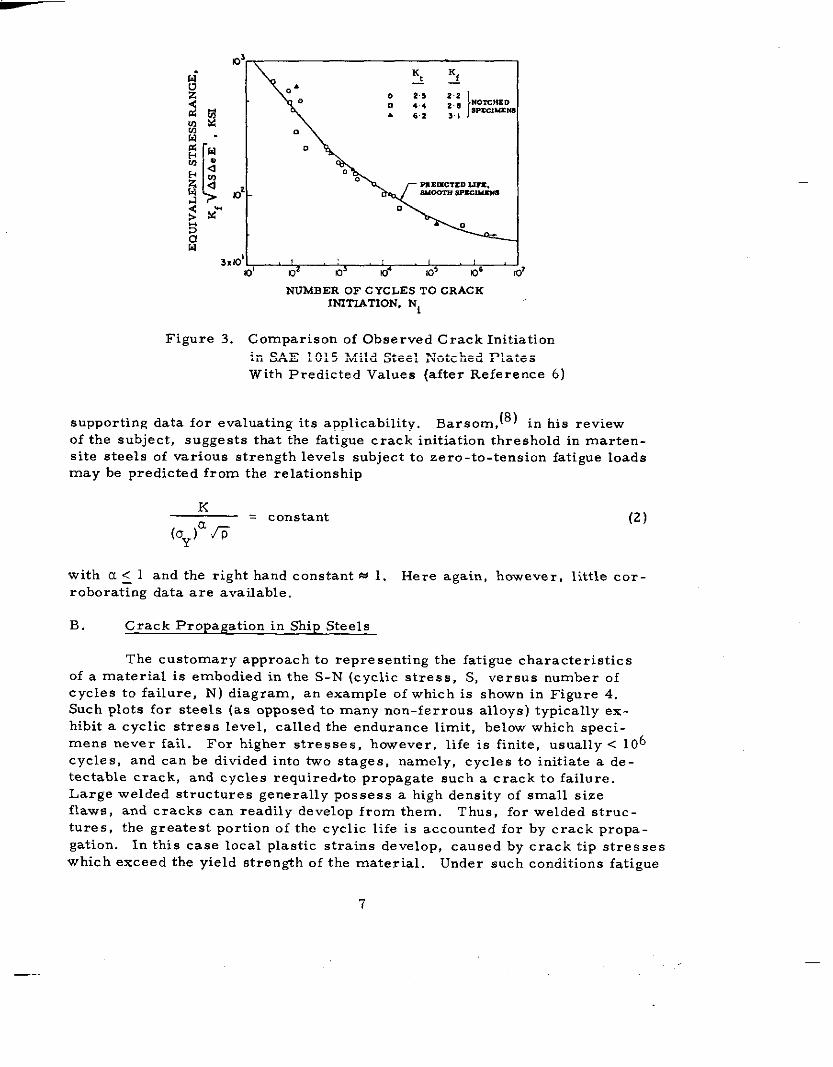
of effective stress Kf ~= .,,... Ni , cycles to crack initiation, for thematerials of interest. Figure 3 shows one such curve for SAE 1015 mild.teel. (6) The solid line ~a~ con~tructed from ~nnotched specimens, for
which the value of =was calculated from steady-state cyclic stressand strain ranges. The data points were taken from experiments with notchedplates. The correlation is reasonably good, which tends to validate the theory
for this material. This procedure enables initiation predictions for many types
of notched specimens from readily available smooth specimen fatigue data.
Note that curves of AoAeE versus life can be derived from any two of the fol-
lowing curves: stress versus life, total strain versus life, plastic strain ver-sus life, and cyclic stress versus strain.
Aside from the approach just outlined, other investigators ha”e
suggested procedures for estimating tbe number of cycles to iniliate a fatigue
crack. Manson and Hirschberg(7) proposed an empirical method which usesas input the fatigue behavior of unnotched specimens to predict the number of
cycles required to initiate an ‘Engineering sizet, crack, This method is some-what more complex than that described previously, and there has been little
6
3.UJ’ 1 , 1d d r.+ 0’ 10’ 0’
NUMBER OF CYCLES TO CRACKINITIATION, N,
L
Figure 3. Comparison of Observed Crack Initiation
in SAE 1015 Mild Steel Notched Plates
With Predicted Values (after Reference 6)
Bar~om,(8) in his reviewsupporting data for evaluating its applicability.
of the subject, suggests that the fatigue crack initiation threshold in marten.site steels of various strength levels subject to zero-to-tension fatigue loads
may be predicted from the relationship
K= constant
(Uy)= 6
(2)
with a < 1 and the right hand constant = 1. Here again, however, little cor -
roborat%g data are available.
B. Crack Propagation in Ship Steels
The customary approach to representing the fatigue characteristicsof a material is embodied in the S-N (cyclic stress, S, versus number of
cycles to failure, N) diagram, an example of which is shown in Figure 4.Such plots for steels (as opposed to many non-ferrous alloys) typically ex-hibit a cyclic stress level, called the endurance limit, below which speci-
mens never fail. For higher stresses, however, life is finite, usually < 106
cycles, and can be divided into two stages, namely, cycles to initiate a de-tectable crack, and cycles requiredrto propagate such a crack to failure.
Large welded structures generally possess a high density of small sizeflaws, and cracks can readily develop from them. Thus, for welded struc-
tures, the greatest portion of the cyclic life is accounted for by crack propa-
gation. In this case local plastic strains develop, caused by crack tip stresseswhich exceed the yield strength of the material. Under such conditions fatigue
7
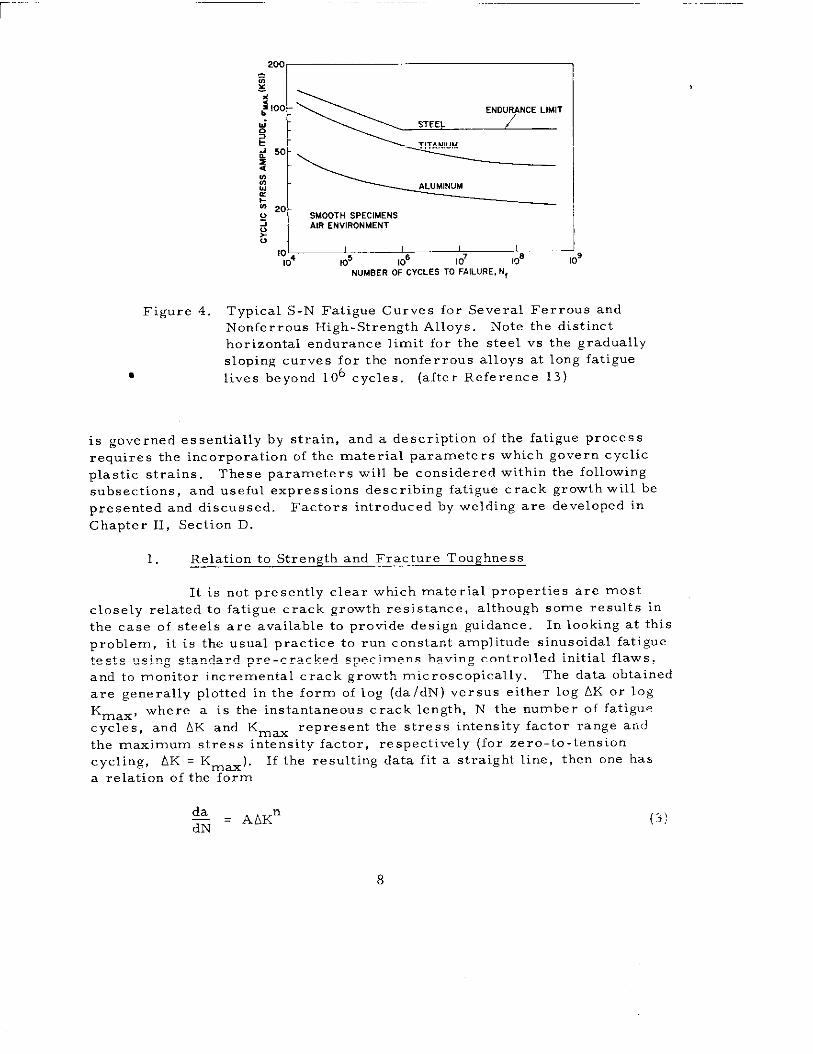
Figure 4.
●
,IJ L10*
SMOOTH SPECIMINSAIR ENVIRONMENT
1 ! 1 I
105 106 107 !08 109NUMBER OF CYCLES TO FAILURE. N,
Typical S-N Fatigue Curves for Several Ferrous and
Nonferrous High-Strength A~loys. Note the distincthorizontal endurance limit for the steel vs the gradually
sloping curves for the nonferrous alloys at long fatigue
lives beyond 106 cycles. (after Reference 13)
is governed essentially by strain, and a description of the fatigue process
requires the incorporation of the material parameters which govern cyclicplastic strains. These parameters will be considered within the following
subsections, and useful expressions describing fatigue crack growth will be
presented and discussed. Factors introduced by welding are developed in
Chapter II, Section D.
1. Relation to Strength and Fracture Toughness
It is not presently clear which material properties are most
closely related to fatigue crack growth resistance, altbougb some results in
the case of steels are available to provide design guidance. In looking at this
problem, it is the usual practice to run constant amplitude sinusoidal fatigue
tests using standard pre-cracked specimens having controlled initial flaws,and to monitor incremental crack growth microscopically. The data obtained
are generally plotted in the form of log (da/dN) versus either log AK or log
K ~ax, where a is the instantaneous crack Iengtb, N the number of fatigue
cycles, and AK and Km= represent the stress intensity factor range and
the maximum stress intensity factor, respectively (for zero-to-tension
cycling, AK ‘ Km= ). If the resulting data fit a straight line, then one has
a relation of the form
da
dN= AAKn
8
(3)
where the dependence of crack growth rate on stress intensity is reflected in<he ~Iope ~ and interce Pt A obtained from the plot of 10g (da/dN) versus ~Og
AK.
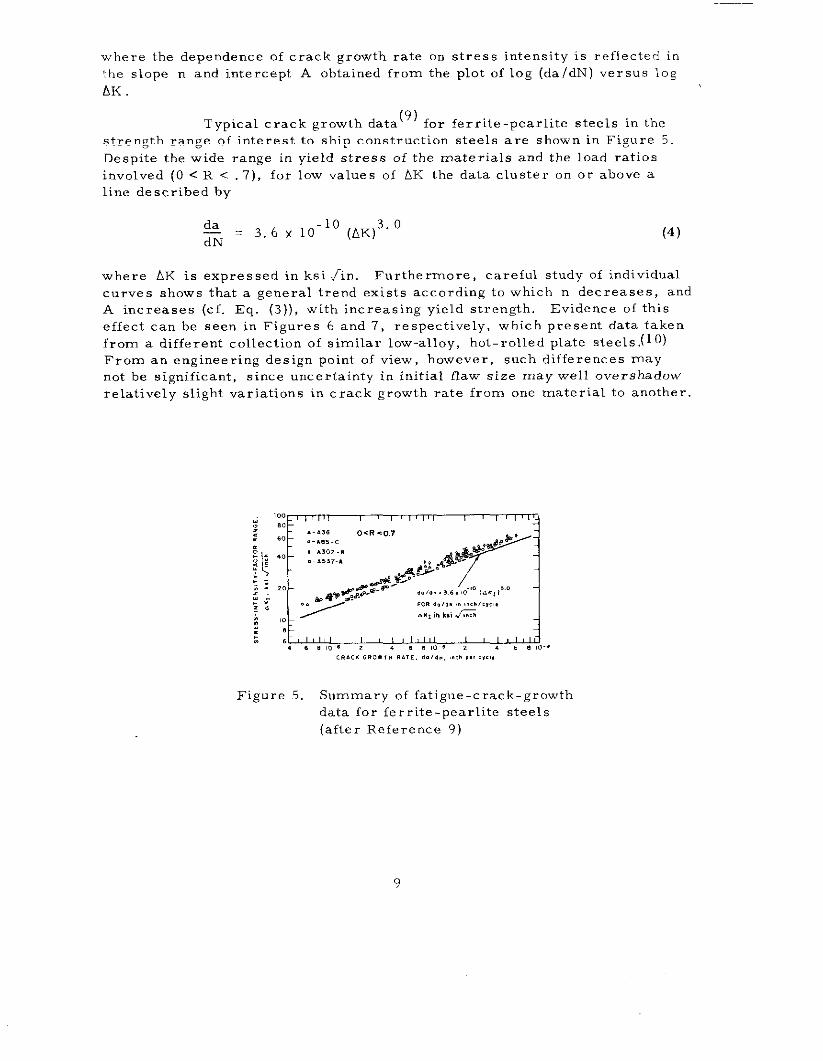
Typical crack growth data(9)
for ferrite -pearlite steels in the
strength range of interest to ship construction steels are shown in Figure 5.
Despite the wide range in yield stress of the materials and the load ratios
in”olved (O < R < 7), for low “alues of AK the data cluster on or above a
line described by
da= 3.6x1O
-loTN
(AK)3” 0 (4)
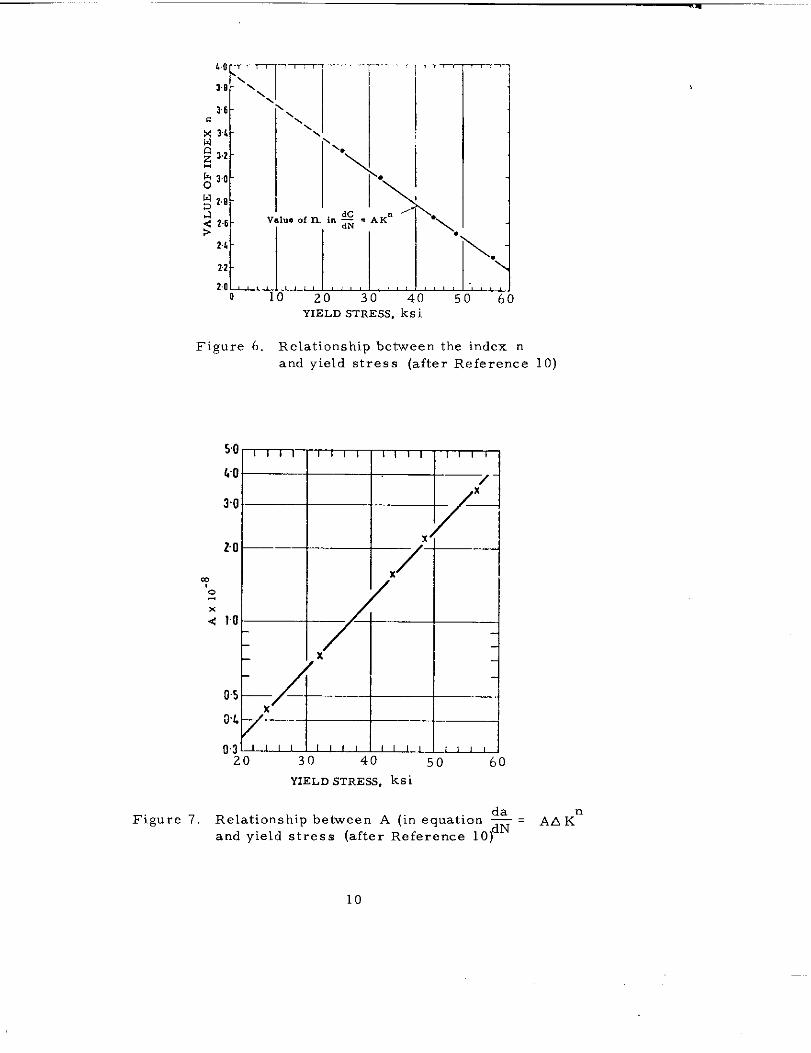
where AK is expressed in ksi /in. Furthermore, careful study of individual
curves shows that a general trend exists according to which n decreases, and
A increases (cf. Eq. (3)), with increasing yield strength. Evidence of this
effect can be seen in Figures 6 and 7, respectively, which present data taken
from a different collection of similar low-alloy, hot-rolled plate steels.
From an engineering design point of view, however, such differences may
not be significant, since uncertainty in initial flaw size may well overshadow
relatively slight variations in crack growth rate from one material to another.
,..,. . . . . . . ,,, ,, ,., ,”, ,.,, ,., .,.,,
Figure 5. Summary of fatigue-crack-growth
data for ferrite -pearlite steels
(after Reference 9)
9
—
‘“\
.-L.o
‘T--
3 B ‘\
‘\\36 -
c ‘\
x 3L- ‘.M~ 32.
g 30 .
:28‘YdC n
<26>
va’”” “f ‘ ‘n TN = A K “\a
24
?2
200 10 20 30” 40
YIELD STRESS. ksi
Figure 6. Relationship between the index n
and yield stress (after Reference 10)
so 1 I I I 1 I I [ I I I I
(0 /“”/I I —/
_T7’ti
05~/ 1 I I
I I i I
03 1 [ 1 ! ! I 1 1 I I ,
20 30 40 50 60
YIELD STRESS, ks i
Figure 7. Relationship between A (in equation & . AAKn
and yield stress (after Reference 10)
10
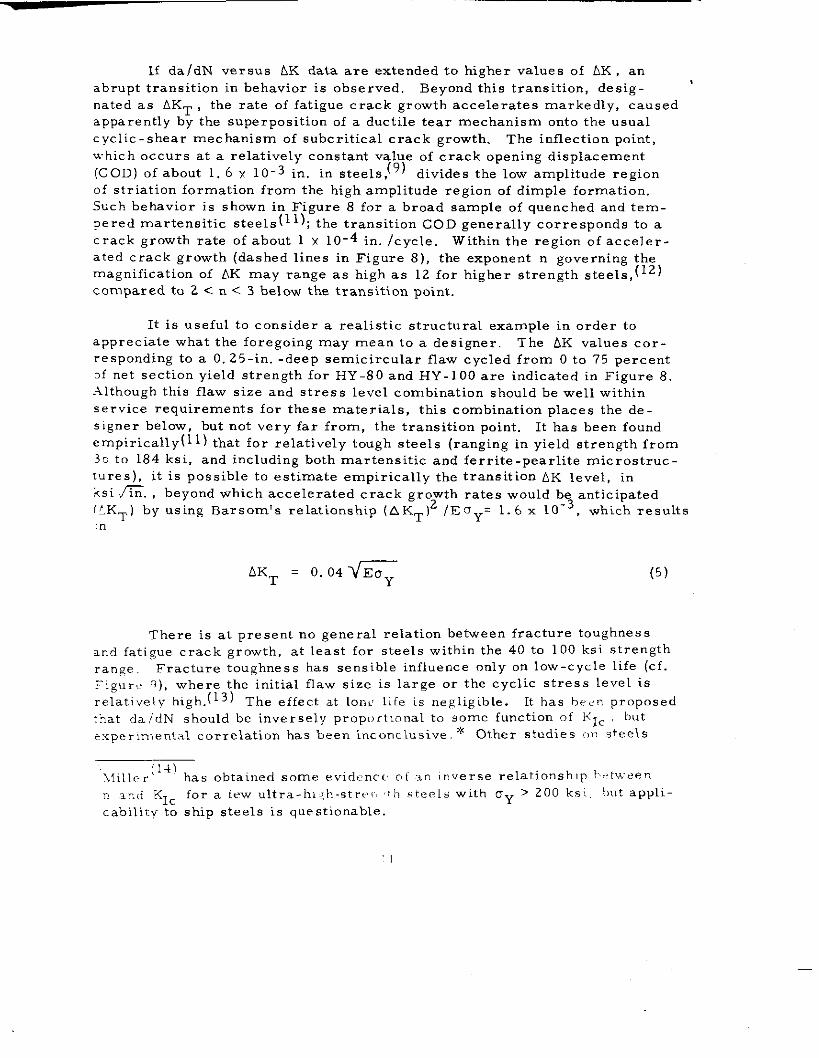
If da/dN versus AK data are extended to higher values of AK , an
abrupt transition in be bavior is observed. Beyond this transition, desig-nated as AKT , the rate of fatigue crack growth accelerates markedly, caused
apparently by the super pOsiti On Of a ductile tear mechanism onto the usualcyclic-shear mechanism of subcritical crack growth. The inflection point,which occurs at a relatively constant value of crack opening displacement
(COD) of about 1.6 x 10⁻³ in. in steels, (9) divides tbe low amplitude region
of striation formation from the high amplitude region of dimple formation.
Such behavior is shown in Figure 8 for a broad sample of quenched and tem-
pered martensitic steels(l 1); the transition COD generally corresponds to a
crack growth rate of about 1 x 10⁻⁴ in. /cycle. Witbin the region of acceler-ated crack growth (dashed lines in Figure 8), the exponent n governing themagnification of AK may range as high as 12 for higher strength steels,
compared to 2 < n < 3 below the transition point.
It is useful to consider a realistic structural example in order to
appreciate what the foregoing may mean to a designer. The AK values cor-responding to a O. 25-in. -deep semicircular flaw cycled from O to 75 percent
of net section yield strength for HY-80 and HY-1OO are indicated in Figure 8..Although this flaw size and stress level combination should be well within
service requirements for these materials, this combination places the de -signer below, but not very far from, the transition point. It has been found
empirically that for relatively tough steels (ranging in yield strength from30 to 184 ksi, and includiug botb martensitic and ferrite -pearlite microstruc-
ture), it is possible to estimate empirically the transition AK Ievel, in
ksi ~. , beyond which accelerated crack growth rates would be anticipated(LKT) by using Barsomts relationship (A KT)2 /Euy= 1.6 x 10⁻³, which resultsn
AKT = 0.04 @ (5)
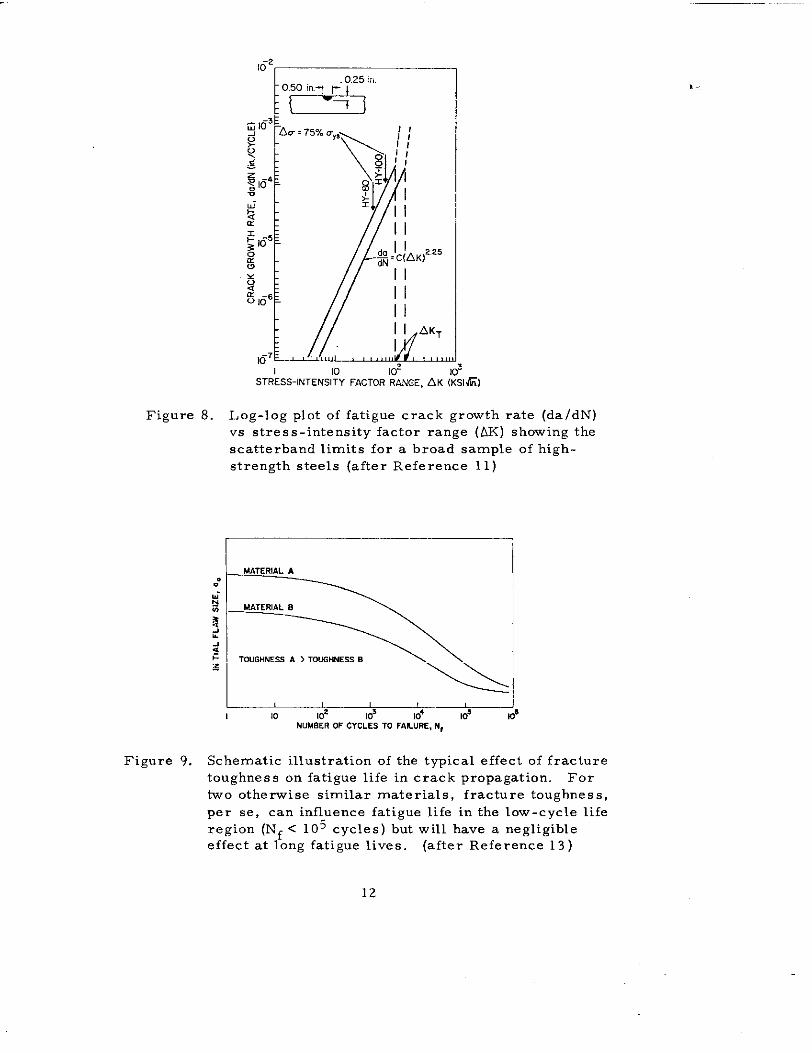
There is at present no general relation between fracture toughnessand fatigue crack growth, at least for steels within the 40 to 100 ksi strength
range, Fracture toughness has sensible influence only on low-cycle life (cf.
:igure Q), where the initial flaw size is large or the cyclic stress level is
relatively high. (13) The effect at lon~, Li[e is negligible. It has been proposed
:hat daid N should be inversely proportional to some function of K:< but
s.sperimental correlation has been inconclusive * Other studies on steels
{!4)!sfiller has obtained some eviclence of :.n inverse relationship Vetu’e+?n
R anci K1= for a few ultra -hl:h-strw It] steels with OY > 200 ksi, but appli-
cability to ship steels is questionable.
..- —
162
E3—
.0.25 i<.0.50 i..q ~
7
I
;1m
Figure 8. Log-log plot of fatigue crack growth rate (da/dN)
vs stress-intensity factor range (AK) showing the
scatterband limits for a broad sample of high-
strength steels (after Reference 11)
, —J10 10$
~,
NuM& OF CYC:S TO FAL~RE, N,
, -
Figure 9. Schematic illustration of the typical effect of fracture
toughness on fatigue life in crack propagation. For
two otherwise similar materials, fracture toughness,
per se, can influence fatigue life in the low-cycle life
region (Nf < 105 cycles) but will have a negligibleeffect at long fatigue lives. (after Reference 13 )
12
—-’
have shown that the connection between growth rate and fracture toughnessis a function of the thermo-chemical environment, with no obvious relation- ‘
s hip existing for te sts carried out in inert environments.
From the foregoing, it may be concluded that:
(a) For ship steels having similar microstructure, crack
growth rates are essentially independent of material
yield strength and fracture toughness.
(b) The AK corresponding to accelerated crack growth in
ship steels is proportional to ~.
2.. Influence of Microstructure
There are a number of microstructural parameters whichmight be suspected of influencing cyclic crack growth: stacking fault energy,
degree of cold work (i. e. , initial defect structure), prior austenitic grain
size, inclusion content and morphology, and the carbide-ferrite structure.
For the case of ship steels, it appears that only the latter two factors are
of major significance. The relative insensitivity of crack growth to the otherfactors has been reviewed by Plumbridge. (~5) Only a small number of crack
growth studies have involved a sufficient variety of steels such that valid,
general conclusions may be drawn regarding the role of microstructure.
Of these studies, the careful, practical works by Barsom (9) and by Heiser
and Hertzberg(16) offer guidance in the present context.
Barsom studied fatigue crack growth rates in ferrite -pearlite
steels ranging in yield strength from 36 to 59 ksi (discussed previously) andin quenched and tempered marten sites ranging in strength from 87 to 184 ksi
(the lower range included HY-80). All specimens were machined from struc-tural plates ranging from 1 to 2 in. thickness. It was found that the rate ofcrack growth for ferrite -pearlite steels was described by Equation (4) (ear-
Iier), while for the marten sitic steels,
da= O.66X1O
-8
TN
~AK)2. 25(6)
with AK expressed in ksi G. From these results, it is evident that prior
to the rate-of-growth transition, the crack extens ion rate at a given value of
stress intensity factor is lower in ferrite -pear~ite steels than in martensitic
steels. Although the exponent in Equation (4) is larger than that in Equation (6),
the value of the proportionality constant A is much smaller for tbe feri-ite -
pearlite steels than for the martensites. Therefore, Equation (6) may be
,used as a general, conservative relation for calculating ap proximate crack
zrowth rates, precedin~tran sition, for both classes of steel.
13
It can be helpful to understand wh these differences in growth
rate exist. ?From the observations of Barsom, 9, it seems that two factors
combine to lower the net crack growth rate of tbe normalized-type steels incomparison with the marten sites. First, severe secondary cracking (crack
branching) is observed in the former steels, but not in the latter. The secon-
dary cracks tend to “share ,, the crack-tip COD with the main crack, thereby
reducing the effective stress-intensity factor for the main crack. Secondly,
the ferrite -pearlite matrix microstructure can be looked at as a “particulate
composite” material, with the pearlitic carbides playing the role of brittle,
strong micro-ligaments, immersed in a relatively ductile ferrite matrixthrough which the main crack propagates. It has been proposed that as the
main crack moves through the ferrite, bypassing certain pearlite colonies,
it leaves behind unbroken, load-bearing ligaments of pearlite, which eventually
would fracture when loaded to their tensile instability. Because these liga-ments carry a portion of the applied stress, the actual stress intensity at the
crack tip is further reduced, again tending to lower the measured crack growth
rate.
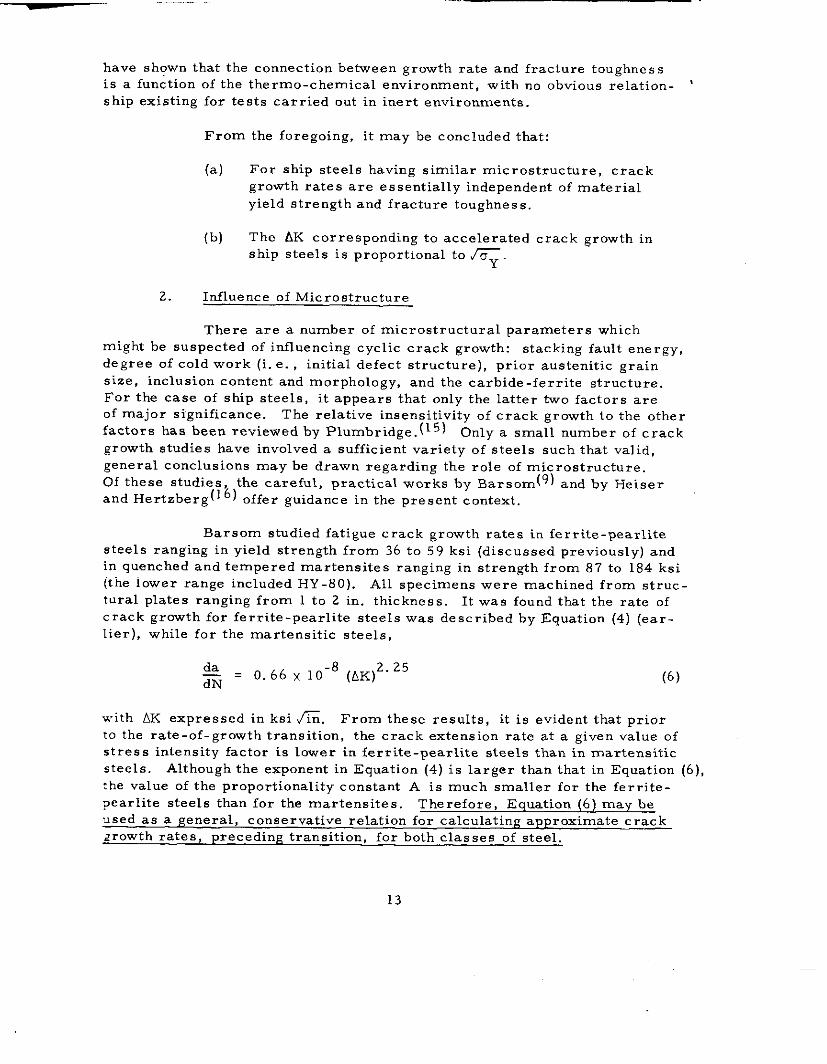
The anisotropy of fatigue crack propagation in bet-rolled alloysteel plate was studied for three mutually perpendicular crack orientations
(Figure 10) by Heiser and Hertzherg.(16) By beat treating the material ap-
propriately, they produced both ferrite -pearlite and martensitic microstruc-
ture with a range of strengths (49 - 144 ksi), having both banded and homo-geneous marten site-ferrite and ferrite -pearlite macro structures. The hot
rolling produced a preferential alignment of nonmetallic inclusions parallel
to the rolling direction, which was not altered during subsequent heat treat-
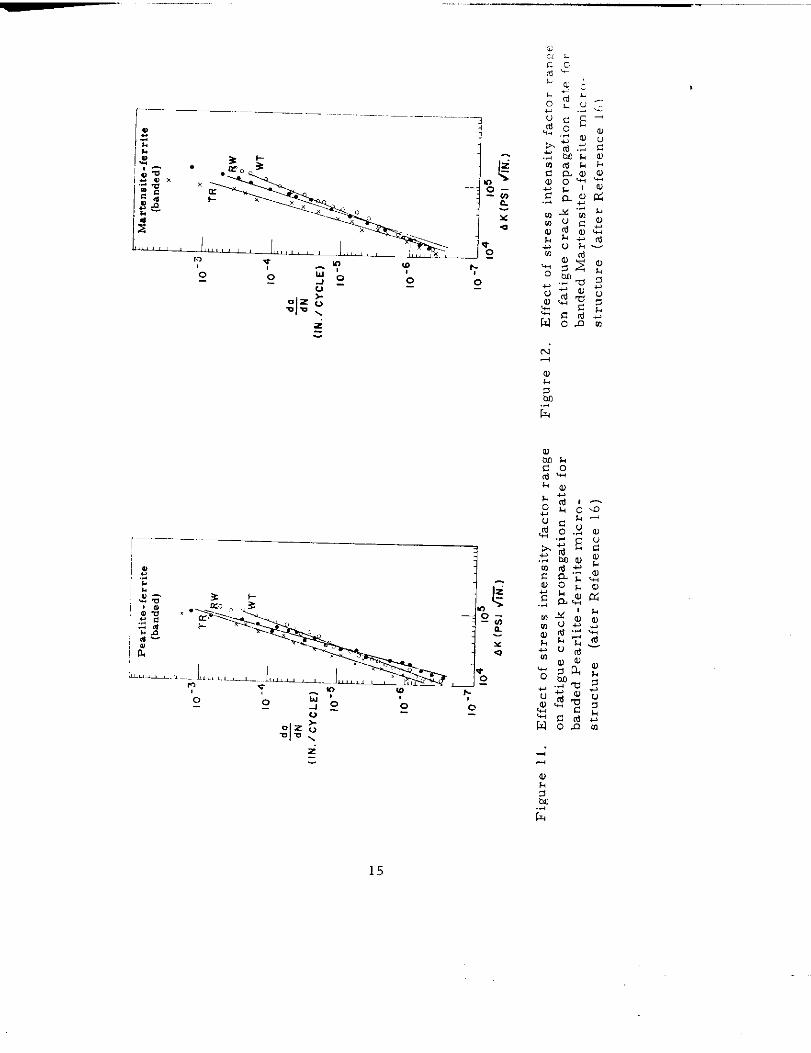
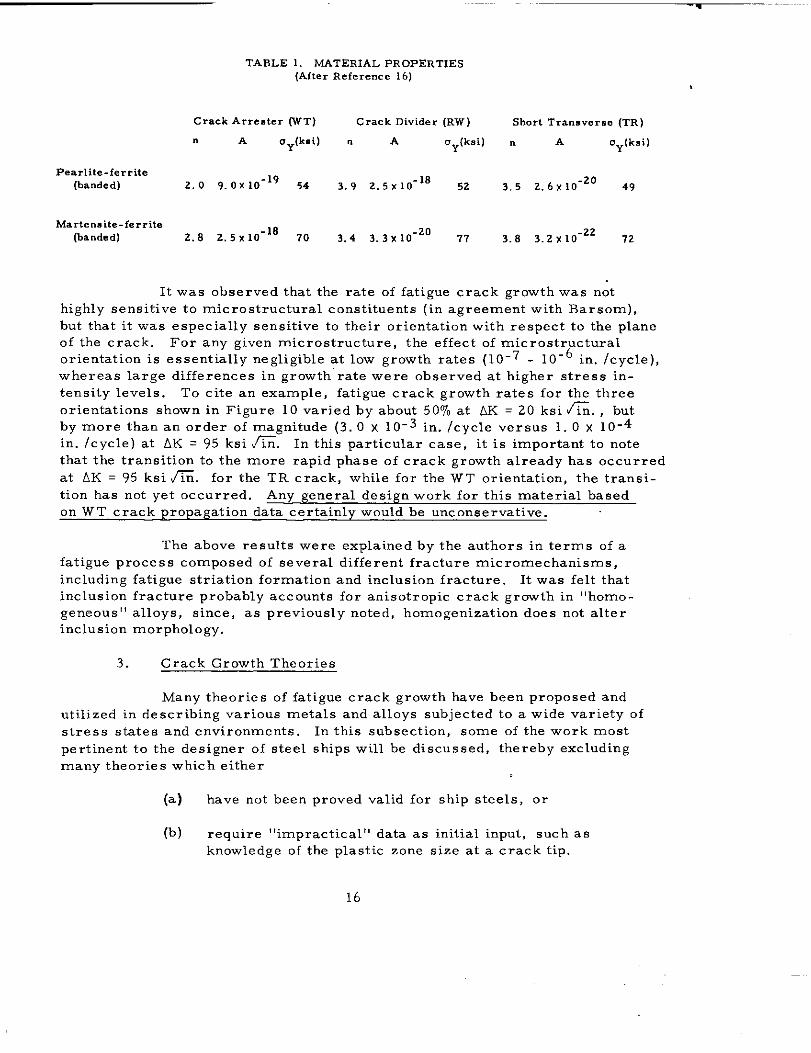
ments. Crack growth rates for all of the materials were correlated with AK.Representative data for banded ferrite -pearlite and banded martens ite-ferrite
are shown in Figures 11 and 12 (banding versus homogeneous was quite similar),The material constants n , A , and ay (as defined in Equation (3)) are tabulated
in Table 1.
➤✎✎✍✿
,.—.— _.
“~
z“=
15
—.
TABLE 1. MATERIAL PROPERTIES(After Reference 16)
Crack Arrester WT) Crack Divider (RW) Short Transverse (TR)
nA oy(ksi) n A oy(ksi) n A oy(ksi)
Pearl ite-ferrite(banded) 2,0 9.0,10”’9 ,4 3.9 2.5x10-’8 52 3,5 2.6,10-20 49
Marten. ite-fer rite(b.mded) 2.8 2,3x10-’8 70 3.4 3.3 X1O-’” 77 3.8 3.2 x 10⁻²² 72
It was observed that the rate of fatigue crack growth was not
highly sensitive to micro structural constituents (in agreement with Barsom),
but that it was especially sensitive to their orientation with respect to tbe plane
of the crack. For any given microstructure, the effect of micro structural
orientation is essentially negligible at low growth rates (10-7 - 10-6 in. /cycle),whereas large differences in growth rate were observed at higher stress in-
tensity levels. To cite an example, fatigue crack growth rates for the three
orientations shown in Figure 10 varied by about 5070 at AK = 20 ksi i%. , butby more than an order of magnitude (3. O x 10-3 in. /cycle versus 1.0 x 10⁻⁴
in. /cycle) at AK = 95 ksi 6. In this particular case, it is important to notethat tbe transition to the more rapid phase of crack growth already has occurred
at AK = 95 ksi G. for the TR crack, while for the WT orientation, the transi-
tion has not yet occurred. Any general design work for this material based
on WT crack propagation data certainly would be unconservative.
The above re suits were explained by the authors in terms of a
fatigue process composed of several different fracture micromechanisrns,
including fatigue striation formation and inclusion fracture. It was felt that
inclusion fracture probably accounts for anisotropic crack growth in “homo-geneous” alloys, since, as previously noted, homogenization does not alterinclusion morphology.
3. Crack Growth Theories
Many theories of fatigue crack growth have been proposed and
utilized in describing various metals and alloys subjected to a wide variety of
stress states and environments. In this subsection, some of the work most
pertinent to the designer of steel ships will be discussed, thereby excluding
many theories which either
(a) have not been proved valid for ship steels, or
(b) require “impractical ,, data ~~ initial input, such as
knowledge of tbe plastic zone size at a crack tip.
Aside from the mechanical properties discussed in the preceding two subsec-
tions, other factors which should be incorporated into a general, fundamentally ,sound crack growth law are: load ratio (R), temperature (T), environment, and
the cyclic strain hardening parameters characteristic of the material.
As discussed in Section D of the Appendix, the simple, empiri-
cally observed proportionality between da/dN and (AK)n has been modified
by Forman, et al. ,(A - 10) in order to account for the effects of load ratio and
the instability of the crack growth as the maximum cyclic value of the stress
intensity factor approaches the fracture toughness Kc . The modified equa-
tion is given by
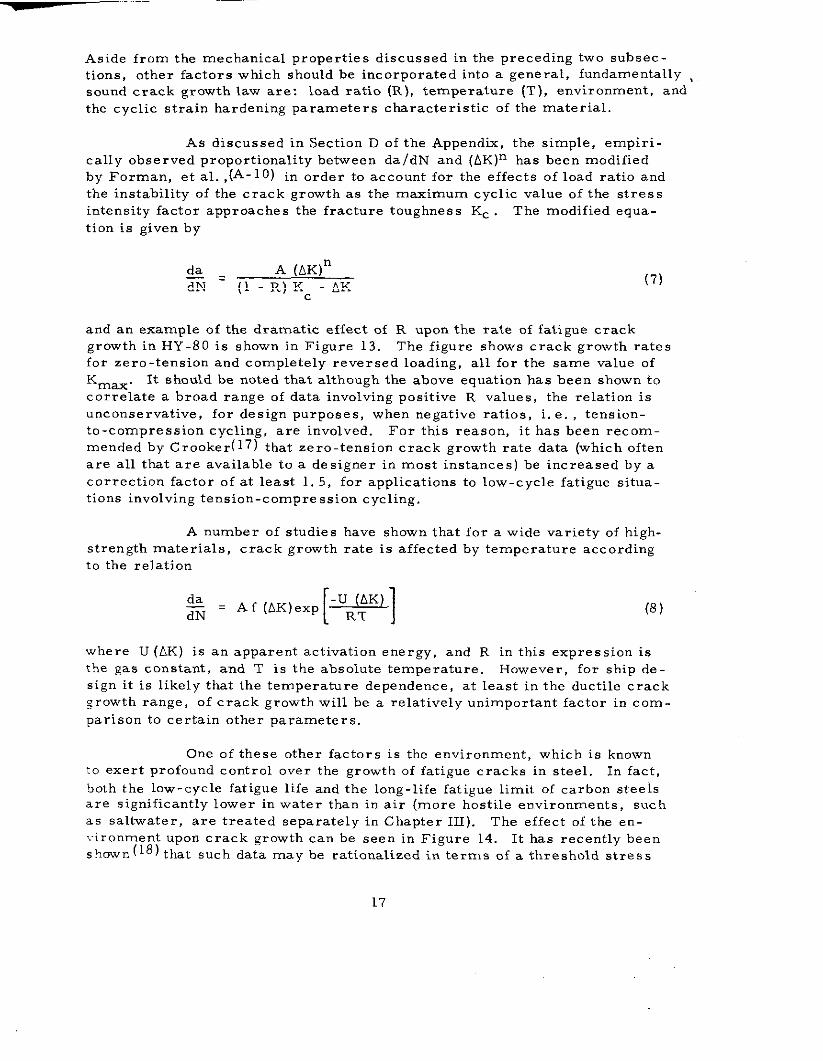
ski= A (AK)n
dN (l- R) KC-AK(7)
and an example of the dramatic effect of R upon the rate of fatigue crackgrowth in HY-80 is shown in Figure 13. The figure shows crack growth ratesfor zero-tension and completely reversed loading, all for the same value of
K ~ax, It should be noted that although the above equation has been shown to
correlate a broad range of data involving positive R values, the relation is
unconservative, for design purposes, when negative ratios, i. e. , tension-
to-compression cycling, are involved. For this reason, it has been recom-mended by Cooker that zero-tension crack growth rate data (which often
are all that are available to a designer in most instances) be increased by a
correction factor of at least 1. 5, for applications to low-cycle fatigue situa-
tions involving tension-compression cycling,
A number of studies have shown that for a wide variety of high.
strength materials, crack growth rate is affected by temperature according
to the relation
@&a
[1
-u (AK)
dN= Af (AK)exp ~ (8)
where U (AK) is an apparent activation energy, and R in this expression is
the gas ‘onstant, and T is the absolute temperature, However, for ship de-sign it is likely that the temperature dependence, at least in the ductile crack
~rowth range, of crack growth will be a relatively unimportant factor in com-
parison to certain other parameters.
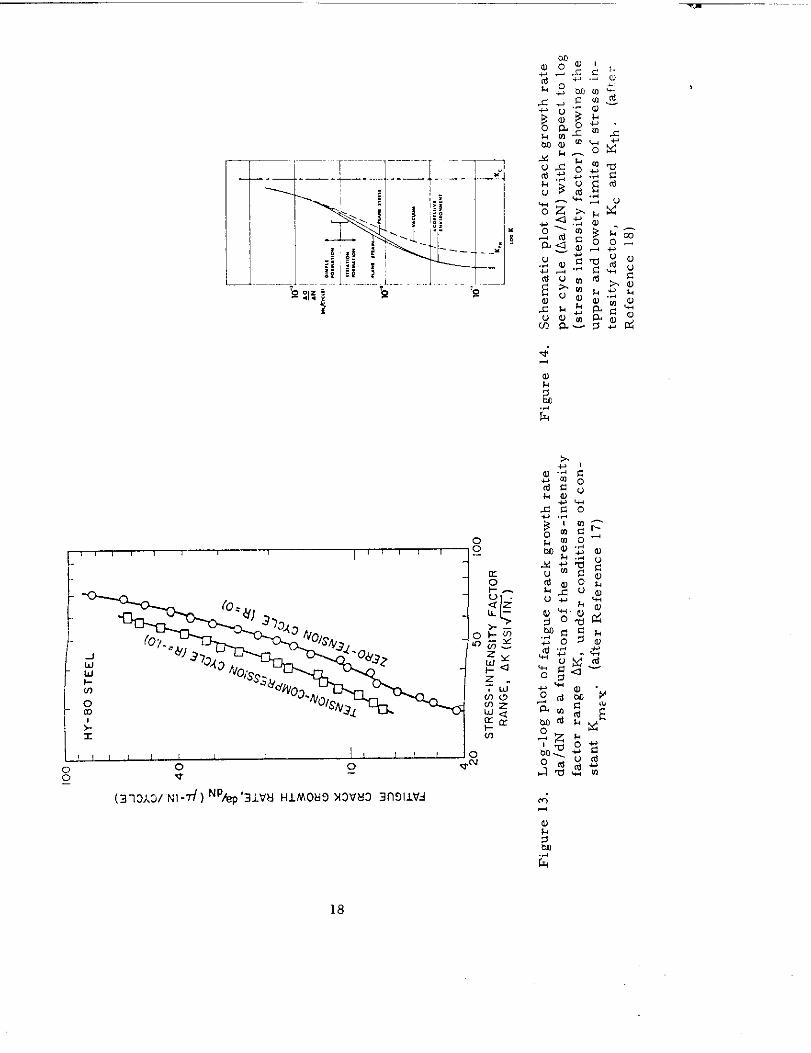
One of these other factors is the environment, which is knownto exert profound control over the growth of fatigue cracks in steel. In fact,
both the low-cycle fatigue life and the long-life fatigue limit of carbon steelsare significantly lower in water than in air (more hostile environments, such
as saltwater, are treated separately in Chapter III). The effect of the en-vironment upon crack growth can be seen in Figure 14. It has recently beenshown (18) that such data may be rationalized in terms of a threshold stress
17
\ 1 , , I I
0 0 0 jg *
(313A3/”Nl-~) ‘PA+ ‘3J.vHH1MOH9 X2VK3 3n911V4
18
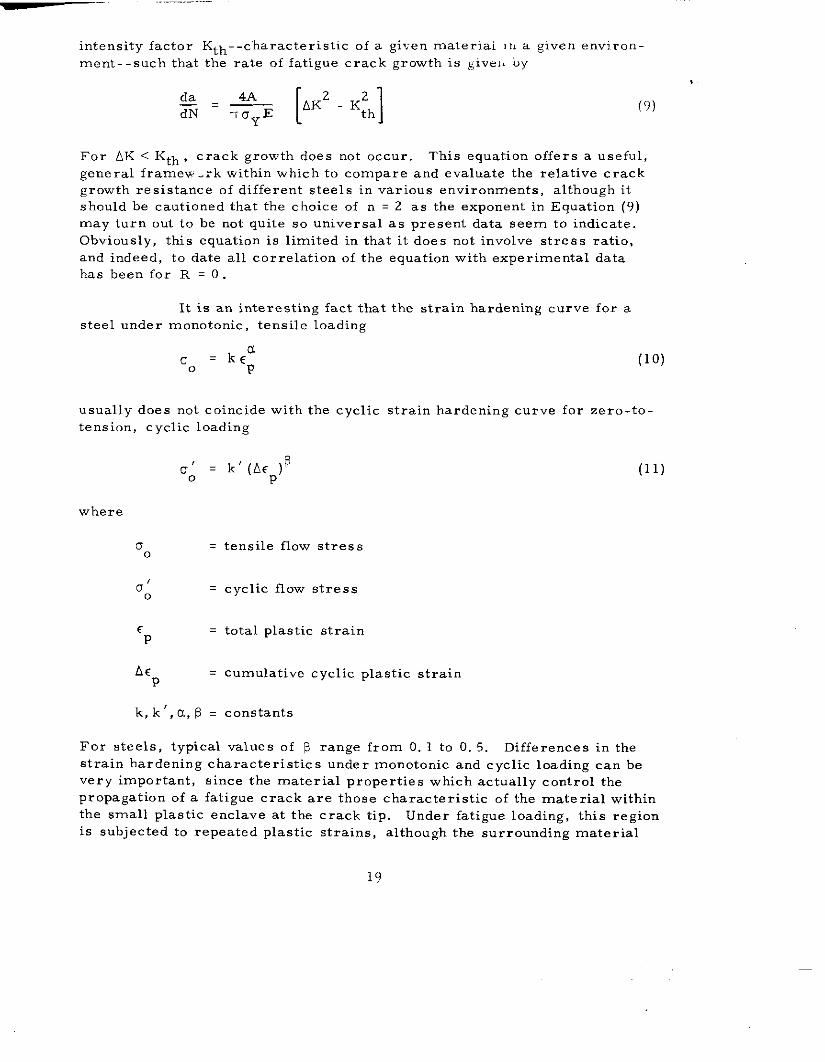
intensity factor Kth--cha racteristic of a given materlai l], a given environ-
ment--such that the rate of fatigue crack growth is give], iJy
(9)
For AK < Kth , crack growth does not occur. This equati On offers a useful,
gene ral framew .rk within which to compare and evaluate the relative c rack
growth resistance of different steels in various environments, although it
should be cautioned that the choice of n = 2 as the exponent in Equation (9)may turn out to be not quite so universal as present data seem to indicate.
Obviously, this equation is limited in that it does not involve stress ratio,
and indeed, to date all correlation of the equation with experimental datahas been for R = O .
It is an interesting fact that the strain hardening curve for a
steel under monotonic, tensile loading
o = k<;0
(lo)
usually does not coincide with the cyclic strain hardening curve for zero. to-
tension, cyclic loading
u’ = k’ (Acp)p0
(11)
where
o = tensile flow stress0
u’ = cyclic flow stress0
< = total plastic strainP
A< = cumulative cyclic plastic strainP
k, k’, a, D = constants
For steels, typical values of p range from 0.1 to O. 5. Differences in tbestrain hardening characteristics uncle r monotonic and cyclic loading can be
very important, since the material properties which actually control the
propagation of a fatigue crack are those characteristic of the material within
the small plastic enclave at the crack tip. Under fatigue loading, this regionis subjected to repeated plastic strains, although the surrounding material
19
——
may experience. only elastic strains. Fatigue crack growth is then actuallya process of localized low-cycle fatigue, through which small volumes of
material undergo plastic strain cycling until local failure occurs, extending
the plastic zone further into virgin material.
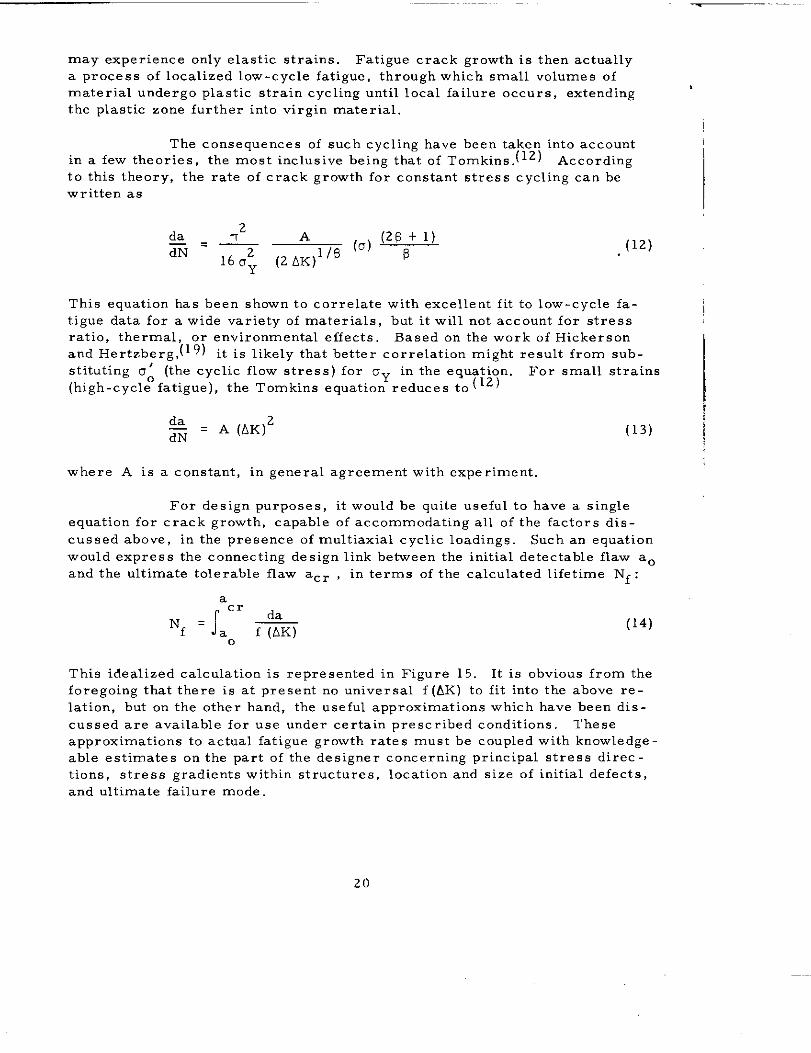
The consequences of such cycling have been taken into accountin a few theories, the most inclusive being that of Tomkins. (12) Accordingto this theory, the rate of crack growth for constant stress cycling can be
written as
da TT2 A (o) (26 + 1)m=—
160~ (2 AK)1’P $(12)
This equation has been shown to correlate with excellent fit to low-cycle fa-
tigue data for a wide variety of materials, but it will not account for stressratio, thermal, or environmental effects. Based on the work of Hickersonand Hertzberg,(19) it is likely that better correlation might result from sub-
stituting u; (the cyclic flow stress) for Oy in tbe equation. For small strains
(high-cycle fatigue), the Tomkins equation reduces to ( 12)
da
G= A (AK)2 (13)
where A is a constant, in general agreement with experiment,
For design purposes, it would be quite useful to have a singleequation for crack growth, capable of accommodating all of the factors dis-
cussed above, in the presence of multiaxial cyclic loadings. Such an equationwould express the connecting design link between the initial detectable flaw a.
and the ultimate tolerable flaw a cr , in terms of the calculated lifetime Nf :
‘f =?’*0
(14)
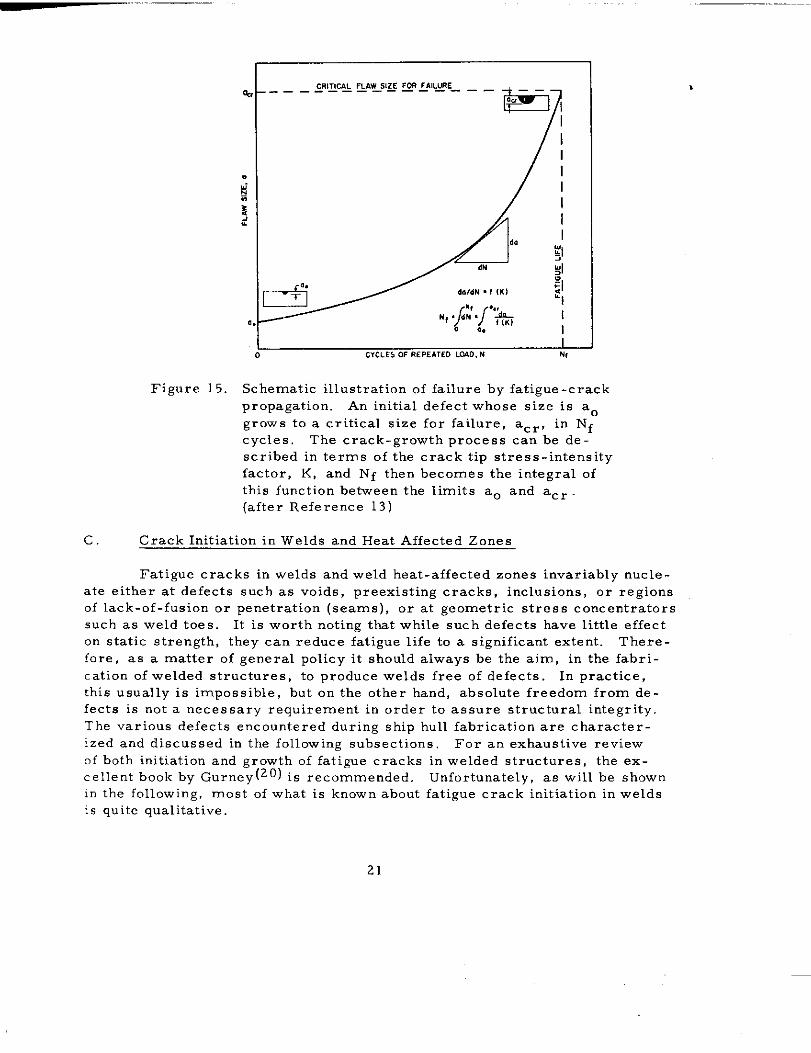
This idealized calculation is represented in Figure 15. It is obvious from the
foregoing that there is at present no universal f (AK) to fit into the above re-
lation, but on the other hand, the useful approximations which have been dis-
cussed are available for use under certain prescribed conditions. These
approximations to actual fatigue growth rates must be coupled with knowledge.able estimates on the part of the designer concerning principal stress direc -tions, stress gradients witbin structures, location and size of initial defects,
and ultimate failure mode.
I
20
i I0 c7cLc5OFREPEATEDLOAO,N N,
Figure 15. Schematic illustration of failure by fatigue-crack
propagation. An initial defect whose size is a.
grows to a critical size for failure, acr, in Nf
cycles, The crack-growth process can be de-
scribed in terms of the crack tip stress-intensity
factor, K, and Nf then becomes the integral of
this function between the limits a. and acr
(after Reference 13)
c. Crack Initiation in Welds and Heat Affected Zones
Fatigue cracks in welds and weld heat-affected zones invariably nucle-
ate either at defects such as voids, preexisting cracks, inclusions, or regionsof lack-of-fusion or penetration (seams), or at geometric stress concentrators
such as weld toes. It is worth noting that while such defects have little effecton static strength, they can reduce fatigue life to a significant extent. There-fore, as a matter of general policy it should always be the aim, in the fabri-
cation of welded structures, to produce welds free of defects. In practice,this usually is impossible, but on tbe other hand, absolute freedom from de.
fects is not a necessary requirement in order to assure structural integrity.
The various defects encountered during ship hull fabrication are character-
ized and discussed in the following subsections, For an exhaustive reviewof both initiation and growth of fatigue cracks in welded structures, the ex-
cellent book by Gurney (20) is recommended. Unfortunately, as will be shownin the following, most of wt,at is known about fatigue crack initiation in welds
:s quite qualitative.
,
21
1. Sources of Initiation
Incomplete penetration generally refers to the condition in butt
welds in which the weld filler metal does not reach the root of a joint, so that
the depth of tbe weld metal is less than the plate thickness. Such defects mayrange from small, localized gaps to large regions of discontinuity, and may
occur either as buried internal defects, as when plates are welded from both
sides, or as surface defects, if the plates are welded from one side only.
Lawrence and Munse (21) observed that the initiation period for fatigue cracks
nucleated at penetration defects in mild steel butt welds occupied approxi-
mately one-half of tbe total life. This period consisted of the cycles neededto ,,~hake down!! the residual stresses in the weld and to transform the lack -
of-penetration flaw into an active fatigue crack. A number of investigationshave been aimed at relating fatigue strength to defect severity (percent re-
duction of joined area caused by incomplete penetration), For laboratory-
sized specimens, it has been shown that several sets of data can be repre-
sented as shown in Figure 16. Burdekin, et al. , (22) suggested a method of——analyzing such results on a fracture mechanics basis, and this approach is
discussed in Section II. C. 3. Fatigue strength data for surface lack-of-pene-
tration defects are even lower than those of Figure 16, so that every effort
should be made to avoid the more readily detectable surface penetration flaw.
Cracks associated with a welded region may occur in either theweld metal or in the parent metal, may form either parallel or transverse to
the line of the weld, and may be created by a variety of sources. Concerning
cracks which are sufficiently large to be detected by common NDI techniques,the most usual types are solidification cracking, which occurs in the weld
metal while it is bot and relatively plastic, and cold (or bard zone) cracking,
which takes place in the heat-affected zone (HAZ) material following cooling
of the joint. A parameter which looms important (but difficult to quantify)
in both these processes is the degree of restraint opposing accommodation
of weld-shrinkage, since this provides the effective cracking force. A secondfactor, important in solidification cracking, is the solidification rate, which
determines the local structure and impurity segregation. Tbe solidification
rate can be controlled through correct heat input and by preheating, although
the latter is primarily used in avoiding cold cracking in the HAZ. Cold crack-ing is most likely to occur in high-strength steels, due to a hard, brittle
microstructure, the embrittling presence of hydrogen, and restraint stresses,
It is worth noting that cracking in high-strength, quenched-and-tempered low-
alloy steels occurs primarily in the heat. affected zones. This behavior is
associated with an unmixed zone and a partially melted zone, which together
constitute the fusion line between the apparent heat-affected zone and the basemetal.(23)
Only limited fatigue research has heen dev~.d ,0 the problem
of weld region cracking, i. e. , the effect of weld-induced crac is upon fatigue
properties. According to Warren, at 2 ~ 106 ::cles :.,ter ‘ cracks,
—
. Weld rei”for, emen, on
A Weld reinforcement
20 ~ machined OH
16.
12.
8
4A
Io
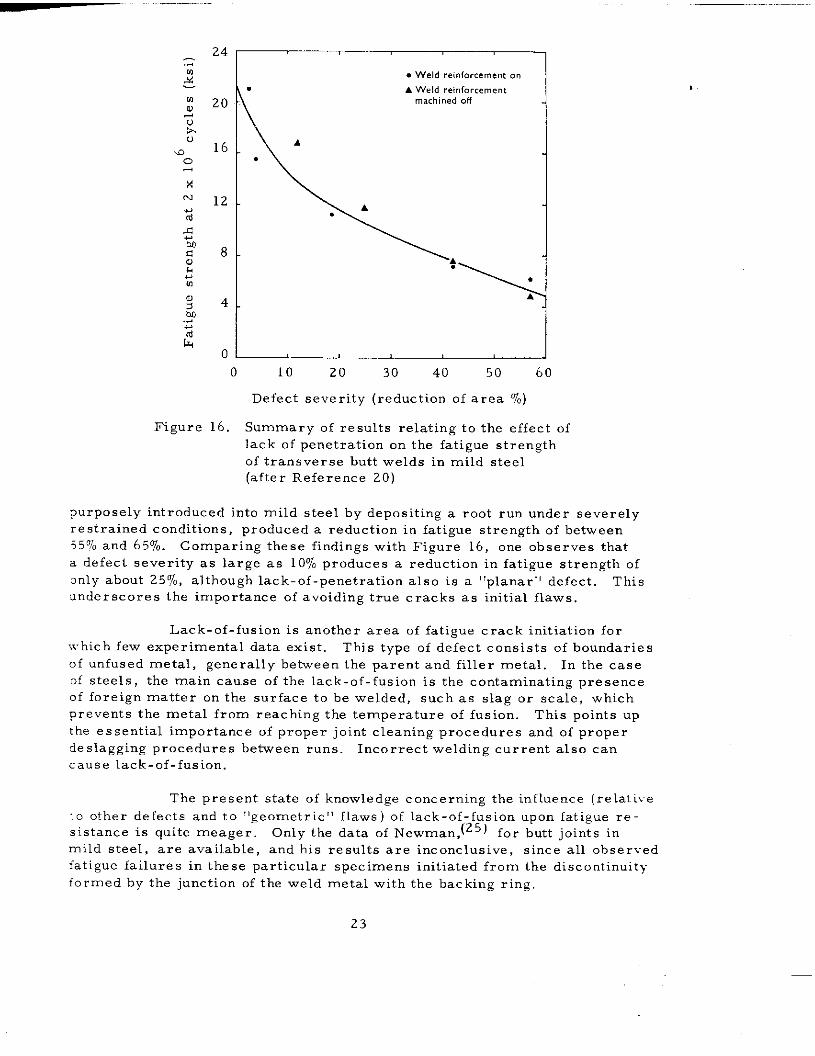
Figure 16.
10 20 30 40 50 60
Defect severity (reduction of area %)
Summary of results relating to the effect of
lack of penetration on the fatigue strength
of transverse butt welds in mild steel(after Reference 20)
purposely introduced into mild steel by depositing a root run under severely
restrained conditions, produced a reduction in fatigue strength of between55% and 657,. Comparing these findings with Figure 16, one observes that
a defect severity as large as 10~o produces a reduction in fatigue strength of
only about 257,, although lack-of-penetration also is a ‘Iplanart( defect. This
underscores the importance of avoiding true cracks as initial flaws.
Lack-of-fusion is another area of fatigue crack initiation forwhit h few experimental data exist. This type of defect consists of boundaries
of unfused metal, generally between the parent and filler metal. In the caseof steels, the main cause of the lack-of-fusion is the contaminating presenceof foreign matter on the surface to be welded, such as slag or scale, which
prevents the metal from reaching the temperature of fusion. This points up
the essential importance of proper joint cleaning procedures and of proper
deslagging procedures between runs. Incorrect welding current also can
cause lack-of-fusion.
The present state of knowledge concerning the influence (relative
.O other defects and to “geometric” flaws ) of lack-of-fusion upon fatigue re-
sistance is quite meager. Only the data of Newman, (25) for butt joints in
mild steel, are available, and his results are inconclusive, since all observed
fatigue failures in these particular specimens initiated from the discontinuity
formed by the junction of the weld metal with the backing ring,
23
—-
,,poro~ityt, refers to the ~resence of weld metal cavities caused
by the entrapment of gas during solidification. These cavities typically are
spherical, and may occur in a clustered and/or a scattered distribution
throughout the weld. Factors which contribute to porosity include high sul -
phur content, either in the parent metal or the electrode, excessive moisture
in the electrode coating, or, most commonly, wind disturbance of the elec-
trode shield, allowing nitrogen intake.
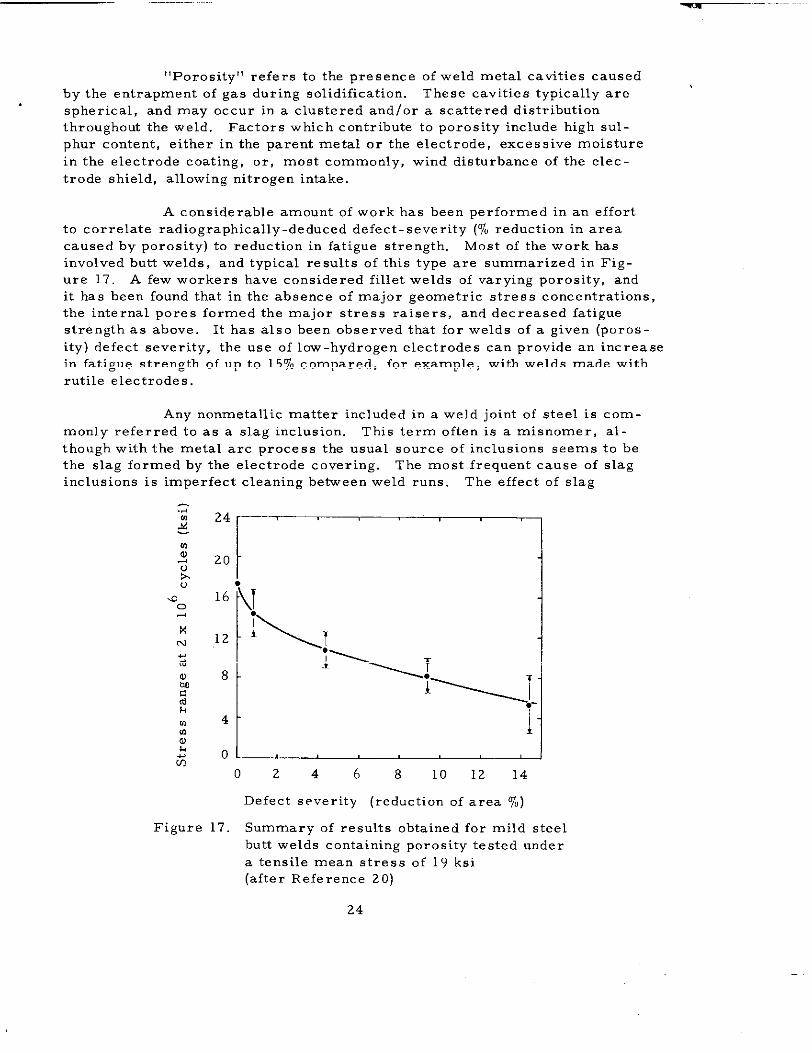
A considerable amount of work has been performed in an effort
to correlate radio graphically-deduced defect-severity (7, reduction in area
caused by porosity) to reduction in fatigue strength. Most of the work has
involved butt welds, and typical results of this type are summarized in Fig-ure 17. A few workers have considered fillet welds of varying porosity, and
it has been found that in the absence of major geometric stress concentrations,
the internal pores formed the major stress raisers, and decreased fatigue
strength as above. It has also been observed that for welds of a given (poros-
ity) defect severity, the use of low-hydrogen electrodes can provide an increase
in fatigue strength of up to 15% compared, for example, with welds made with
rutile electrodes.
Any nonmetallic matter included in a weld joint of steel is com-
monly referred to as a slag inclusion. This term often is a misnomer, al-
though with the metal arc process the usual source of inclusions seems to bethe slag formed by the electrode covering. The most frequent cause of slag
inclusions is imperfect cleaning between weld runs. The effect of slag
024681012 14
Defect severity (reducticn of area %)
Figure 17. Summary of results obtained for mild steel
butt welds containing porosity tested under
a tensile mean stress of 19 ksi(after Reference 20)
24
inclusions has been examined in considerable detail, and they presently are ,the defect type for which the most comprehensive fatigue data exist.
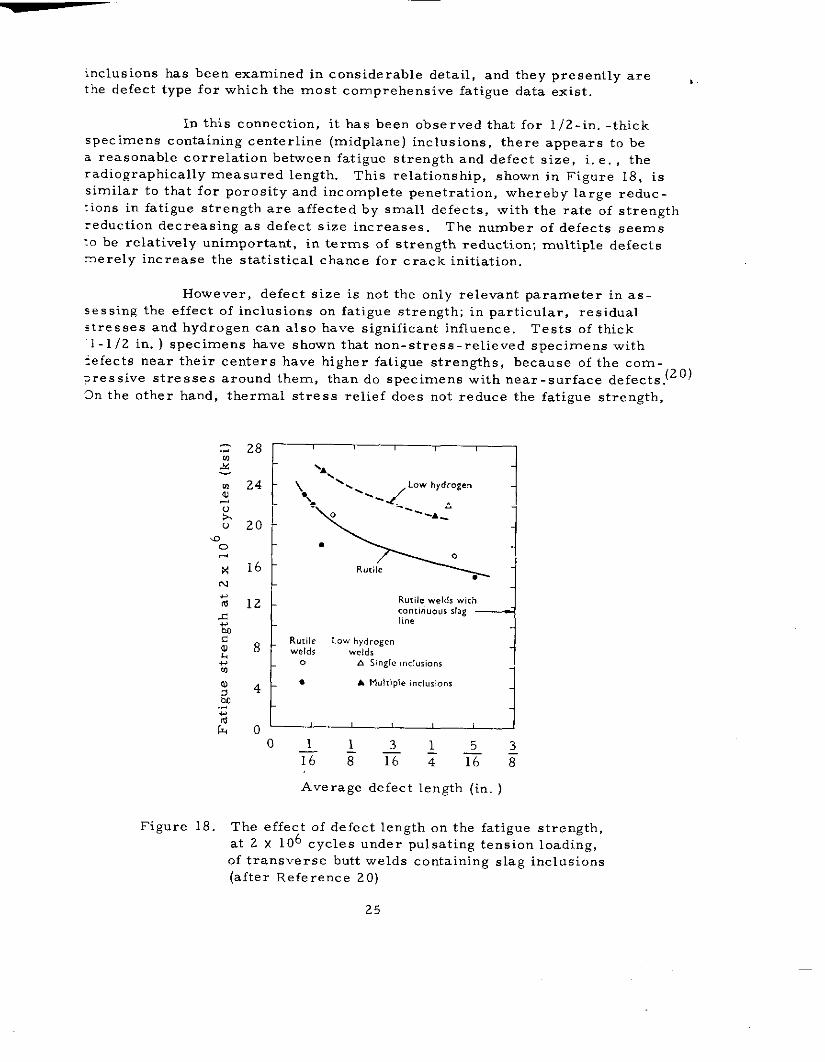
In this connection, it has been observed that for 1 j2-in. -thickspecimens containing centerline (midplane) inclusions, there appears to be
a reasonable correlation between fatigue strength and defect size, i. e. , theradiographically measured length. This relationship, shown in Figure 18, is
similar to that for porosity and incomplete penetration, whereby large reduc-
tions in fatigue strength are affected by small defects, with the rate of strength
reduction decreasing as defect size increases. The number of defects seems:0 be relatively unimportant, in terms of strength reduction; multiple defectsmerely increase the statistical chance for crack initiation.
However, defect size is not the only relevant parameter in as-sessing the effect of inclusions on fatigue strength; in particular, residual
stresses and hydrogen can also have significant influence. Tests of thick“1-1 /2 in. ) specimens have shown that non-stress-relieved specimens with
:efects near their centers have higher fatigue strengths, because of the com -
~ressive stresses around them, than do specimens with near-surface defects.(20)
on the other hand, thermal stress relief does not reduce the fatigue strength,
F 12t
Rutile welds with
. CO{,ti””o”s slag —
am
1line
Rutile Low hydrogen;8 weld, weld,
oG
b Single inc!. sions
u4“
A M.ltip!e inclusions
,%
Figure 18.
Average defect length (in. )
The effect of defect length on the fatigue strength,
at 2 x 10⁶ cycles under pulsating tension loading,
of transverse butt welds containing slag inclusions
(after Reference 20)
25
despite eliminating beneficial compressive stresses, since the thermal pro-
cess also enables hydrogen entrapped in the defect to diffuse out of tbe speci-men. This effect overrides the loss of beneficial residual stresses, since the
effect of molecular hydrogen is so very deleterious to fatigue strength. For
thinner specimens, residual stress considerations are less important.
Another way of looking at tbe preceding discussion is to notethat for stress-relieved specimens there is no significant difference between
welds made with rutile and with low-hydrogen electrodes. For defect-con-taining welds in the as-welded condition, however, those made with 10w -
hydrogen electrodes are stronger (see Figure 18). It has been observed
that continuous lines of inclusions give a lower fatigue strength than do long
discontinuous inclusions, and that preheating of welds containing inclusions
has no effect on fatigue strength.
Throughout this discussion, defects have been considered as
if they were buried in a continuum and were uniform in shape and orientation.
Actually, surface defects, surface geometry, and the specific geometries ofboth internal and surface defects can further complicate the initiation of cracks
in weldments. These factors will be considered next.
2. Influence of Surface and Flaw Geometry
In recent years it has become apparent that weld shape, i. e.>
surface geometry , is tbe overriding factor in determining the fatigue strength
of transverse butt welds, and is a crucial factor for other ty pes of welds as
well. While other variables do affect fatigue strength, such as welding pro-
cess, electrode type, welding position, and post-weld machining, their in-
fluence is determined by their effects on the shape of the weld toe. Several
researchers have provided dramatic and convincing evidence of the crucial
role of weld shape. (On the other hand, it is important to bear in mind that
only a very small, hut sharp, internal defect is required to override the effectof reinforcement shape. )
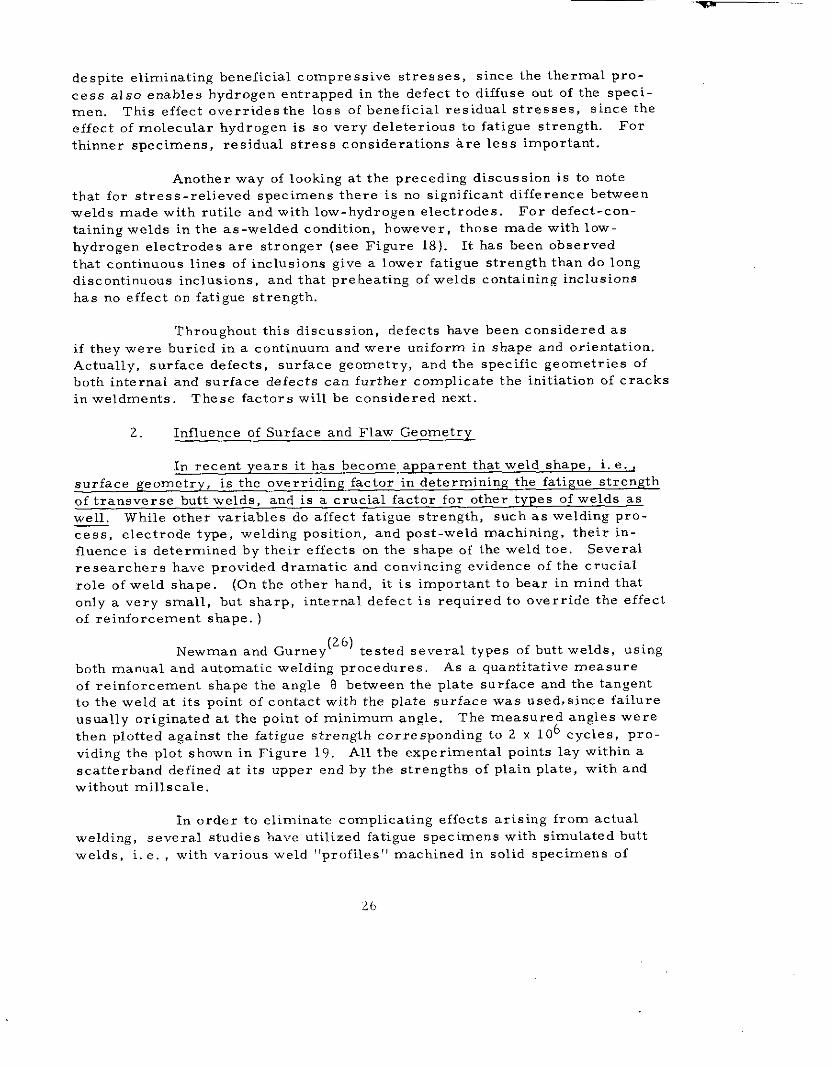
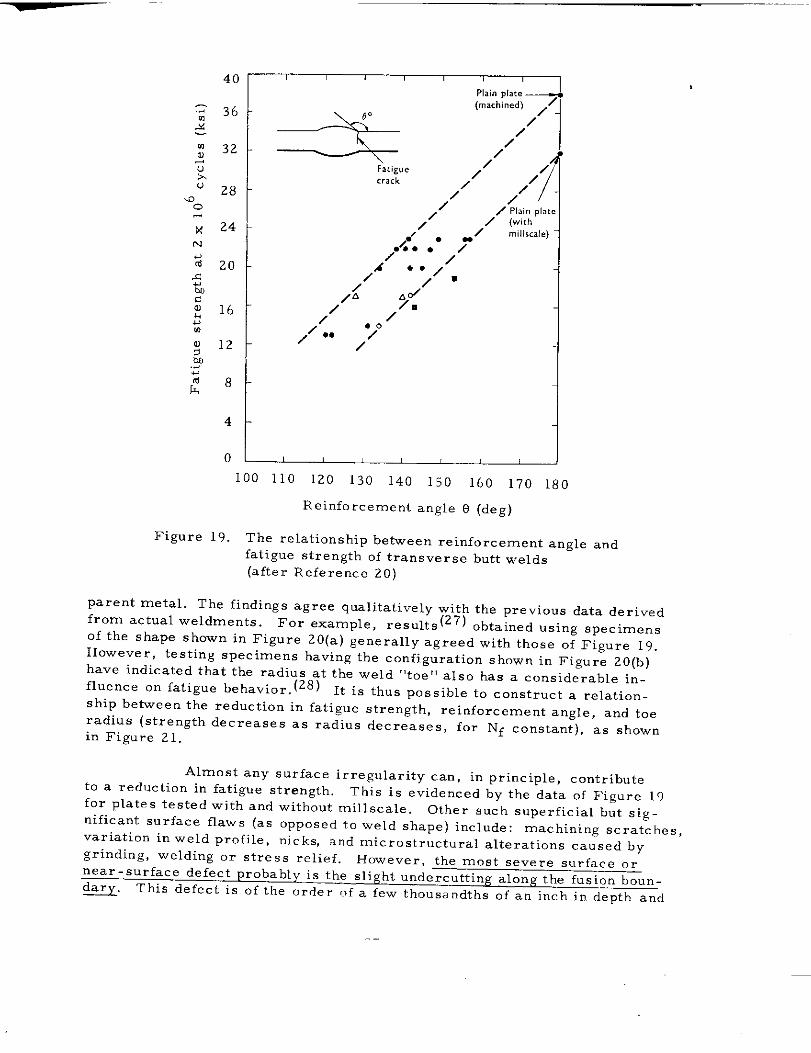
Newman and Gurney(26)
tested several types of butt welds, usingboth manual and automatic welding procedures. As a quantitative measure
of reinforcement shape tbe angle 13 between the plate surface and the tangentto the weld at its point of contact with the plate surface was used, since failure
usually originated at the point of minimum angle. The measured angles were
then plotted against the fatigue strength corresponding to 2 x 10⁶ cycles, prO -
viding the plot shown in Figure 19. All the experimental points lay within a
scatterband defined at its upper end hy the strengths of plain plate, with andwithout mills cale.
In order to eliminate complicating effects arising from actual
welding, several studies have utilized fatigue specimens with simulated butt
welds, i.e. , with various weld “profiles” machined in solid specimens of
I ( , I
Plain p(a<e(machined) /
* ,,.,~
Facig.e/crack
//
//
//
// Plain plate
/ / (with.,
“/mil!scale)
./. ● ●
/“,/
.4 ● ./
/,/
,<
/ %
/ /
/.0
/. . /
/
11
100 110 120 130 140 150 16o 170 180
Reinforcement angle !3 (deg)
Figure 19. The relationship between reinforcement angle and
fatigue strength of transverse butt welds
(after Reference 20)
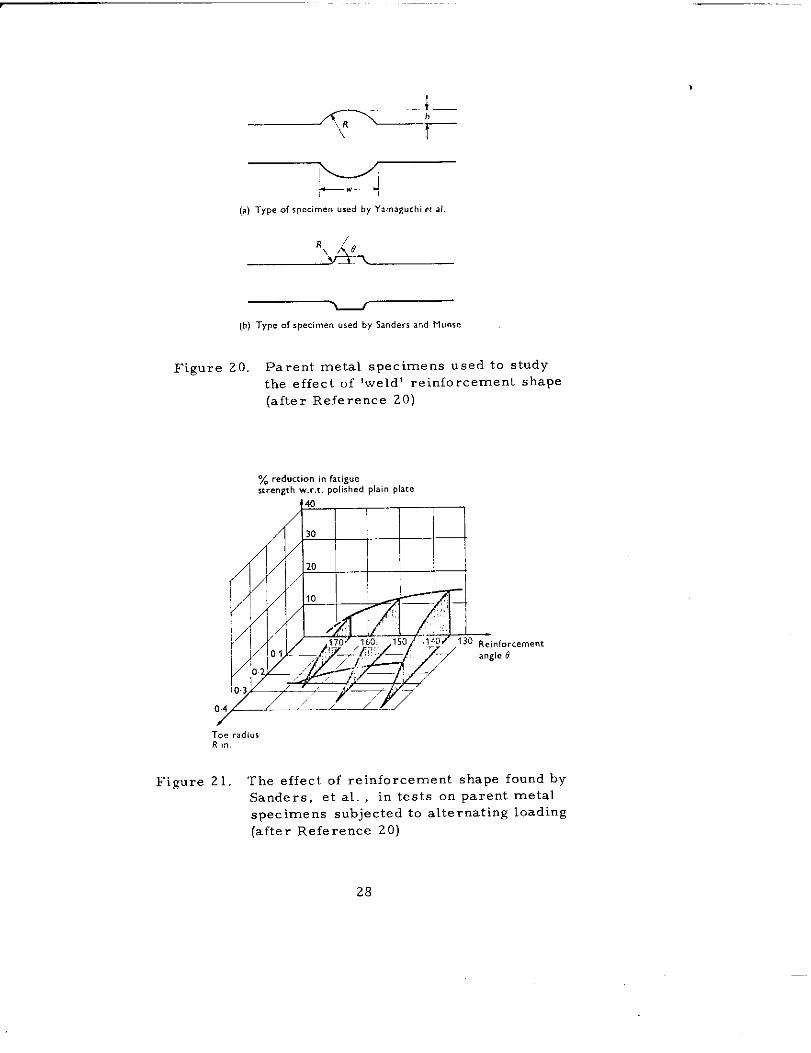
parent metal. The findings agree qualitatively with the previous data derived
from actual weldments. For example, *e~ults(27) obtained using specimensof the shape shown in Figure 20(a) generally agreed with those of Figure 19.
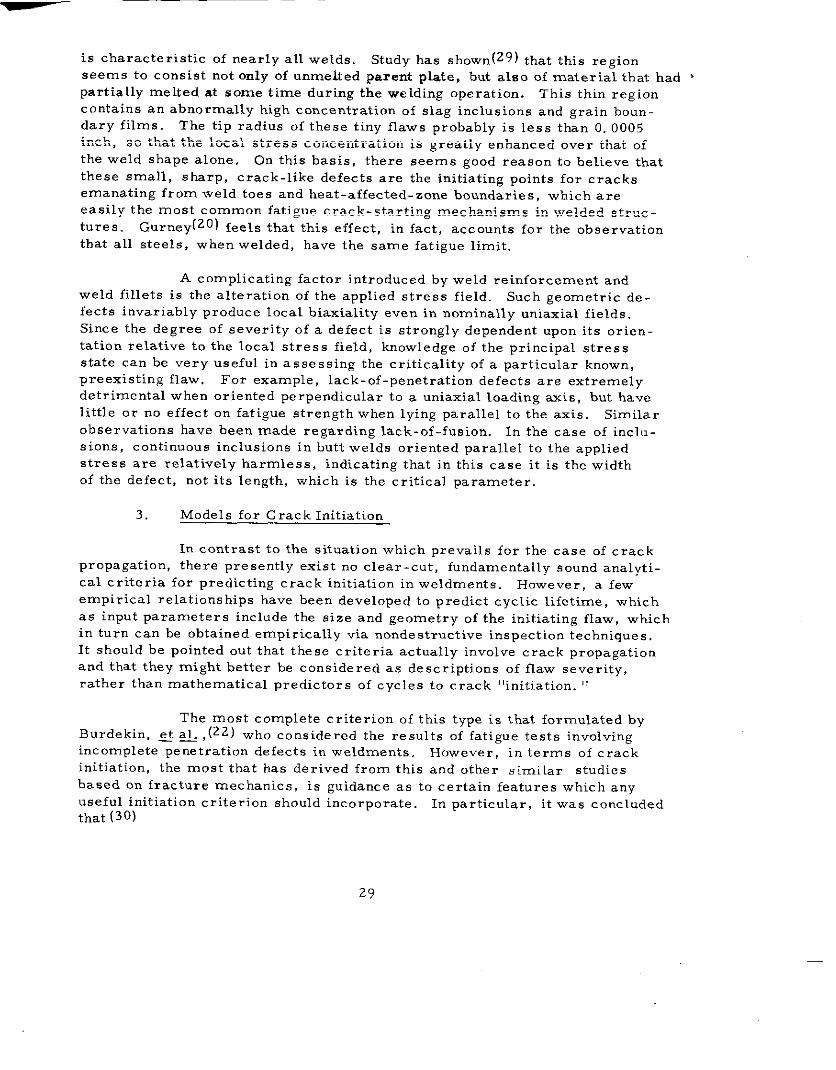
However, testing specimens having the configuration shown in Figure 20(b)have indicated that the radius at the weld “toe!! also has a considerable in.fluence on fatigue behavior. It is thus possible to construct a relation-
ship between the reduction in fatigue strength, reinforcement angIe, and toeradius (strength decreases as radius decreases, for Nf constant),
as shownin Figure 21.
Almost any surface ir=eg”larity can, in principle, contributeto a reduction in fatigue strength. This is evidenced by the data of Figure 19for plates tested with and without millscale.
Other such superficial b“t sig-nificant surface flaws (as opposed to weld shape) include: machining scratches,variation in weld profile, nicks, and micro structural alterations caused bygrinding, welding or stress relief. However, se most severe s~lrface O=near-surface defect probably is the slight undercutting along the fusion boun -~. This defect is of the order of a few thousandths of an inch in depth and
.—. —
Iui-w-
(8) Twe .f SPe.imenused by Y2maguchi et d
[b) Type of specimen used by Sanders and M.nse
Figure 20. Parent metal specimens used to studythe effect of ‘weld’ reinforcement shape
(after Reference 20)
~0 reduction in fatiguestrength w.r.t. polished plain plate
nforceme”t1, 8
Toe radiusR in.
Figure 21. The effect of reinforcement shape found bySanders, et al. , in tests on parent metal
specimens subjected to alternating loading
(after Reference 20)
28
is characteristic of nearly all welds. Study has shown (Z9) that this region
seems to consist not only of unmelted parent plate, but also of material that had ,
partially melted at some time during the welding operation. ‘This thin region
contains an abnormally Klgh concentration of slag inclusions and grain boun-
dary films. The tip radius of these tiny flaws probably is less than O. 0005
inch, so that the local stress concentration is greatly enhanced over that of
the weld shape alone. On this basis, there seems good reason to believe thatthese small, sharp, crack-like defects are the initiating points for cracks
emanating from weld toes and heat-affected-zone boundaries, which are
easily the most common fatigue crack-starting mechanisms in welded struc-
tures. Gurney(20) feels that this effect, in fact, accounts for the observationthat all steels, when welded, have the same fatigue limit.
A complicating factor introduced by weld reinforcement and
weld fillets is the alteration of the applied stress field. Such geometric de-
fects invariably produce local biaxiality even in nominally uniaxial fields.
Since the degree of severity of a defect is strongly dependent upon its orien-
tation relative to the local stress field, knowledge of the principal stress
state can be very useful in assessing the criticality of a particular known,
preexisting flaw. For example, lack-of-penetration defects are extremelydetrimental when oriented perpendicular to a unia.xial loading axis, but have
little or no effect on fatigue strength when lying parallel to the axis. Similar
observations have been made regarding lack-of-fusion. In the case of inclu-
sions, continuous inclusions in butt welds oriented parallel to the appliedstress are relatively harmless, indicating that in this case it is the width
of the defect, not its length, which is the critical parameter.
3. Models for Crack Initiation
In contrast to the situation which prevails for the case of crack
propagation, there presently exist no clear-cut, fundamentally sound analyti-
cal criteria for predicting crack initiation in weldments. However, a fewempirical relationships have been developed to predict cyclic lifetime, which
as input parameters include the size and geometry of the initiating flaw, whichin turn can be obtained empirically via nondestructive inspection techniques.
It should be pointed out that these criteria actually involve crack propagation
and that they might better be considered as descriptions of flaw severity,
rather than mathematical predictors of cycles to crack “initiation. “
The most complete criterion of this type is that formulated byBui-dekin, et al. ,(22) who considered the results of fatigue tests invO1ving.—incomplete penetration defects in weldments. However, in terms of crack
initiation, the most that has derived from this and other similar studies
based on fracture mechanics, is guidance as to certain features which any
useful initiation criterion should incorporate. In particular, it was concludedthat (30)
29
.
(a)
(b)
(c)
—
The ratio of flaw width to plate tbickness is dominant
in controlling the period spent in crack initiation.
The position of the initiating flaw relative to the center-
line of the weld is an important parameter in determining
initiation life.
In the case of very small flaws, the actual geometry ofthe flaw is influential in determining tbe init iat ion life.
D. Crack Propagation in Welds and Heat-Affected Zones
The problem of fatigue crack growth in weldments is considerably
more complicated than that of crack propagation in the parent metal. Com-
plications arise from the fact that welding results in residual stresses and
metallurgical changes, so that the fatigue crack may initiate in,
and propagate through, material having mechanical properties quite dif-ferent from those of the parent metal. Furthermore, the rate of growth
may accelerate or decelerate as the crack passes from weld metal to
heat-affected zone to parent alloy. For weldments, the influence of
growth rate-controlling factors has not been determined in as systematic
and general a fashion as has been the case for the base metals (Sect. II. B),
but useful work has been carried out and will be discussed in this Section.
1. Factors Controlling Fatigue Crack Growth in Welds
and Heat-Affected Zones
As in the case of base metals, the rate-of-growth of fatigue
cracks generally may be described by an equation of tbe form
da
TN= A AK” (15)
It has been shown(31) that for weld metal specimens whose tensile strengths
range from 50 to 82 ksi, the crack growth rate, as a function of AK , increases
only slightly with yield strength. The data actually cluster within a fairly nar-
row scatterband, and a transition to a faster, less stable mode occurs between10-4 in. ,Cycle < & < 10-3
dNIn. /cycle, in accordance with the discussion of
Section 11. B. 1. The influence of variations in fracture toughness across the
weld zone upon crack growth has not yet been established.
It does appear that micro structural alterations may play a sig-
nificant, but not yet clearly understood, role in crack propagation. Limited
experimental data(32) have indicated that for normalized mild steel weldments,
the microstructure of the weld metal and the HAZ are more notch sensitive
than unaltered base metal. The spheroidized pearlite region of the HAZ is
30
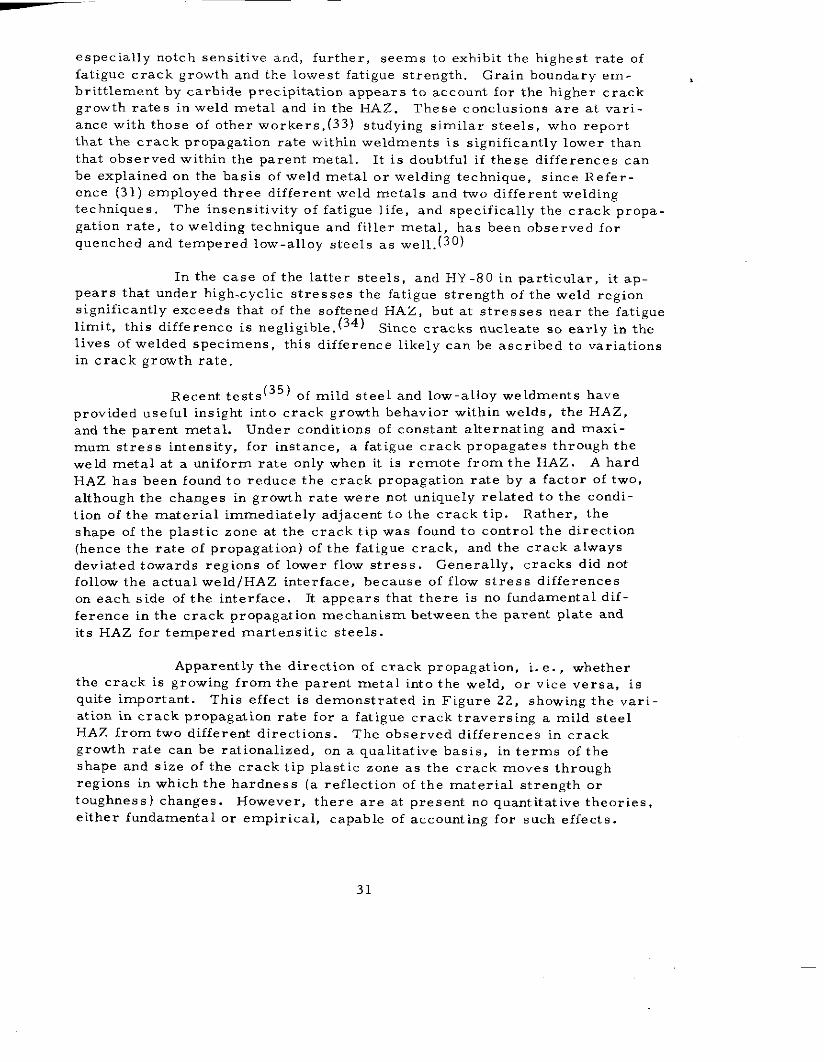
especially notch sensitive and, further, seems to exhibit the highest rate of
fatigue crack growth and the lowest fatigue strength. Grain boundary em.
brittlement by carbide precipitation appears to account for the higher crack
growth rates in weld metal and in tbe HAZ. These conclusions are at vari-
ance with those of other workers, studying similar steels, who reportthat the crack propagation rate within weldments is significantly lower than
that observed within the parent metal. It is doubtful if these differences can
be explained on the basis of weld metal or welding technique, since Refer-
ence (31) employed three different weld metals and two different weldingtechniques. The insensitivity of fatigue life, and specifically the crack propa-
gation rate, to welding technique and filler metal, has been observed for
quenched and tempered low-alloy steels as well. (3°)
In the case of the latter steels, and HY-80 in particular, it ap.pears that under high. cyclic stresses the fatigue strength of the weld region
significantly exceeds that of the softened HAZ, but at stresses near the fatigue
limit, this difference is negligible. Since cracks nucleate so early in the
lives of welded specimens, this difference likely can be ascribed to variationsin crack growth rate.
Recent te~t~(35) of mild steel and low-alloy weldments have
provided useful insight into crack growth behavior within welds, the HAZ,
and the parent metal. Under conditions of constant alternating and maxi-
mum stress intensity, for instance, a fatigue crack propagates through the
weld metal at a uniform rate only when it is remote from the HAZ. A hard
HAZ has been found to reduce the crack propagation rate by a factor Of twO,
although the changes in growth rate were not uniquely related to the condi-
tion of the material immediately adjacent to the crack tip. Rather, the
shape of the plastic zone at the crack tip was found to control the direction
(hence the rate of propagation) of the fatigue crack, and the crack always
deviated towards regions of lower flow stress. Generally, cracks did nOtfollow the actual weld/HAZ interface, because of flow stress differenceson each side of the interface. It appears that there is no fundamental dif-
ference in the crack propagation mechanism between the parent plate and
its HAZ for tempered marten sitic steels.
Apparently the direction of crack propagation, i. e. , whetherthe crack is growing from the parent metal into the weld, or vice versa, is
quite important. This effect is demonstrated in Figure 22, showing the vari-ation in crack propagation rate for a fatigue crack traversing a mild steel
HAZ from two different directions. The observed differences in crackgrowth rate can be rationalized, on a qualitative basis, in terms of the
shape and size of the crack tip plastic zone as the crack moves through
regions in which the hardness (a. reflection of the material strength or
toughness) changes. However, there are at present no quantitative theories,either fundamental or empirical, capable of accounting for such effects.
31
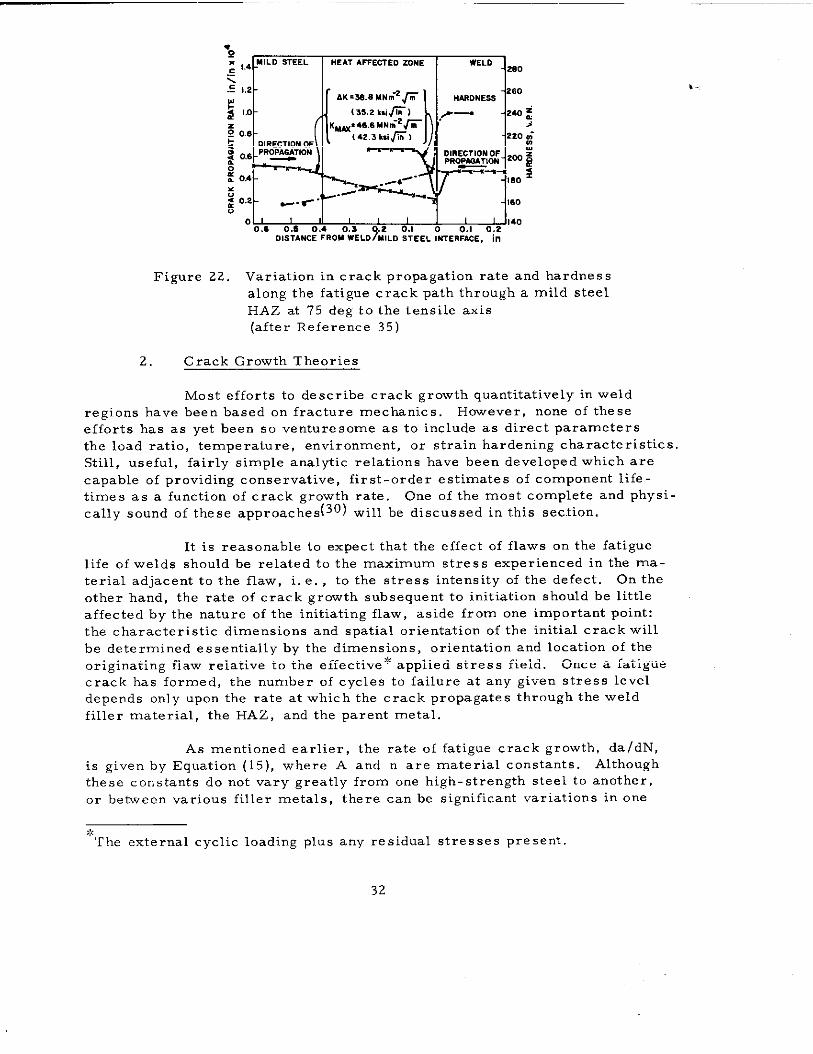
●9,:!.4-~lLD‘rEEL ‘EAT‘FFEmED ‘ONE WELD *no
\.E L2 - r
AK=338MNm*fi HARDNESS- 260
: ,,0(33.2 k,i~).
KM#6.6MNm-2~E 0.8
>[42.3 k*lfi)+ DIRECTIONW ,
~ ~,6 PROPAGATION—
: -.: 0.4 - % /.~”
--,--: 0,* ~.
-.<. “ 160s
0 , , ,0.6 0.S 0.4 0.3 + :., ;,, 0:2 ’40
DISTANCE FROM WEI.D MlLD STEEL ~NTERFACE, in
Figure 2.2. Variation in crack propagation rate and hardness
along the fatigue crack path through a mild steel
HAZ at 75 deg to the tensile axis(after Reference 35)
2. Crack Growth Theories
Most efforts to describe crack growth quantitatively in weld
regions have been based on fracture mechanics. However, none of these
efforts has as yet been so venturesome as to include as direct parametersthe load ratio, temperature, environment, or strain hardening characteristics.
Still, useful, fairly simple analytic relations have been developed which are
capable of providing conservative, first-order estimates of component life-
times as a function of crack growth rate. One of the most complete and physi-
cally sound of these approaches will be discussed in this section.
It is reasonable to expect that the effect of flaws on the fatigue
life of welds should be related to the maximum stress experienced in the ma-
terial adjacent to the flaw, i. e. , to the stress intensity of the defect. On the
other hand, the rate of crack growth subsequent to initiation should be little
affected by the nature of the initiating flaw, aside from one important point:
the characteristic dimensions and spatial orientation of the initial crack will
be determined essentially by the dimensions, orientation and location of the
originating flaw relative to the effective* applied stress field. Once a fatigue
crack has formed, the number of cycles to failure at any given stress leveldepends only upon the rate at which the crack propagates through the weld
filler material, the HAZ, and the parent metal.
As mentioned earlier, the rate of fatigue crack growth, da/dN,
is given by Equation (15), where A and n are material constants. Althoughthese constants do not vary greatly from one high-strength steel to another,
or between various filler metals, there can be significant variations in one
,-
,:The external cyclic loading plus any residual stresses present.
32
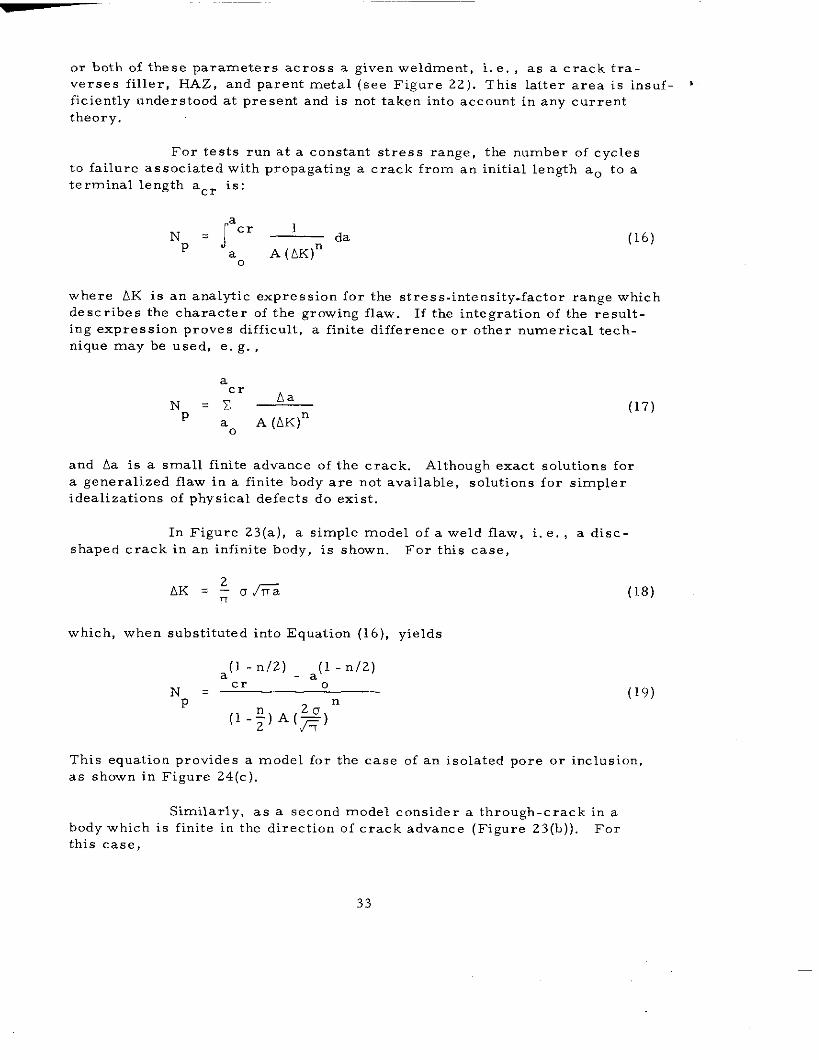
or both of these parameters across a given weldment, i. e. , as a crack tra-
verses filler, HAZ, and parent metal (see Figure 22). This latter area is insuf - ~ficiently understood at present and is not taken into account in any current
theory.
For tests run at a constant stress range, the number of cyclesto failure associated with propagating a crack from an initial length a. to a
terminal length acr is:
“p ‘ r=’ -‘aa A (AK)n
0
(16)
where AK is an analytic expression for the stress -intensity. factor range which
describes the character of the growing flaw. If the integration of the re suit-ing expression proves difficult, a finite difference or other numerical tech-
nique may be used, e. g. ,
acl’
NAa
=Y-Pa A (AK)n
0
(17)
and Aa is a small finite advance of the crack. Although exact solutions fora generalized flaw in a finite body are not available, solutions for simpler
idealizations of physical defects do exist.
In Figure 23(a), a simple model of a weld flaw, i. e. , a di.sc -
shaped crack in an infinite body, is shown. For this case,
which, when substituted into Equation (16), yields
=(1 -n/2) _ ~(1 -n/2)
N=cr0
P n
(l-~) A(~)
(19)
This equation provides a model for the case of an isolated pore or inclusion,
as shown in Figure 24(c).
Similarly, as a second model consider a through-crack in abody which is finite in the direction of crack advance (Figure 23(b)). For
this case,
33
A
—--—2a—
2a
I I,-2 b +II
Figure 23. Two models for flawed weldments: left (a) - a disc-shapedcrack in an infinite body; right (b) - a through crack in a
finite plate. The stress intensity factors are given for each
(after Reference 30)
34
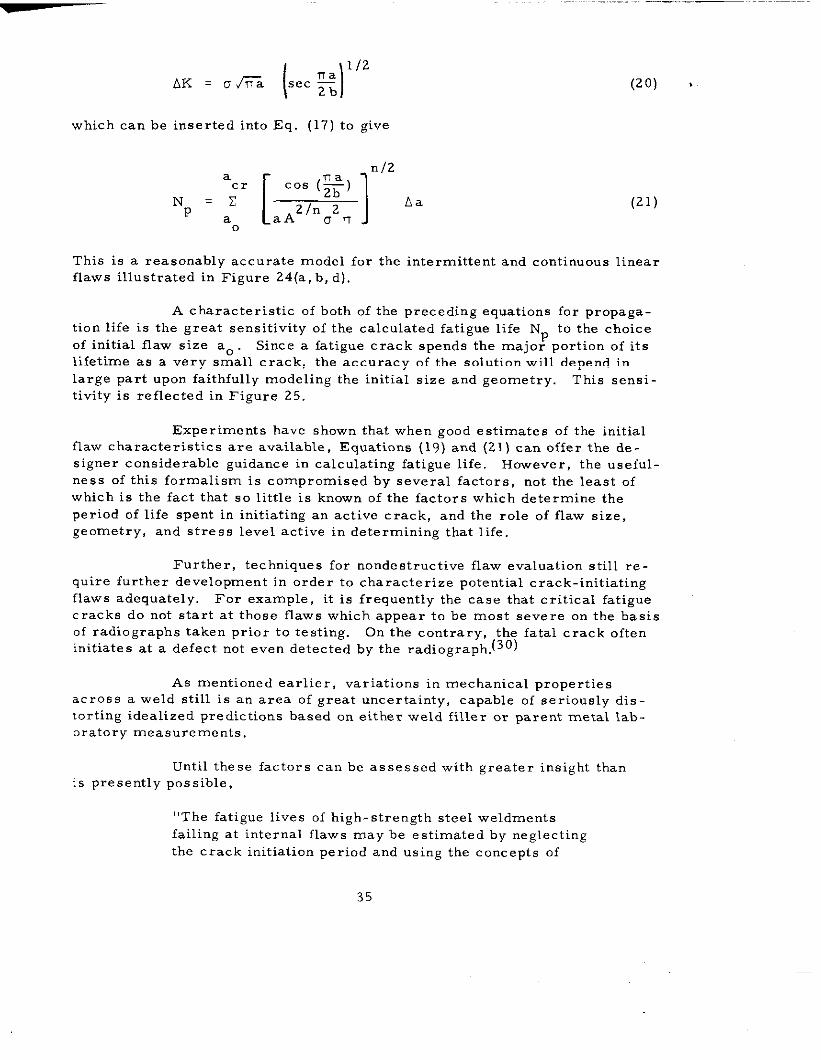
(20) ,
which can be inserted into Eq. (17) to give
‘p‘$ [aT3’:ln’20
This is a reasonably accurate model forflaws illustrated in Figure 24(a, b, d).
Aa (21)
tbe intermittent and continuous linear
A characteristic of both of the preceding equations for propaga-
tion life is the great sensitivity of the calculated fatigue life N to the choice
of initial flaw size a. . Since a fatigue crack spends the majof portion of itslifetime as a very small crack, the accuracy of the solution will depend in
large part upon faithfully modeling the initial size and geometry. This sensi-
tivity is reflected in Figure 25.
Experiments have shown that when good estimates of the initialflaw characteristics are available, Equations (19) and (21) can offer the de-
signer considerable guidance in calculating fatigue life. However, the useful-ness of this formalism is compromised by several factors, not the least of
which is the fact that so little is known of the factors which determine the
period of life spent in initiating an active crack, and the role of flaw size,geometry, and stress level active in determining that life.
Further, techniques for nondestructive flaw evaluation still re-
quire further development in order to characterize potential crack-initiating
flaws adequately. For example, it is frequently the case that critical fatiguecracks do not start at those flaws which appear to be most severe on the hasis
of radiographs taken prior to testing. On the contrary, the fatal crack often
initiates at a defect not even detected by the radiograph~30)
As mentioned earlier, variations in mechanical propertiesacross a weld still is an area of great uncertainty, capable of seriously dis-torting idealized predictions based on either weld filler or parent metal lab-
oratory measurements.
Until these factors can be assessed with greater insight thanlS presently possible,
“The fatigue lives of high-strength steel weldmentsfailing at internal flaws may be estimated by neglecting
the crack initiation period and using tbe concepts of
35
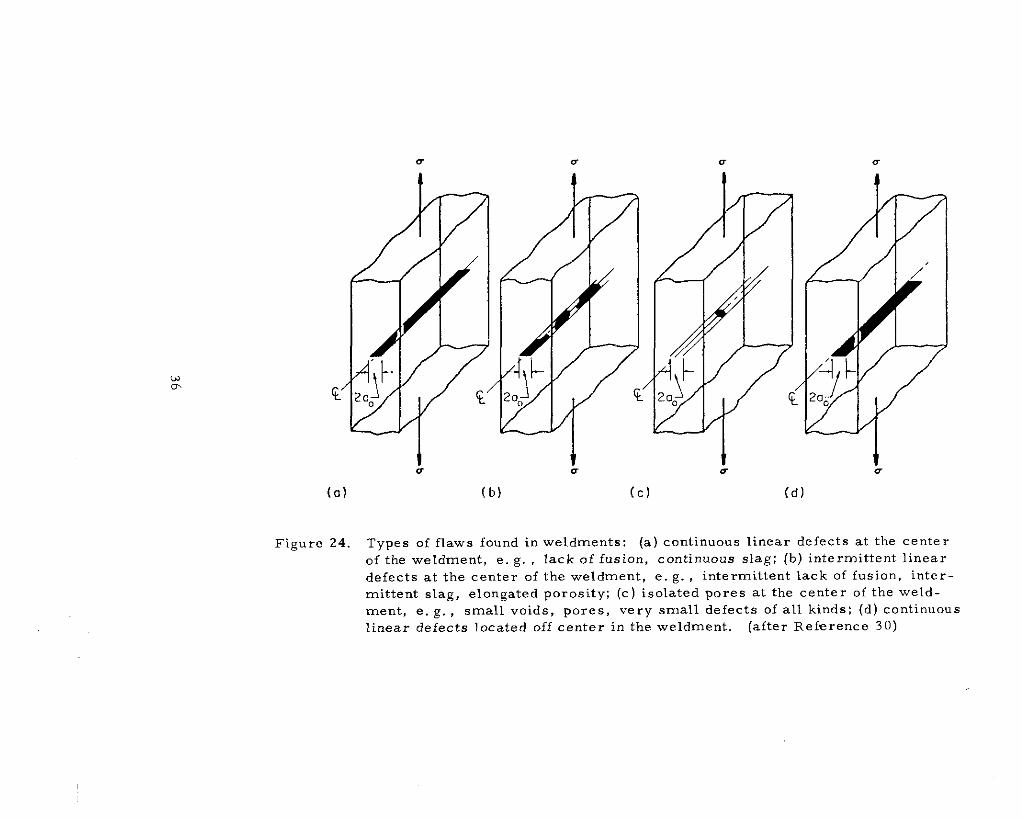
(a)
Figure 24.
(b) (c) (d]
Types of flaws found in weldments: (a) continuous linear defects at the center
of the weldment, e. g. , lack of fusion, continuous slag; (b) intermittent linear
defects at the center of the weldment, e. g. , intermittent lack of fusion, inter-mittent slag, elongated porosity; (c) isolated pores at the center of the weld-
ment, e. g. , small voids, pores, very small defects of all kinds; (d) continuous
Iinear defects located off center in the weldment. (after Reference 30)
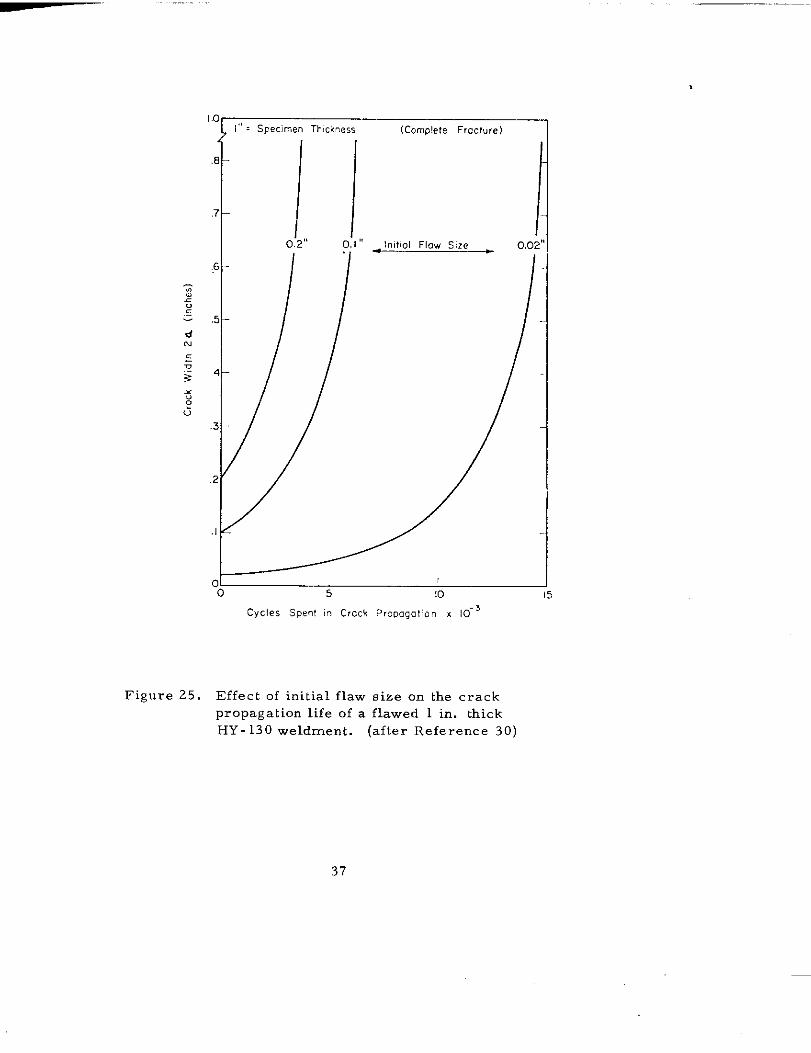
Cycles SW.! in Crock Propogolion x 10-3
Figure 25. Effect of initial flaw size on the crack
propagation life of a flawed 1 in. thick
HY - 130 weldment. (after Reference 30)
37
fracture mechanics to (empirically) predict the number
of cycles spent in crack propagation and hence the mini-mum expected total life. Furthermore, from the demon-
strated sensitivity of tbe propagation life to initial width
of the flaw, it would seem that the fatigue life of a weld-
ment in service should be assumed to be no better than
that resulting from the largest flaw (through -thickness)
dimension) which may be permitted or remain undetectedby the post fabrication nondestructive inspection stan-
dards used. “(3°)
E. Fatigue Damage Estimation
Tbe previous sections have discussed in some detail the problems of
crack initiation and propagation in ship steels and weldments. This knowledgealone, however, is not a sufficient basis for ship design and structural analy-
sis. In many cases the existence of a dangerous subcritical crack is unknownprior to fast fracture, and therefore data concerned with crack growth ratesmay be entirely useless. What is needed instead is a set of design principles
which will relate the expected life of a structural component to the expected
service environment. Such principles are generally known as cumulative dam-
age rules and form the substance of this section.
1. Cumulative Damage Analysis
Structural components are subjected to a wide variety of fatigue-
producing load spectra. Some structural regions primarily experience simple
sinusoidal loads of constant amplitude, whereas others may be subjected to
complex nonstationary random loads. Some appreciation for the variety of
load environments which can occur may be gained by the following classifi-
cation of service fatigue problems currently being studied, from Akaike and
Swanson:
Percentage of all .r. tigueDani”..t Service Lo.*,w Problem, currently Under Study
Constant Anvli,ude Periodic[sine. c=ia.wlar wave) 7
Pmgramned Con, ta.t Amplitude
[block. .f . ..s..”, amplitude
waves) 12
ArbitraryProfileLoadi”~,(reP.. ted..=-SM COMP1.XIcadings) 13
Statima.JRandom[constantrma t. rail... ) 9
N.n-StationaryR..do.n Loadings 13Q..,i-Scati.n.w Random
(..c-ssi.. of st.ti.mavra.dor” blocks) 41
Other >
100?O
38
Superposed on this scale are further complicating effects of multiaxial stress
fields, variable thermal and chemical environments, etc.,.
Nearly all models of cumulative fatigue damage are refinementsof a basic linear cumulative damage model proposed independently by Palm-~ren(37) and Miner, (38) This simPle model views irreversible fatigUe damage
as being introduced with each cycle of load. Tbe rule states that at the i-th
cycle of load with stress Ui , a damage increment is introduced which is equalto 1 /Ni , where Ni is the number of cycles to failure of a specimen cycledunder constant amplitude stress Oi Assuming that the amount of damage
“~sorbed by the material in any one cycle is determined only by the load
during that cycle, then failure should occur when the summation of the dam-
age increments at each stress amplitude equals unity:
T ni/Ni = 1 (22)i
where ni is the number of applied cycles at the i-th load Ie”el
In its usual application Ni is found from the S-N diagram, inturn constructed from fatigue failure tests with small specimens under sinus-
oidal loading. ni , the number of applied cycles at the i-th stress level, is
derived from an estimate of the expected load spectra under which the struc-ture is expected to operate. The print ipal difficulties attendent to this pro-cedure are (1) relating the local material response to the overall structural
loading environment, and (2) estimating the ni from a complex expected load
spectrum.
The most common objection with the linear cumulative damage
approach is that it does not account for the order of stress application. Loadsequencing effects may be important in cases of simple block-type loading,
such as ni cycles at stress Ui followed by cycling to failure at stress Uj..b such cases, it is generally found that the deviation of Zni/Ni from unity
at failure is less predictable, and the linear cumulative law more nearly
provides an average estimate of fatigue life. Reported differences among
investigators almost surely are due largely to the way in which pseudo-
random or true random stress histories are counted as “equivalent” load
cycles for use with the damage rule. It is worth mentioning that Saunders(39)
has recently developed a general analytical probability model from which he
showed that the linear cumulative damage rule emerges as the expected
value of stochastic fatigue life.
In addition to the nature of the loading environment there areother variables which affect the adequacy of the linear cumulative damage
rule. Because of the inherent assumption that the damage increment is inde.pendent of the relative position of the load cycle in the spectrum, the rule is
strictly valid only for the precrack region, Thus, it tends to be more usefulin the ,,low-cycle,, fatigue range, where the major portion of fatigue life ‘s
39
-
spent in crack initiation. Moreover, a review of the experimental basisfor this rule suggests that it is somewhat in better agreement with test re-
sults for structural aluminum alloys than for steels.
In an effort to overcome some of the deficiencies of the linear
cumulative damage rule, many investigators during the 1950’s and ‘6o’s
sought to develop new and improved damage rules. Most amounted to em-
pirical modifications of “Miner’s Rule. “ Although some were developed from
basic physical principles governing crack initiation and growth, most came
as modifications to the original linear cumulative damage rule. O’Neill (41)
bas provided a critical survey of cumulative damage theories through 1970.
He points out that
“None of the rules considered shows a clear superiority
to the linear rule. Some are better in particular situa-tions--typically where a few discrete stress levels are
applied to a simple specimen run to fracture--but suchcases are trivial. However, in random loading of small
specimens, which must one day be related to structural
behavior, the linear rule is usually unconservative. In
part this can be attributed to the common practice of
equating cycles and zero crossings and ignoring inter-
mediate fluctuations. “
This emphasizes the point that the linear cumulative damage rule is the best
one currently available in terms of simplicity and predictive ability, and canbe applied to random loading environments provided the random environment
is properly interpreted in terms of simple sinusoidal specimen fatigue test
data.
2. Frequency and Temperature Effects
Fatigue strength is affected by both cyclic frequency and tem-
perature. The frequency effect in HSLA steels is quite small. In the range
of about 500-10, 000 cpm the frequency effect is in fact negligible. Above
this range tbe fatigue strength shows a continuous, but slow, increase with
frequency, due primarily to micro structural effects (such as dislocation gen-
eration and movement) which require a finite time scale in which to develop.
For typ ical applications involving primar y and secondary sbi p structure, how-
ever, fatigue strength may be considered to be independent of loading frequency.
The effect of temperature on fatigue strength is best understood
by considering three separate thermal regimes. In the range Up to shout
700” F the fatigue and creep properties interact to reduce the fatigue strengthsharply. Above 1000° F the fatigue life is very small and is controlled en-
tirely by creep. Within the temperature environments usually experienced
by p rimary and secondary ship structure, creep is not a consi,ie ration.
40
Fatigue strength decreases with increasing temperature and is accompanied
by the disappearance of a well-defined endurance limit.
3. Multiaxial Stress Fatigue
Although most structural fatigue analysis in practice is based
upon the assumption of a one-dimensional stress state, it is unquestionably
true that most problem areas involve multiaxial stresses. A good deal of
research effort has been given in recent years to understanding this prob-
lem, * and, while substantial gains have been made, there is no single ac-
cepted design procedure for fatigue life prediction under multiaxial stresses.
It is known, however, that such stress systems can severely reduce fatigue
life. Various investigators have attempted to correlate biaxial fatigue failure
data by introducing an “effective” stress Ue (or strain Ce ), which is some
analytical function of the principal stresses (strains) acting. Among the
several expressions proposed for the effective stress are:
u =0e 1
maximum normal stress
Oe = ;(O1- 03)
0=e
:[0?, - 02,’+(02
In these expressions u, > a. > u. are
maximum shear stress
1/203)2 + (03 - 01)2 ]
octahedral shear stress
(23)
(24)
(25)
the principal stresses. As in the case. .of uniaxial fatigue, the Ifatig’ue Ii;e may be expres sed in terms of the maximum
value of Oe per cycle, Or cyclic amplitude per cycle fIUe, Or in terms Of themaximum or cyclic amplitude of the effective strain fe . There is no agree-ment, however, as to which expressions are the most descriptive for a given
material and loading spectrum. A good engineering discussion of the use of
these various expressions may be found in the book by Marin. (44) He recom-
mends that the single most useful design tool is the modified octahedral sheartheory. In the case of biaxial StreSseS (U3 . O), this theory takes the form
(0; )2 +[2 - (0. /70)2 ]0;0; + (0; )2
+ i+l (:I’J(u;? + [2 - (Ofky)z]u; u; + (U;)2 = 00
(26)
*,-a, den(43) has published ~ bibliography on the subject containing approxi-
mately 700 references through 1967.
41
where o{ , etc. , represent maximum values per cycle, and 00 and ‘rO are
the tensile and shear fatigue strength, respectively, under completely i-e.
versed stress. Also, of and UY are the static tensile and yield strengths,
and R is the usual stress ratio: %in /“max This theory, which assumes
that the biaxial stresses are always in-phase, may be used either to predict
fatigue strengths Go and -rO for given combined stresses, or determine allow-
able stresses u; and U2 for given fatigue properties.
Despite the amount of engineering research devoted to the prob-
lem of multiaxial fatigue, little definitive information is available for low-alloy
steels of the type employed in ship construction, Blatherwick and Viste(45)tested thin tubes of 1020 steel in combined stress fatigue and concluded that
the octahedral shear stress correlated their data better than other effective
stress measures. Havard and Topper (46) conducted similar tests on 1018steel in oil. They found that fatigue strength conformed to the Basquin rela-
tionship Ac = ANb for ~la~tic strains, to the Coffin -Manson relationship
c Nd IOr plastic strains, and to the sum Act = A Nb + C Nd for total::}aPn~
Their recommendation for design is to use the maximum shear
stress range plus one-twelfth of the sum of the principal stress ranges.
Thus, De .ANb, where
a= ;A(ul -e
rJ2) + *A (U I + U2) (27)
In view of the variety of criteria and recommended practices
available, for the time being design for multiaxial fatigue must lean heavily
on experimental data generated under conditions closely simulating the ex-
pected service environment. Extrapolations of such data to other material
conditions and loading spectra can be quite hazardous and should be attemptedonly when comfortable margins can be designed into the structure.
4. Random Loads
In the analysis of structural fatigue the engineer is faced with
the problem of defining the load environment and its relationship to critical
structural regions under investigation. First, it is necessary to characterize
the service loading as being essentially constant amplitude (such as sinusoidal
or blocks of sinusoids) or essentially random, or a combination of random
and deterministic loads. If the loading environment has random content, thenestimates must be made of statistical quantities which, at least roughly, de -
scribe the environment. Some of the basic concepts involved in describinga random signal are illustrated in Figure 26. Figure 26(a) shows a trace of a
portion of a random signal as a function of time, and its square, shown dashed.
A Fourier analysis of this trace segment would reveal a number of harmonic
components ; three are illustrated, Figure 26(b) shows the “power spectral
density” (PSD) diagram for this trace; PSD is a measure of the energy content
42
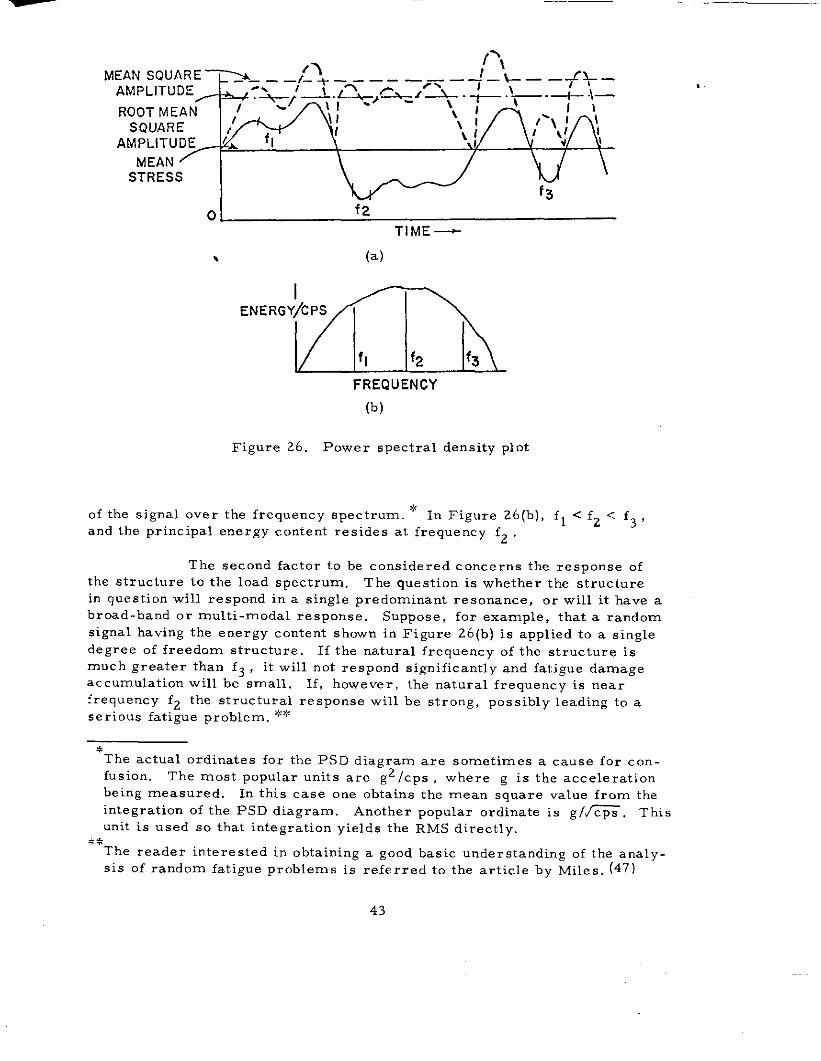
ROOT MEANSQUARE
AMPLITUDEMEAN T \ / L“J \
STRESSI WY’
TIME+
\ (a)
FREQUENCY
(b)
Figure 26. Power spectral density plot
of the signal over the frequency spectrum. * In Figure 26(b), fl < f2 < f3,and the principal energy content resides at frequency fz .
The second factor to be considered concerns the response of
the structure to the load spectrum. The question is whether the structurein question will respond in a single predominant resonance, or will it have abroad-band or multi-modal response. Suppose, for example, that a random
signal having the energy content shown in Figure 26(b) is applied to a single
degree of freedom structure. If the natural frequency of the structure ismuch greater than f3 , it will not respond significantly and fatigue damageaccumulation will be small. If, bowever, the natural frequency is near<requency fz the structural response will be strong, possibly leading to a
serious fatigue problem. ‘:*
.‘The actual ordinates for tbe PSD diagram are sometimes a cause for con-
fusion. The most popular units are g2/cps , where g is the accelerationbeing measured. In this case one obtains the mean square value from the
integration of the PSD diagram, Another popular ordinate is g/@. Thisunit is used so that integration yields the RMS directly.
The reader interested in obtaining a good basic understanding of the analy-
sis of random fatigue problems is referred to the article by Miles, (47)
43
Problems in random vibration are commonly classified as
“narrow-band” or “wide-band” according to how wide in frequency the PSD
diagram is relative to the center frequency. More is known of narrow-band
random processes than of wide-band processes. For example, if the pro-
cess is Gaussian, it is known that the distribution of peak amplitudes is aRayleigh distribution. (For wide-band processes the distribution is unique
to the process. ) This fact has made it possible to calculate the expected
value of fatigue damage accumulation for narrow-band random processes as
a function of time t Crandall and Mark (48) have shown that if one assumesan S-N curve of the form Nub = c , and uses the linear cumulative damage
rule, the expected value of the damage, E(D) , is:
E [D(t)] = ~ (@orm~)b ~ (1 + b/2) (28)
where ~. is the expected frequency of the narrow-band random stress history
with zero mean stress (the average number of zero crossings with positiveslope per unit time), Urms is the rms stress level, and r is the gamma func-
tion, tabulated in standard mathematical tables. It is useful to compare the
damage as predicted by the narrow-band random process to that given by the
cumulative damage rule for constant -amplitude s inusoidal loading. In the~ Otlatter case, the time-dependent damage is D(t) =—
bOn equating
c ‘max”this damage with the expected damage from the random process, Eq. (28),one finds an expression of the form Umax = kurm~ , where k =/2~(1 +b/2)]1’brelating the stresses for the two processes. It is instructive also to comparethe calculated value of fatigue damage accumulated under a narrow-band ran-
dom process with the damage accrued under a sinusoidal stress environment
of frequency u. and maximum stress Orms . The ratio of the expecteddamage from the narrow-band random process to that of the constant-am-
plitude sinusoidal process at the same peak stress le”el orm~ is 2 b/2r(l+b/2).Using a typical value of b = 4 for steels, one finds that tbe damage accumula -tion rate for the random process is 8 times that of the ,,equi”alent,, deter-
ministic process. This ca~culation has been borne out by laboratory experi-ence many times. The rates of damage accumulation under the narrow-bandrandom and the sinusoidal loading environments are equal only as the S-Ncurve approaches a horizontal slope, which is uncharacteristic of any real
metal.
The problem of transforming a, random loading spectrum into
an “effective!’ sinusoidal environment is a difficult one which has received
a great deal Of attenti On recently. It is essential tO have a proven procedurefor determining tbe stress levels and numbers of loading cycles in order that
sinusoidal specimen data can be used in conjunction with the linear cumula-
tive damage rule. One day undoubtedly more property data will be generatedunder !’standardlt random loading conditions, but that day is not yet in sight.
I
When reducing a random signal for purposes of fatigue analysisit is essential that all “primary!! cYcles in a given period be considered, but
44
“secondary” signals can usually be ignored. The meanings of “primary” and
“secondary” are established in the following manner: First, ~ mean ~tre~~
level ume%n is established for the entire record. Then, the maximum stress
occurring between a crossing of Omean with a positive slope and a crossing
with negative slope is called Umax All other local maximum stress values
are designated Uma Finally, the minimum stress occurring between a
crossing of omean with negative slope and a crossing with positive slope
is designated Umin . With these definitions, the combination of a Umi with
the next Oma forms a secondary cycle. A simple systematic procedure for
cycle counting, which has enjoyed wide use, is the following: If peaks and
troughs are normally distributed about a positive mean stress, the damage
per cycle caused by all cycles which neither cross nor exceed the mean
stress can be neglected.
5. Equivalence Between Sinusoidal and Random Fatigue Damage
The structural designer is interested in knowing how to deter-
mine the frequency and number of cycles of a sinusoidal loading program
that is “equivalent” to a given random loading program. In the present con-
text, the term “equivalent” means the same as “inflicting the same amountof fatigue damage. “ This sort of a calculated equivalence between sinusoidal
and random fatigue loading environments is often necessary in structural fa.tigue design. For example, it is not uncommon for the fatigue load spectra
to be given by a random description, whereas the base-line material behavior
(S-N diagram) is available only from the results of sinusoidal fatigue tests.
There is no calculation procedure that can be applied with corn.
plete confidence in all cases. In striving for accuracy and generality, a num-ber of research investigators have proposed rather sophisticated procedures
in recent years. Rather than follow this trend, however, this subsection willoutline the simple method of calculating random-sinusoidal fatigue equivalence
discussed in the preceding section. This procedure can be simply applied andshould provide realistic answers sufficiently accurate for ship primary and
secondary structural design purposes. The problem posed in this procedure
is to calculate the constant amplitude sinusoidal fatigue loading which is
equivalent (in terms of cumulative damage) to a given random loading en”ii-on -
ment. This procedure rests on the following assumptions:
(a) The stress response of primary and secondary ship
structure is approximately a narrow-band, stationary
Gaussian process.
(b) The “S-N” curve is log-log linear and described by the
equation Nub . c
(c) The usual assumptions of “Minerrs Rule,, (Sect. 11. E. 1)
hold.
The procedure is described by the following six steps.
45
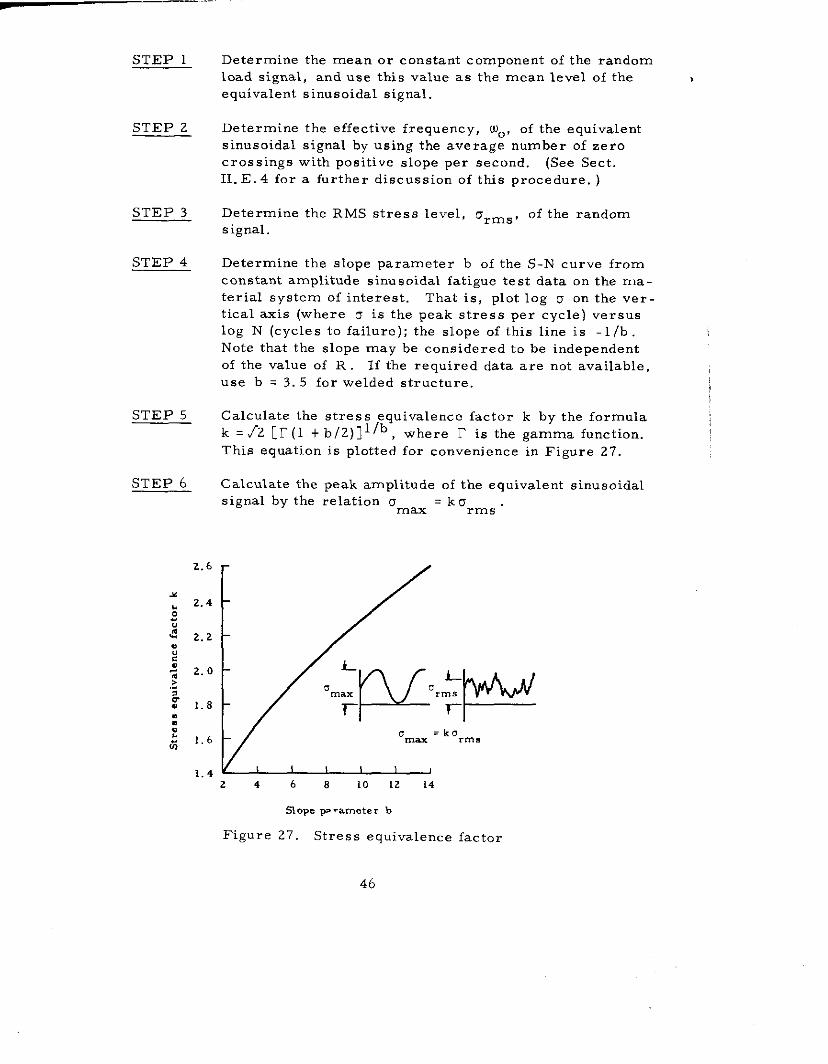
~—””--
STEP 1
STEP 2
STEP 3
STEP 4
STEP 5
STEP 6
2.6
1.4
Determine the mean or constant component of the random
load signal, and use this value as the mean level of the
equivalent sinusoidal signal.
Determine the effective frequency, Wo, of the equivalent
sinusoidal signal by using the average number of zero
crossings with positive slope per second. (See Sect.
11. E.4 for a further discussion of this procedure. )
Determine the RMS stress level, Orm~, of the random
signal.
Determine the slope parameter b of the S-N curve from
constant amplitude sinu ~oidal fatigue test data on the ma, -terial system of interest. That is, plot log u on the ver-
tical axis (where o is the peak stress per cycle) versus
log N (cycles to failure); the slope of this line is -1/b
Note that the slope may be considered to be independent
of the value of R If the required data are not available,
use b . 3. 5 for welded structure.
Calculate the stress equivalence factor k by the formula
k={2 [r(l +b/2)]1/b, where r is the gamma function.
This equation is plotted for convenience in Figure 27.
Calculate the peak amplitude of the equivalent sinusoidal
signal by the relation Omm = k urms
=ko‘rnax rms
24 68101214
tlope P -amete r b
Figure 27. Stress equivalence factor
46
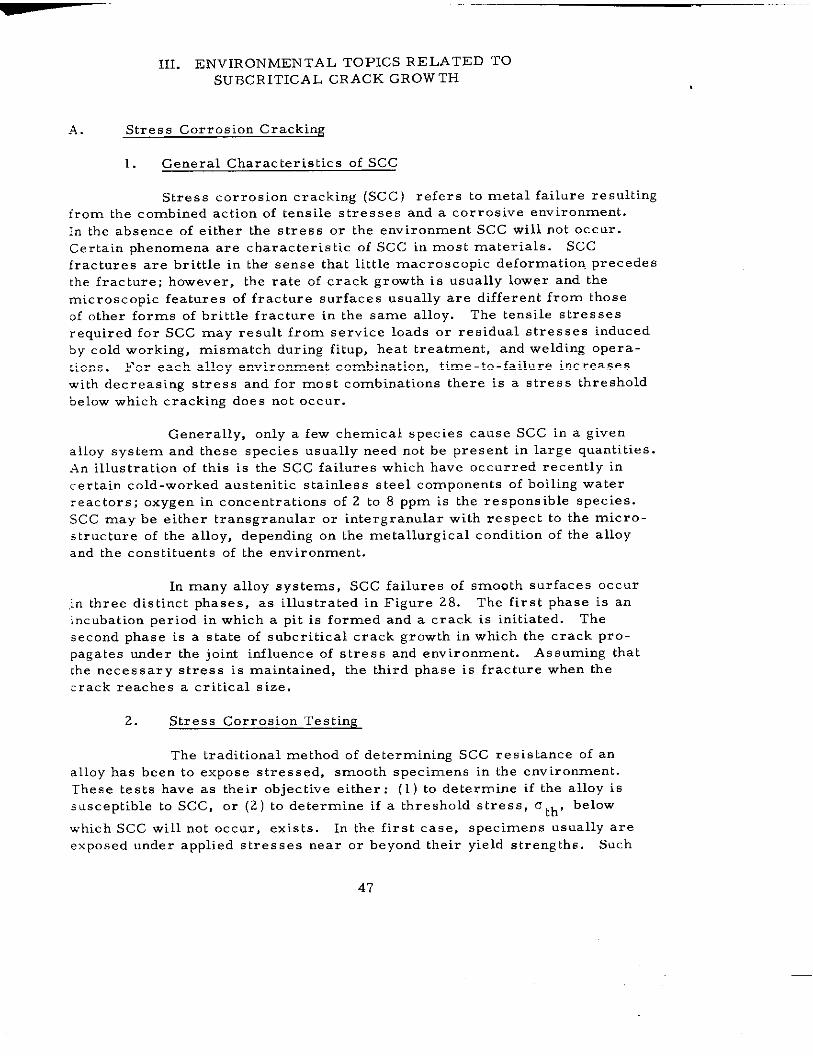
III. ENvIRONMENTAL TOPICS RELATED TO
SUBCRITICAL CRACK GROWTH
A . Stress Corrosion Cracking
1. General Characteristics of SCC
Stress corrosion cracking (SCC) refers to metal failure resultingirom the combined action of tensile stresses and a corrosive environment.
In the absence of either the stress or the environment SCC will not occur.
Certain phenomena are characteristic of SCC in most materials. SCC
fractures are brittle in the sense that little macroscopic deformation% precedesthe fracture; however, the rate of crack growth is usually lower and the
microscopic features of fracture surfaces usually are different from those
of other forms of brittle fracture in the same alloy. The tensile stresses
required for SCC may result from service loads or residual stresses induced
by cold working, mismatch during fitup, heat treatment, and welding opera-
tions. For each alloy environment combination, time-to-failure increases
with decreasing stress and for most combinations there is a stress threshold
below which cracking does not occur.
Generally, only a few chemical species cause SCC in a givenalloy system and these species usually need not be present in large quantities.
.+n illustration of this is the SCC failures which have occurred recently in
certain cold-worked austenitic stainless steel components of boiling water
reactors; oxygen in concentrations of 2 to 8 ppm is the responsible species.
SCC may be either transgranular or intergranular with respect to the micro-s tructure of the alloy, depending on the metallurgical condition of the alloy
and the constituents of the environment.
In many alloy systems, SCC failures of smooth surfaces occurin three distinct phases, as illustrated in Figure 28. The first phase is an
incubation period in which a pit is formed and a crack is initiated. The
second phase is a state of subcritical crack growth in which the crack pro-
pagates under the joint influence of stress and environment. Assuming thatthe necessary stress is maintained, the third phase is fracture when thecrack reaches a critical size.
2. Stress Corrosion Testing
The traditional method of determining SCC resistance of analloy has been to expose stressed, smooth specimens in the environment.
These tests have as their objective either : (1 ) to determine if the alloy issusceptible to SCC, or (2 ) to determine if a threshold stress, Oth, below
which SCC will not occur, exists. In the first case, specimens usually are
exposed under applied stresses near or beyond their yield strengths. Such
47
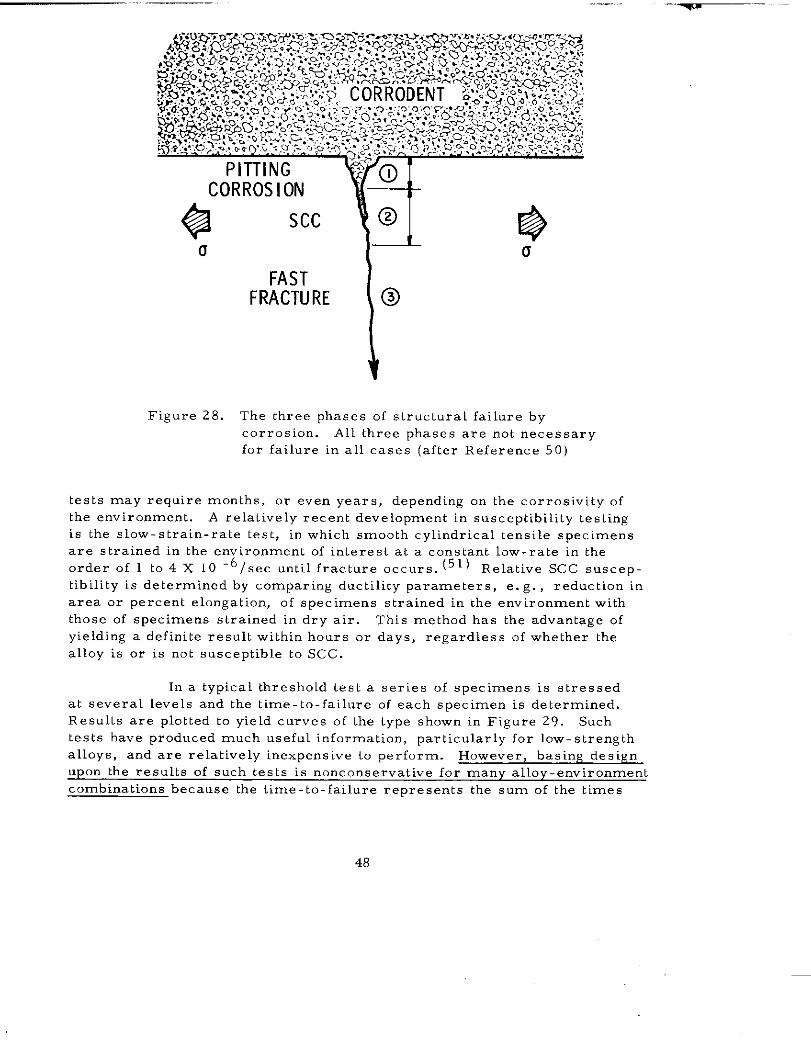
.- ----- .-
PITTINGCORROSION
@Scc
0
FASTFRACTURE
Figure 28. The three phases of structural failure by
corrosion. All three phases are not necessaryfor failure in all cases (after Reference 50)
tests may require months, or even years, depending on the corrosivity of
the envircmment. A relatively recent development in susceptibility testingis the slow-strain-rate test, in which smooth cylindrical tensile specimensare strained in the environment of interest at a constant low-rate in the
order of 1 to 4 X 10 ‘blsec until fracture occurs. (51) Relative SCC suscep-
tibility is determined by comparing ductility parameters, e. g. , reduction in
area or percent elongation, of specimens strained in the environment with
those of specimens strained in dry air. This method has the advantage ofyielding a definite result within hours or days, regardless of whether the
alloy is or is not susceptible to SCC.
In a typical threshold test a series of specimens is stressed
at several levels and the time-to-failure of each specimen is determined.
Results are plotted to yield curves of the type shown in Figure 29. Suchtests have produced much useful information, particularly for low-strengthalloys, and are relatively inexpensive to perform. However, basing designupon the results of such tests is nonconservative for many alloy-environment
combinations because the time-to-failure represents the sum of the times
48
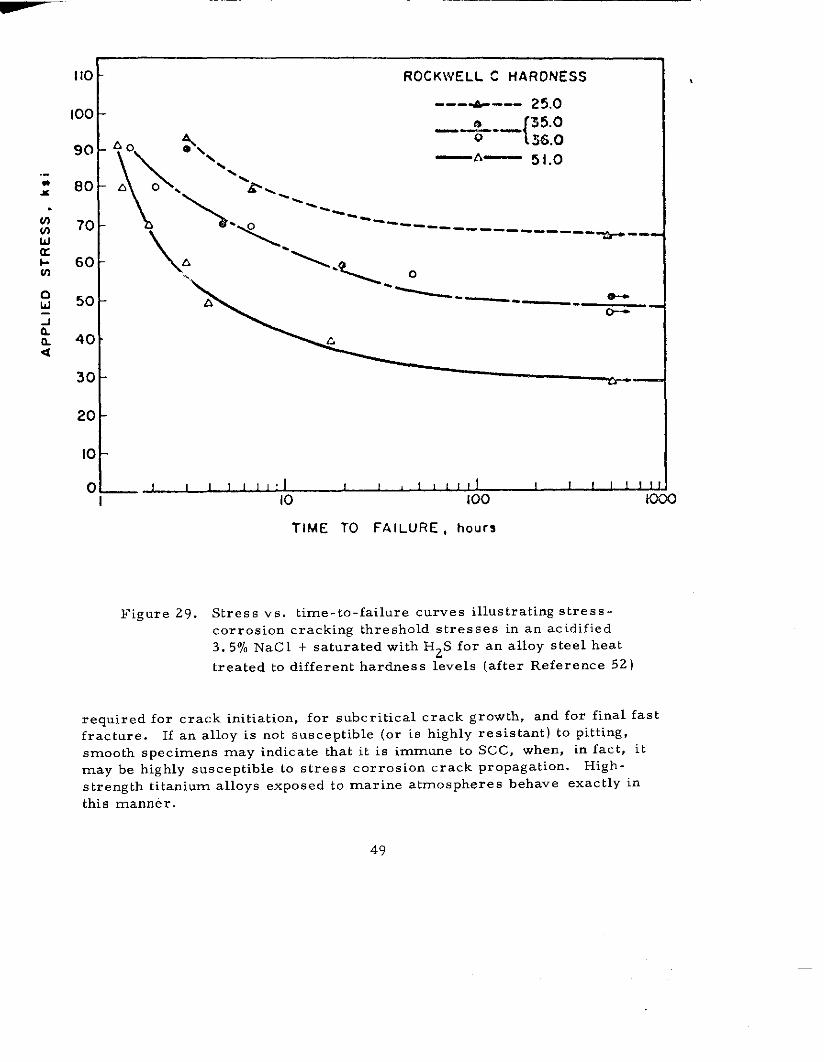
I10 -
100 -
90 -
.-
: 00 -
w0? 70 -ua1- 60 -In
aw 50 -
i&a. 40 -a
30 -
ROCKWELL C HARONESS
---+--- 25.0b
{35.0——. —
Ao0
* K,36.0
/
\
—A—\ 51.0‘\
Ao. k.%<
L+.~~
---
‘<------ --------------
A ‘\. -<.<
‘~
b -—- —-— -
c,
—
o
TIME TO FAILURE , hours
Figure 29. Stress vs. time-to-failure curves illustrating stress-
corrosion cracking threshold stresses in an acidified
3.570 NaCl + saturated with H2S for an alloy steel heat
treated to different hardness levels (after Reference 52)
required for crack initiation, for subcritical crack growth, and for final fast
fracture. If an alloy is not susceptible (or is highly resistant) to pitting,
smooth specimens may indicate that it is immune to SCC, when, in fact, it
may be highly susceptible to stress corrosion crack propagation. High-
strength titanium alloys exposed to marine atmospheres hehave exactly inthis manner.
49
.-
Testing, using precracked specimens and linear elastic fracture
mechanics analysis (see Appendix, Section D), has come into widespread use
in recent years. These tests are particularly relevant to high-strength
materials with a limited tolerance to defects, where a small stress corrosion
crack may initiate catastrophic brittle fracture. A variety of test methods
and specimen designs to simulate various loading conditions have been
described in the technical literature. (53-55) Since SCC in high-strength
materials occurs almost wholly under plane-strain conditions, the fracture
mechanics parameter most widely employed in SCC studies is the Mode I
plane-strain stress-intensity factor, KI, hereafter abbreviated K Use of pre -
cracked specimens eliminates the crack initiation phase of SCC, and K then is
an accurate measure of the mechanical driving force for subcritical crackgrowth since it expresses conditions at the crack tip. The resistance of metals
to SCC has been characterized in terms of the threshold level of K below which
subcritical crack growth is not observed. This characteristic threshold level
is designated KI~cc and quantifies SCC resistance for a specific alIOY-envir On- 1ment combination with a single number which relates flaw size to nominal
stress. Characterization of SCC resistance in terms of critical flaw size
is then possible and is most useful since the design of many structures is
based on a maximum allowable flaw size, usually determined by the sensi-
tivity or reliability of the nondestructive inspection methods employed. If it
is assumed that a long, shallow surface crack is present in a structure, that
yield point stresses are present around this crack, and that the value of
‘Iscc is known for the material in the given environment, the depth of the
flaw required to initiate SCC subcritical crack growth may be computed from
(29)
where a is the critical flaw depth and OY is the yield strength. This methodof characterizing SCC is convenient for comparing SCC resistance of various
alloys, as shown in Figure 30. k this figure K1~cc data for four ultra high-
strength steels in salt water are shown as a function of yield strength. Sincemechanical properties of a material can vary from point-to-point on one plate
and from one plate to another of the same nominal composition, each alloy
system is characterized by a zone reflecting a range of properties rather thanby a point. The dotted line represents the plane-strain fracture toughness,
KIC, of the materials. The straight lines represent Equation (29) for two
selected values of flaw depth. The significance of these lines is that if aflaw of the depth shown exists and if yield point stresses are present about
the flaw, a metal with a K18CC value below the line will undergo SCC sub-critical crack growth.
50
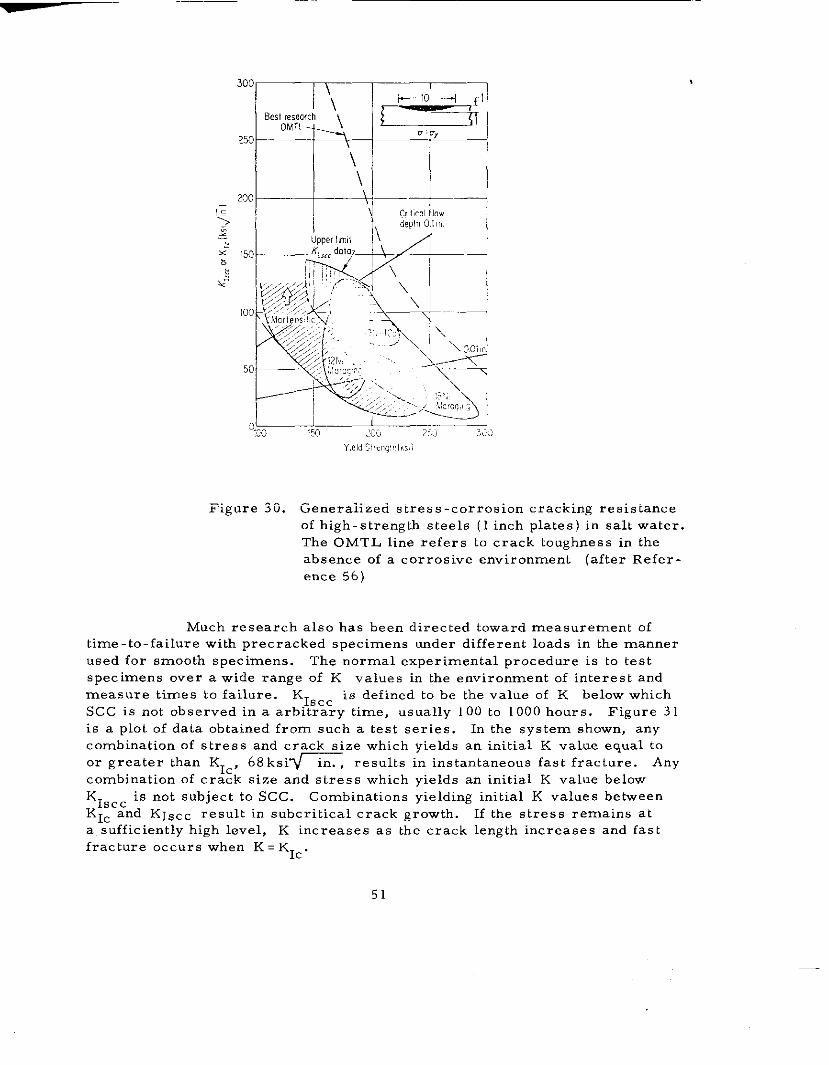
.
300
E
\Bml,mm,ch
OMTL \ ~’
250
\
\200— l—4—
~ Cri!icolflow ~~111 dwl” O.llr,.
~&M
Figure 30.
IN ,!c)o —— ? :,, j :,~~
Y,eld Slrw!?.id
Generalized stress-corrosion cracking resistanceof high-strength steels ( 1 inch plates) in salt water.
The OMTL line refers to crack toughness in the
absence of a corrosive environment (after Refer-
ence 56)
Much research also has been directed toward measurement of
time-to-failure with precracked specimens under different loads in the manner
used for smooth specimens. The normal experimental procedure is to test
specimens over a wide range of K values in the environment of interest and
measure times to failure. K1~cc is defined to be the value of K below which
SCC is not observed in a arbitrary time, usually 100 to 1000 hours. Figure 31
is a plot of data obtained from such a test series. In the system shown, any
combination of stress and crack size which yields an initial K value equal to
or greater than KIC, 68 ksi~, results in instantaneous fast fracture. Any
combination of crack size and stress which yields an initial K value below
K ~~cc is not subject to SCC. Combinations yielding initial K values between
KIC and K1~cc result in subcritical crack growth. If the stress remains at
a sufficiently high level, K increases as the crack length increases and fastfracture occurs when K . KIC.
51
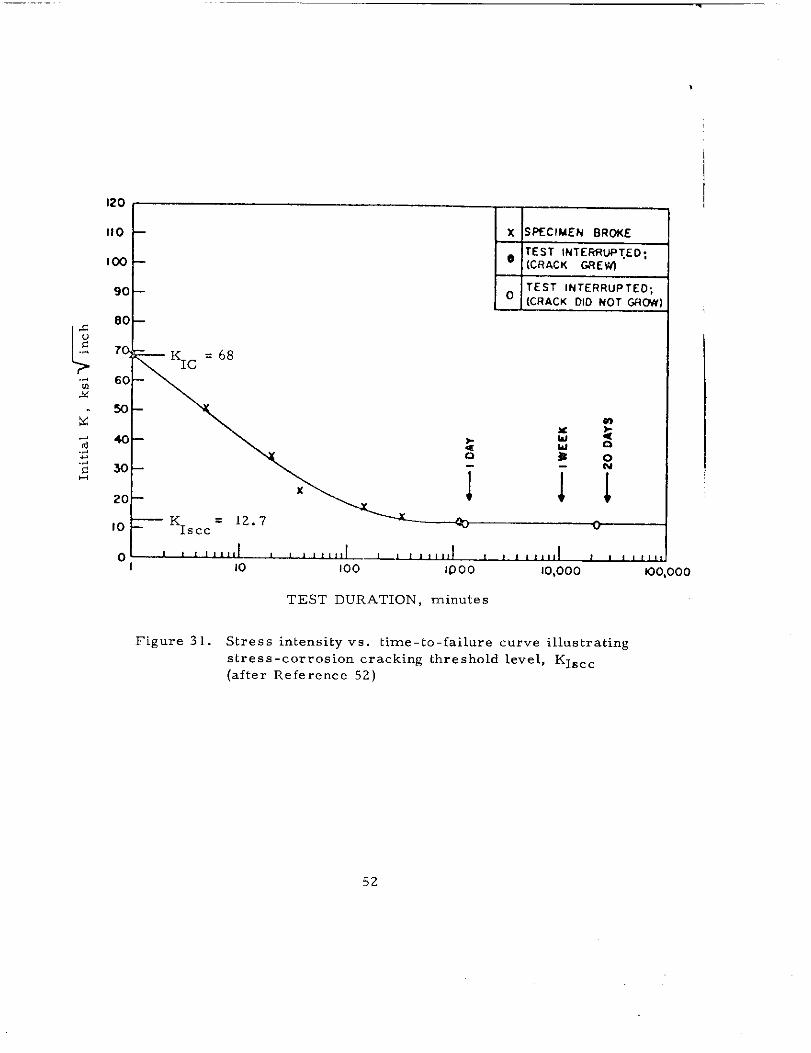
120 -
110 x SPECIMEN BRoKETEsT INTERwPTEO;
100 — 0 [Cf?ACK GQEwT
90 — TEST lNTERRuPTEO;
0 (CRACK DID NOT GRCW)
80 –
7Q
60 —
so –91
40 —~
$ :0
0
30 –$0-w
20 —x 1 Jl
to TK = 12.7Iscc w
o~~ooo
TEST DURATION, minutes
Figure 31. Stress intensity vs. time-to-failure curve illustratingstress-corrosion cracking threshold level, K1~cc
(after Reference 52)
52
3. SCC of Ship Steels in Marine Environments
Merchant ship hull structural elements are currently con-
structed of a wide variety of steels which can be classified into three groups :
( 1 ) as rolled or normalized structural carbon steels with yield strengths up
to 40 ksi; (2) high-strength low-alloy (HSLA) steels with yield strengthsfrom 40 to 75 ksi; and (3) high-strength low-alloy quenched-and-tempered
(HSLA Q & T) steels with yield strengths from 75 to 100 ksi. The structural
carbon steels for years have been employed in many applications involving
exposure to marine environments, e. g. , bridges, drilling platforms, and
pipelines, in addition to their use in ship structures. To the knowledge of
the authors, SCC has not occurred in any of these applications with structural
carbon steels. The literature indicates that these steels are subject to SCC
in a relatively few chemical environments, i. e. , hot concentrated hydroxides,
nitrates, and carbonates, sulfides, cyanides, some hydrocarbons, and coalgas. (57,58) Chlorides, the principal constituent of seawater, have beenshown to be incapable of inducing SCC. (59, 60) These data, in conjunction
with the favorable service experience with structural carbon steels, lead to
the conclusion that these steels are immune to SCC in marine environments.
A review of the SCC behavior of HSLA and HSLA Q & T steels
by Phelps(52) indicates that steels with yield strengths up to about 180 ksi
are resistant to SCC in chloride solutions, that steels in the range of 180 to210 ksi may be susceptible, and that steels with higher yield strengths are
highly susceptible. Sandoz(61 ) states that the yield strength limit for SCCimmunity of marten sitic steels in salt water is about 120 ksi. The resultsof SCC tests on a number of low-alloy steels in marine atmospheres and
seawater reported by Schmitt and Phelps(62) are summarized in Tables II
and III. Examination of the data in these tables shows that steels rangingin yield strength from 50 to 163 ksi were not susceptible to SCC in marine
environments for exposure times ranging up to 2200 days. However, all of
these data were obtained from smooth specimens, and it is known that many
alloys, particularly higher strength materials, which appear to be resistant
to SCC when tested as smooth specimens actually are resistant to crackinitiation and may be quite susceptible to crack propagation. Therefore, tocategorize completely the SCC resistance of a high-strength materials of the
HSLA Q & T type it is necessary to test precracked specimens.
There is relatively little precracked specimen data availablefor HSLA and HSLA Q & T steels. Novak(63) found that artificial seawaterhad no effect on the SCC resistance of precracked specimens of HY-80
(90 ksi yield strength) and that precracked specimens of HY-130 (T) (135 ksiyield strength) were only slightly susceptible to SCC. Leckie and Loginow(64)obtained the same result for HY-80 steels. Smith and Davis(65) investigatedthe effects of 3% NaCl solution on precracked specimens of HY-80 weld metal
(124 ksi yield strength) obtained from a 1 -inch thick ..veldment prepared by
the shielded-metal-arc process and HY - 130 weld metal (145 ksi yield strength)
53
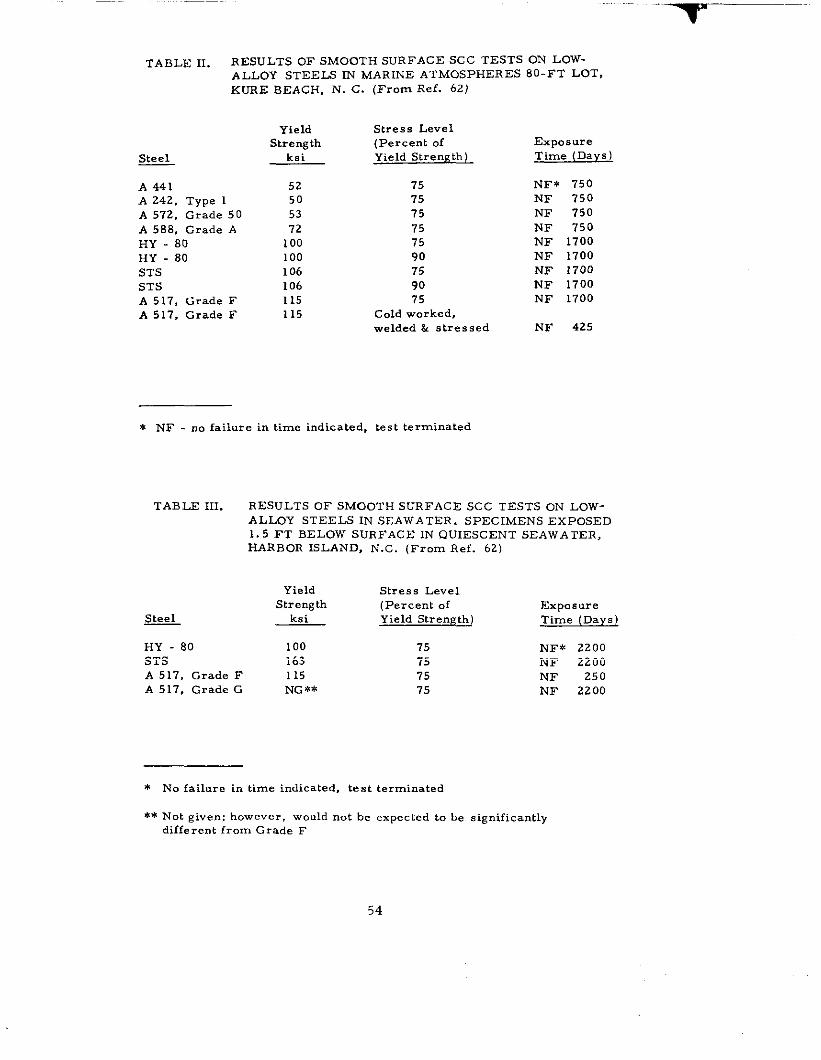
““-””“-7
TABLE II. RESULTS OF SMOOTH SURFACE SCC TESTS ON LOW=ALLOy STEELS m MARINE ATMOSPHERES 80-FT LOT,KURE BEACH, N. C. (From Ref. 62)
~
A 441A 242, Type 1A 572, Grade 50A 588, Grade AHY - 80HY - 80STSSTSA 517, Grade FA 517, Grade F
YieldStrength
ksi
52505372
100100106106115115
Stress Level(Percent ofYield Strength)
757575757590759075
Cold worked,welded & stressed
ExposureTime (Days)
NF+ 750NF 750NF 750NF 750NF 1700NF 1700NF 1700NF 1700NF 1700
NF 425
* NF . m failure in time indicated, test terminated
TABLE III. RESULTS OF SMOOTH SURFACE SCC TESTS ON LOW-ALLoY STEELS IN SEAWATER. SPECIMENS EXPOSED1.5 FT BELOW SURFACE IN QUIESCENT SEAWATER,fiARBoR ISLAND, N.C. (Frorn Ref. 62)
Yield Stress LevelStrength (Percent Of Exposure
~ ksi Yield Stren~th) Time (Days)
HY - 80 100 75 I.JF* 2200STS 163 75 NF 2200A 517, Grade F 115 75 NF 250A 517, Grade G NG ** 75 NF 2200
* NO failure in t,me indicated, test terminated
** Not given; however, would not be expected to be significantlydifferent from Grade F
54
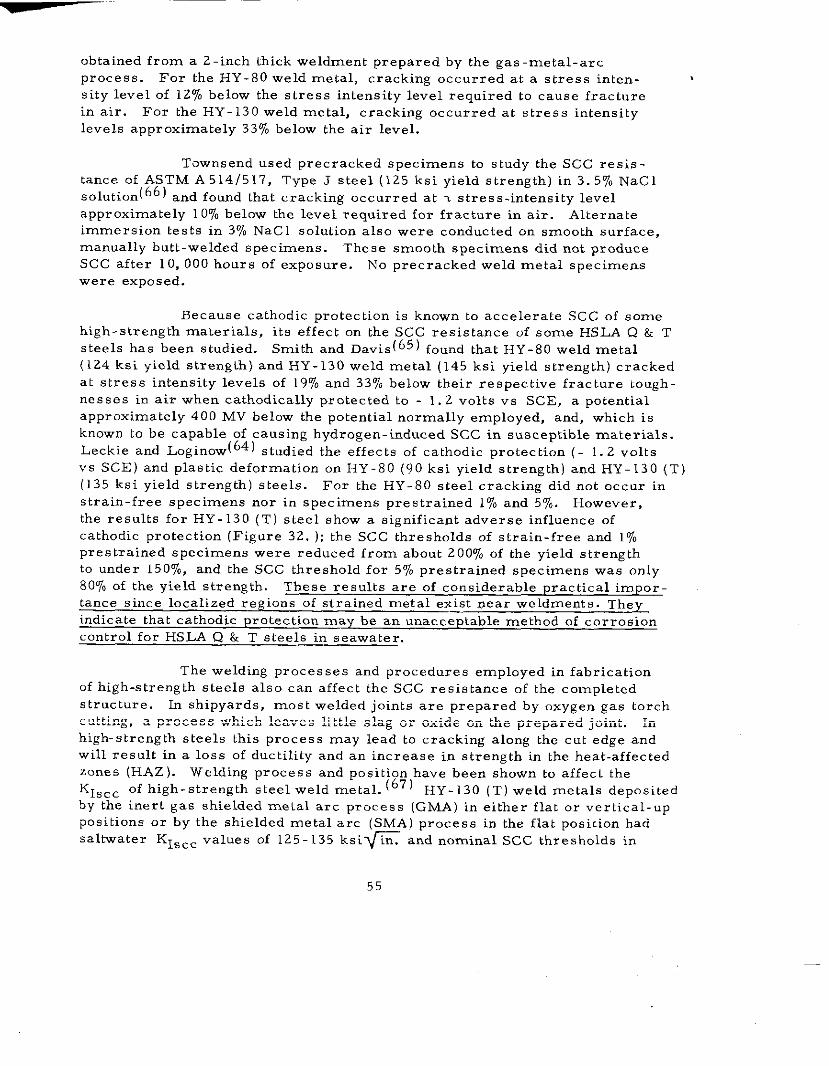
obtained from a 2-inch thick weldment prepared by the gas-metal-arc
process. For the HY-80 weld metal, cracking occurred at a stress inten-
sity level of 1270 below the stress intensity level required to cause fracture
in air. For the HY-130 weld metal, cracking occurred at stress intensitylevels approximately 33% below the air level.
Townsend used precracked specimens to study the SCC resis-tance of ASTM A 514/517, Type J steel (125 ksi yield strength) in 3.570 NaGl
soluticm(66) and found that cracking occurred at ~ stress-intensity level
approximately 1 WO below the level required for fracture in air. Alternate
immersion tests in 3% NaCl solution also were conducted on smooth surface,
manually butt-welded specimens. These smooth specimens did not produceSCC after 10, 000 hours of exposure. No precracked weld metal specimens
were exposed.
Because cathodic protection is known to accelerate SCC of somehigh-strength materials, its effect on the SCC resistance of some HSLA Q & T
steels has been studied. Smith and Davis (65) found that HY-80 weld metal
(124 ksi yield strength) and HY-130 weld metal (145 ksi yield strength) cracked
at stress intensity levels of 1970 and 33’% below their respective fracture tough-
nesses in air when catholically protected to - 1.2 volts vs SCE, a potential
aPPr OximatelY 400 MV below the potential normally employed, and, which isknown to be capable of causing hydrogen- i~duced SCC in susceptible materials.
Leckie and Loginow(64) studied the effects of cathodic protection (- 1.2 volts
vs SCE) and plastic deformation on HY-80 (90 ksi yield strength) and HY-130 (T)
(135 ksi yield strength) steels. For the HY-80 steel cracking did not occur instrain-free specimens nor in specimens prestrained 170 and 570. However,
the results for HY - 130 (T) steel show a significant adverse influence of
cathodic protection (Figure 32. ); the SCC thresholds of strain-free and l%prestrained specimens were reduced from about 2007, of the yield strength
to under 150’70, and the SCC threshold for 57, prestrained specimens was only
80% of the yield strength. These results are of considerable practical impor-tance since lo’alized regions of strained metal exist near weldments. They
indicate that cathodic protection may be an unacce~table method of corrosioncontrol for HSLA Q & T steels in seawater.
The welding processes and procedures employed in fabricationof high-strength steels also can affect the SCC resistance of the compLeted
structure. In shipyards, most welded joints are prepared by oxygen gas torchcutting, a process which leaves little slag or oxide on the prepared joint. In
high-strength steels this process may lead to cracking along the cut edge and
will result in a loss of ductility and an increase in strength in the heat-affected
zones (HAZ ). Welding process and position have been shown to affect the
K1~cc of high-strength steel weld metal. (67) Hy.130 (T) weld metals deposited
by the inert gas shielded metal ar’ process (G MA) in either flat or vertical-up
positions or by the shielded metal arc (SMA) process in the flat position had
saltwater K1~cc values of 125-135 ksi~ and nominal SCC thresholds in
55
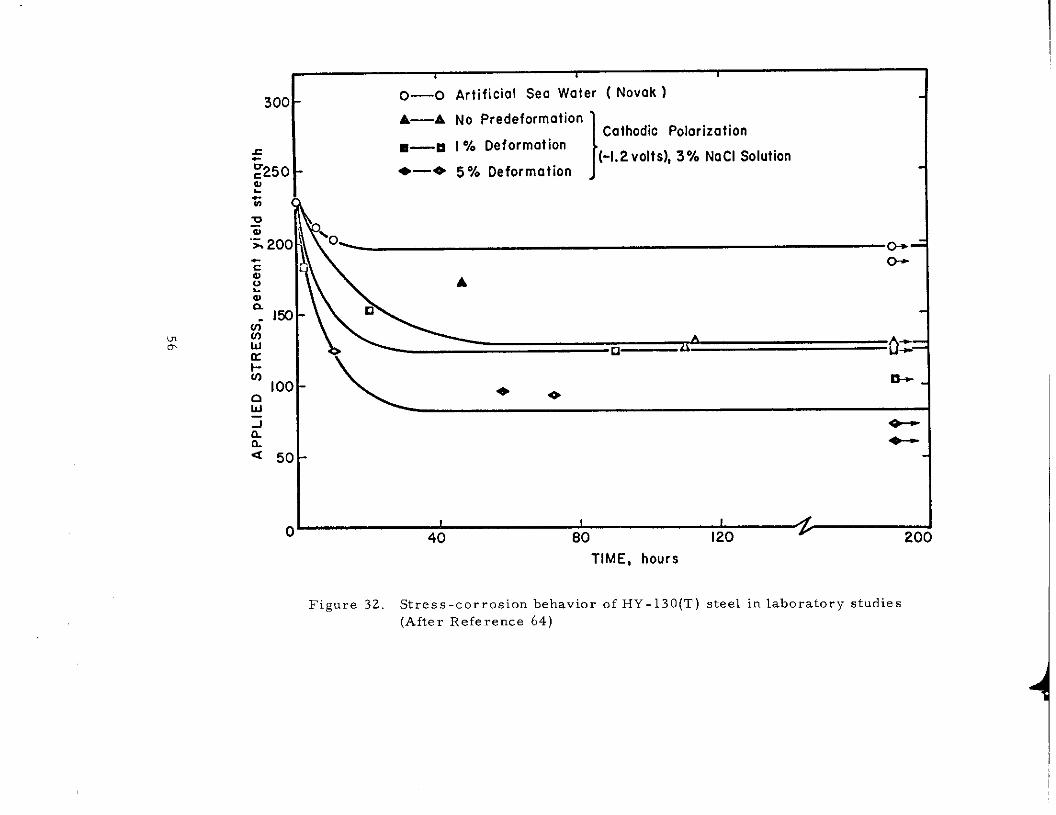
300
zG.250a!.zvz“= 20C
~o.al0.
0--(JYIA.1at-OY
nuian.<
lx
Ioc
5C
c
1
0 —o ArtificialSea Water ( Novak )
A—A No Predeformation
ICaihodic Polarization❑— ❑ I % Deformation
(-1.2 volts),3% NaCl Solution—+ 5% Deformation
~
0+-0+
A
A+.❑— ~
_
&* *
*
4-’=
1 I I AAI-1 m I90 71.“ ““ ,-” .
TIME, hours
Figure 32. Stress-corrosion behavior of HY- 130(T) steel in laboratory studies
(After Reference 64)
excess of the yield strength. However, K1~cc for weld metal deposited by
SMA in the vertical-up position was reduced to 90 ksi G and the nominal ‘
SCC threshold was reduced to the yield strength.
The data cited above indicate that low.alloy steel-base metals
with yield s trengths of app roximately 100 ksi are immune to SCC in marine
environments, but that weld metals and the HAZ adiacent to weldments in
which the yield strength is higher may be susceptible, particularly if cathodic
protection is app lied. A survey(bs) conducted in 1969 of shipyards and
related industries, domestic and foreign, with experience in the use of
A514/A5 17 in merchant ship hulls, indicated that typical yield strength ofbase metals and submerged arc weldments (as measured by microhardness)
ranged from 105 to 115 ksi; however, HAZ yield strengths ranged from below100 ksi to as high as 175 ksi.
The results of this survey coupled with the limited amount of
precracked data on SCC resistance of HSLA Q & T steels sugg est that theweld metal and HAZ of these materials may be susceptible to SCC in marine
environments. Other factors which increase the probability of SCC in the
HAZ of HSLA Q & T steels are: (1) higher residual stresses in HSLA Q & T
weldments than in carbon steel weldments because of the higher yield strengthsof the HSLA Q & T materials; (2) a lack of sufficient quality control* of
HSLA Q & T base plate used in shipbuilding makes it likely that many of thefactors which contribute to weldment cracking (e. g. , segregates of nonmetallic
inclusions and alloying elements and laminations ) may be present and unde-
tected; and (3) HSLA Q & T steels, because of a high yield to ultimate strengthratio, resist blunting of notches and small cracks under occasional high ser-
vice loads (referred to as l!~hakedO~~,, ) So that sharp flaws in regi Ons Of
yield stress loading may exist during the ship! s service life.
B. Corrosion Fatigue
1. General Characteristics of Corrosion Fatigue
Corrosion fatigue is the combined action of a corrosion environ-
ment and a cyclic stress leading to premature failure of metals by cracking. (69)
In general, as in the case of stress corrosion cracking (SCC), neither cyclic
stress in an innocuous environment, e. g. , dry air, nor environmental attack,
alone, will produce results as damaging as their combined action. Unlike
SCC, which occurs only in certain specific alloy-environment combinations,
most alloys which are subject to corrosion in an environment also are subjectto corrosion fatigue in that environment. Corrosion fatigue is an even more
complex phenomenon than is SCC in that it is influenced by all of the chemical
‘:Of the shipyards using A514/517 materials in 1969 only one used radio-
graphy and ultrasonic testing for buried flaw detection; the others relied on
radiography alone. (68 )
57
.-. ---
and mechanical variables which affect SCC, plus the additional variables of
tbe fatigue process, e. g. , frequency, ratio of minimum to maximum stress,
stress range, and cyclic load wave form.
Corrosion fatigue behavior can be measured in terms of thenumber of cycles of stress or strain required to produce failure, Nf, or
the rate of crack growth, da/dN, for a given set of conditions. Figure 33
shows stress versus cycles to failure for a carbon steel in air and in a
corrosive environment. The fatigue limit ceases to exist in the corrosiveenvironment and fatigue strength and fatigue life are significantly degraded.
Corrosion fatigue cracks are usually transgranular. Failure at smooth
surfaces occurs in three stages in the same manner as in SCC : (1 ) pitting,
which initiates a crack, (2) subcritical crack propagation, and (3) brittle
fast fracture or ductile rupture. In contrast to ordinary fatigue where there
is rarely more than one crack, a number of corrosion fatigue cracks usuallyare initiated at the bases of pits.
The following sections review the state-of-the-art of corrosionfatigue in steels. In the majority of the cases cited, the steels studied haveyield strengths in the range of 150 to 250 ksi. These examples have been
used because they illustrate the concepts involved and because yield strengths
as high as 175 ksi have been shown to be present in the HAZ of A514/A517
Steels(f’s).
2. Analysis of Fatigue Crack Growth
The general fatigue crack growth behavior of a hypothetical
steel in terms of stress intensity, K, in an inert environment is shown in
Figure 34a. The principal features of this illustration are : (1) there exists
a threshold stress intensity leve L Kthi, bel Ow which fatigue cracks are nOt
observed to grow in inert environments, (2) fatigue crack growth is termi-
nated when the maximum stress-intensity factor exceeds the material’sfracture toughness, KIC , and (3) fatigue crack growth rates between ( 1)
and (2 ) can be described as a power law function of K or AK (Kmax - K ~in)
of the form
da
dNAAKn (30)
where A and n are material constants. Fatigue crack growth rate is
cycle dependent, provided the material is not strain rate sensitive andthere are no environmental effects. When these conditions are satisfied,
changes in the frequency, f, of the applied load have no
the rate of crack propagation is frequency independent.
58
effect on da/dN, i. e. ,
The rate of crack
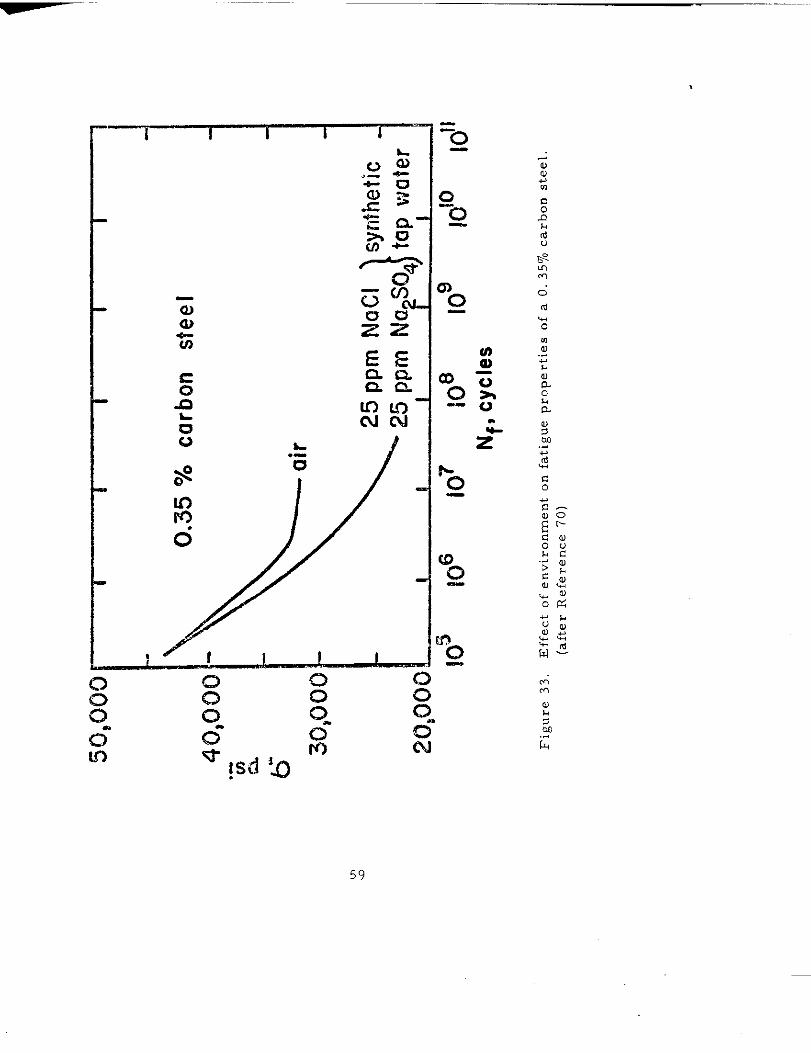
o
.
z“
59
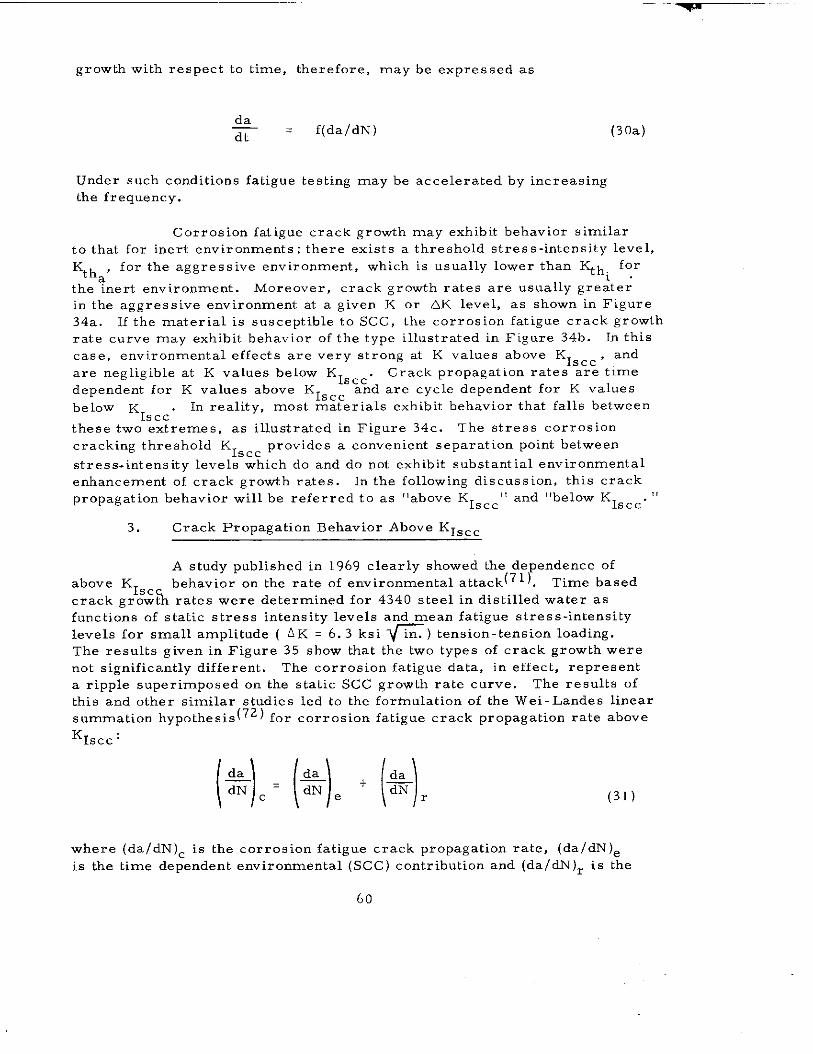
--’~–-
growth with respect to time, therefore, may be expressed as
da
dt =f(da/dN) (30a)
Under such conditions fatigue testing may be accelerated by increasing
the frequency.
Corrosion fatigue crack growth may exhibit bebavior similar
to that for inert environments : there exists a threshold stress-intensity level,
~b , for the aggressive environment, which is usually 10wer than Kth. fOrK
the ‘%ert environment. Moreover, crack growth rates are usually gre~terin the aggressive environment at a given K or dK level, as shown in Figure
34a. If the material is susceptible to SCC, the corrosion fatigue crack growthrate curve may exhihit behavior of the type illustrated in Figure 34b. In this
case, environmental effects are very strong at K values above K1~cc , and
are negligible at K values below K1~cc. Crack propagation rates are timedependent for K values above K1~cc and are cycle dependent for K values
below K In reality, most materials exhibit behavior that falls betweenIscc”
these two extremes, as illustrated in Figure 34c. The stress corrosion
cracking threshold K ~~cc provides a convenient separation point between
stress-intensity levels which do and do not exhibit substantial environmental
enhancement of crack growth rates. In the following discussion, this crack
propagation behavior will be referred to as “above K1~cc” and “below K1~cc. “
3. Crack Propagation Behavior Above K1~cc
A study published in 1969 clearly showed the dependence of
above K1~cc behavior on the rate of environmental attack(7 1 ). Time based
crack growth rates were determined for 4340 steel in distilled water as
functions of static stress intensity levels and mean fatigue stress-intensity
levels for small amplitude ( AK = 6.3 ksi ~) tension-tension loading.
The results given in Figure 35 show that the two types of crack growth werenot significantly different. The corrosion fatigue data, in effect, represent
a ripple superimposed on the static SCC growth rate curve. The results of
this and other similar studies led to the fort-nulation of the Wei - Landes linear~umation hypothesis for corrosion fatigue crack propagation rate abOve
‘Iscc:
(-)da
dN =c )()SE+%
dN e r (31)
where (da/dN)= is the corrosion fatigue crack propagation rate, (da/dN)e
is the time dependent environmental (SCC ) contribution and (da/ dN)r is the
60
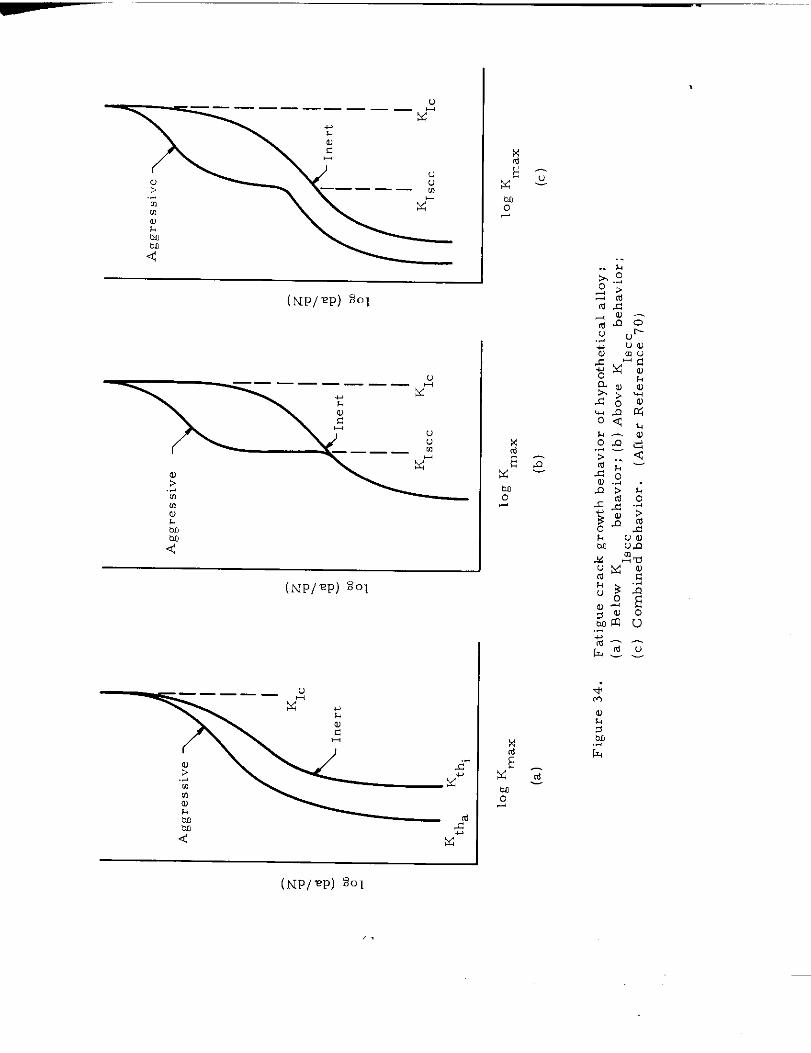
(NP/~P) ~01
—— —___ __:
uu
———— m
QJ>.-.mal.b“
I
(NP/E’P) ~01
/.
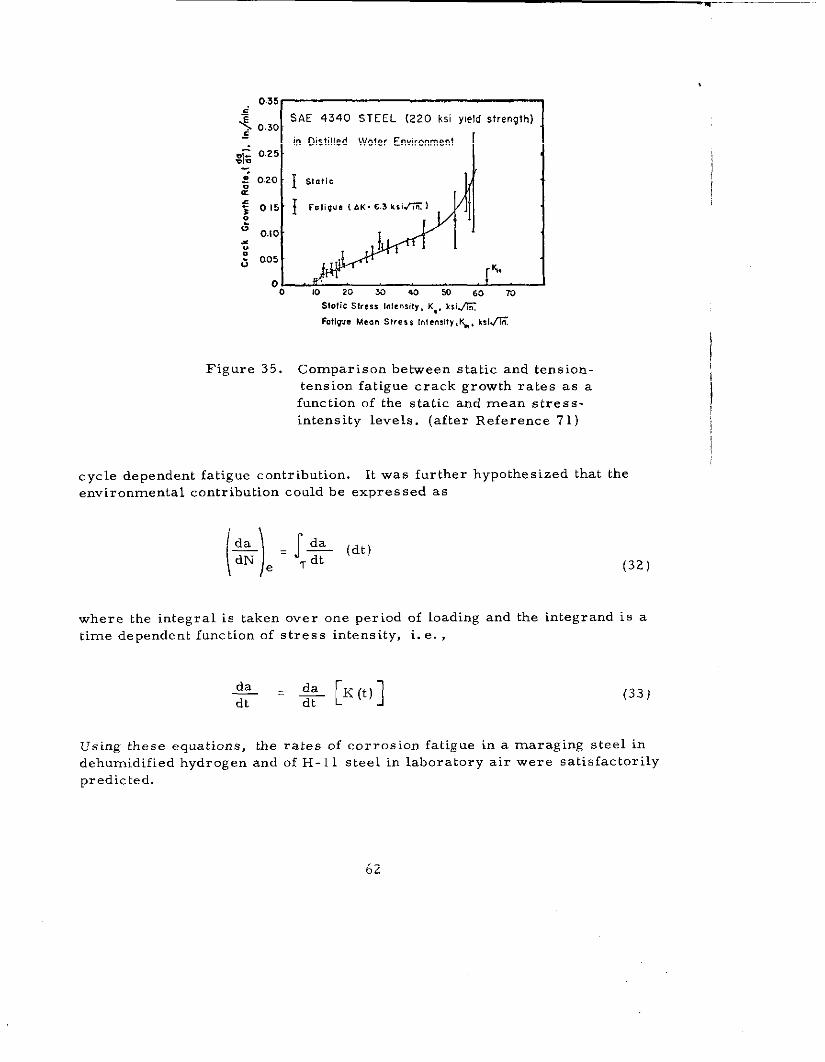
=.$ 0.30
I
SAE 4340 STEEL (220 ksi y(eldstrength)
m Distilled Wolec Environmentg~ 0.25 I
S1.a!ic$ k,,, in!, n,i,y, K,, k,i~
Fatigue Me.. Sfress lnlensily, ~, ksiw
!Figure 35. Comparison between static and tension-
tens~on fatigue crack growth rates as a
function of the static and mean stress-
intensity levels. (after Reference 71)
cycle dependent fatigue contribution. It was further hypothesized that the
environmental contribution could be expressed as
(32)
where the integral is taken over one period of loading and the integrand is a
time dependent function of stress intensity, i. e. ,
S&=$dt
[K(t)] (33)
Using these equations, the rates of corrosion fatigue in a maraging steel in
dehumidified hydrogen and of H-1 1 steel in laboratory air were satisfactorily
predicted.
62
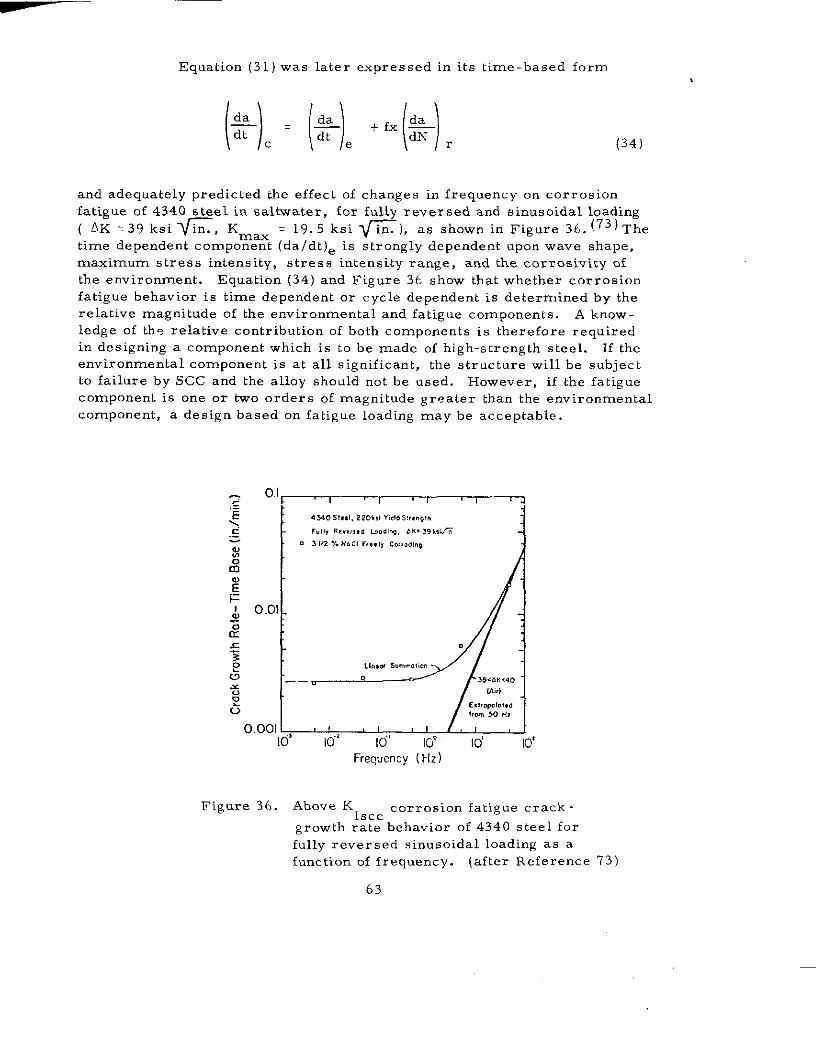
Equation (31
l\
was later expressed in its time-based form
[*)c = (*I.“X(%), (34)
and adequately predicted the effect of changes in frequency on corrosion
fatigue of 4340 steel in saLtwater, for fully reversed and sinusoidal loading( AK .39ksifi, Kmax = 19.5 ksifi), as shown in Figure 36. (73) The
time dependent component (da/dt)e is strongly dependent upon wave shape,
maximum stress intensity, stress intensity range, and the corrosivity of
the environment. Equation (34) and Figure 36 show that whether corrosion
fatigue behavior is time dependent or cycle dependent is determined by the
relative magnitude of the environmental and fatigue components. A knm=-
ledge of the relative contribution of both components is therefore required
in designing a component which is to he made of high-strength steel. If the
environmental component is at all significant, the structure will be subject
to failure by SCC and the alloy should not be used. However, if the fatigue
component is one or two orders of magnitude greater than the environmental
component, a design based on fatigue loading may be acceptable.
0.1,2 1 I , [E 4340,,,,,,220,,,wws,,,”~,h\.
,.,,,R,”,,,,,L8.dkq, ,K. ,,,sm& o >1/2 %..,, ,,,,,, ,.,, O,,. O 1
%
s
E.-t-
& 0.01 _
($2s o3S? LI.,C4S“.”- !,.”
u o—.
%
:u ,,0,” ,0 .,
0.00110’ 10” lo” 10° 10’ lo’
Frequency(Hz)
Figure 36. Above K ~~cc corrosion fatigue crack-
growth rate behavior of 4340 steel for
fully reversed sinusoidal loading as a
function of frequency. (after Reference 73)
63
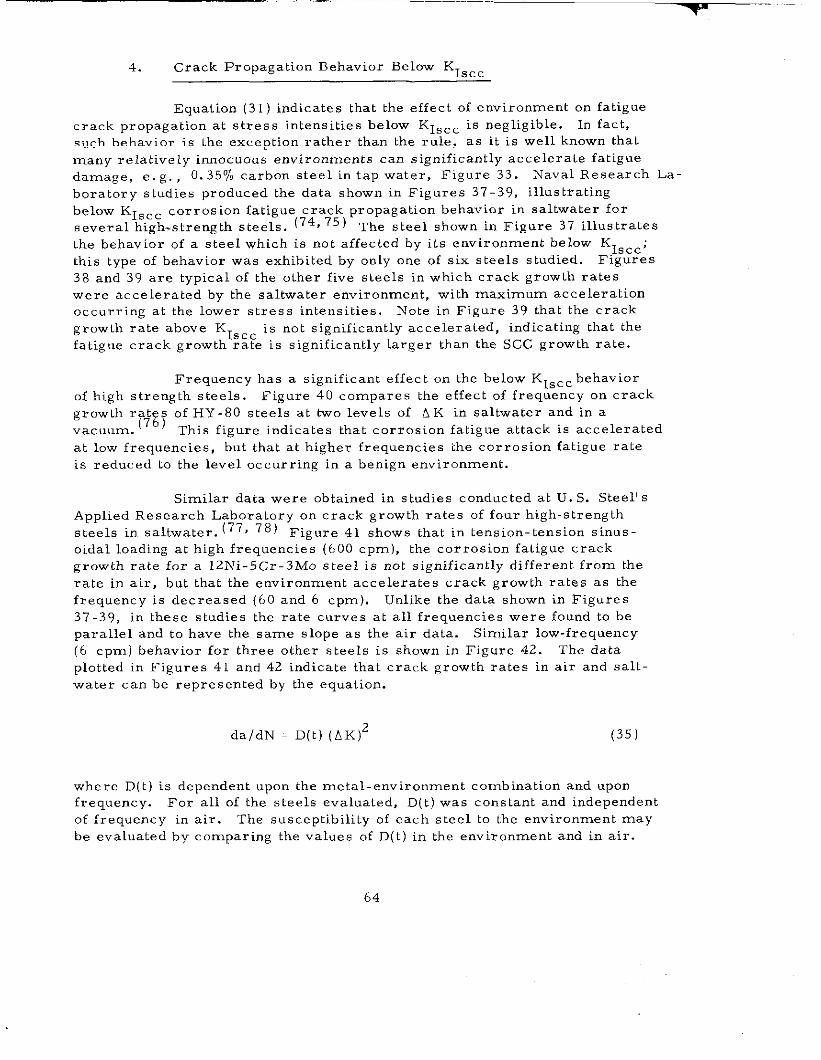
. . ..—...——————. — ..—~-- ‘“”-
4. Crack Propagation BehaviOr BelOw KTscc
Equation ( 31 ) indicates that the effect of environment on fatigue
crack propagation at stress intensities below KI~cc is negligible. In fact,
such behavior is tbe exception rather than the rule, as it is well known that
many relatively innocuous environments can significantly accelerate fatiguedamage, e.g. , 0.35% carbon steel in tap water, Figure 33. Naval Research La-
boratory studies produced the data shown in Figures 37-39, illustrating
below K1~cc corrosion fatigue crack propagation behaviOr in saltwater fOrseveral high-strength steels. (74, 75) The steel shown in Figure 37 illustrates
the behavior of a steel which is not affected by its environment below K1~cc;
this type of behavior was exhibited by only one of six steels studied. Figures
38 and 39 are typical of the other five steels in which crack growth rates
were accelerated by the saltwater environment, with maximum acceleration
occurring at the lower stress intensities. Note in Figure 39 that the crack
growth rate above K1~cc is not significantly accelerated, indicating that thefatigue crack growth rate is significantly larger than the SCC growth rate.
Frequency has a significant effect on the belOw K1~ccbehaviOr
of high strength steels. Figure 40 compares the effect of frequency on crackgrowth rat s of HY-80 steels at two levels of AK in saltwater and in a
(7%) ~hi, figure indicates that corrosion fatigue attack is acceleratedvacuum.
at low frequencies, but that at higher frequencies the corrosion fatigue rate
is reduced to the level occurring in a benign environment.
Similar data were obtained in studies conducted at U.S. Steel’sApplied Research Laboratory on crack growth rates of four high-strength
steels in saltwater. (77, 78) Figure 41 shows that in tension- tensiOn sinus-
oidal loading at high frequencies (600 cpm), the corrosion fatigue crack
growth rate for a 12 Ni-5Cr-3Mo steel is not significantly different from the
rate in air, but that the environment accelerates crack growth rates as the
frequency is decreased (60 and6 cpm). Unlike the data shown in Figures37-39, in these studies the rate curves at all frequencies were found to be
parallel and to have the same slope as the air data. Similar low-frequency(6 cpm) behavior for three other steels is shown in Figure 42. The data
plotted in Figures 41 and42 indicate that crack growth rates in air and salt-
water can be represented by the equation.
da/dN= D(t) (AK)2 (35)
where D(t) is dependent upon the metal-environment combination and uponfrequency. For all of the steels evaluated, D(t) was constant and independent
of frequency in air. The susceptibility of each steel to the environment may
be evaluated by comparing the values of D(t) in the environment and in air.
64
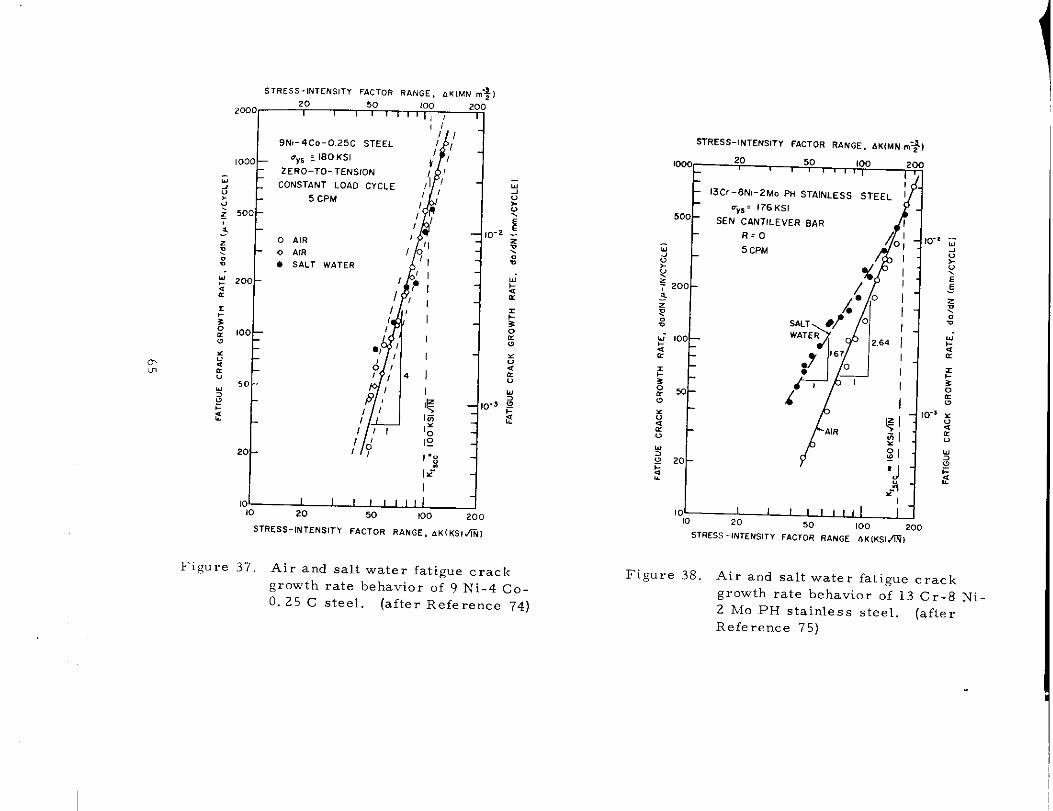
STRESS-INTENSITY FACTOR RANGE,AK(MNm-+)
XKJo 2,0 50 ,00 zoo, I , 1, , II
,!
W-4C0-O.25C STEEL
my%? 180KSI
ZERO–TO-TENSION
5 CPM
0 AIR
0 AIRb SALT WATER
1’
/
,#
1
10 1 I 1 1 1 1 1 1110 20
I50 ,00 zoo
S7fiESS- INTENSITY FACTOR RANGE, .3KIKSI TN)
Figure 37. Air and salt water fatigue crack
growth rate behavior of 9 Ni.4 Co.
0.25 C steel. (after Reference 74)
SRESS- INTENSITY FACTOR RANGE, bKWNm-+l
1000 2,0 50 10,3 zoor I
,’OObt.?“fil,13cc-8N,-2M. PH STAINLESS STEEL 1
10 I 1 I 1 I 1 I 1 I10 20
I 150 ,0,3 Zoo
5TRE5 S-INTENSITY FACTOR RANGE OKMSr~)
Figure 38. Air and salt water fatigue crack
growth rate behavior of 13 Cr-8 Ni-
2 MoPH stainless steel. (afterReference 75)
STRESS-INTENSITY FACTOR RANGE, AK[MN m-+)
20 50 (00 2001000
‘1 :
12 Ni MARAGING STEEL
~ 500
zCy, :180 KSl11240MNlmz) i d
: ZERO-TO-TENSION I ● ,0-, $
<z
CONSTANT LOAD CYCLE ~ ~ g
j 5 CPM● salt z
?: ~m Wc.ter
::
Y
- ‘Ii, “
● I ~
2z
x 1009 1 ~~,
1.63, ?
ig
55
:5 0:
5,..! :
% 0 ;.40 $?
~$ 1? .
%0 l=1:1 .“1:,s
1010 20 50 100 200
STRESS-INTENSITY FACTOR RANGE, AK(KSl~l
Figure 39. Air and salt water fatigue crackgrowth rate behavior of 12 Ni(180) maraging steel. (after
Reference 74)
t
HY-80 STEEL
,. 3+% N.cl s.).!,..200 I
‘L___!hoot 001 0.1 ,0 100
F,.,” ,”,,(Hz]
Figure 40. Below KI~cc corrosion fatigue
crack growth rate behavior asa function of frequency. (after
Reference 76)
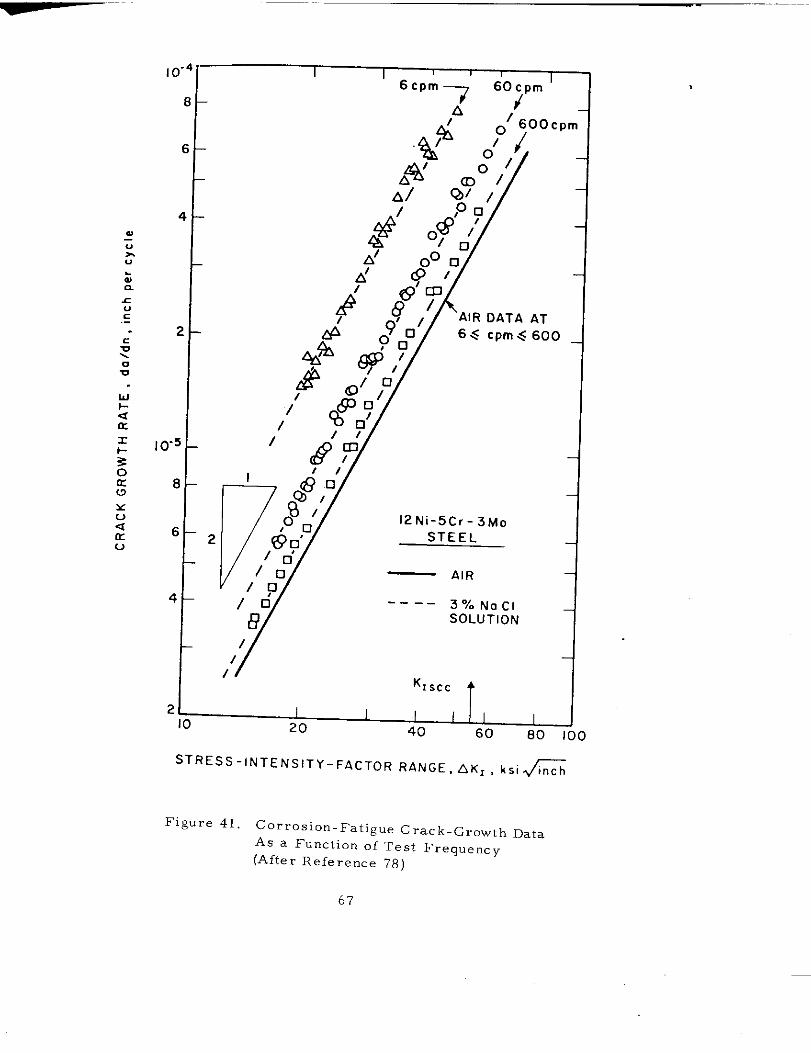
,.-4
2
‘1 I I6cpm _ 60c Bm
I
cpm
A .’f ❑“/ G..
//
/
%?Y/ II
nn-1
$Y,7-
1# ,0P/~112 Ni-5Cr-3Mo
2 ,&D?’o STEEL
In — AIR/0
/
/d ‘-–– 3°/. NoCl
8 SOLUTION
/
//
/Krscc ~
1 I I I20
I I40 60 80
STRESS-INTENSITY-FACTOR RAN GE, aKr , ksifi
Figure 41. Corrosion-Fatigue Crack-Growth Data
As a Function of Test Frequency
(After Reference 7fIJ
67
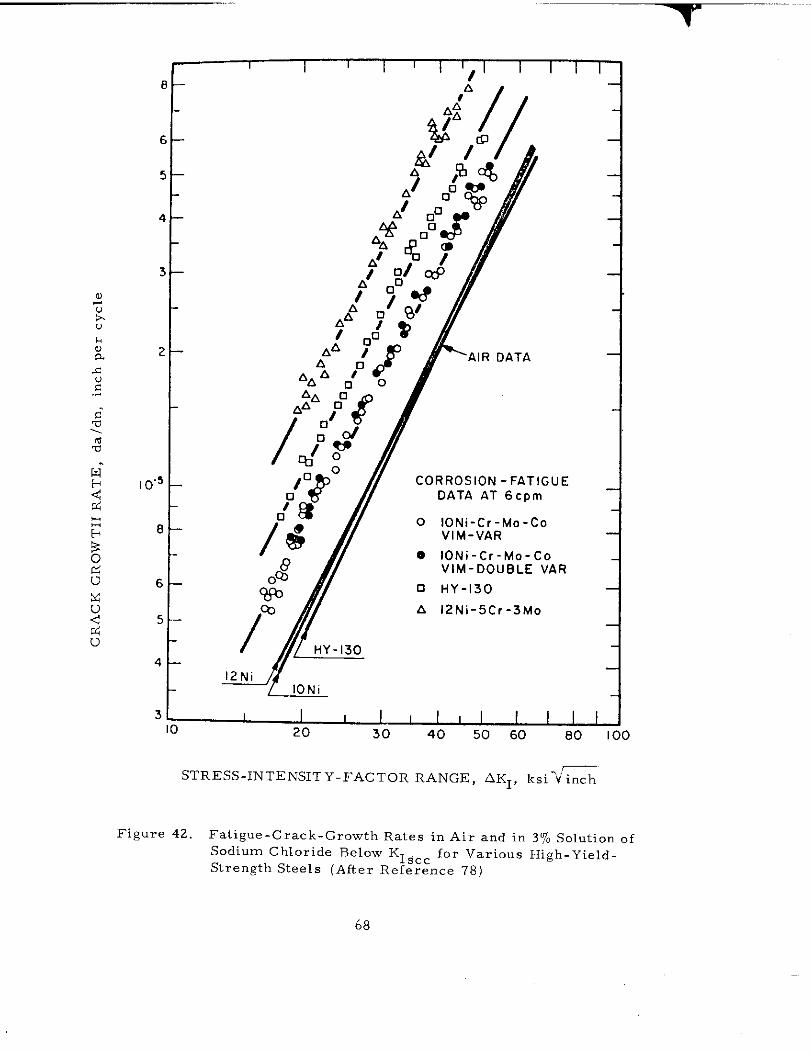
.
“-”””~-
, ~.5 _
8 —
6 —
5 —
4 —
1 I I I I I I/’
I I I 1
CORROSION -FATIGUEOATA AT 6cpm
T’ ~ 10Ni-Cr-Mo-CoVIM-VAR
10Ni-Cr-Mo-CoVIM-DOUBLE VAR
HY-130
12Ni-5Cr-3Mo
31 I I I I I I I I ! I I I10 20 30 40 50 60 80 )
STRESS-INTENSITY-FACTOR RANGE, AK1, ksi=
Figure 42. Fatigue-Crack-Growth Rates in Air and in 3% Solution of
Sodium Chloride Below K1gcc for various H~gh-Yield-
Strength Steels (After Reference 78)
68
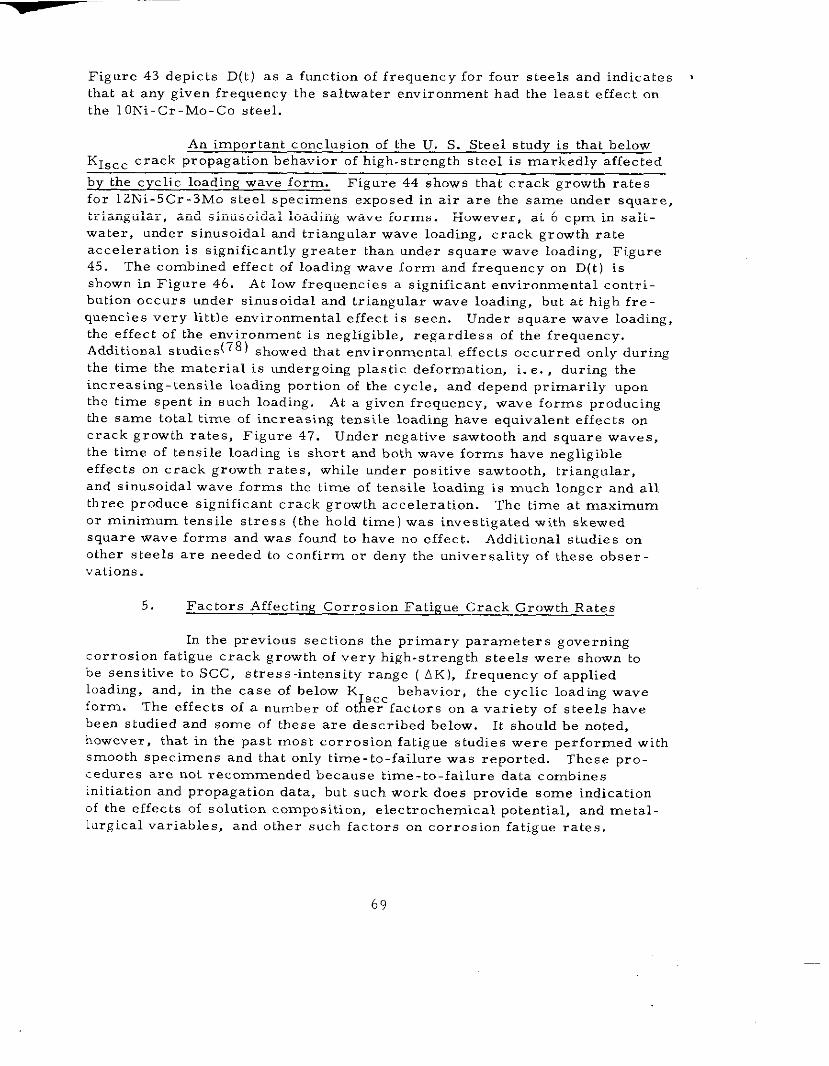
Figure 43 depicts D(t) as a function of frequency for four steels and indicates I
that at any given frequency the saltwater environment had the least effect on
the 10 Ni-Cr-Mo-Co steel.
An important conclusion of the U. S. Steel study is that belowK1~cc crack propagation behavior of high-strength steel is markedly affected
by the cyclic loading wave form. Figure 44 shows that crack growth ratesfor 12 Ni-5Cr-3Mo steel specimens exposed in air are the same under square,
triangular, and sinusoidal loading wave forms. However, at 6 cpm in salt-
water, under sinusoidal and triangular wave loading, crack growth rate
acceleration is significantly greater than under square wave loading, Figure
45. The combined effect of loading wave form and frequency on D(t) isshown in Figure 46. At low frequencies a significant environmental contri-bution occurs under sinusoidal and triangular wave loading, but at high fre-
quencies very l~ttle environmental effect is seen. Under square wave loading,the effect of the environment is negligible, regardless of the frequency.Additional ~tudie~(78) showed that environmental effects occurred OnlY during
the time the material is undergoing plastic deformation, i. e. , during the
increasing -tensile loading portion of the cycle, and depend primarily uponthe time spent in such loading. At a given frequency, wave forms producingthe same total time of increasing tensile loading have equivalent effects on
crack growth rates, Figure 47. Under negative sawtooth and square waves,the time of tensile loading is short and both wave forms have negligible
effects on crack growth rates, while under positive sawtooth, triangular,and sinusoidal wave forms the time of tensile loading is much longer and all
three produce significant crack growth acceleration. The time at maximumor minimum tensile stress (the hold time) was investigated with skewed
square wave forms and was found to have no effect. Additional studies onother steels are needed to confirm or deny the universality of these obser-
vations.
5. Factors Affecting Corrosion Fatigue Crack Growth Rates
In the previous sections the primary parameters governingcorrosion fatigue crack growth of very high-strength steels were shown to
be sensitive to SCC, stress-intensity range ( AK), frequency of applied
loading, and, in the case of below K behavior,
L
the cyclic loading waveform. The effects of a number of ot ~rcfactors on a variety of steels havebeen studied and some of these are described below. It should be noted,
however, that in the past most corrosion fatigue studies were performed withsmooth specimens and that only time-to-failure was reported. These pro-cedures are not recommended because time-to-failure data combinesinitiation and propagation data, but such work does provide some indication
of the effects of solution composition, electrochemical potential, and metal-lurgical variables, and other such factors on corrosion fatigue rates.
69
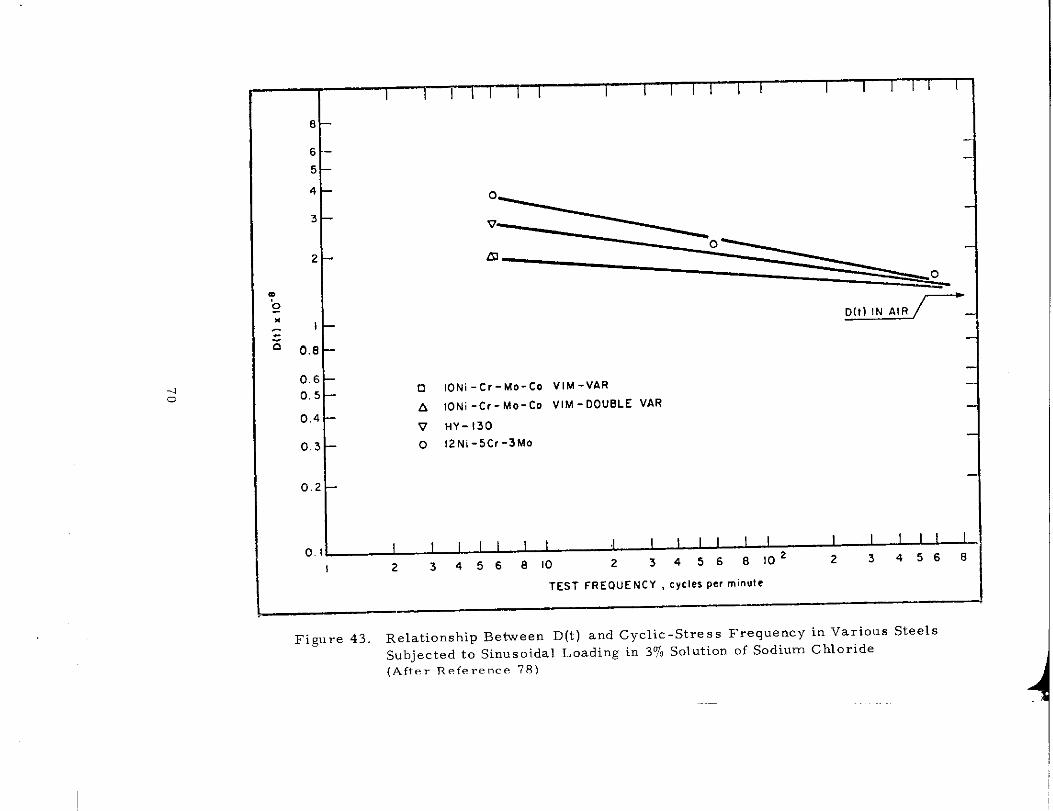
-J0
I I I I I I I I 1 I I I I I I I 1 I I I
8 —
6 - —5 –
.
o loN[-cr-MO-CO VIM-VAR
A 10Ni-CC-MO-CO VIM- OOUBLE VARV HY- 130o 12Ni-5Cf-3M0
4 ~
3 -:-
2 - a
‘~ -
~-1 —
08 -
06 –05 —
04 –
0 3–
0 2-
1 I I I I I I I I I0 1. I 1 I I I I I I I I
2 3 456 8 10 2 3456 8 102 23 4568
TEST FREQuENCY ,cyclesperminute!
Figure 43, Relationship Between D(t) and Cyclic-Stress Frequency in Various SteelsSubjected to Sinusoidal Loading in 3% Solution of Sodium Chloride
(After Referemc. e 78)A
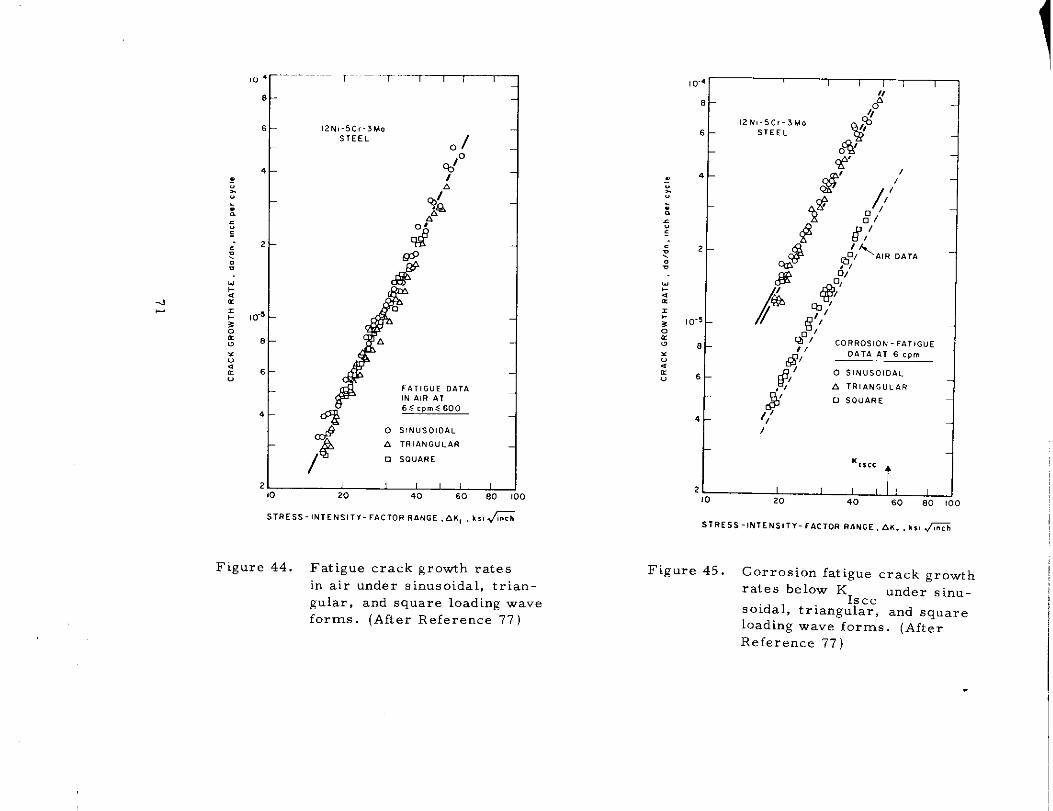
4
I
T---~–~
&@
&#@
f
0
A
FFATIGUEDATAIN &,R 41
6Cc Pm SS00
O SINUSOIDAL
,+?
A TRl&NGu L4R
O SQUARE
5TRESS-, NT EN SIT Y- FACTORR ANGE, AK ,., S’G
Figure 44. Fatigue crack growth rates
in air under sinusoidal, trian-
gular, and square loading wave
forms. (After Reference 77)
\ I I I ) 1 1
a-/ CORROSION-F4TIGUE
A ‘ OATA 41 6 CP,n
,#’ 0 SINUSOIDAL
A TRIANGUL&R
/#’❑ SOUARE
I
,Ib20 40 60 80
ST RE5S-!NTEN SIT Y-FACTOR RANCE,AK. ,k$,,,TFF
Figure 45. Corrosion fatigue crack growth
rates below KIscc
under sinu-
soidal, triangular, and square
10ading wave forms. (AfterReference 77)
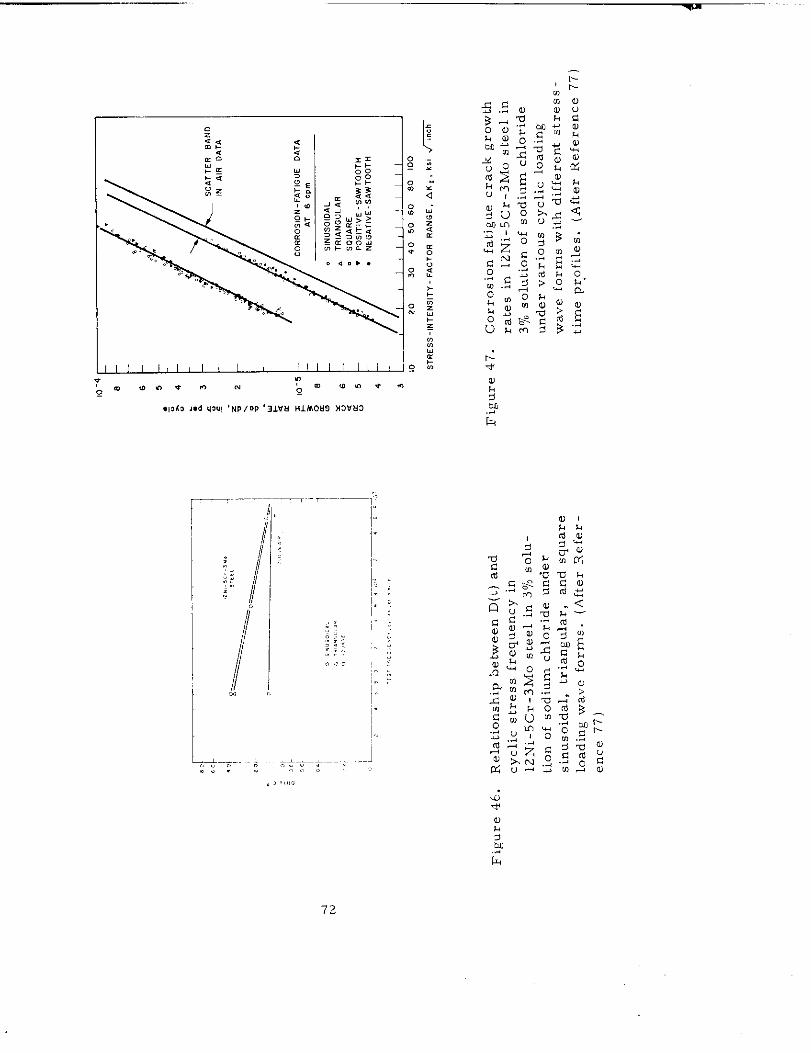
F‘t-.
. . . . .
—1’:
0, ,
72
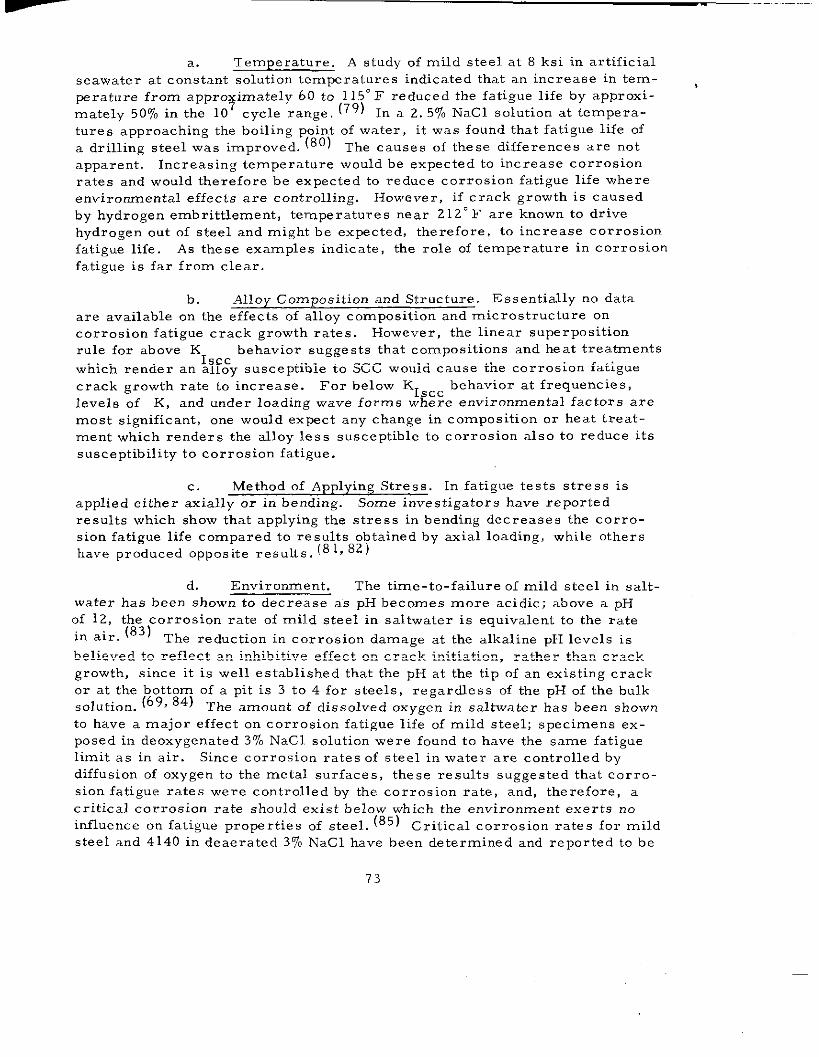
a. Temperature. A study of mild steel at 8 ksi in artificial
seawater at constant solution temperatures indicated that an increase in tem-
perature from appro imately 60 to 115” F reduced the fatigue life by approxi-? (79) In ~ Z. 5~0 NaCl $OIUtiOn at tempera-mately 50% in the 10 cycle range.
tures approaching the boiling point of water, it was found that fatigue life of
a drilling steel was improved. (80) The CaUSe S of these differences are not
apparent. Increasing temperature would be expected to increase corrosion
rates and would therefore be expected to reduce corrosion fatigue life where
environmental effects are controlling. However, if crack growth is causedby hydrogen embrittlement, temperatures near 212” F are known to drive
hydrogen out of steel and might be expected, therefore, to increase corrosion
fatigue life. As these examples indicate, the role of temperature in corrosion
fatigue is far from clear.
b. Alloy Composition and Structure. Essentially no data
are available on the effects of alloy composition and microstructure on
corrosion fatigue crack growth rates. However, the linear superposition
rule for above K behavior suggests that compositions and heat treatments
17fcwhich render an a oy susceptible to SCC would cause the corrosion fatigue
crack growth rate to increase. For below K1 cc behavior at frequencies,
ilevels of K, and under loading wave forms w ere environmental factors are
most significant, one would expect any change in composition or heat treat-
ment which renders the alloy less susceptible to corrosion also to reduce its
susceptibility to corrosion fatigue.
c. Method of Apply in g Stress. In fatigue tests stress is
applied either axially or in bending. Some investigators have reportedresults which show that applying the stress in bending decreases the corro-
sion fatigue life compared to results obtained by axial loading, while othershave produced opposite results. (81, 82)
d. Environment. The time-to-failure of mild steel in salt-water has been shown to decrease as pH becomes more acidic; above a pH
of 12, the corrosion rate of mild steel in saltwater is equivalent to the rate
in air. (83) The reduction in corrosion damage at the alkaline PH levels ‘s
believed to reflect an inhibitive effect on crack initiation, rather than crack
growth, since it is well established that the pH at the tip of an existing crack
or at the bottom of a pit is 3 to 4 for steels, regardess of the pH of the bulk~olution. (69, 84) The amo””t of dissolved oxygen in saltwater has been shown
to have a major effect on corrosion fatigue life of mild steel; specimens ex-
posed in deoxygenated 3% NaCl solution were found to have the same fatiguelimit as in air. Since corrosion rates of steel in water are controlled by
diffusion of oxygen to the metal surfaces, these results suggested that corro-
sion fatigue rates were controlled by the corrosion rate, and, therefore, a
critical corrosion rate should exist below which the environment exerts noinfluence on fatigue properties of steel. (85) critical corrosion rates for mild
steel and 4140 in deaerated 3% NaCl have been determined and reported to be
73
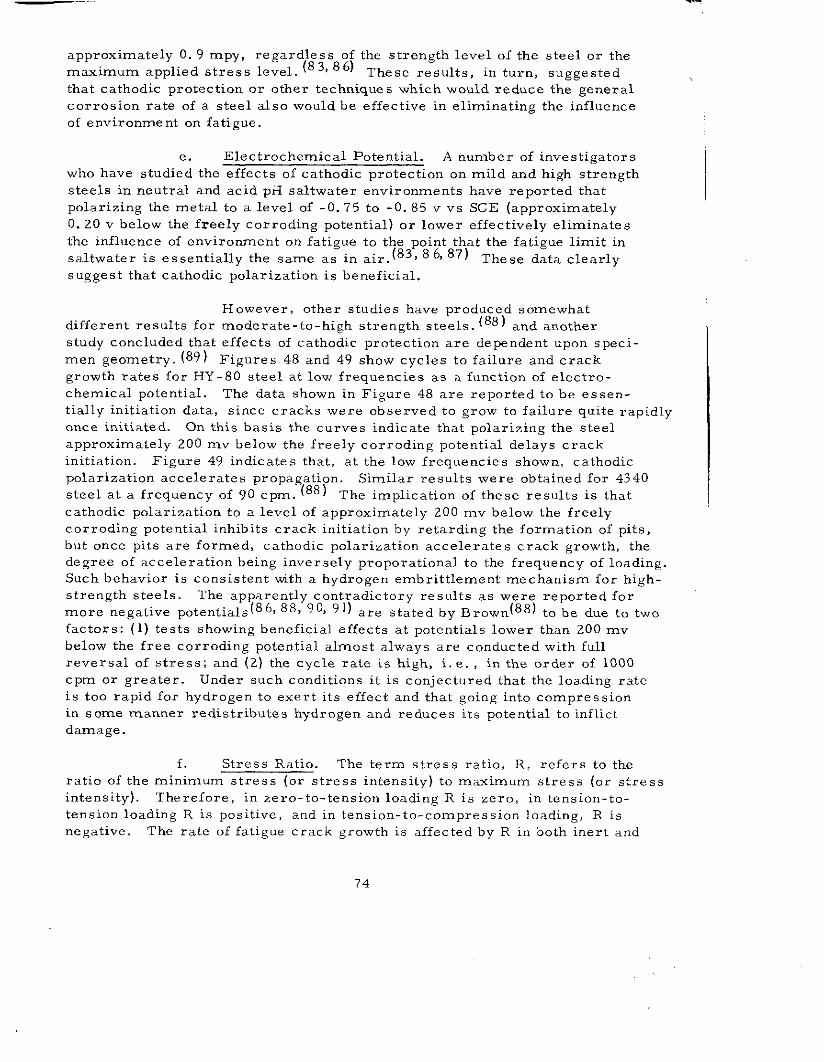
,—-—
approximately o. 9 mpy, regardless of the strength level of the steel or the(83, 86) These results, in turn, suggestedmaximum applied stress level.
that cathodic protection or other techniques which would rednce th~”general
corrosion rate of a steel also would be effective in eliminating the influence
of environme nt on fatigue.
e. Electrochemical Potential. A number of investigators
who have studied the effects of cathodic protection on mild and high strength
steels in neutral and acid pa saltwater environments have reported that
polarizing the metal to a level of -0.75 to -0.85 v vs SCE (approximatelyO. 20 v below the freely corroding potential) or lower effectively eliminates
the influence of environment on fatigue to the point that the fatigue limit in
saltwater is essentially the same as in air. (83, 86, 87) The,e data clearly
suggest that cathodic polarization is beneficial.
However, other studies have produced somewhat
different results for moderate-to-high strength steels. (88 ) and another
study concluded that effects of cathodic protection are dependent upon speci-men geometry. (89) Figures 48 and 49 show cycles to failure and crack
growth rates for HY-80 steel at low frequencies as a function of electro-
chemical potential. The data shown in Figure 48 are reported to be essen-
tially initiation data, since cracks were observed to grow to failure quite rapidly
once initiated. On this basis the curves indicate that polarizing the steel
approximately 2.00 mv below the freely corroding potential delays crackinitiation. Figure 49 indicates that, at the low frequencies shown, cathodic
polarization accelerates propagation. Similar results were obtained for 4340(88) The implication of these results is thatsteel at a frequency of 90 cpm.
cathodic polarization to a level of approximately 200 mv below the freely
corroding potential inhibits crack initiation by retarding the formation of pits,but once pits are formed, cathodic polarization accelerates crack growth, the
degree of acceleration being inversely proportional to the frequency of loading.Such behavior is consistent with a hydrogen embrittlement mechanism for high-
strength steels. The apparently contradictory results as were reported for
more negative potentials (86,88, 90, 91) are stated by Brown (88) to be due to two
factors: (1) tests showing beneficial effects at potentials lower than 200 mv
below the free corroding potential almost always are conducted with full
reversal of stress; and (2) the cycle rate is high, i. e. , in the order of 1000
cpm or greater. Under such conditions it is conjectured that the loading rate
is too rapid for hydrogen to exert its effect and that going into compressionin some manner redistributes hydrogen and i-educes its potential to inflict
damage.
f. Stress Ratio. The term stress ratio, R, refers to theratio of the minimum stress (or stress intensity) to maximum stress (or stress
intensity). Therefore, in zero-to-tension loading R is zero, in tension-to.
tension loading R is positive, and in tension-to-compression loading, R is
negative. The rate of fatigue crack growth is affected by R in both inert and
74
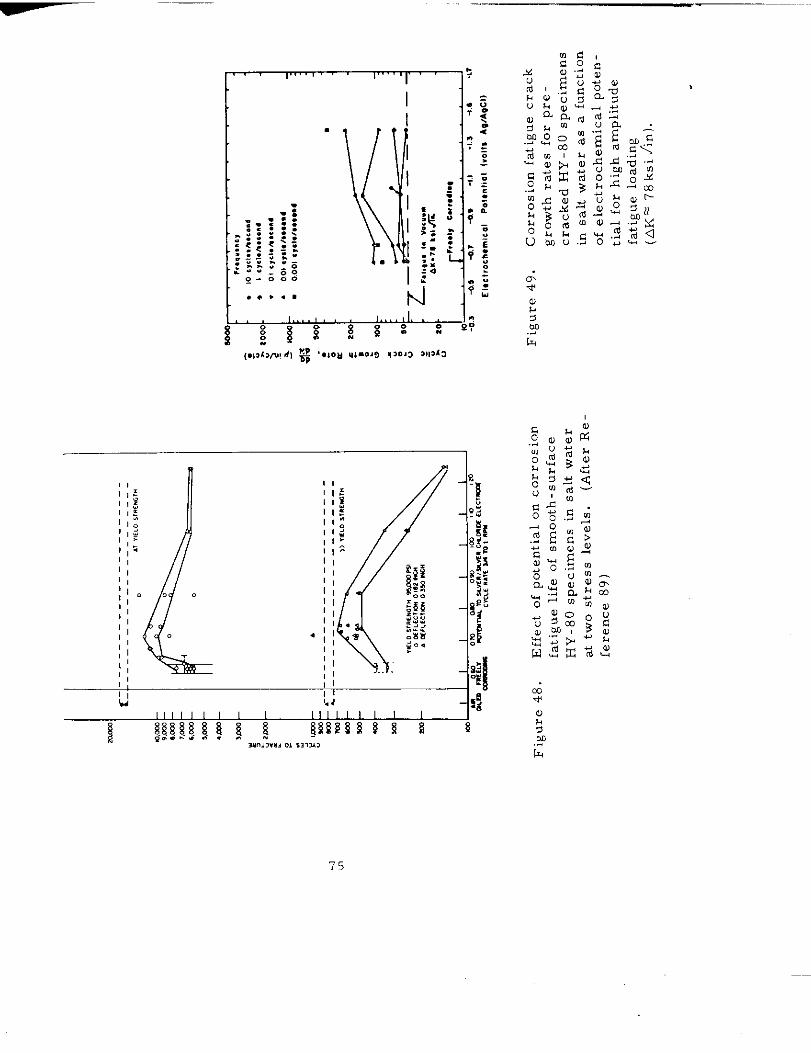
—— ..——.
75
corrosive environments. For a given value of AK, the crack growth rate
is proportional to R and may vary by as much an order of magnitude as R
varies from O to 0.50(92), as illustrated in Fi ure 50. However, for designpurposes crack growth rates for R = zero. (13Y
g. Surface Discontinuities and Stress Concentrations. Figure 51
demonstrates the effects of surface discontinuities and stress concentrations
on the fatigue strength of A5 17F Q&T steel. Scratches perpendicular to theprincipal stress axis are shown to reduce the fatigue strength from an as -
received plate value of 45 ksi to approximately 35 ksi. Leaving the weld
reinforcement intact produces the maximum stress concentration at the toe
of the weld and reduces the fatigue strength to approximately 15 ksi. However,
grinding down the weld i-educes the stress concentrations and increases fatigue
life. Figure 51 indicates that grinding the weld down from l/16-in. height tol/64-in. height nearly doubled the fatigue strength, and removing the weld
reinforcement completely, followed by polishing, essentially restored the
fatigue life to the as-received plate value. These data clearly indicate that( 1) designers must minimize stress concentrations by careful attention to
design of details and (2) desipn should be based on data from material fabri-
cated by the process to be used, rather than on as-received plate data, or
that the as -received plate data must be modified to account for effects of
discontinuties and stress concentrations.
c. GOntrOl of Stress Corrosion Cracking and Corrosion Fatigue
The techniques available for control of stress corrosion
cracking (SCC ) and corrosion fatigue in ship structure can be classified into
two groups :
(a) design measures, and
(b) protective measures.
Design measures include such important steps as minimizing discontinuities
and stress concentrations through careful attention to details of design and
holding stresses below critical values. They also include a thorough know-
ledge on the part of the designer of the structure and the structural material
if crack propagation technology is to be applied successfully. The designermust anticipate where to look for flaws in the structure, what type of flaws
to look for, and a reliable means for flaw detection. Quality control and
inspection procedures must be considered in the light of the properties of
the materials. Weldment joint design and welding procedures must be care-
fully specified to minimize flaws, stress concentration, and residual stresses
that could degrade performance of components below threshold values. The
necessary knowledge for satisfactory use of structural carbon steels in ship
hull construction is well established. The task remains to establish like
factors for higher strength HSLA Q&T steels to provide equal serviceability
and permit economic shipyard construction and marine service.
76
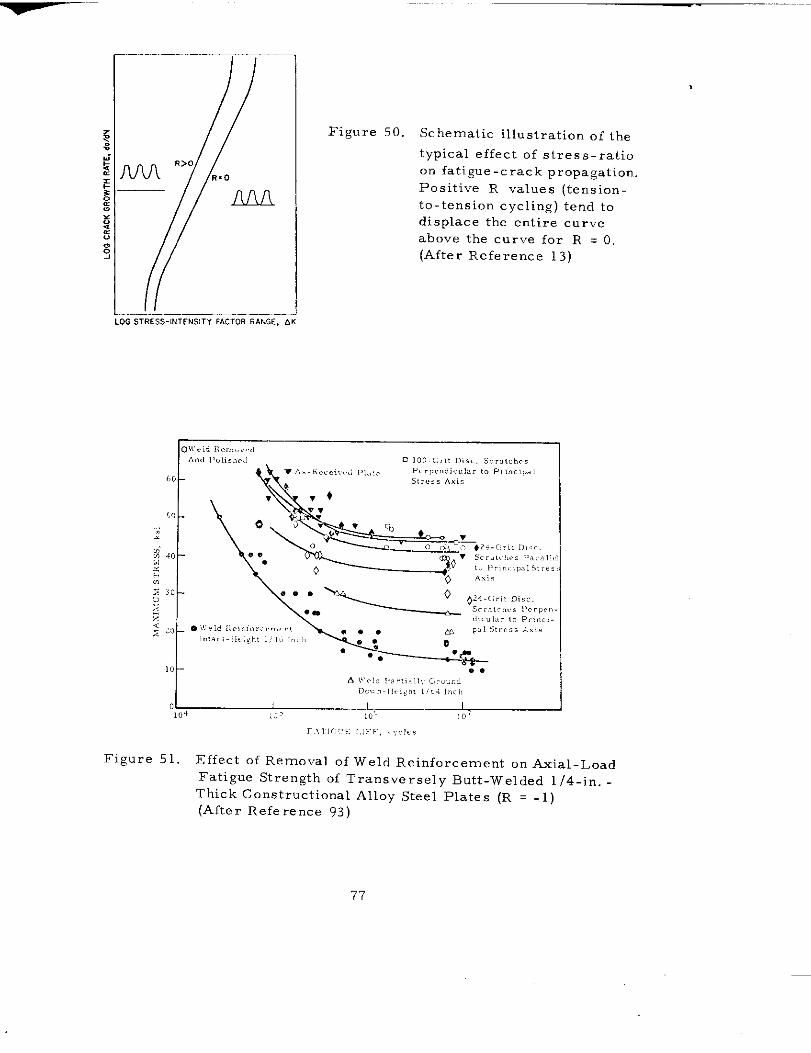
Figure 50. Schematic illustration of the
typ~cal effect of stress .ratiOon fatigue-crack propagation.
Positive R ValLIe S (ten~ion -
to-tension cycling) tend to
displace the entire curve
above the curve for R . 0,
(After Reference 13)
10,.,. “.,,><,.,..
Figure 51. Effect of Removal of Weld Reinforcement on Axial-Load
Fatigue Strength of Transversely Butt-Welded l/4-in. -
Thick Constructional Alloy Steel Plates (R . -1)(After Reference 93)
77
The common protective methods available for minimizing
environmentally induced cracking phenomena is seawater are :
(a) reducing stress concentrations,(b) reducing residual tensile stresses,
(c) use of cathodic protection,
(d) use of coatings,
(e) combinations of these.
Stress concentrations have a major effect on fatigue and
stress corrosion cracking resistance of materials exposed to corrosive en-
vironments. The effects of weld discontinuities and associated stress con-
centrations are shown in Figure 51 and are discussed in Section B. 5. g. Every
effort should be made to minimize stress concentrations by careful attention
to design of weld joints, notches, penetrations, changes in section thickness,
and similar details of design. Further, actual construction should be care-
fully supervised and inspected to assure that design specifications are followed.
Residual stresses may be removed by thermal stress
relieving, but this obviously is impractical for large structures. Residual
surface tensile stresses may be reduced or eliminated by the use of shot
peening to introduce compressive surface stresses which effectively raise
the applied stress level required to initiate cracking. However, to be
effective the compressive stresses must be continuous and extend far
enough below the surface so as not be removed by general corrosion.
Shot peening, too, is clearly impractical for the extensive welds on primary
ship structure.
Cathodic protection is an effective method of minimizinggeneral corrosion and may be helpful in minimizing SGC and corrosion fatigue
to the extent that if a critical corrosion potential for cracking exists, the
potential of the structure can be lowered below that potential. However, as
noted in the previous sub-section, cathodic protection may cause hydrogen-induced SGC in HSLA Q&T steels. It therefore should not be used for thesematerials without careful testing to ensure design integrity.
Coatings are the most widely used means of protecting
steel against corrosion in seawater. The various types of organic coatingsthat have performed well in seawater include vinyls, epoxies, urethanes,
and coal-tar epoxies. These coatings function as barriers preventing thecorrodent from reaching the steel surface. To be most effective they mustbe sufficiently ductile to withstand rupture, particularly under dynaic strain
conditions present in corrosion fatigue. Metallic protective coatings of
sprayed Or vapOr depOs ited aluminum have been found effective in preventingatmospheric SCC of Q & T steels with yield strengths in the 200 ksi range;zinc-rich paints were similarly effective. (94) A wide variety of coating. has
78
—
been evaluated in a seaside exposure with bent-beam SCC tests. The coatings
tested and the results are shown in Tables 4 and 5. Of these, only aluminum
deposited after austenizing was effective for both steels. Robinson and Uzdar -~in(95) conducted bent-beam tests on H-n and 18% Ni maraging steels in a 3qo
NaCl solution using polyurethane, inorganic zinc, and inhibited epoxy coatings.
These coatings also were evaluated in air saturated with water at 140” F. Re -
pre sentative re suits are shown in Table 6. The inhibited epoxy was the most
effective in both environments. The se data indicate that although certain
coatings appear promising as preventive measures against SCC of high strength
steels, the reliability and effectiveness of a given coating must be evaluatedfor each situation. No data are available on the effects of coatings on the
corrosion fatigue resistance of Q & T steels.
79
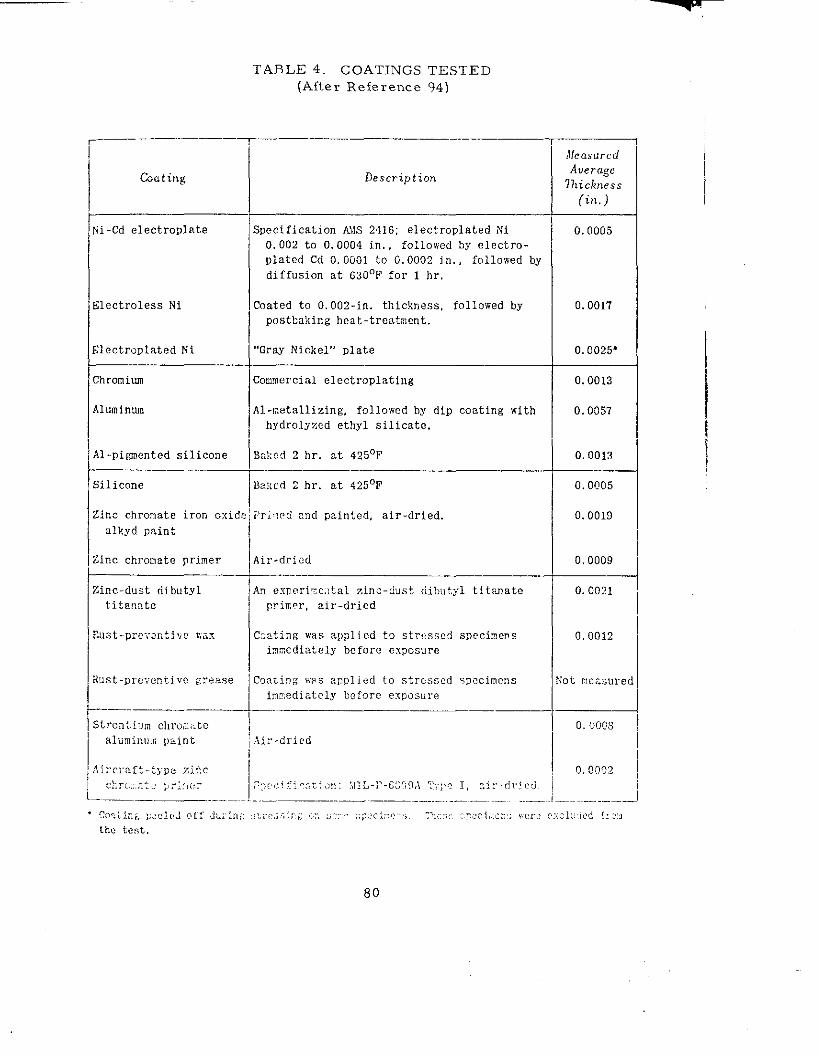
TABLE 4. COATINGS TESTED
(Aftey Reference 94)
__— —
Tr “--Coating Description
tii-Cd electroplate Specification AVS 2416: electroplated Xi0.002 to 0.0004 in, , followed by electro-plated Cd 0.0001 to G.0002 in, , followed bydiffusion at 630°F for 1 hr.
Electroless Ni Ic.ated to 0.002-in. thickness, followed bypostbaking heat -treatment.
Chromim Commercial electroplating
Aluminum ,... ,.Al !retallx Ling, followed by dip coating withbydroljzed ethyl silicate.
I
f-
A1-pismnted silico.e lBskcd2hr.at42~W
‘ilicone T“=hrat4250F —Zinc chromate iron oxide ~i>ri.n[,$ and Dzi”ted, air-dried.
alkyd paint
Is)..t.pmm:il,o ,,.7. Coztine was applied to stress?d s:mcimensimmediately before exposure
,Jleasu,ed
Auerage71tick”ess
(in. )
0.0005
0.0017
0,0025*
0.0013
0,0057
0,0013
0.ol?05
0.0019
0,0009
0.0021
0,0012
Ot measure
0, iJoK3
0.0002
80
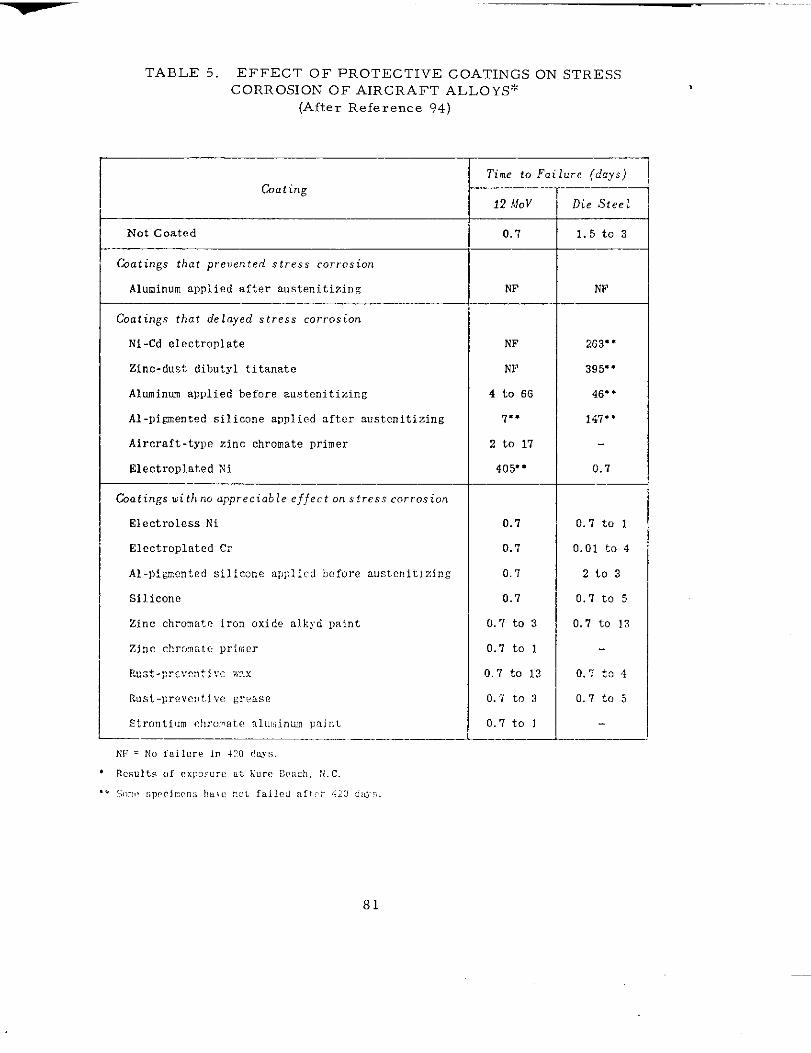
TABLE 5. EFFECT OF PROTECTIVE COATINGS ON STRESS
CORROSION OF AIRCRAFT ALLOYS:*
(After Reference 94)
Time to Fai lure (days)Coating
12 ifov Die Steel—
Not Coated 0,7 1.5t03
Gatings that prevented stress corrosion
Aluminumapplied after austenitizin~ NF NF
Coatings that delayed stress corrosion
Ni-Cd electroplate NF 263”.
Zinc-dust dibutyl titanzte NF 395”’
Aluminumapplied before austcnitizing 4 to 66 46- ●
Al-pigmented silicone aDplied after austcnitizing 7“* 147**
Aircraft -tyDe zinc chromate primer 2 to 17
Electroplated Xi 405”” 0.7
Coatings withno appreciable effect on sircss corrosion
Electroless Ni 0.7
1
0.7 to 1
Electroplated Cr 0.7 0.01 to 4
Al-pigmented silicone applied before austenit?zir!g 0.1 2t03
Silicone 0.7 0.7 to 5
Zinc chromate iron oxide al.ksd Daint o.7t03 0,7 to 13
Zinc c!>rmztc primer 0.7 to 1
RlJ3t-Erc\WltlW W.x 0.7 to 13 0.7 t9 4
F.ust-Dreve:>tive gr~zse 0.7 to 3 0.7t05
Strontium cbro::,ate Ilu.m!in,umLInirjt o.7t0 I——. —
W = N. failure in. 4:!0 C!OJJS,
81
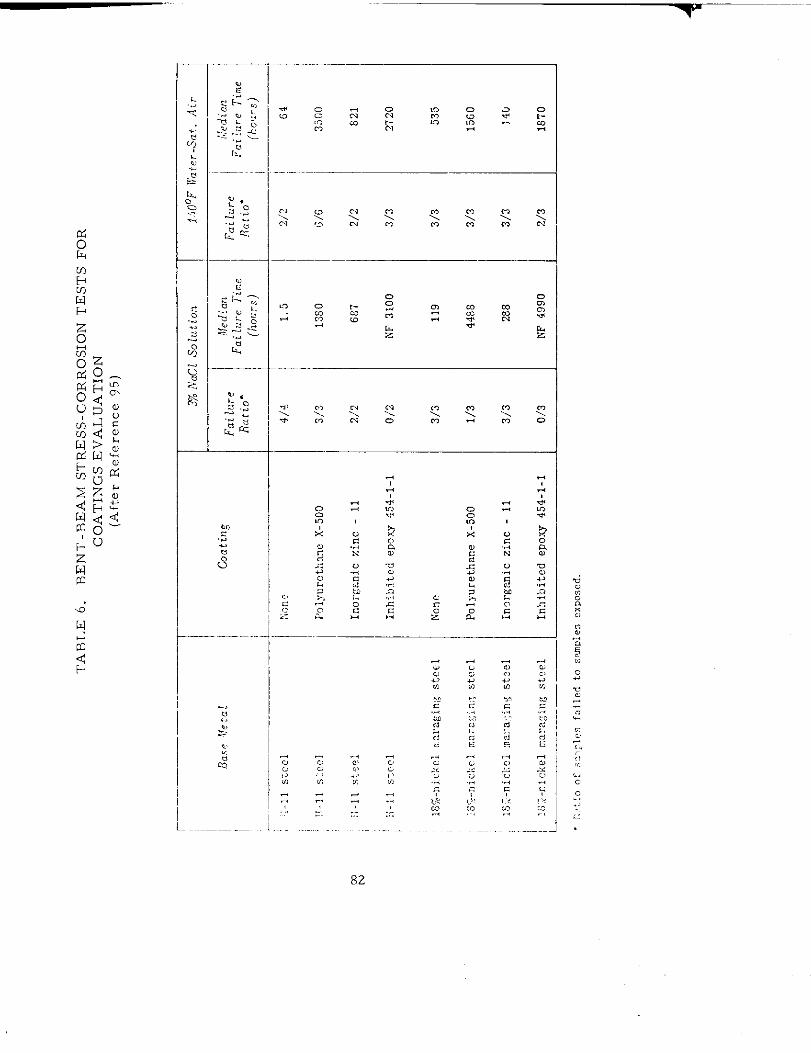
Iv. CRACK INITIATION AND SUBCRITICAL CRACK GROWTH CRITERION
A. General Principles Governing Ship Design with H$jLA Steels
The first requirement in establishing a crack growth criterion is to
determine the general design objectives which the structural designer must
set before himself. Up to the present time, ships have been designed andbuilt without specific reference to fatigue crack growth. Performance suc-
cess has been achieved due to the conservatism with which loads spectra
were es tablished and design allowable defined. In addition, the low-strength,
low-alloy mild steels used have had relatively high toughness, which is often
an index of resistance to crack growth. With the prospect of HSLA steels
being used on a selective basis in primary ship structure, the possibilityof crack growth is now of much more concern. Thus, the designer is im-mediately confronted with the following choices : he may either
(a) design to prevent fatigue cracks from developing,
or
(b) design to ensure overall integrity of the structure even iffatigue cracks propagate substantially in some areas.
The first of these two design philosophies is referred to as a safe-life cri-
terion. From this viewpoint, the structure is designed such that crack
propagation is only remotely possible. At the end of the design life the
structure is either scrapped or reworked extensively, as there is no reliance
on periodic ND I and repair in the design framework. According to the safe-life design principle, if fatigue cracks do develop afid grow, whether due to
changes in service conditions or design error, they may well prove to befatal.
rhe alternative to the safe-life principle is the fail-safe principle.
According to this philosophy, the design is based on the premise that cracks
will develop and grow, and hence there must be sufficient structural redundancy(load paths) and crack arrest devices to ensure that the structure can be used
safely until the crack can be discovered and repaired. Thus, this design scheme
assumes an inspection schedule will be performed periodically during servicelife. The fail-safe philosophy is usually less conservative than the safe-lifephilosophy, and results in a lighter, more efficient structure.
Heretofore, ship design has been based on a combination of the safe.life and the fail-safe design principles. Traditional ship design methodologyhas not specifically included structural fatigue analysis. Operating stresses
83
—.
in primary and secondary structure have been kept low relative to endurancelimits, and structural redundancies have been designed in to ensure structural
integrity in the event of fast fracture in one region. On the other hand, past ‘
designs have assumed that periodic NDI inspections would be performed so
that any cracks that do develop would be repaired or replaced at some stage
in their growth. Thus, unlike aircraft structures, which are often designed
according to strict fail-safe principles, ship structural design currently re–
presents an intermediate position between the two complementary philosophies.
This approach, coupled with conservative design factors and a long history
that records only rare instances of fatigue crack propagation in primary struc-
ture, has proved to be a successful design philosophy for ship structures.However, as design stresses are increased in both mild and in HSLA ship.
steels used in primary structure, it will be necessary that design philosophies
move closer to the fail-safe position, by including crack growth criteria in
structural design.
The criterion that is set forth in this chapter is to be considered a
tentative design tool by which the designer/architect can evaluate tradeoffs
between stress levels and fatigue damage resistance of ship structural weld-
ments. It is tentative because the data on which the criterion is based are in
some respects inadequate to develop a complete, reliable design process.
The criterion concerns crack initiation and subcritical crack growth specifically,
and does not address fast fracture. * It assumes that the designer can identify
the potentially critical stress areas in the structure and has some knowledge ofthe loading environment which these regions experience.
B. Purpose of the Criterion
“The purposes of the criterion described in this chapter may be statedbriefly as follows.
(a) To identify the relative merits of mild and HSLA steels
with regard to crack initation and subcritical crack growth
in ship structure,
(b) to permit the ship designer to place realistic estimates on the
permissible fatigue-producing stresses in primary structure
so that adequate service life can be assured,
(c) to enable the ship designer to make recommendations, on
the basis of expected subcritical crack growth rates, of
the required resolution and frequency of nondestructive
inspection procedures,
‘*The reader interested in an introduction to fracture design is referred to the
Appendix; in general it is to be emphasized that the plane-strain fracture tough-ness KIC can lead to excessive structural weight since the apparent fracture
toughness, Kc, is usually somewhat higher than KIC.
84
.
(d) to have a basis for estimating the level of conservatism
now present in primary ship structural design,
(e) to identify areas in need of further investigation so that
the confidence level and applicability of the criterion may
be increased.
c. Rationale for Criterion
1, Technical Basis
The Criterion set forth in Section IV. D should be considered to be
a tentative procedure which may be applied by a ship designer or naval
architect to make realistic design decisions concerning the application ofmild and HSLA ship steels, when subcritical crack growth may be of con-
cern. This Section presents the rationale behind the suggested criterion,i. e. , the technical basis and the assumptions which were used in developing
the criterion. To begin with, it is useful to establish the interpretation of
the word “criterion” as used in this report. One authoritative source*
defines tbe word “criterion” as 11A standard, =ule, or test on which a judge-
ment or decision can be based. “ This interpretation is to be given in the
criterion to follow. The principles which guided the development of this
particular criterion were :
(a) Simplicity of use, consistent with sound, accepted principles.
(b) Incorporation of the best state-of-the-art data generally
available.
(c) Establishment of a framework that will permit updating thecriterion as improved data and procedures become available.
(d) Viewpoint that the criterion must be easily usable by de-
signers having at best a, marginal knowledge of fatigue and
fracture processes.
These principles are clearly subjective and open to varying intrepretations.
Neverthelesss, they provide useful guidance to the overall understanding of
the criterion.
The criterion is based on the premise that small discontinuities
(as distinguished from cracks) are inherently present in ship structure, and
hence may be assumed to exist in cirtical stress regions. b time, due to
exposure to the loading environment, these dis continuities may develop(initiate ) into true fatigue cracks, which can then propagate subcritically
*Taken from the American Heritage Dictionary, Houghton-Mifflin Co. , 1969.
for a period of time. Given sufficient exposure to the loading environment,one or more such cracks may eventually attain a critical length associatedwith structural failure through fast fracture, excessive deflection, leakage,
or some other form of structural malperformance. The total number of loadcycles to failure, N
f’associated with a crack propagating to a critical length
is, therefore, Nf = Ni + N , where Ni is the number of cycles required to ini -P
tiate a fatigue crack, and NP
is the number of cycles active in propagating the
crack to its critical length.
The number of cycles, Ni, required to initiate the crack is definedin different ways by different people. It may, on the one hand, be taken
from micromechanical considerations as the number of cycles required to
trigger cyclic growth from a pre-existing flaw site under the expectedloading environment. On the other hand, it is sometimes more useful to
consider Ni as the number of cycles required to grow a crack to the mini-
mum length which can be detected reliably by the structural NDI means to be
employed. This criterion uses the latter interpretation, for reasons to be
explained shortly.
Sustained load stress corrosion cracking (SCC) does not need to be
accounted for in applying this criterion. At the present time SCC effects
are generally thought to be negligible for the class of materials and environ-
ments relevant to ship structures. Moreover, the criterion as presented
applies only to welded joint structural regions, since experience has shownthat fatigue cracks will initiate and propagate in these areas at lower stresses
long before developing in the base material. Because of the residual stresses
created in weld regions by confinement forces and by the welding process
itself, the weld region may experience a load ratio R quite different from
the load ratio applied to the structure. According to Gurney and Maddox(96)the current knowledge of residual stresses in as-welded structures suggests
that R is irrelevant to fatigue life because of the inevitability of high tensile
residual stresses. Thus, members subjected to applied compressive stresses
would need to be designed as if they were subjected to tensile stresses. Whilethis assumption requires some further experimental clarification, for pur-poses of this criterion subcritical crack growth in welded structures is taken
to depend purely on the stress range. Cycles which nominally are partially oreven wholly compressive are assumed to be just as damaging as cycles which
are fully tens ile.
There presently exists in the technical literature a substantial bodyof test data concerned with the fatigue life, Nf, of various welded structuraljoints. (2°, 96. 97) These data can be presented in the form of plots Of Stress
range A u vs Nf as shown in Figure 52. The test data consistently show that,for mild and HSLA steels of interest to this work, the AU - Nf curve depends
strongly on the particular type of welded joint configuration, and also upon
the strength level of the base material at stress levels associated with a failure life
86
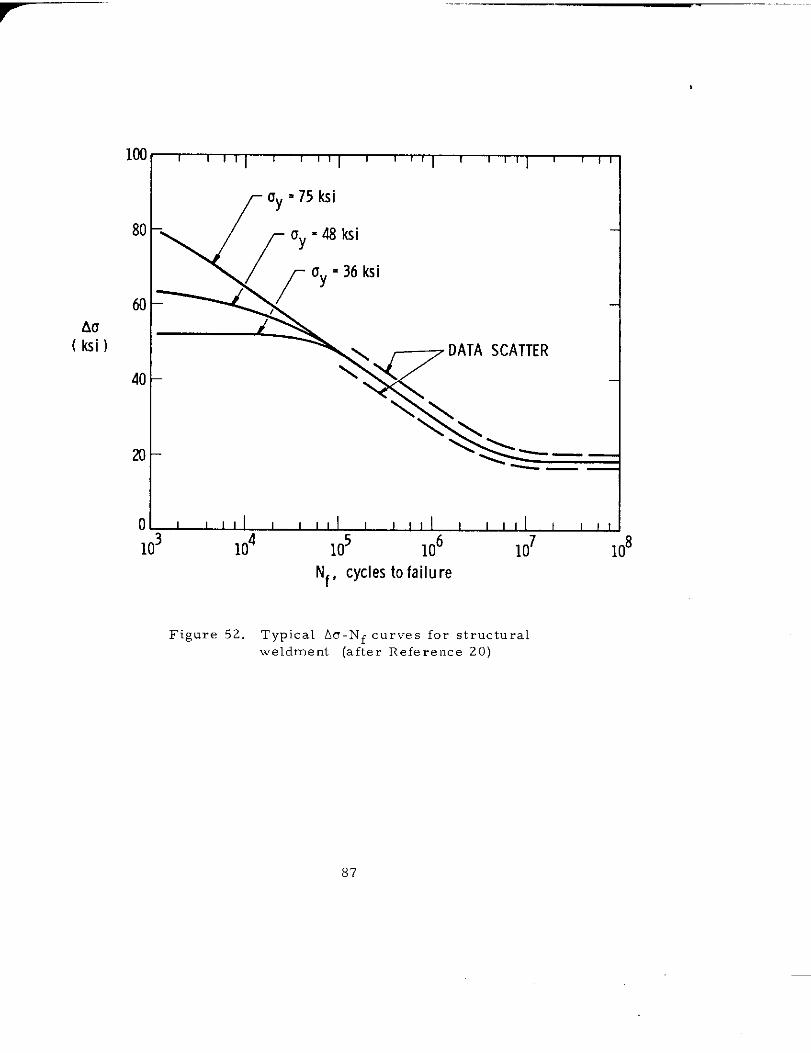
AU
(ksi)
100
80
60
40
20
0
1(
1 I 8 1 I 1 1 1 1 I 1 1 , r I I T 1 1i
1 1 !
~ Oy = 75 ksi
-—_———
I 1 I I I 1 1 1 I I I I I I I I I I I I I I I
104 105 106 107 108Nf, cyclestofailure
Figure 52. Typical Au-Nf curves for structural
weldment (after Reference 20)
87
Nf less than about 5 X 10⁵ cycles. However, for Nf >5x 10⁵ cycles, the
Au - Nf curve and the endurance strength (stress level for unlimited fatigue
life) are independent of the base material strength level for a given weld-ment type.
The implication of this finding is that if the structure is exposed
predominately to low-cyclic stress levels, i. e. , those associated with
failure Nf> 5 X 10⁵ ~ycle~, the fatigue life is the same for mild and HSLA
ship steels. Since the ship design life is considerably in excess 5 X 10⁵
cycles, * differences between the fatigue life of mild and HSLA ship steels
will arise only due to the infrequent stress overloads where the AC - Nf
curve is yield-strength-dependent. This “strength effect” of fatigue life,
which is dependent on the mean or rms stress level in the structure and
the spectral response of the ship to the various sea states encountered, can
be ex-Dected to be verv small for conventionally designed ships wherein the
operating stresses are low. That is, while high-yield-strength steels do
provide an extra margin of protection against infrequent high overload
cycles, the occurrence frequency of these cycles is so small that the fatigue
strength of the ship to spectral loading is expected to be insensitive to yield
strength.
While Au - Nf data of the type discussed abOve are impOrtant indesign and, in fact, form the cornerstone of the proposed criterion, they
give no information as to the relative proportions of life associated with ini-
tiation, Ni, and propagation, Np. At the present time, there is no reliable
and accepted procedure for independently determining the crack initiationperiod Ni for welded structural joints. On the other hand, sound engineering
data are generally available for the propagation rates associated with sub-
critical crack growth in welded marten sitic and pearlitic parent steels.(9,98-102
These data can be represented by curves similar to that shown in Figure 53
where the crack propagation rate, da/dN, is plotted as a function of the stressintensity factor range, AK. Over a certain range of AKtbis relationship is
log-log linear, bounded from belOw by AKth, the threshOld value, and frOm
above by AKT. Below AKth , the crack growth rate da/dN is so small as to
be considered negligible for all practical purposes. AbOve AKT , da/dN is
so large that serious structural fatigue damage may occur within a relatively
small number of cycles. AKth is generally considered to be independent of
the strength level (although it appears dependent upo}the load ratio R ). ‘8)
Between the limits of A~h and AKT , da/dN S (AK) . The slOpe Of this
portion of the curve is not sensibly affected by the material’s strength level.
For martens itic steels in the strength range 80 - 300 ksi, da/dN ~ (AK) ,2.25
while for pearlitic steels of lower strengths (40 - 60 ksi) the exponent is usually
‘: The design fatigue life for primary structure in a ship having a hog/sagfrequency of 6 cpm and a design life of 20 years at 200 operational days/year
is 6 X 60 X 24 X 200 X 20 = 3.456 X 10⁷ cycles.
88
~ —— -..
(9,101, 102)taken as 3.0. Crack growth rates are almost always somewhat
higher in the parent material than in the weld Or HA.Z, and to be design-
conservative, crack growth rates should be those associated with the base
metal. (8)
Since there is a known proportionality between da/dN and AK in the
region AK~h~ AK: AK p this expression may be integrated to give Np, the
number of cycles required to propagate the crack from an initial length a.
to a critical length acr. For simplicity, this criterion assumes that the
initial crack configuration is a surface crack, with a length equal tO twice
the depth, and that this crack aspect ratio does not change during crack
growth. With these assumptions, the following calculation procedure
directly determines N : 17he crack growth expression da/dN = O. 66X 10-8~(AK)2. 25.
(101)1s adopted fo? purposes of this criterion from the work of Bar-
s om, for application to design for both martensitic and pearlitic steels
in the strength range 40 - 300 ksi. In this expression, AK is expressed as
ksi~in. , and the instantaneous crack depth a is in inches. Combining this
with the expression AK = 1. 24iaA o for the surface crack with a length
equal to twice the depth, (103) there results
racr J’ ‘pdNJ da = 0.66 X 10⁻⁸ (1.24/a Ao)2”25 o (36)a0
from which
N = 7.47 x 10⁸
!
1-1
P 2.25 1/8 1/8(Au) a a-)0 cr
(37)
where AU is expressed in ksi, and a. and a are in inches. Thus, under
the assumptions mentioned earlier, N dep~~ds only upon the applied stressP
range, and the initial and final crack depths, but is otherwise independent of
material strength.
The manner in which the initial and critical crack lengths, a and
acr, are defined influences the calculated value of N . One method”of
determining these quantities is to calculate them fro% fracture mechanics
principles. According to this approach, since2AK = 1. 24~a AU, then
a. . 0.65 (AKtb/AO) and acr . 0.65 (AK T/AU) . Furthermore, while
AKth (and hence ao) is independent of the yield strength, AKT (and hence acr)
does depend upon oy. In particular, there is convincing evidence showing
89
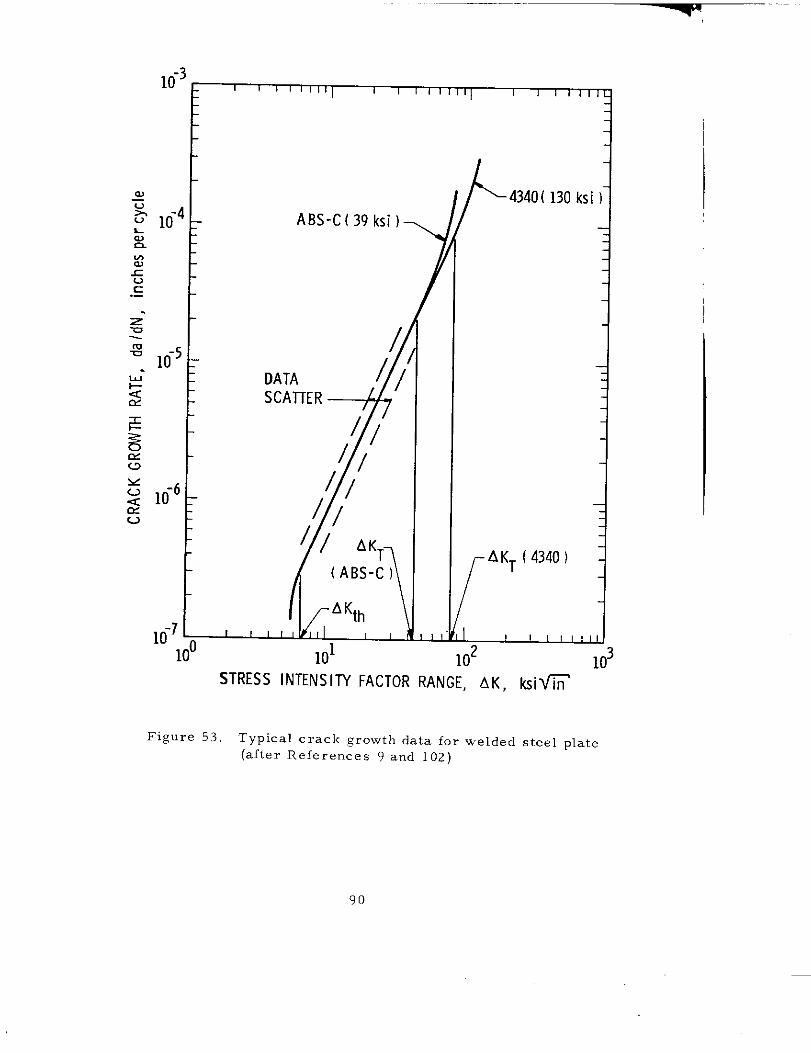
—
‘“~ i*
~~ 10-4: ABS-C(39 ksi )
E%5uc.-
g
g10-5.–
w- DATA2E SCATTER /
$0
~ -6_< 10Ev
lci7 1 I 1 1 1
10° 101 102 103STRESS INTENSITY FACTOR RANGE, AK, ksi~
Figure 53, Typical crack growth data for welded steel plate(after References 9 and 102)
90
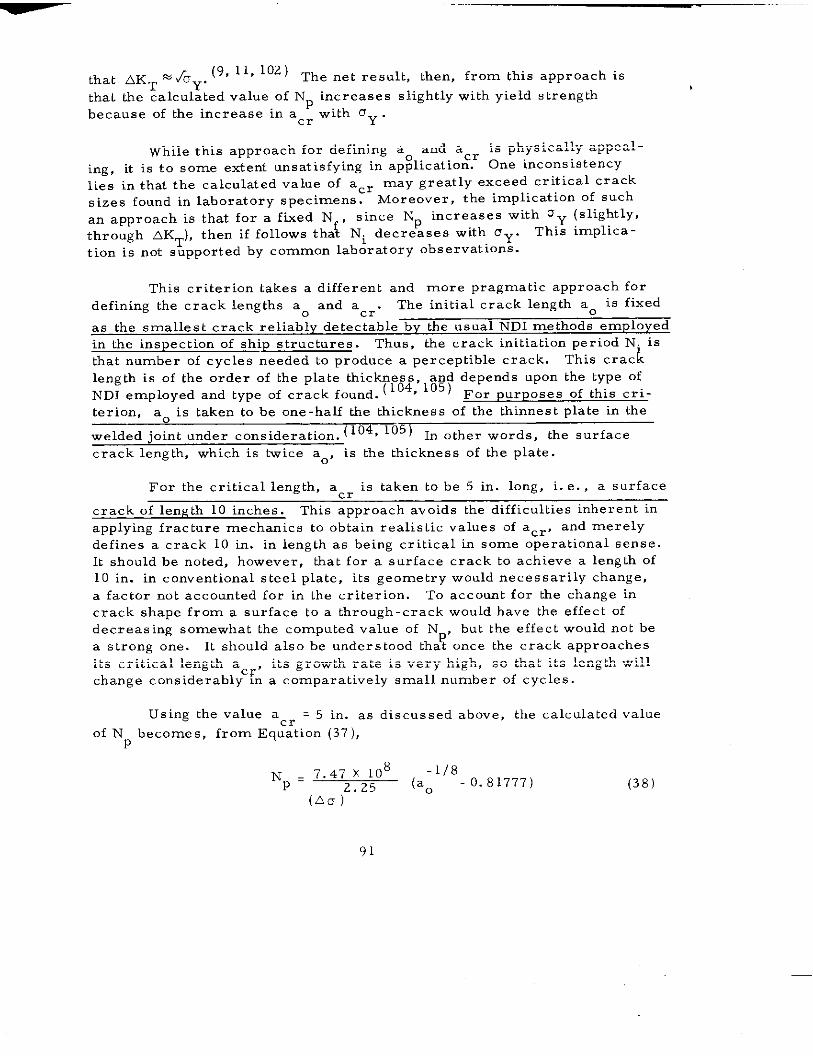
—
that AKT = ~UY.(9, 11, Ioz) ~~ e net result, then, from this approach is
that the calculated value of Np increases slightly with yield strength
because of the increase in a C= with OY .
While this approach for defining a and acr is physically aPpeal -
ing, it is to some extent unsatisfying in ap~lication. One inconsistency
lies in that the calculated value of acr may greatly exceed critical crack
sizes found in laboratory specimens. Moreover, the implication of such
an approach is that for a fixed N , since Np increases with OY (slightly,
$through AKT), then if follOws tha Ni decreases with oy. This ‘mPlica -
tion is not supported hy common laboratory observations.
This criterion takes a different and more pragmatic approach for
defining the crack lengths a and a The initial crack length a is fixed0 Cr” 0
as the smallest crack reliably detectable by the usual ND I methods employed
in the inspection of ship structures. Thus, the crack initiation period N. isthat number of cycles needed to produce a perceptible crack. This cracklength is of the order of the plate thickness, and depends upon the type of
NDI employed and type of crack found.(104, 105) For purposes of this cri-
terion, a. is taken to be one -half the thickness of the thinnest plate in theo
104, 105) In ~th~r words, the surfacewelded joint under consideration. (
crack length, which is twice ao, is the thickness of the plate.
For the critical length, acr is taken to be 5 in. long, i. e. , a surface
crack of length 10 inches. This approach avoids the difficulties inherent in
aPPIYing fracture mechanics to obtain realistic values of acr, and merelydefines a crack 10 in. in length as being critical in some operational sense.
It should be noted, however, that for a surface crack to achieve a length of10 in. in conventional steel plate, its geometry would necessarily change,
a factor not accounted for in the criterion. To account for the change incrack shape from a surface to a through-crack would have the effect of
decreasing somewhat the computed value of N , but the effect wOuld nOt be
a strong one. It should also be understood tha? once the crack approaches
its critical length acr, its growth rate is very high, so that its length willchange considerably in a comparatively small number of cycles.
Using the value acr = 5 in. as discussed above, the calculated value
of Np becomes, from Equation (37),
Np . 7.47 X 10⁸ -1/8
2.25 (a. -0. 81777) (38)
(Au)
91
This expression was used in developing the data for the crack initiation
period Ni (=Nf - Np) presented in the criterion.
Using the approach for the calculation of Np outlined above, it is
concluded that N does not depend directly on the yield strength propertiesof the base ~ate:ial
Np does, however, depend indirectly on UY in that
HSLA steels, as contrasted with mild steels, will be employed in ship
structure in plates of reduced thickness, and thus a. as defined by the ci-i -
terion will be smaller for HSLA than for mild steel construction. The resultis that Np, will be somewhat greater for the HSLA application, when compared
On the basis of equal Au. This comparison is only partially correct, hqwever.HSLA steels are employed to raise the working stresses through reduced
plate thicknesses, and the commensurate increase in stress amplitude will
tend to counteract the effect just mentioned of increasing Np through smaller
values of ao. The net effect is that Np is considered not to be significantly
influenced by the strength level of the base steel used.
The rationale for the proposed criterion, as thus far outlined, im-plies that Nf is independent of IJY in the medium-to-high-cycle design regime,and depends only on the welded joint configuration under consideration. More-over, N is, for all practical purposes, independent of 0 y. Therefore, it
\follows t at Ni (=Nf -Np) is essentially independent of yield strength, so that
the whole process of crack initiation and propagation to a critical length is
at most only weakly dependent upon yield strength. Thus, insofar as crackinitiation and subcritical crack propagation in ship steels are concerned,there is no important benefit or penalty associated with yield strength. ~-
deed, HSLA steels emerge as having no less fatigue resistance than milds teels, and the benefits that accrue from usin g HSLA steels to withstand thestatic design loads with reduced structural sections may be enjoyed without
sacrifice. HSLA steels may also be expected to possess enhanced fatigueresistance due to greater ability to withstand the overload cycles which,
while few in number, do inflict increased fatigue damage on the structure.
More is said about the implications of the criterion in the subsection to
follow.
The criterion proposes two complementary approaches for estimatingfatigue life and permissible cyclic stress levels. The first, and most con-
servative of the two, makes use of a cons tant. amplitude sinusoidal loadingenvironment to replace the true narrow-band random environment experiencedby the primary structure. ‘The assumption of a narrow-band process itselfimplies that high-frequency loading components associated with dynamic slam-
ming are disregarded. These loading components, however, are generallyconsidered to be unimportant to the fatigue damage prOCe SS.
(lo6)
Using the constant-amplitude sinusoidal loading environment approach,
the criterion provides a conservative estimate of the maximum fatigue loads
that can be sustained for an indefinite or for a finite life. These data are
derived from the AIS - Nf curves shown as Figures 54-59. It is important
that this simplification, which is commonly employed in other structural
design criteria, be understood and appreciated hy users of the criterion
Figures 54-59 present fatigue life design data for typical welded joint con-
figurations, and form the basis for life estimates for the criterion. The
data are based upon results from Gurney (20) and Frost and Denton (97)
obtained in pulsating tension experiments. These curves reflect the assump-tion (F, o,t and Denton(97))that the fatigue strength approaches the ultimate
tensile sti-en th as the life Nf is decreased to zero. It is also assumed,after Gurney~20), that the f~~ig~~ ~ndur~nc~ limit is reached at 107 .y.k,,
and it is further assumed to he equal to 7570 of the fatigue strength at2 X 106 cycles. (As mentioned earlier, the stress range to he used in the
criterion is the algebraic difference between the maximum and minimum
cyclic stress values, i. e. , AD includes any compression component of the
loading cycle that may be present. ) These figures furthermore permit
estimates of the scatter effect in the high-cycle portion of the fatigue life
to be made. They also reveal that Nf is independent of yield strength for
cyclic lives above 105 cycles, for all weldments considered.
Primary ship structure is exposed to a large number of narrow-band
process random load cycles, typically 107 - ~08 ~ycle~, and thus ship struc-
tural fatigue design is inherently in the high-cycle regime. In this regime,
as mentioned previously, for welded structures base metal strength effec~svanish and the Au - Nf curves are independent of fJY out beyond abOut 10cycles. However, the spectral distribution of the loads about the mean
value can affect the fatigue resistance. The (relatively few) load cycles of
high intensity that can be expected statistically to occur do influence crack
initiation and growth behavior, and it is here that yield strength effects can
emerge. High-strength steels can accommodate those few load cycles of
high intensity much better than mild steels. In general, it can be expectedthat due to the increased low-cycle fatigue resistance of HSLA ship steels,
these materials will perform somewhat better under actual spectral loading
conditions than conventional mild steels insofar as crack initiation is con-
cerned.
Several recent research studies(107-109)
conducted under the auspicesof the Ship Structure Committee have addressed the problem of describing
structural loading spectra for cargo ships deployed in service. Certainlyeach ship has its own peculiar structural response to given sea conditions,and the operational mission pattern also will vary from ship-to-ship. There-fore, it is unrealistic to expect there to be a single load spectral distribution
which will closely characterize the total envelope of variable loads experienced
by all cargo ships. Nevertheless, it is useful to examine the subcritical
crack growth and failure implications of a representative load spectrum.
93
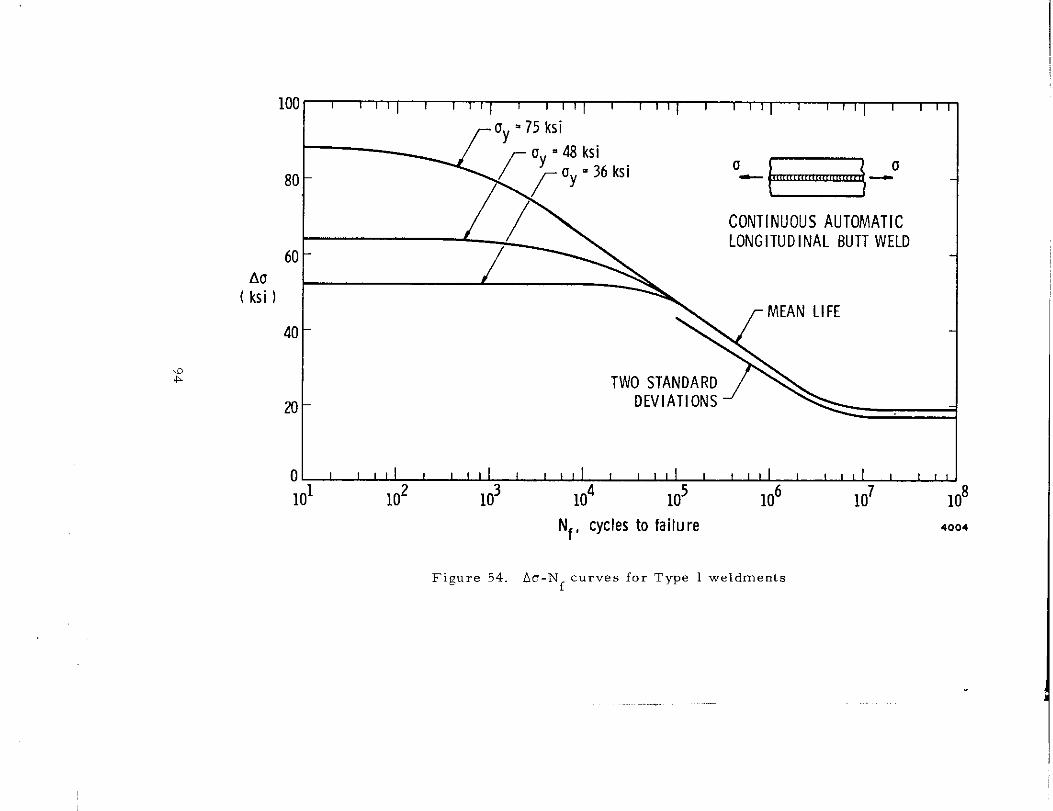
100- I I I I I 1 1 1 1I 1 I I 1 I I 1 I II I 1 I I I 1 I 1 II 1 I I r
80 -
CONTINUOUS AUTOMATICLONGITUDINAL BUTT WELD
60 -AU
( ksi )
40 -
m -
01 1 I 1 I I 1 1 I I I I 1 I I I t 1 I 1 I 1 t 1 1 I 1 I 1 1 I 1 ! ! !
101 102 103 104 105 106 107 108
Nf, cycles to failure 4004
Figure 54. AO-Nf curves for Type 1 weldments
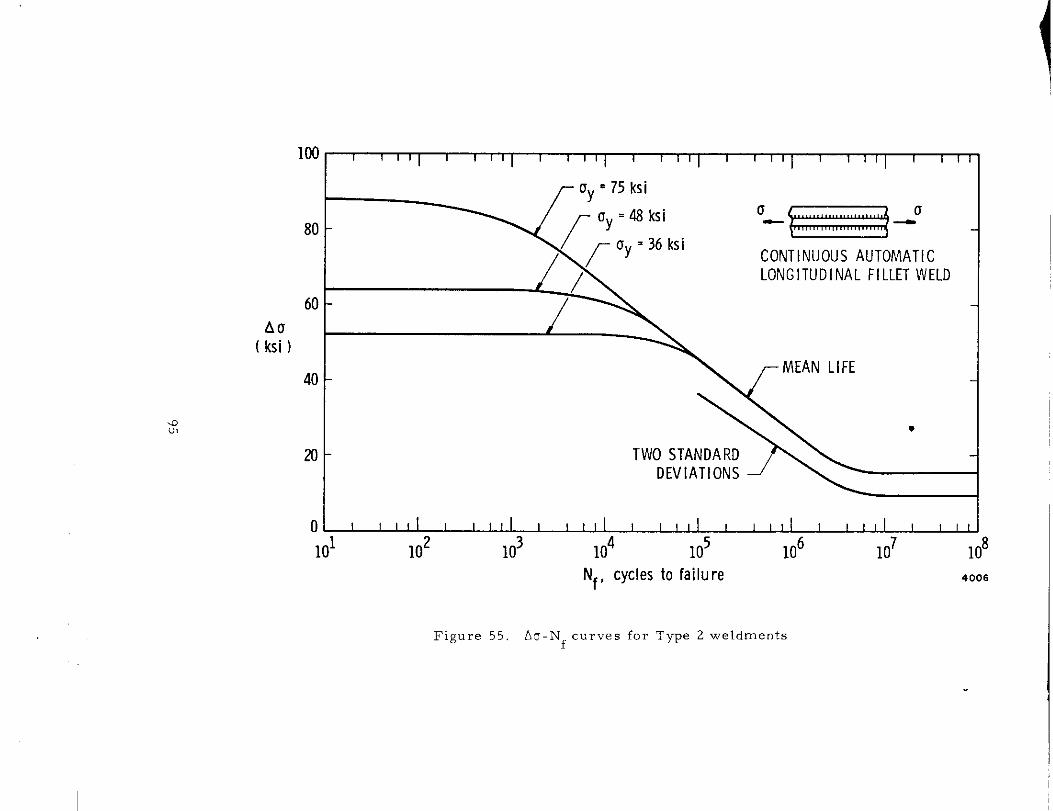
100 1 I 1 II I I 1 I
I1 I I 1
II 1 T 1
II 1 1 1
II ! ! rl [ I I
( ksi )
40
m
u o
CONTINUOUS AUTOMATIC
80 -
LONGITUDINAL FILLET WELD
60 -
Au
~
MEAN LIFE
*
TWO STANOA RDDEVIATIONS
01 I t I ! I I I I r I I I I II I I I I I I 1 I I I I I I 1 I I I I
101 102 103 104 105 106 107
Nf, cyclesto failure 4006
Figure 55, AU-Nf curves for Type 2 weldments
I
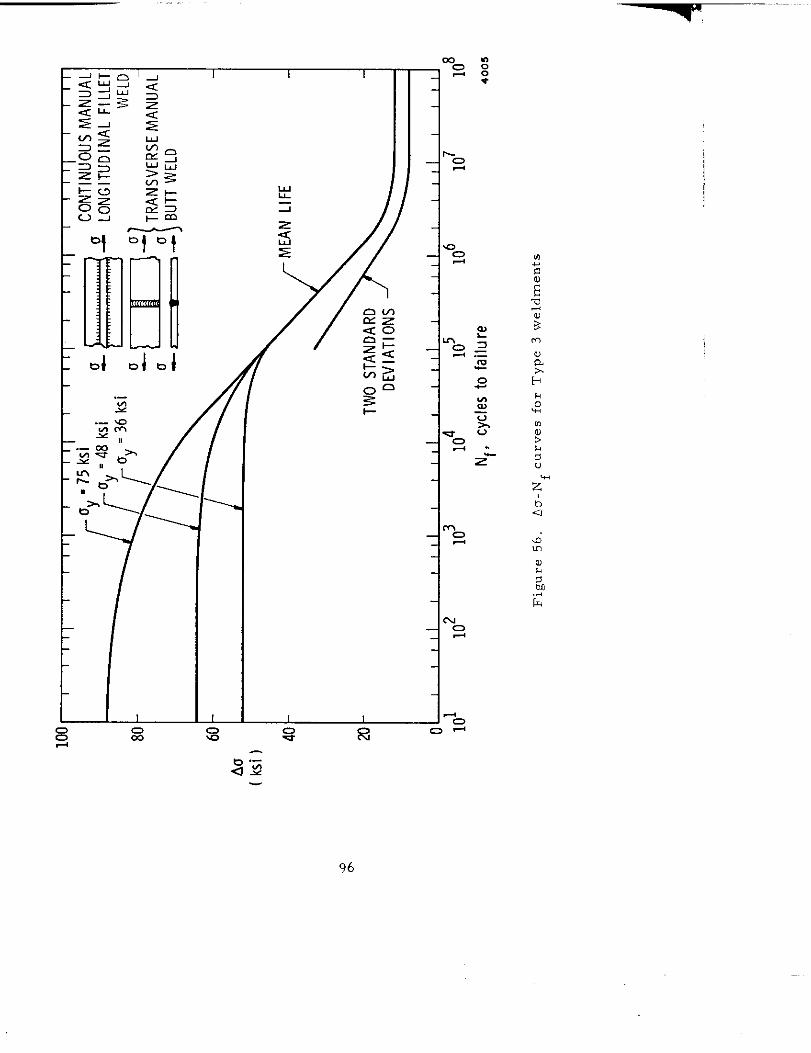
I
96
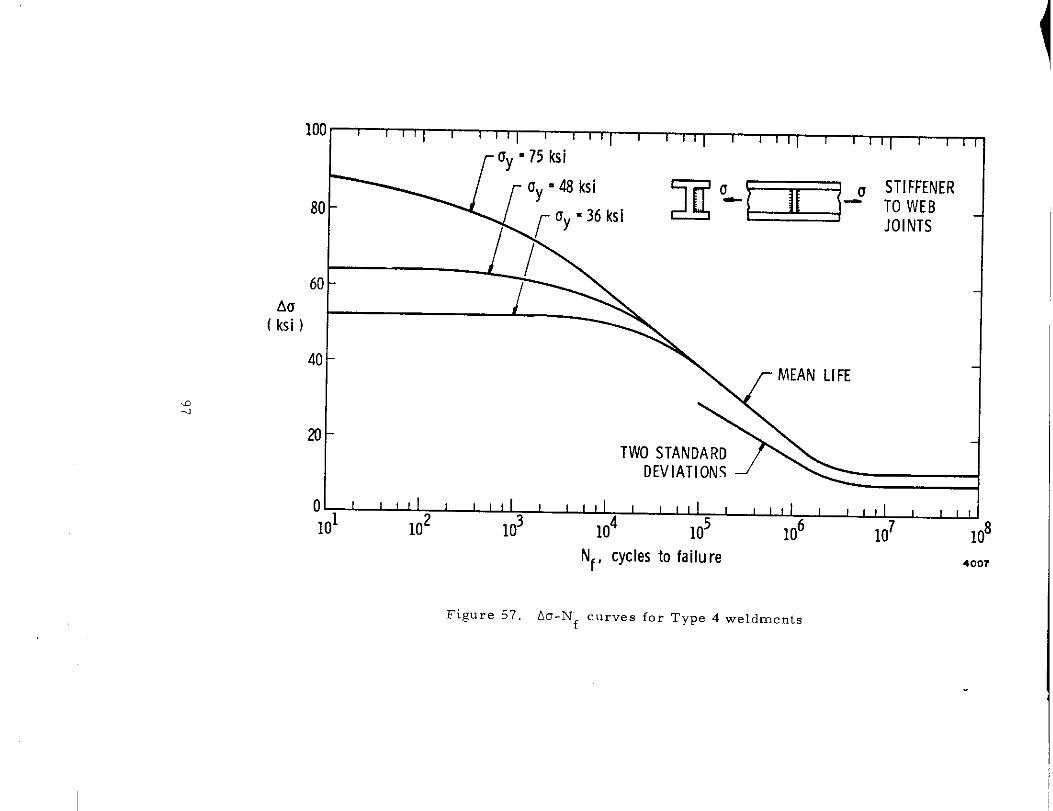
AU
( ksi )
100 1 I 1 1I I I I I I 1 I 1 !
I 1 I I 1[ I 1 I II I I 1 I I ! 1 i I
80 -
60 -
40-
20-TWO STANOARD
DEVIATIONS
01 1 I ! 1 1 1 I I I I I I I I I
101I I I
102
I I I
103
1 I ! I
104
I I I I I 1 1
105
I [
106 107 108Nf, cyclesto failure 4007
Figure 57. AO-Nf curves for Type 4 weldments
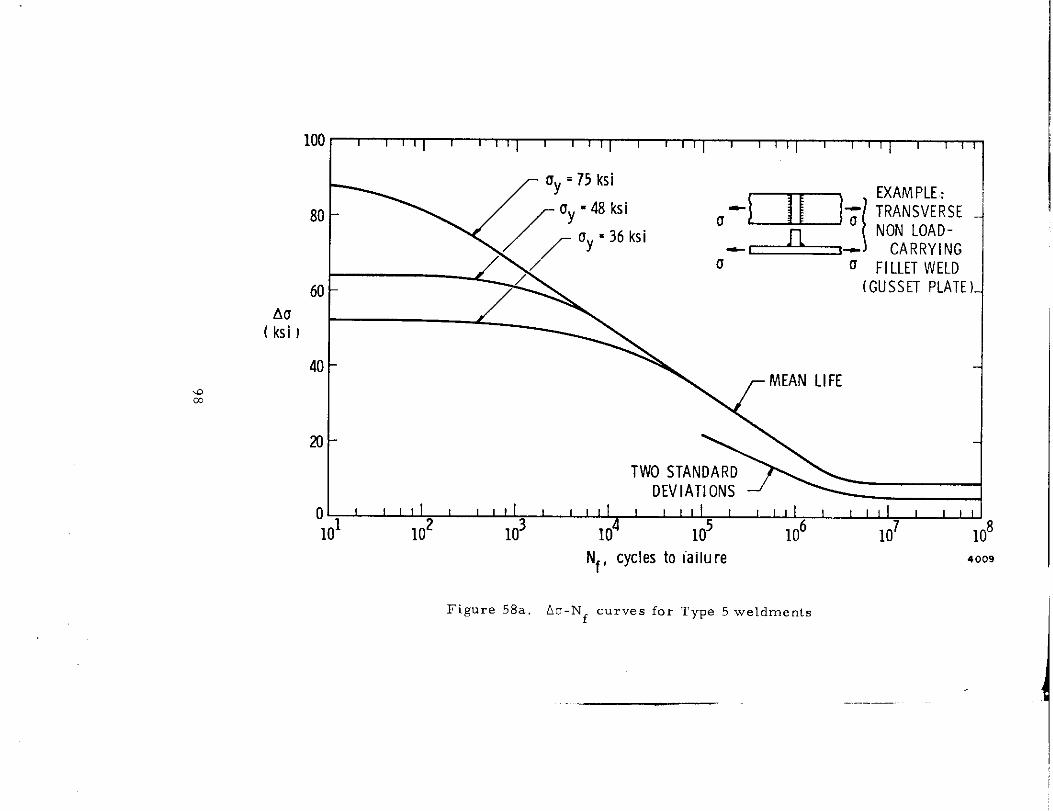
AU
( ksi1
-nm
100 1 1 1 1 I 1 1 1 tI I 1 1 1[ 1 I 1 1 I I I 1 [I I 1 I 1 I I ! i r-
80 -
u FILLET WELD
60 - (GUSSET PLATE )-
40 -
20 -
TWO STANDARDDEVIATIONS
o ! ! ! I I 1 1 1 I I I 1 I I I ! 1 I I I 1 [ I II I t I II 1 1 I I
101 102 103 104 105 106 107 108Nf, cycles to iailure 4009
Figure 58a, Au-Nf curves for Type 5 weldments
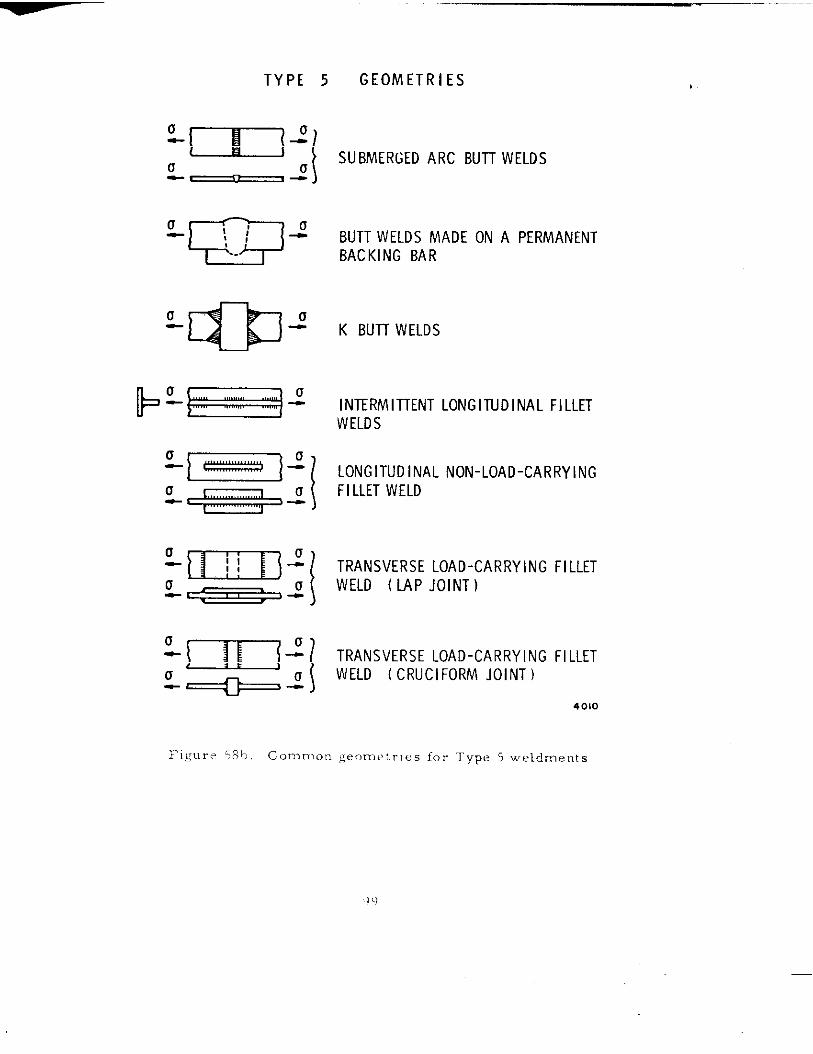
TYPE 5 GEOMETRIES
TIEF ! SUBMERGED ARC BUTT WELDS~~z
‘=4 BACKINGBARBUTT WELDS MADE ON A PERMANENT
—
=1-JJ4K‘“”wEL’s
1+= = =1-0 u
INTERMITTENT LONGITUDINAL FILLETWELDS
+iiziEF 1LONGITUDINAL NON-LOAD-CARRYING
~-~ “’LET ‘EL’
W1332 I TRANSVERSE LOAD-CARRYING FILLET
~~~WELD ( LAP JOINT)
:~<:~
TRANSVERSE LOAD-CARRYING FILLETWELD (CRUCIFORM JOINT)
4010
Fi,qure 58b, common ~ec, me:ries for Type 5 weldments
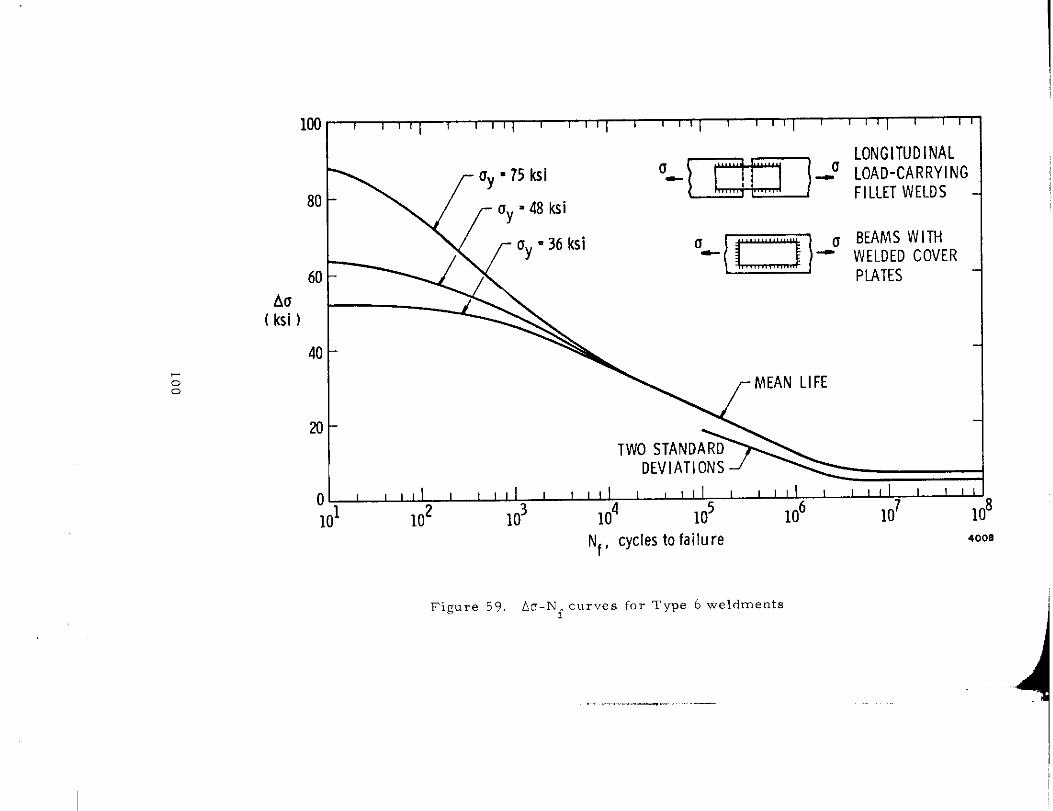
AU( ksi )
00
100 I 1 I r 1I
! 1 1 1 I I 1 I II
i 1 I ! I I 1 1 I I 1 1 I 1I I 1 I 1
.,
80 -
60 -
40 -
xl -
1
TWO STANDARDnF\/lATlf)NS
01 1 1 I 1 I I t I I I I t I I I 1 1 I II I I I 1 I I ! I I I I I I II
101 102 103 104 105 106 107 108
Nf, cycles to failure 4008
Figure 59, AU-Nf curves for Type 6 weldments1
. . ..”....—-. . .
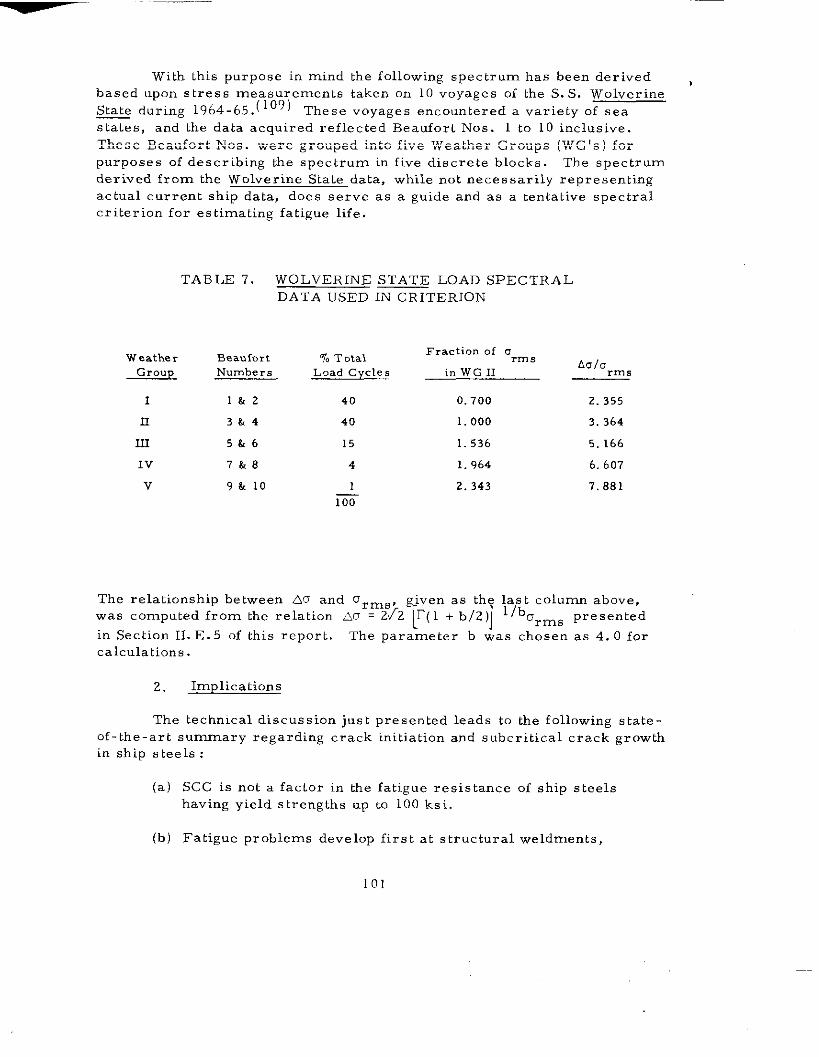
With this purpose in mind the following spectrum has been derivedbased upon stress measurements taken on 10 voyages of the S. S. Wolverine
~e during 1964-65.(109) These voyages encountered a variety of sea
states, and the data acquired reflected Beaufort Nos. 1 to 10 inclusive.
These Beaufort Nos. were grouped into five Weather Groups (WG’S) for
purposes of describing the spectrum in five discrete blocks. The spectrum
derived from the Wolverine State data, while not necessarily representing
actual current ship data, does serve as a guide and as a tentative spectral
criterion for es timating fatigue life.
TABLE 7. WOLVER1liE STATE LOAD SPECTRALDATA USED IN CRITERION
Weather Beaufort % TotalFraction of arm,
Aalorm,Group Numbers Load Cycles in WC II
1 l&2 40 0.700 2.355
II 3&4 40 1.000 3.364
113 5.k6 15 1.536 5.166
Iv 7&8 4 1.964 6, 607
v 9&lo 1
E
2.343 7, 881
The relationship between AU and o ~m~. gjven as the last column above,was computed from the relation Au = 2/2 lr(l +b/2)1 l/burm~ presented
in Section 11. E.5 of this report. The parameter b was chosen as 4.0 forcalculations.
2. Implications
The technical discussion just presented leads to the following state-of-the-art summary regarding crack initiation and subcritical crack growth
in ship steels :
(a)
(b)
SCC is not a factor in the fatigue resistance of ship steels
having yield strengths up to 100 ksi.
Fatigue problems develop first at structural weldments,
101
““”””--’-~–””” ‘-”
(c)
for there fatigue damage resistance is much lees than
in the base steel plate.
Tbe fatigue strength of typical weldments is independentof yield strength in the region Nf > 105 cycles, wherein
nearly all of the fatigue life resides. Also, crack growth
rates da/dN are indifferent to OY for yield strengths at~
least up to 100 ksi. From these observations, it is con-
cluded that the crack initiation process in critical weld-
ments is essentially independent of the yield strength of
the base material.
These conclusions, in turn, lead to the implication that HSLA steels
are no worse than mild steels from a crack initiation and subcritical crackgrowth standpoint, In fact, they emerge as somewhat better considering
the relatively few high level stress cycles which can be expected, on sta-
tistical grounds, to occur within the spectral distribution of loads. It is
impossible, however, without some specific knowledge of the expected
fatigue loads envelope for a given ship, to associate a numerical index of
the improved spectral fatigue resistance of HSLA steels. HSLA steels
are most apt to be integrated into primary ship structure from staticdesign and other factors. Their resistance to fatigue will depend princi-
pally upon the endurance limit (and its scatter, or dispersion) of the weld-ment in question, and not upon the yield strength.
Typically, during its lifetime a cargo ship may be expected to expe -
rience between 107 and 108 cycles of load in its primary structure. ‘The
strength levels at these cyclic lives (see Figures 54-59) are relatively hi hF07)
compared to the stresses in conventional ship structure deployed today. (
Thus, contemporary ship design is doubly conservative with respect to fatigueresistance : the operating stresses are low compared with the weldment en-
durance strengths, beyond which design based on endurance strength (infinite
life) is a conservative design philosophy.
If one considers, as here, the crack initiation period to be that num-ber of cycles needed to “make-up” the difference between total life and pro-
pagation life, the criterion forecasts that Ni is generally much greater than
Np . In ship primary structures the operating stresses are low in keeping
with the large number of load cycles expected. At these stresses nearly
all the life is consumed in initiating a crack, and the lower the cyc[ic
stresses, the more so. The implication in terms of ND1 is clear : JNDIsystems should be concerned primarily with initial flaw detection. Oncea crack has initiated, its growth rate may be very high (regardless ofyield stren~th level) and short inspection intervals are then required to
prevent sudden failures.
I
All of the remarks just made mu.t be tempered with one fact : the
data base upon which this criterion has txen bui~t is, Ln certa, c, respects,
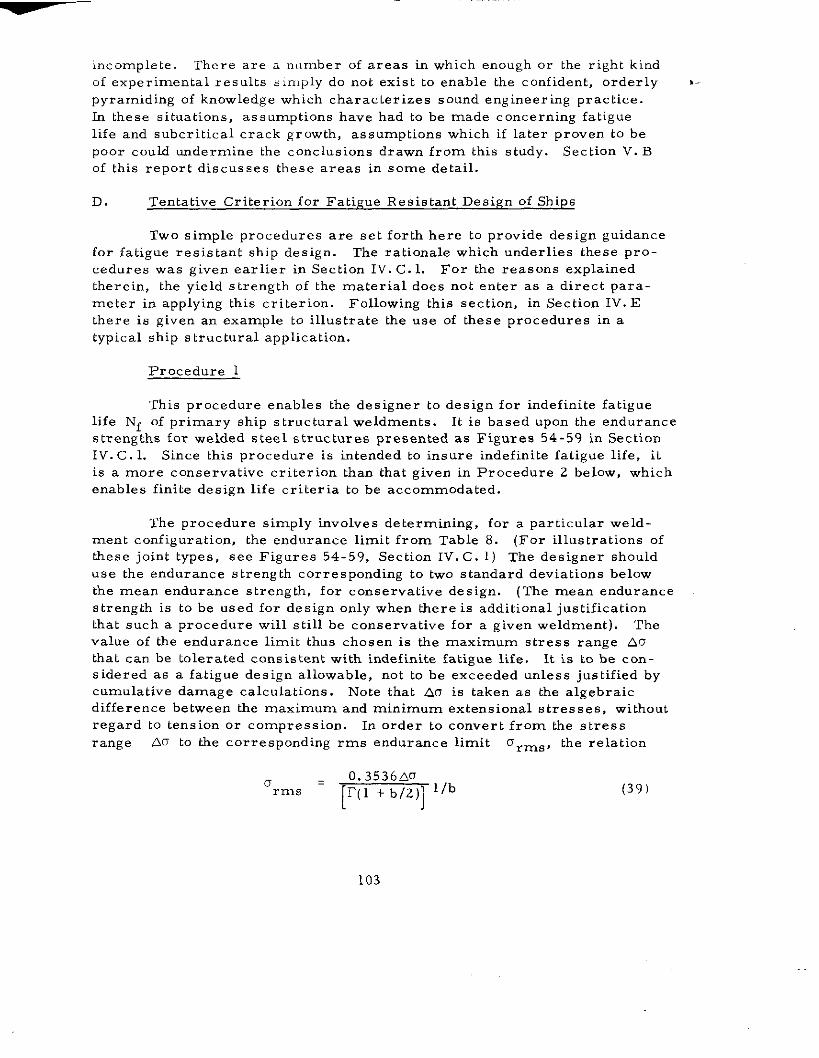
incomplete. There are a number of areas in which enough or the right kindof experimental results sin,ply do not exist to enable the confident, orderly ,-
pyramiding of knowledge which characterizes sound engineering practice.
In these situations, assumptions have had to be made concerning fatigue
life and subcritical crack growth, assumptions which if later proven to be
poor could undermine the conclusions drawn from this study. Section V. B
of this report discusses these areas in some detail.
D. Tentative Criterion for Fatigue Resistant Design of Ships
Two simple procedures are set forth here to provide design guidancefor fatigue resistant ship design. The rationale which underlies these pro-cedures was given earlier in Section IV. C. 1. For the reasons explained
therein, the yield strength of the material does not enter as a direct para-
meter in applying this criterion. Following this section, in Section IV. E
there is given an example to illustrate the use of these procedures in a
typical ship structural application.
Procedure 1
This procedure enables the designer to design for indefinite fatiguelife Nf of primary ship structural weldments. It is based upon the endurance
strengths for welded steel structures presented as Figures 54-59 in Section
IV. C. 1. Since this procedure is intended to insure indefinite fatigue life, it
is a more conservative criterion than that given in Procedure 2 below, which
enables finite design life criteria to be accommodated.
The procedure simply involves determining, for a particular weld-ment co~figuration, the endurance limit from Table 8. (For illustrations of
these joint types, see Figures 54-59, Section IV. C. 1) The designer should
use the endurance strength corresponding to two standard deviations below
the mean endurance strength, for conservative. design. ( The mean endurancestrength is to be used for design only when there is additional justification
that such a procedure will s till be conservative for a given weldment). The
value of the endurance limit thus chosen is the maximum stress range AU
that can be tolerated consistent with indefinite fatigue life. It is to be con-sidered as a fatigue design allowable, not to be exceeded unless justified by
cumulative damage calculations. Note that AU is taken as the algebraicdifference between the maximum and minimum extensional s tres Ses, without
regard to tension or compression. In order to convert from the stressrange AU to the corresponding
orms –
rms endurance limit Urm~, the relation
O.3536AO
[~(1 +b,2,] l/b (39)
103
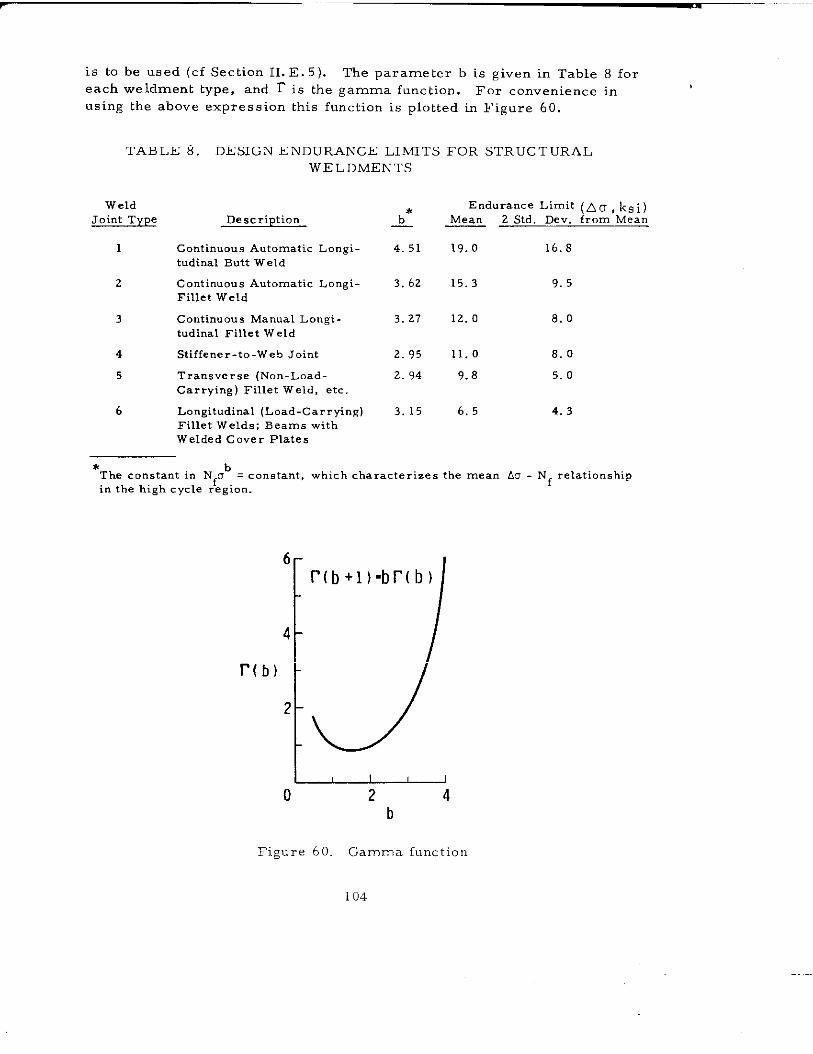
r
is to be used (cf Section 11. E. 5). The parameter b is given in Table 8 for
each weldment type, and ~ is the gamma function. For convenience inusing tbe above expression this function is plotted in Figure 60.
TABLE 8. DESIGN ENDURANCE LIMITS FOR STRUCTURAL
WE LDMENTS
WeldJoint Type
1
2
3
4
5
6
Description
Continuous Automatic Longi-tudinal Butt Weld
Continuous Automatic Longi-FiUet Weld
Continuous Manual Longi-tudinal Fillet Weld
Stiffener-to-Web Joint
Transverse (Non-Load-Carrying) Fillet Weld, etc.
Longitudinal (Load-Carrying)Fillet Welds; Beams withWelded Cover Plates
<
4.51
3.62
3,27
2.95
2.94
3.15
E“d”rance Limit (A~,kSi)Mean 2 Std. Dev, from Mean
19.0 16.8
15.3 9.5
12.0 8.0
11.0 8.0
9.8 5.0
6.5 4.3
*The constant in N.ob = constant, which characterizes the mean Ao - N= relationshipin the high cycle r’egion.
,
6-
4 -
r(b)
2 -
[ I ( I
0 2 4b
Figure 60. Gamma function
104
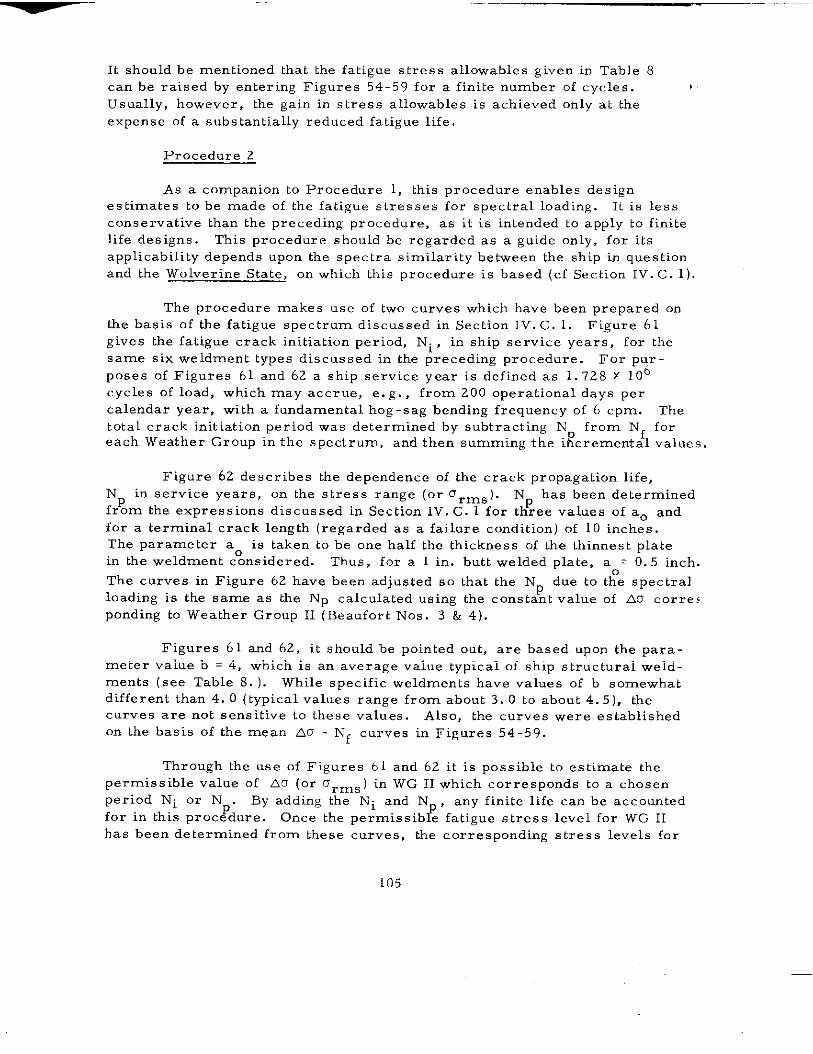
It should be mentioned that the fatigue stress allowable given in Table 8
can be raised by entering Figures 54-59 for a finite number of cycles.
Usually, however, the gain in stress allowable is achieved only at the
expense of a substantially reduced fatigue life.
Procedure 2
As a companion to Procedure 1, this procedure enables designestimates to be made of the fatigue stresses for spectral loading. It is less
conservative than the preceding procedure, as it is intended to apply to finitelife designs. This procedure should be regarded as a guide only, for its
applicability depends upon the spectra similarity between the ship in questionand the Wolverine State, on which this procedure is based (cf Section IV. C. 1)
The procedure makes use of two curves which have been prepared onthe basis of the fatigue spectrum discussed in Section IV. C. 1. Figure 61
gives the fatigue crack initiation period, Ni , in ship service years, for the
same six weldment types discussed in the preceding procedure. For pur-poses of Figures 61 and 62 a ship ser”ice year is defined as 1.728 X 10⁶
cycles of load, which may accrue, e. g. , from 200 operational days per
calendar year, with a fundamental hog -sag bending frequent y of 6 cpm. The
total crack initiation period was determined by subtracting N from Nf for“Reach Weather Group in the spectrum, and then summing the L cremental values.
Figure 62 describes the dependence of the crack propagation life,
Np in service years, on the stress range (or CTrm~ ). Np has been determinedfrom the expressions discussed in Section IV. C. 1 for three values of a. and
for a terminal crack length (regarded as a failure condition) of 10 inches.
The parameter a is taken to be one half the thickness of the thinnest platein the weldment considered. Thus, for a 1 in. butt welded plate, a = O. 5 inch.
The curves in Figure 62 have been adjusted so that the Np due to t~e spectralloading is the same as the NP calculated using the constant value of AU corre:
pending to Weather Group II (Beaufort Nos. 3 & 4).
Figures 61 and 62, it should be pointed out, are based upon the para-meter value b = 4, which is an average value typical of ship structural weld-
ments (see Table 8. ). While specific weldments have values of b somewhatdifferent than 4.0 (typical values range from about 3.0 to about 4. 5), the
curves are not sensitive to these values. Also, the curves were establishedon the basis of the mean AU - Nf curves in Figures 54-59.
Through the use of Figures 61 and 62 it is possible to estimate the
permissible value of AO (or u,m~) in WG II which corresponds to a chosenperiod Ni or N . any finite life can be accounted
‘y add’ng ‘he ‘i and ‘Nf‘for in this proc~dm-e. Once the permlss~b e fat~gue stress level for WG IIhas been determined from these curves, the corresponding stress levels for
105
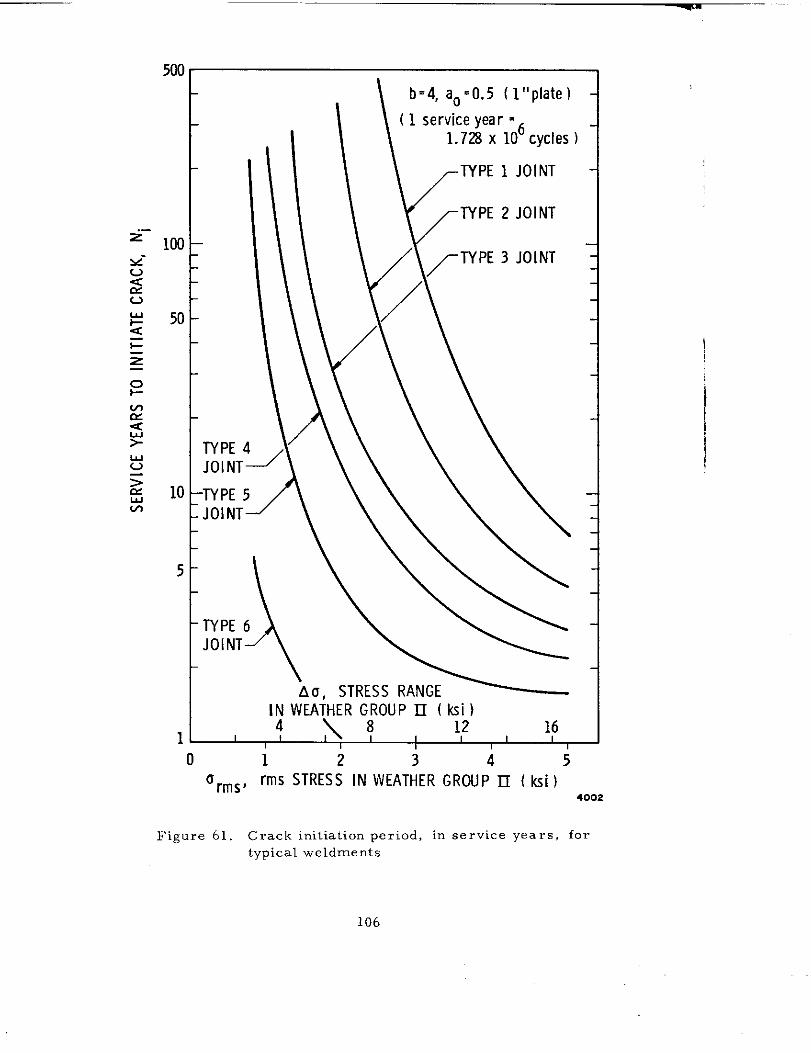
5KI
10Q
50
10
5
1
b=4, ao=0.5 (l’’plate)
\\
( 1 service year =61.728 x 10 cycles )
\
TYPE 4JOINT>
-TYPE 5JOINT
4
TYPE 6JOINT
Au, STRESS RANGEIN WEATHER GROUP H ( ksi )
14\ 81216
1 I 1 1 10 1 2 3 4 5
0 rms, rms STRESS IN WEATHER GROUP n ( ksi )4002
Figure 61. Crack initiation period, in service years, for
I
typical weldments
106
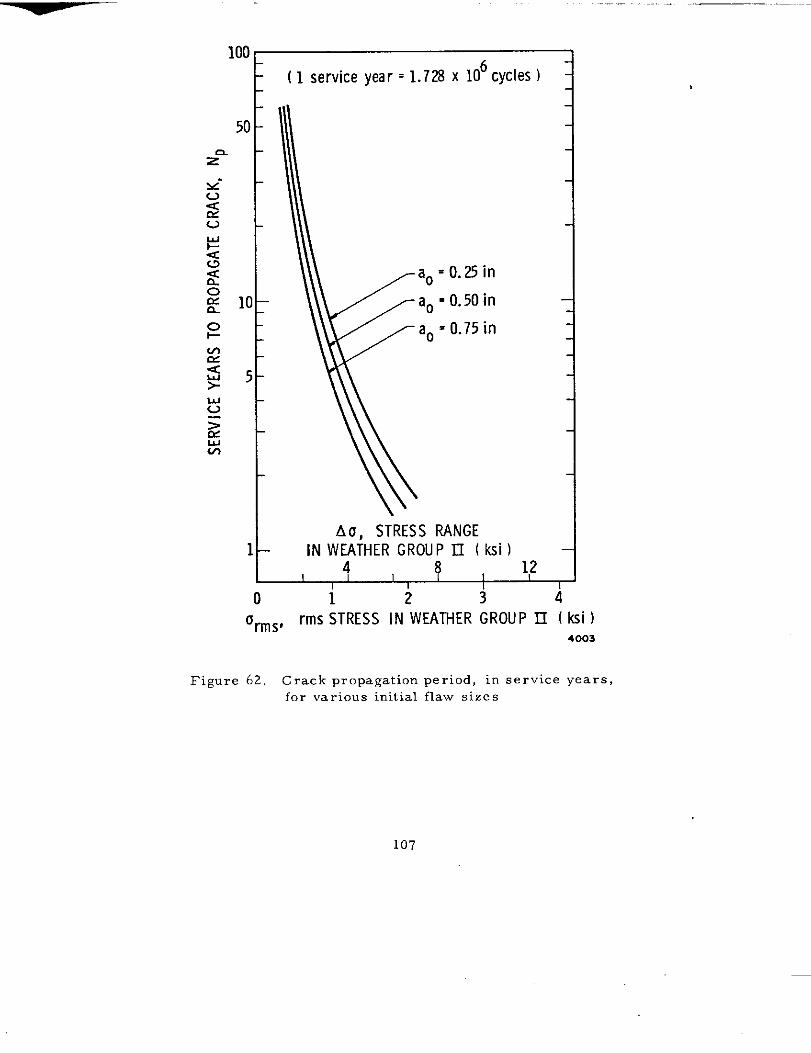
,..
10( 1 service year = 1.728 x 10⁶ cycles )
I
0.25 in
0.50 in
0.75 in
o 1 2 3 4
‘Jrms’ rms STRESS IN WEATHER GROUP II ( ksi )4003
Figure 62. Crack propagation period, in service years,for various initial flaw sizes
107
the other Weather Groups can be found by apportioning the stresses in the
following manner.
Weather Group
I
II
111
IV
v
Fraction of WG II urms
0.700
1.000
1.536
1.964
2.343
The stress levels so obtained constitute the design spectral loads envelope.
The higher stresses found by this Procedure, those in WG IV and V, willnormally be found to exceed the permissible ACI (or O._o) value established
via Procedure I.
In the followingthese two procedures.
E. Example
. . ..”
Section an example is given to illustrate the use of
As an example to illustrate the use of the criterion, consider the
problem of estimating the fatigue life of welded steel deck plating. Assume
the plating is joined by a continuous automatic longitudinal fillet welding pro-
cess (Type 2, Figure 55). The ship under consideration, which has beendesigned initially from static loads criteria, has a fundamental bending
frequency (hog/sag mode) of 6 cpm. The problem is to estimate the maxi-mum permissible stress amplitudes in the plate consistent with a design
life of at least 25 years ( 180 days/year operations).
As one approach to this problem, and the more conservative of the
two to be discussed, the deck plating can be designed to insure that the peakstress amplitude in service never exceeds the endurance strength. From
Table 8 in Section IV. D, the lower limit endurance strength for this type ofweldment is AU = 9.5 ksi. To obtain the correspondence between AO and
‘rms , the relatiOn given as Equation (39) is to be used. * Here, b . 3. 6.zTable 8, Section IV. D, and ~ is the Gamma function. From this relation-
ship it follows that urm~ = O. 306A0 = 2.91 ksi.
* Assuming, as here, that in the case of zero mean stress CTmax = AO/2.
108
These equivalent stress values, Au = 9.5 ksi and orm~ = Z.91 ksi, repre.sent the highest admissible levels that the deck plating can be expected to
tolerate with indefinite life. Higher stress levels, of course, could be
sustained for finite design lives.
TO appreciate the tradeoff between stress level and fatigue life,suppose that the peak stress envelope was raised from Orm~ = 2.91 ksi to
‘rms = 3.20 ksi, an increase of 10%. The corresponding sinusoidal stresslevel is AU = 3.20/0.306 = 10.5 ksi. Fr m Figure 55, Section IV. C. 1, the
2expected life now becomes Nf = 4.5 X 10 cycles, or, at 6 cpm and 180
operational days per year, 2.89 calendar years. Thus, for this example,
a reduction in life from indefinite to 2.89 years is a heavy price to pay
for a 10% increase in cyclic stress allowable.
It should be noticed that in this constant-amplitude stress calcula-
tion, material strength effects do not enter in for design lives Nf > 105
cycles. 105 cycles, incidentally, is operationally equivalent tO 11. fJ days.
In view of this, it can safely be said that yield strength effects will have no
influence on constant-amplitude cyclic s tress allowahles.
As an alternative approach, it will be interesting to examine this
design problem from the standpoint of spectral analysis. To do this it is
necessary first to define the expected root-mean-square stress level Orm~
for the sea state corresponding to Weather Group II. From this parameter
‘he ‘alues ‘f ‘i and ‘P.’ and ‘ence ‘f ‘ ‘i + ‘P’ .’an ‘e ‘btained ‘remFigures 61 and 62, SectIon IV. D. Notice that in using these figures anadjustment must be made from the 200 operational days per year on which
the figures are based to the 180 operational dyas per year for the problem
at hand. The results of such calculations may be summarized as follows :
a in WG II (ksi)rms
0.5
1.0
2.0
3.0
4.0
5.0
Ni
(years )
m
.
310
24
7.9
4.7
109
NP(years)
34.5
7.0
1.8
negligible
,,
,,
Nf
(years)
02
m
311.8
24
7.9
4.7
In calculating N a value of a = 0.5 in. (l-in. plate) was assumed. Cor -P
responding values for differing plate thicknesses can be calculated directly
from Figure 62, Section IV. D. These figures serve to show that N is
negligible at moderate -to-higb values of Urm~, and that Ni is alwa~s in
excess of N in the high-cycle fatigue regime of interest to ship design.
For the pro;lem at hand, it is possible to establish a maximum permissible
Weather Group II cyclic stress environment for a specified design life, say25 calendar years. By plotting O~m~ as a function of Nf , both of which arefound in the foregoing calculation summary, it is found that Orm~ = 2.95 ksi
for WG II for the stated design life. In fact, from this the permissible stresslevels for each Weather Group may be found as follows :
~%0
% cycIes!5010
rms~ QJ.W- arms‘= 306‘o’“i)
I 0.7000 40 2.3545 6.95 2.12
n 1,000 40 3.3636 9.92 3.04 !
III 1.5357 15 5.1655 15.2 4.66
Iv 1.9643 4 6, 6071 19.5 5, 96
v 2.3429 _2- ?.8806 23.2 7.11
100
These calculated values of Orms for each Weather Group for a 25 calendar
year design life may be compared with the more conservative constant urm~
value of 2.91 ksi found according to Procedure 1.
To summarize, in neither of the two approaches (cons tant.amplitude
cyclic load or spectral loads distribution) did the yield strength of the material
affect the calculated fatigue stress allowable or lifetimes. For the exampleat hand, if the stresses are maintained always below Orm$ = 2.91 ksi
(Au = 9.5 ksi) the ship decking under consideration should have an indefinitelife. Increasing this level by about 10$70 to orm~ = 3.2 ksi, however, bringsthe expected life down to 2.89 calendar years. It is possible, however, to
operate at somewhat higher stress levels based on the more realistic spectral
load estimates. For realistic ship design lives the crack propagation periodNp is very small when compared with Ni. The calculations made for pur-poses of this example used the mean AI? - Nf relationship, not accounting for
scatter. Estimates of the scatter effect may, however, be made o“ the basisof Figures 54-59. Finally, it should be clear that if the designer has someparticular knowledge of the expected stress spectrum for the particular ship
under consideration, these can be used in a conventional linear cumulative
damage analysis (cf Section II. E. 1) to derive more reliable ship life estimates.
110
v. CONCLUSIONS AND RECOMMENDATIONS,-
A. Significance of Crack Initiation and Growth in HSLA Ship Steels
This study has been concerned with the factors which
influence crack initiation and subcritical crack growth in conventional mild
steel and in high-strength low-alloy (HSLA) primary and secondary cargo
ship structure exposed to typical sea environments. Under normal operating
conditions the structural components of interest experience a low-frequency,narrow-band random dynamic response to the sea, Under conventional fabri-
cation techniques, the potential for crack initiation and subsequent propagation
exists almost exclusively in welded regions and their associated heat-affected
zones. This potential, in addition, is very sensitive to the quality of the
welding procedures and technique used during shipyard fabrication and onlyby scrupulous adherence to the strictest quality control measures can one
hope to avoid problems of crack initiation and propagation during in-service
operations.
For purposes of discussing the mechanics of the process,
the total number of load cycles-to-failure, Nf, has been assume dtobe com-
posed of Ni, the number of cycles required to initiate a crack, plus N , the
number of cycles needed to propagate tbe crack to some critical lengt %. It
was found that under conditions typical of service, cracks will usually initiate(if at all) in the welder HAZ, andthatby far the greatest portion of life is
spent in crack initiation: Ni/Np>>l. It is, however, impossible at the present
time to determine Ni directly for structural weldments, and recourse must
be made to the indirect determination Ni ‘Nf - Np, since both Nf and Np can
be measured to an acceptable level of confidence. It was found that Ni is not
sensibly affected by the strength level of the weldment under consideration,
but is more strongly influenced by the geometry of the detail (i. e., stress
concentrations), by the nature and distribution of the flaws introducedduring the we~d process, and by the operating stress levels.
The crack propagation rate likewise appears to be insen-
sitive to the strength level, although the role of residual and constraint stresses
is not entirely clear.NP ‘
the number of cycles required to carry an existing
crack from an initial length a. to a critical length acr, depends only upon the
applied stress range, and upon a. and a= themselves. Experience has also
7shown that the crack propagation rate, da dN, is greater in the parent material
than in either the weld or HAZ, and hence conservative design practice requires
that values of da/dN that are characteristic of the base metal should be used.
In assessing the combined effects of Ni and Np, the number
of cycles to failure, Nf, is found to be independent of yield strength at stresses
corresponding to lifetimes Nf z 5 x 10⁵ cycles. Virtually all cyclic life is
expended within this high-cycle regime. Thus, insofar as crack initiation and
111
subcritical crack propagation in ship steels are concerned, there is no
important benefit or penalty associated with yield strength. Indeed, HSLA
steels emerge as having no less fatigue resistance than mild steels, and the
benefits that accrue from using HSLA steels to withstand the static designloads with reduced structural section may be enjoyed without sacrifice.
HSLA steels may also be expected to possess enhanced fatigue resistance due
to greater ability to withstand tbe overload cycles which, while few in number,
do inflict increased fatigue damage on the structure.
The marine environment can, in some cases, severely
restrict the ability of welded structure to serve faithfully its intended pur-
pose. For example, it appears as though mild and HSLA ship steels (including
Q & T steels) are immune to stress corrosion cracking in marine environments,although the critical weld and heat-affected zones at this time can not be de-
clared sufficiently resistant to SCC to be ignored. A survey of the literature
concerned with corrosion fatigue suggests that below the threshold SCC level,
K aggress ive marine environments may have little or no effect cm the i-ateIscc’
of subcritical crack propagation. In this regime the mechanical variables,especially AK, frequency, and wave form, dominate. At working stresses
which place the crack tip above the K level, the environmental factors(temperature, humidity, thermochemf~;~y) share the same role of impor -
tance as the mechanical variables. Insufficient data are available at presentto include in the criterion provision for estimating the extent of the deleteriousenvironmental effects. Great care must therefore be exercised in using datafrom specimens tested in relatively inert environments for design of structures
exposed to aggressive marine environments, especially where corrosionfatigue at high-stress levels may be of concern.
Cathodic protection s ys terns can be effective in minimizing
corrosion, and can also be helpful in minimizing SCC and corrosion fatigue.
The one potential danger in cathodic protection s ys terns, bowever, is that
there is a potential for hydrogen-induced SCC in HSLA Q & T steels. Coatings,
in a variety of available types, are the most widely used protective systems
to prevent general corrosion, and can be effective against SCC and corrosion
fatigue if properly applied.
Using the proposed criterion, safe-life quality assurancecan be provided by either of two approaches. In the first approach, and themore conservative of the two, weldment stresses are maintained below the
endurance strength, leading to indefinite lifetimes. A somewhat less con-servative design philosophy emerges from the alternative procedure given,
in which a spectral loading distribution is assumed, and stress levels are
determined in accordance with the desired service lifetime. It does appear,
in general, that the stress level/lifetime tradeoff is an unrewarding one :
substantial sacrifices in design lifetime may he the price to be paid for modest
gains in operating stresses.
112
B. Priority Problem Areas
Several areas warranting investigation in order to improve theutility of, and confidence in, the proposed criterion are outlined below,
in descending order of importance to tbe criterion :
1. Expand Data Base of Fatigue Life of Welded Joints. A pro-gram to improve and expand on the inventory of data presented in Figures
54-59 needs to be undertaken, to include the effects of marine environments,
more joint types common to ship primary structure, and U. S. steel types
(the data in the criterion are all based on British specification steels). This
would mean gathering existing information from British Welding Institute,
and American organizations known to be working in this area currently,
where such data are not in the literature. Then, an experimental program
would be undertaken to fill in gaps.
2. SGC Properties of Ship Steels. There presently are no pub-
lished data on the SCC properties of the low-and high-strength alloy steels
and HAZS of interest to the purposes served by this report. An experimentalprogram needs to be undertaken to confirm or qualify the assumption of the
criterion that SCC can be ignored.
3. Effects of Residual Stresses Due to Welding on Subcritical
Crack Growth. The residual stresses which exist in welded coupon speci-mens are generally not as high as those found in actual structure due to the
lack of external (structural) ~onstraint. Fatigue life tests should be made
on coupons in which realistic residual stresses are present, to determinewhether the design data of Figures 54-59 are realistic. This experimentalwork would also serve to test the assumption that crack growth rate is inde-
pendent of R and depends only on Au ; this assumption may he invalid under
the wide range of minimum stresses present in actual welded structures.
This effort would also include ancillary studies to determine whether the
observed difference in crack growth rate in parent vis-a-vis weld material
is due to the difference in microstructure or to residual stresses.
4. Environmental Effects on Crack Growth Rate. Crack growth
data for low-and high-alloy steels need to be generated for R # O in aggres-
sive marine environments to test validity of current theories (such as Equa-
tion (6)), which do not account for R This needs to be done so that this
work can be included in the criterion. Also, tbe effect of frequency on
environmentally conditioned crack growth needs to be established for sinu-
soidal and random loading. The se effects are known to be important inhigher strength steels (such as the maraging steels).
,.
113
— -- ------ . .
5. Validation of Criterion. An experimental program should beorganized to “exercise!! the criterion, to ensure that it is capable of pro-
ducing correct prediction differentials between various ship steels. This
must be done to validate the general framework and to gain confidence in it.
6. Improved Design Loads Spectra. The spectral loading data
presented in Table 7 and carried on into Procedure 2 of the criterion are
drawn from incomplete records of a single ship. A research program
should be undertaken in which ship response data are generated for other
cargo vessels, and these results then condensed into design spectral load-
ing data as a function of ship length, loading condition, and seas traveled.
As a part of this study, the desirability and feasibility of generating “stan-
dardized” random crack growth data, to replace the sinus oidally-based
data of the Criterion, should be made. The purpose of this undertaking
would be to eliminate the step of calculating a “damage equivalence” be-
tween AU and U=mS , and simply reference bOth the 10ading and the weld-ment fatigue properties to the random sea/structural environment.
7. Generation of AKti and AKT Data. AKth and AKT data are
not available for relevant low- and high-strength steels , and this information
is needed in the criterion. An experimental program should be undertaken
to provide this information under a standard benign atmosphere, and under
various corrosive environments. Data thus obtained would also be used to
test the validity of the crack growth relation da/dN= (AK)2. 25, used in the
criterion, under various environments.
8. Cathodic Protection Effects. An experimental research
program needs to be conducted to determine the effects of various cathodic
protection systems on crack initiation and subcritical growth. Are either
or both regimes affected by cathodic protection? Ancillary to this investi-gation is the importance of determining whether or not SCC cracks are in
fact a source of initiation.
The areas of investigation outlined above are consideredto be of primary importance to qualifying the criterion, herein proposed
tentatively. In addition to these areas which are directly linked to the cri-terion, these are also ancillary technical questions that arise in connectionwith implementing the criterion. TWO of these are mentioned here.
The first question concerns the current practice andtechnology of weldment NDI as related to ship structures. The criterion
brought out the fact that the crack initiation process heavily dominates thepropagation process in ship loading environments. Inasmuch as the criterion
allows for some increase in working stresses over present practice, the
early detection of subcritically propagating cracks assumes even greater
importance. It should be determined whether current NDI technology andprocedures as applied to ship structure are adequate to enable full imple-
mentation of the criterion for HSLA steels.
I 14

The second area of related interest concerns thedevelopment of data and design guidelines for introducing crack arrest
devices in critical ship structural areas . These devices, in actual fact, ‘
consist of structural design principles such as structural reinforcement
techniques which will serve to retard or arrest dangerous subcritically -
propagating cracks.
115
1.
2.
3.
4.
5.
6.
7.
8.
VI. REFERENCES
Schijve, J. , “Significance of Fatigue Cracks in Micro-Rangeand Macro-Range, ,, FATIGUE cRACK PROPAGATION,
ASTM STP 415, 415-459, 1967.
Forman, R. G. , ,, Study of Fatigue Crack Initiation frOm Flaws
Using Fracture Mechanics Theory, !( Engineering Fracture
Mechanics, Vol. 4, No. 2, 333-345 (June 1972).
Barsom, J. M. , and McNicol, R. C. , “Effect of Stress Con-
centration on Fatigue-Crack Initiation in HY- 130 Steel, “
ASTM STP 559, American Society for Testing and
Materials, August, 1974.
Clark, W. G., Jr. , !,An Evaluation of the Fatigue Crack
initiation Properties of Type 403 Stainless Steel in Air
and Stream E~vironments, (, ASTM STP 559, American
Society for Testing and Materials, August, 1974.
Topper, T. H. , Wetzel, R. M. , and Morrow, J. , “Neuber’s
Rule Applied to Fatigue of Notched Specimens, “ Journal
of Materials, Vol. 4, 200-21J9 (1969).
Gowda, C. V. B. , Topper, T. H. , and Leis, B. N. , ‘rCrack
Initiation and Propagation in Notched Plates Subjected to
Cyclic Inelastic Strains, ,, MECHANICAL BEHAVIOR OF
MATERIALS: VOL. II - FATIGUE OF METALS, Proceed-
ings, International Conference on the Mechanical Behavior
of Metals, Kyoto, 187-198, 1971.
Manscm, S. S. , and Hirschberg, N. H. , “Crack Initiation and
Propagation in Notched Fatigue Specimens, “ PROCEEDINGS
OF THE FIRST INTERNATIONAL CONFERENCE ON
FRACTURE, Sendai, Vol. 1, 479-498, 1966.
Barsom, J. M. , !!Fatigue Behavior of Press ure-Ve SSels, “
WRC Bulletin No. 194, Pressure vessel Research
Committee, May 1974.
116
9.
10.
11.
12.
13.
14.
15.
16.
17.
18.
19.
Barsom, J. M., “Fatigue-Crack Propagation in Steels of Various
Yield Strengths, ” Transactions of the ASME, Journal of ,.
Engineering for Industry, Vol. 93, 1190-1196 (1971).
Gurney, T. R., ,, The Effect of Mean Stress and Material yield
Stress on Fatigue Crack Propagation in Steels, “ MetalConstruction and British Welding Journal, vol. 1 , 91-96(1969).
Crooker, T. W., “The Role of Fracture Toughness in Low-
Cycle Fatigue Crack Propagation for High-Strength Alloys, “
NRL Report 7422 (1972).
Tomkins, B., “Fatigue Crack Propagation - An Analysis, “
Philosophical Magazine, vol. 18, 1041-1065 (1968).
Crooker, 1. W., ,,Ba~i= Concepts for Design Against Structural
Failure by Fatigue Crack Propagation, “ NRL Report 7347(1972).
Miller, G. A., “The Dependence of Fatigue Crack Growth Rateon the Stress Intensity Factor and the Mechanical Proper-
ties of Some High Strength Steels, “ ASM Transactions
Quarterly, Vol. 61, 442-448 (1968).
Plumbridge, W. J., “Review: Fatigue Crack Propagation in
Metallic and Polymeric Mater ials, ” Journal of Materials
Science Vol. 7, 939-962 (1972).—,
Heiser, F. A., and Hertzberg, R. W. , l’Anisotropy of Fatigue
Crack Propagation, “ “Transactions of the ASME, JouI.nalof Basic Engineering, VO1.93, 211-217 (1971).
Crooker, T. W. , ,,~ffect of ren3i0n-Compression Cycling On
Fatigue Crack Growth in High-Strength Alloys, “ NRL
Report 7220 (1971).
Donahue, R. J. , Clark, McI. H. , Atanmo, P. , Kumble, R. ,
and McEvily, A. J. , “Crack Opening Displacement and
the Rate of Fatigue Crack Growth, “ International Journal
of Fracture Mechanics, vol. 8, 209-219 (1972).
Hickerson, J. P. , and Hertzberg, R. W. , “The Role of Mechanical
Properties in Low-Stress Fatigue Crack Propagation, “
Metallurgical Transactions, vol. 3, 179-189 ( 1972).
117
>-. . .
:i.
22.
23.
24.
25.
26.
27.
28.
29.
30.
Gurney, r. R. , FATIGUE OF WELDED STRUCTURES, Cam-
bridge University Press, Cambridge, U. K. (1968).
Lawrence, F. V. and Munse, W. H. , ‘(Fatigue Crack Propaga-tion in Steel Weldments., ,, SAE paper 720267, January 10-
14 (1972).
Burdekin, F. M. , Harrison, J. D. , and Young, J. G., !t The
Effect of Weld Defects with Special Reference to B. W. R.A.
Research, “ Institute of Welding Non-Destructive Testing
Conference, London, February, ( 1967).
Savage, W. F. and Szekeres, E. S. , IfTechnical Note: A Mecha-
nism for Crack Formation in HY-80 Steel Weldments, “
Welding Research Supplement, 94-96 ( 1967).
Warren, W. G. , “Fatigue rests on Defective Butt Welds, ‘1Welding Research Supplement, Vol. 6, ( 1952).
Newman, R. P. , ,,Tbe Influence of Weld Faults on Fatigue
Strength with Reference to Butt Joints in Pipe Lines. “
Transactions of the Ins titute for Marine Engineering,
Vol. 68, 153-172 (1956).
Newman, R. P. and Gurney, T. R. , ‘rFatigue “Tests on Plain
Plate Specimens and Transverse Butt Welds, ‘1 British
Welding Journal, Vol. 6, 569-594 (1959).
Yamaguchi, I. , ‘Tereda, Y. , and Nitta, A. , “On the Fatigue
Strength of Steels for Ship Structures, ‘I International Insti-tute of Welding Documentation, No. XIII, 425 ff ( 1966).
Sanders, W. W., Derecho, A. i?. , and Munse, W. H. , “Effect
of External Geometry on Fatigue Behavior of Welded
Joints, “ Welding Research Supplement , Vol. 30, ( 1965).
Signes, E. G. , Baker, R. G. , Harrison, J. D. , and Burdekin,
F. M. , llFactors Affecting the Fatigue Strength Of Welded
High Strength Steel, !! British Welding Journal, vol. 14,
108-116 (1967).
Lawrence, F. V. and Radziminski, J. B. , “Fatigue CrackInitiation and Propagation in High-Yield-Strength Weld.-Metal, “ Welding Research Supplement,
445-452 (1970).
118
vol. 35,
31.
32.
33.
34.
35.
36.
37.
38.
39.
40.
41.
Maddox, S. J. , ,, Fatigue ~rack propagation in Weld Metal
and HAZ, “ Metal Construction and British Welding
Journal Vol. 2 , 285-289 ( 1970).—$
Watanabe, M. , Nagai, K. , Otsuka, A. , and Nagata, Y. , llA
Study of Fatigue Strength in Weld Metal and H. A. Z. of
Mild Steel Weld, “ Journal of the Japanese Welding Society,Vol. 36, 55-63 (1967).
Ohta, S. , “Fatigue Properties in Notched Steel Plates and the
Effect of Welding on Them, “ Quarterly Report of theRailway Technical Research Institute, Vol. 11, 79-83 (1970).
Watanabe, M. , Yoshino, Y. , Watanabe, I. , and Aoki, H. ,
Variation in the Positions Where the Welded Joints of
HT 80 Failed in the Fatigue Test, “ Transactions of the
Japanese Welding Society, Vol. 39, 98-104 ( 1970).
Dowse, K. R. , and Richards, C. E. , ‘lFatigue Crack Propaga-
tion Through Weld Heat Affected Zones, “ Metallurgical
hansactions, Vol. 2, 599-603 (1971).
Akaike, H. , and Swanson, S. R. , 11LOad History Effects in
Structural Fatigue, r, Proceedings of the 15th Annual
Meeting of the Institute of Environmental Sciences,Anaheim, April 2.0-24, 1969, pp 66-77.
Palmgreen, A. , “Die Lebensdauer von Kvgellagern, VereinDeutscher Ingenieure Zeitschrift, Vol. 68, 339 ff (1924).
Miner, M. A. , ,,Cumu~a~ive Damage in Fatigue, “ Transactions
of the ASME, Journal APP lied Mechanics, vol. 67, pp A159-
A164, [1945).
Saunders, S. C. , “A Review of Miner’s Rule and Subsequent
Generalizations for Calculating Expected Fatigue Life, “
M. I.S. Report No. 45, Boeing Company, December, (1970)
Miner, M. A. , llE~ timation of Fatigue Life with particular
Emphasis on Cumulative Damage, “ in: METAL FATIGUE,
Edited by G. Sines and J. L. Waisman, McGraw-Hill BookCompany, Inc. , pp 278-289 (1959).
O’Neill, M. J. , “A Review of Some cumulative Damage Theories, “Aeronautical Research Laboratory, Structures & Materials
Report 326, Melbourne, June 1970.
119
.——
42.
43.
44.
45.
46.
47.
48.
49.
50.
51.
52.
Gucer, D. E. and Capa, M. , “Frequency Effects in Low-Cycle
Fatigue, ,, Metallurgical Transactions, Vol. 1, 3075-3081,
November, 1970.
Garden, A. E. , !!~ib~iOgr~phy of tbe Literature on Multiaxial
Stress Fatigue, “ Report No. MH-67-AEC-2, College Of
Engineering, University of Alabama.
Marin, J. , MECHANICAL BEHAvIOR OF ENGINEERING MATE-
RIALS, Prentice-Hall, Englewood Cliffs, 204-214 (1962).
Blatherwick, A. A., and Viste, N. D., “Cumulative Damage
Under Biaxial Fatigue Stress, “ Materials Research and
Standards, Vol. 7, No. 8, 331-336, August 1967.
Havard, D. G., and Topper, T. H., ,, Biaxial Fatigue of 1018
Mild Steel at Low Endurance, “ Proceedings of the First
International Conference on Pressure Vessel Technology,Delft, ASME, 1267-1277, 1969.
Miles, J. W., ,,on SEructura I Fatigue Under Random LOading) “
Journal of Aeronautical Sciences. vol. 21, 753-762 (1954).
Crandall, S. H., and Mark, W. D. , RANDOM VIBRATION IN
MEcHANICAL SYSTEMS, Academic Press, New York,112-125, 1963.
Madayag, A. F. , (Ed. ), METAL FATIGUE: THEORY AND
DESIGN, John Wiley & Sons, Inc. , New York, Chapter 8,
(1969).
Judy, R. W. , Jr. , and Goode, R. J. , “Stress COrr OsiOn Crack-ing of High Strength Steels and Titanium Alloys, “ WeldingResearch Supplement, September, 1972, pp 437 S-445S.
Reinoehl, J. E. and Boyd, W. K. , “The Use of Slow Strain Rate
Experiments in Evaluating Resistance to Environmental
Cracking, “ Specialist Meeting on Stress Corrosion TestingMethods, AGARD Conference Proceedings No. 98, January,1972, pp 299-302.
phelp~, E. H. , ,1A Review of the Stress Corrosion BehaviOr Of
Steels with High Yield Strength, “ Proceedings of Conference
on Fundamental Aspects of Stress Corrosion Cracking,
pp 398-410, National Association of Corrosion Engineers,Houston, 1969.
120
53.
54.
55.
56.
57.
58.
59.
60.
61.
62.
63.
Brown, W. F., Jr. , and Srawley, J. E. , Plane-Strain CrackToughness Tes ting of High-Strength Metallic Materials, , -ASTM STP 410, 1966.
Brown, W. F. , Jr. , ed. , Fracture Toughness Testing and Its
Applications, ASTM STP 381, 1965.
,, Te~tative Method of rest for Plane-Strain Fracture roughness
of Metallic Materials, !! ASTM De*ignatiOn E399-70T.
Brown, F. G., ,,Metal~ and Corrosion, “ Machine Design,
January 18, 1968, pp 165-173.
Logan, H. L. , IISCC in Low-Carbon Steel, “ Physical Metallurizv
of Stress Corrosion Cracking, AIME, Inter science, 1959,pp 341-372.
Sutcliffe, J. M. , Fessler, R. R. , Boyd, W. K. , and Parkins,
R. N., Stress Corrosion of Carbon Steel in Carbonate
Solutions, “ Corrosion, VO1. 28, No. 8, October, 1972,pp 313-320.
Mazille, H. , and Uhlig, H. H. , llEffect of Temperature and SOme
Inhibitors on SCC of Carbon Steels in Nitrate and AlkalineSolutions, “ Corrosion , Vol. 28, No. 11, November 1972,pp 427-433.
Engell, H. J. , and Baumel, A. , “The Electrochemical Mechanism
of Stress Corrosion Cracking of Mild Steel, “ Physical Metal-lurgy of Stress Corrosion Cracking, AIME Inter science, 1959,
pp 341-372.
Sandoz, G. , ,, The Effects of Alloying Elements on the Suscepti-
bility to Stress Corrosion Cracking of Martens itic Steels in
Salt Water, “ Metallurgical Transactions, Vol. 2, April1971, pp 1055-1063.
Schmitt, R. J. , and Phelps, E. H. , ,lCc, rrosion Performance Of
Constructional Steels in Marine Applications, “ Journal of
Metals vol. 22, 47-55 (1970).—,
Novak, S. R. , llEffe~t of pkM,tiC strain On ‘IS, CC of HY-80,
HY- 130(T) and 12 Ni - 5 Cr - 3 Mo Steels, ” U. S. Steel
Applied Research Laboratory Report No. 39. 018-007(20),January 1, 1968.
121
64.
65.
66.
67.
68.
69.
70.
71.
i.e-~ie, H. P. , and Loginow, A. W. , “A Comparison 01 Lhe
Stress Corrosion Behavior of Some High-Strength Steels, “ ,
U. S. Steel Applied Research Laboratory Report No. 39.001-001(2), July 15, 1968.
Smith J. H. , and Davis, J. A. , ,,skre~~-corrosion and Hydr Ogen
Embrittlement Cracking Behavior of HY-80 and HY - 130
Weld Metals, “ U. S. Steel Applied Research LaboratoryReport No. 89,021-024(4) (B-63304), 40.001-021(8),
January 8, 1971.
Townsend, H. E. , Jr. , l)Re~istance of High Strength Structural
Steel to Environmental Stress Corrosion Cracking, “ Stress
Corrosion Cracking - A State of the Art, ASTM STP 518,American Society for Testing and Materials, 1972, pp155-166.
Smith, J. H., and Rolfe, S. T. , ,,Effects of Welding POS itiOn On
the K1~cc of HY - 130(T) Weld Metals, 1’ U.S. Steel Applied
Research Laboratory Report No. 39. 018- fJ16(7) (a-ORD-NP-3) (B-23204), January 1, 1968.
Lmvenberg, A. L. , et al, !!High-str~ngth, Low-Alloy Steel Weld-
ments, !! First Technical Report, SSC - 199, NAVSEC COntract
NOO024-67-C5416, Ship Structure Committee, August 1969,
p 25.
Duquette, D. J. , “A Review of Aqueous Corrosion Fatigue, “Corrosion Fatigue : Chemistry, Mechanics, and Micro-
structure, Proceedings of Conference held at the Universityof Connecticut, June 14-18, 197 1; National Association of
Corrosion Engineers, 1972, pp 12-24.
McEvily, A. J. , and Wei, R. P. , “Fracture Mechanics andCorrosion Fatigue, It Corrosion Fatigue : Chemistry,
Mechanics, and Microstructure, Proceedings of Con-ference held at the University of Connecticut, June 14-18,
1971; National Association of Corrosion Engineers, 1972,
pp 12-24.
Gallagher, J. P. , and Sinclair, G. M. , “Environmentally
Assisted Fatigue Crack Growth Rates in SAE 4340 Steel, “Journal of Basic Engineering,
Vol. 91, 1969, p 598.
122
Transactions of the ASME,
72. Wei, R. P. , a~d Landes, J. D. , “Correlation Between Sustained ,Load and Fatigue Crack Growth in High Strength Steels, “
Materials Res~arch and Standards, ASTM, V~l. 9, July,
1969, p 25.
73.
74.
75.
76.
77.
78.
79.
80.
81.
82.
Gallagher, J. P. , ,, Corrosion Fatigue Crack Growth Rate Beha-
vior Above and Below K1~cc in Steels, “ Journal of Materials,
Vol. 6, 1971, p 941.
Crooker, T. W. , and Lange, E. A. , “The Influence of Salt Wateron Fatigue Crack Growth In High Strength Structural Steels, “
Effects of Environment and Complex Loading His tory on Fatigue
~ ASTM STP 462, 1970, p 258.
Crooker, T. W. , and Lange, E. A., “Corrosion Fatigue CrackPropagation of Some New High Strength Structural Steels, “
Journal of Basic Engineering, Transactions of the ASME,
Vol. 91, 1969, p 570.
Gallagher, J. P. , “Corrosion Fatigue Crack Growth BehaviorAbove and Below K1~cc, ,, NR, L Report 7064, Naval Research
Laboratory, Washington, D. C. , May 1970.
Barsom, J. M. , ,, Effect of Cyclic Stress Form on COrr OsiOn
Fatigue Crack Propagation Below K1~cc in a High Yield
Strength Steel, “ Ibid. , pp 424-436.
Barsom, J. M. , Sovak, J. F. , and Imhof, E. J. , Jr. , “CorrosionFatigue Crack Propagation Below K1~cc in Four High-Yield
Strength Steels, “ Technical Report 89.02 1-024(3), United
States Steel Applied Research Laboratory, Monroeville,Pennsylvania, December 14, 1970.
Gould, A. J. , ,!~fluence Of temperature on Severity of COrros iOn
Fatigue”, Engineering, vol. 141, 1936, p 495.
Cornet, I. , and Golan, S. , “Influence of Temperature on Corro-sion Fatigue (t, Corrosion, Vol. 15, 1959, p 262 t.
Sopwith, D. G. , and Cough, H. J., “Some Comparative Corros ion-Fatigue Tests Employing Two Types of Stressing
Action, “ Journal of the Iron ar, d Steel Institute, T/cl. 127,h~(). 1, pp 301-3.35, 1~3.
Gould, A. J. , “C, rr,sion >’~c,gue of Steel Under Ass;n..:ric
Stress in Se:, Wxter, “ .~,,urnal ,,f the Iron and Stec,..—Institute, ‘io~. 101, Part 1, pp 11-10, January l-i .
.- —....—.—. .
83. Duquette, D. J., and Uhlig, H. H., ItThe Critical Reaction Rate
for Corrosion Fatigue of O. 1870 Carbon Steel and the Effect
of pH, “ Transactions of the ASM, Vol. 62, 1969, pp 839.845.
84. Brown, B. F. , I,Concept of the Occluded Corrosion Cell, “
Corrosion, Vol. 26, August 1970, pp 249-250.
85. Duquette, D. f., and Uhlig, H. H. , ‘lEff~ct of Dissolved oxygenand NaCl on Corrosion Fatigue of O. 187, Carbon Steel, ‘I
Transactions of the ASM, Vol. 61, 1968, pp 449-456.
86. Lee, H. H., and Uhlig, H. H. , “Corrosion Fatigue of Type
4140 High Strength Steel, “ Metallurgical Transactions,
Vol. 3, November 1972, pp 2949-2957.
87. Evans, U. R. and Simnad, M. T. , “The Mechanism of Corrosion
Fatigue of Mild Steel, “ Proceedings of the Royal Society,
vol. 188, 1947, p 372.
88. Brown, B. F., ,, Stress Corrosion and Corrosion Fatigue of High
Strength Steels, “ (Source not identified on document),
pp 91-102.
89. Brown, B. F. , Corrosion Fatigue in Naval Structures, “ Corrosion
90.
Fatigue : Chemis try, Mechanics, and Microstructure, Pro-
ceedings of Conference held at the University of Connecticut,June 14.18, 197 1; National Association of Corrosion Engineers,
1972, pp 25-29.
Endo, K. , and Komai, K. , ,,corro~ion Fatigue Strength of a Steel
Under Controlled Potential and pH Values, “ Proceedings of
the 13th Japanese Congress on Materials Research , Tokyo,
Japan, September, 1969, pp 162-166.
91. Hudgins, C. M., Jr. , et al, ,, The Effect of Cathodic PrOtectiOn On
the Corrosion Fatigue Behavior of Carbon Steel in Synthetic
Seawater, “ Journal of Petroleum 17echnology, March, 1971,
pp 283-293.
92. Crooker, T. W. , and Lange, E. A. , ,,Fatigue Crack Propagation
in a High-Strength Steel Under Constant Cyclic Load with
Variable Mean Loads, ,, NRL Report 6805, November 29, 1968.
93. Kline, R. G. , “Application of Higher Strength Steels to Great Lakes
Vessels, “ Marine technology, pp 273-287, July 1966.
124
94. Phelps, E. H. , and Loginow, A. W. , ‘rStress Corrosion Of Steel
for Aircraft and Missiles, “ Corrosion, Vol. 16, p 325, ‘July, 1960.
95.
96.
Robinson, R. B. , and Uzdarwin, R. J. , “Investigation Of Stress-
Corrosion Cracking of High-Strength Alloys, Aerojet General
Report 2092, Contract DA-04 -495 -OR D-3069, August, 1961.
Gurney, r. R. , and Maddox, S. J. , $lDeterminati On of Fatigue
Design Stresses for Welded Structures from an Analysis
of Data, “ Metal Construction and British Welding Journal,vol. 4. No. 11, 418-422, November 1972.
97. Frost, N. E. , and Denton, K. , “The Fatigue Strength of Butt-
Welded Joints in Low-Alloy Structural Steels, “ BritishWeldin~ Journal, bol. 14, No. 4, 157-163, April 1967.
98. Pook, L. P. , “Fatigue Crack Growth Data for Various Materials
Deduced From the Fatigue Lives of Precracked Plates, ‘I
i. : STRESS ANALYSIS AND GROWTH OF CRACKS, ASTM—STP 513, American Society for Testing and Materials,Philadelphia, 106-124 (1972).
99. Bucci, R. J. , Clark, W. G. , and Paris, P. C. , ‘lFatigue Crack
Propagation Growth Rates Under a Wide Variation of 4K for
an ASTM a517 Grade F( T-1) Steel, “ ~: STRESS ANALYSISAND GROWTH OF CRACKS, ASTM STP 513, American
Society for Testing and Materials, Philadelphia, 177-195 (1972
100. Parry, M. , Nordberg, H. , and Hertzberg, R. W. , “Fatigue Crack
Propagation in A5 14 Base Plate and Welded Joints, ‘1 Weldinp
Research Supplement, Vol. 51, 485s-490s, October 1972.
101. Lawrence, F. V. , ,,Estimation of Fatigue-Crack Propagate On
Life in Butt Welds, “ Welding Research Supp lement, Vol. 52,
No. 5, 212s-220s, May 1973.
102. Imhof, E. J. , and Barsom, J. M. , !NFatigue and Corrosion-
Fatigue Crack Growth of 4340 Steel at Various Yield
Strengths, “ in: PROGRESS IN FLAW GROWTH AND
FRACTURE TOUGHNESS TESTING, ASTM STP 536,
American Society for Testing and Materials, Phila-
delphia, 182-205 (1973).
103. Paris, P. C., and Sib, G. C., “Stress Analysis of Cracks, “~ FRACTURE TOUGHNESS TESTING AND ITS APPL1:
CATIONS, ASTM STP 381, American Society for restingand Materials, Philadelphia, 30-83 (1965).
125
104. ,lG~ide for Interpretation of Non-Destructive Tests for Welds in
Ship Hull Strut tures, 11SSC Report SSC-177, 1966.
105. Youshaw, R. A. , ,1A Guide for Ultrasonic Testing and Evalua-
tion of Weld Flaws, “ SSC Report SSC-213, 1970.
106. LeWi~, E. V. , et al., ‘,Load criteria for Ship Str UCkLIral Design, “——SSC Report SSC- 240, 1973.
107. Walters, I. J. , and Bailey, F. C. , ,! Results From Full-Scale
Measurements of Midship Bending Stresses on Three Dry
Cargo Ships, ‘( SSC Report SSC-209, 1970.
108. Hoffman, D. , Williamson, J. , and Lewis, E. V. , “Correlationof Model and Full-Scale Results in Predicting Wave Bending
Moment Trends, “ SSC Report SSC-233, 1972.
109. Hoffman, D. , van Hooff, R. , and Lewis, E. V. , ‘fEvaluation of
Methods for Extrapolation of Ship Bending Stress Data, “
SSC Report SSC-234, 1972.
This Appendix consists of basic background information in support
of the main report text. This Appendix should be consulted as a reference
to the reader who needs a more introductory exposition in able to study the
main report effectively.
A. METALLURGY OF SHIP sTEELS AND WELDMENTS
B. SHIP ENVIRONMENT
1. Loads Acting on Ships
2. Corrosion and Corrosion Protection of
Steels in Marine Environments
c. BASIC STRUCTURAL, FABRICATION AND NDT
ASPECTS
D. ELEMENTS OF FRACTURE MECHANICS
REFERENCES
Z?f2
A-1
A-10
A-10
A-16
A-20
A-23
A-31
127
A. METALLURGY OF SHIP STEELS AND WELDMENTS
The most common structural materials for shipbuilding are the car-
bon steels having 0.2% offset yield strengths in the neighborhood of 32,000psi. However, there are many higher strength steels currently in use, and
others under consideration, by shipbuilders desirous of producing lighter,
stronger, and more economical ships. Tbe bigher strength steels of cur-
rent interest possess yield strengths as high as 100 KSI, and many have
been classified, along witb the more familiar medium steels, by the several
classifying organizations (American Bureau of Shipping (ABS), Lloyd’s Reg-
ister of Shipping, and Det Norske Veritas). As can be seen in the following
Classification Tables, requirements for ship steels generally have been
based upon considerations related to strengtb and brittle fracture resistance.
It is useful here to discuss the most common shipbuilding steels,
ABS (1973) classes A, B, and C.(l) Tbe class distinction is based primarily
on plate thickness, all plates of 1/2 in. and below being in Class A. Thinner
steel plates have greater notch toughness and lower nil ductility transitiontemperatures than do thicker plates rolled from the same melt. Class B
includes plates over 1/2 in. and up to 1 in. , inclusive. Class C containsplates over 1 in. and up to 2-in. thickness. Since both decreased carbon
and increased manganese lower the brittle-ductile transition temperature,
Classes B and C are restricted regarding the carbon and manganese con-tent, as noted in Table I. The other steels in the Table are used in some-
what smaller quantities, although it should be pointed out that grades CS
and E are intended primarily for applications where superior notch tough-
ness is required in certain specially designed strakes. It can be seen from
the Tables that most of the ship steels are killed or semi-killed, in order
to promote grain refinement and to minimize microcracks caused by blow-holes, through the addition of deoxidizing elements such as silicon and
aluminum. Again, this is a procedure designed to improve notch tough-
ness, strength, and workability.
The use of higher strength steels for major structural components
in large merchant ships is increasing, especially for the more highly
stressed members of the hull girders. This serves primarily to keep the
extreme-fiber stress within permissible limits without resorting to ex-
tremely thick plates, which often are excessively heavy and difficult to
fabricate. In Tables II and III, ABS (1973) higher strength steels are
summarized with regard to chemical and mechanical specifications. Asin the case of the ordinary medium steels, the ABS bigher- strength classi-
fication is based on thickness. Special heat-treatment requirements for
higher strength steels are listed in Table IV. At this point, it may be
appropriate to describe the normalizing process. Normalizing consists
of heating iron base alloys above the upper critical temperature range,
128
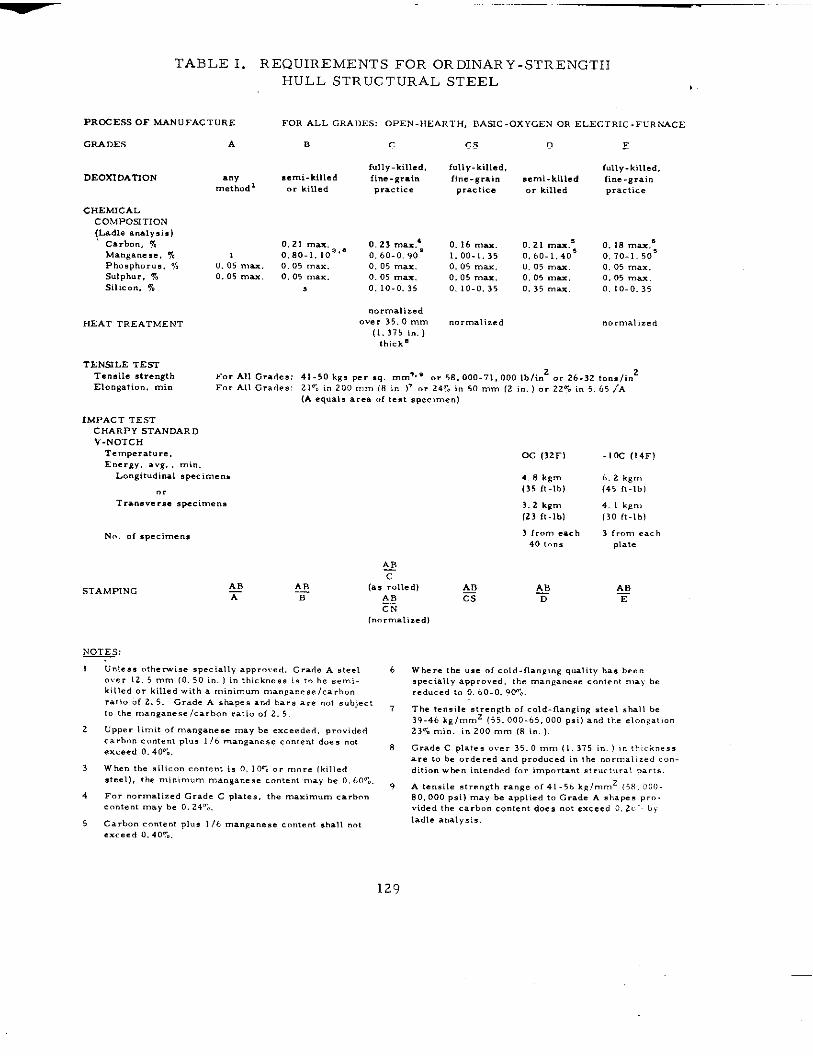
—
TABLE I. REQUIREMENTS FOR ORDINARY-STRENGTH
PRCCESS OF MANUFACTURE
GRADEs
DEOXI DATION
CHEMICAL
COMPOSITION
(,Ladle znaly, is)
Carbon, %
Manganese, %
Ph.a, phorum, 7,
Sulphur, %
Sllico., %
HEAT TREATMENT
TEN5LE TEST
Tensile .tve.gth
Elongation, .ni.
A
anymethod 1
0.05 max.
0.05 max.
HULL STRUCTURAL STEEL
FORALL GRAuE5: OPEN-tlEAR~H, DAsc.Ox YGENORELEcTRIC.rIJRNACE
E c
fully-killed,
semi-!+lled fine-grain
or killed practice
0,21 max 0.23 max.’z
0,80.1.10’” 0, 60-0.90
0, 05 max. 0. 05 max.
0, 05 ,“... 0.05 max.
, 0. 10.0.35
normalized..., 35.0 mm
(1,375 in. ]
,hickn
Cs
fully-killed,
fine-grain
practice
O. 16 ,max
1.00.1.35
0.05 max.
0.05 max.
0.10-0.35
D
.emi. k,lled.? killed
0.21 ma.;
0,60-1.40
0.05 mu.
0.05 max.
0.35 mu.
E
fully-killed,
f,ne- grain
P..ctic.
0. 18 max.;
0, 70-1.50
0, 05 max.
0.05 r“?. x
O. 10.0.35
normalized
IMPACT TEST
CHARPY STANDARD
V-NOTCH
Temperature,
Energy, avg. min.
Longitudinal speci m..,
I’. rA11 Grades: 41-50k8s P., ,q. rnmv, q or 58, 000.71, 000 lb/in2 or 26.32 tmM/i”z
For A1l Gcades: 21r0 in200.nm (8 l..)- or24e. in 501mm (2 i.. )or22@o in5. lJ5JA
(A equal, .,,s of test specimen]
STAMPING
&B
c
(.s rolled) LBLB Cs
CN
(.. rrn.liz.dl
as:
1“ Unless othewi, e specially a~~roved, Grade A steel
. . . . 12. 5 mm ,0. 50 in. ) !“ thick,, ,,. i, to be semi.
killed or k!lled with a minimum .>an Ranese/c. rb..
ratie of 2.5. Grade A shapes and bars are not s. bje. t
to the n,angane, elcarbon ratio of 2.5.
2 uPP.. ii”Ii, of “mnaa.e= r“aYbe exceeded, providedcarb”” c,,.,,., plus 1/6 r“a!, ganese content doe, no,
exceed 0. 40%.
3 When the silicon .s.,.., i, 0, 10., or ,,,.,, (killed
s,..1], the rni. i.mum rna.ga.ese content m-y be 0. 60.,.
4 For normalized Grade C PI.,.,, the maximum carbon
CO.,.,,, may be O. 24%.
5 Carbon content plus 1/6 ,nan~ar,e. e con,.., ,!,.11 n.,
●xceed 0. 40?..
6
7
8
9
OC (32F)
4.8 kg”,
(35 [t-lb)
3.2 kg”,
(23 [t-lb)
3 fro., ca<h
40 ,..,
.lCG (14F)
Where the u,. .Fcold. flaqing quality ha, E,,..
,Pecially approved, the manganese <on, en! may be
reduced t. 0. 60-0. !Or..
The tensile strength of cold- llang{r, g steel shall be
39-46 k~l”u”z [55,000-65,000 psi] and the elanpat’on
23% min. i. 200 mm (8 in. ).
Grade C plateg over 35.0 mm (1,375 i.. j ,. th!ckncss
=,, to be ordered and produced in the “., ”,,l, .,,1 con.
ditto nwhrn inte.ded for important ,!,.., >,,.) parts.
A tensile stren~th ,.”B. .,[ 41-56 kR/”, r”2 <58, 000.
80.000 osil ma. be anolied ,. Grade A ,hane, .,..
vialed th’e c“arbc,’n . . ...’.. doe, mot exceed 0: 2,, -1 b,
ladle analysis,
129
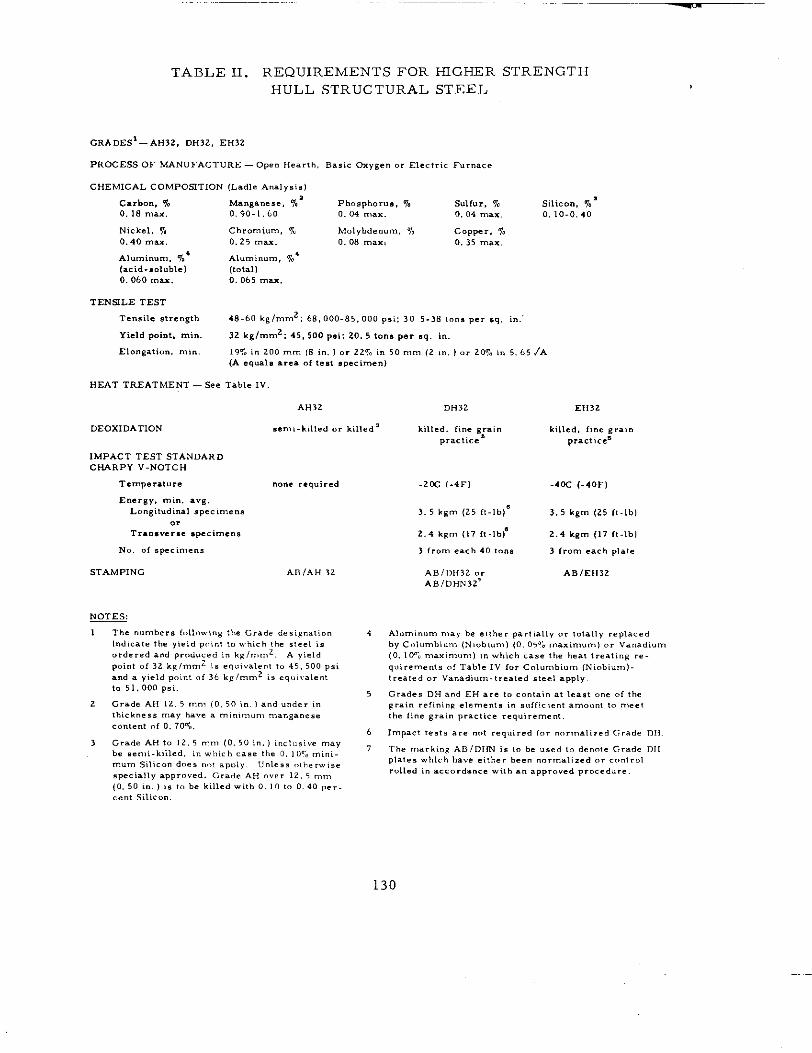
TABLE II. REQUIREMENTS FOR HIGHER STRENGTH
HULL STRUCTURAL STEEL
CP.ADES’-AH32, DH32, EH32
pROcEss OF hfANUFACTURE -Open Hearth, Basic tiygen or EIectr{c Furnace
CHEM1 CAL COMPOSITION (Ladle Analys%s)
Carbon, % Mal.gane,e, %’ Phosphorus, 7, sulfur, 7, Silicon, %S0. 18 max. 0,90.1,60 0.04 max. 0.04 “,,.. 0. 10.0.40
Nickel, % Chromium, % Molybdenum, 7, copper, %
0.40 max 0.25 mm. 0.08 max, 0.35 max.
Aluminum, %’ Aluminum, %’
(acid-soluble) (total]
0.060 max. 0.065 max.
TENSILETESTTen, !le strenxth 48-60 kg/mrn2; 68,000.85,000 Psi, 30 5-38 to”, P., ,q. in.’
Yield point, mim. 32 kglrnmz; 45,500 p-i; 20.5 ton. per ❑q. in.
[email protected], ml”. 19% ;“ 200mm (8 in. ] or 22% in 50 ”,,,, (2 in, ,., 207. in 5..55/A
(Aeq.alsarea of test specimen)
HEAT TREATMENT—See Table IV
AH32 DH32 EH32
DEOX1DATION .emi. k;lied or killed’ killed, 1{.. g~a;n killed, fine grain
IMPACT TEST STANDARD
CHARPY V-NOTCH
TwT,erat .,. . . . . rquired
Energy, min. avg.
Lcmg:tud inal SF.ec; mens
.*
Transverse specimens
No, of SVci”, ens
STAMPING AB/AH 32
~
1
z
3
The number, [c)llwi”g the Grade de, i~na,,. n
indicate the yield point to which the steel is
ordered and Produced in kg/m”,2. A yield
Point .=1 32 k~lmmz is .q. i.alent te 45,500 ~,i
and a yield point .f 36 kg/mm2 is equivalent
to 51,000 Psi.
Gr=de AH 12.5 r“”> (0, 50 i“. ) and under <,,
,hickn e,, may h.., a r“i”i,,, um r“m,, gane, e
.0”,, ”, “f 0. 70%.
Grade AH to 12.5 m.> (0,50 in.1 <nclusive may
b. se”, i-k ftled, in which . . . . the 0. 10To mini.
mum Silicon does .,>, apply. Unless c,iherwisc
sPeciaIly apprnwd, Grade AH over 12, 5 mm
(0.50 kn. )i, tobe killed with O.10to 0. 40,...
cent sill . . . .
4
5
b
,
P=.,,.=” p,..,:..’
.2CC (.4F) -40C (.40F)
3.5 kg,n (25 f,-lb]’ 3.5 kgr” (25 it-lb)
2.4 kg”, (17 ft.lb? 2.4kgm (17 ft.lb)
3 from each 40 ton, 3 from each plate
AB/1)H32 .,, AB/EH32
ABIDHN32°
Alurn{.um may be e,the, partially . . totally replaced
by C<>lumb(um (N, obtum) (0. 05% “m.xirnurnl or Vanadium
[0. 10nk r“ax:mur”] inwh!ch c... the heat treatin~ r..
q.ire~=.t~ or Tabl. IV r., Col”~bi”~ (Nt.b i.”,)-tcea!<d or Vanadiu,n. treat. d steel aPPly,
Grades DH and EH . . . to ..,.,. !. at 1,.,, one OC the
8rai. .eft.iw element. in .,~ffi.,.nt .m~..t ,. m.=tthe fine grain practice req. irem..,.
lr”Pact test, are ““t required f., normalized Grade “H.
The rmrki. g AB/DHN {a t. be . ..d t. demte C,. ade “H
plates which have eithev been normalized or control
rolled in accordance with a“ aPPr,, ved procedure.
130
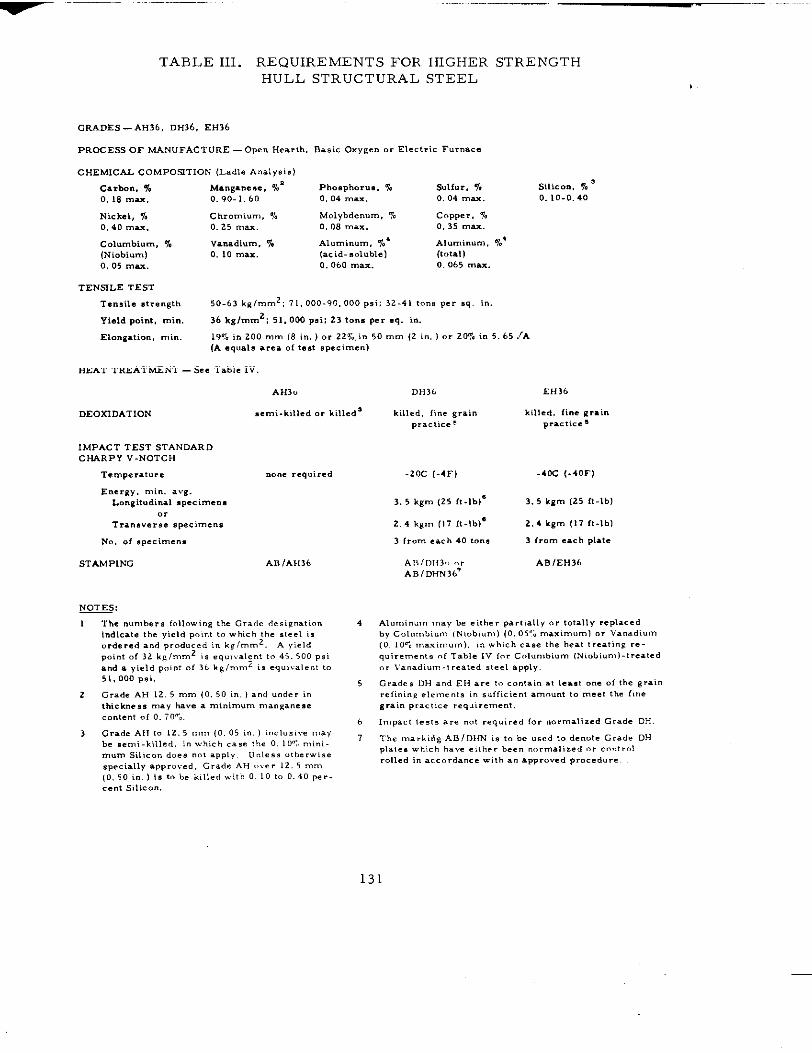
~ .—.. —
TABLE III. REQUIREMENTS FOR HIGHER STRENGTHHULL STRUCTURAL STEEL
GRADES -AH36, DH36, EH36
PROCESS OF MANUFACTURE -OPen Hearth, B*,ic Oxysen or Electric Fur”=..
CHEMICAL COMPOSITION (Ladle Anal)’s is)
Catbe., 70 [email protected], %= Phoaph.arum, % Sulfur, % Silicon, % ‘
0. 18 max. 0.90.1.60 0.04 “,mx. 0,04 max. 0.10-0.40
Nickel, % Chromium, % Molybdenum, % C.ppe., %
0.40 max. 0.25 mu. 0.08 max. 0,35 max.
c.hxnbkn, % vamdhm. % Alumi”utn, %’ Aluminum, %“
(NioV,.rn) 0. 10max. (acid-soluble) (total)
0,05 max. O. 060 max. 0.065 mm.
TENSILE TEST
Tensile strength 50.63 kg(mmz; 71,000-90,000 psi; 32-41 tone per q in.
Yield point, min. 36kg/rnrn2; 51.000 psi: 23to”s Pe. r ❑q. :..
Elongation., min. 19%iI1200rnm (8 i.. )or227.. in 50rnm (2 in. )or20%in5.65JA
(Aequalsarsa of test SPecimen)
HEAT TREATMENT-See Table IV.
AH3”
DEOXIDATION semi-killed or killed’
lMPACT TEST STANDARD
CHARPY V-NOTCH
Temperature rmne required
Energy, rn!n. avg.
Longitudinal .peci.nena
.,
Transverse speck?).”,
No. .f .pecimen*
STAMPING ABIAH36
-s :
1 The “umber, f“llmv!ng the Grade des!enat!”n
indicate the yield F.”i”t to which the steel ts
ordered amd produced in kg/”u”2. A yield
r.oint of 32 kglrmmz is equivalent to 45.500 ~si
and a yield Point of 3. k&!/n, m2 t, equivalent to
51.000 Psi,
2 Grade AH 12.5 mm (0. 50 in. ) and under in
thickness may have a rni. knum manganese
.0.,.., of 0. 70-,.
3 Grade AH to 12.5 .,”> (0. 05 i“. ) :..l.,; . . r,>.)’
be semi-killed, in~hich case the 0. 10?, mini-
mum Silicon does not apply. Unless “*he rwi$e
specially approved, Grade AH ,0.er 12. 5 mm
(0, 50 i., I is to be k;lled ,v!th O. 10 to 0.40 per.
=ent Silicon.
4
5
6
7
DH36 EH36
killed, fine grdn killed, fine grain
prac~:.= 5 P.=.,,== s
.20C [.4F) .4CC (.40F)
3.5 kg.” (25 It-1 b)” 3.5 kgrn (25 {t-lb)
2.4 kg,,, (17 ft.lb)” 2.4 kgm (17 ft-lb)
3 from ●ach 40 ton, 3 [ram each plate
A1\/D113c, “, AB/EH36
ABIDHN36’
Aluminum may be either Partially or totally replaced
by Columbium (Niebi. ml (0, 05”; “m.x!rnuml or vanadium
(O. 10WO“,?..,.,.”?), i“ which case the heat lreati”8 re -
q.~~.m..~~ “f Table lV f., C“l””,bi”m (Ni.hi””,)-~~=at~dor Vaoadium -treated ,teel aPP1y.
Gvades DH and EH are to contain at least one of the grain
re[inin R ,1.,.,., s in sufficient amr,un, to meet the fine
8..,. P,=c~~ce req.,.e~=nt.
lmPact tests are not required [or normalized Grade DH.
The “uarki!is AB/DHT4 ,, to be used to demote Grade DH
plates which have either been normalized or control
rolled in accordance with an approved Procedure
131
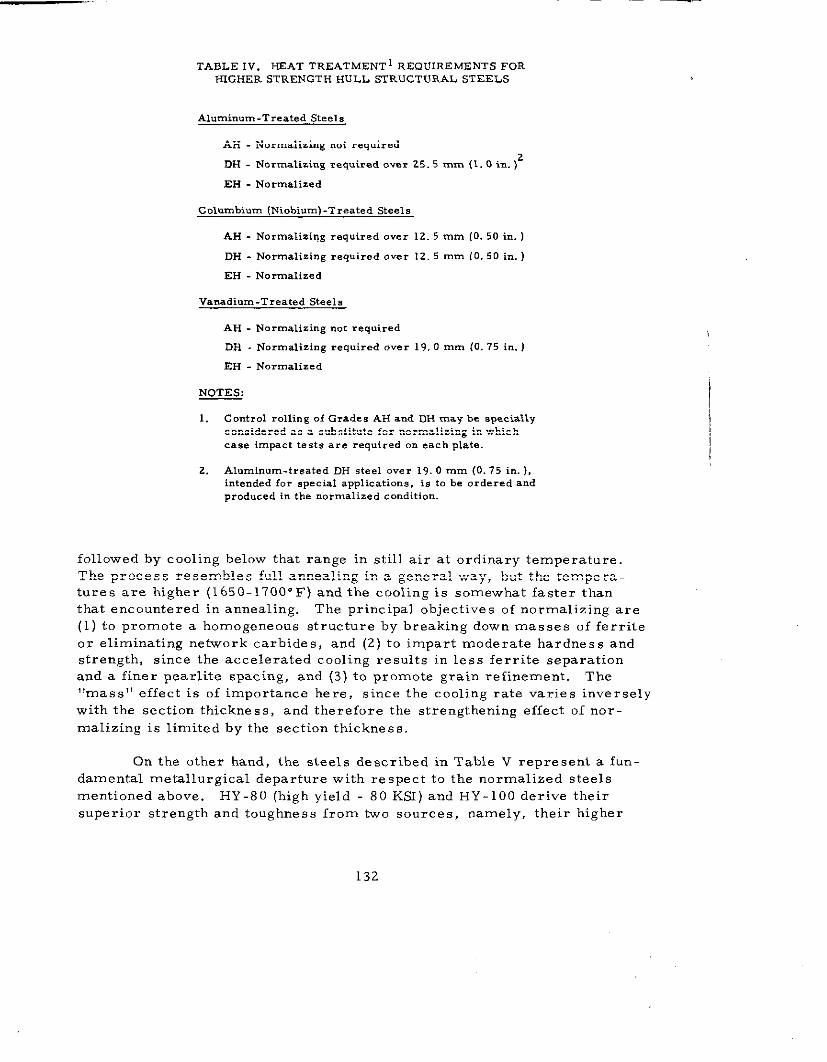
TABLE IV. HEAT TREATMENT 1 REQUIREMENTS FORHIGHER STRENGTH HULL STRUCTURAL STEELS
Alurnin. m-Treated Steels
AH - Normalizing not required
DH - Normali.ir.g required over 25.5 mm (1. 0 in. )2
EH - Normalized
Columbium (Niobium) -Treated Steels
AH - Normalizing required over 12.5 mm (0. 50 in. )
DH - N.mmalizinS required over 12.5 mm (0. 50 in. )
EH - Normalized
Vanadium-Treated Steels
AH - Normalizing mat required
DH Normalizing required over 19, 0 mm (0. 75 in. )
EH - Normalized
~
1.
2.
C ontml rolling of Grades AH znd DH may be speciallyconsidered as a substitute for normalizing in whichcase impact tests are required on each plate.
Alurninwn -treated DH steel over 19.0 mm (0. 75 in. ),intended for special applications, is tobe ordered and
produced in the normalized condition.
followed by cooling below that range in still air at ordinary temperature.
The process resembles full annealing in a general way, but the tempera-tures are higher (1650 -1700e F) and the cooling is somewhat faster than
that encountered in annealing. The principal objectives of normalizing are
(1) to promote a homogeneous structure by breaking down masses of ferrite
or eliminating network carbides, and (2) to impart moderate hardness and
strength, since the accelerated cooling results in less ferrite separationand a finer pearlite spacing, and (3) to promote grain refinement. The,!ma~~r! effect is of importance here, since the cooling rate varies inversely
with the section thickness, and therefore the strengthening effect of nor-
malizing is limited by the section thickness.
I
On the other hand, the steels described in Table v represent a fun-
damental metallurgical departure with respect to the normalized steels
mentioned above. HY-80 (high yield - 80 KSI) and HY-1OO derive their
superior strength and toughness from two sources, namely, their higher
132
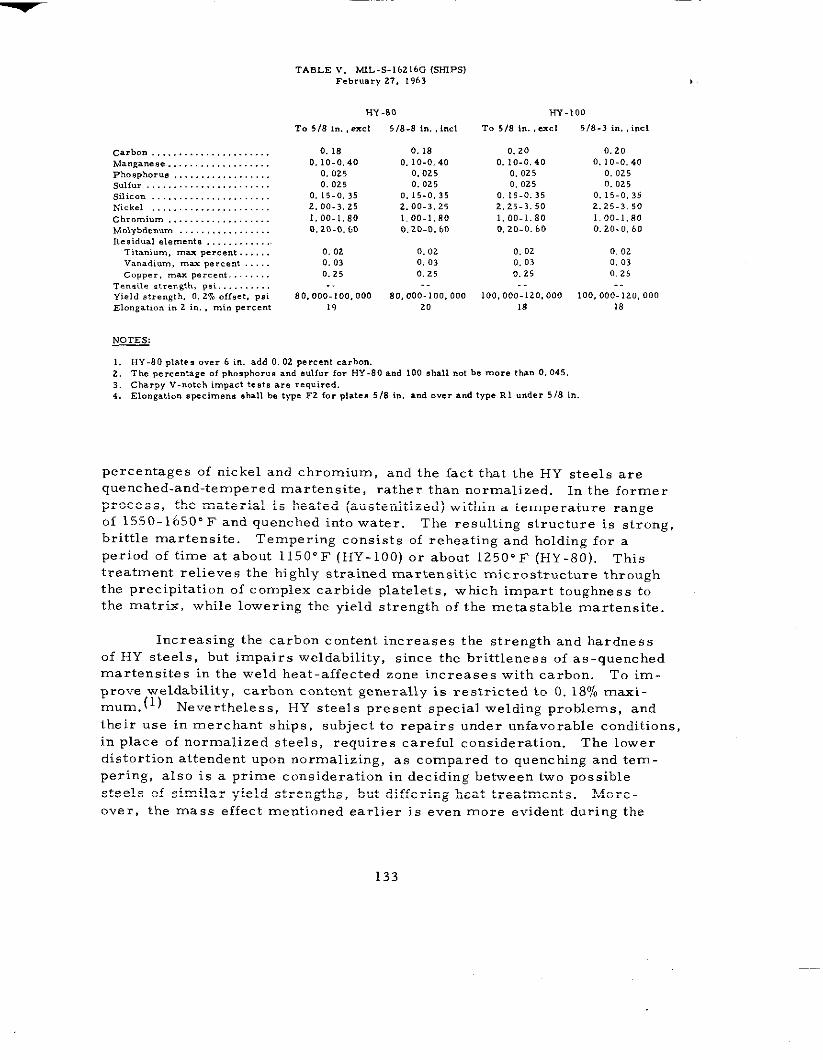
_.
TABLE v. MIL. s.16216G (sHIPsj
FebruaPy 27, 1963
IIY-80 HY-1OO
To 5/8 in, , ,..1
0.180.10.0.40
0.0250.025
0.15.0.352.00.3.25
1.00.1.80
0.20.0.60
0.02
0, 03
0.25
. .
80.000.100, 000
19
5/8.8 in, incl
0.180.10.0.40
0, 0250.025
0.15.0,35
2.00-3.25
1.00-1,80
0.20.0.60
0.020.030.25. .
80,000-100,000
20
T. 5/8 in, ,CXC1
0.200.10-0,40
0.0250.025
0.15.0.35
2.25-3.50
1.00.1.80
0.20-0.60
0.02
0.03
0.25
5/8-3 in, , incl
0.20
0.10.0.40
0.025
0.025
0.15-0,35
2.25.3.50
1,00.1.80
0.20.0.60
0.02
0.03
0.25
100,000-120,000 100,000.120,00018 18
1. HY-80 plates over 6 in, add O. 02 percent carbon,
2. The percentageof phosphor.. and e.lf.r for HY-80 and 100 @hall not be more than O. 045.3. Charpy v-notch impact test. are required,4, Elongation specimen. ehall be type F2 for plate. 5/8 in. and .ver and type R1 u.der 5/8 in.
percentages of nickel and chromium, and the fact that the HY steels arequenched-and-tempered marten site, i-athe r than ~ormalized, In the former
process, the material is heated (austenitized) within a temperature rangeof 1550 -1650SF and quenched into water. The resulting structure is strong,brittle marten site. Tempering consists of reheating and holding for aperiod of time at about 1150” F (HY-1OO) or about 12500F (HY-80). This
treatment relieves the highly strained marten sitic microstructure through
the precipitation of complex carbide platelets, which impart toughness to
the matrix, while lowering the yield strength of the metastable marten site.
Increasing the carbon content increases the strength and hardness
of HY steels, but impairs weldability, since the brittleness of as-quenchedmarten sites in the weld heat-affected zone increases with carbon. To im-prove weldability, carbon content generally is restricted to O. 1890 mmi -
mum.(l) Nevertheless, HY steels present special welding problems, and
their use in merchant ships, subject to repairs under unfavorable conditions,in place of normalized steels, requires careful consideration. The lowerdistortion attendent upon normalizing, as compared to quenching and tem-
pering, also is a prime consideration in deciding between two possible
steels of similar yield strengths, but differing heat treatments. More-
over, the mass effect mentioned earlier is even more evident during the
133
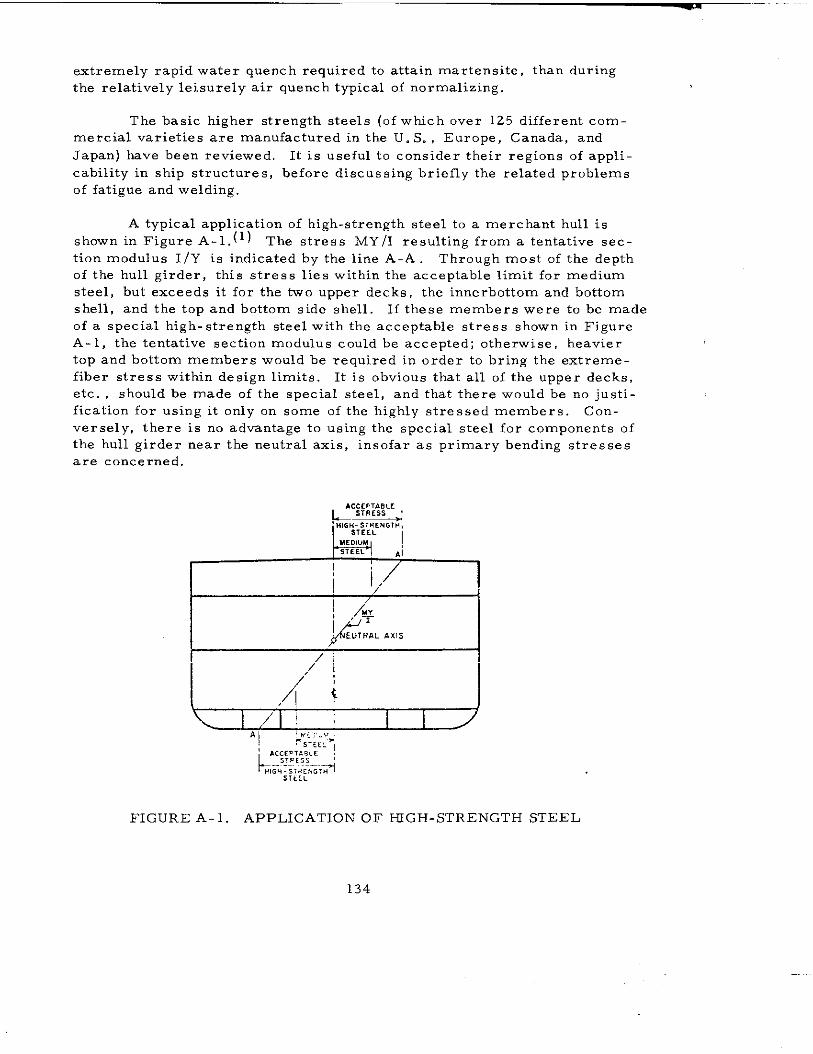
extremely rapid water quench required to attain marten site, than duringthe relatively leisurely air quench typical of normalizing.
The basic higher strength steels (of which over 125 different com-
mercial varieties are manufactured in the U. S. , Europe, Canada, and
Japan) have been reviewed. It is useful to consider their regions of appli-
cability in ship structures, before discussing briefly the related problems
of fatigue and welding.
A typical application of high-strength steel to a merchant hull is
shown in Figure A-l.(l) The stress MY/I resulting from a tentative sec-
tion modulus I/Y is indicated by the line A-A Through most of the depth
of the hull girder, this stress lies within the acceptable limit for medium
steel, but exceeds it for the two upper decks, the innerbottom and bottom
shell, and the top and bottom side shell. If these members were to be made
of a special high-strength steel with the acceptable stress shown in Figure
A- 1, the tentative section modnlns could be accepted; otherwise, heavier
top and bottom members would be required in order to bring the extreme-
fiber stress within design limits. It is obvious that all of tbe upper decks,
etc. , should be made of the special steel, and that there would be no justi-
fication for using it only on some of the highly stressed members. Con-
versely, there is no advantage to using the special steel for components ofthe hull girder near the neutral axis, insofar as primary bending stresses
are concerned.
I ! A&k=AL‘x), I
FIGURE A-1. APPLICATION OF HJGH-STRENGTH STEEL
134
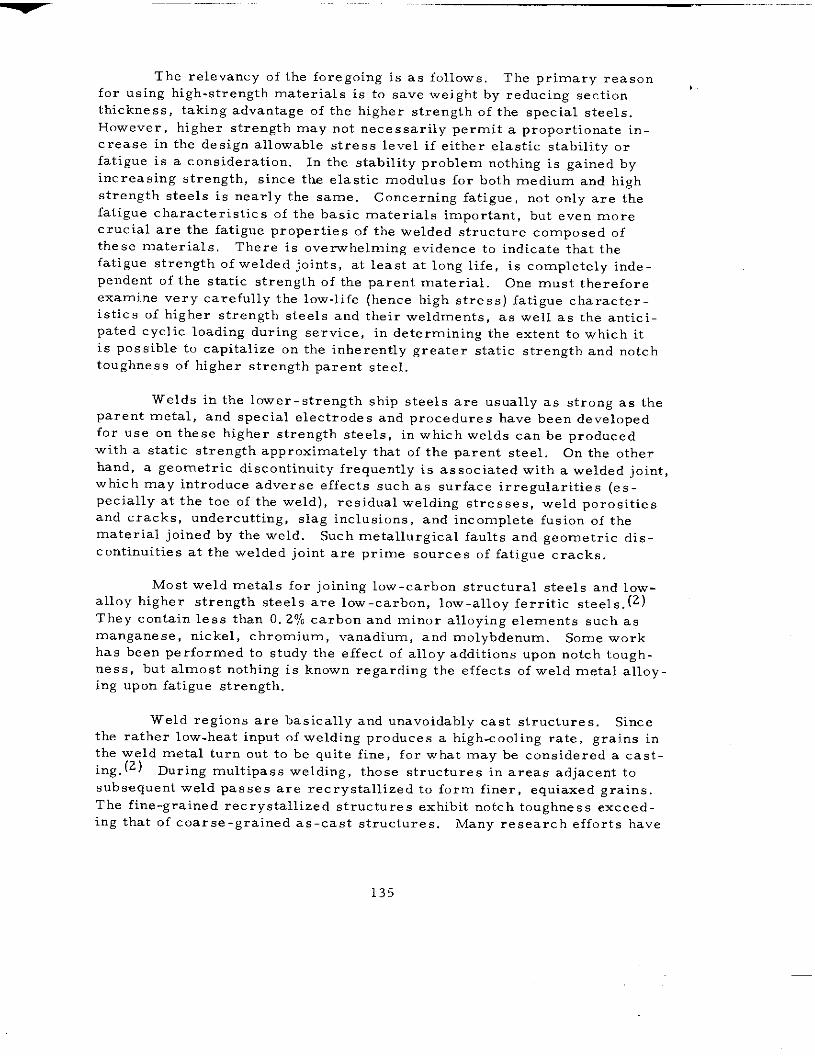
The relevancy of the foregoing is as follows, The primary reasonfor using high-strength materials is to save weight by reducing section
thickness, taking advantage of the higher strength of the special steels.
However, higher strength may not necessarily permit a proportionate in-crease in the design allowable stress level if either elastic stability or
fatigue is a consideration. In the stability problem nothing is gained byincreasing strength, since the elastic modulus for both medium and high
strength steels is nearly the same. Concerning fatigue, not only are thefatigue characteristics of tbe basic materials important, but even more
crucial are tbe fatigue properties of the welded structure composed of
these materials, There is overwhelming evidence to indicate that thefatigue strength of welded joints, at least at long life, is completely inde-
pendent of the static strength of the parent material. One must therefore
examine very carefully the low-life (hence high stress) fatigue character-istics of higher strength steels and their weldrnents, as well as the antici-
pated cyclic loading during service, in determining the extent to which it
is possible to capitalize on the inherently greater static strength and notch
toughness of higher strength parent steel.
Welds in the lower-strength ship steels are usually as strong as theparent metal, and special electrodes and procedures have been developedfor use on these higher strength steels, in which welds can be producedwith a static strength approximately that of the parent steel. On the other
hand, a geometric discontinuity frequently is associated with a welded joint,
which may introduce adverse effects such as surface irregularities (es-
pecially at the toe of the weld), residual welding stresses, weld porositiesand cracks, undercutting, slag inclusions, and incomplete fusion of thematerial joined by the weld. Such metallurgical faults and geometric dis -
continuities at the welded joint are prime sources of fatigue cracks.
Most weld metals for joining low-carbon structural steels and low-alloy higher strength steels are low-carbon, low-alloy ferritic steels,(2)
They contain less than 0, 27, carbon and minor alloying elements such as
manganese, nickel, chromium, vanadium, and molybdenum. Some workhas been performed to study the effect of alloy additions upon notch tough-
ness, but almost nothing is known regarding the effects of weld metal alloy-
ing upon fatigue strength.
Weld regions are basically and unavoidably cast structures. Sincethe rather low-heat input of welding produces a high-cooling rate, grains in
tbe weld metal turn out to be quite fine, for what may be considered a cast-ing, (2) During multipass -welding, those structures in areas adjacent tO
subsequent weld passes are recrystallized to form finer, equiaxed grains.
Tbe fine -grained recrystallized structures exhibit notch toughness exceed-
ing that of coarse -grained as-cast structures. Many research efforts have
135
been aimed at establishing welding procedures which would produce weld
metals having a favorable microstructure. However, there has been little
information published concerning quantitative relations between weld micro -
structures and notch toughness, and again almost nothing regarding control
of fatigue crack initiation and growth by weld-region micro structural vari-
ation.
Of the some 40 welding processes which are employed commercially,
only the following are the most important in fabricating hull structures:(3)
(1) Shielded metal-arc process,
(2) Submerged-arc process,
(3) Gas metal-arc process,
(4) Vertical welding process (electroslag and electrogas),
The shielded metal-arc and submerged-arc processes are far and
away the most commonly used for ship hull fabrication. However, the other
two have been used increasingly in recent years. Although any of the aboveI
procedures can be used in joining bigher-strength steels, it is important
that the process be of the low-hydrogen type, in order to avoid underbead
cracking caused by hydrogen embrittlement. Further, the high rates ofheat input associated with the electroslag or electrogas processes some-
times cause excessive degradation in the heat-affected zone of the base
metal, to the extent that reheat treatment of the weldment may be required
for quenched. and.tempered steels. The guidelines for welding high-strength
steels are extremely stringent, and have previously been reviewed exhaus -tively(4) and summarized excellently(3) regarding crucial points. Proper
electrode selection and welding procedures cannot be overemphasi.zed. Thehandling of low-hydrogen electrodes and flux deserves special mention,
since hydrogen-induced cracking is a possible consequence of less than
extreme care according to specified practices, and avoiding the problemdemands high competence on the part of the welder. Satisfactory welding
requires a compromise between (1) a sufficiently high preheat and inter-
pass temperature to remove moisture and relieve weld-shrinkage stresses,
and (2) a sufficiently low preheat, weld heat input, and interpass tempera-ture to provide a high weldment quench rate and thereby maintain strength
and toughness.
Finally, it should be pointed out that the ABS has not yet adopted
requirements for specifications for weld metals. The American Welding
Society has proposed specifications in terms of notch toughness, (2) but
again this does not bear on the question of fatigue resistance.
136
B. SHIP ENVIRONMENT
Ship design is largely dependent upon the environment the SKIP will
experience in service. Strength requirements differ for various serviceconditions. For example, a ship structure de signed for smooth-water ser-
vice may be inadequate to withstand wave -induced stresses the ship would
encounter in the ocean. Ship design also may be significantly influencedby the corrosivity of the water in which the ship will operate. Criteria
established for design of a Great Lakes vessel would likely be unsuitable
for design of an ocean-going vessel because of the higher corrosivity of
salt water and salt water atmospheres.
A short discussion of the various types of loadings experienced by
ships and of the corrosion and corrosion protection of steels in marine en-
vironments is given below. These discussions are brief and general in nature.
For detailed treatments, the reader is referred to authoritative references
on these subjects. (5-7)
1. Loads Acting on Ships
Longitudinal Loading. A ship is a deformable body that floats
on the surface of the sea. In still water, a ship is subject to upward buoyancy
forces and downward gravity forces, e. g. , hull weight, payload, machinery
and equipment, fuel, etc. Figure B-1 illustrates these forces acting on a ship
which is divided into five sections by water-tight bulkheads. Within each sec -
tion the forces may be considered to be evenly distributed; weight forces are
indicated by downward arrows on the deck and buoyancy forces are indicatedby upward arrows on the bottom. The difference between weight and buoyancy
forces on each section is represented by the heavy central arrows; a plus sign
indicates an excess buoyant y force and a negative sign indicates excess weight.
The buoyancy and weight forces balance each other for the ship as a whole,
but a point-to-point balance, as would be the case for a uniformly loaded,homogeneous floating body, does not exist. If the ship were cut at the four
bulkheads, each of the sections would float at a different draft, as indicated
in Figure B-2. These upward and downward shearing forces tend to changethe shape of the ship’s hull. If the hull is represented as a beam with a plane
of vertical symmetry, bending moments and longitudinal stress produced hy
the shearing forces may be calculated by the principles of structural mechanics.
When a ship is at sea, waves will produce greater and varying
differences between weight and buoyance and, as a result, generally greater
bending moments and correspondingly greater bending stres ses will be gen-
erated. A ship centered on the c,rest of a wave produces tensile stresses inthe deck and compressive stresses in the bottom; under such loading the shipis said to be “hogging. “ A ship centered on the trough of a wave produces
—
137
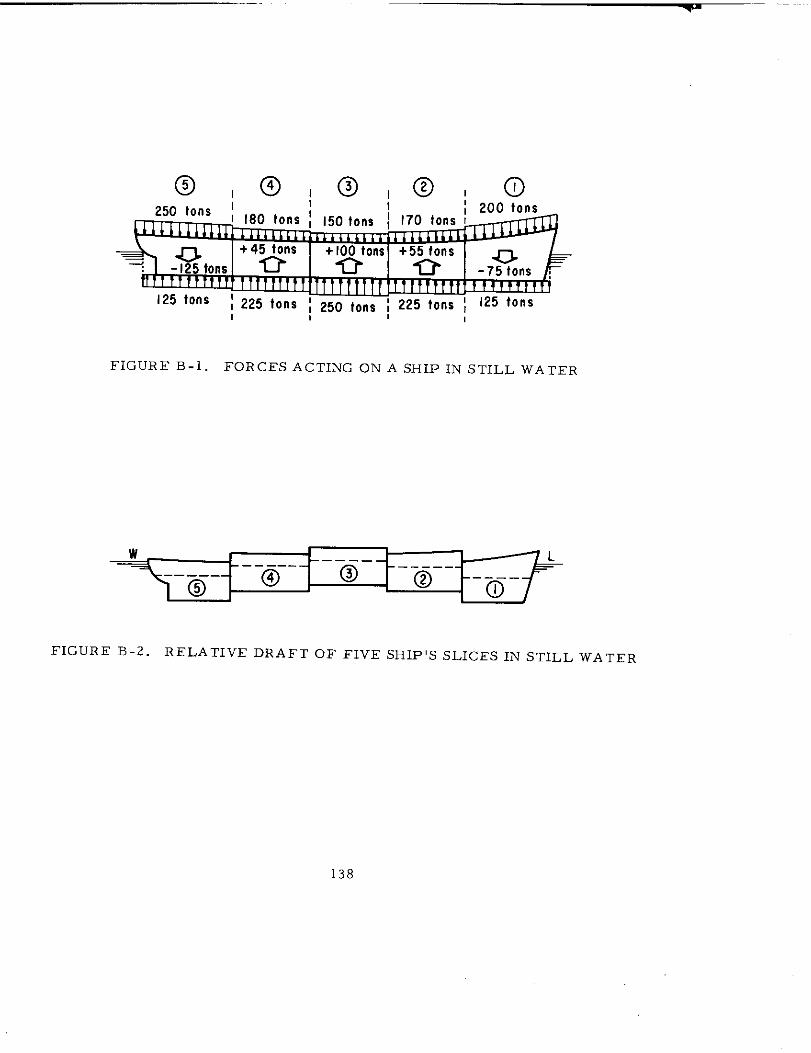
al @l@, @lo
1 1 I
F1GUR3? B-1. FORCES ACTING ON A SHIP IN STILL WATER
w————.
—— ___
0. @
FIGURE B-2. RELATIVE DRAFT OF FIVE SHIPIS SLICES IN STILL WATER
138
—
compressive stresses in the deck and tensile stresses in the bottom; underthis loading the ship is said to be “sagging. “ These modes of bending are ,shown in Figure B-3. Buoyant sea forces acting on the ship are continu-
ously changing, subjecting the deck and bottom to successive stress rever-
sals as the ship passes from wave crest to wave trough. At any given time,assuming that the ship remains upright in the water, stresses across the
deck and bottom are fairly uniform, while stresses in the side shells vary
uniformly from zero at the neutral axis to the maximum values existing at
the deck and bottom, as indicated in Figure B-4. When a ship is heeled,
the position of the neutral axis may change, and the maximum stressesmay occur at the intersections of the side shells and the deck and bottom;
i. e. , at the greatest distance from the neutral axis. For this reason the
sheer strake and bilge plating on the deck and bottom must either be thicker
or made of higher strength material than the plating used in the side shells.
Figure B-3 illustrates the hogging and sagging conditions when bendingmoments are likely to reach maximum values. In either case, the bend-ing stresses will be greatest at the mid-length, and thicker or stronger
strake plating is therefore required amidships.
Because wave spectra are largely random and ships at sea en-
counter combinations of many sizes of waves, bending moments can only be
estimated. The usual basis for calculating the required strength of the ship’s
hull girder for standard loading is to assume that the ship is statically bal-
anced on a stationary standard wave with the cre st amidships for the hogging
bending moment and the trough amidships for the sagging bending moment.
The buoyancy curve is predicted on the following assumptions: (1) the waveis trochoidal in form; (2) the wave length is equal to the ship length, L;
(3) the wave height is equal to 1.1 /L, L/20, or some other standard height;
(4) the ship is perpendicular to the wave. The inadequaciess of this static
model are compensated for by supplementary empirical rules and safetyfactors developed by classification societies and governmental regulating
agencies.
Several attempts have been made to supplement the standard
static model by introducing concepts based on the fundamental laws of strut -tural dynamics, The most important is the “Smith Effect. “ One of the
basic assumptions in calculation of the bending moment on a ship is that
pressure in a trochoidal wave, and therefore buoyancy, is directly pro-
portional to the depth of the ship below the wave surface. The Smith effect
calls attention to the fact that centrifugal forces caused by the orbital mo-
tion of water in waves modify hydrostatic pressure gradients. AS a result
of the acceleration of water particles, and consequent changes in apparent
mass/weight, the water appears less dense than normal at wave crests
and more dense than normal at wave troughs. A more even distribution
of wave buoyancy results and both hogging and sagging moments are de-
creased. Neglect of the Smith effect will lead to overestimation of bend-ing moments. Similar effects occur in the weight distribution curve
139
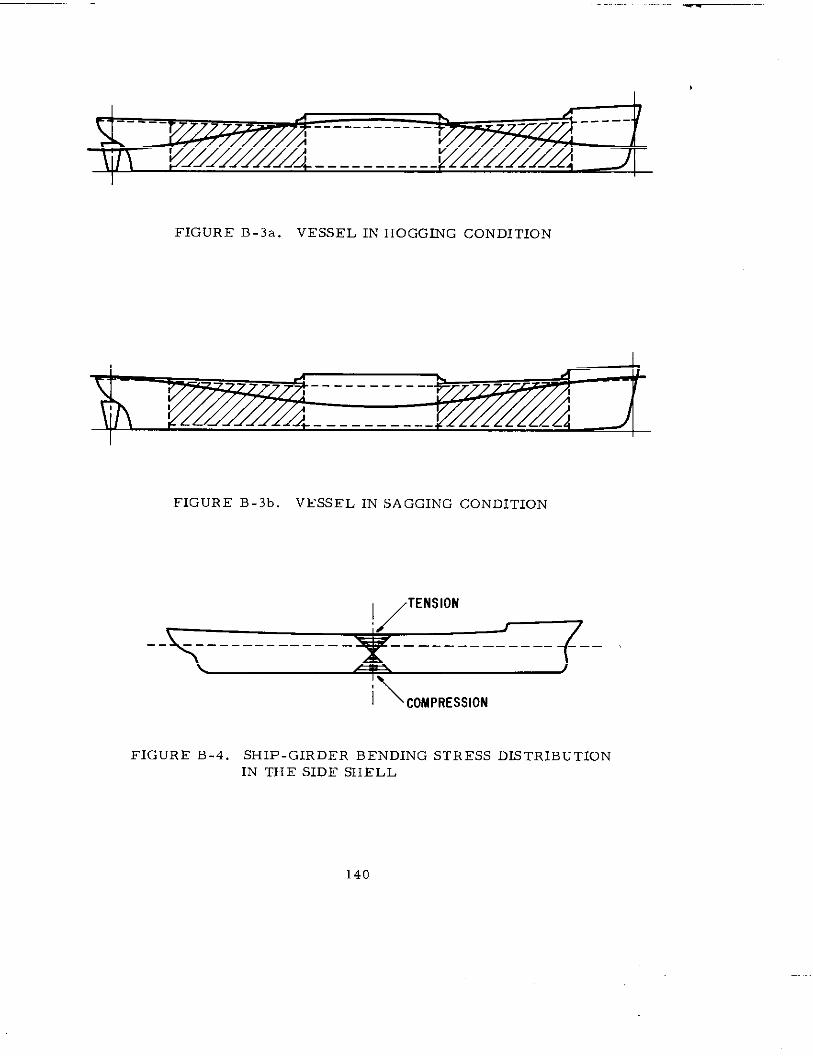
--- -
I-- — _________
FIGURE B-3a. VESSEL IN HOGGING CONDITION
-.--———--—-
FIGURJZ B-3b. VESSEL IN SAGGING CONDITION
yTENSION
— — _________
i\ COMPRESSION
FIGURI? B-4. SHIP-GIRDER BENDING STRESS DISTRIBUTION
IN THE SIDE SHELL
140
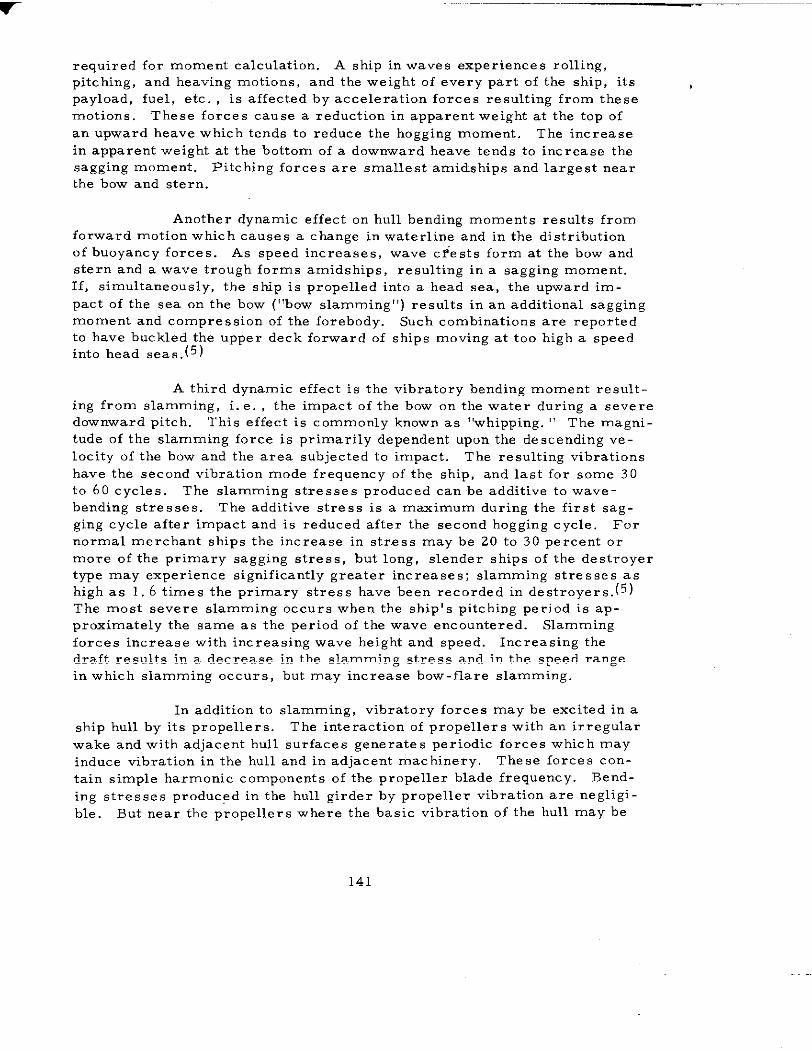
required for moment calculation. A ship in waves experiences rolling,
pitching, and heaving motions, and the weight of every part of the ship, itspayload, fuel, etc. , is affected by acceleration forces resulting from these
motions. These forces cause a reduction in apparent weight at the top of
an upward heave which tends to reduce the hogging moment. The increase
in apparent weight at the bottom of a downward heave tends to increase the
sagging moment. Pitching forces are smallest amidships and largest nearthe bow and stern.
Another dynamic effect on hull bending moments results fromforward motion which causes a change in waterline and in the distribution
of buoyancy forces. As speed increases, wave cf’ests form at the bow and
stern and a wave trough forms amidships, resulting in a sagging moment.
If, simultaneously, the ship is propelled into a head sea, the upward im-
pact of the sea on the bow (“bow slamming”) results in an additional sagging
moment and compression of the forebody. Such combinations are reportedto have buckled the upper deck forward of ships mo”ing at too high a speed
into head seas.(5)
A third dynamic effect is the vibratory bending moment result-
ing from slamming, i. e. , the impact of the bow on the water during a se”ere
downward pitch. This effect is commonly known as “whipping. “ The magni-
tude of the slamming force is primarily dependent upon the descending ve-
locity of the bow and the area subjected to impact. The resulting vibrations
have the second vibration mode frequency of the ship, and last for some 30
to 60 cycles. The slamming stresses produced can be additive to wave-
bending stresses. The additive stress is a maximum during the first sag-
ging cycle after impact and is reduced after the second hogging cycle. For
normal merchant ships the increase in stress may be 20 to 30 percent or
more of the primary sagging stress, but long, slender ships of the destroyer
type may experience significantly greater increases; slamming stresses ashigh as 1. 6 times the primary stress have been recorded in destroyers.(5)
The most severe slamming occurs when the ship’s pitching period is ap-
proximately the same as the period of tbe wave encountered. Slamming
forces increase with increasing wave height and speed. Increasing the
draft results in a decrease in the slamming stress and in the speed rangein which slamming occurs, but may increase bow-flare slamming.
In addition to slamming, vibratory forces may be excited in aship hull by its propellers. The interaction of propellers with an irregular
wake and with adjacent hull surfaces generates periodic forces whit h may
induce vibration in the hull and in adjacent machinery. These forces con-
tain simple harmonic components of the propeller blade frequency. Bend-
ing stresses produced in the hull girder by propeller vibration are negligi-
ble. But near the propellers where the basic vibration of the hull may be
141
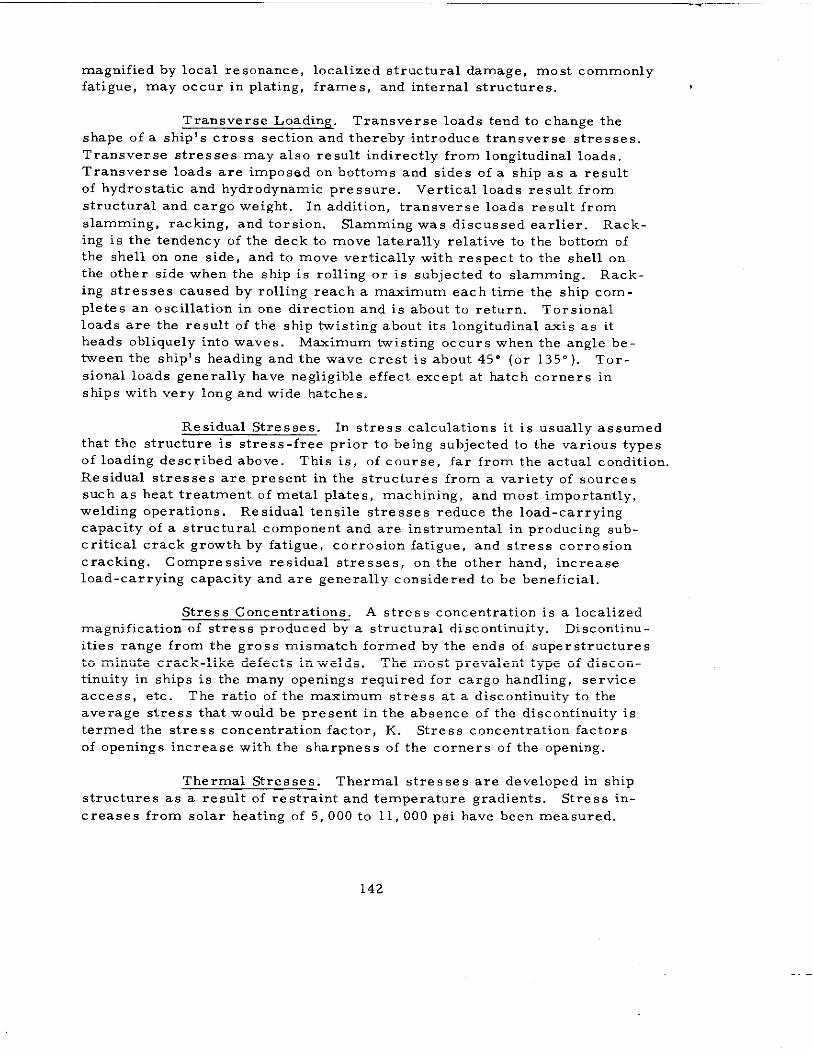
magnified by local resonance, localized structural damage, most commonlyfatigue, may occur in plating, frames, and internal structures.
Transverse Loading. Transverse loads tend to change the
shape of a shiprs cross section and thereby introduce transverse stresses.
Transverse stresses may also result indirectly from longitudinal loads.
Transverse loads are imposed on bottoms and sides of a ship as a result
of hydrostatic and hydrodynamic pressure. Vertical loads re suit from
structural and cargo weight. In addition, transverse loads result from
slamming, racking, and torsion. Slamming was discussed earlier. Rack-ing is the tendency of the deck to move laterally relative to the bottom of
the shell on one side, and to move vertically with respect to the shell onthe other side when the ship is rolling or is subjected to slamming. Rack.
ing stresses caused by rolling reach a maximum each time the ship comp-
letes an oscillation in one direction and is about to return. Torsional
loads are the result of the ship twisting about its longitudinal axis as it
heads obliquely into waves. Maximum twisting occurs when the angle be-tween the ship’s heading and the wave crest is about 45° (or 135”). Tor-
sional loads generally have negligible effect except at hatch corners in
ships with very long and wide hatches.
Residual Stresses. In stress calculations it is usually assumedthat the structure is stress-free prior to being subjected to the various types
of loading described above. This is, of course, far from the actual condition.
Residual stresses are present in the structures from a variety of sources
such as heat treatment of metal plates, machining, and most importantly,
welding operations. Residual tensile stresses reduce the load-carryingcapacity of a structural component and are instrumental in producing sub-
critical crack growth by fatigue, corrosion fatigue, and stress corrosion
c racking. Compressive residual stresses, on the other hand, increase
load-carrying capacity and are generally considered to be beneficial.
Stress Concentrations. A stress concentration is a localized
magnification of stress produced by a structural discontinuity. Disc ontinu -
ities range from the gross mismatch formed by the ends of superstructures
to minute crack-like defects in welds. The most prevalent type of discon-
tinuity in ships is the many openings required for cargo handling, service
access, etc. The ratio of the maximum stress at a discontinuity to the
average stress that would be present in the absence of the discontinuity is
termed the stress concentration factor, K. Stress concentration factorsof openings increase with the sharpness of the corners of the opening.
Thermal Stresses. Thermal stresses are developed in ship
structures as a result of restraint and temperature gradients. Stress in-
creases from solar heating of 5, 000 to 11, 000 psi have been measured.
142
A wider temperature range is experienced in ships carrying liquid sulfur,
heated oil, and refrigerated products. Stresses produced are often tom- ,
parable in magnitude to those produced by cargo. It has been reported that
lowering the temperature of a refrigerated ship from 100 to 20” F resulted
in stresses in the second and third decks of 10, 000 psi and 8, 000 psi, re-
spectively. It is extremely difficult to predict the magnitude of thermal
stresses because of complex heat transfer conditions. Temperature effects
of interest to ship de signers are the shape and magnitude of temperature
gradients in the hull, deflection of the hull girder by thermal expansion,
thermal stresses in the hull girder, buckling of hull plating as a result of
thermal expansion, and changes in material fracture toughness in refriger-
ated areas.
Fatigue. Fatigue is the progressive cracking of a metal under
cyclic stressing at stress levels well below the ultimate strength of the metal.
Three basic factors are necessary for fatigue failure to occur: (1) a maxi-
mum tensile stress of sufficiently high value, (2) a sufficiently large variation
in the applied stress, and (3) a sufficiently large number of cycles of applied
stress. Two key design parameters are fatigue strength, the value of stress
at which a metal will fail after a specified number of stress cycles, and the
fatigue limit, the stress level below which the metal can be stressed for an
infinite number of cycles without failure. Steel has a definite fatigue limit in
air, but under the corrosive conditions present in sea water, this fatigue limitno longer exists. All ship’s hulls are subject to fatigue loading during service.
In the past, there has been little evidence to indicate that fatigue is an impor-
tant consideration in the design of the primary hull-girder structure. Fatigue
has not been identified as the cause of sudden, catastrophic cracking of hull
girders, but, rather, has been associated with fracture of secondary struc-
tures. However, design for fatigue resistance may well become much moreimportant in the future as more and more higher strength steels are employed
in ship structures This is because, in general, stable fatigqe crack growth
rates go up and critical crack sizes required for initiation of unstable crack
growth go down as the yield strength is increased.
?.. Corrosion and Corrosion Protection of Steels inMarine Environments
Steel is the most widely used metal in marine environments,but it is chosen for its cost and structural properties rather than its resis-
tance to corrosion. In the atmosphere, a nonprotective coat of rust forms.
At the “splash zone, “ or “wind and water line, “ where the material is inter-mittently sprayed with sea water, the attack is significantly higher than in
the case of complete immersion. Steels typically corrode at the rate of 3to 5 roils (O. 003-0. 005 in. ) per year (mpy) in quiescent seawater,higher rates usually being obser”ed as flow velocity is increased.
143
withAt the
,.. ..— .
wind and water line, rates as high as 50 mpy are not uncommon, Pitting,galvanic attack, crevice corrosion, and other forms of localized corrosion
frequently occur. Under submerged conditions, corrosion of steel is gov-
erned hy the chemical reaction at cathodic sites on the metal surface. In
neutral or alkaline seawater the reaction at cathodic sites is governed by
the amount of oxygen arriving at the surface; the corrosion rate increases
with the increased concentration of oxygen, At cathodic sites, hydroxyl
ions may be formed which increase the alkalinity of these localized sites
and promote deposition of protective calcareous scales.
Because seawater is a complicated, delicately balanced mixture
of salts containing living matter, silt, dissolved gases, and decaying organic
matter, the individual effect of each factor affecting the corrosion beha”ior
is not readily separable. Dissolved oxygen concentration is the major factor
governing the corrosivity of seawater. The amount of oxygen present at a
steel surface depends upon the concentration of oxygen in the water and thevelocity of flow. Water low in oxygen flowing at a high velocity can provide
as much oxygen to a steel surface as water high in oxygen moving slowly
past the surface. The oxygen level of seawater may range up to 12 parts
per million (ppm). Plant life and wave action tend to increase the oxygen
level. On the other hand, decaying organic material tends to reduce oxygen
consumption.
When steel is first immersed in seawater, a biological slime
develops in a matter of a few hours. This film of bacteria and other micro-organisms is attractive for embryonic fouling organisms looking for a placeto settle, Of most concern from a corrosion viewpoint are the sessile orga-
nisms which arrive at slime-covered steel surfaces in embryonic form and
become firmly attached in a few hours. They then rapidly transform to amature form and become immobile. Typical sessile fouling organisms arebarnacles, bryzoa, mollusks, corals, and algae, Biofouling, the growth ofthese organisms, tends to reduce general corrosion because the organisms
act as a barrier preventing water from reaching the steel surface. However,they promote formation of localized corrosion cells which leads to pitting and
crevice corrosion at the interface between the organisms and the steel surface,
Increasing the ambient temperature of seawater tends to accel-
erate corrosion of steel. Increasing salinity also tends to increase corrosion
rate by decreasing the electrical resistance of the water, thereby making it
possible for localized anodes and cathodes to operate over longer distances
than would be the case in a less conductive liquid such as fresh water. The
pH of seawater varies slightly depending on plant life present. Plants con-
sume carbon dioxide and this affects the PH. This slight shift in pH has little
direct effect on corrosion behavior; however, it can affect calcareous scale
deposition which, in turn, will influence corrosivity. As water depth increases
the corrosion rate generally decreases. This is attributed to such factors as
144
lower oxygen concentration, 10VKI. temperature, and less water movement
at the greater depths. Corrosion of steel in polluted seawater may be quite ,
different from that in normal seawater. Depending upon tbe pollutant, the
effects of oxygen concentration, salinity, biofouling, and pH may change.
Acidic polutants will be much more corrosive. Sulfides, which normally
are present in polluted seawater, greatly accelerate corrosion of steel.
The problem of providing protection against corrosion in sea-
water is aggravated by its high conductivity, which favors local-action cell
formation, a high content of sodium ions to promote the development of alka-
linity at cathodic sites, and a high total ion content which facilitates e stab-
lishment of ion concentration gradients and osmotic transfer of water throueh
protective films. The principal method for mitigating corrosion of ship’shulls is use of protective coatings supplemented with cathodic protection.
Protective coatings normally are intended to form a continuous
film of electrically insulating material over the steel surface to be protected.
The function of a coating is to isolate. the metal from direct contact with the
surrounding environment, and to impose a high electrical resistance in the
anode-cathode circuit so that there can be no significant corrosion current
flowing from anodic sites to cathodic sites. Tbe ideal protective coating
would have an electrical resistance in the multi -megohm range and would
completely and permanently separate the metal from the surrounding en-
vironment, This condition is never realized in practice, On a typical well-
coated ship hull, approximately lY’ of the total surface area will remain un.
coated. This exposed area usually will be under small coating defects, com-
monly called “holidays. 1’ Holidays result from skips by the coating machine,pinholes in the film, cracks from mechanical Or thermal stresses, action of
solvents, action of bacteria, and penetration or mechanical damage by orga-
nisms. Some of this damage can be prevented by rigid quality control and
careful systematic inspection of coated hull, The ability of coating to resistdevelopment of holidays after its initial construction is governed basicallyby its chemical and mechanical properties in the service environment.
In general, any effective coating for marine use ~u~t have cer
tain characteristics. The coating
(1) Must be highly water resistant. This means that the coatingmust be able to withstand continuous immersion in water and
should have a very low water absorption and moisture “apor
transfer rate. It should also be able to resist cycles of wetting
and drying as occur in the splash zone.
(2) Must resist passage of ions, such as chloride, sulfate, and
carbonate, that on penetration could start corrosion under the
coating.
145
(3)
(4)
(5)
(6)
(7)
(8)
(9)
(lo)
(11)
—
should be highly dielectric in order to resist any electron
passage caused by anodes set up at breaks in the coating.
must be highly weather resistant.
must be chemically resistant.
should be highly adherent.
should also be abrasion resistant since any material lacking
toughness, hardness, and shock resistance could soon be
eroded away.
should not be susceptible to undercutting in areas that be-
come damaged.
should be inhibitive. Should damage occur, the coating
itself should tend to minimize and restrict corrosion of
the bare metal thus exposed.
should be easily applied and easy to repair.
should be resistant to biofouling.
Cathodic protection is the use of a direct electric current from
an external source to oppose the discharge of corrosion current from anodic
areas. When a cathodic protection system is installed for maximum effect,
all exposed portions of the metal surfaces become cathodic. The function
of cathodic protection used with coatings is to protect metal exposed at holi-
days. The direct current required is usually obtained from sacrificial anodes,
the most common which are zinc, magnesium, and aluminum.
c. BA5TC STRUCTURAL, FABRICATION AND ND I ASPECTS
This report concerns subcritical crack growth in conventional struc-
ture associated with commercial surface ships. It is appropriate to review
here a few of tbe most basic structural aspects of such vessels, and to high-
light the typical nondestructive test and inspection procedures used today to
qualify the structure,
We are considering conventional surface cargo and passenger ships,
generally in the over 400-ft class. In such ships, the primary structure,
i. e. , the main load-carrying elements, may be considered to act as a box
146
girder, While the structure varies in detail in the vicinity of the bow andstern, a typical cross section through the ship hull is shown in a simplified ‘-form in Figure C- 1. The main components of the primary structure are
the deck and bottom plating and the side shell. Together, these elements
form a continuous structure which serves both to carry the primary ship
loads and to support the internal structure.
During its service, the ship is exposed to hydrodynamic forceswhich tend to bend and twist the structure. As the ship hogs and sags (thefundamental bending mode) the bending stresses generally are greatest on
the stringer plate and on the sheer and bilge strakes, since these critical
primary elements are farthest from the neutral axis. Torsional forcesadd shear stresses to these direct stress components due to bending. Addi-tional shear stresses arise in the side shell due to the behavior of the ship
structure as a thick beam. These shear stresses in the primary structure
are greatest near the plane containing the neutral axis, at the quarter points
(i. e. , one-fourth of the ship length in from the bow and the stern). The
“strength envelope, “ or primary structure as discussed thus far, is assistedsomewhat by the secondary support offered internally in the form of trans-
verse andlor longitudinal frames.
Most of the potentially dangerous cracks that develop in a ship may
either be associated with welding seams or with corners and other struc-tural discontinuities in the primary and secondary structural assemblies.
With regard to the former, arc welding is used today almost exclusively asthe means of joining principal ship structural components. The most com-mon weld joints are the double welded ‘lVrl joint, intermittent fillet joint,
double fillet “T” joint, double bevel “TIN joint, and the double bevel corner
joint (fillet reinforced). These weld joint configurations are standard forall types of stiffened plate and structural construction. While welding en-
joys a number of advantages over earlier riveting practice, slag inclusions,residual stresses and steep property gradients associated with weld regions
offer convenient sites for the initiation of cracks.
Structural regions where load discontinuities occur are inevitable
in ship structures, and often are the sites of cracks and fractures. Major
openings in the structure may occur in tbe strength decks for cargo hatches,and in stairway and elevator wells. These openings can be especially dan-
gerous when large tensile stress concentrations occur on the main deck.
For example, the Liberty ships had square corners on the main hatch open.
ings; these corners were the sources of hundreds of reported fractures.
Large side openings, such as cargo ports, may be another potential source
of failure, particularly when the opening includes tbe sheer strake or is
located close to the quarter points of the ship. When the side openings in-volving the sheer strake are in the same transverse plane as large deck
147
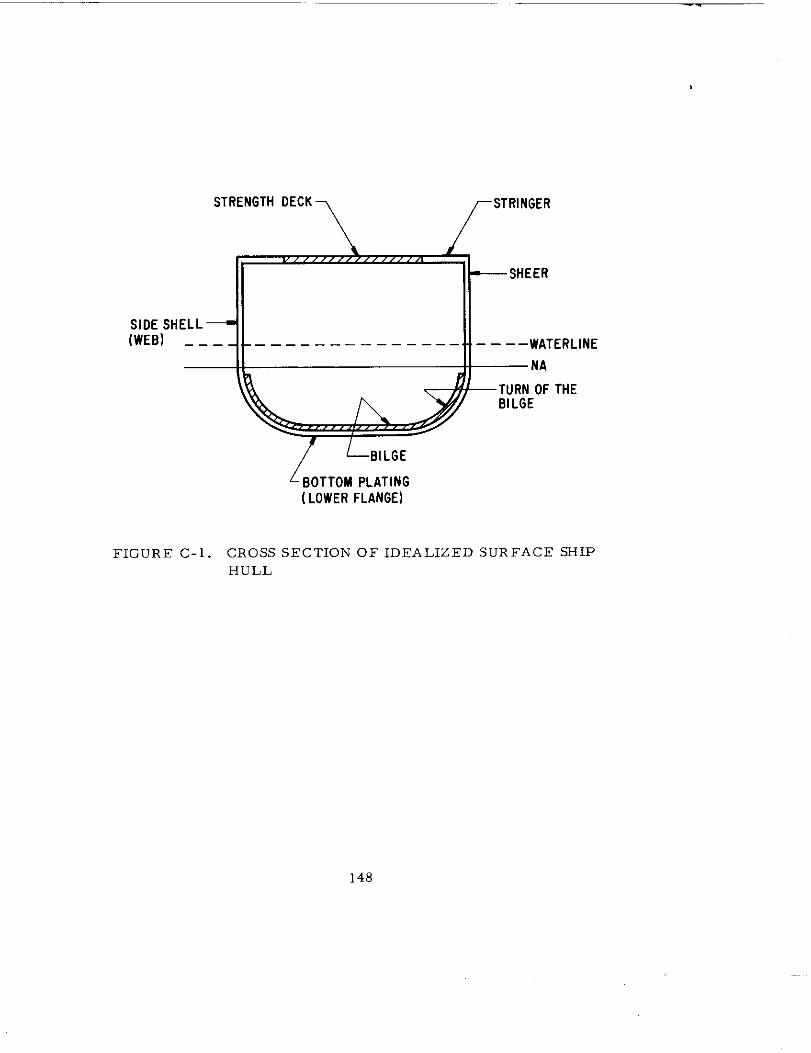
STRENGTH DECK STRINGER
—SHEER
SIDESHELL—(WEB) _ _ – - -–––-–-––––––––. ..- –––WATERLINE
BOTTOM PLATING(LOWER FLANGE)
FIGURE C-1. CROSS SECTION OF IDEALIZED SURFACE SHIP
HULL
148

openings, the failure potential is increased. In addition to the major open-ings, a large number of minor openings must usually be introduced to ac - ‘“
commodate access, cargo handling, drainage, air escape, piping systems
and other needs. These openings may also present potential fracture haz-
ards. Critical areas can also be present where structural members inter-
sect, with abrupt changes in load transfer and consequent stress concentra-tions.
Nondestructive inspection of joint details is an essential part of ship
structure qualification. Several years ago the Weld Flaw Evaluation Com-mittee reviewed the most common NDT techniques used in shipbuilding.(8)
The purpose of this review was implied in the opening statement of Ship
Structure Committee Report SSC - 177: “At the present time (1966) tbe ship-
building industry, as concerned with general cargo tanker and passenger
ship construction, does not have a uniformly accepted procedure for exam-ining and comparing the quality of welds in such ships. 1’ This report out-
lines the following five most commonly used NDT techniques:
Visual
Radiographic (x-ray or gamma-ray)Magnetic particle
Liquid dye penetrant
Ultrasonic
One or more of these methods may be applied to nearly any welded jointconfiguration, depending on the geometry, metallurgy, and type of cracking
of interest (e.g. , surface heat check cracks, deep slag inclusions, etc. ).A major problem which exists today, and which in part motivated the pres-
ent study, is the lack of adequate criteria for positive acceptance/rejection
of joint details in structural qualification. The reader is referred to Refer-
ence 9, which presents a detailed NDT guide for the inspection of steel weld-ments.
D. ELEMENTS OF FRACTURE MECHANICS
The subject of subcritical crack growthin ship steels is intimatelyrelated to the discipline of fracture mechanics, It is difficult to imagine any
thorough contemporary discussion of this subject without occasional recourse
to its terminology and nomenclature. Therefore, it is appropriate to present
in this subsection a brief account of some of the most important results and
methods of fracture mechanics.
149
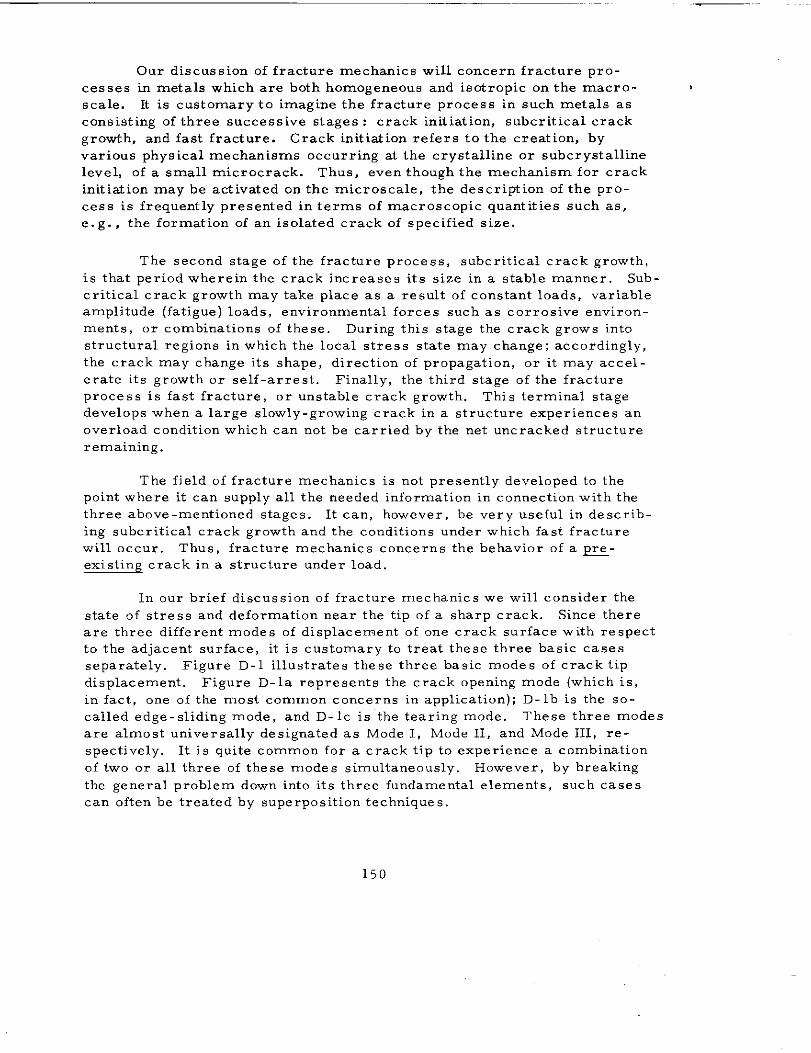
..—
Our discussion of fracture mechanics will concern fracture pro-
cesses in metals which are both homogeneous and isotropic on the macro-scale. It is customary to imagine the fracture process in such metals as
consisting of three successive stages : crack initiation, subcritical crack
growth, and fast fracture. Crack initiation refers to the creation, by
various physical mechanisms occurring at the crystalline or subcrystallinelevel, of a small microcrack. Thus, even though the mechanism for crack
initiation may be activated on the micro scale, the description of the pro-
cess is frequently presented in terms of macroscopic quantities such as,
e. g. , the formation of an isolated crack of specified size.
The second stage of the fracture process, subcritical crack growth,
is that period wherein the crack increases its size in a stable manner. Sub -
critical crack growth may take place as a result of constant loads, variableamplitude (fatigue) loads, environmental forces such as corrosive environ-ments, or combinations of these. During this stage the crack grows into
structural regions in which the local stress state may change; accordingly,
the crack may change its shape, direction of propagation, or it may accel-
erate its growth or self-arrest. Finally, the third stage of the fractureprocess is fast fracture, or unstable crack growth. This terminal stagedevelops when a large slowly-growing crack in a structure experiences an
overload condition which can not be carried by the net untracked structure
remaining.
The field of fracture mechanics is not presently developed to the
point where it can supply all the needed information in connection with the
three above-mentioned stages. It can, bowever, be very useful in describ-
ing subcritical crack growth and the conditions under which fast fracture
will occur. Thus, fracture mechanics concerns the behavior of a ~-
existing crack in a structure under load.
In our brief discussion of fracture mechanics we will consider the
state of stress and deformation near the tip of a sharp crack. Since thereare three different modes of displacement of one crack surface with respectto the adjacent surface, it is customary to treat these three basic cases
separately. Figure D-1 illustrates these three basic modes of crack tip
displacement. Figure D-la represents the crack opening mode (which is,
in fact, one of the most common concerns in application); D- lb is the so-
called edge-sliding mode, and D- lC is the tearing mode. These three modes
are almost universally designated as Mode I, Mode II, and Mode III, re-
spectively. It is quite common for a crack tip to experience a combination
of two or all three of these modes simultaneously. However, by breaking
the general problem down into its three fundamental elements, such cases
can often be treated by superposition techniques.
150
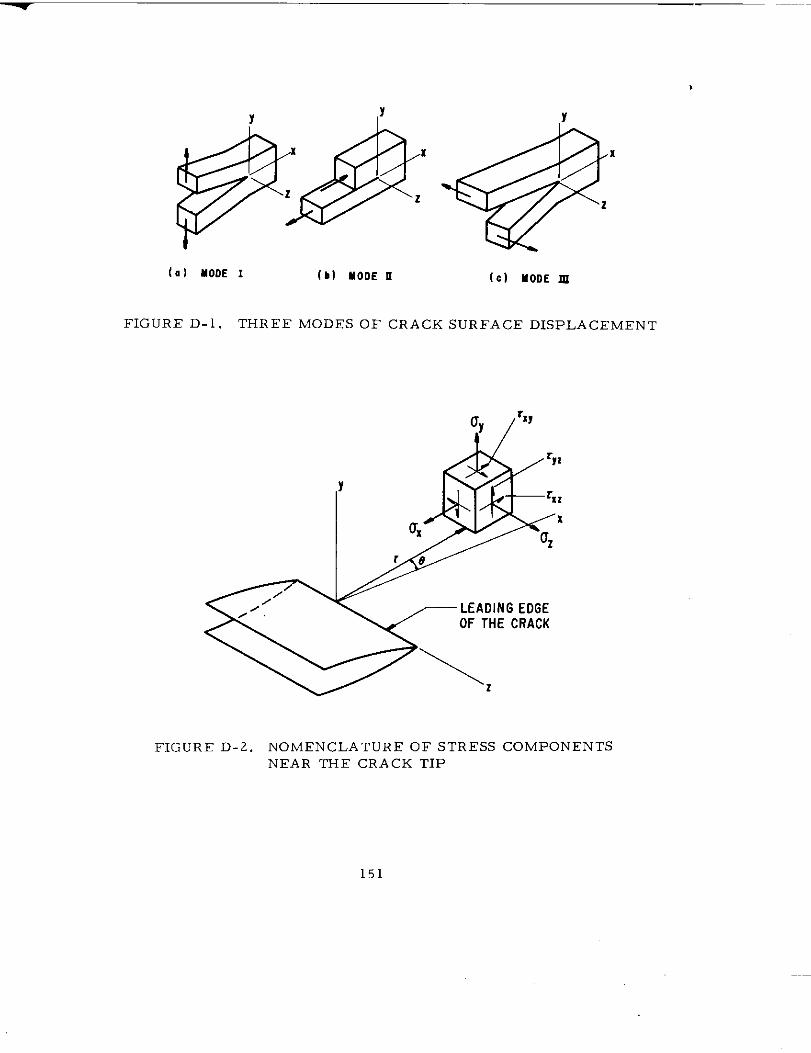
-
,.
(a) MODE 1 (b) MODE U (c) MODE ~
FIGURE D-1. THREE MODES OF CRACK SURFACE DISPLACEMENT
FIGURE D-2. NOMENCLATURE OF STRJ?SS COMPONENTS
NEAR THE CRACK TIP
151
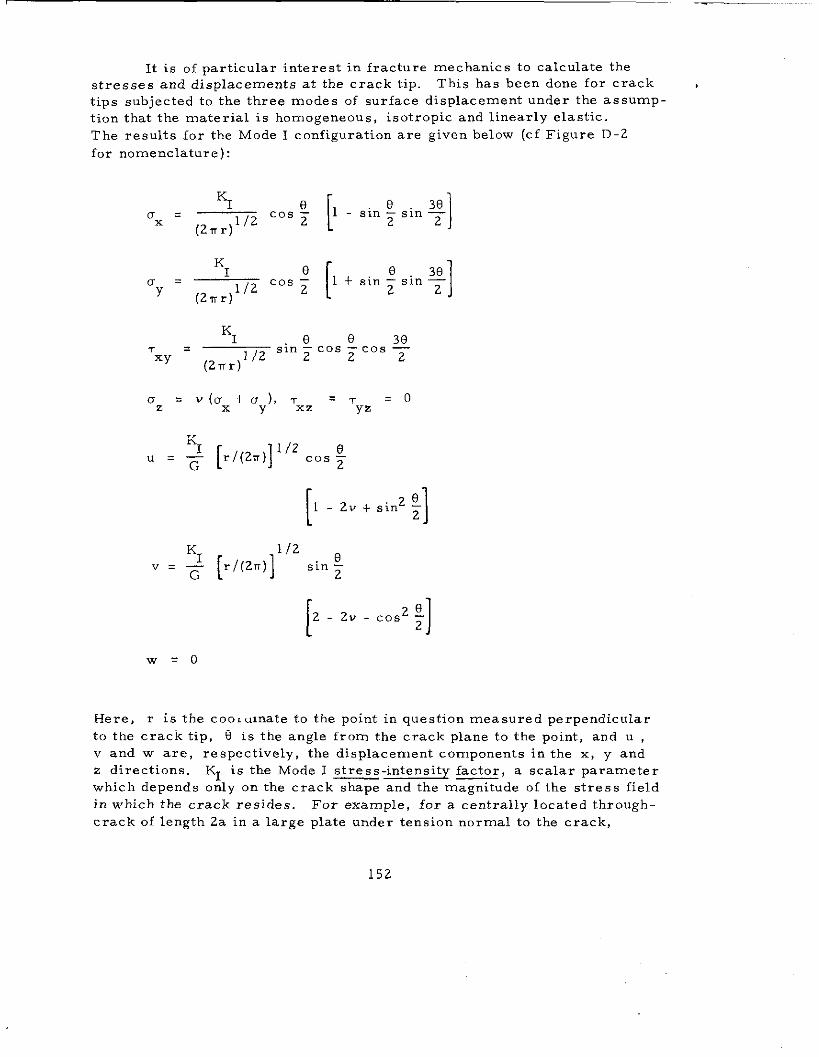
It is of particular interest in fracture mechanics to calculate the
stresses and displacements at the crack tip. This has been done for crack
tips subjected to the three modes of surface displacement under the assump-
tion that the material is homogeneous, isotropic and linearly elastic.
The results for the Mode I configuration are given below (cf Figure D-2
for nomenclature):
KI e
[
~-aing~in~ux. — Cos —
(2rr)1’Z 22 2 1
KI e
[
e
‘Y ‘---mzc Os–l+sin~sin~
(2mr)2 1
K1 e e 3e
T=1/2
sin ~cos ~cos ~XY (2rr)
Is = U (Ux + (Jy), Txz ‘T=oz yz
u = ~ [r/(27r)]1’2 ... !2
[
~-2v+~in23
21v=~ [~/(2T)]1’2 sing
2
[2-2 V. COS2; 1
w =0
Here, r is the coo Lumate to the point in question measured perpendicular
to the crack tip, 9 is the angle from the crack plane to the point, and u ,
v and w are, respectively, the displacement components in the x, y and
z directions. K1 is the Mode I stress-intensity factor, a scalar parameterwhich depends only on the crack shape and the magnitude of the stress field
in which the crack resides. For example, for a centrally located through-
crack of length 2a in a large plate under tension normal to the crack,
152
K1=o~. Equations (1) above are written for the case of = strain. *
For the case of plane stress, the stresses are unchanged and the displace- ,-ments are found simply by replacing the Poisson ratio v in these formulae
by v/(1 + v); the shear modulus remains unchanged. The corresponding
equations for Mode II (involving Ku) and Mode III (involving K1ll) are not
written here, but are available in the literature.
The stress-intensity factors, K1, K1l, K1ll characterize the size
and shape of a crack, and the intensity of the stress field in which the crack
resides. It is measured in terms of (Force )(Length)-3/2, or psi /in. in
conventional engineering units. It can always be expressed as K = o ~where K is generic for K1, K1l or K1ll, c is a length characteristic of thecrack, u the applied stress and a is a scalar parameter of order-of-magni-
tude unity which depends on the crack shape (and possibly upon the ratio
O/uY, where UY is the uniaxial yield strength). Closely associated withthe stress-intensity factor is the strain. energy .release rate, or crack.ex.
tension force, G:
G = K2 (1 -v2)/E (plane strain)
I
Modes
G = K21EI and II
(2)
(plane stre .5)
Physically, G (again, taken generically for G1, G1l or G1ll) is interpreted
as the rate of strain-energy-release per unit crack area.
All of the above considerations have concerned cracks in linearly elas-
tic media, In real structures, however, the stresses near the tip of sharpcracks are in excess of the proportional limit, and hence some plastic yield-
ing always takes place. The exact size and shape of the plastic zone is ex-
ceedingly difficult to calculate, and depends on a number of material proper-ties, the way in which the loads have been applied, and the detailed configu-
ration of the crack, However, for engineering purposes the size of the plas-tic zone can be estimated simply by inserting a yield criterion into the equa-
tions for the elastic stresses at the crack tip, e, g. , Eqs. (l). For example,
by introducing the von Mises (J2) yield criterion, we find that R , the maxi-
mum dimension of the plastic zone, is approximately
*Plane strain and plane stress represent limiting cases in which, respec.tively, the strain and the stress are assumed to be zero in the direction
normal to the plane of loading. A thick plate loaded in its plane is con-sidered to be in a state of plane strain, while a thin plate will approxi-
mate a state of plane stress.
153
..—
()K2
R=$$ (plane strain)
2(3)
()
K
R=:& (plane stress)‘Y
It should be borne in mind that the stress-intensity factor, and hence the size
of the plastic zone, will, in general, vary from point-to-point along the leading
edge of the crack tip. Only for ideal cases, involving ideal through-notches
in plates under in-plane forces, and a few other such examples, is K the
same for all points on the crack tip.
The methods of fracture mechanics have been developed primarily
for conditions of small-scale yielding, where the size of the plastic zone R
is quite small with respect to the crack length c : R/c < < 1 In such cases
the stresses in the vicinity of the crack tip are very nearly the same as
computed under the assumptions of elasticity theory. As a practical mat-
ter, what is commonly done is to assume that the crack has an effective
length equal to the actual length plus the dimensions of the plastic zones,
and this effective length is then used to calculate the stress-intensity factor.
However, when the crack tip experiences large-scale yielding, the proce-
dures of linearly elastic fracture mechanics fail to be valid. Such condi-
tions are usually reached in connection with cracks in thin section sheet
prior to fast fracture, but can also occur in thick sections, depending upon
the yield strength and toughness.
The concepts introduced above may, under appropriate conditions,
be applied to predict tbe onset of fast fracture. From Eqs. (1 ) it can be
seen that the distribution of stresses near tbe tips of two dissimilar cracksis identical, provided the stress-intensity factors are the same. If we as-
sume that crack extension is controlled by tbe conditions at the crack tip,then it follows that unstable crack extension will take place when the stress-
intensity factor K1 achieves some critical level. * This critical value is de-noted as KIC, the =-strain fracture toughness. Its significance is that
KIC may be regarded as a material property, independent of the crack shape
or size that triggers fracture, or the type of specimen used to determine
~c. The distinction between K1 and KIC is of essential importance: K1 is
analogous to stress, while KIC is analogous to strength. Also, since K1
*From this point the discussion concerns only the Mode I crack configuration,
since it is by far the most important encountered in the field. The same gen-
eral statements will apply, however, to both Mode II and Mode III.
154
.
and G1 are related in a simple way through the elastic constants (Eqs. (2)),for ~very ~ropertyK1c there is its counterpart, GIC, called the critical ,.
strain-~-release rate.—.
There are certain restrictions that must be placed on tbe crack con-figuration for the concept of a critical value of K1, independent of the speci-
men, to exist. * These restrictions have to do primarily with the plastic
zone that forms at the crack tips. First of all, the size of the plastic zonemust be small with respect to the crack length, so that the stress distribu-
tion near the tip may accurately be approximated by the elastic stress field.
Secondly, the crack tip must be primarily in a state of plane strain, whichmeans that the specimen must be thick enough so that little, if any, strain
develops in the direction of the leading edge of the crack. This thickness
effect is illustrated in Figure D-3. For relatively thin specimens the criti-cal stress intensity factor, called Kc, is high, owing to the large stabilizingcrack tip plasticity zone. This critical value, however, decreases with in-creasing specimen thickness until a thickness is reached such that the criti-
cal value is independent of thlckness. This critical value is called the plane-strain sti-es s-intensit y factor, KIC. It, unlike Kc, which is thickness-depen-dent, is considered a material property and always represents a conserva-tive value of the critical stress-intensity factor for design purposes. One
might expect that the critical specimen thickness necessary to achieve plane-
strain conditions is related to the plastic zone size. It was seen earlier
(Eq. (3)) that the zone size is proportional to (K1/uy)2. ASTM has set stan-dards for “valid” plane-strain fracture toughness testing based on a speci-men thickness T such that T ~ 2.5 (K1c/uY)2. ** For T less than these
values, the crack tip is substantially or entirely in a state of plane stress.
The subject of fracture mechanics, as described to this point, pro-vides a framework for answering the following general questions:
(1) Witbin the resolution capabilities of the pertinent nondestruc-
tive inspection equipment, is the largest detectable flaw well
within the subcritical region for its stress state ?
(2) Can it be assured that a known flaw will be non-propagatingwithin the expected operational loads of the structure?
However, recent developments in fracture mechanics permit one to addre ss
such problems when more complex environmental factors are involved. Per-haps the mast important of the se. is the problem of metal fatigue, or subcritical
::~The plane .strain fracture toughness, KIC, like other thermo-mechanical
material properties, does depend upon temperature and strain rate to
some extent.
**Section 6 of ASTM E399-70T.
155
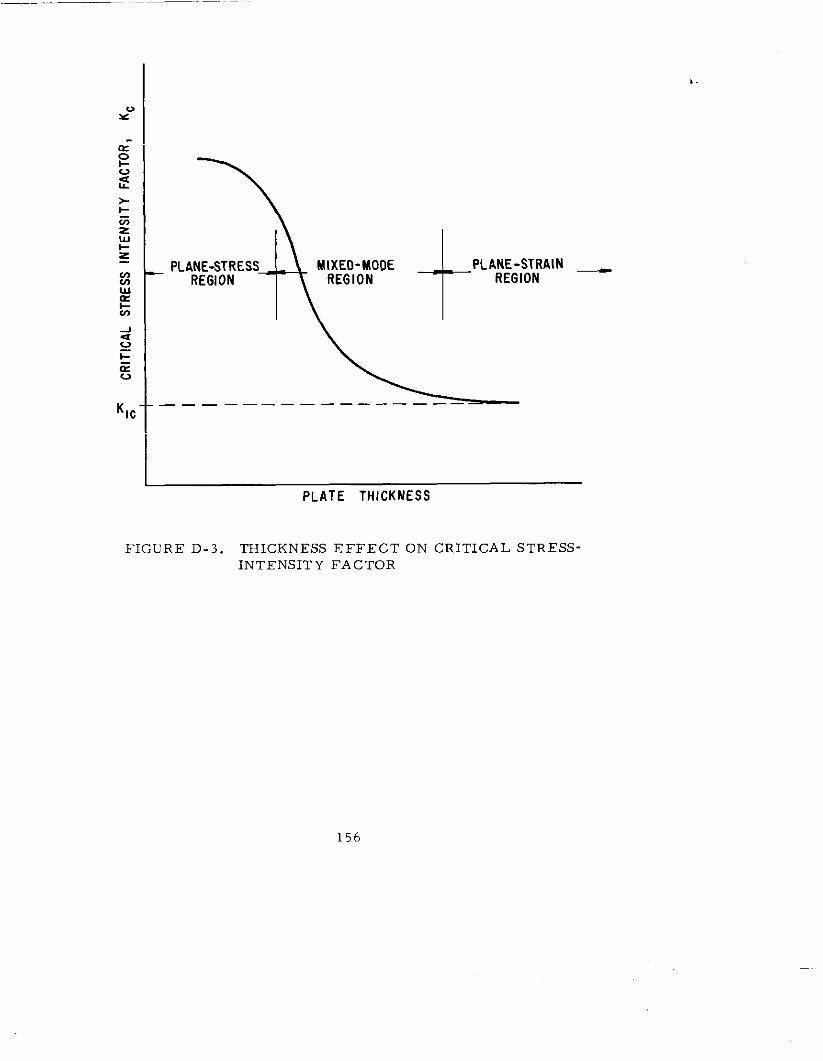
— — _— —_-
PLA}::&N~ESS MIXED-MOOE _
_.— ——— ———
PLATE THICKNESS
FIGURI? D-3. THICKNESS EFFECT ON CRITICAL STRFSS-
INTENSITY FACTOR
156
growth of a crack under cyclic stresses. It has been reliably demonstrated
that the growth of a crack of length c , as a function of the number of ap - ‘-’
plied load cycles N , can be expressed in terms of the variation in stress.intensity factor at the crack tip, AK1 A number of analytical expressions
have been proposed, but the most widely accepted perhaps is that proposed
by Forman, et al. (11)
dcC (AK1)n
fi=(l-R)Kc-AK1 (4)
where C and n are constants, and R is the ratio of the minimum to themaximum stress in a loading cycle. This equation can be integrated overthe anticipated loading spectrum to produce an estimate of the number of
cycles to fast fracture, which develops when AK1~ (1 - R) K . It hasbeen noted by some that the above expression has particular li~itations
when applied to steels having low-yield strengths. This area is discussedin detail in Chapter II, Section B.
A further application of fracture mechanics has been in tbe area ofpredicting the life of statically loaded structures in an aggressive environ-
ment. The problem of stress corrosion cracking (cf. Chapter III, Section A)involves the slow growth of a crack, under conditions of constant load, to
critical proportions. It has been established that the time-to-failure is afunction of the crack tip stress-intensity factor. The critical stress-inten-
sity factor, below which the life is indefinite and above which the life is
finite, is called K1~cc, for Stress Corrosion Cracking. K1~cc, which is
determined under static conditions, plays a role analogous to the endurance
limit in cyclic metal fatigue, inasmuch as both quantities are upper limits
on the region of indefinite life. This subject is discussed comprehensivelyin Chapter III, Section A.
157
REFERENCES
1. MacNaught, D. F. , “Strength of Ships, “ principles Of NavalArchitecture, Ed. J. P. Comstock, Rev. Ed. , 1967, 167.
2. Masubuchi, K. , Monroe, R. E. , and Martin, D. C. , “Inter pre-
tative Report on Weld-Metal Toughness, “ SSC-169, July 1965.
3. “Higher Strength Steels in Hull Structures, “ Technical andResearch Bulletin 2-19, SNAME, New York, N.Y. , Dec. 1971.
4. Welding High Strength Steels, American Society for Metals,Metals Park, Ohio, 1969.
5. Comstock, J. P. , Ed. , PRINCIPLES OF NAVAL ARcHITECTURE,
Sot. of Naval Arch. & Marine Engrs. , New York, N. Y., 1967.
6. D’arcangelo, A. M. , SHJP DESIGN AND CONSTRUCTION, CornellMaritime Press, Inc. , Cambridge, Md. , 1964.
7. Fink, F. W., and Boyd, W. K, , THE CORROSION OF METALS IN
MARINE ENVIRONMENTS, D. M. I.C. Report No. 245, Bayer & Co. ,Inc. , Columbus, Ohio, 1970.
8. !lGUide for I~t~rpr~tatiOn of Non-Destructive Tests Of welds
in Ship Hull Structures, “ SSC -177, Prepared for the Ship Structure
Committee by the Weld Flaw Evaluation Committee, Sept. 1966.
9. l!~uide fOr Int~~pretatiOn of Non-Destructive Tests Of High-—,Strength Low-Alloy Steel Weldments in Ship Hull Structures, “ SSC-245, Prepared for the Ship Structure Committee by the Weld Flaw
Evaluation Committee, 1973.
10. Paris, P. C. , and Sib, G. , ,lstre.~ Analysis Of Cracks, “ in
SYMPOSIUM ON FRACTURE TOUGHNESS TESTING AND ITS
APPLICATIONS, ASTM STP 381, pp 30-82, ASTM, Philadelphia.
11, Forman, R, G. , Kearney, V. E. , and Engle, R. M. , “Numerical
Analysis of Crack Propagation in Cyclic-Loading Structures, “
Trans. ASME, Journal of Basic Engineering, Vol. 89, No. 3,
1967, pp 459-464.
158
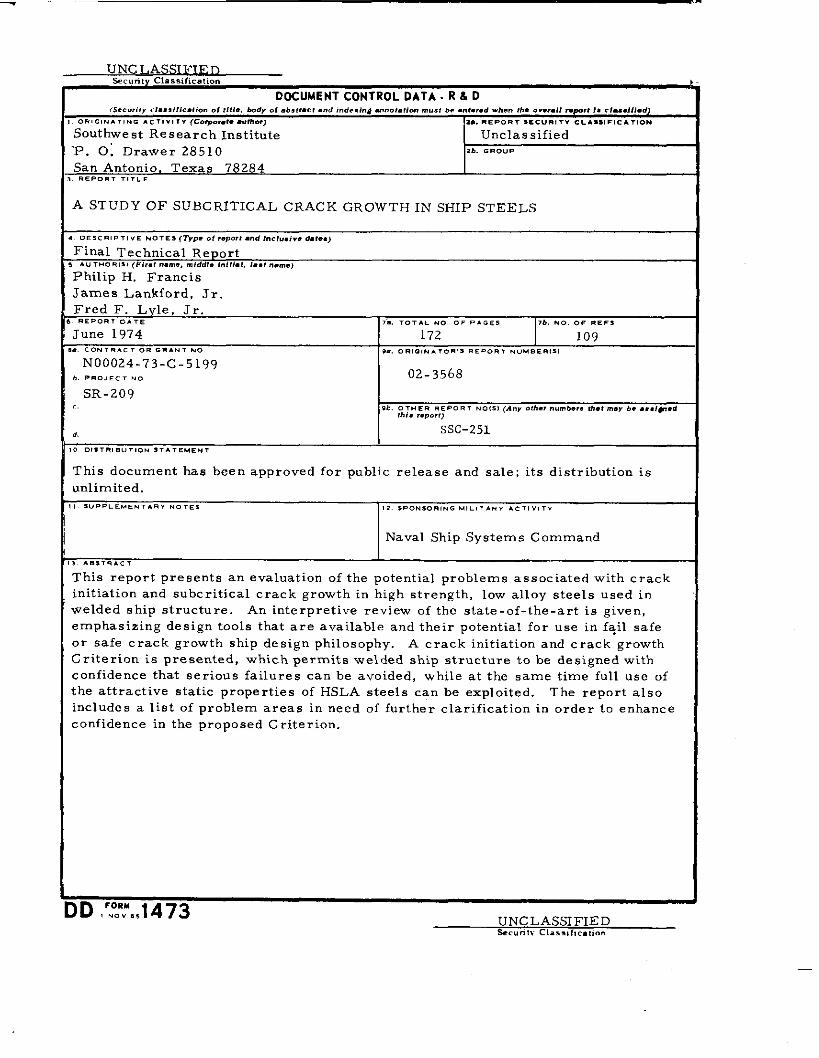
UNC LASS-DSe C.nty Classification
DoCUMENT CONTROL DATA - R & D,s...,’,. .,.. s,,,..,,.. .,, ,1,,., hod, o, .,. tr.c, .“. /d,.,.@ m..,.,,.sm “,.s, b. ..t.r.d wA.” fh. o“w.IJ “#d 1. cl-.lfl.d,
0.!.,.. ,,.. .. 7!.,,, (Co,x,o,.t. .”,l,.,, [2.. ”,.0., SE C.”,,” . ..s.! .,..,,0.
Southwest Research Institute Unclassified‘P. O; Drawer 28510 .?,. . . . . .
San Antonio, Texas 78284.,... , .,, .,
A STUDY OF SUBCRITICAL CRACK GROWTH IN SHIP STEELS
. . . . . .. . .. . .0,,, fly..0, report .nd ,.,,”., ”. d.,..,
Final Technical RepOrtA. ,“0 R,,, (F,r., ..,,,., ,,,, old,. ,.,,,.,, ,.., “.me,
Philip H. Francis
James Lankford. JrFred F. Lyle, J’r..,.0.. 0.,, 7.. TOTAL NO, 0, . . ..s 7,. ?40. 0, ..,,
June 1974 172 109. ,0. ,... , 0. . . . . . NO ,., O., G, N.. O”, S . . . . . . .“....,3,
NOO024-73-C-5199,, ..0, ... .0 02-3568
SR-209. ,,, OTHER.,,0., .0,,, (.4., ah.? ““m,.,. *., “,., b. . . ..m.d
(h,. “.0,,,
d,SSC-251
. . .,s, .,. ”,,0. ,,. ,.ME. .
This document has been approved for public release and sale; its distribution isunlimited.
,. ,“.., . . . . ...” NOT,, ,2. ,.O.,O .,,.. MI,,,,. , . ...”,,,
Naval Ship Systems Command
This report presents an evaluation of the potential problems associated with crackinitiation and subcritical crack growth in high strength, low alloy steels used in
welded ship structure, An interpretive review of the state-of-the-art is given,emphasizing design tools that are available and their potential for use in f?il safeor safe crack growth ship design philosophy. A crack initiation and crack growth
Criterion is presented, which permits welded ship structure to be designed withconfidence that serious failures can be avoided, while at the same time full use oftbe attractive static properties of HSLA steels can be exploited. The report alsoincludes a list of problem areas in need of further clarification in order to enhance
confidence in the proposed Criterion.
)D ,’:5’.,1473UNCLASSIFIEDsec.,,,, C1., s,r, c.,,..
-.—
UNCLASSIFIEDsecurity Cl,s>iik.tion
..” .0. ”.
Oesign Criterion
Fatigue
ShipsSubcritical C rack GrowthCrack InitiationHigh Strength, Low Alloy Steels
Welded Structures
UNCLASSIFIEDsecurity C1. ssilic., io”
SHIP RESEARCH COMMITTEEMaritime Transportation Research Board
National Academy of Sciences-National Research Council
The Ship Research Committee has technical cognizance of the inter-agency Ship Structure Commi ttee’s research program:
PROF. J. E. GOLDBERG,Chairman, Schoo2 of Civi2 Engineering, Purdue UniversityPROF. R. W. CLOUGH, Prof. of Civil Engineering, University of CaliforniaDR. S. R. HELLER, Jr., C’man, Civil & h%ch. Eng. Dept., The Catholic Univ. of AmericaMR. G. E. KAMPSCHAEFER, Jr., Manager, Technical Seroices, ARMCO Steel CorporationMR. W. W. OFFNER, Consulting Erzginwr, San FranciscoMR. O. P. ROSEMAN, Chief Naval Architect, Hydronaaties, Inc.MR. H. S. TOWNSEND, Vice President, U.S. Salvage Association, Inc.FJR. S. ‘WKAWA, Consulting Rngineer, General EZectric CompanyMR. R. W. RUMKE, Executive .%eretary, Ship Research Committee
Advisory Group III, “Materials, Fabrication, and Inspection”, preparedthe project prospectus and evaluated the proposals for this project:
MR. G. E. KAMPSCHAEFER, Jr. , Chairman, Manager, Teeh. Services, ARMCO Stee1 Corp.DR. J. M. BARSOM, Research Consultant, U.S. Steel CorporationPROF. J. R. FREDERICK, Dept. of Mach. Erzgineering,The University of MichiganMR. S. GOLDSP1 EL, Mechanical Engineer, Board of Water Supply, New YorkMR. T. E. KOSTER, Naval Architect, AMOCO International Oil CompanyDR. J. M. KRAFFT, Head, Ocean Materials Criteria Branch, Naval Research Lab.MR. G. E. LINNERT, North American Rt?presentative,The Welding InstitutePROF. H. W. LIU, professor of Materials Science, Syracuse UniversityPROF. W. H. MUNSE, Dept. of Civil Engineering, University of IllinoisMR. W. W. OFFNER, Consulting Engineer, San FranciscoPROF. H. C. ROGERS, Co Zlege of Engineering, Drezel UniversityDR. W. F. SAVAGE, Professor of Meta%2urgy, Ra-zeselaw Polytechnic InstituteDR. W. K. WILSON, Ar?a2ytiea2Mechanics, l.WestinghouseElectric Corporation
The SR-209 Project Advisory Committee provided the 1iaisontechnical guidance, and reviewtd the project reports with the investigator:
DR. S. YUKAWA, Chairman, Consulting Engineer, General Electric CompanyDR. J. M. BARSD$l, Research Consultant, U.S. Steel.CorporationMR. R. L. GRAY, Vice President, States Steamship Company
I --
SSC-242 ,
SSC-243 ,
SSC-244,
SSC-245 ,
SSC-246 ,
SSC-247 ,
SSC-248,
SSC-249 ,
SSC-250,
SL-7-1,
SL-7-2 ,
SL-7-3,
SL-7-4 (
SHIP STRUCTURE COMMITTEE
These documents are distributed bu
PUBLICATIONS
the flationrzlTechnicalInformation Service, Springfield,”Va. 22151. !l%c?6e doc-uments have been announced in the Clearinghouse journa?,U.S. Government Research & Dew.Zopment Reports (USGRDR)under the indicated AD numbers.
Fast Fracture Rt?sista??ceand Crack Arrest ix Struetura1 SteeZs byG. T. Hahn, R. G. Hoagland, M. F. Kanninen, A. R. Rosenfield andR. Sejnoha. 1973. AO 775018.
Structural Analysis of SL-7 Containership under Combined Loading ofVertical, Lateral and Torsional Moments Using Finite Element Techniquesby A. M. Elbatouti, O. Liu and H. Y. Jan. 1974. AO-A 002620.
Fracture-Control Guidelines for Welded Steel Ship Hu116 by S. T. Ro]fe,O. M. Rhea and B. O. Kuzmanovic. 1974. AO-A 004553.
I
.4(hide for Inspection of High-Strength Steel Weldments by The WeldFlaw Evaluation Committee. (To be published).
l%eoretical Estimates of Wave Loads On the SL-7 Containership InRegular and Irregular Seas by P. Kaplan, T. P. Sargent and J. Cilmi. 1974.AO-A 004554.
Flame Straightening Quenched-And-Tempered SteeL.sin Ship Constructionby R. L. Rothman. 1974. AO-A 002621.
Fracture Toughness Characterizeztion of Shipbuilding Ste?eLs byJ. R. Hawthorne and F. J. Loss. 1974.
Ship-Vibration Prediction Methods and Evaluation of Influence of HuZ1Stiffness Variation on Vibratwy Response by R. G. K1ine andJ. C. Daidola. 1975.
BibLiography to Ship-Vibration Prediction Methods and Evaluation ofInfZienee of Hull Stiffness Variation on Vibratory Response byR. G. Kline and J. C. Oaidola. 1975.
SL-7 PUBLICATIONS TO OATE
(5SC 238] - Design and Installation of a Ship Response InstrumentationSystem Aboard the SL-7 Class Containership S.S. SEA-LANO !4cLEANbyR. A. Fain. 1974. AO 780090.
(SSC 239) - Wave Load. in a Model of the SL-7 Containership Running atOb7.iquaHeadings in Regular Waves by J. F. Dalzel1 and M. J. Chiocco.1974. AO 780065.
(SSC-243 ) - Strwetupal Analysis of SL-7 Container.shipUnder CombinedLoading of Vertical, Lateral and Tor.siona1 )40mentsUsing Finite ElementTechniques by A. M. Elbatouti , D. Lju and H. Y. Jan. 1974. AO-A 002620.
SSC-246 ), Theoretical Estimates of Wave Loads On the SL-7 Container
hip in Regu2ar and Irwgu2ar seas by P. Kaplan, T. P. Sargent andCilmi 1974. AO-A 004554.