Embed Size (px)
Citation preview
University of Wollongong University of Wollongong
Research Online Research Online
University of Wollongong Thesis Collection 1954-2016 University of Wollongong Thesis Collections
1998
A study of size segregation in the top part of an HYL-III reactor A study of size segregation in the top part of an HYL-III reactor
Gunawan Setyadi University of Wollongong
Follow this and additional works at: https://ro.uow.edu.au/theses
University of Wollongong University of Wollongong
Copyright Warning Copyright Warning
You may print or download ONE copy of this document for the purpose of your own research or study. The University
does not authorise you to copy, communicate or otherwise make available electronically to any other person any
copyright material contained on this site.
You are reminded of the following: This work is copyright. Apart from any use permitted under the Copyright Act
1968, no part of this work may be reproduced by any process, nor may any other exclusive right be exercised,
without the permission of the author. Copyright owners are entitled to take legal action against persons who infringe
their copyright. A reproduction of material that is protected by copyright may be a copyright infringement. A court
may impose penalties and award damages in relation to offences and infringements relating to copyright material.
Higher penalties may apply, and higher damages may be awarded, for offences and infringements involving the
conversion of material into digital or electronic form.
Unless otherwise indicated, the views expressed in this thesis are those of the author and do not necessarily Unless otherwise indicated, the views expressed in this thesis are those of the author and do not necessarily
represent the views of the University of Wollongong. represent the views of the University of Wollongong.
Recommended Citation Recommended Citation Setyadi, Gunawan, A study of size segregation in the top part of an HYL-III reactor, Master of Engineering (Hons.) thesis, Department of Materials Engineering, University of Wollongong, 1998. https://ro.uow.edu.au/theses/2472
Research Online is the open access institutional repository for the University of Wollongong. For further information contact the UOW Library: [email protected]
A STUDY OF SIZE SEGREGATION IN
THE TOP PART OF AN HYL-III REACTOR
A thesis submitted in fulfilment of the requirements for the award of the degree
Honours Master of Engineering
from
University of Wollongong
by
GUNAWAN SETYADI(Ir. UGM, Yogyakarta)
Department of Materials Engineering
July 1998

am enang i jam an edan
ewuh oya ing pam budi
m elu edan ora tahan
yen tan m elu ang lakon i
boya kedum an m elik
ka liren w eksananipun
d i I a l ah kersa A llah
begja begjane kang la li
luw ih begja wong kang e ling lan waspada
[Ki Rangga Warsita, the Javanese poet 1860s-1920s]
ii Gunawan Setvadi 9484663

DECLARATION
The results presented in this thesis are original and have never been
submitted, wholly.or partly, to any other institution or university.
Gunawan Setyadi
Gunawan Setvadi 9484663

ACKNOWLEDGMENTS
I would like to thank my supervisor, Professor Nick Standish, for his
advice, guidance, thoroughness and patience, from the beginning till the end
of this research. I wish also to thank the management of PT Krakatau Steel;
Ir. Fazwar Bujang MM., Ir. Wahyudi Utomo MM. and Ir. Nurhudin MEng., for
making it possible for me to join the PT Krakatau Steel scholarship program.
My special thanks go to the supervisor of PT Krakatau Steel Research
Laboratory, Ir. Hari Sumpono, for allowing me to use his laboratory facilities
during this research.
My special gratitude is due to my wife Endang, my daughter Ifti and
both of my parents, Abror and Minni, for their love, support and
encouragement.
IV Gunawan Setvadi. 9484663
ABSTRACT
A model of HYL-III top reactor with its feeding bin called UFO, has
been built to investigate size segregation phenomena in the top part of the
reactor. The model was one tenth of the actual size, both for the equipment
and the material used in the experiment. To give more comprehensive
overview of the investigation, a prediction of segregation in the HYL-III
reactor feeding system was also done at each of the main equipment in the
system.
Some factors that may affect the size segregation which were
observed in this study are size distribution of the material, solids flow rates
and the charging and discharging mode. Two kinds of material size
distributions, two kinds of solids flow rates, five kinds of UFO model charging
modes and two kinds of UFO model discharging modes were investigated.
To understand the effect of size distribution on the particle
segregation, two kinds of materials were used, i.e. one that was close to the
actual concentration of large and small particles ({ + {), and the other that
each size range has an equal concentration. The effect of solids flow rates
was investigated by discharging the UFO model in a low and high solids flow
rates. Five charging modes were investigated to understand their effect. The
effect of discharging mode was measured by blocking one of the UFO model
legs.
Segregation was investigated by taking samples from the reactor
model, screening them and comparing the results with the initial composition.
v Gunawan Setvadi 9484663
The results have shown that the solids with an equal initial
composition of large, medium and small particles segregate easier than if it
has the lower initial composition of large and small particles, except for when
a cone is inserted. For the same initial solids composition, the higher the
solids flow rate during discharge the lower is the segregation. The layered
solids charging in the UFO model gave more segregated results than for the
complete mixing charge. The segregation results that match with the “ideal
condition” were only for the case of legs only charging. A single center
charging mode in the UFO model causes more segregated results, and the
presence of inserted cone reduces it. The one leg blocked charging mode
had no significant effect on the segregation, but had a big effect on the
burden distribution of the solids in the reactor. The segregation results
obtained from an industrial HYL-III reactor showed a closer similarity with the
results from the case of low initial concentration of large and small particles
with cones inserted in UFO model, than with any other charging mode
investigated.
Sampling positions were chosen to obtain as a general picture of the
segregation as possible that may yield comprehensive information.
VI Gunawan Setvadi 9484663
CONTENTS
DECLARATION ................................................................................ jjj
ACKNOWLEDGMENT ....................................................................... jv
ABSTRACT ......................................................................................... v
CONTENTS ......................................................................................... vii
NOTATION ......................................................................................... x
1. INTRODUCTION ................................................................................. 1
1.1. Background ....................................................................... 1
1.2. Identification of the problem ............................................ 2
1.3. Objective of the study ..................................................... 5
2. THEORETICAL ASPECTS ............................................................... 6
2.1. Solid-gas reaction and contacting .................................... 6
2.2. Free surface segregation ...................................................... 10
2.2.1. Piling segregation ...................................................... 10
2.2.2. Shape and density effect in free surface segregation 12
2.2.3. Gas flow effect in free surface segregation ......... 12
2.2.3. Effect of height in free surface segregation .......... 14
2.3. In-bin segregation ................................................................ 15
2.3.1. In-bin segregation during its charging ................... 15
2.3.2. Effect of charging angle on in-bin segregation ........... 16
2.3.3. Effect of bin geometry on in-bin segregation ........... 17
2.3.4. Effect of repulsion box on in-bin segregation ........... 18
2.3.5. Effect of solids flow rate on in-bin segregation .. 19
vii Gunawan Setvadi 9484663
2.3.6. Effect of charging condition on in-bin segregation ... 20
2.3.7. In-bin segregation during discharge ...................... 23
2.3.8. Effect of bin flow pattern on discharge segregation ... 25
2.4. Flowability of a bulk solid ........................................................ 30
3. HYL-III REACTOR CHARGING SYSTEM AND SEGREGATION
PREDICTION ................................................................................... 33
3.1. Description of an HYL-III charging system ............................. 33
3.2. Prediction of segregation pattern in the HYL-III reactor charging
system .................................................................................. 34
3.2.1. Segregation in the day bin ..................................... 34
3.2.2. Segregation in the loading bin ..................................... 37
3.2.2. Segregation in the pressurized bin ............................ 39
3.3. UFO type of bin ......................................................................... 40
4. EXPERIMENTAL EQUIPMENT AND PROCEDURE ................... 43
4.1. Similarity criteria ................................................................. 43
4.2. Experimental apparatus ....................................................... 44
4.3. Experimental procedure ....................................................... 47
4.3.1. Size distribution ........................................................ 47
4.3.2. Solids flow rates ....................................................... 48
4.3.3. Charging mode ........................................................ 49
4.3.4. Discharging mode ......................................................... 51
4.4. Sampling procedure ................................................................. 52
4.5. Flowability of the solids ........................................................ 53
viii Gunawan Setvadi 9484663
5. EXPERIMENTAL RESULTS AND DISCUSSION 56
5.1. Reproducibility of the data ........................................................ 56
5.2. Experimental results ................................................................ 58
5.3. Discussion ........................................................................ 61
5.4. Flowability of the solids ....................................................... 71
5.5. Application of the results ....................................................... 72
6. CONCLUSIONS .................................................................................. 76
REFERENCES............................................................................................ 78
APPENDIX A EXPERIMENTAL RESULTS ..................................... 81
APPENDIX B CALCULATIONS ....................................................... 95
ix Gunawan Setvadi 9484663

NOTATION
Cd drag coefficient, dimensionless
Cg gas concentration, mole/cm3.
C s solid concentration, mole/cm3.
F b buoyant force, N.
F d drag force, N.
Fg gravitational force, N.
g gravitational constant, m/sec2.
k9 mass transfer coefficient of the gas phase, mole/cm2. sec. atm.
ks first order reaction rate constant based on unit surface, cm/sec.
Ld length characteristic of the geometry, m.
m mass of solid, kg.
N a moles of component A.
NRe Reynolds number, dimensionless
Q g flux of transferred gas, mole/cm2.sec.
Qreaction flux of reacted material, mole/cm2.sec.
Q S flux of reacted solid, mole/cm2.sec.
Qtransfer flux of transferred material, mole/cm2.sec.
rA” rate of reaction based on unit surface, moles A formed/cm2.sec.
S maximum projected area normal to flow, m2.
s space velocity, sec.'1
t time, sec.
u linear velocity, m/sec.
X Gunawan Setvadi 9484663

Ufs free stream velocity, m/sc.
half hopper angle, deg.a
Ô effective angle of internal friction, deg.
<|> wall friction angle, deg.
[i fluid viscosity, kg/m. sec.
p fluid density, kg/m3.
ps solid density, kg/m3.
XI Gunawan Setvadi 9484663
CHAPTER ONE
I N T R O D U C T I O N
1.1. BACKGROUND
PT Krakatau Steel (PT KS) has been operating the HYL-III plant since
February 1994. The plant consists of two reactors with the design capacity of
1.35 million tonnes per year. HYL-III plant consists of two independent
sections i.e., reforming section and reducing section. Reforming section
treats natural gas to produce reducing gas which contains 72.0 % H2 and
14.5 % CO and the rest is CH4, C 02 and H20. Reduction section treats iron
ore pellets (solids) to produce sponge iron, with H2 and CO as a reducing
gas. Both solids and the gas (reducing gas) react by the following equations :
Fe203 + 3 H2 ---------> 2 Fe + 3 H20
Fe2Oa + 3 CO - -> 2 Fe + 3 C 02
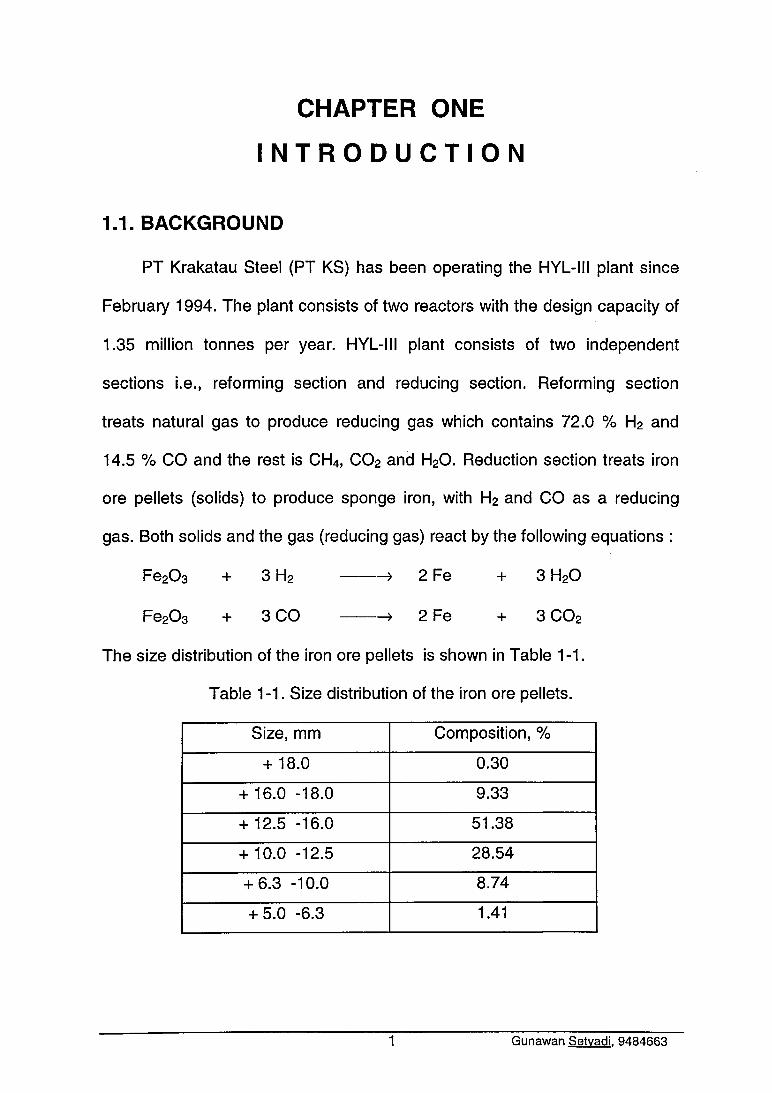
The size distribution of the iron ore pellets is shown in Table 1-1.
Table 1-1. Size distribution of the iron ore pellets.
Size, mm Composition, %
+ 18.0 0.30
+ 16.0 -18.0 9.33
+ 12.5 -16.0 51.38
+ 10.0 -12.5 28.54
+ 6.3 -10.0 8.74
+ 5.0 -6.3 1.41
1 Gunawan Setvadi. 9484663

Because the reactions involve gas and solids the following are
considered as important factors, i.e. reduction potential ( H2 and CO content),
gas volume per unit time, gas pressure, gas flow pattern in the reactor which
has correlation with solids segregation, and, gas temperature.
1.2. IDENTIFICATION OF THE PROBLEM
HYL-III reactor is fed by a vessel named UFO which has four legs
inserted to the top part of the reactor, whilst the UFO is fed by the cold
pressurized feeding bin. Schematic arrangement of the reactor feeding
system can be seen in Figure 1-1 and the detail drawing of the UFO in Figure
3-5. The solids from the pressurized feeding bin come into the UFO from one
fill point in the center. Then, the solids from the UFO come into the reactor
through its four legs together and continuously, so that there are four fill
points in the reactor. Schematic diagram of the fill points can be seen in
Figure 1-2. In normal operation, the ends of the legs are always in touch with
the solids inside the reactor, because the solids in the UFO has a minimum
level before it is recharged (the UFO is never empty).
There is an important phenomenon during filling of solids in any vessel,
i.e. its tendency to segregate. Size segregation of particulate material is one
of the major problems that plagues all processing industries handling bulk
solid material, when material to be processed consists of particles varying in
size [ Standish et al., 1985]. Many researches have shown that on filling
hoppers or bins, small particles concentrate under the fill-point, large particles
2 Gunawan Setvadi. 9484663

roll or slide to the outer edges of the pile, and medium size particles are
distributed relatively uniformly.
Figure 1-1. Schematic diagram of HYL-III reactor charging system.
3 Gunawan Setvadi. 9484663
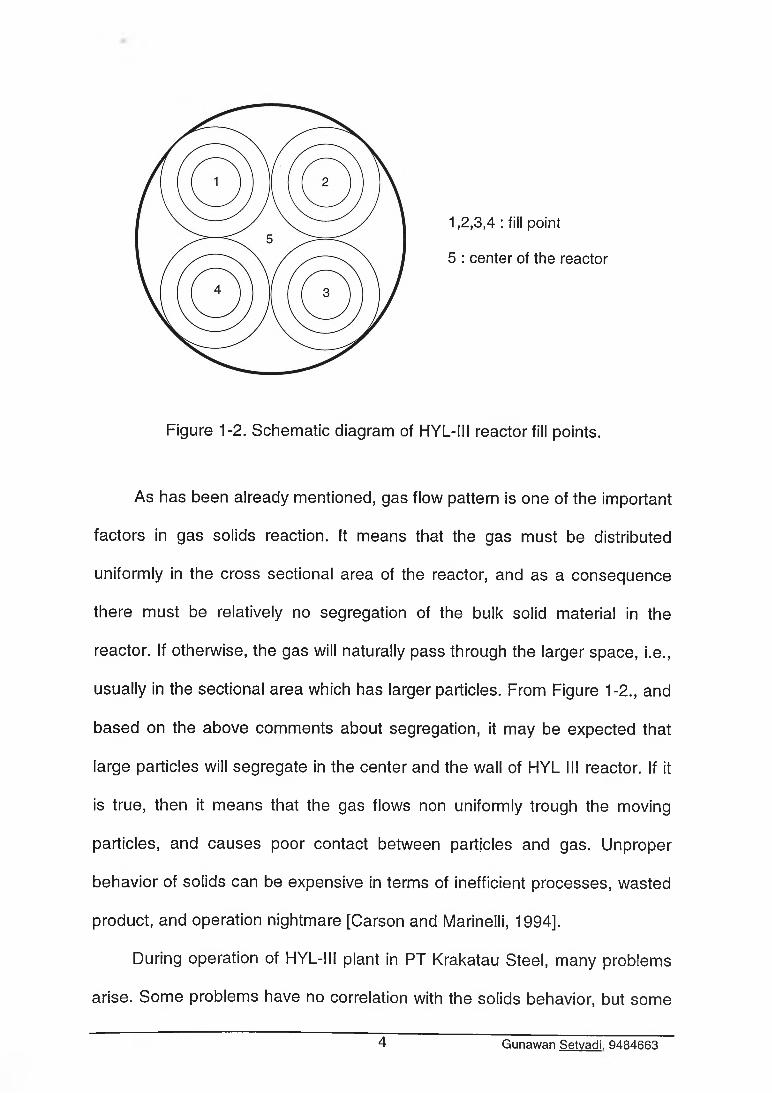
1,2,3,4 : fill point
5 : center of the reactor
Figure 1-2. Schematic diagram of HYL-III reactor fill points.
As has been already mentioned, gas flow pattern is one of the important
factors in gas solids reaction. It means that the gas must be distributed
uniformly in the cross sectional area of the reactor, and as a consequence
there must be relatively no segregation of the bulk solid material in the
reactor. If otherwise, the gas will naturally pass through the larger space, i.e.,
usually in the sectional area which has larger particles. From Figure 1-2., and
based on the above comments about segregation, it may be expected that
large particles will segregate in the center and the wall of HYL III reactor. If it
is true, then it means that the gas flows non uniformly trough the moving
particles, and causes poor contact between particles and gas. Unproper
behavior of solids can be expensive in terms of inefficient processes, wasted
product, and operation nightmare [Carson and Marinelli, 1994].
During operation of HYL-III plant in PT Krakatau Steel, many problems
arise. Some problems have no correlation with the solids behavior, but some
4 Gunawan Setvadi. 9484663
others predictably have. Some problems directly related with solids behavior
are reactor hot spots, one or more UFO legs blocked and flow interruption in
the reactor during direct reduction discharging.
1-3- OBJECTIVE OF THE STUDY
In view of the above and the fact that we have no basic information
about such reactor phenomena, it is important to explore and to understand
them. Therefore, the aim of this study is to investigate the general picture of
segregation and related phenomena that may yield useful information for the
gas flow in the actual HYL-III reactor in PT. Krakatau Steel, in order to give
inputs for a better operation.
5 Gunawan Setvadi. 9484663
CHAPTER TWO
THEORETICAL ASPECTS
In heterogeneous reacting systems, flow distribution between the
reactants has very important role for the chemical reaction rate
because flow distribution will directly influence the contacting pattern.
Contacting pattern, in turn, affects the total reaction rate. In the
ironmaking process, where fluid-particle reaction takes place, analysis
of the flow dynamics of granular materials is essential for the
prevention of segregation, and improvement of solids flow pattern in
the reactor.
HYL-III reactor is a reactor which treats flowing bulk solids with
gas, and is the object of this research. Since there is a practical
lim itation of doing the research in the plant, a one-tenth scale reactor
model is used. In order to make the solids flow characteristics of the
model as similar as possible with the solids flow characteristics of the
real reactor, the smaller solids diameter is used in the research. The
interpretation of the segregation, and solids flow pattern in the reactor
is done by using the data obtained from the model (research).
2.1. SOLIDS-GAS REACTION AND CONTACTING
When gas or liquid contacts a solid, reacts with it, and transforms
it into a product, it may be represented by:
6 Gunawan Setvadi. 9484663
& Afiuid + b Bsoiid fluid products (2 .1 )•>
a Afiuid + b BSo i i d ----------- > solid products
a Af|Uid + b BSo M d ----------- » fluid and solid products
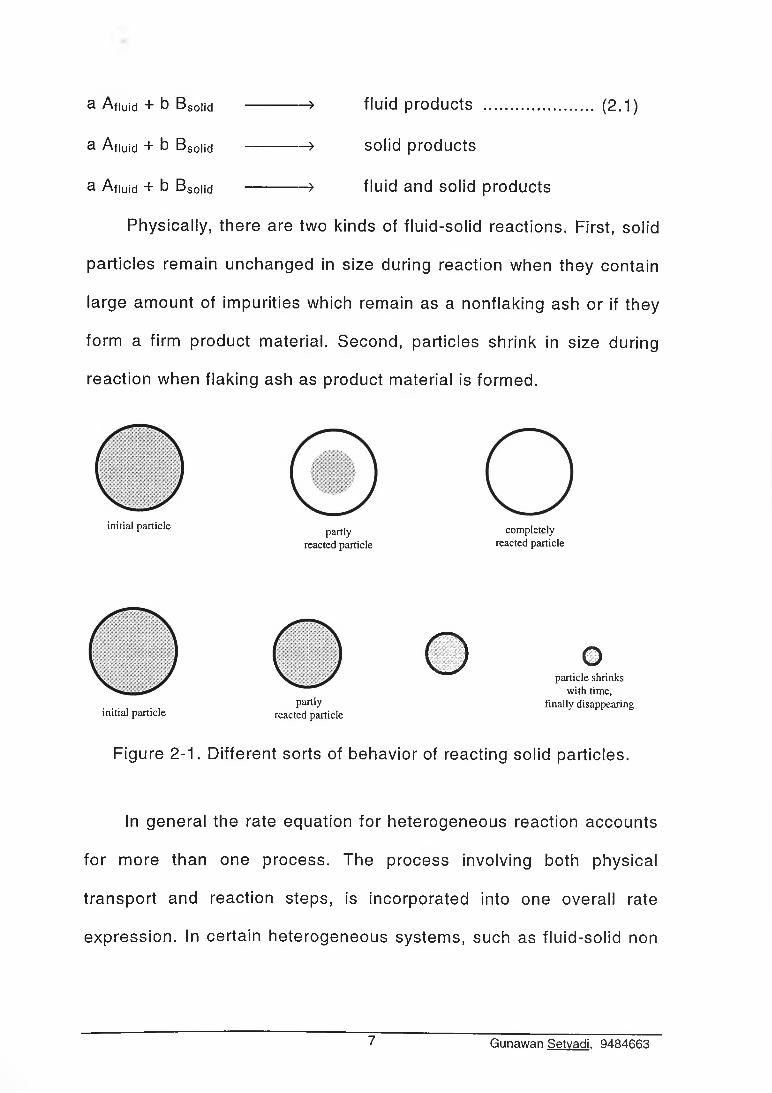
Physically, there are two kinds of fluid-solid reactions. First, solid
particles remain unchanged in size during reaction when they contain
large amount of impurities which remain as a nonflaking ash or if they
form a firm product material. Second, particles shrink in size during
reaction when flaking ash as product material is formed.
initial particle partly completely
reacted particle reacted particle
initial particlepartly
reacted particle
G °particle shrinks
with time, finally disappearing
Figure 2-1. Different sorts of behavior of reacting solid particles.
In general the rate equation for heterogeneous reaction accounts
for more than one process. The process involving both physical
transport and reaction steps, is incorporated into one overall rate
expression. In certain heterogeneous systems, such as fluid-solid non
7 Gunawan Setvadi. 9484663
Two points should be mentioned here. First, when rates are to be
compared or combined, they should be defined in the same manner.
As an example, suppose we wish to combine a mass transfer and a
reaction step. Since the rate of mass transfer is defined as the flow of
material normal to a unit of surface, or
Qtransfer = ............................................................. (2 .2)s dt
then the reaction step must similarly be defined, as shown in equation
(2.3)
- . ■ 1 d N . , ,Qreaction — t"A — -----:— .................................................... (2 -3)
S dt
Thus the rate of reaction should be based on unit area rather than on
unit volume.
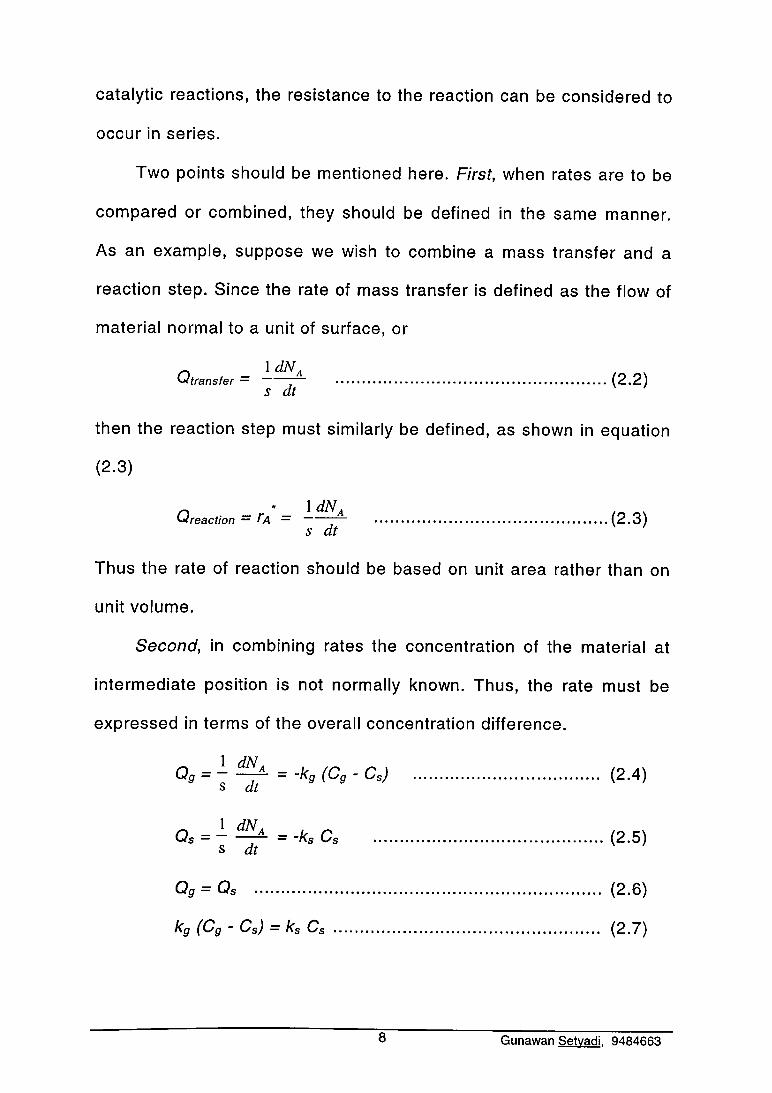
Second, in combining rates the concentration of the material at
intermediate position is not normally known. Thus, the rate must be
expressed in terms of the overall concentration difference.
C g = ~ ~ 7 T = ~kg (C g - C s) .......................................... (2 .4)s at
Q s = - = -k. Cs ....................................................(2.5)S dt
Cg = Qs ............................................................................................ (2.6)
kg (Cg - Cs) = ks Cs ............................................................ (2.7)
catalytic reactions, the resistance to the reaction can be considered to
occur in series.
8 Gunawan Setvadi. 9484663
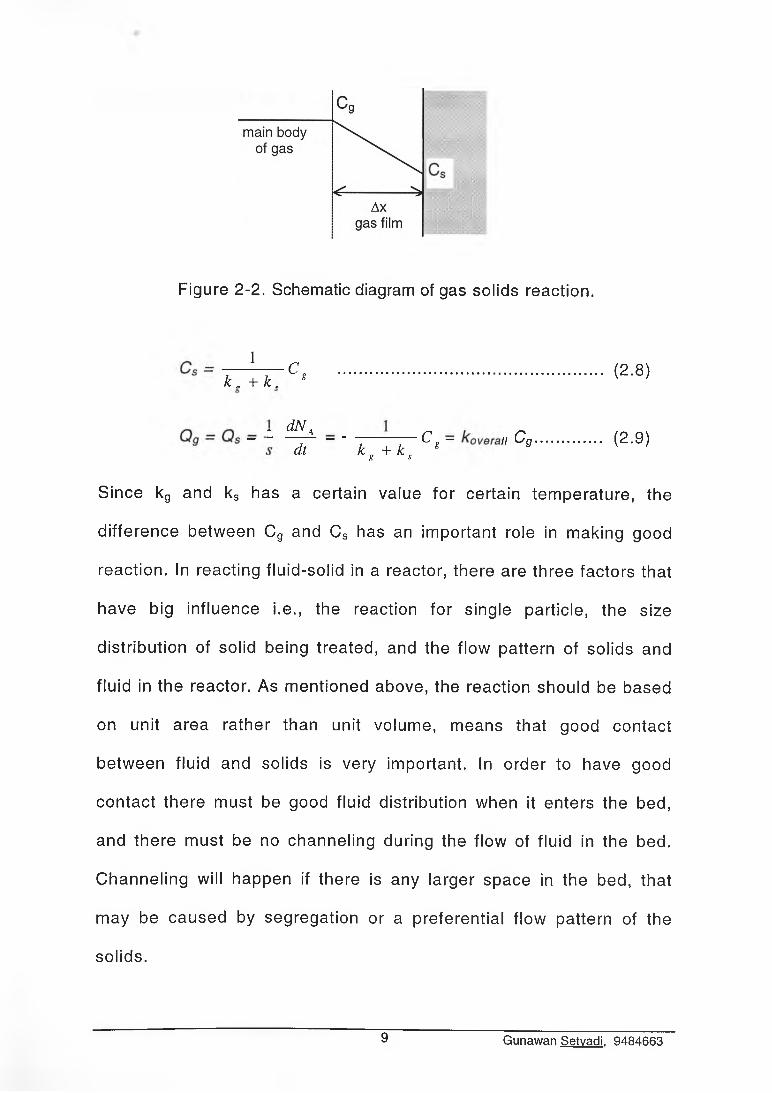
Figure 2-2. Schematic diagram of gas solids reaction.
— !— ck . + k . s
(2 .8)
Qg ~Qs~ ]Z t ~ ' T ~ 7 T Cg ~ " Cg... (2'9)8 s
Since kg and ks has a certain value for certain temperature, the
difference between Cg and Cs has an important role in making good
reaction. In reacting fluid-solid in a reactor, there are three factors that
have big influence i.e., the reaction for single particle, the size
distribution of solid being treated, and the flow pattern of solids and
fluid in the reactor. As mentioned above, the reaction should be based
on unit area rather than unit volume, means that good contact
between fluid and solids is very important. In order to have good
contact there must be good fluid distribution when it enters the bed,
and there must be no channeling during the flow of fluid in the bed.
Channeling will happen if there is any larger space in the bed, that
may be caused by segregation or a preferential flow pattern of the
solids.
9 Gunawan Setvadi. 9484663
2.2. FREE SURFACE SEGREGATION
During the storage and handling operations, a bulk solid tends to
segregate (separate) according to the particle size, shape and density.
Segregation of the particles can be serious and costly problem. It is
often the cause of unexplained variations in operating conditions and
in variations in product quality.
2.2.1. Piling Segregation.
Most of segregation during pile builds up takes place in the
following two situations. F irs t in freely falling stream which has
horizontal component of velocity. In free fall, each particle is acted
upon by two forces: its weight and its air resistance to motion. The
former is equal to the product of the volume and density of the
particle, and acts vertically down; the latter is a function of the size
and shape of the particle and of its velocity, and acts in the direction
opposite to the velocity. In vertical free fall, both these forces are
vertical, and while the terminal velocities of the various particles may
vary, their trajectories do not, hence there is no significant
segregation. When a solid is discharged over a conveyor pulley or
spouted through or an inclined chute, the initial horizontal component
of velocity is introduced, the two forces are not aligned any longer,
and as their ratios differ for the various particles, so do the trajectories
of the particles, which then segregate.
10 Gunawan Setvadi. 9484663
Second, when a stream hits a sloping surface. Whenever a
stream hits a sloping surface, the particles roll down the slope: the
large, heavy, and more nearly spherical particles tend to roll farther
than the fine, light, and flaky particles which tend to remain at the
point of impact of the stream. As a pile of the solid builds up, the fines
concentrate in the center of the pile; the size of the particles gradually
increases with the distance from the column toward the periphery of
the pile of the walls of the bin. If the outlet of a pile or of a plug-flow
bin is located directly beneath the trajectory, the draw will be heavily
segregated. An excess of fines will be drawn every time the feeder is
started after charging the solid while the feeder was at rest. When the
container has several outlets, the outlet under the trajectory will
consistently draw an excess of fines.
The foregoing indicates that segregation is a dynamic effect and
occurs inevitably when the solid is in free fall. It also indicates
methods of minimizing segregation, which are: reducing the velocity of
particles by shortening the height of free fall, reducing the horizontal
component of velocity, and limiting the area of the slopes over which
the particles roll. Another method in minimizing segregation is by
moving the point of discharge, in order to make the solids spread well.
11 Gunawan Setvadi. 9484663
3 0009 03254591 0
2.2.2. Shape And Density Effect On Free Surface Segregation.
Literature [Standish., 1985] shows that provided they are not
excessive, the differences in shape and density have a minor influence
on segregation. In terms of particle shape influence, the more nearly
spherical shape particle, tend to roll or slide to the outer edges of the
pile, than the more flaky particles. In terms of particle density
influence, material with higher density tends to roll or slide to the outer
edges of the pile, than the less dense particles.
2.2.3 Gas Flow Effect On Free Surface Segregation.
It is a well know fact that if any surface is in contact with a fluid,
and a relative motion exists between the fluid and the surface, skin
friction will exist between the surface and the fluid. In addition to the
skin friction, significant frictional losses occur because of acceleration
and deceleration of the fluid. The accelerative effects occur when the
fluid changes path to pass around a solid body set in the flow path.
This phenomenon is the so called form drag. The drag coefficient (Cd)
is defined as (2.9)
CD = (2 . 10)
and the Reynolds number is
_ LDufsp
Re H(2 .11)
12 Gunawan Setvadi. 9484663

When a solid body falls in the fluid or when a fluid flows upward
at a solid body, there are three forces acting on the solid, i.e., gravity
force (Fg), buoyant force (FB), and the drag force (FD) due to fluid
friction in the direction of the velocity of the fluid relative to the
particle, as illustrated in Figure 2-3.
Figure 2-3. Schematic diagram of forces acting on a body falling in a
fluid.
The force balance is:
„ „ „ duF, - F D- F . = m-
F. = mg
(2 - 12)
(2.13)
Fr_ CDUfSpS
(2.14)
Fe =( \ m
\ P s )
Pf g (2.15)
Both the drag force and the buoyant force, slow down the falling
of the particle, and in case that the Fg = FD + FB, the solid (particle)
13 Gunawan Setvadi. 9484663
does not move at all or move at a constant speed. If this case
happens in the bed of solids it means that a small increase in the
velocity of the gas flow makes the bed fluidized. From the above
illustration it can be seen that the presence of a gas flow in a solids
bed will influence the segregation of the falling solids. In a view that
the two forces will reduce solids momentum of its falling, it may be
expected that the presence of gas flow will reduce a free surface
segregation.
2.2.4. Effect Of Height On Free Surface Segregation.
The effect of height on segregation of large and small particles
can be explained by the momentum principles of the heavier and
lighter particles. The result that the lowest concentration of large
particles is seldom in the center of the pile, on the other hand, the
height concentration of the small size particles is seldom in the
periphery of the pile, is explained by the momentum-size principle in
causing these particles to bounce off away from the center. This
behavior is a direct result of the low momentum preventing small
particle from bouncing off the free surface and the large particle from
bouncing into the center of the heap.
All the above effects influence the free surface segregation, but
all of the available evidence shows that the difference in particle size
is by far the most important [Standish, 1986].
14 Gunawan Setvadi. 9484663
2.3. IN-BIN SEGREGATION
In an ironmaking process, analysis of the behavior of granular
material, such as iron ore pellets is essential for the improvement of
segregation in the process of material transportation in the direct
reduction furnace. The research about flow dynamics of granular
material, formation of burden distribution and many researches about
size segregation in relation with the blast furnace operation have been
widely published [e.g. Standish and Jones, 1984; Standish, 1985;
Standish and Kilic,1985; Standish, 1986; Kajiwara, et.al., 1988;
Tanaka, et.al., 1988]. On the other hand, not many sim ilar researches
were published for the purpose of direct reduction improvement, such
in HYL-III or Midrex plant. Although the principles of the phenomena
may be applied in a direct reduction plant, it is still important to
understand more deeply the behavior of direct reduction plant.
The handling of material in bulk form is a major activity of the
ironmaking process, with bins and hoppers being the main equipment
in the handling system. Understanding the flow behavior of bulk solids
in bins and hoppers may prove beneficial in order that they perform
properly to improve the plant performance as a whole.
2.3.1. In-Bin Segregation During Its Charging.
From the previous theory about free surface segregation (Section
3.1), one can predict that all the effects of piling segregation are also
operative in the segregation of material in a bin no matter whether the
15 Gunawan Setvadi. 9484663
bin is mass flow bin or funnel flow bin. The in-bin segregation pattern
will be identical in both. The difference between these two bin types
will only be notable in the discharge segregation, that is in the
segregation of material in the discharge stream from the hoppers. And,
the difference between free surface segregation (piling segregation)
and in-bin segregation will only be relative because on free surface
segregation the pile width is limited by the material angle of repose,
but the pile width in in-bin segregation will be limited by the bin wall.
2.3.2. Effect Of Charging Angle On In-Bin Segregation.
In general it can be said that during central filling the bin with
solids of different size distribution, small particles will segregate in the
center, large particles will segregate in the periphery of the pile
(toward the bin wall) and the medium size particle distribution will be
essentially uniform. Where the charging point is in the center of the
bin and the solids fall in vertical direction, it may be expected that the
composition of the solids will be sim ilar through out the circle of the
pile.
In case of an angle pour point and the solids being poured
consist of a mixture of different size material, the previous studies
[e.g. Standish and Jones, 1984] prove that asymmetry of the solids
composition through out the circle of the pile will happen. It is possible
due to the resultant difference of momentum. However, if no
avalanche effect is operative, this condition may be caused by the
resultant forces to bounce off when the particles hit the surface.
16 Gunawan Setvadi. 9484663
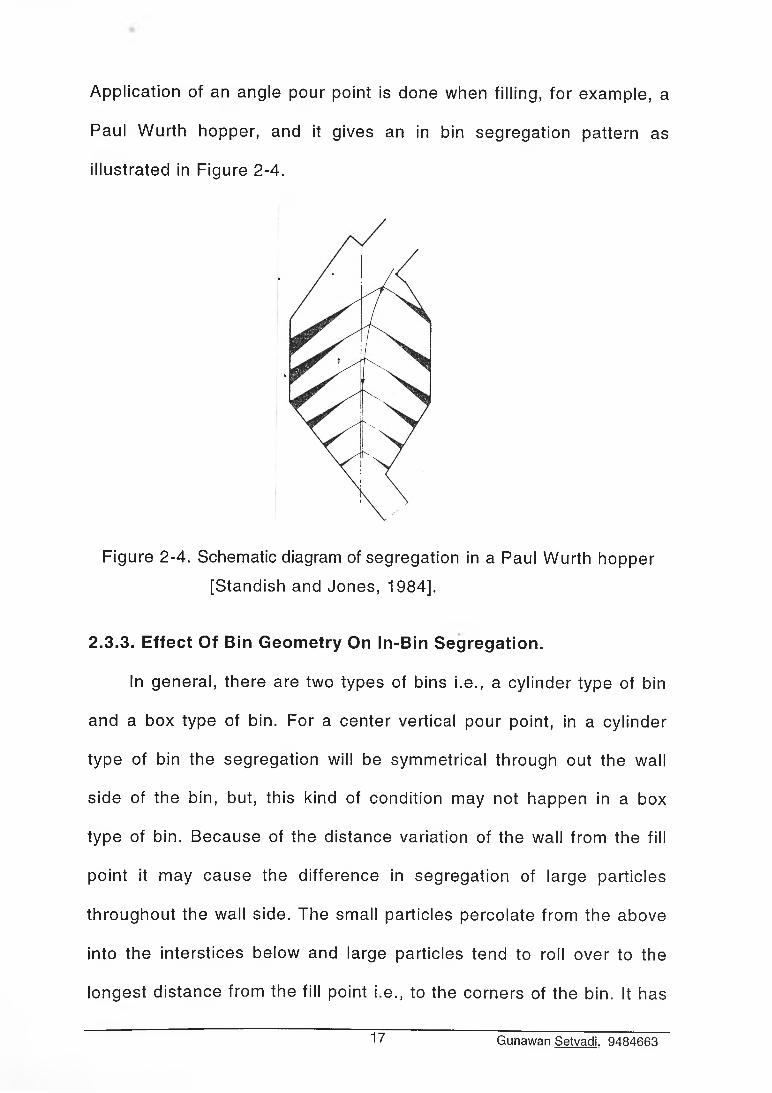
Application of an angle pour point is done when filling, for example, a
Paul Wurth hopper, and it gives an in bin segregation pattern as
illustrated in Figure 2-4.
Figure 2-4. Schematic diagram of segregation in a Paul Wurth hopper
[Standish and Jones, 1984].
2.3.3. E ffect Of Bin Geom etry On In-B in Segregation.
In general, there are two types of bins i.e., a cylinder type of bin
and a box type of bin. For a center vertical pour point, in a cylinder
type of bin the segregation will be symmetrical through out the wall
side of the bin, but, this kind of condition may not happen in a box
type of bin. Because of the distance variation of the wall from the fill
point it may cause the difference in segregation of large particles
throughout the wall side. The small particles percolate from the above
into the interstices below and large particles tend to roll over to the
longest distance from the fill point i.e., to the corners of the bin. It has
17 Gunawan Setvadi. 9484663
been shown, [Standish,1986] that the effect of size difference on the
percolation velocity is almost exponential. So, the highest
concentration of the large particles will be in the corners of the bin and
gradually decrease to the middle of the bin wall.
2.3.4. Effect Of Repulsion Box On In-Bin Segregation.
The effect of a repulsion box in charging a bin [Tanaka et.al.,
1988] was described in the study of “Flow Dynamics of Granular
Materials in a hopper” . In the article it was mentioned that without
repulsion box small particles segregate in the central part of the
hopper. On the other hand, with repulsion box small particles deposit
slightly both in the central part and in the wall part, while they deposit
more in the middle part where peaks are formed during charge. Since
the position of peaks is related with the falling trajectory of particles,
the peaks position during charge depends on the height as well as the
size of repulsion box, as illustrated in Figure 2-5.
18 Gunawan Setvadi. 9484663
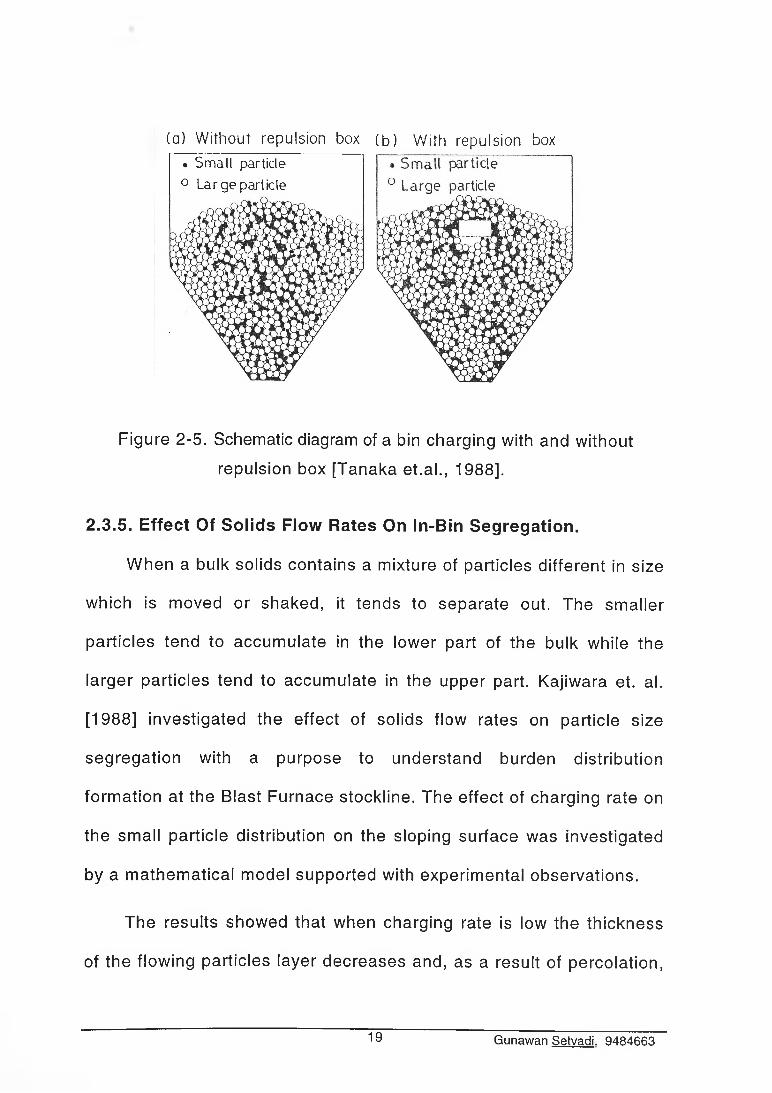
(a) Without repulsion box• Small particle 0 Large particle
(b) With repulsion box
Figure 2-5. Schematic diagram of a bin charging with and without
repulsion box [Tanaka et.al., 1988].
2.3.5. E ffect Of S o lids Flow Rates On In-B in Segregation.
When a bulk solids contains a mixture of particles different in size
which is moved or shaked, it tends to separate out. The smaller
particles tend to accumulate in the lower part of the bulk while the
larger particles tend to accumulate in the upper part. Kajiwara et. al.
[1988] investigated the effect of solids flow rates on particle size
segregation with a purpose to understand burden distribution
formation at the Blast Furnace stockline. The effect of charging rate on
the small particle distribution on the sloping surface was investigated
by a mathematical model supported with experimental observations.
The results showed that when charging rate is low the thickness
of the flowing particles layer decreases and, as a result of percolation,
19 Gunawan Setvadi. 9484663
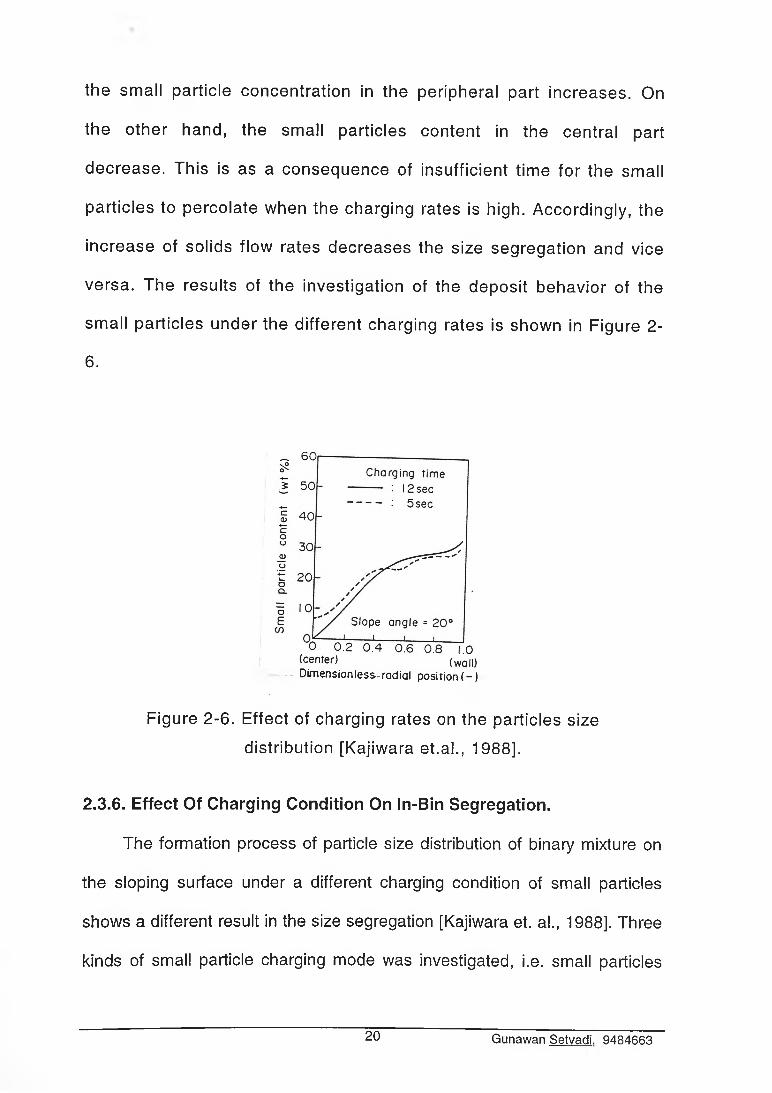
the small particle concentration in the peripheral part increases. On
the other hand, the small particles content in the central part
decrease. This is as a consequence of insufficient time for the small
particles to percolate when the charging rates is high. Accordingly, the
increase of solids flow rates decreases the size segregation and vice
versa. The results of the investigation of the deposit behavior of the
small particles under the different charging rates is shown in Figure 2
6.
• ••— Dimensionless^radial position ( - )
Figure 2-6. Effect of charging rates on the particles size
distribution [Kajiwara et.al., 1988].
2.3.6. Effect Of Charging Condition On In-Bin Segregation.
The formation process of particle size distribution of binary mixture on
the sloping surface under a different charging condition of small particles
shows a different result in the size segregation [Kajiwara et. al., 1988]. Three
kinds of small particle charging mode was investigated, i.e. small particles
20 Gunawan Setvadi. 9484663
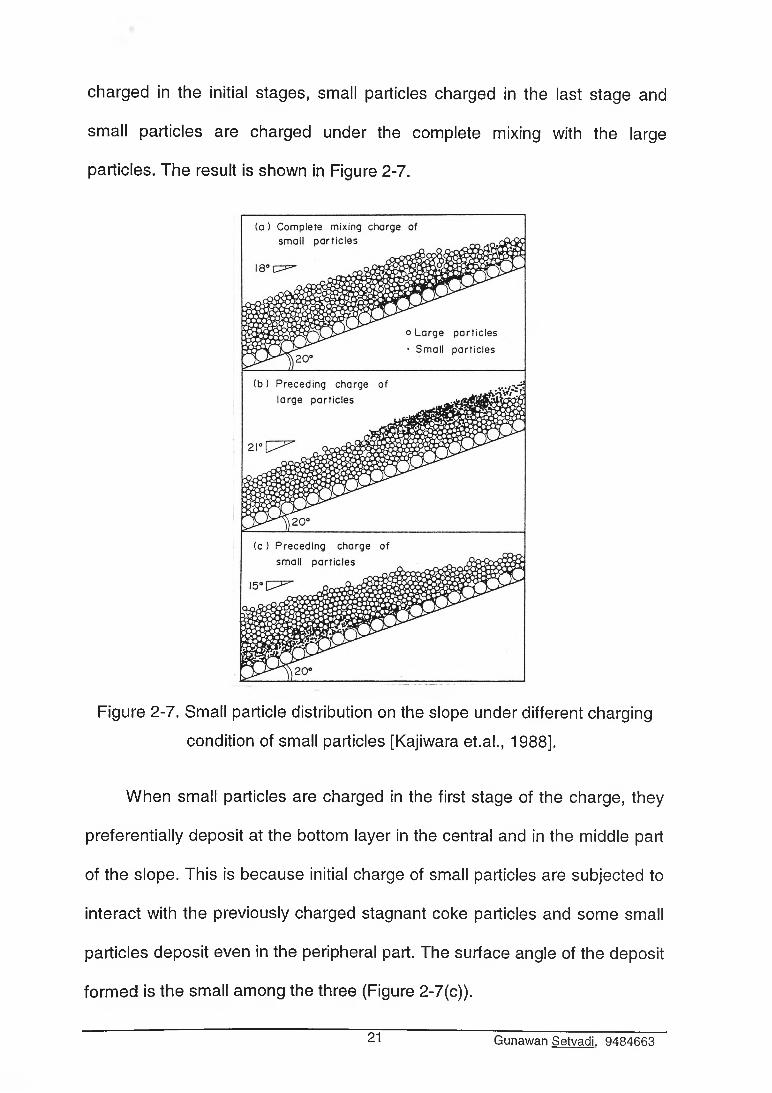
charged in the initial stages, small particles charged in the last stage and
small particles are charged under the complete mixing with the large
particles. The result is shown in Figure 2-7.
Figure 2-7. Small particle distribution on the slope under different charging
condition of small particles [Kajiwara et.al., 1988].
When small particles are charged in the first stage of the charge, they
preferentially deposit at the bottom layer in the central and in the middle part
of the slope. This is because initial charge of small particles are subjected to
interact with the previously charged stagnant coke particles and some small
particles deposit even in the peripheral part. The surface angle of the deposit
formed is the small among the three (Figure 2-7(c)).
21 Gunawan Setvadi. 9484663
When small particles are charged in the last stage of the charge, they
preferentially deposit at the surface layer mostly in the peripheral part and
the surface angle of the deposit formed is the largest (Figure 2-7(b)).
When small particles are charged under a complete mixing with the
large particles, the small particles monotonously decrease toward the center.
This is because the small particles are subjected to percolation action on the
slope, then deposit more in the peripheral part. The surface angle of the
deposit formed is in between the other two (Figure 2-7(a)).
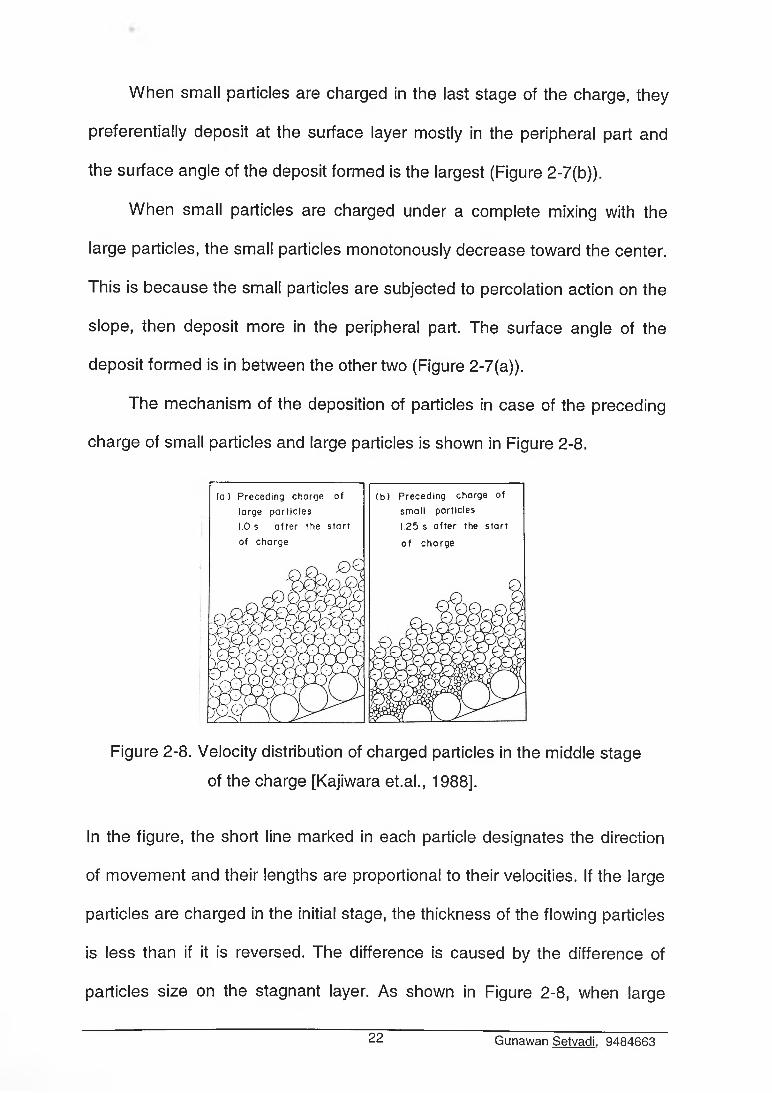
The mechanism of the deposition of particles in case of the preceding
charge of small particles and large particles is shown in Figure 2-8.
(a) Preceding charge of large particles 1.0 s after the start of charge
(b) Preceding charge of small particles 1.25 s after the start of charge
Figure 2-8. Velocity distribution of charged particles in the middle stage
of the charge [Kajiwara et.al., 1988].
In the figure, the short line marked in each particle designates the direction
of movement and their lengths are proportional to their velocities. If the large
particles are charged in the initial stage, the thickness of the flowing particles
is less than if it is reversed. The difference is caused by the difference of
particles size on the stagnant layer. As shown in Figure 2-8, when large
22 Gunawan Setvadi. 9484663
particles exist in stagnant layer as a result of charging large particles in the
initial stage, flowing particles collide with large particles in the stagnant layer
and the flowing particles rapidly dissipate their kinetic energy. The difficulty of
particles to move toward the central part causes higher deposit angle. On the
other hand, when small particles exist in the stagnant layer as a result of
their initial charging, flowing particles collide with small particles in the
stagnant layer and the dissipation of the kinetic energy of the flowing
particles is not as rapid as the previous case. The easiness of the movement
of the particles to the central part causes low deposit angle.
2.3.7. In-Bin Segregation During Discharge.
Gravity flow of solids is a common operation in many industries.
Reliable and predictable flow of solids from a bin under the influence
of gravity is an important part of a bin criterion, in order that the design
and operational efficiency of handling system can be improved. There
are now well established techniques for the determination of the flow
properties of the bulk solids and a considerable number of case
studies are available demonstrating the application of the bulk solids
flow theories to a wide variety of industrial problems [Arnold, 1992].
The flow pattern of material passing through a vessel (bin) is most
conveniently analyzed by the stimulus response technique, whereby a
known input is introduced at the bin inlet and the response measured
at the outlet of the bin. By analyzing of the response then gives the
behavior of the material passing trough the bin. Basically, there are
two kinds of solids flow patterns in bins i.e., mass-flow and funnel-
23 Gunawan Setvadi. 9484663
flow. In mass-flow the bulk solid is in motion at substantially every
point in the bin whenever solids are drown from the outlet. The solids
flow along the walls with the bin and hopper forming the flow channel.
Mass-flow occurs when the hopper walls are sufficiently steep and
smooth and there are no abrupt transitions or inflowing valleys.
Funnel-flow, on the other hand, occurs when the bulk solids
slough off the surface and discharge trough a vertical channel which
forms within the material in the bin. This mode of flow occurs when the
hopper walls are rough and the slope angle is too large. The flow is
erratic with a strong tendency to form stable pipes which obstruct bin
discharge. When flow does occur segregation takes place, there being
no remixing during flow. It is undesirable flow pattern for many bulk
solids.
Mass-flow bins are classified according to the hopper slope and
associated flow pattern. The limit for the mass flow depends on the
hopper half angle, the wall friction angle and the effective angle of
internal friction. Funnel-flow bins are characterized either by the squat
hopper proportion or their flat bottom. For funnel-flow bins to operate
satisfactorily it is necessary to ensure that the solids will not form a
stable pipe but rather will always collapse and flow, that is much
influenced by the hopper opening size. Therefore, the flow pattern in a
bin is actually dependent on the hopper and its related factor. Typical
mass-flow and funnel-flow bins are shown in Figure 2-9.
24 Gunawan Setvadi. 9484663
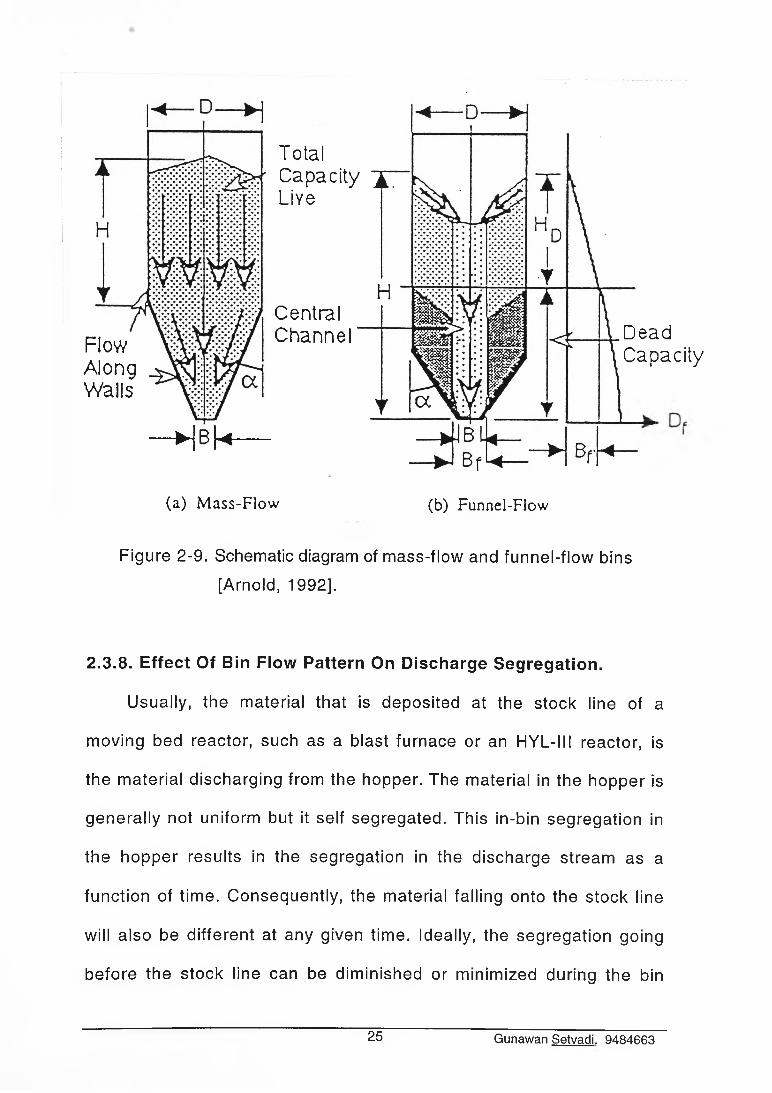
TotalCapacity f Liye
FlowAlongWalls
CentralChannel
— H Bk
DeadCapacity
(a) M ass-F low (b) Funnel-Flow
Figure 2-9. Schematic diagram of mass-flow and funnel-flow bins
[Arnold, 1992].
2.3.8. E ffect Of Bin Flow Pattern On D ischarge Segregation.
Usually, the material that is deposited at the stock line of a
moving bed reactor, such as a blast furnace or an HYL-III reactor, is
the material discharging from the hopper. The material in the hopper is
generally not uniform but it self segregated. This in-bin segregation in
the hopper results in the segregation in the discharge stream as a
function of time. Consequently, the material falling onto the stock line
will also be different at any given time. Ideally, the segregation going
before the stock line can be diminished or minimized during the bin
25 Gunawan Setvadi. 9484663
discharge, because, segregation in the discharge from any hopper is
governed by the inter relationship of in-bin segregation and the flow
pattern of the solids in the hopper.
The methods that may be used in discharging solids from a
hopper are the stop-start and continuous discharging. Standish and
Kilic [1985], studied stop-start and continuous discharging from a
hopper consisting of plug flow region, mixed flow region and the dead
volume. The flow pattern was measured by a tracer analysis. The
results showed that during discharging the plug flow volume the tracer
concentration was independent of the operating mode of the hopper,
i.e. whether as a batch vessel or a continuous vessel. However, after
reaching the peak of the curve the two sets of the data were not
identical but only similar. The increase in the lateral spread of the
batch curve indicated an increase in the plug flow dispersion or the
intermixing in batch operation. The flow dispersion or the intermixing
will reduce solids segregation during discharge, because of a re
mixing of the solids segregated in the bin. The curve of the batch and
the continuous discharge is shown in Figure 2-10.
26 Gunawan Setvadi. 9484663
0 0-2 0 4 0 6 0-8 1 0 12 1-4
F R A C TIO N D IS C H A R G ED
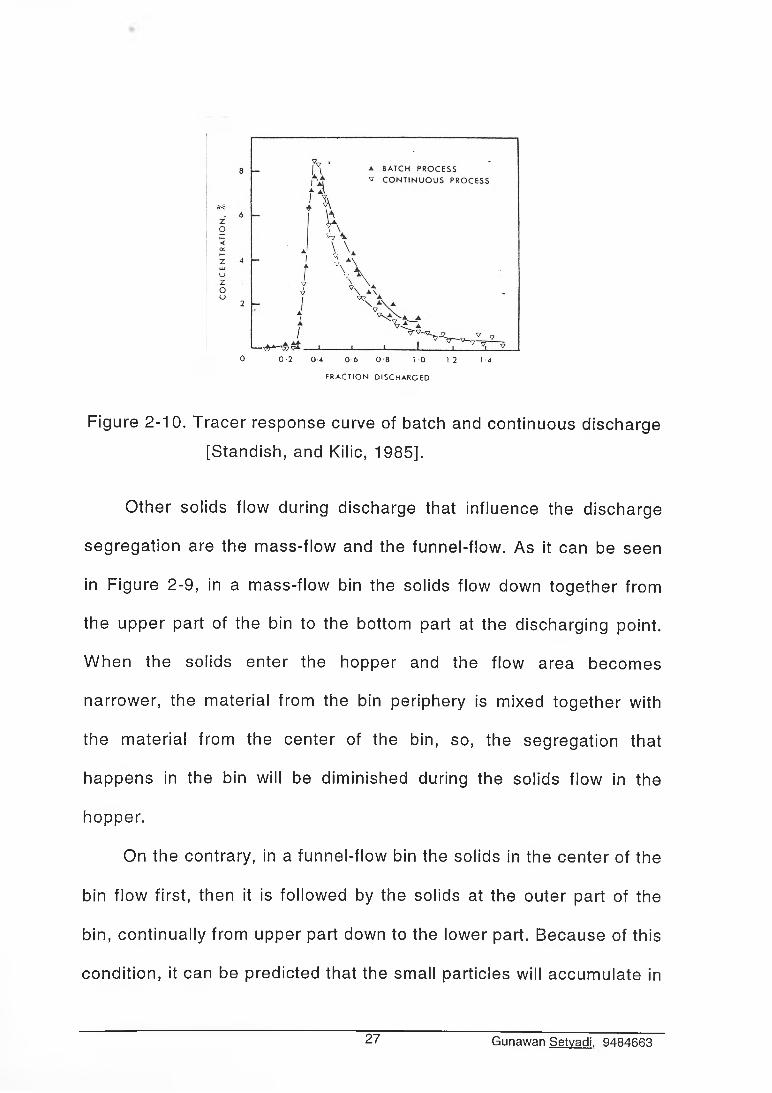
Figure 2-10. Tracer response curve of batch and continuous discharge
[Standish, and Kilic, 1985].
Other solids flow during discharge that influence the discharge
segregation are the mass-flow and the funnel-flow. As it can be seen
in Figure 2-9, in a mass-flow bin the solids flow down together from
the upper part of the bin to the bottom part at the discharging point.
When the solids enter the hopper and the flow area becomes
narrower, the material from the bin periphery is mixed together with
the material from the center of the bin, so, the segregation that
happens in the bin will be diminished during the solids flow in the
hopper.
On the contrary, in a funnel-flow bin the solids in the center of the
bin flow first, then it is followed by the solids at the outer part of the
bin, continually from upper part down to the lower part. Because of this
condition, it can be predicted that the small particles will accumulate in
27 Gunawan Setvadi. 9484663
the center-lower part of the pile formed and the large particles will
accumulate on the upper part and outer part of the pile formed. In
short, mass-flow diminishes segregation and funnel-flow aggravates
segregation.
A funnel-flow bin can be improved by using an insert at the bin
hopper [Standish et.al, 1988] as it is shown in Figure 2-11. The flow
pattern was measured by filling the hopper in the upright position with
layers of sinter and sand. As it can be seen in Figure 2-11, the original
horizontal layers of sand (Figure 2-11(a)) have been severely
deformed in the core region (Figure 2-11(b)). The unusual feature of
sand concentration in an almost spherical point volume at the upper
level of the funnel was almost certainly caused by the adjustment of
the flow angle to that of the normal inverse angle of repose of the
material at the surface when the flow was interrupted. It means that
the flow angle of the upper most layer is very much smaller than those
of the other layers, whose readjustment was presented by the
overlaying material.
W ith the insert placed in the bin, the flow pattern was completely
changed as shown in Figure 2-11(d). Above the bin transition, the
solids moved in a plug flow, below this level, some material dispersion
is apparent, but there is no evidence of funnelling as in Figure 2-11 (b).
28 Gunawan Setvadi. 9484663
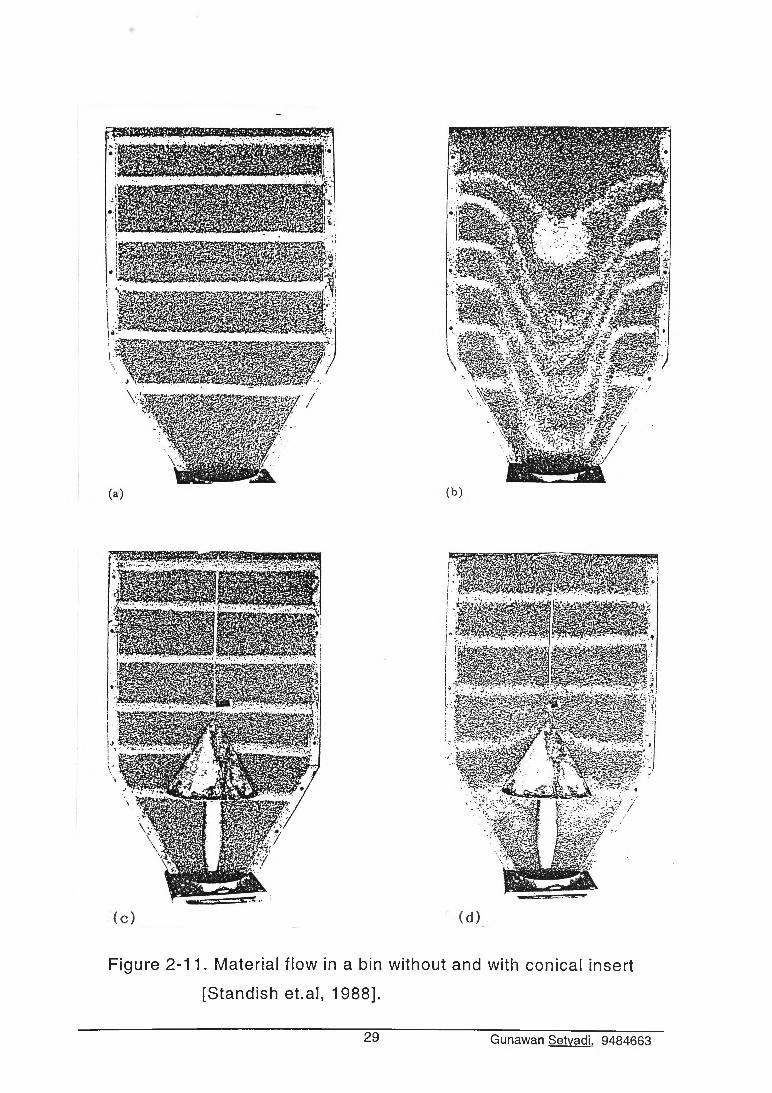
Figure 2-11. Material flow in a bin without and with conical insert
[Standish et.al, 1988].
29 Gunawan Setvadi. 9484663
It may be noted that the original lowermost sand layer (Figure 2-
11(c)) was completely discharged and the dispersed sand below the
cone insert in Figure 2-11(d) is the material in the second layer from
the bottom in Figure 2-11(c). Considering that flow converges from the
apex of the cone and then expands below the cone, layer thickening is
inevitable. It may be expected that this also leads to the material
dispersion or intermixing.
2.4. FLOWABILITY OF A BULK SOLIDS
Flowability of solids is the ability of solids to flow both when
unconfined and when confined. Solids flowability affects the in bin
solids flow pattern. The more flowability of the solids the more its
tendency to mass flow and the less flowability of the solids the more
its tendency to funnel flow. The strength and the flow characteristics of
a bulk solids are defined by its flow function, FF, which is usually
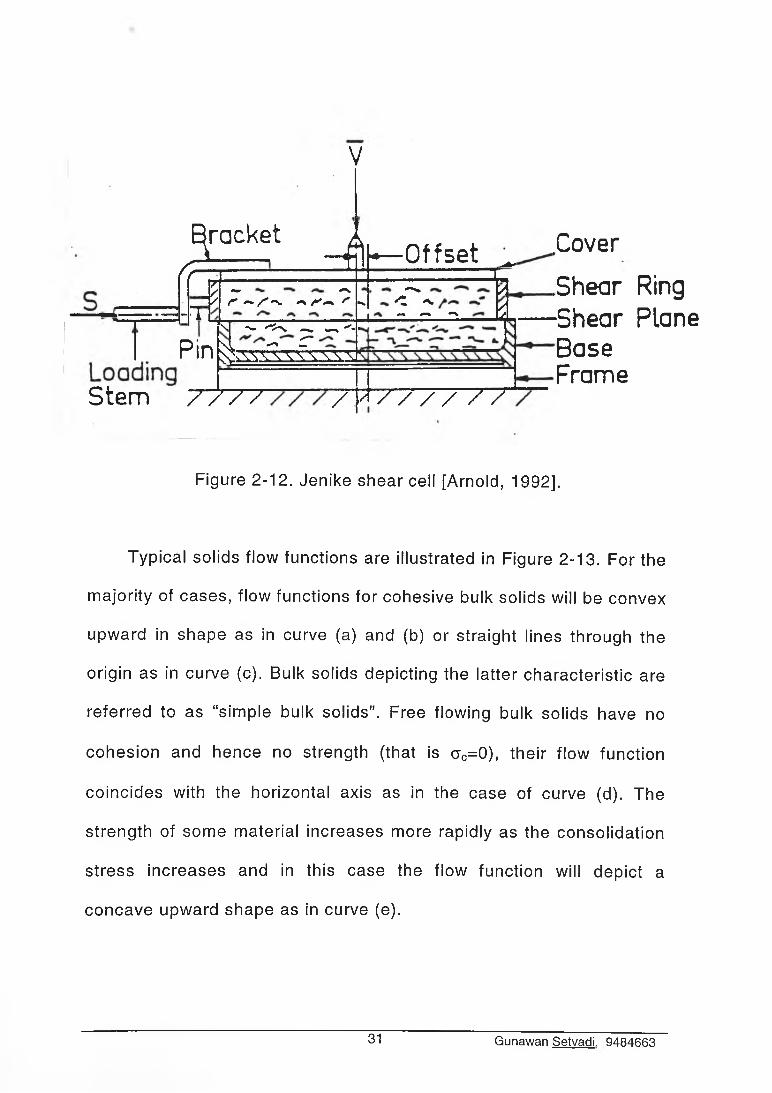
obtained from the test using Jenike shear cell (Figure 2-12). One of
the factors obtained in such kind of a test is an effective angle of
internal friction, 5, as a measurement of inter particle friction in a bulk
solid. The smaller the 5 the more free flowing the solids and the larger
the 8 the less free flowing they are.
30 Gunawan Setvadi. 9484663
V
E/Ç -
^racket ^ih— Offset _
= - ii- ~ ^v r *•/***- ̂a ' - s s -
--------------------- ------------------Lm^ /V 'C ̂ y
J M < -» « N y
Pi\ — ^ — 3T̂ -
n ä s f e f i s s ;
Sterri ' / ï / / Y7~7/IJ/ / / / / /
.Cover
.Shear Ring ■Shear Plane Base Frame
Figure 2-12. Jenike shear cell [Arnold, 1992].
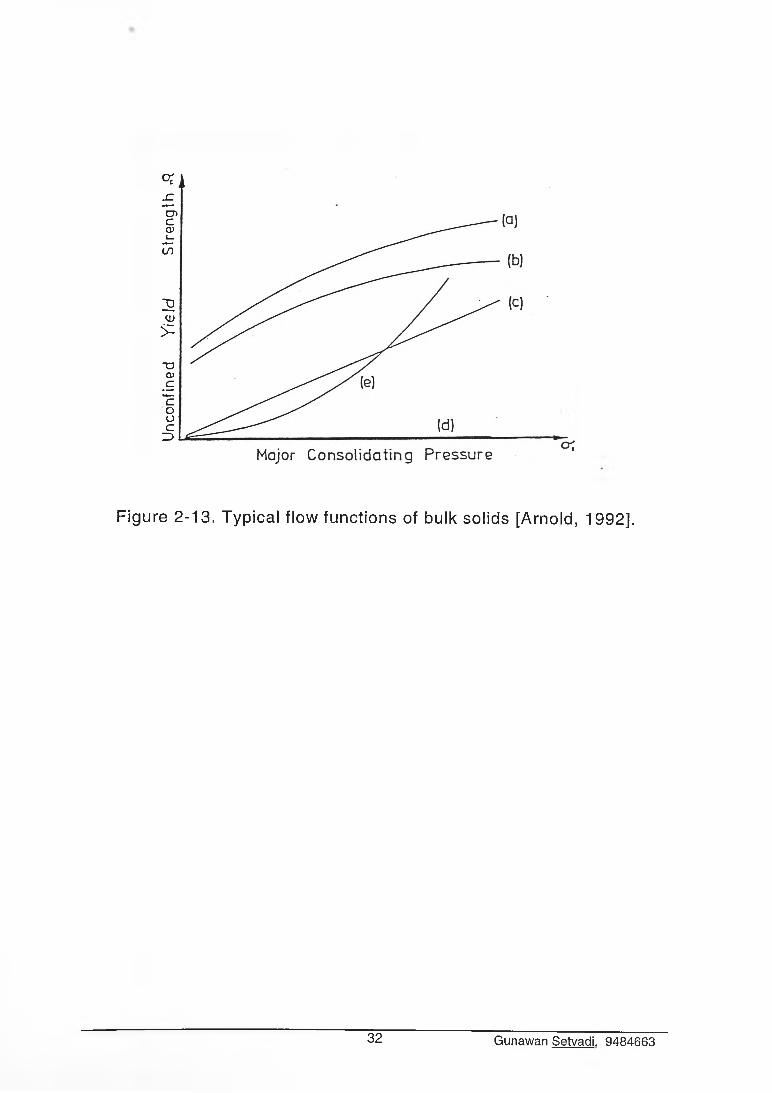
Typical solids flow functions are illustrated in Figure 2-13. For the
majority of cases, flow functions for cohesive bulk solids will be convex
upward in shape as in curve (a) and (b) or straight lines through the
origin as in curve (c). Bulk solids depicting the latter characteristic are
referred to as “simple bulk solids” . Free flowing bulk solids have no
cohesion and hence no strength (that is ac=0), their flow function
coincides with the horizontal axis as in the case of curve (d). The
strength of some material increases more rapidly as the consolidation
stress increases and in this case the flow function will depict a
concave upward shape as in curve (e).
31 Gunawan Setvadi. 9484663
Unc
onfin
ed
Yie
ld
Str
engt
h *9
Figure 2-13. Typical flow functions of bulk solids [Arnold, 1992].
32 Gunawan Setvadi. 9484663

CHAPTER THREE
HYL-III REACTOR CHARGING SYSTEM
AND SEGREGATION PREDICTION
The purpose of the HYL-III reactor charge system is to maintain
a continuous flow of iron ore to the reactor, even though the charge
system operates intermittently. Some equipment used in transporting
iron ore from stockyard to the reactor are conveyor system, a day-bin,
iron ore loading bin, pressurized bin and feeding bin or UFO. The
charge system receives the iron ore at atmospheric pressure and
feeds it to the reactor at its operating condition (5 kg/cm2). In order to
achieve this requirement, the system includes a special sealing
mechanism.
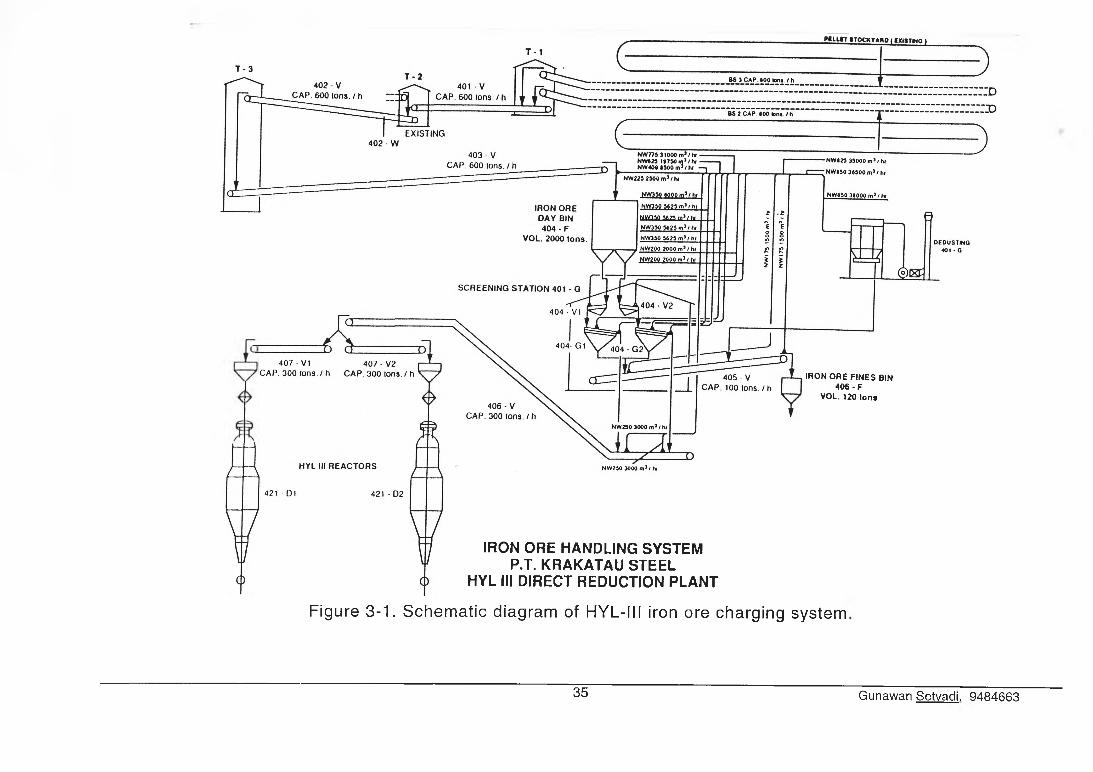
3.1. DESCRIPTION OF AN HYL-III CHARGING SYSTEM
The belt conveyor system transports iron ore from stock yard to
a day bin and charges the bin trough a chute (non movable chute) at
one center point, which has capacity of 2000 tonnes. The day-bin has
two hoppers at the bottom which discharge the material to a screening
system and it is controlled by vibrating feeder in order to control the
adequate amount of the material to be fed to the screening unit.
From the screening system the upper screen ore (+5 mm) is
lifted to an iron ore loading bin (loading bin) by a “Flexowell” conveyor.
From the loading bin which operates at atmospheric condition, the
33 Gunawan Setvadi. 9484663

material is charged to the iron ore pressurized bin (pressurized bin)
sequentially. The charge sequence is possible by means of a solids
cut-off valve and a plug flow valve at the iron ore loading bin
discharge.
The iron ore pressurized bin (pressurized bin) discharges iron
ore to the reactor iron ore feeding bin (UFO) which always operates at
the reactor pressure and its primary function is to maintain a
continuous flow of iron ore and uniformly distribute it within the reactor
[HYL-III Operating Manual, 1992]. The schematic diagram of the HYL-
III iron ore charging system is shown in Figure 3-1.
3.2. PREDICTION OF SEGREGATION PATTERN IN THE HYL-III
REACTOR CHARGING SYSTEM
Segregation happening in each of the equipment during iron ore
transportation will influence the in-reactor segregation. The above
segregation may diminish the in-reactor segregation, or aggravate it.
The equipment before the UFO that is interesting to be analyzed is the
day-bin, the loading bin and the pressurized bin.
3.2.1 Segregation In The Day-Bin.
A day-bin is a cylinder bin with twin pyramidal hoppers at the
bottom. The dimension of the cylinder bin is 9.00 meters in diameter
and 14.13 meters in height. The hopper height is 7.50 meters, the
hopper upper side dimension is 3.18 times 6.36 square meters, with
the opening 0.90 times 1.50 square meters. The half angles of the
34 Gunawan Setvadi. 9484663
H U f T f t f r V * t r V A in < C W ia*a> n >
IRON ORE FINES BIN 406 -F
VOL. 120 Ions
IRO N O RE H A N D LIN G S Y S TE M P.T. K R A K A T A U S T E E L
H Y L III D IR EC T R E D U C TIO N P L A N T
Figure 3-1. Schematic diagram of HYL-III iron ore charging system
35 Gunawan Setvadi. 9484663
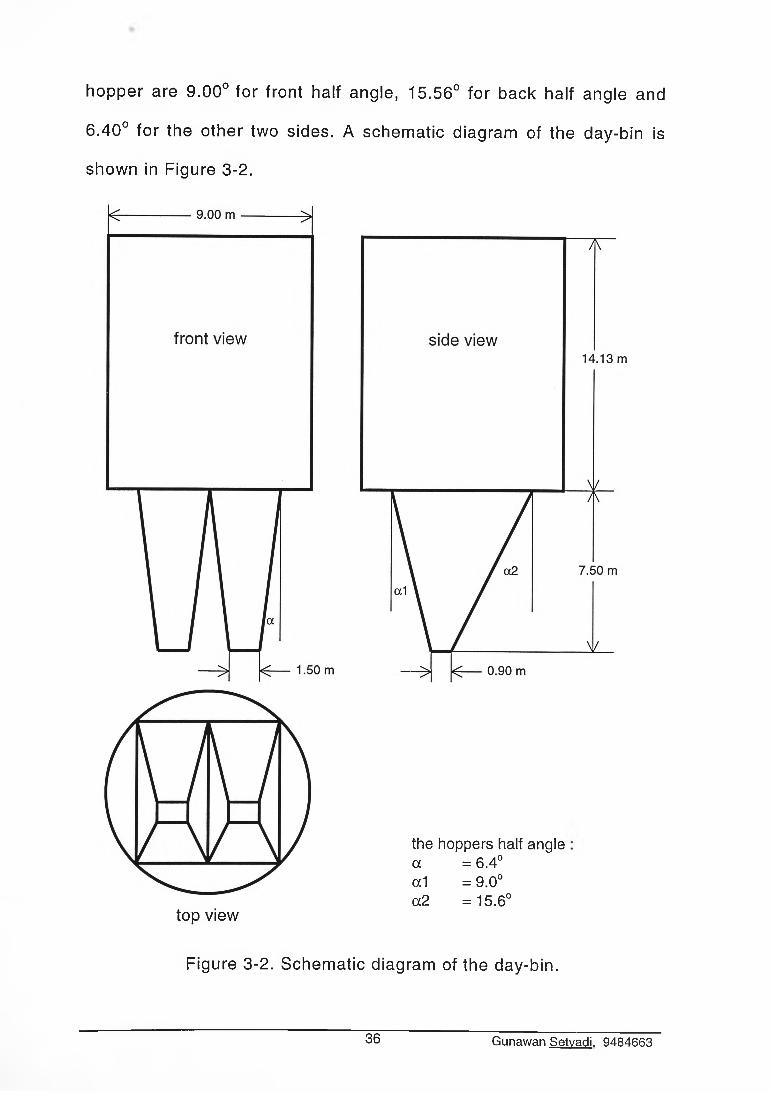
hopper are 9.00° for front half angle, 15.56° for back half angle and
6.40° for the other two sides. A schematic diagram of the day-bin is
shown in Figure 3-2.
top view
the hoppers half angle a = 6.4°a1 = 9.0°a2 =15.6°
Figure 3-2. Schematic diagram of the day-bin.
36 Gunawan Setvadi. 9484663
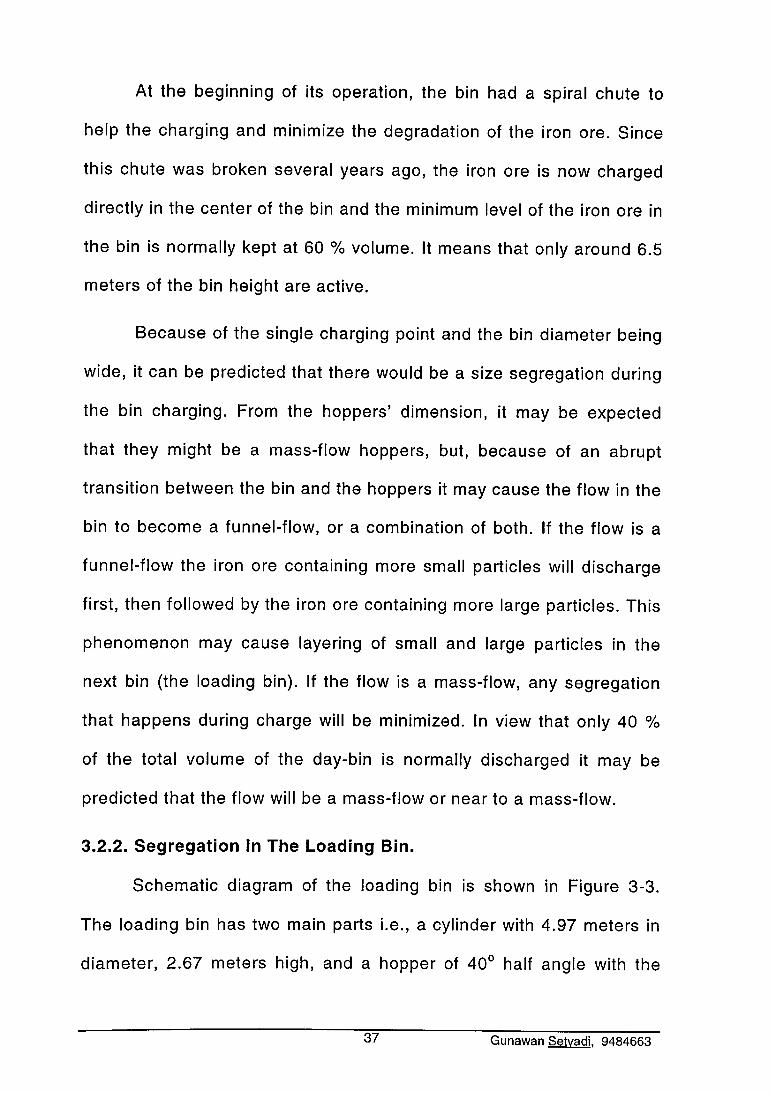
At the beginning of its operation, the bin had a spiral chute to
help the charging and minimize the degradation of the iron ore. Since
this chute was broken several years ago, the iron ore is now charged
directly in the center of the bin and the minimum level of the iron ore in
the bin is normally kept at 60 % volume. It means that only around 6.5
meters of the bin height are active.
Because of the single charging point and the bin diameter being
wide, it can be predicted that there would be a size segregation during
the bin charging. From the hoppers’ dimension, it may be expected
that they might be a mass-flow hoppers, but, because of an abrupt
transition between the bin and the hoppers it may cause the flow in the
bin to become a funnel-flow, or a combination of both. If the flow is a
funnel-flow the iron ore containing more small particles will discharge
first, then followed by the iron ore containing more large particles. This
phenomenon may cause layering of small and large particles in the
next bin (the loading bin). If the flow is a mass-flow, any segregation
that happens during charge will be minimized. In view that only 40 %
of the total volume of the day-bin is normally discharged it may be
predicted that the flow will be a mass-flow or near to a mass-flow.
3.2.2. Segregation In The Loading Bin.
Schematic diagram of the loading bin is shown in Figure 3-3.
The loading bin has two main parts i.e., a cylinder with 4.97 meters in
diameter, 2.67 meters high, and a hopper of 40° half angle with the
37 Gunawan Setvadi. 9484663
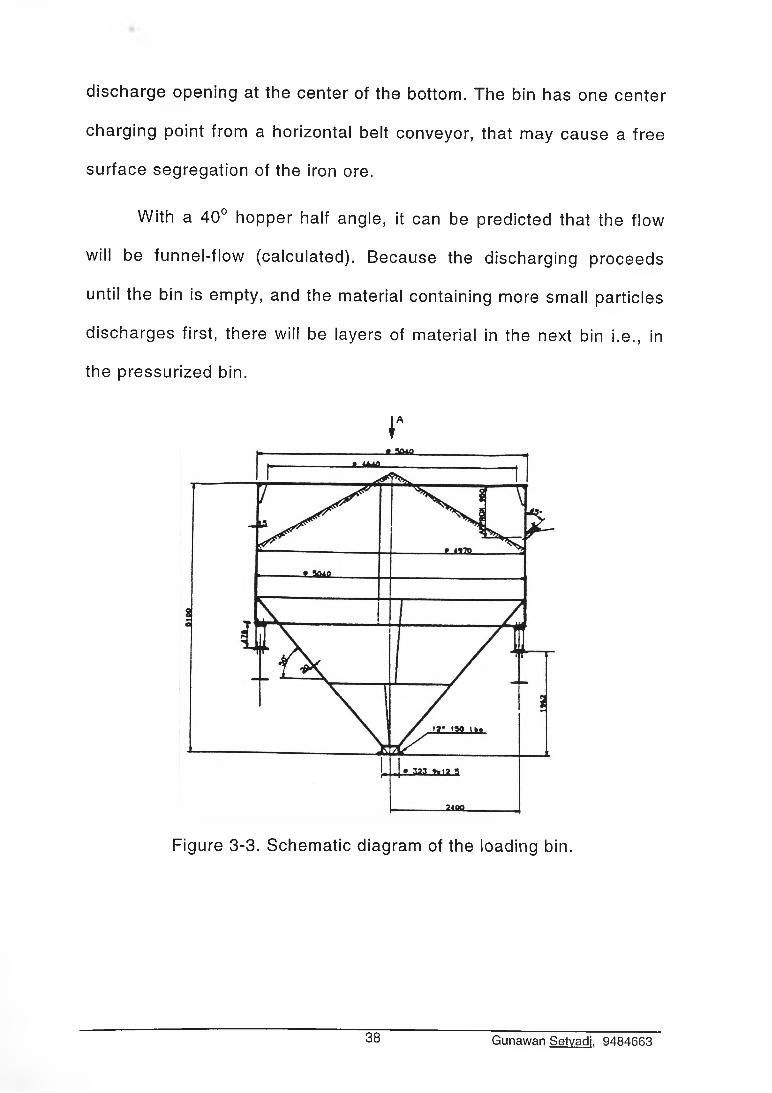
discharge opening at the center of the bottom. The bin has one center
charging point from a horizontal belt conveyor, that may cause a free
surface segregation of the iron ore.
With a 40° hopper half angle, it can be predicted that the flow
will be funnel-flow (calculated). Because the discharging proceeds
until the bin is empty, and the material containing more small particles
discharges first, there will be layers of material in the next bin i.e., in
the pressurized bin.
r
Figure 3-3. Schematic diagram of the loading bin.
38 Gunawan Setvadi. 9484663
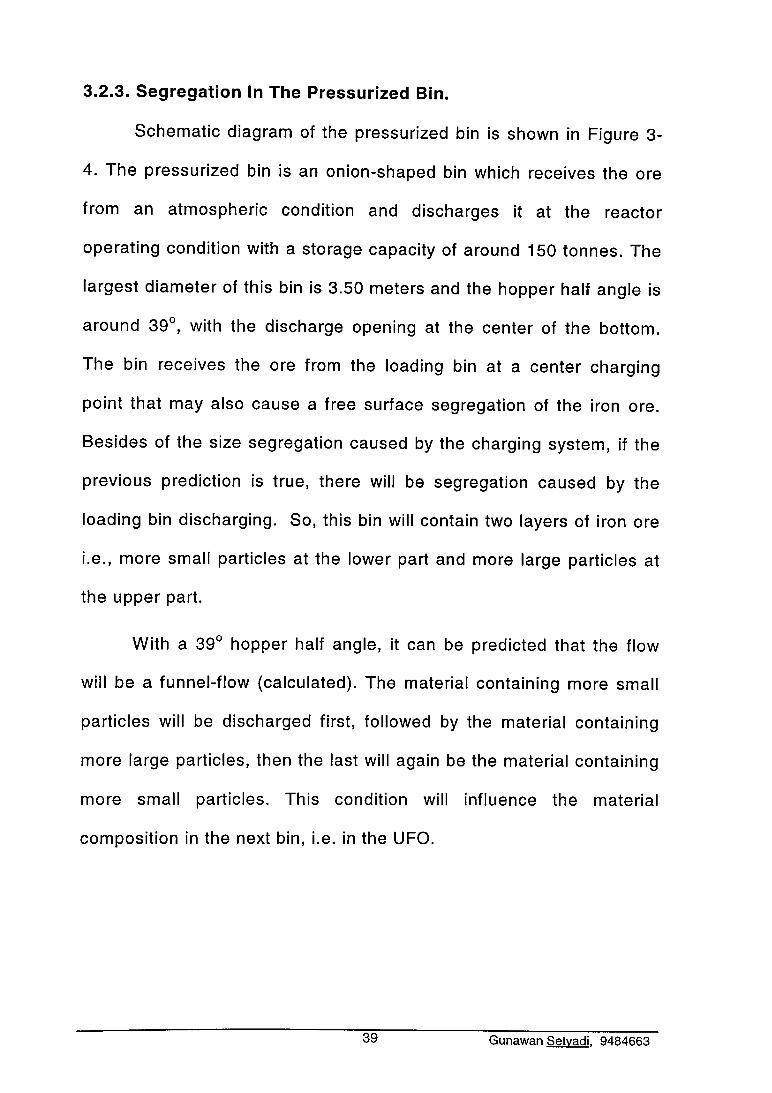
3.2.3. Segregation In The Pressurized Bin.
Schematic diagram of the pressurized bin is shown in Figure 3
4. The pressurized bin is an onion-shaped bin which receives the ore
from an atmospheric condition and discharges it at the reactor
operating condition with a storage capacity of around 150 tonnes. The
largest diameter of this bin is 3.50 meters and the hopper half angle is
around 39°, with the discharge opening at the center of the bottom.
The bin receives the ore from the loading bin at a center charging
point that may also cause a free surface segregation of the iron ore.
Besides of the size segregation caused by the charging system, if the
previous prediction is true, there will be segregation caused by the
loading bin discharging. So, this bin will contain two layers of iron ore
i.e., more small particles at the lower part and more large particles at
the upper part.
W ith a 39° hopper half angle, it can be predicted that the flow
will be a funnel-flow (calculated). The material containing more small
particles will be discharged first, followed by the material containing
more large particles, then the last will again be the material containing
more small particles. This condition will influence the material
composition in the next bin, i.e. in the UFO.
39 Gunawan Setvadi. 9484663
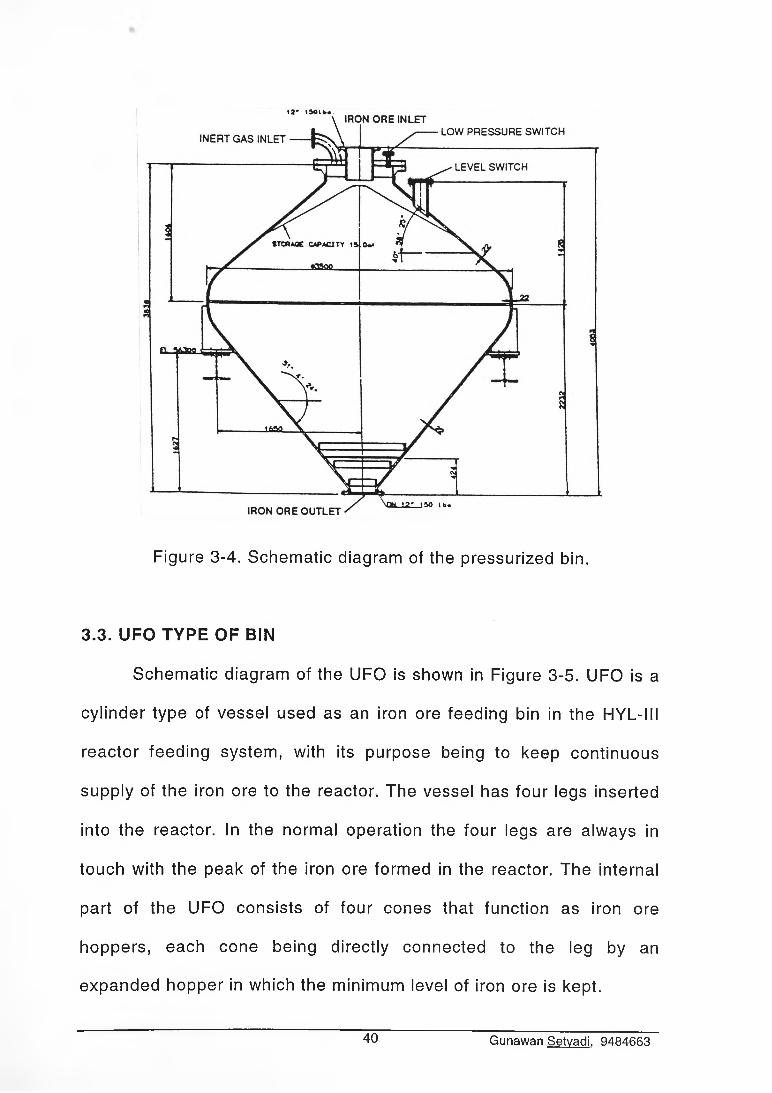
Figure 3-4. Schematic diagram of the pressurized bin.
3.3. UFO TYPE OF BIN
Schematic diagram of the UFO is shown in Figure 3-5. UFO is a
cylinder type of vessel used as an iron ore feeding bin in the HYL-III
reactor feeding system, with its purpose being to keep continuous
supply of the iron ore to the reactor. The vessel has four legs inserted
into the reactor. In the normal operation the four legs are always in
touch with the peak of the iron ore formed in the reactor. The internal
part of the UFO consists of four cones that function as iron ore
hoppers, each cone being directly connected to the leg by an
expanded hopper in which the minimum level of iron ore is kept.
40 Gunawan Setvadi. 9484663
The dimension of the vessel is 426 cm wide (internal diameter)
and 266 cm high. The diameter of the legs are 36.6 cm, with diagonal
distance between the legs of 250 cm. The cone half angle is 41° and
an expanded hopper half angle of 16°. The solids flow from the UFO
also will be a funnel flow (calculated).
41 Gunawan Setvadi. 9484663
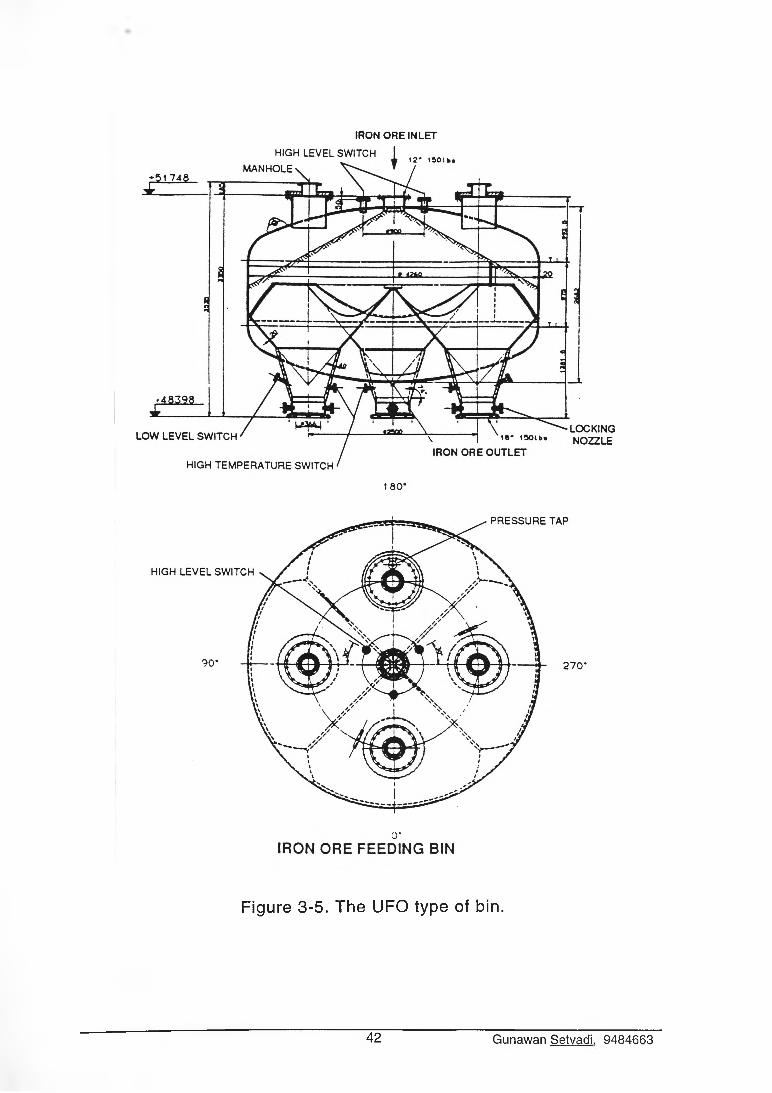
IRON ORE INLET
Figure 3-5. The UFO type of bin.
42 Gunawan Setvadi. 9484663
CHAPTER FOUR
EXPERIMENTAL EQUIPMENT
AND PROCEDURE
Because it is hardly possible to investigate materials segregation in
the real HYL-III reactor in a hot condition, a scaled down cold model was
used to investigate this. The HYL-III solids segregation was investigated in
the model by varying the size distribution, flowrates, and the charging system
of the solids. The equipment was designed in such a way as to give best
possible simulation to obtain the optimum result.
4.1. SIMILARITY CRITERIA
The study of solids segregation in an operating HYL-III reactor is
difficult, because of its pressurized condition and high temperature.
However, it is possible to obtain selected data at reactor shut down, which is
most infrequent, that might give a better understanding of a solids
segregation when coupled with a cold model study. A cold model is also a
more economic modeling tool. As far as it is known, there is no book
available giving similarity criteria in scaling-up the equipment treating solids.
However, unpublished guide lines on a scale-up criteria for discharge
segregation in hoppers has been successfully applied for the study of filling
and emptying a hopper [Standish, 1985]. It was shown there that the
discharge segregation results obtained in the model have paralleled those
obtained in the full scale test of the P-W hopper.
43 Gunawan Setvadi. 9484663
In view of the general limitation of information about similarity criteria
in solids modeling, one can always be reasonably confident of geometric
similarity as a criterion. When solids flow against the wall of a hopper, there
is a frictional condition between the wall and the solids, described by the
angle of friction (<|>‘). Usually, wall friction angle is particle size dependent, so
the model material would have a higher wall friction angle than its full-size, if
< h b e c a u s e the model material is scaled down.
Since there is no quantitative data about the limiting number of solid
particles along the diameter of the bin, so in this research the same number
of the particles along the diameter of the model as in the real condition was
used, i.e. (D/dp)1=(D/dp)2, where subscript 1 indicates the prototype and 2
indicates the model.
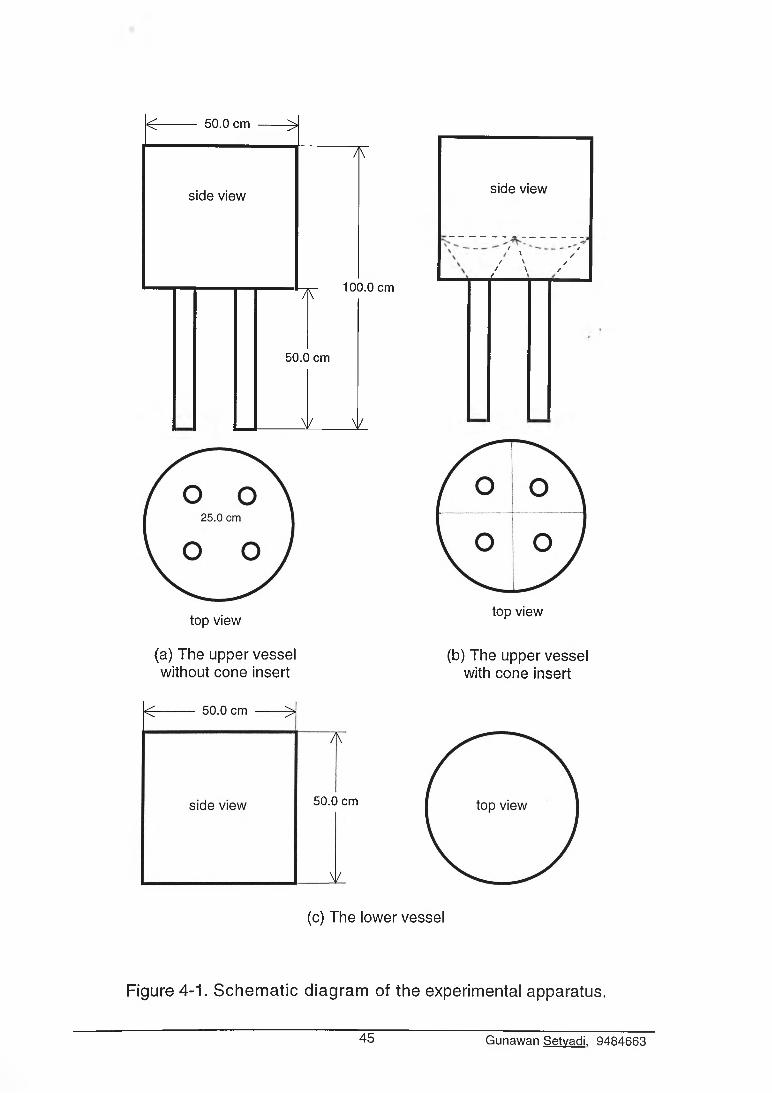
4.2. EXPERIMENTAL APPARATUS
Schematic diagram of the experimental apparatus is shown in Figure
4-1, and the photograph of the actual experimental apparatus is shown in
Figure 4-2.
The experimental apparatus was made-up of carbon steel, and
divided into two parts. The upper part was a model of the HYL-III UFO-bin
but in form of a cylinder with the four legs in the bottom. The position of the
legs in form of a square in which the distance from center to center was a
half of the reactor model diameter, paralleled to the actual condition. The
lower part was a model of the top section of the HYL-III reactor, and it was
44 Gunawan Setvadi. 9484663
< --------- 50.0 cm ------->
side view
7K
side view
A\
50.0 cm
100.0 cm
± ±
top view
- / x ' // ' ✓/ \ ✓
/ ----
top view
(a) The upper vessel without cone insert
(b) The upper vessel with cone insert
50.0 cm
(c) The lower vessel
Figure 4-1. Schematic diagram of the experimental apparatus.
45 Gunawan Setvadi. 9484663
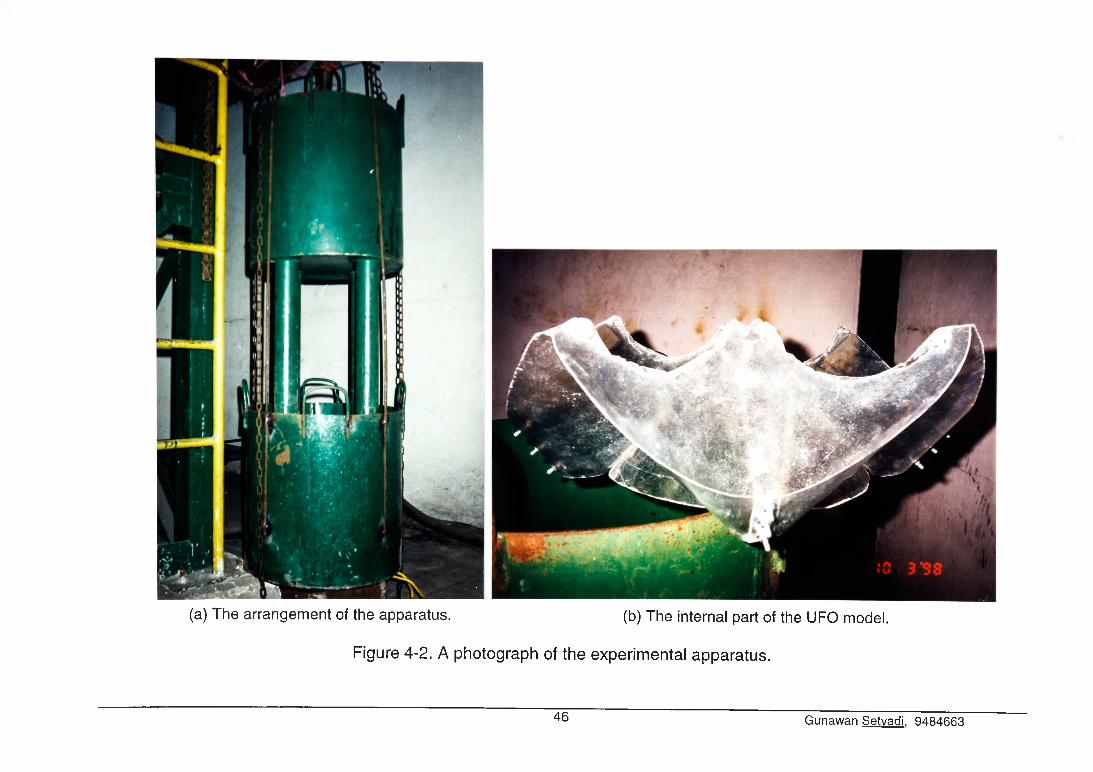
(a) The arrangement of the apparatus. (b) The internal part of the UFO model.
Figure 4-2. A photograph of the experimental apparatus.
■■■■■
46 Gunawan Setvadi. 9484663
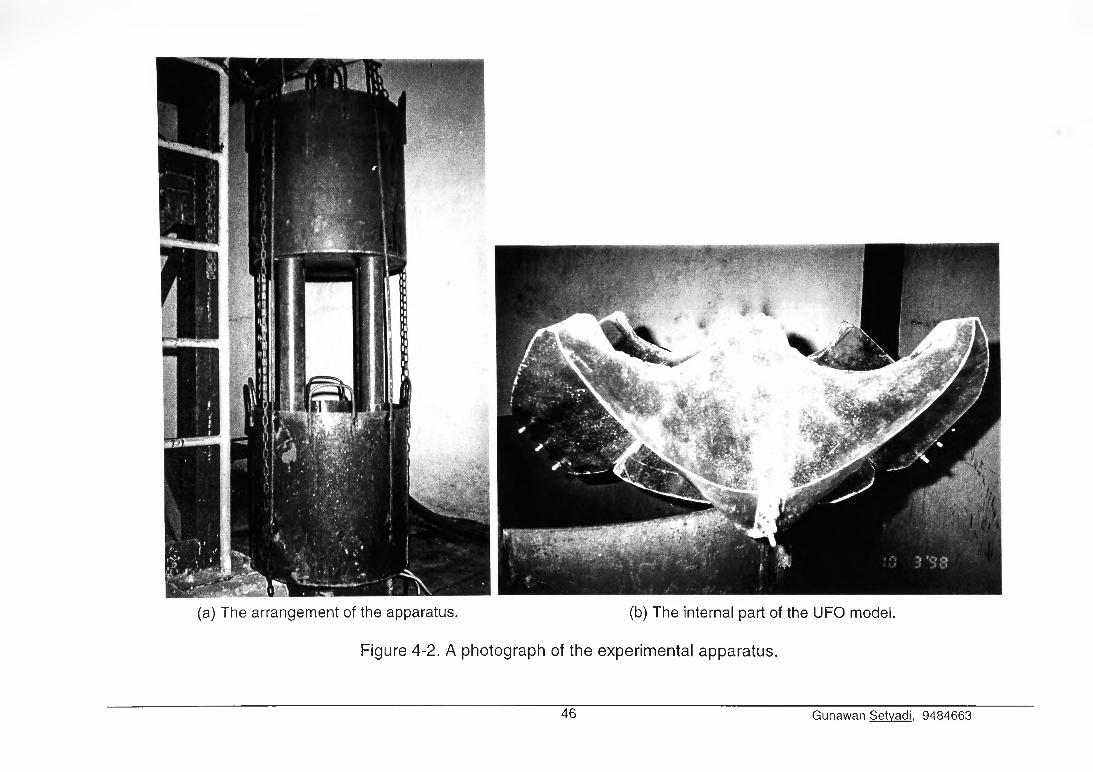
(a) The arrangement of the apparatus. (b) The internal part of the UFO model.
Figure 4-2. A photograph of the experimental apparatus.
46 Gunawan Setyadi, 9484663
The material (solids) used in this experiment was ferric oxide from
Acid Regenerating Plant, Cold Rolling Mill of PT. Krakatau Steel, Cilegon,
Indonesia. The original size of the solids is in between 150 and 2000 jam, the
density is around 3.0 kg per liter, and the form is essentially spherical. Before
the material was used in the experiment it was screened into three parts, i.e.
+315 to -500 pm as small particles, +500 to -800 pm as medium particles,
and +800 to -1400 pm as large particles, and the rest was discarded. The
consideration of not using the particles smaller than 315 pm was because of
their low yield in the feed and the particles larger than 1400 pm, because
they were too large to maintain a reasonable D/dp ratio.
4.3. EXPERIMENTAL PROCEDURE
In this study three independent variables were investigated that may
influences segregation, i.e. size distribution, solids flow rate, and the
charging system.
4.3.1. Size Distribution.
The purpose of deciding size distribution as one of the variables is to
understand how far size distribution influences a segregation. In the actual
industrial condition the iron ore pellets used have the size range of +5.0 to -
20.0 mm. That size range in Table 1-1 can be grouped into : +5 to -10 mm
considered as small particles, around 10.0 %, +10 to -16 mm considered as
also made up of carbon steel. This part was used to investigate segregation
in the top of the reactor.
47 Gunawan Setvadi. 9484663
In this investigation it was decided to use two kinds of size distribution.
One, a size distribution that has a composition of 16.67 % small particles,
66.66 % medium particles, and 16.67 % large particles, in order to have a
composition that is closely similar to the actual condition. The reason for not
using the exact particles size distribution as the actual condition is because
such a size distribution would have only 10 % of both small and large
particles and this was considered would mask the result and make it difficult
to make the already thin layers in the UFO model. Two, a size distribution
that has composition of 33.33 % each for small, medium and large particles.
This condition was considered optimum in helping to understand a
segregation in which each group of particles may have the same influence.
4.3.2. Solids Flow Rates.
From a calculation based on the design capacity, the linear solids
velocity in the HYL-III reactor is 4.5 cm per minute. To understand the effect
of solids flowrates in a segregation in this investigation, two kinds of solids
flowrates were used. Firstly, a linear flowrate that is near to the actual
condition, and secondly, a linear flowrate that is much faster than the actual
condition, for similar reason as those in the case of the size distribution
referred to above. The solids from the UFO model discharged when it was
lifted up by the crane hoist, in such a way that the speed could be adjusted
manually. In the actual condition the solids flow down by gravity, and in the
model the solids flow down because the UFO is lifted up. The final result
medium particles, around 80.0 % and +16 to -20 mm considered as large
particles, around 10.0 % .
48 Gunawan Setvadi. 9484663
4.3.3. Charging Mode.
Charging mode is a way of filling the UFO model, and there were five
kinds of charging modes.
1) . Layering. Layering means filling the UFO model by making thin
layers before it is discharged. The layers contain large, medium, and small
particles. The way of making layers was by weighing each kind of particles in
such composition related with the size distribution needed, then depositing it
by hand and making it flat. For the mixture composition of large, medium,
and small of 1/6, 4/6, and 1/6, the layer thickness of large and small particles
were around 1 cm, and the layer thickness of the medium particles was
around 4 cm. The UFO model height is 50 cm, so there were totally 24 layers
including legs ( 3 x 8 layers, equal to 48 cm), and because of the four legs,
the solids height in the UFO model was around 46 cm. For the mixture
composition of large, medium, and small of 1/3, 1/3, and 1/3, the layer
thickness of large, medium, and small particles were all around 2 cm, and
they were totally 24 layers, with solids height in the UFO model being the
same as in the previous case.
2) . F lat mixture. Flat mixture was a method of filling the UFO model
by a mixture of large, medium, and small particles to a certain level, making
the surface flat, and then discharging it. The way of making the solids
particles was by making a mixture of large, medium and small particles in a
small bucket, then placing the mixture slowly into a big plastic bag. The bag
being the same in each case, namely a deposition of the solids from the four
legs of the UFO.
49 Gunawan Setvadi. 9484663
contained 60 small bucket mixtures. For the mixture composition of large,
medium, and small of 1/6, 4/6, and 1/6, each mixture contained 1/2 kg large,
2 kg medium, and 1/2 kg small particles. For the mixture composition of
large, medium and small of 1/3, 1/3, and 1/3, each mixture contained 1 kg
each of large, medium and small particles. The multiple mixture from the bag
was placed into the UFO model little by little, then it was charged to the
reactor model by lifting up the UFO model.
3) . Legs only. Legs only was the way of investigating the segregation
by filling only the legs of the UFO model to provide an “¡dear reference point.
In this method the legs of the UFO model were kept full while the UFO model
was lifted up with the solids flowing speed as in the actual reactor. As noted
above, the aim of this method was to understand an “ideal” segregation,
because by doing so, there was no double segregation during discharging as
would occur with normal charging. The method of mixing the solids used in
this experiment was the same as it was done in the previous experiment.
4) . Single center p o in t In the real condition, the UFO is filled-up from
a bin called pressurized bin which has one discharge outlet in the center,
meaning that the UFO has only one fill point in the center. The aim of the
single center point was to make a condition in the UFO model as close as
possible with the real condition. From the flow diagram of the process in
Figure 1-1, bearing in mind the natural of the solids, it is clear that before the
solids discharge from the UFO they segregate, and in this case segregation
happens three times, i.e. during charging and discharging the UFO, and that
in the reactor itself. This situation was also reproduced in the reactor model.
50 Gunawan Setvadi. 9484663

5). Cone insert. From the previous investigation (single center point)
the results in Table 5-1 were not the same as the data in Table 5-5 taken
from the actual reactor when it was shut down. A question exist whether the
different segregation results between the model and the actual reactor are
because of the difference in construction or because the data taken in the
actual reactor are not valid? To understand and to answer this question, the
UFO model was made as same as possible with the real UFO by inserting
appropriate cones in the model.
4.3.4 Discharging Mode.
Discharging mode is a way of emptying the UFO model, and there
were two kinds of discharging modes.
1) . Normal discharging. In normal discharging mode all of the UFO
legs are active, so the solids in the UFO model come out to the upper part of
the reactor model trough the four legs. This condition is just like in the actual
HYL-III reactor when the operation is normal. By doing so, the composition of
the solids, hopefully, will be symmetrical at the same position of each pile.
This discharging procedure was applied to all of the charging modes.
2) . One leg blocked. In normal operation, the temperature in the
reduction zone of the reactor reaches 900 °C. At this temperature the iron
oxide materials that are being reduced sometimes stick together and cause
flow problems. To solve this problem iron ore pellets are coated with cement-
water solution before entering the reactor.
The method of mixing the solids used in this procedure was the same as it
was done in the previous procedure.
51 Gunawan Setvadi. 9484663
The use of cement coating solves the problem of sticking, but it
creates a new problem, viz. agglomeration of cement and iron ore fines
forming very hard agglomerates, and block one of the UFO legs (up to
present only one of the legs has ever been blocked). The purpose of this
investigation was to understand the effect of one leg blocked on the
segregation in the reactor, and to ensure complete similarity it was done in
the UFO model with cone inserts.
4.4. SAMPLING PROCEDURE
In analyzing segregation characteristics in the model to draw valid
conclusions in relation to the actual conditions, it is impossible or impractical
to observe entire group of the solids. Instead of examining the entire group of
the solids, as a population or universe, one examines a small part of the
group called sample. In order that a conclusion of sampling inference be
valid, the sample must be chosen so as to be representative of the
population. One way in which a representative sample may be obtained is by
random sampling, according to which member of population has an equal
chance of being included in the sample.
It was mentioned in the previous chapter (section 2.3), that a
concentration of the small and large particles will be different throughout the
discharge cycle, whilst medium size particles concentration would be
expected to remain essentially constant. The sampling points were placed to
obtain as general a picture of the segregation as possible that may yield
useful information for the gas flow in the actual HYL-III reactor. The
52 Gunawan Setvadi. 9484663
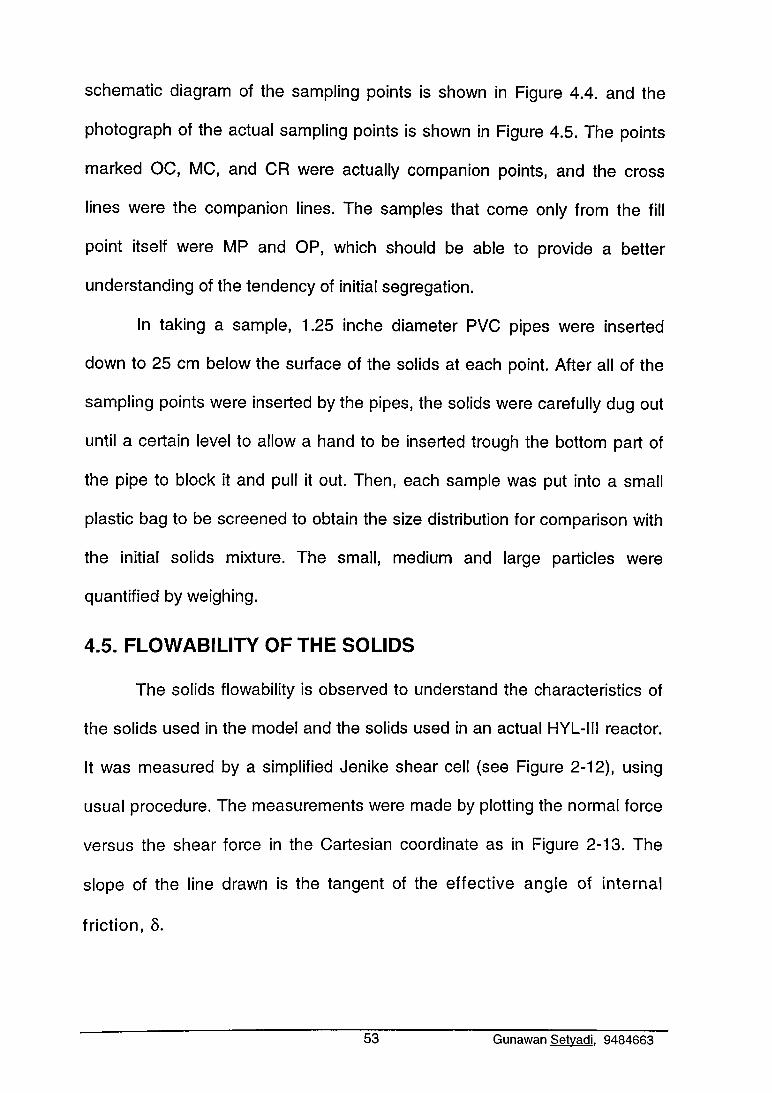
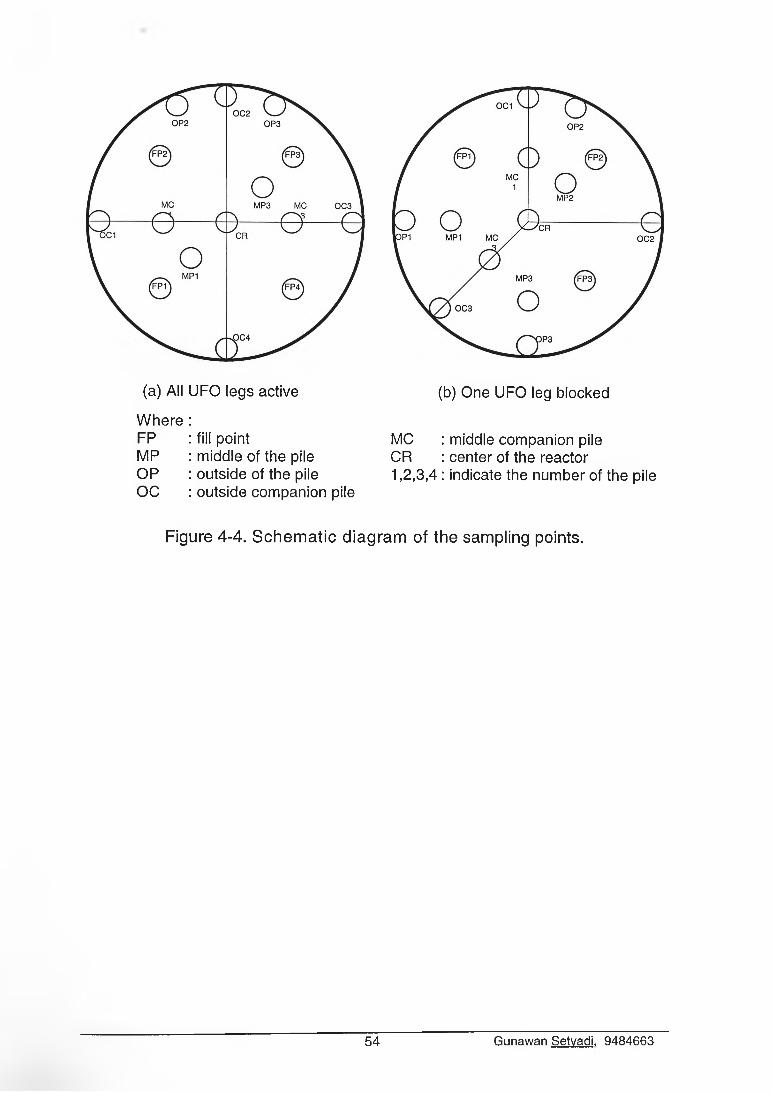
schematic diagram of the sampling points is shown in Figure 4.4. and the
photograph of the actual sampling points is shown in Figure 4.5. The points
marked OC, MC, and CR were actually companion points, and the cross
lines were the companion lines. The samples that come only from the fill
point itself were MP and OP, which should be able to provide a better
understanding of the tendency of initial segregation.
In taking a sample, 1.25 inche diameter PVC pipes were inserted
down to 25 cm below the surface of the solids at each point. After all of the
sampling points were inserted by the pipes, the solids were carefully dug out
until a certain level to allow a hand to be inserted trough the bottom part of
the pipe to block it and pull it out. Then, each sample was put into a small
plastic bag to be screened to obtain the size distribution for comparison with
the initial solids mixture. The small, medium and large particles were
quantified by weighing.
4.5. FLOWABILITY OF THE SOLIDS
The solids flowability is observed to understand the characteristics of
the solids used in the model and the solids used in an actual HYL-III reactor.
It was measured by a simplified Jenike shear cell (see Figure 2-12), using
usual procedure. The measurements were made by plotting the normal force
versus the shear force in the Cartesian coordinate as in Figure 2-13. The
slope of the line drawn is the tangent of the effective angle of internal
friction, 5.
53 Gunawan Setvadi. 9484663
(a) All UFO legs active (b) One UFO leg blocked
Where :FP : fill point MC : middle companion pileMP : middle of the pile CR : center of the reactorOP : outside of the pile 1,2,3,4: indicate the number of the pileOC : outside companion pile
Figure 4-4. Schematic diagram of the sampling points.
54 Gunawan Setvadi. 9484663
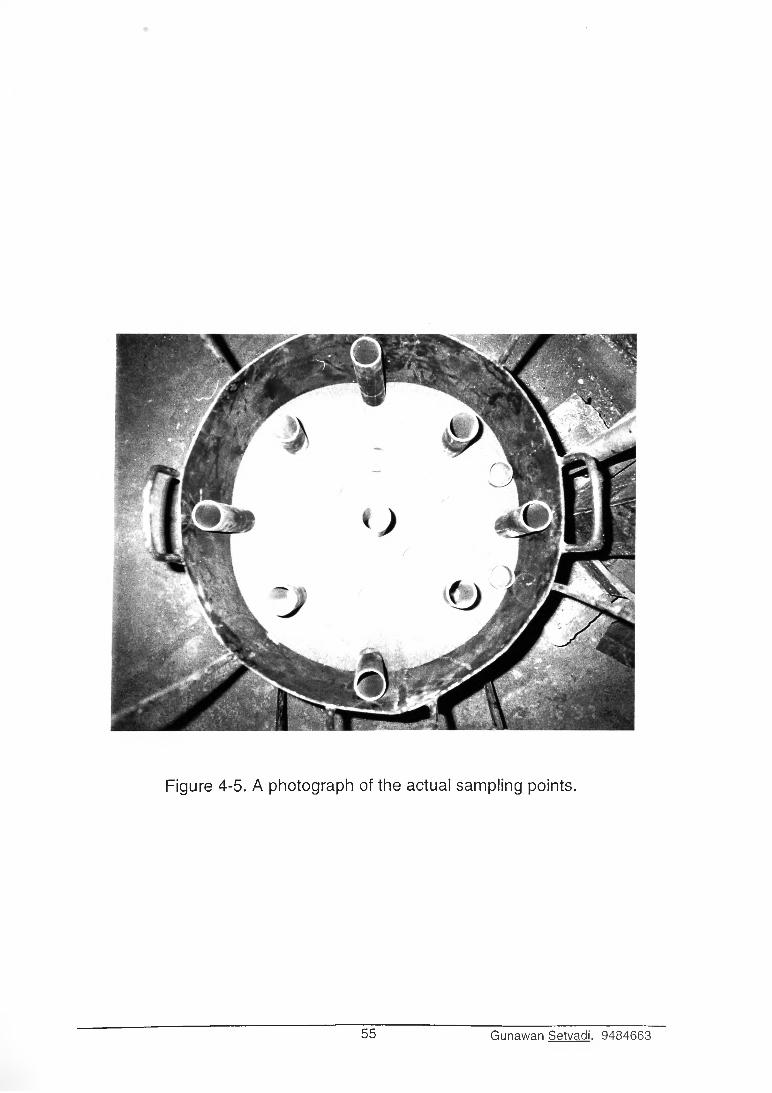
Figure 4-5. A photograph of the actual sampling points.
55 Gunawan Setvadi. 9484663
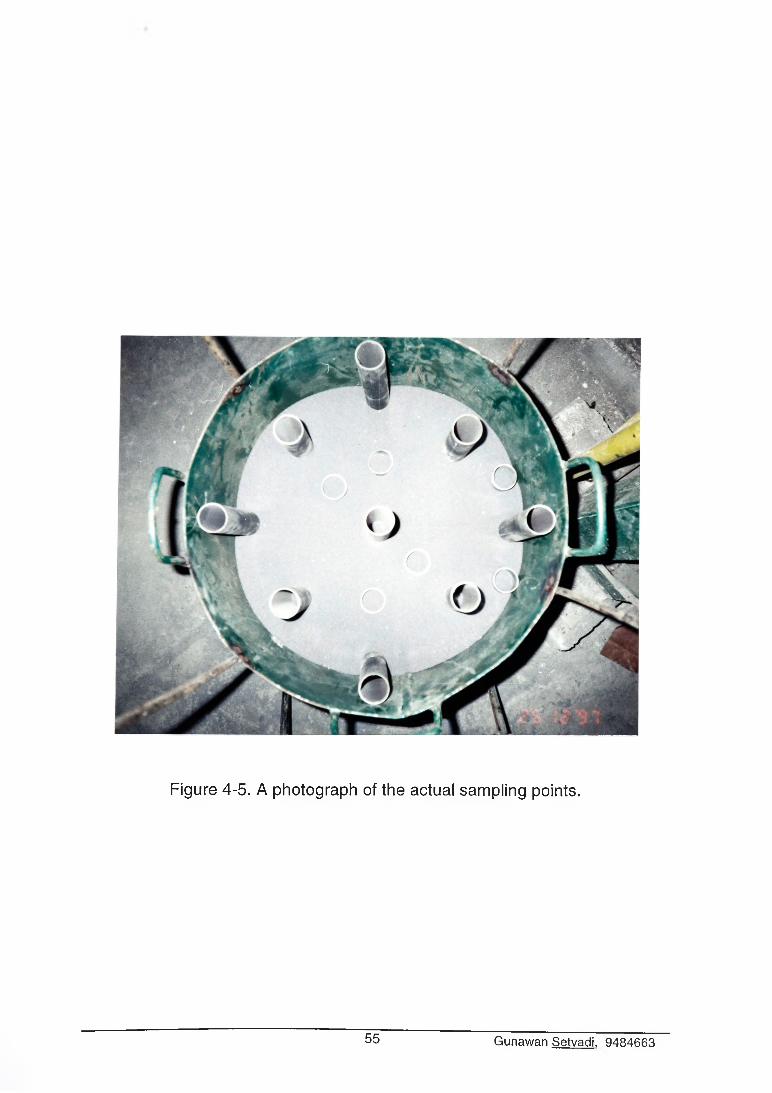
Figure 4-5. A photograph of the actual sampling points.
55 Gunawan Setvadi. 9484663
CHAPTER FIVE
EXPERIMENTAL RESULTS AND DISCUSSION
From the investigations of the five methods of UFO charging and the
two methods of UFO discharging, the results of the investigations will be
analyzed simultaneously to obtain an integrated overview of the general
phenomena of solids segregation in such a kind of model in order to have
strong foundation in making prediction in the actual HYL-III reactor.
The results from the methods 6a and 6b are given in a separate table
due to their specific condition. The effect of solids discharge rate on the
segregation was only tested once and the applicability to the other methods
is based on the reproducibility of the data. Additional investigations were
made to understand the flowability of the material used.
5.1. REPRODUCIBILITY OF THE DATA
To understand the consistency of the data and to ensure that the
results are replicable, reproducibility runs were done on three different
methods i.e., methods 2b, 3a and 3b in which each method was replicated
once. The results of the investigation are shown in Figures 5-1, to 5-3.
56 Gunawan Setvadi 9484663
- -0- - Smalli— ♦—-Small2------ Medluml— ■—-Medium2— o- - Large 1— •—- Large2
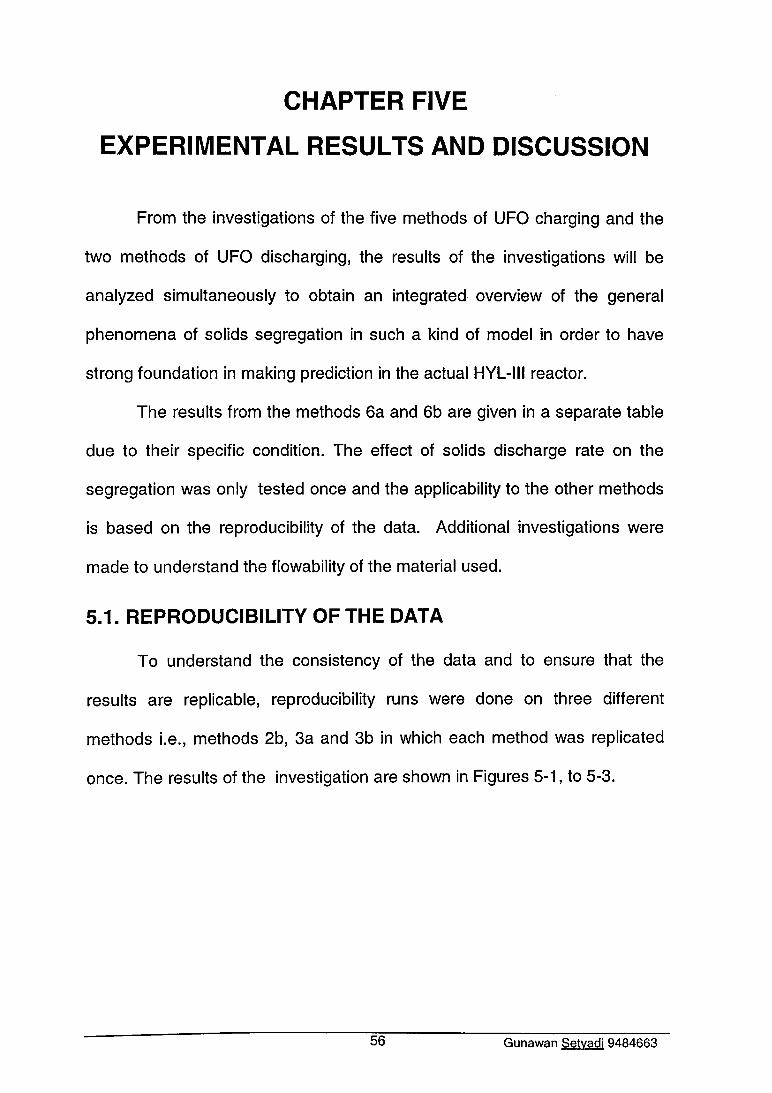
Figure 5-1. Data reproducibility of the method 2b.
o 20.00 O
10.00
0.00CM CO rj- T - CM CO cc T - CM T - CO CM CO
CL CL CL CL o O O o o CL CL o O CL CLLL LL LL LL o O O o o o
---o-- Smalli— ♦—-Small2
Mediuml— ■—-Medium2— o- - Large 1— •—- Large2
Sample position
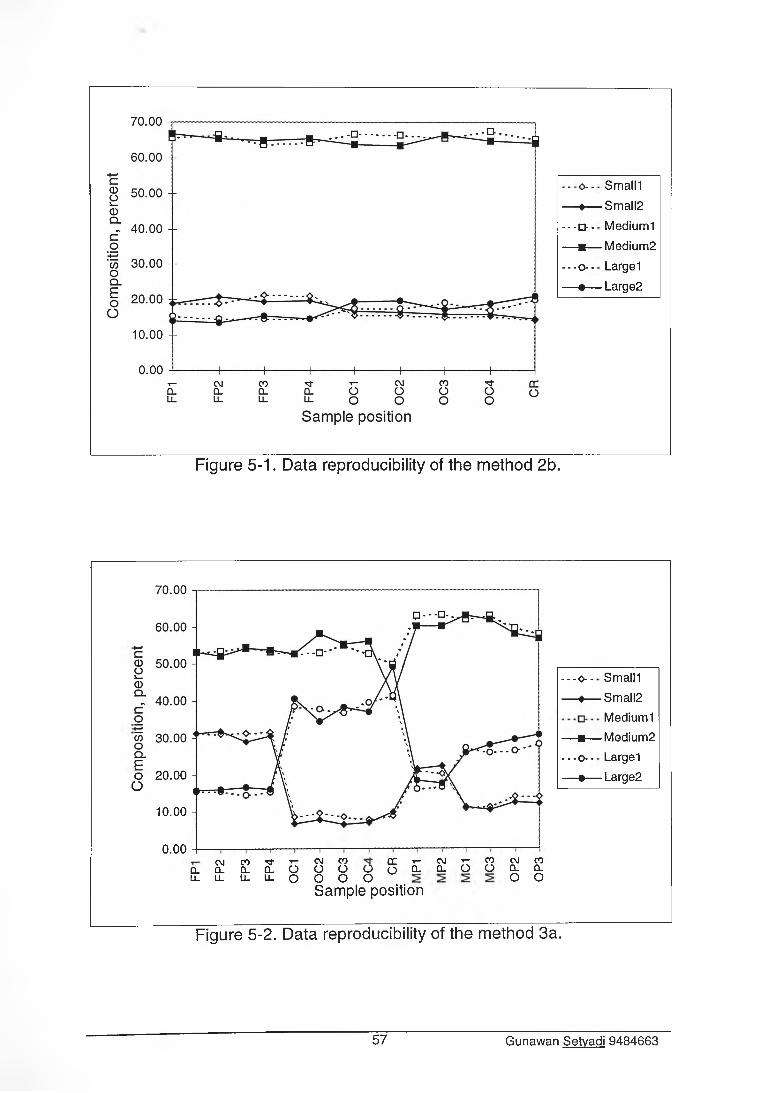
Figure 5-2. Data reproducibility of the method 3a.
57 Gunawan Setvadi 9484663
-- SmalM— ♦“ Small2
-- Mediuml— m-— Medium2- - - O - - - Large 1— • -— Large2
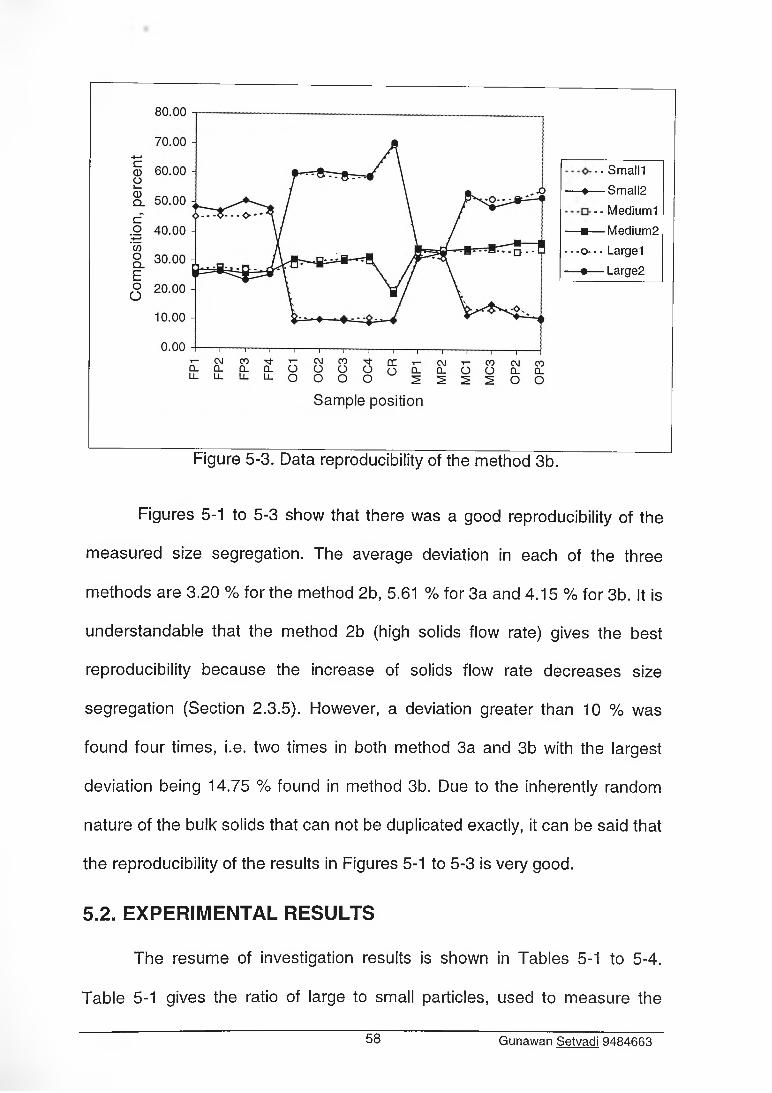
Figure 5-3. Data reproducibility of the method 3b.
Figures 5-1 to 5-3 show that there was a good reproducibility of the
measured size segregation. The average deviation in each of the three
methods are 3.20 % for the method 2b, 5.61 % for 3a and 4.15 % for 3b. It is
understandable that the method 2b (high solids flow rate) gives the best
reproducibility because the increase of solids flow rate decreases size
segregation (Section 2.3.5). However, a deviation greater than 10 % was
found four times, i.e. two times in both method 3a and 3b with the largest
deviation being 14.75 % found in method 3b. Due to the inherently random
nature of the bulk solids that can not be duplicated exactly, it can be said that
the reproducibility of the results in Figures 5-1 to 5-3 is very good.
5.2. EXPERIMENTAL RESULTS
The resume of investigation results is shown in Tables 5-1 to 5-4.
Table 5-1 gives the ratio of large to small particles, used to measure the
58 Gunawan Setvadi 9484663
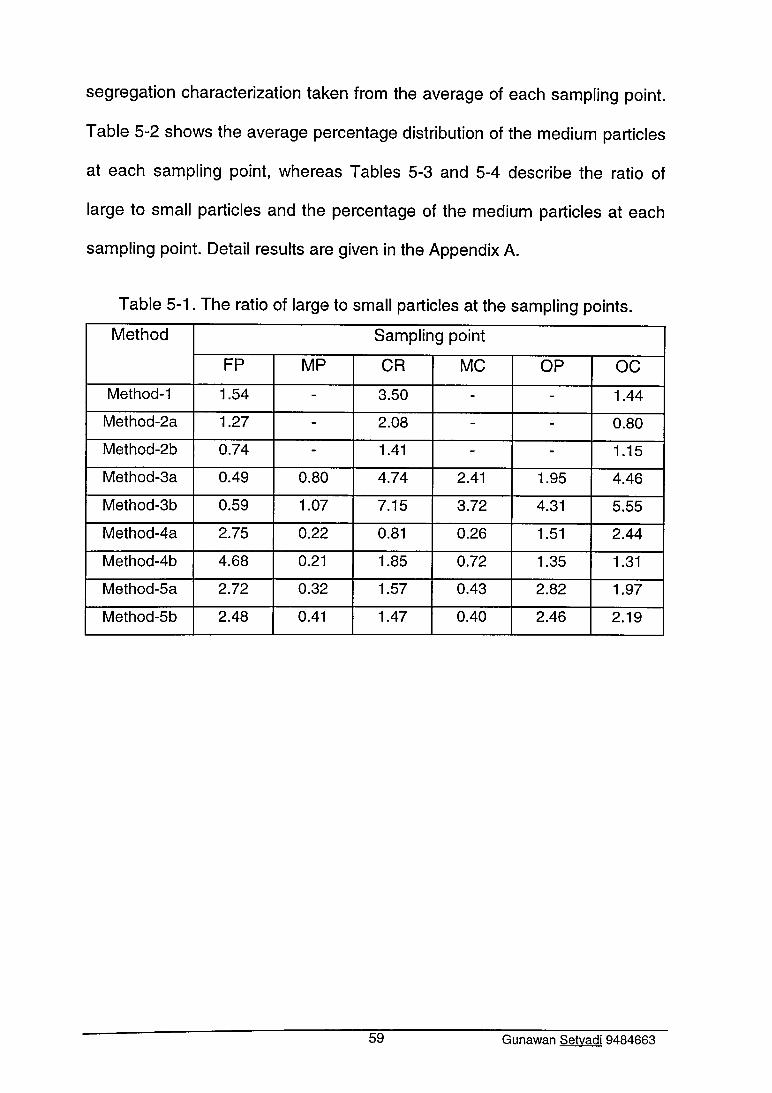
segregation characterization taken from the average of each sampling point.
Table 5-2 shows the average percentage distribution of the medium particles
at each sampling point, whereas Tables 5-3 and 5-4 describe the ratio of
large to small particles and the percentage of the medium particles at each
sampling point. Detail results are given in the Appendix A.
Table 5-1. The ratio of large to small particles at the sampling points.
Method Sampling point
FP MP CR MC OP OCMethod-1 1.54 - 3.50 - - 1.44
Method-2a 1.27 - 2.08 - - 0.80Method-2b 0.74 - 1.41 - - 1.15Method-3a 0.49 0.80 4.74 2.41 1.95 4.46Method-3b 0.59 1.07 7.15 3.72 4.31 5.55
Method-4a 2.75 0.22 0.81 0.26 1.51 2.44
Method-4b 4.68 0.21 1.85 0.72 1.35 1.31
Method-5a 2.72 0.32 1.57 0.43 2.82 1.97
Method-5b 2.48 0.41 1.47 0.40 2.46 2.19
59 Gunawan Setvadi 9484663

Table 5-2. The percentage of medium size particles at the sampling points.
Method Sampling point
FP MP CR MC OP OCMethod-1 66.71 - 61.01 - - 75.19Method-2a 61.90 - 70.92 - - 75.82Method-2b 65.02 - 65.52 - - 66.59Method-3a 53.59 63.14 49.92 62.51 58.89 53.33Method-3b 27.27 34.45 20.40 34.22 34.18 30.20Method-4a 36.18 41.26 61.09 49.19 80.06 77.66Method-4b 24.28 19.46 27.37 34.21 43.03 45.31Method-5a 62.51 44.11 64.21 55.82 68.29 70.95Method-5b 29.36 29.19 39.15 28.95 31.90 37.08
Table 5-3. The size distribution results of method 6a.
SamplePosition
Size distribution, % Large / SmallSmali Medium Large
FP1 14.20 49.41 36.39 2.56FP2 14.03 49.46 36.51 2.60FP3 13.83 49.29 36.88 2.67
OC1 11.72 69.03 19.24 1.64OC2 11.51 69.94 18.55 1.61OC3 10.46 71.98 17.56 1.68
CR 12.44 66.33 21.23 1.71MP1 42.72 43.13 14.16 0.33MP2 41.64 45.93 12.43 0.30MP3 42.80 43.32 13.87 0.32
MC1 13.77 65.68 20.55 1.49MC3 13.12 67.56 19.32 1.47
OP1 7.10 73.00 19.90 2.80OP2 10.67 71.02 18.32 1.72OP3 7.04 73.26 19.70 2.80
60 Gunawan Setvadi 9484663
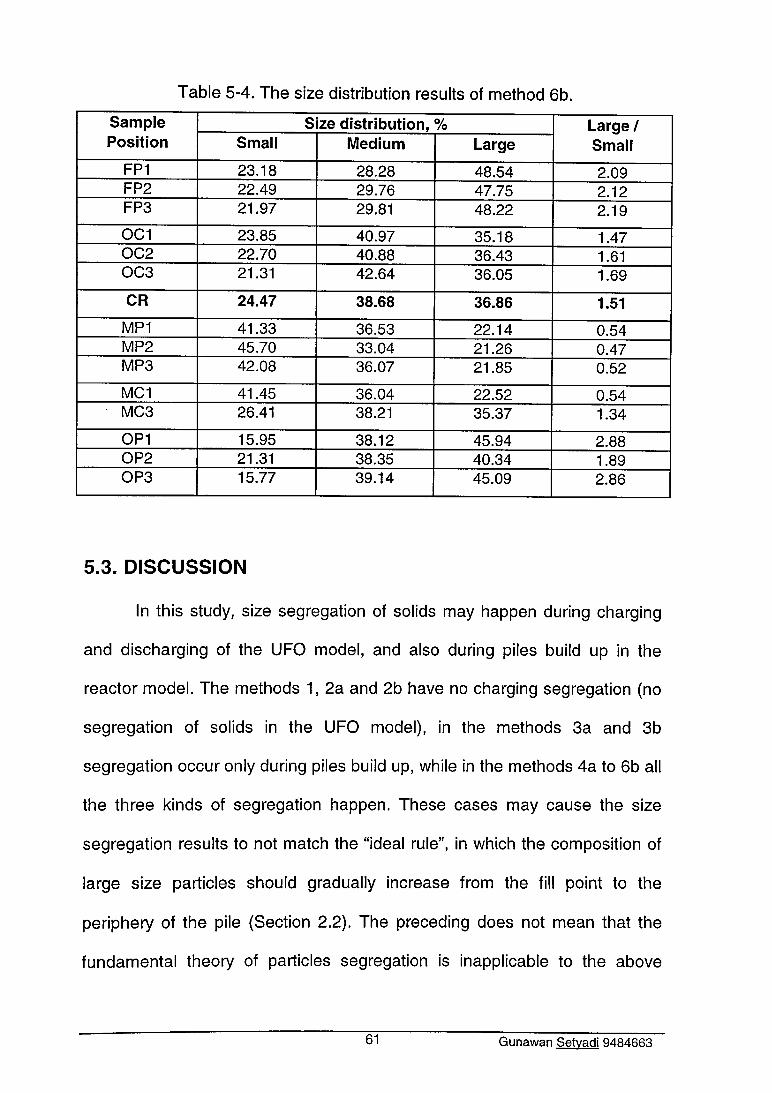
Table 5-4. The size distribution results of method 6b.
SamplePosition
Size distribution, % Large / SmallSmall Medium Large
FP1 23.18 28.28 48.54 2.09FP2 22.49 29.76 47.75 2.12FP3 21.97 29.81 48.22 2.19OC1 23.85 40.97 35.18 1.47OC2 22.70 40.88 36.43 1.61OC3 21.31 42.64 36.05 1.69CR 24.47 38.68 36.86 1.51MP1 41.33 36.53 22.14 0.54MP2 45.70 33.04 21.26 0.47MP3 42.08 36.07 21.85 0.52MC1 41.45 36.04 22.52 0.54MC3 26.41 38.21 35.37 1.34OP1 15.95 38.12 45.94 2.88OP2 21.31 38.35 40.34 1.89OP3 15.77 39.14 45.09 2.86
5.3. DISCUSSION
In this study, size segregation of solids may happen during charging
and discharging of the UFO model, and also during piles build up in the
reactor model. The methods 1, 2a and 2b have no charging segregation (no
segregation of solids in the UFO model), in the methods 3a and 3b
segregation occur only during piles build up, while in the methods 4a to 6b all
the three kinds of segregation happen. These cases may cause the size
segregation results to not match the “ideal rule”, in which the composition of
large size particles should gradually increase from the fill point to the
periphery of the pile (Section 2.2). The preceding does not mean that the
fundamental theory of particles segregation is inapplicable to the above
61 Gunawan Setvadi 9484663
At the piles’ companion points (CR-MC-OC) all investigations show
(Table 5-1, 5-3 and 5-4) that at MC the large particles composition is always
lower than at CR and OC. A most likely reason is that a pile companion acts
as a bin wall, CR and OC act as bin corners while MC acts as a middle of the
wall. Based on the theory (Section 2.3.3) it can be readily shown that CR and
OC will have more large particles than MC.
The results of medium particles composition (Table 5-2) show the
influence of charging segregation on its size distribution. When there was no
segregation in the UFO model (methods 1 to 3b) the medium size
distribution was relatively uniform compared with the condition when
segregation happened. The most uniform medium size segregation is in the
method 2b, while the worst is the method 4a. These results indicate that the
medium size particles are less segregated than the small particles, and this
accords with theory (Section 2.2).
The other results that match the “ideal condition” are those of the
methods 3a and 3b. It is because in these methods segregation took place
only in the reactor model, i.e. during the piles build up. If Table 5-1 is seen
more deeply in both methods 3a and 3b, from points FP-MP-CR or points
FP-OP-OC, there is a significant increase of large size particles composition.
It is for example, for the method 3b, 0.59 - 1.07 - 7.15 for FP-MP-CR and
0.59 -4.31 - 5.55 for FP-OP-OC. Although it may be tempting to ascribe this
to the high initial concentration of large and small particles (-j+-|) a similar
cases, but rather that the deviation happens because of the given
segregation in a certain case being more dominant than the others.
62 Gunawan Setvadi 9484663
result is also shown for the low initial concentration of these two sizes ( i + i ) ,
in method 3a, i.e. 0.49 - 0.80 - 4.74 and 0.49 - 1.95 - 4.46 for the two
segments in Table 5-1. Examination of the sampling point locations (Figure
4-4) clearly shows that the distance from the pour point (FP) increases to CR
and OC, respectively, and that from theory (Section 2.3.3) the foregoing
results are to be expected. The fact that these two methods (3a and 3b) give
a “textbook segregation” is explained by noting that these were the only
methods in which the material was contained in the legs so that, unlike in the
other methods the material discharging from the legs was, for all practical
purposes, uniform throughout.
The results that may also match the ideal condition are the method 2b
results - the only set of runs using a high solids flow rate (108.5 centimeter
per minute). The reason of only taking one run for the high solids flow rate is
because of the time limitation and because high solids flow rates are not so
important in daily HYL-III plant operation. The data from the sampling points
taken, i.e. FP, CR and OC have a similar trend as the data of methods 3a
and 3b, but since there are no data between FP and CR or FP and OC, so,
the size distribution tendency can not be seen. The ratio of large to small
particles at FP (the feed point), indicates its lower segregation during
discharge, the ratio in CR and OC (the center and the outside companion),
indicates its reduced segregation during piles build up compared to the other
methods. These results therefore show that increasing the solids flow rates
during discharge in the present system reduces segregation. This finding is
supported by the theory (Section 2.3.5) that increased solids flow rates
63 Gunawan Setvadi 9484663

The only difference between methods 2a and 2b is the discharge flow
rates but they gave different results. A positive segregation (the ratio of large
to small particles greater than unity) at FP of method 2a shows that there
was a discharge segregation in the UFO model. It was also visually observed
that the flow in the UFO was a funnel flow as indicated by the formation of a
cavity at each of the center of the legs during the solids movement. In view
that the solids movement in the UFO model was very slow (between 2.6 to
4.4 centimeter per minute), during its movement the small particle tend to
percolate vertically into the lower part of the moving solids while the large
particles kept on the upper part then roll into the center of the cavities that
act as new piles periphery. In the meantime the solids coming into the legs
will automatically segregate, so the particles in each leg will have a different
composition throughout the diameter. The solids coming from the center of
the cavities enter the center of legs and the others come into the outer part.
This means the closer to the center of the leg the more large particles will be,
while the closer to the periphery the more small particles will there be. The
predicted size segregation in the of legs the UFO model for methods 1 to 2b,
is illustrated in Figure 5-4.
(decreased discharging time) reduce the tendency of small particles to
percolate.
64 Gunawan Setvadi 9484663
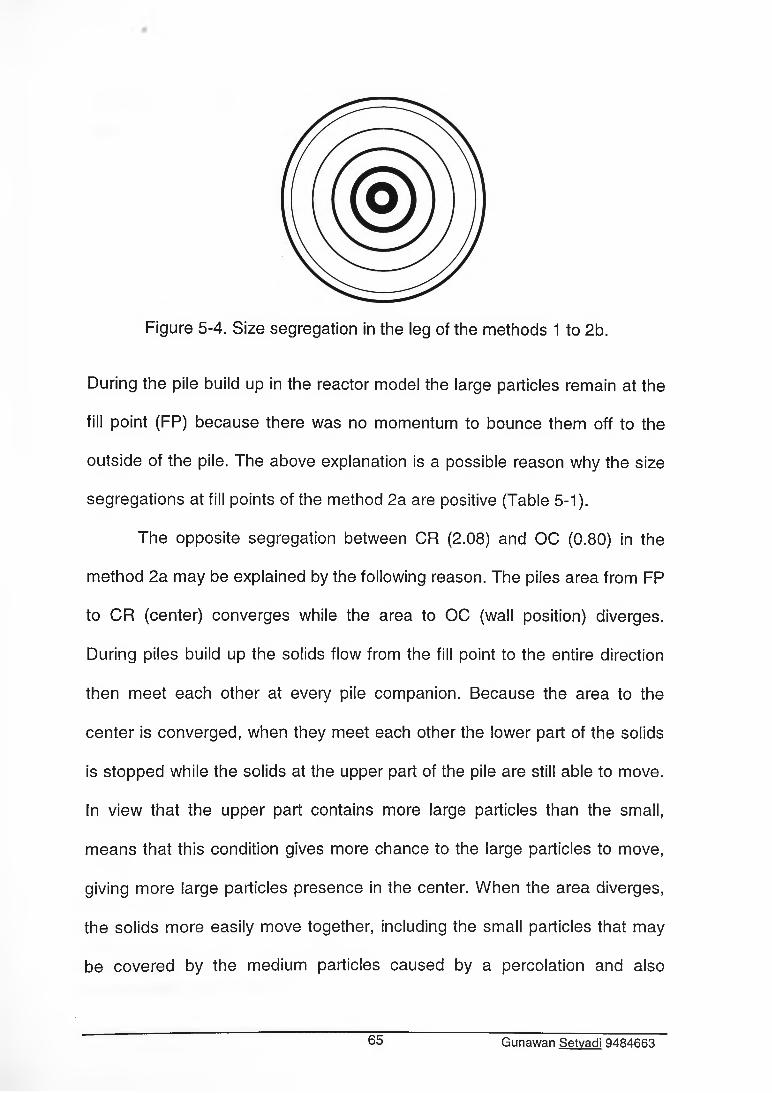
Figure 5-4. Size segregation in the leg of the methods 1 to 2b.
During the pile build up in the reactor model the large particles remain at the
fill point (FP) because there was no momentum to bounce them off to the
outside of the pile. The above explanation is a possible reason why the size
segregations at fill points of the method 2a are positive (Table 5-1).
The opposite segregation between CR (2.08) and OC (0.80) in the
method 2a may be explained by the following reason. The piles area from FP
to CR (center) converges while the area to OC (wall position) diverges.
During piles build up the solids flow from the fill point to the entire direction
then meet each other at every pile companion. Because the area to the
center is converged, when they meet each other the lower part of the solids
is stopped while the solids at the upper part of the pile are still able to move.
In view that the upper part contains more large particles than the small,
means that this condition gives more chance to the large particles to move,
giving more large particles presence in the center. When the area diverges,
the solids more easily move together, including the small particles that may
be covered by the medium particles caused by a percolation and also
65 Gunawan Setvadi 9484663
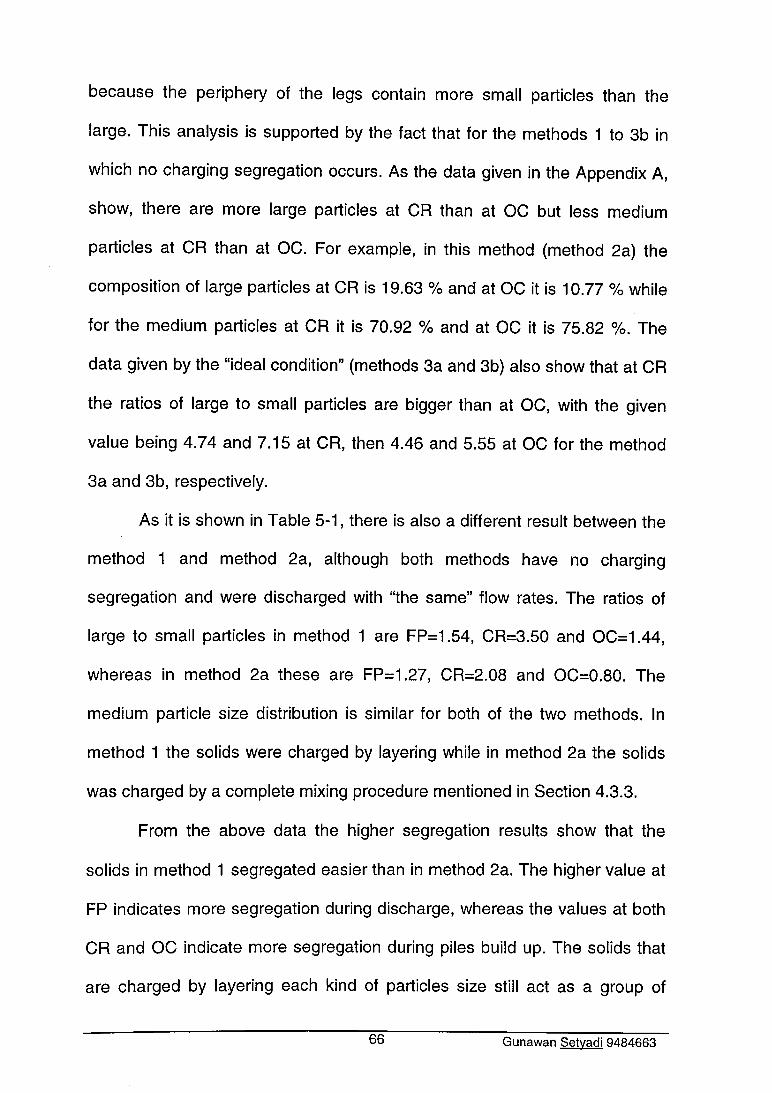
because the periphery of the legs contain more small particles than the
large. This analysis is supported by the fact that for the methods 1 to 3b in
which no charging segregation occurs. As the data given in the Appendix A,
show, there are more large particles at CR than at OC but less medium
particles at CR than at OC. For example, in this method (method 2a) the
composition of large particles at CR is 19.63 % and at OC it is 10.77 % while
for the medium particles at CR it is 70.92 % and at OC it is 75.82 %. The
data given by the “ideal condition” (methods 3a and 3b) also show that at CR
the ratios of large to small particles are bigger than at OC, with the given
value being 4.74 and 7.15 at CR, then 4.46 and 5.55 at OC for the method
3a and 3b, respectively.
As it is shown in Table 5-1, there is also a different result between the
method 1 and method 2a, although both methods have no charging
segregation and were discharged with “the same” flow rates. The ratios of
large to small particles in method 1 are FP=1.54, CR=3.50 and OC=1.44,
whereas in method 2a these are FP=1.27, CR=2.08 and OC=0.80. The
medium particle size distribution is similar for both of the two methods. In
method 1 the solids were charged by layering while in method 2a the solids
was charged by a complete mixing procedure mentioned in Section 4.3.3.
From the above data the higher segregation results show that the
solids in method 1 segregated easier than in method 2a. The higher value at
FP indicates more segregation during discharge, whereas the values at both
CR and OC indicate more segregation during piles build up. The solids that
are charged by layering each kind of particles size still act as a group of
66 Gunawan Setvadi 9484663

solids that easily move with each other. When the solids are discharged then
they gradually mix whilst also segregate. Because of the movement, theory
shows (Section 2.3.5) that small particles percolate through large particle
layer and medium particle layer. Because percolating through medium
particles is more difficult than it is through the large one (the solids were
arranged in medium, large and small layers), so the percolating small
particles will accumulate more around the boundary of large and medium
particles. This accumulation of small particles is most likely to give a
beneficial effect of bearing to the large particles movement that would cause
the large particles to more easily move and give more segregation than its
case in the complete mixing (method 2a), and this accords with the theory in
Section 2.3.6.
In methods 4a and 4b charging, segregation in the UFO model seems
to have big effect on the segregation in the following steps, even for the
medium particles composition. The results in Table 5-1 show a higher
positive segregation at the fill point (FP), moderate positive segregation at
the area toward the wall (OP and OC), lower negative segregation (the ratio
of large to small particles less than unity) at the area in the middle part of the
piles (MP and MC) and moderate negative segregation at CR (center) for the
method 4a but moderate positive segregation for the method 4b. It is, for
example, for the method 3a, 2.75 - 0.22 - 0.81 for FP-MP-CR and 0.26 - 2.44
- 1.51 for MC-OC-OP. The single center charging of the UFO model causes
size segregation in the UFO model, that means the increase of particle size
from the center toward the wall, or the closer to the center the more small
67 Gunawan Setvadi 9484663
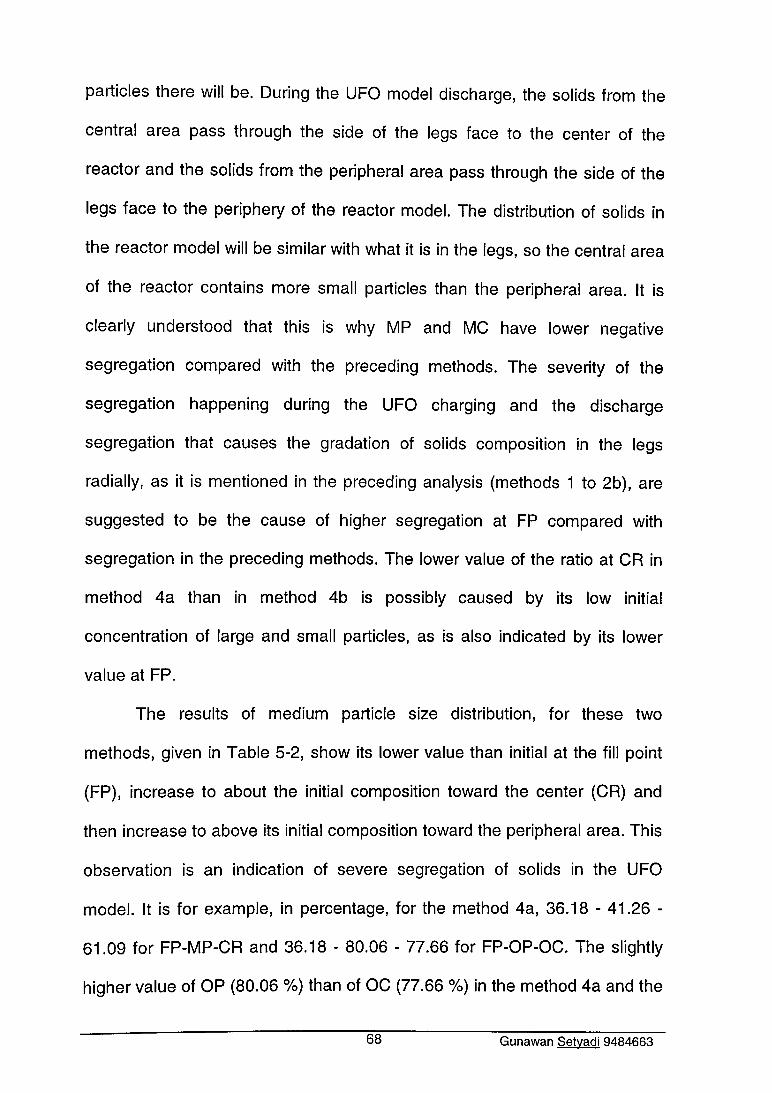
particles there will be. During the UFO model discharge, the solids from the
central area pass through the side of the legs face to the center of the
reactor and the solids from the peripheral area pass through the side of the
legs face to the periphery of the reactor model. The distribution of solids in
the reactor model will be similar with what it is in the legs, so the central area
of the reactor contains more small particles than the peripheral area. It is
clearly understood that this is why MP and MC have lower negative
segregation compared with the preceding methods. The severity of the
segregation happening during the UFO charging and the discharge
segregation that causes the gradation of solids composition in the legs
radially, as it is mentioned in the preceding analysis (methods 1 to 2b), are
suggested to be the cause of higher segregation at FP compared with
segregation in the preceding methods. The lower value of the ratio at CR in
method 4a than in method 4b is possibly caused by its low initial
concentration of large and small particles, as is also indicated by its lower
value at FP.
The results of medium particle size distribution, for these two
methods, given in Table 5-2, show its lower value than initial at the fill point
(FP), increase to about the initial composition toward the center (CR) and
then increase to above its initial composition toward the peripheral area. This
observation is an indication of severe segregation of solids in the UFO
model. It is for example, in percentage, for the method 4a, 36.18 - 41.26 -
61.09 for FP-MP-CR and 36.18 - 80.06 - 77.66 for FP-OP-OC. The slightly
higher value of OP (80.06 %) than of OC (77.66 %) in the method 4a and the
68 Gunawan Setvadi 9484663
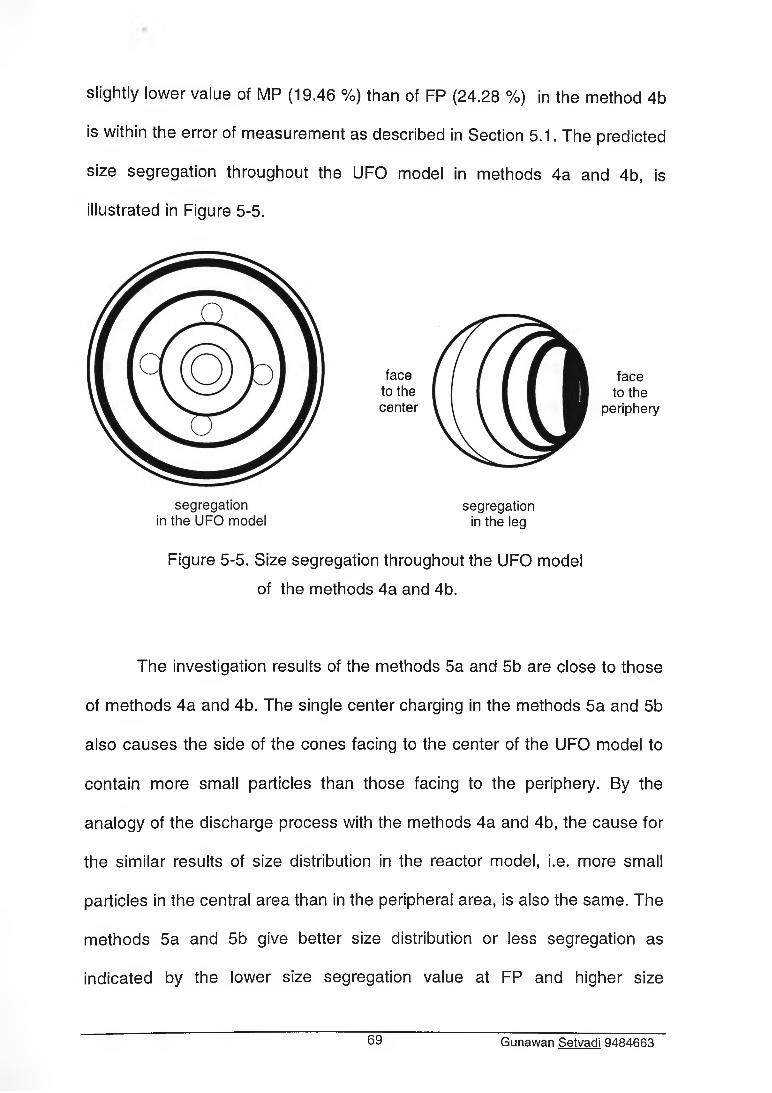
slightly lower value of MP (19.46 %) than of FP (24.28 %) in the method 4b
is within the error of measurement as described in Section 5.1. The predicted
size segregation throughout the UFO model in methods 4a and 4b, is
illustrated in Figure 5-5.
face to the center
face to the
periphery
segregation in the leg
Figure 5-5. Size segregation throughout the UFO model
of the methods 4a and 4b.
The investigation results of the methods 5a and 5b are close to those
of methods 4a and 4b. The single center charging in the methods 5a and 5b
also causes the side of the cones facing to the center of the UFO model to
contain more small particles than those facing to the periphery. By the
analogy of the discharge process with the methods 4a and 4b, the cause for
the similar results of size distribution in the reactor model, i.e. more small
particles in the central area than in the peripheral area, is also the same. The
methods 5a and 5b give better size distribution or less segregation as
indicated by the lower size segregation value at FP and higher size
69 Gunawan Setvadi 9484663
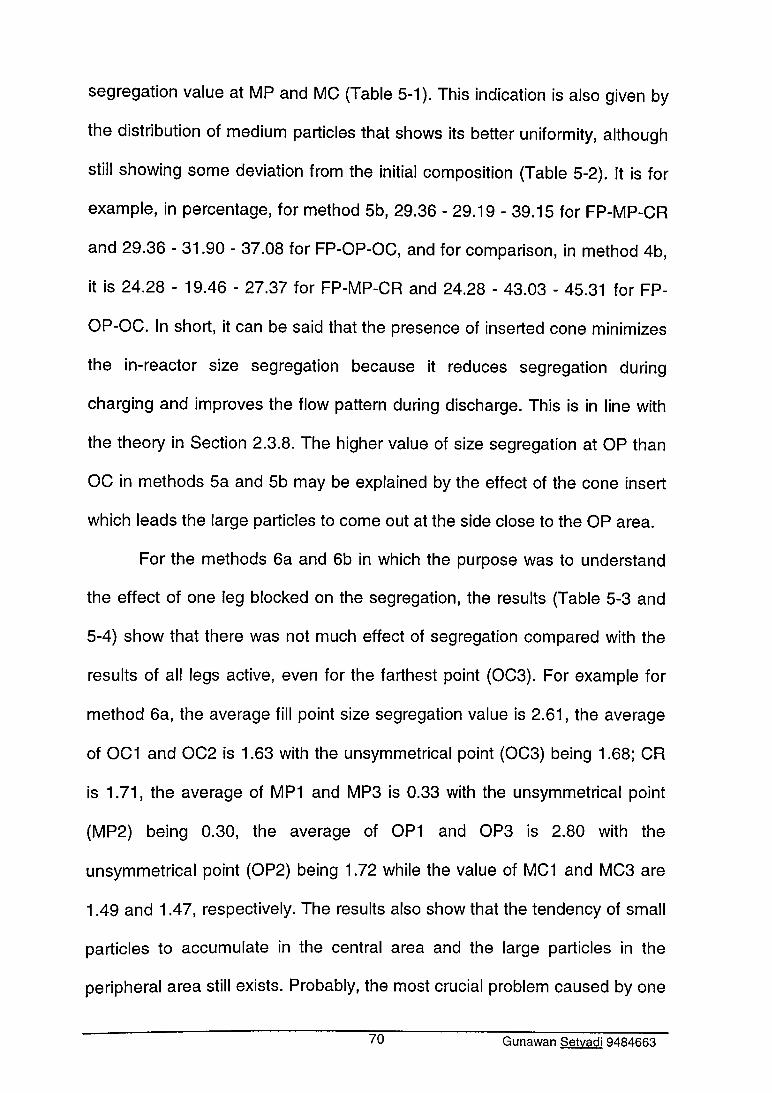
segregation value at MP and MC (Table 5-1). This indication is also given by
the distribution of medium particles that shows its better uniformity, although
still showing some deviation from the initial composition (Table 5-2). It is for
example, in percentage, for method 5b, 29.36 - 29.19 - 39.15 for FP-MP-CR
and 29.36 - 31.90 - 37.08 for FP-OP-OC, and for comparison, in method 4b,
it is 24.28 - 19.46 - 27.37 for FP-MP-CR and 24.28 - 43.03 - 45.31 for FP-
OP-OC. In short, it can be said that the presence of inserted cone minimizes
the in-reactor size segregation because it reduces segregation during
charging and improves the flow pattern during discharge. This is in line with
the theory in Section 2.3.8. The higher value of size segregation at OP than
OC in methods 5a and 5b may be explained by the effect of the cone insert
which leads the large particles to come out at the side close to the OP area.
For the methods 6a and 6b in which the purpose was to understand
the effect of one leg blocked on the segregation, the results (Table 5-3 and
5-4) show that there was not much effect of segregation compared with the
results of all legs active, even for the farthest point (OC3). For example for
method 6a, the average fill point size segregation value is 2.61, the average
of OC1 and OC2 is 1.63 with the unsymmetrical point (OC3) being 1.68; CR
is 1.71, the average of MP1 and MP3 is 0.33 with the unsymmetrical point
(MP2) being 0.30, the average of OP1 and OP3 is 2.80 with the
unsymmetrical point (OP2) being 1.72 while the value of MC1 and MC3 are
1.49 and 1.47, respectively. The results also show that the tendency of small
particles to accumulate in the central area and the large particles in the
peripheral area still exists. Probably, the most crucial problem caused by one
70 Gunawan Setvadi 9484663
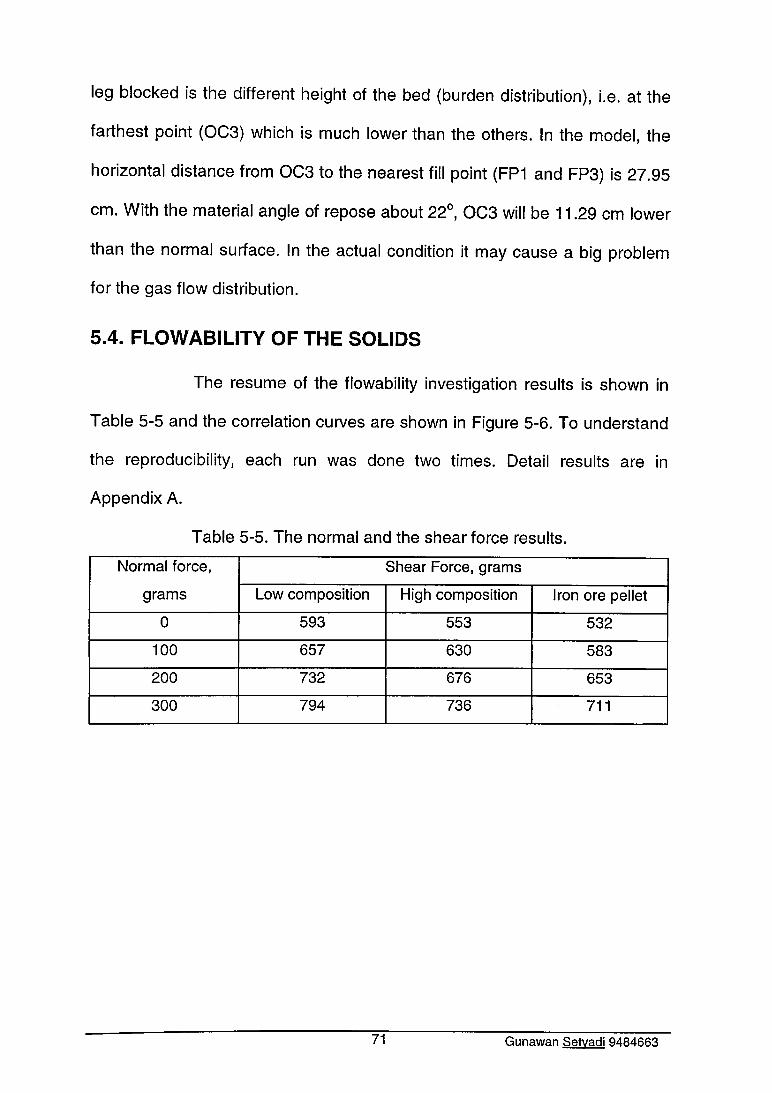
leg blocked is the different height of the bed (burden distribution), i.e. at the
farthest point (OC3) which is much lower than the others. In the model, the
horizontal distance from OC3 to the nearest fill point (FP1 and FP3) is 27.95
cm. With the material angle of repose about 22°, OC3 will be 11.29 cm lower
than the normal surface. In the actual condition it may cause a big problem
for the gas flow distribution.
5.4. FLOWABILITY OF THE SOLIDS
The resume of the flowability investigation results is shown in
Table 5-5 and the correlation curves are shown in Figure 5-6. To understand
the reproducibility, each run was done two times. Detail results are in
Appendix A.
Table 5-5. The normal and the shear force results.
Normal force, Shear Force, grams
grams Low composition High composition Iron ore pellet
0 593 553 532
100 657 630 583
200 732 676 653
300 794 736 711
71 Gunawan Setvadi 9484663
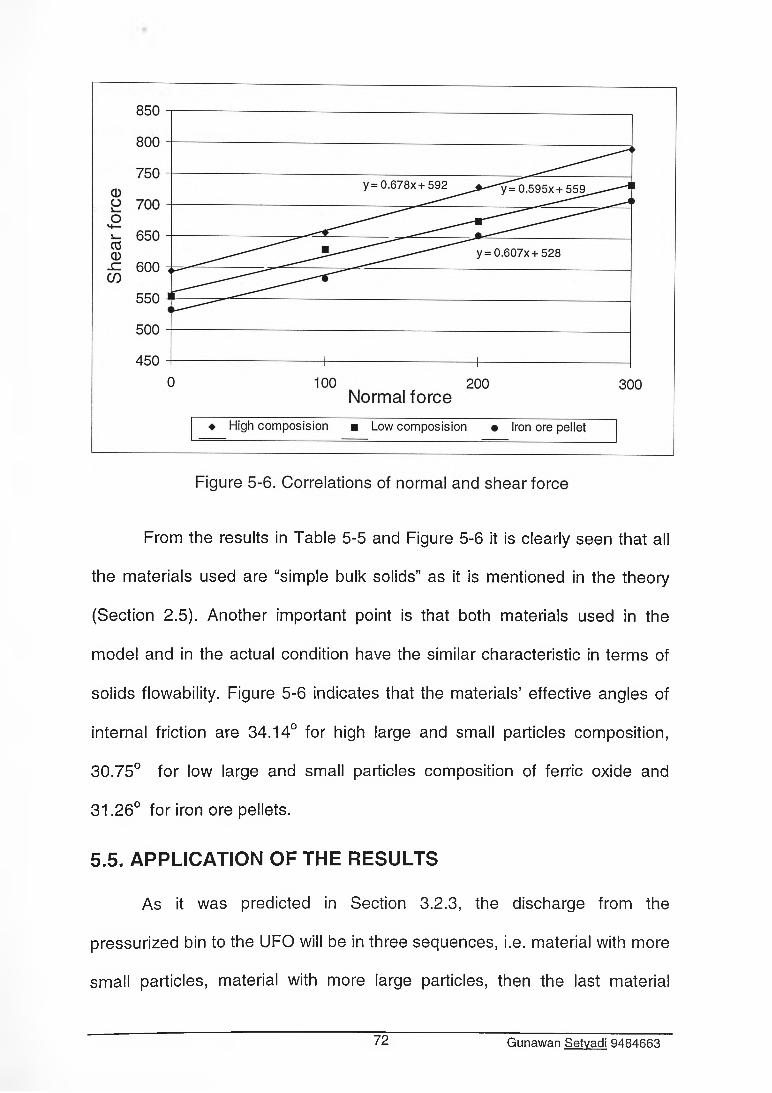
From the results in Table 5-5 and Figure 5-6 it is clearly seen that all
the materials used are “simple bulk solids” as it is mentioned in the theory
(Section 2.5). Another important point is that both materials used in the
model and in the actual condition have the similar characteristic in terms of
solids flowability. Figure 5-6 indicates that the materials’ effective angles of
internal friction are 34.14° for high large and small particles composition,
30.75° for low large and small particles composition of ferric oxide and
31.26° for iron ore pellets.
5.5. APPLICATION OF THE RESULTS
As it was predicted in Section 3.2.3, the discharge from the
pressurized bin to the UFO will be in three sequences, i.e. material with more
small particles, material with more large particles, then the last material
72 Gunawan Setvadi 9484663
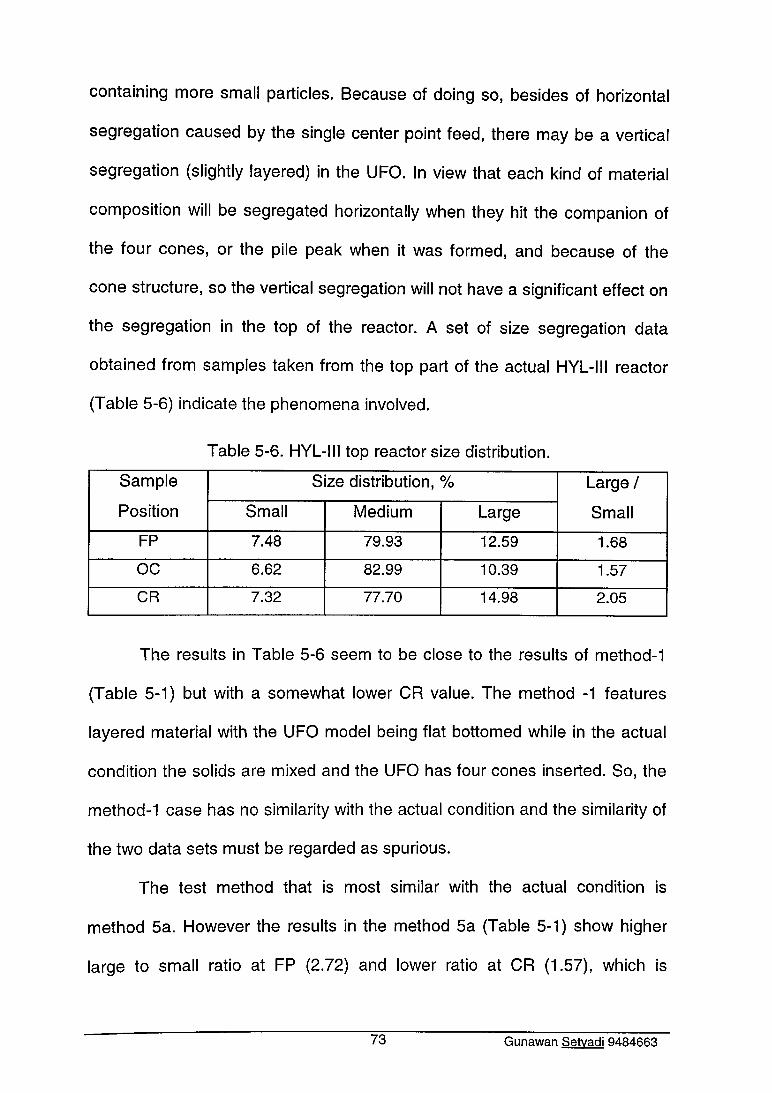
containing more small particles. Because of doing so, besides of horizontal
segregation caused by the single center point feed, there may be a vertical
segregation (slightly layered) in the UFO. In view that each kind of material
composition will be segregated horizontally when they hit the companion of
the four cones, or the pile peak when it was formed, and because of the
cone structure, so the vertical segregation will not have a significant effect on
the segregation in the top of the reactor. A set of size segregation data
obtained from samples taken from the top part of the actual HYL-III reactor
(Table 5-6) indicate the phenomena involved.
Table 5-6. HYL-III top reactor size distribution.
Sample Size distribution, % Large /
Position Small Medium Large Small
FP 7.48 79.93 12.59 1.68
OC 6.62 82.99 10.39 1.57
CR 7.32 77.70 14.98 2.05
The results in Table 5-6 seem to be close to the results of method-1
(Table 5-1) but with a somewhat lower CR value. The method -1 features
layered material with the UFO model being flat bottomed while in the actual
condition the solids are mixed and the UFO has four cones inserted. So, the
method-1 case has no similarity with the actual condition and the similarity of
the two data sets must be regarded as spurious.
The test method that is most similar with the actual condition is
method 5a. However the results in the method 5a (Table 5-1) show higher
large to small ratio at FP (2.72) and lower ratio at CR (1.57), which is
73 Gunawan Setvadi 9484663
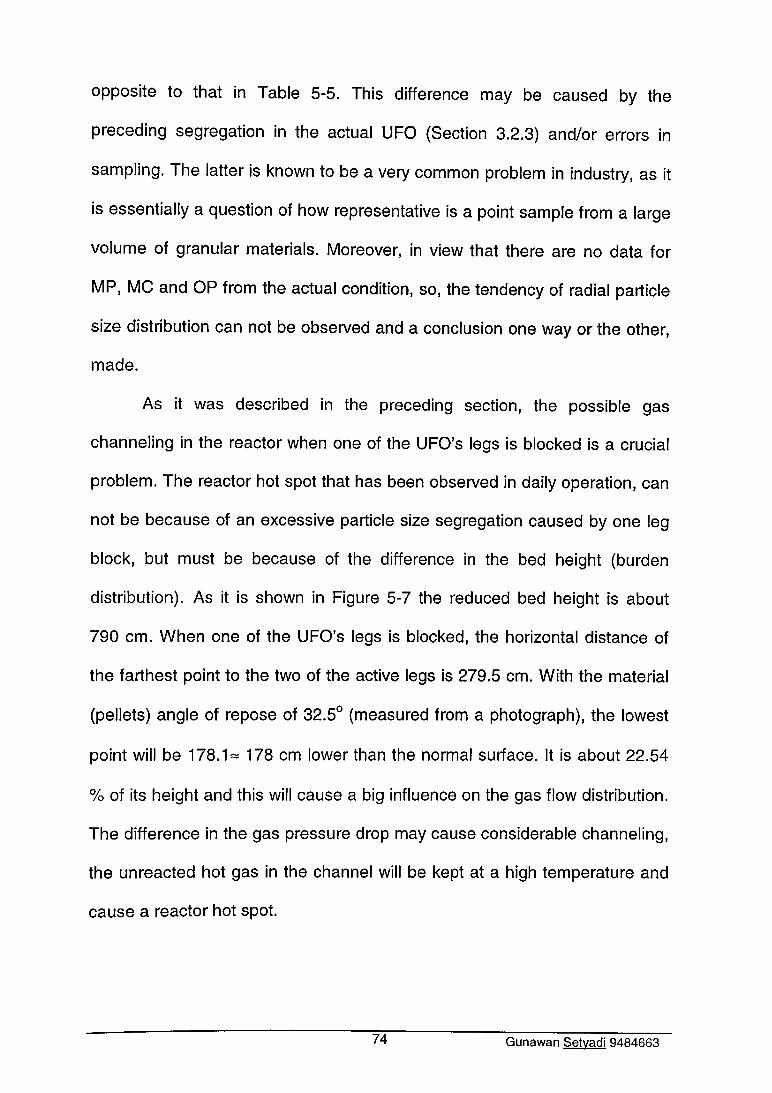
opposite to that in Table 5-5. This difference may be caused by the
preceding segregation in the actual UFO (Section 3.2.3) and/or errors in
sampling. The latter is known to be a very common problem in industry, as it
is essentially a question of how representative is a point sample from a large
volume of granular materials. Moreover, in view that there are no data for
MP, MC and OP from the actual condition, so, the tendency of radial particle
size distribution can not be observed and a conclusion one way or the other,
made.
As it was described in the preceding section, the possible gas
channeling in the reactor when one of the UFO’s legs is blocked is a crucial
problem. The reactor hot spot that has been observed in daily operation, can
not be because of an excessive particle size segregation caused by one leg
block, but must be because of the difference in the bed height (burden
distribution). As it is shown in Figure 5-7 the reduced bed height is about
790 cm. When one of the UFO’s legs is blocked, the horizontal distance of
the farthest point to the two of the active legs is 279.5 cm. With the material
(pellets) angle of repose of 32.5° (measured from a photograph), the lowest
point will be 178.1- 178 cm lower than the normal surface. It is about 22.54
% of its height and this will cause a big influence on the gas flow distribution.
The difference in the gas pressure drop may cause considerable channeling,
the unreacted hot gas in the channel will be kept at a high temperature and
cause a reactor hot spot.
74 Gunawan Setvadi 9484663
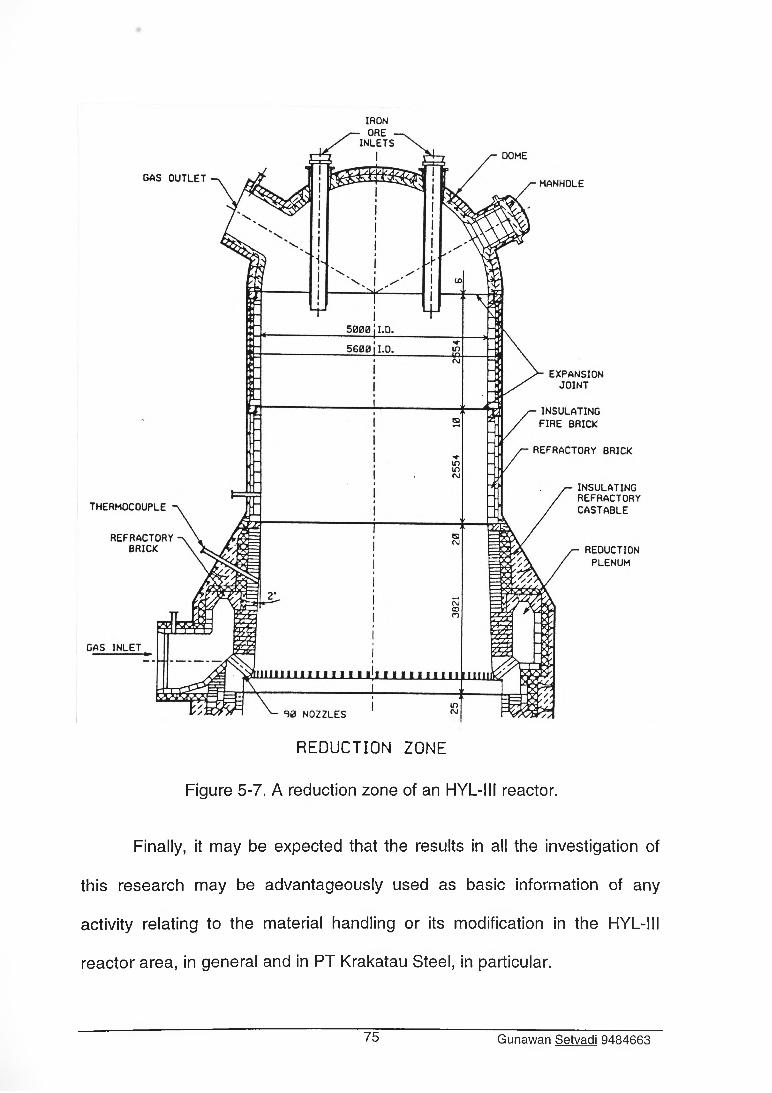
S0 NOZZLES
REDUCTION ZONE
Figure 5-7. A reduction zone of an HYL-III reactor.
Finally, it may be expected that the results in all the investigation of
this research may be advantageously used as basic information of any
activity relating to the material handling or its modification in the HYL-III
reactor area, in general and in PT Krakatau Steel, in particular.
75 Gunawan Setvadi 9484663
CHAPTER SIX
CONCLUSIONS
A study of size segregation in the top part of an HYL-III reactor has
been carried out on a one tenth scale cold model. From the results of the
investigation, the following conclusions are drawn :
1. The solids with an equal initial composition of large, medium and small
particles are easier to segregate than if they have a low (-| + initial
composition of large and small particles, except for the cone inserted UFO
model.
2. For the same initial solids composition, the higher the solids flow rate
during discharge the less it is segregated, but for the linear solids flow
rates in the UFO model which were in the range of 2.6 to 4.4 cm per
minute, the effect of this small range can not be seen.
3. The layered solids charging in the UFO model gave more segregated
results than for the complete mixing charge.
4. The segregation results that match with the “ideal condition” were obtained
only for the legs-only charging. This was attributed to the absence of
charge and discharge segregation in the UFO model.
5. A single center charging causes a severe size segregation in the UFO
model and its segregation enhance the segregation in the reactor model,
while the presence of an inserted cone in the UFO model reduces
76 Gunawan Setvadi 9484663
6. The one leg blocked UFO discharging had no significant effect to the
reactor segregation, but cause a big effect to the burden distribution of the
solids in the reactor.
7. The segregation results taken from the industrial HYL-III reactor were
reasonably close to the model results from the low initial concentration of
large and small particles case with cone inserted in UFO model.
segregation in the reactor model and also diminishes the effect of initial
solids composition to the reactor model segregation.
77 Gunawan Setvadi 9484663

REFERENCES
Arnold, P.C., 1992, Bulk Solids Handling; A Collection of Notes and Papers,
P a rti, The University Of Wollongong, Wollongong, New South
Wales.
Carson, J.W., and Marinelli, J., 1994, Characterize Bulk Solids To Ensure
Smooth Flow, Chemical Engineering, Vol. 101, No. 4, pp 78-90.
Fayed, M.E., and Otten, L , 1984, Handbook of Powder Science and
Technology, Van Nostrand Reinhold Company, New York.
Foust, A.S., Wenzel, L.A., Clump, C.W., Maus, L , and Andersen, L.B., 1960,
Principles of Unit Operations, John Wiley and Sons Inc., New York.
German, R.M., 1989, Particle Packing Characteristics, Metal Powder
Industries Federation, Princeton, New Jersey.
Humby, S., Tuzun, U., and Yu, A.B., 1997, Prediction Of Hopper Discharge
Rates Of Binary Granular Mixtures, Chemical Engineering Science,
Vol. 53, pp 483-494.
linoya, K., Beddow, J.K., and Jimbo, G., 1984, Powder Technology,
McGraw-Hill International Book Company, New York.
Jenike, A.W., 1970, Storage And Flow Of Solids, Bulletin of the University of
Utah, Vol. 23, No. 26.
Johanson, J.R., 1979, Two-Phase-Flow Effects In Solids Processing And
Handling, Chemical Engineering, Vol. 86, No. 1, pp 77-86.
78 Gunawan Setvadi. 9484663
Kajiwara, Y., Inada, T., and Tanaka, T., 1988, Two Dimensional Analysis On
The Formation Of Burden Distribution At Blast Furnace Top,
Transaction of The Iron and Steel Institute of Japan, Vol. 28, pp 916
925.
Levenspiel, O., 1972, Chemical Reaction Engineering, John Wiley and Sons,
New York.
Perry, R.H., Green, D.W., and Maloney, O.J., 1984, Perry’s Chemical
Engineers’ Handbook, 6th ed., McGraw-Hill Book Co., New York.
Standish, N., and Kilic, A., 1985, Comparision Of Stop-Start And Continuous
Sampling Methods Of Studying Segregation Of Materials Discharging
From A Hopper, Chemical Engineering Science, Vol. 40, No. 11, pp
2152- 2153.
Standish, N., 1985, Studies Of Size Segregation In Filling And Emptying A
Hopper, Powder Technology, Vol. 45, pp 43-56.
Standish, N., 1986, Size Segregation In Bell-Less Top Furnaces, European
Ironmaking Congress, Aachen.
Standish, N., and Jones, J.J., 1984, A Tracer Study Of Discharge
Segregation From A Paul Wurth Hopper, Symposium on Extractive
Metallurgy, The Aus. I.M.M., Melbourne, pp 279-285.
Standish, N., and Tambakis, N., 1978, The Flow Pattern Of Solids In A
Gravity Column, Powder Technology, Vol. 21, pp 113-117.
Standish, N., Liu, Y.N., and McLean, A.G., 1988, Quantification Of The
Degree Of Mixing In Bins, Powder Technology, Vol. 54, pp 197-208.
79 Gunawan Setvadi. 9484663
Standish, N., 1989, On Scale-Up Criteria For Discharge Segregation in
Hoppers, Unpublished Paper, The University Of Wollongong,
Wollongong, New South Wales.
Tanaka, T., Kajiwara, Y., and Inada, T., 1988, Flow Dynamics Of Granular
Materials In A Hopper, Transaction Of The Iron and Steel Institute of
Japan, Vol. 28, pp 907-915.
80 Gunawan Setvadi. 9484663

APPENDIX A
EXPERIMANTAL RESULTS
EXPERIMENTAL METHOD DEFINITIONS
Method 1
Method 2a
Method 2b
Method 3a
Method 3b
Method 4a
: Charging the UFO model with low composition of small and
large particles (16.67 % small, 66.66 % medium and 16.67 %
large), by layering and discharge with low solids flow rate.
: Charging the UFO model with low composition of small and
large particles, by mixing and discharge with low solids flow
rate.
: Charging the UFO model with low composition of small and
large particles, by mixing and discharge with high solids flow
rate.
: Charging the UFO model with low composition of small and
large particles, in the legs only and discharge with low solids
flow rate.
: Charging the UFO model with high composition of small and
large particles (all small, medium and large are 33.33 %) in the
legs only and discharge with low solids flow rate.
: Charging the UFO model with low composition of small and
large particles, at one center pile and discharge with low solids
flow rate.
81 Gunawan Setyadi 9484663
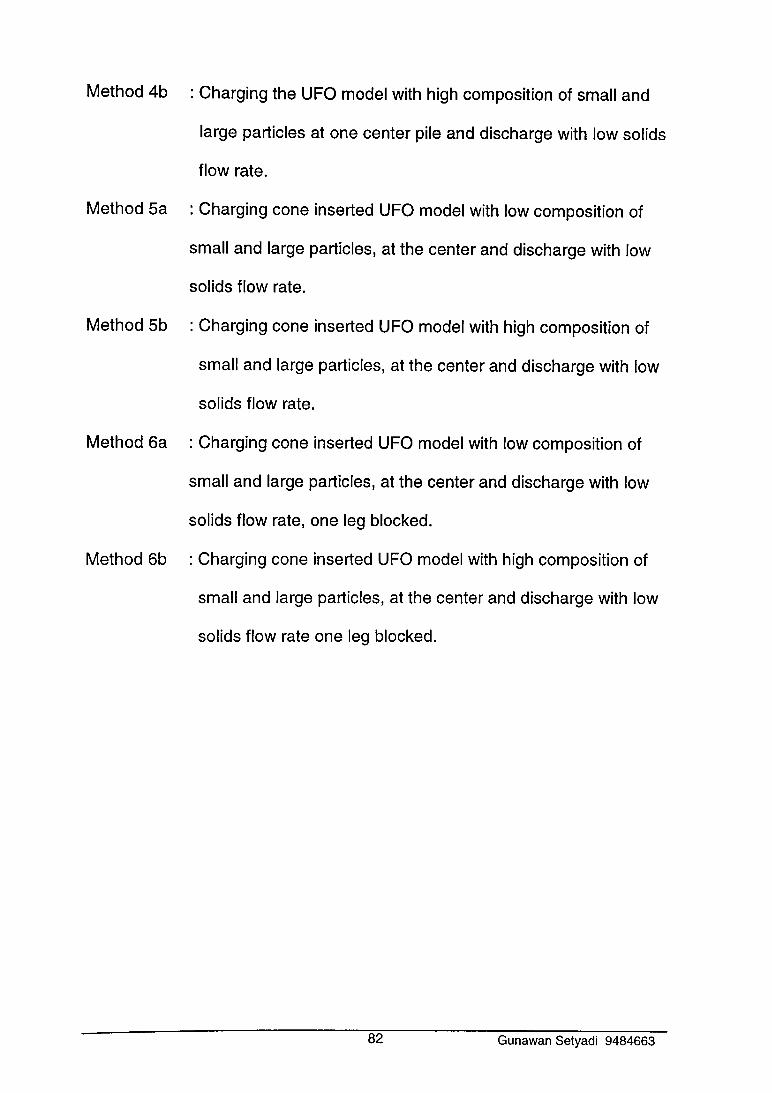
Method 4b
Method 5a
Method 5b
Method 6a
Method 6b
: Charging the UFO model with high composition of small and
large particles at one center pile and discharge with low solids
flow rate.
: Charging cone inserted UFO model with low composition of
small and large particles, at the center and discharge with low
solids flow rate.
: Charging cone inserted UFO model with high composition of
small and large particles, at the center and discharge with low
solids flow rate.
: Charging cone inserted UFO model with low composition of
small and large particles, at the center and discharge with low
solids flow rate, one leg blocked.
: Charging cone inserted UFO model with high composition of
small and large particles, at the center and discharge with low
solids flow rate one leg blocked.
82 Gunawan Setyadi 9484663
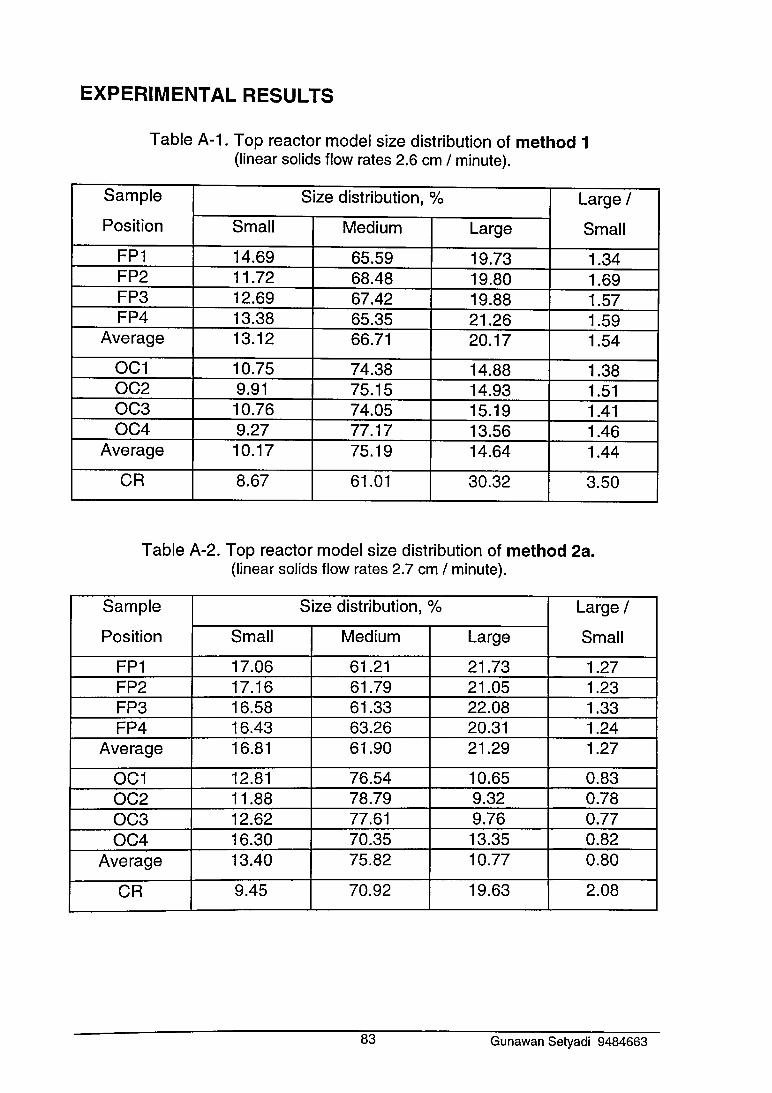
EXPERIMENTAL RESULTS
Table A-1. Top reactor model size distribution of method 1(linear solids flow rates 2.6 cm / minute).
Sample
Position
Size distribution, % Large /
SmallSmall Medium Large
FP1 14.69 65.59 19.73 1.34FP2 11.72 68.48 19.80 1.69FP3 12.69 67.42 19.88 1.57FP4 13.38 65.35 21.26 1.59
Average 13.12 66.71 20.17 1.54
OC1 10.75 74.38 14.88 1.38OC2 9.91 75.15 14.93 1.51OC3 10.76 74.05 15.19 1.41OC4 9.27 77.17 13.56 1.46
Average 10.17 75.19 14.64 1.44
CR 8.67 61.01 30.32 3.50
Table A-2. Top reactor model size distribution of method 2a. (linear solids flow rates 2.7 cm / minute).
Sample
Position
Size distribution, % Large /
SmallSmall Medium Large
FP1 17.06 61.21 21.73 1.27FP2 17.16 61.79 21.05 1.23FP3 16.58 61.33 22.08 1.33FP4 16.43 63.26 20.31 1.24
Average 16.81 61.90 21.29 1.27
OC1 12.81 76.54 10.65 0.83OC2 11.88 78.79 9.32 0.78OC3 12.62 77.61 9.76 0.77OC4 16.30 70.35 13.35 0.82
Average 13.40 75.82 10.77 0.80
CR 9.45 70.92 19.63 2.08
83 Gunawan Setyadi 9484663
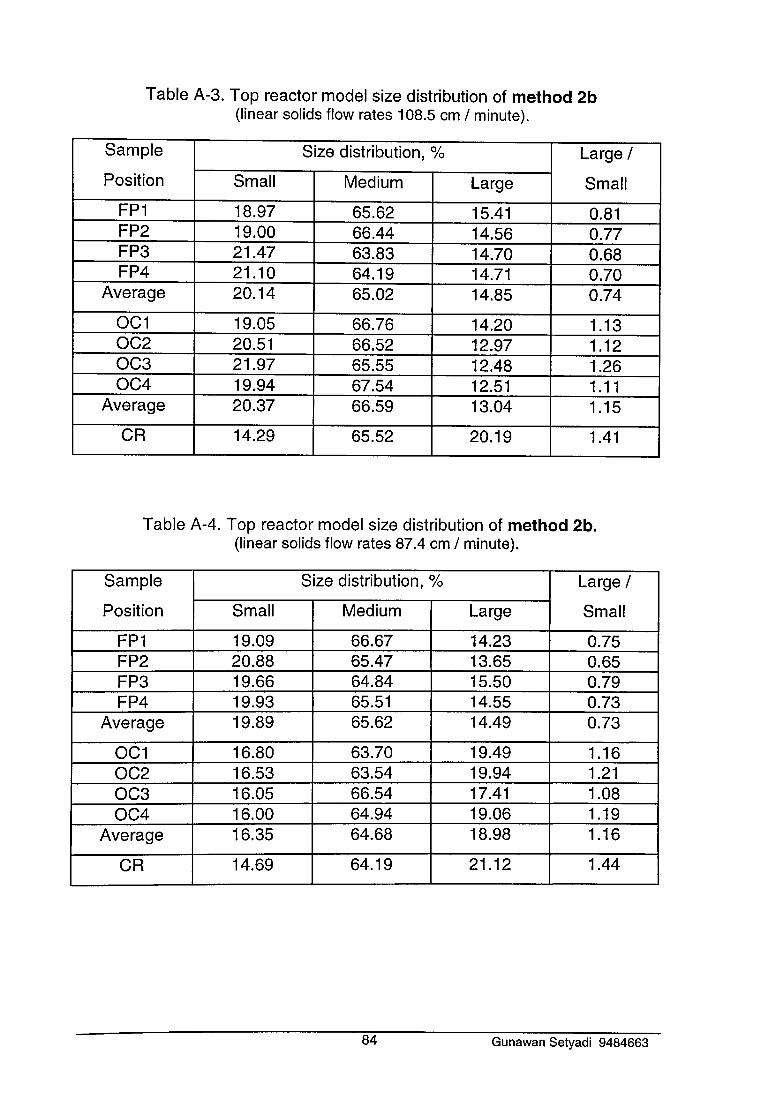
Table A-3. Top reactor model size distribution of method 2b(linear solids flow rates 108.5 cm / minute).
Sample
Position
Size distribution, % Large /
SmallSmall Medium Large
FP1 18.97 65.62 15.41 0.81FP2 19.00 66.44 14.56 0.77FP3 21.47 63.83 14.70 0.68FP4 21.10 64.19 14.71 0.70
Average 20.14 65.02 14.85 0.74
OC1 19.05 66.76 14.20 1.13OC2 20.51 66.52 12.97 1.12OC3 21.97 65.55 12.48 1.26OC4 19.94 67.54 12.51 1.11
Average 20.37 66.59 13.04 1.15
CR 14.29 65.52 20.19 1.41
Table A-4. Top reactor model size distribution of method 2b. (linear solids flow rates 87.4 cm / minute).
Sample
Position
Size distribution, % Large /
SmallSmall Medium Large
FP1 19.09 66.67 14.23 0.75FP2 20.88 65.47 13.65 0.65FP3 19.66 64.84 15.50 0.79FP4 19.93 65.51 14.55 0.73
Average 19.89 65.62 14.49 0.73
OC1 16.80 63.70 19.49 1.16OC2 16.53 63.54 19.94 1.21OC3 16.05 66.54 17.41 1.08OC4 16.00 64.94 19.06 1.19
Average 16.35 64.68 18.98 1.16
CR 14.69 64.19 21.12 1.44
84 Gunawan Setyadi 9484663
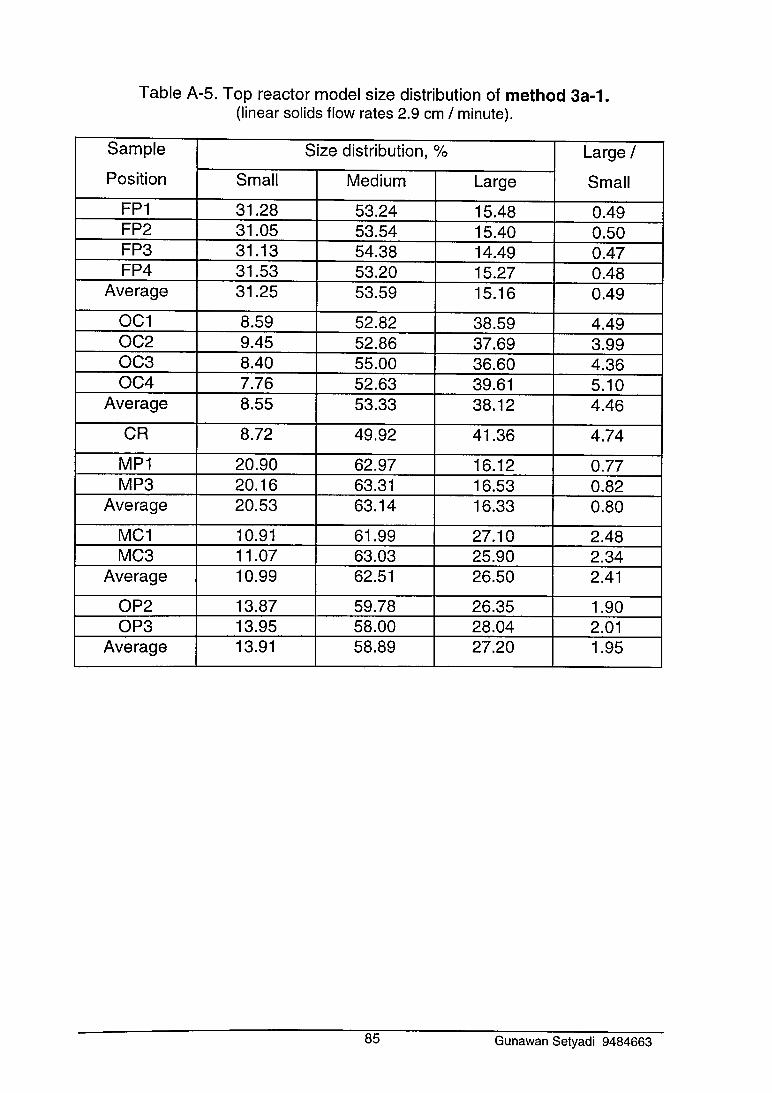
Table A-5. Top reactor model size distribution of method 3a-1.(linear solids flow rates 2.9 cm / minute).
Sample
Position
Size distribution, % Large /
SmallSmall Medium Large
FP1 31.28 53.24 15.48 0.49FP2 31.05 53.54 15.40 0.50FP3 31.13 54.38 14.49 0.47FP4 31.53 53.20 15.27 0.48
Average 31.25 53.59 15.16 0.49
OC1 8.59 52.82 38.59 4.49OC2 9.45 52.86 37.69 3.99OC3 8.40 55.00 36.60 4.36OC4 7.76 52.63 39.61 5.10
Average 8.55 53.33 38.12 4.46
CR 8.72 49.92 41.36 4.74
MP1 20.90 62.97 16.12 0.77MP3 20.16 63.31 16.53 0.82
Average 20.53 63.14 16.33 0.80
MC1 10.91 61.99 27.10 2.48MC3 11.07 63.03 25.90 2.34
Average 10.99 62.51 26.50 2.41
OP2 13.87 59.78 26.35 1.90OP3 13.95 58.00 28.04 2.01
Average 13.91 58.89 27.20 1.95
85 Gunawan Setyadi 9484663
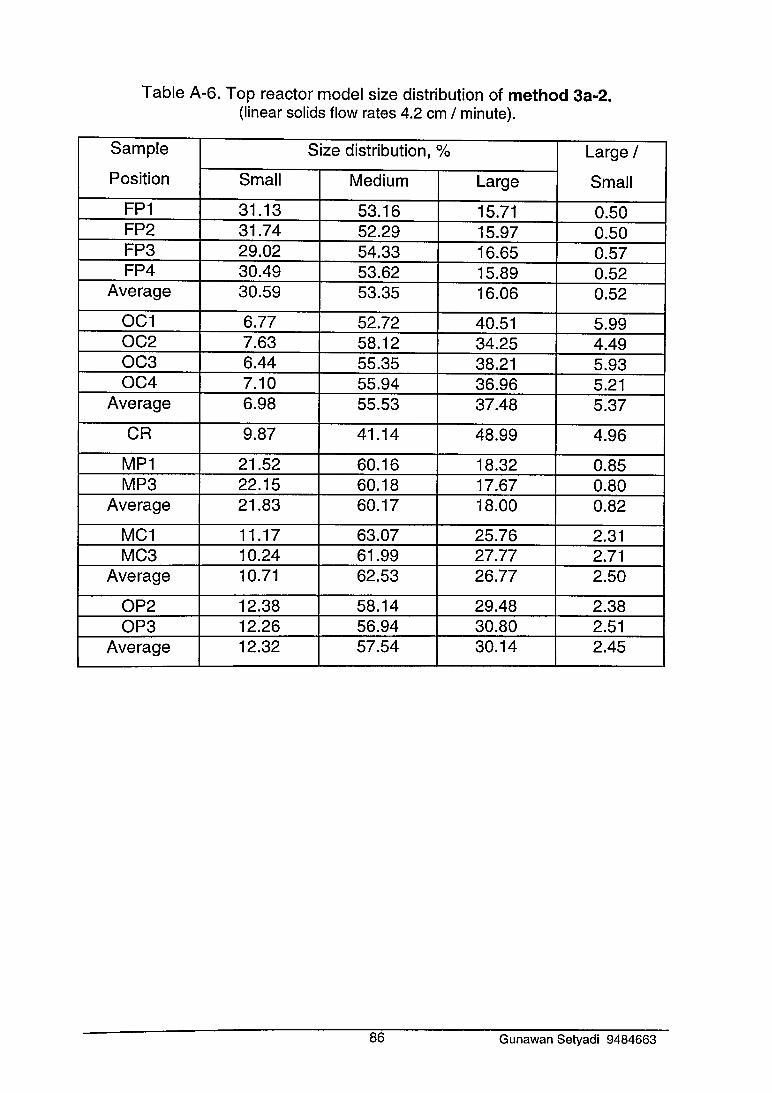
Table A-6. Top reactor model size distribution of method 3a-2.(linear solids flow rates 4.2 cm / minute).
Sample
Position
Size distribution, % Large /
SmallSmall Medium Large
FP1 31.13 53.16 15.71 0.50FP2 31.74 52.29 15.97 0.50FP3 29.02 54.33 16.65 0.57FP4 30.49 53.62 15.89 0.52
Average 30.59 53.35 16.06 0.52
OC1 6.77 52.72 40.51 5.99OC2 7.63 58.12 34.25 4.49OC3 6.44 55.35 38.21 5.93OC4 7.10 55.94 36.96 5.21
Average 6.98 55.53 37.48 5.37
CR 9.87 41.14 48.99 4.96
MP1 21.52 60.16 18.32 0.85MP3 22.15 60.18 17.67 0.80
Average 21.83 60.17 18.00 0.82
MC1 11.17 63.07 25.76 2.31MC3 10.24 61.99 27.77 2.71
Average 10.71 62.53 26.77 2.50
OP2 12.38 58.14 29.48 2.38OP3 12.26 56.94 30.80 2.51
Average 12.32 57.54 30.14 2.45
8 6 Gunawan Setyadi 9484663
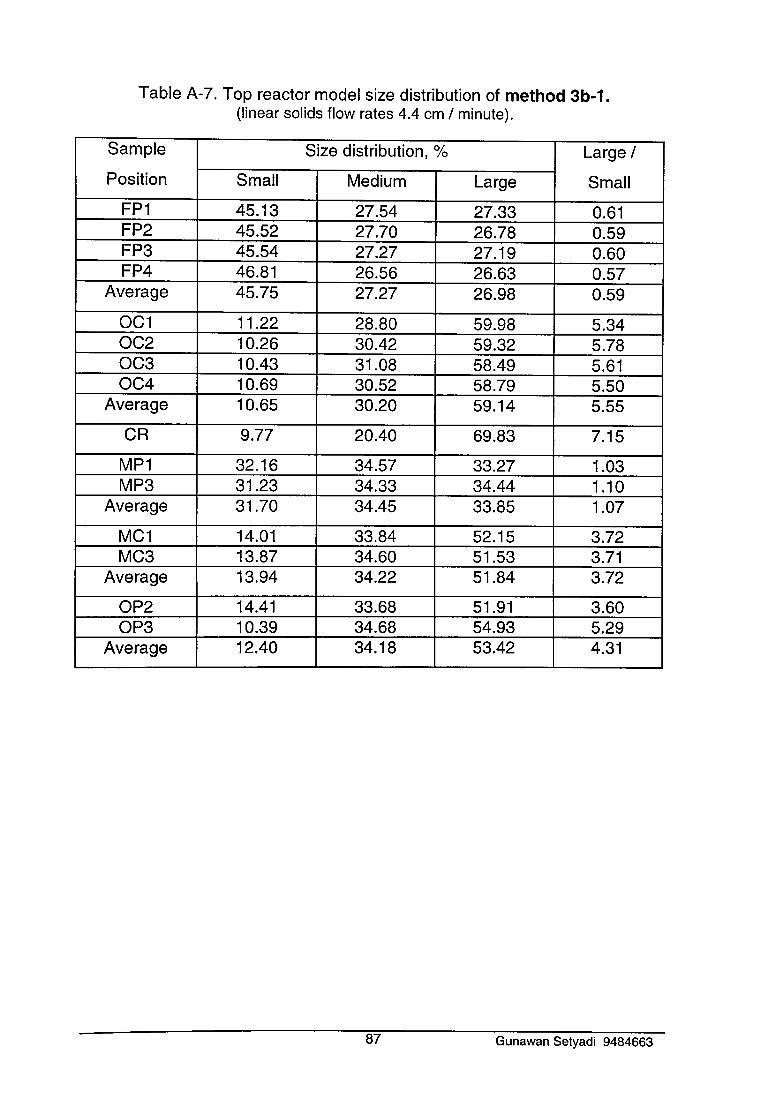
Table A-7. Top reactor model size distribution of method 3b-1.(linear solids flow rates 4.4 cm / minute).
Sample
Position
Size distribution, % Large /
SmallSmall Medium Large
FP1 45.13 27.54 27.33 0.61FP2 45.52 27.70 26.78 0.59FP3 45.54 27.27 27.19 0.60FP4 46.81 26.56 26.63 0.57
Average 45.75 27.27 26.98 0.59
OC1 11.22 28.80 59.98 5.34OC2 10.26 30.42 59.32 5.78OC3 10.43 31.08 58.49 5.61OC4 10.69 30.52 58.79 5.50
Average 10.65 30.20 59.14 5.55
CR 9.77 20.40 69.83 7.15
MP1 32.16 34.57 33.27 1.03MP3 31.23 34.33 34.44 1.10
Average 31.70 34.45 33.85 1.07
MC1 14.01 33.84 52.15 3.72MC3 13.87 34.60 51.53 3.71
Average 13.94 34.22 51.84 3.72
OP2 14.41 33.68 51.91 3.60OP3 10.39 34.68 54.93 5.29
Average 12.40 34.18 53.42 4.31
87 Gunawan Setyadi 9484663
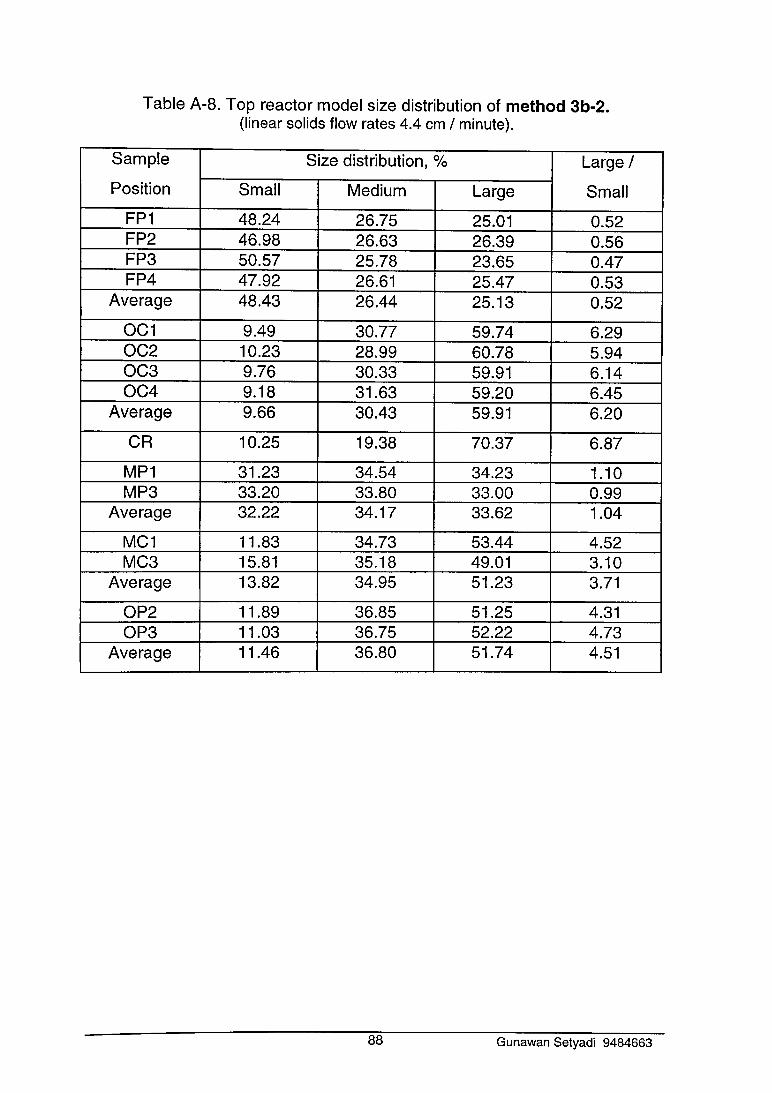
Table A-8. Top reactor model size distribution of method 3b-2.(linear solids flow rates 4.4 cm / minute).
Sample
Position
Size distribution, % Large /
SmallSmall Medium Large
FP1 48.24 26.75 25.01 0.52FP2 46.98 26.63 26.39 0.56FP3 50.57 25.78 23.65 0.47FP4 47.92 26.61 25.47 0.53
Average 48.43 26.44 25.13 0.52
OC1 9.49 30.77 59.74 6.29OC2 10.23 28.99 60.78 5.94OC3 9.76 30.33 59.91 6.14OC4 9.18 31.63 59.20 6.45
Average 9.66 30.43 59.91 6.20
CR 10.25 19.38 70.37 6.87
MP1 31.23 34.54 34.23 1.10MP3 33.20 33.80 33.00 0.99
Average 32.22 34.17 33.62 1.04
MC1 11.83 34.73 53.44 4.52MC3 15.81 35.18 49.01 3.10
Average 13.82 34.95 51.23 3.71
OP2 11.89 36.85 51.25 4.31OP3 11.03 36.75 52.22 4.73
Average 11.46 36.80 51.74 4.51
88 Gunawan Setyadi 9484663
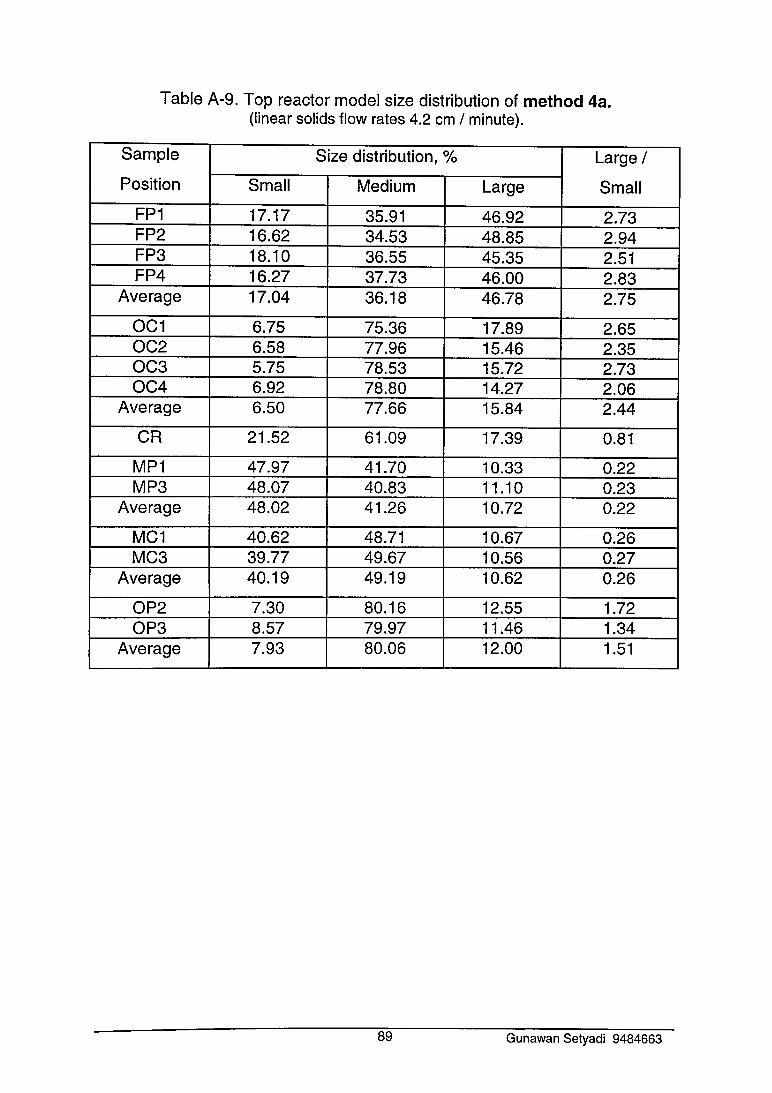
Table A-9. Top reactor model size distribution of method 4a.(linear solids flow rates 4.2 cm / minute).
Sample
Position
Size distribution, % Large /
SmallSmall Medium Large
FP1 17.17 35.91 46.92 2.73FP2 16.62 34.53 48.85 2.94FP3 18.10 36.55 45.35 2.51FP4 16.27 37.73 46.00 2.83
Average 17.04 36.18 46.78 2.75
OC1 6.75 75.36 17.89 2.65OC2 6.58 77.96 15.46 2.35OC3 5.75 78.53 15.72 2.73OC4 6.92 78.80 14.27 2.06
Average 6.50 77.66 15.84 2.44
CR 21.52 61.09 17.39 0.81
MP1 47.97 41.70 10.33 0.22MP3 48.07 40.83 11.10 0.23
Average 48.02 41.26 10.72 0.22
MC1 40.62 48.71 10.67 0.26MC3 39.77 49.67 10.56 0.27
Average 40.19 49.19 10.62 0.26
OP2 7.30 80.16 12.55 1.72OP3 8.57 79.97 11.46 1.34
Average 7.93 80.06 12.00 1.51
89 Gunawan Setyadi 9484663

Table A-10. Top reactor model size distribution of method 4b.(linear solids flow rates 4.3 cm / minute).
Sample
Position
Size distribution, % Large /
SmallSmall Medium Large
FP1 14.23 24.19 61.58 4.33FP2 13.90 23.81 62.29 4.48FP3 12.97 24.31 62.72 4.84FP4 12.23 24.79 62.98 5.15
Average 13.33 24.28 62.39 4.68
OC1 22.99 46.16 30.85 1.34OC2 22.92 46.52 30.56 1.33OC3 23.95 44.62 31.42 1.31OC4 24.51 44.35 31.15 1.27
Average 23.59 45.41 31.00 1.31
CR 25.47 27.37 47.16 1.85
MP1 67.37 18.90 13.73 0.20MP3 65.82 20.03 14.15 0.21
Average 66.60 19.46 13.94 0.21
MC1 38.51 34.10 27.38 0.71MC3 37.81 34.32 27.87 0.74
Average 38.16 34.21 27.63 0.72
OP2 24.97 43.15 31.88 1.28OP3 23.48 42.91 33.61 1.43
Average 24.22 43.03 32.75 1.35
90 Gunawan Setyadi 9484663
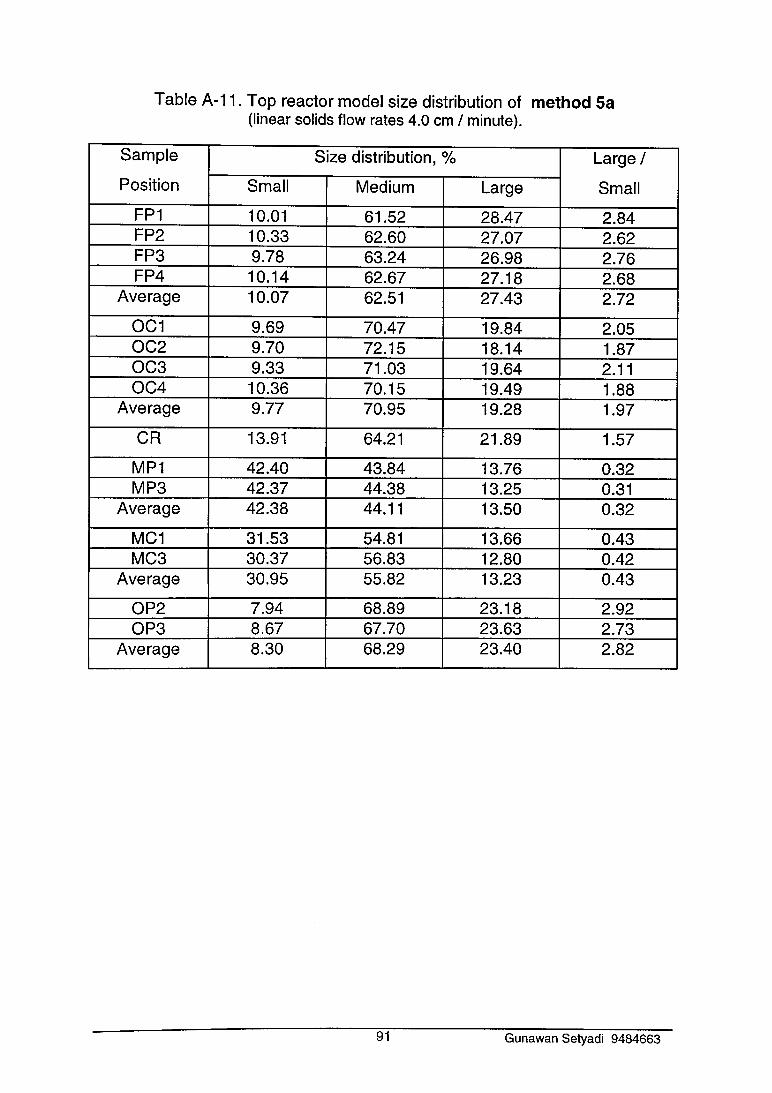
Table A-11. Top reactor model size distribution of method 5a(linear solids flow rates 4.0 cm / minute).
Sample
Position
Size distribution, % Large /
SmallSmall Medium Large
FP1 10.01 61.52 28.47 2.84FP2 10.33 62.60 27.07 2.62FP3 9.78 63.24 26.98 2.76FP4 10.14 62.67 27.18 2.68
Average 10.07 62.51 27.43 2.72
OC1 9.69 70.47 19.84 2.05OC2 9.70 72.15 18.14 1.87OC3 9.33 71.03 19.64 2.11OC4 10.36 70.15 19.49 1.88
Average 9.77 70.95 19.28 1.97
CR 13.91 64.21 21.89 1.57
MP1 42.40 43.84 13.76 0.32MP3 42.37 44.38 13.25 0.31
Average 42.38 44.11 13.50 0.32
MC1 31.53 54.81 13.66 0.43MC3 30.37 56.83 12.80 0.42
Average 30.95 55.82 13.23 0.43
OP2 7.94 68.89 23.18 2.92OP3 8.67 67.70 23.63 2.73
Average 8.30 68.29 23.40 2.82
91 Gunawan Setyadi 9484663

Table A-12. Top reactor model size distribution of method 5b.(linear solids flow rates 4.3 cm / minute).
Sample
Position
Size distribution, % Large /
SmallSmall Medium Large
FP1 20.41 29.89 49.70 2.44FP2 19.48 28.47 52.05 2.67FP3 19.42 30.62 49.96 2.57FP4 21.83 28.47 49.70 2.28
Average 20.29 29.36 50.35 2.48
OC1 19.81 37.26 42.93 2.17OC2 19.10 36.37 44.54 2.33OC3 19.72 35.62 44.67 2.27OC4 20.27 39.07 40.65 2.01
Average 19.73 37.08 43.20 2.19
CR 24.60 39.15 36.24 1.47
MP1 50.44 29.30 20.26 0.40MP3 50.35 29.07 20.58 0.41
Average 50.39 29.19 20.42 0.41
MC1 50.11 29.67 20.22 0.40MC3 51.03 28.23 20.74 0.41
Average 50.57 28.95 20.48 0.40
OP2 19.93 32.30 47.77 2.40OP3 19.48 31.50 49.02 2.52
Average 19.71 31.90 48.39 2.46
92 Gunawan Setyadi 9484663
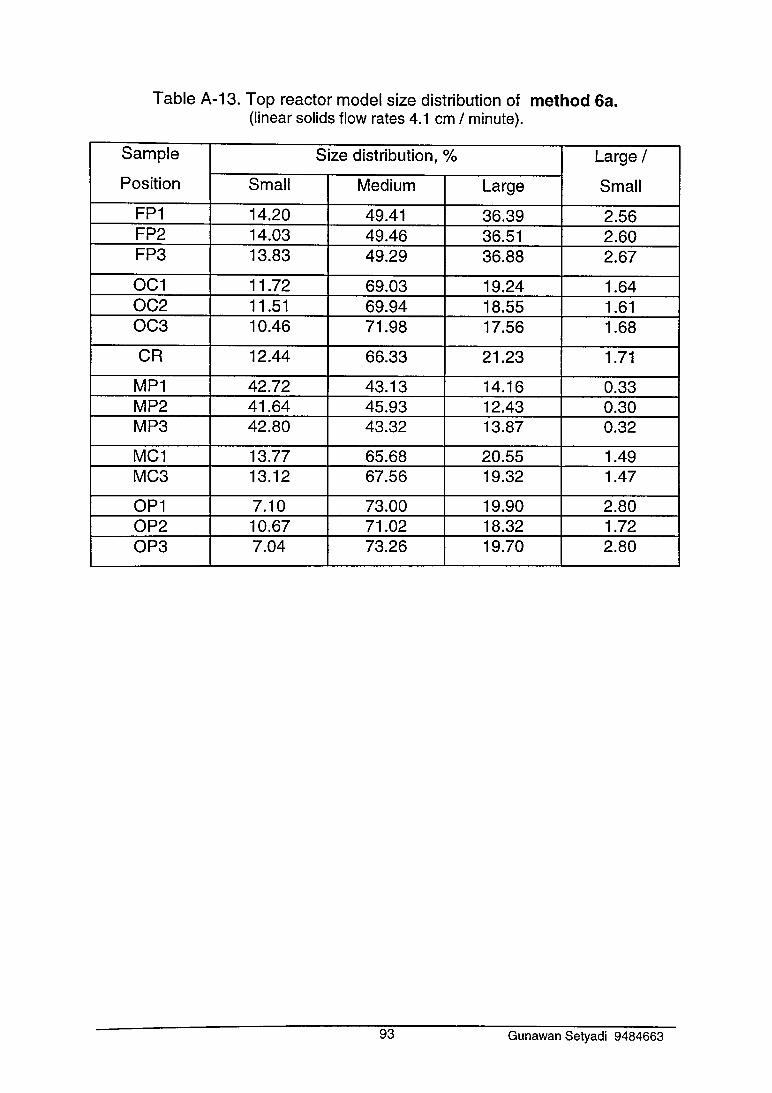
Table A-13. Top reactor model size distribution of method 6a.(linear solids flow rates 4.1 cm / minute).
Sample
Position
Size distribution, % Large /
SmallSmall Medium Large
FP1 14.20 49.41 36.39 2.56FP2 14.03 49.46 36.51 2.60FP3 13.83 49.29 36.88 2.67
OC1 11.72 69.03 19.24 1.64OC2 11.51 69.94 18.55 1.61OC3 10.46 71.98 17.56 1.68
CR 12.44 66.33 21.23 1.71
MP1 42.72 43.13 14.16 0.33MP2 41.64 45.93 12.43 0.30MP3 42.80 43.32 13.87 0.32
MC1 13.77 65.68 20.55 1.49MC3 13.12 67.56 19.32 1.47
OP1 7.10 73.00 19.90 2.80OP2 10.67 71.02 18.32 1.72OP3 7.04 73.26 19.70 2.80
93 Gunawan Setyadi 9484663
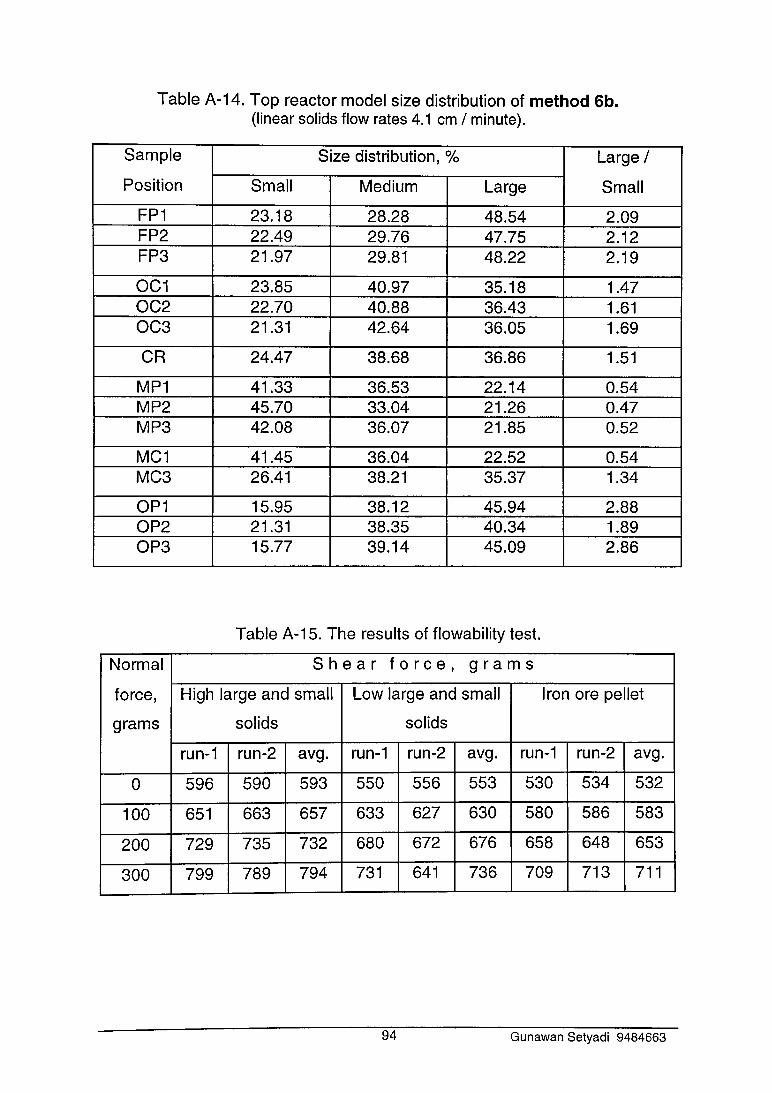
Table A-14. Top reactor model size distribution of method 6b.(linear solids flow rates 4.1 cm / minute).
Sample
Position
Size distribution, % Large /
SmallSmall Medium Large
FP1 23.18 28.28 48.54 2.09FP2 22.49 29.76 47.75 2.12FP3 21.97 29.81 48.22 2.19
OC1 23.85 40.97 35.18 1.47OC2 22.70 40.88 36.43 1.61OC3 21.31 42.64 36.05 1.69
CR 24.47 38.68 36.86 1.51
MP1 41.33 36.53 22.14 0.54MP2 45.70 33.04 21.26 0.47MP3 42.08 36.07 21.85 0.52
MC1 41.45 36.04 22.52 0.54MC3 26.41 38.21 35.37 1.34
OP1 15.95 38.12 45.94 2.88OP2 21.31 38.35 40.34 1.89OP3 15.77 39.14 45.09 2.86
Table A-15. The results of flowability test.
Normal
force,
grams
S h e a r f o r c e , g r a m s
High large and small
solids
Low large and small
solids
Iron ore pellet
run-1 run-2 avg. run-1 run-2 avg. run-1 run-2 avg.
0 596 590 593 550 556 553 530 534 532
100 651 663 657 633 627 630 580 586 583
200 729 735 732 680 672 676 658 648 653
300 799 789 794 731 641 736 709 713 711
94 Gunawan Setyadi 9484663
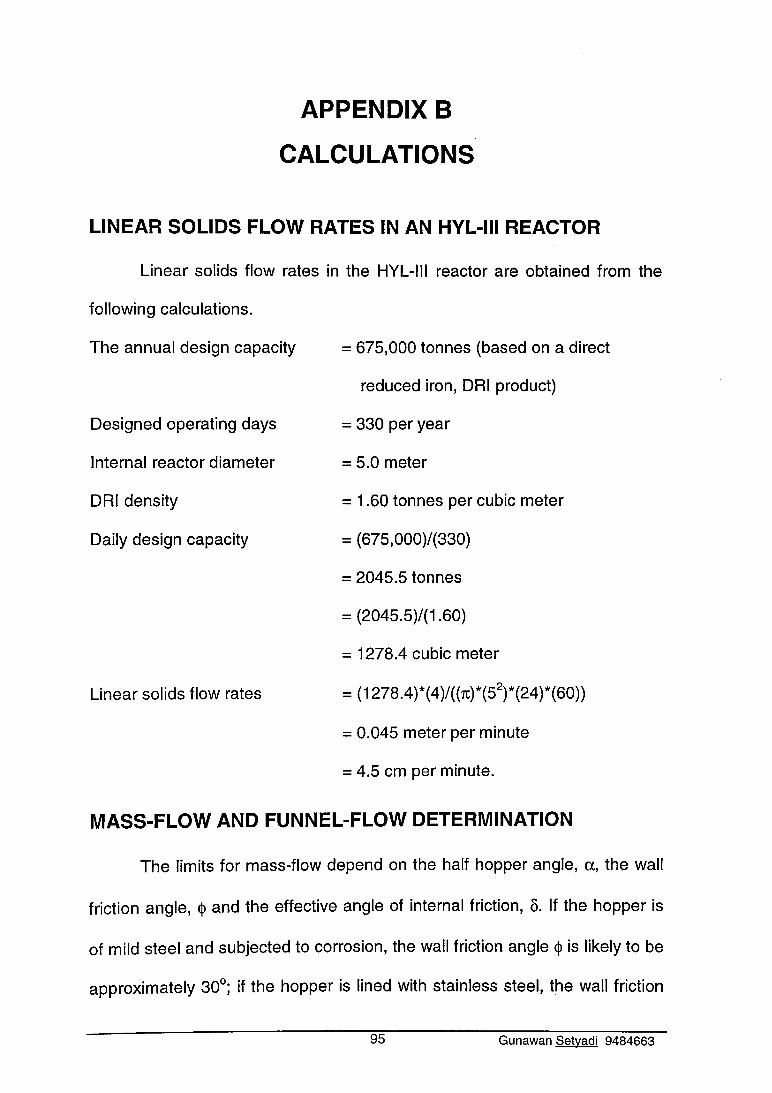
APPENDIX B
CALCULATIONS
LINEAR SOLIDS FLOW RATES IN AN HYL-III REACTOR
Linear solids flow rates in the HYL-III reactor are obtained from the
following calculations.
The annual design capacity = 675,000 tonnes (based on a direct
reduced iron, DRI product)
Designed operating days = 330 per year
Internal reactor diameter = 5.0 meter
DRI density = 1.60 tonnes per cubic meter
Daily design capacity = (675,000)/(330)
= 2045.5 tonnes
= (2045.5)/(1.60)
= 1278.4 cubic meter
Linear solids flow rates = (1 278.4)*(4)/((ti)*(52)*(24)*(60))
= 0.045 meter per minute
= 4.5 cm per minute.
MASS-FLOW AND FUNNEL-FLOW DETERMINATION
The limits for mass-flow depend on the half hopper angle, a, the wall
friction angle, § and the effective angle of internal friction, 8. If the hopper is
of mild steel and subjected to corrosion, the wall friction angle c|) is likely to be
approximately 30°; if the hopper is lined with stainless steel, the wall friction
95 Gunawan Setvadi 9484663

angle § is likely to be approximately 20° The actual half hopper angle taken
is usually 3° less than its calculation [Arnold, 1992]. The relationships for
conical and wedge-shaped hopper are shown in Figure B-1.
Figure B-1. Limits for mass-flow for conical and plane flow channel
[Arnold, 1992].
The effective angle of internal friction for the iron ore pellet is about
30°, From Figure B-1, for a mild steel hopper, the half hopper limits for mass-
flow is about 12° for conical hopper and 20° for wedge-shaped hopper.
Corresponding to this result the solids flow in the day-bin hopper with 15.6°
of maximum wedge-shaped half hopper angle (Section 3.2.1) is a mass-flow,
the solids flow in the loading bin with cone half hopper angle of 40° (Section
3.2.2) , in the pressurized bin with cone half hopper angle of 39° (Section
3.2.3) and in the UFO bin with cone half hopper angle of 41° (Section 3.2.4)
are funnel-flow. The effective angle of internal friction for the material used in
96 Gunawan Setvadi 9484663
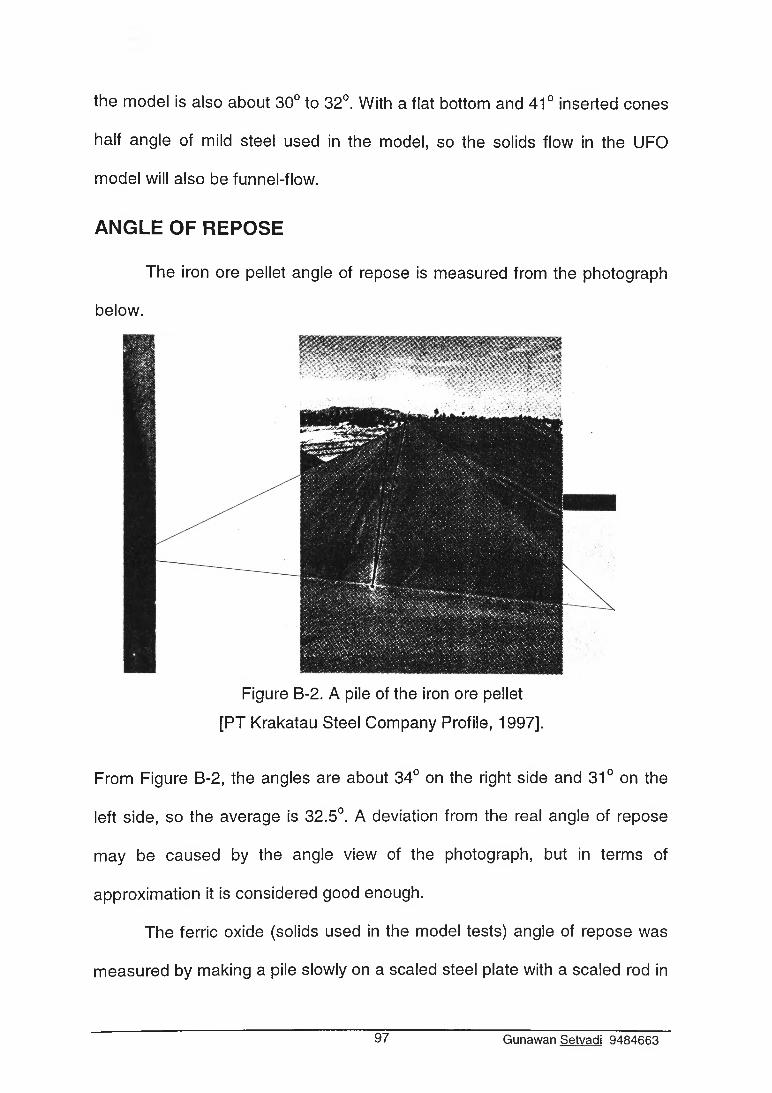
the model is also about 30° to 32°. With a flat bottom and 41° inserted cones
half angle of mild steel used in the model, so the solids flow in the UFO
model will also be funnel-flow.
ANGLE OF REPOSE
The iron ore pellet angle of repose is measured from the photograph
below.
Figure B-2. A pile of the iron ore pellet
[PT Krakatau Steel Company Profile, 1997].
From Figure B-2, the angles are about 34° on the right side and 31° on the
left side, so the average is 32.5°. A deviation from the real angle of repose
may be caused by the angle view of the photograph, but in terms of
approximation it is considered good enough.
The ferric oxide (solids used in the model tests) angle of repose was
measured by making a pile slowly on a scaled steel plate with a scaled rod in
97 Gunawan Setvadi 9484663
the center of the pile. The ratio of the measurement at the rod and at the
plate is the tangent of the angle, and it was determined that the angle of
repose was about 22°.
98 Gunawan Setvadi 9484663