Embed Size (px)
Citation preview
A STUDY OF SHIP SIZE AND TURNAROUND TIME IN THE PORT OF VANCOUVER
by
KEITH RONALD STUDER
B.A., Oxford University, 1966
A THESIS SUBMITTED IN PARTIAL FULFILLMENT OF
THE REQUIREMENTS FOR THE DEGREE OF
MASTER OF BUSINESS ADMINISTRATION
in the Department
of
Commerce and Business Administration
We accept this thesis as conforming to the
required standard
THE UNIVERSITY OF BRITISH COLUMBIA
May 1969

In p r e s e n t i n g t h i s t h e s i s i n p a r t i a l f u l f i l m e n t o f t h e r e q u i r e m e n t s f o r
an a d v a n c e d d e g r e e a t t h e U n i v e r s i t y o f B r i t i s h C o l u m b i a , I a g r e e t h a t
t h e L i b r a r y s h a l l make i t f r e e l y a v a i l a b l e f o r r e f e r e n c e a n d S t u d y .
I f u r t h e r a g r e e t h a t p e r m i s s i o n f o r e x t e n s i v e c o p y i n g o f t h i s t h e s i s
f o r s c h o l a r l y p u r p o s e s may be g r a n t e d b y t h e Head o f my D e p a r t m e n t o r
b y h i s r e p r e s e n t a t i v e s . I t i s u n d e r s t o o d t h a t c o p y i n g o r p u b l i c a t i o n
o f t h i s t h e s i s f o r f i n a n c i a l g a i n s h a l l n o t be a l l o w e d w i t h o u t my
w r i t t e n p e r m i s s i o n .
D e p a r t m e n t o f Commerce and Business A d m i n i s t r a t i o n .
The U n i v e r s i t y o f B r i t i s h C o l u m b i a V a n c o u v e r 8, C a n a d a
Date June 9, 1969.

ABSTRACT
Ships of a l l types spend a large part of their l i v e s in port and this
i d l e time adds considerably to the fixed cost of providing shipping service.
Technological progress has empowered the construction of larger, faster and
more economical vessels, but organisational and cargo handling innovations
in the ports have not kept pace; in many instances the line-haul savings
achieved by larger vessels are negated by excessive i d l e time i n port, during
which many costs continue unabated. The extent to which ship size affects
loading time i s thus a measure of the extent to which economies of scale can
be implemented in the shipping industry; i t i s also important when making
a r a t i o n a l selection of an optimal ship s i z e .
This study concentrates on the loading of grain ships i n the port
of Vancouver; the operations of the port are examined and the constituent fac
tors of turnaround time delineated. Some of the possible causes of delay are
investigated. The costs associated with unproductive ship time are then
estimated and i t is shown that many of the developments in the shipping
industry are placing increased emphasis on a fast turnaround, the l a t t e r i s
often d i f f i c u l t to achieve because of disorganisation and c o n f l i c t i n g
interests i n the port.
The loading records of a sample of 1,305 grain ships are then examined
with a view to determining the degree of size dependency inherent in the
loading time and loading rate attained. I t i s concluded that there i s an
appreciable positive correlation between ship size and loading rate and
that the portion of the v a r i a t i o n explained by linear regression analysis i s
not inconsiderable.
Combining these dependencies of ship size and loading rate with the
dependency of ship size and cost estimated previously, the general form of
the relationship between ship size and total loading time cost per ton is
obtained. It is found that for those types of grain for which the results
are most conclusive, the cost per ton fa l l s up to large ship sizes. Having
regard to the present loading procedures for grain in Vancouver some pos
s ible improvements are suggested, namely the provision of increased loading
capacity and the aggregation of specific grades of grain around the harbour.
A rough estimate of the possible benefits associated with these course of
action is made. The potential benefits would seem to be considerable, but
a high degree of co-operation and co-ordination between the various port
interests would be required to attain them.

ACKNOWLEDGEMENTS
My thanks are due to many people who assisted i n this enquiry and
who provided hel p f u l comments on a l l aspects of the shipping scene; f i r s t l y
to Mr. Meredith Berridge of the B r i t i s h Columbia Grain Shippers' Clearance
Association, who provided much of the s t a t i s t i c a l data, but also to Mr.
Dennis Walker of the Anglo Canadian Shipping Company and Mr. Bob Weinberg
of P a c i f i c Coast Terminals who brought out some of the r e a l i t i e s of port
a c t i v i t y ; to Mr. John MacDonald, Mr. Richard Atkinson and Mr. Thomas John
of Swan Wooster Engineering, who made available some of the recent advances
in bulk cargo handling; to the Canadian Federal Department of Transport, with
the aid of whose Fellowship Award this work was undertaken, and f i n a l l y to
Dr. Trevor Heaver, the chairman of my thesis committee, for his helpful and
encouraging comments throughout the preparation of the study.
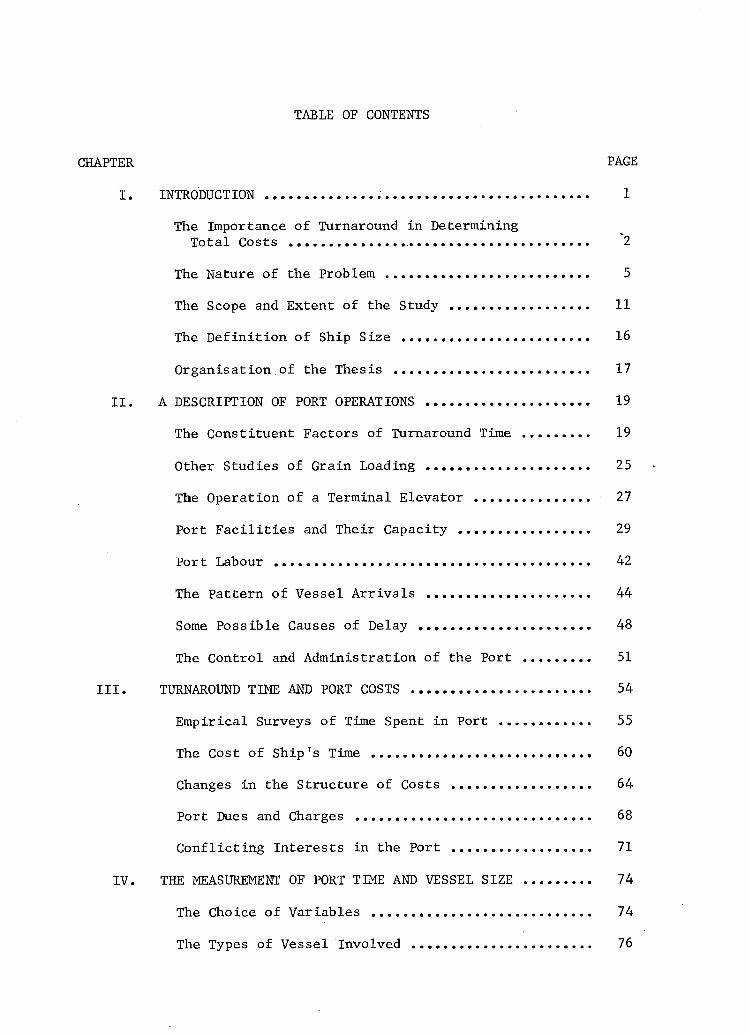
TABLE OF CONTENTS
CHAPTER PAGE
I. INTRODUCTION 1
The Importance of Turnaround i n Determining Total Costs 2
The Nature of the Problem 5
The Scope and Extent of the Study 11
The De f i n i t i o n of Ship Size 16
Organisation of the Thesis 17
I I . A DESCRIPTION OF PORT OPERATIONS 19
The Constituent Factors of Turnaround Time 19
Other Studies of Grain Loading 25
The Operation of a Terminal Elevator 27
Port F a c i l i t i e s and Their Capacity 29
Port Labour 42
The Pattern of Vessel A r r i v a l s 44
Some Possible Causes of Delay 48
The Control and Administration of the Port 51
I I I . TURNAROUND TIME AND PORT COSTS 54
Empirical Surveys of Time Spent i n Port 55
The Cost of Ship's Time 60
Changes i n the Structure of Costs 64
Port Dues and Charges 68
Conf l i c t i n g Interests in the Port 71
IV. THE MEASUREMENT OF PORT TIME AND VESSEL SIZE 74
The Choice of Variables 74
The Types of Vessel Involved 76
i i
CHAPTER PAGE
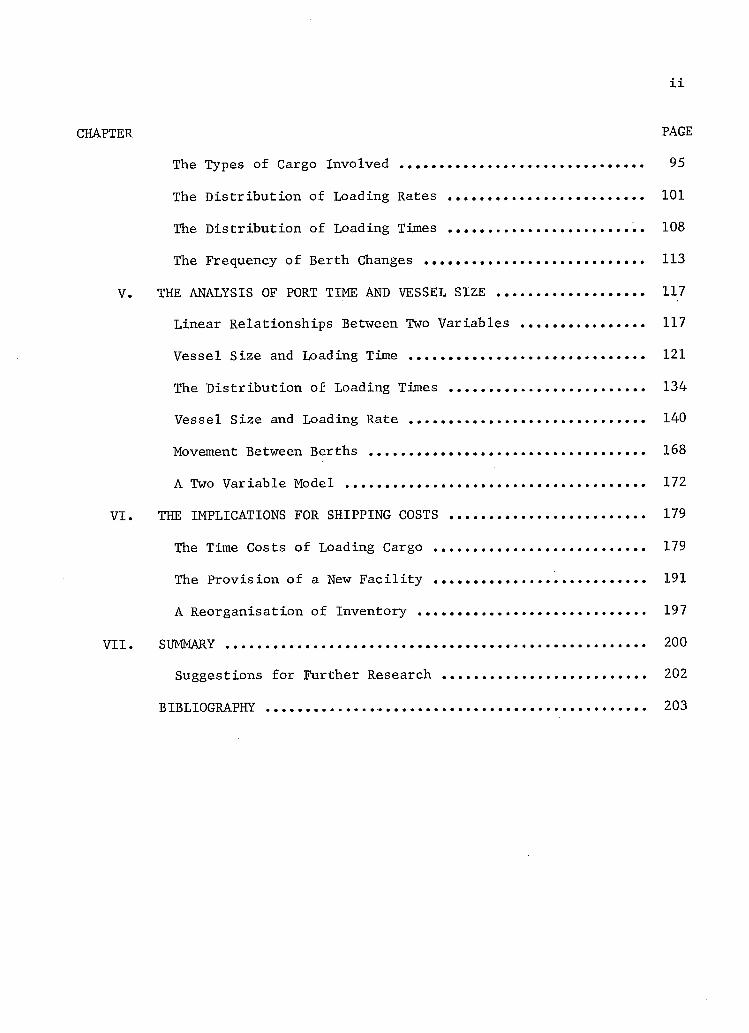
The Types of Cargo Involved 95
The D i s t r i b u t i o n of Loading Rates 101
The Di s t r i b u t i o n of Loading Times .. 108
The Frequency of Berth Changes 113
V. THE ANALYSIS OF PORT TIME AND VESSEL SIZE 117
Linear Relationships Between Two Variables 117
Vessel Size and Loading Time 121
The Di s t r i b u t i o n of Loading Times 134
Vessel Size and Loading Rate 140
Movement Between Berths 168
A Two Variable Model 172
VI. THE IMPLICATIONS FOR SHIPPING COSTS 179
The Time Costs of Loading Cargo 179
The Provision of a New F a c i l i t y 191
A Reorganisation of Inventory 197
VII. SUMMARY 200
Suggestions for Further Research 202
BIBLIOGRAPHY 203
i i i
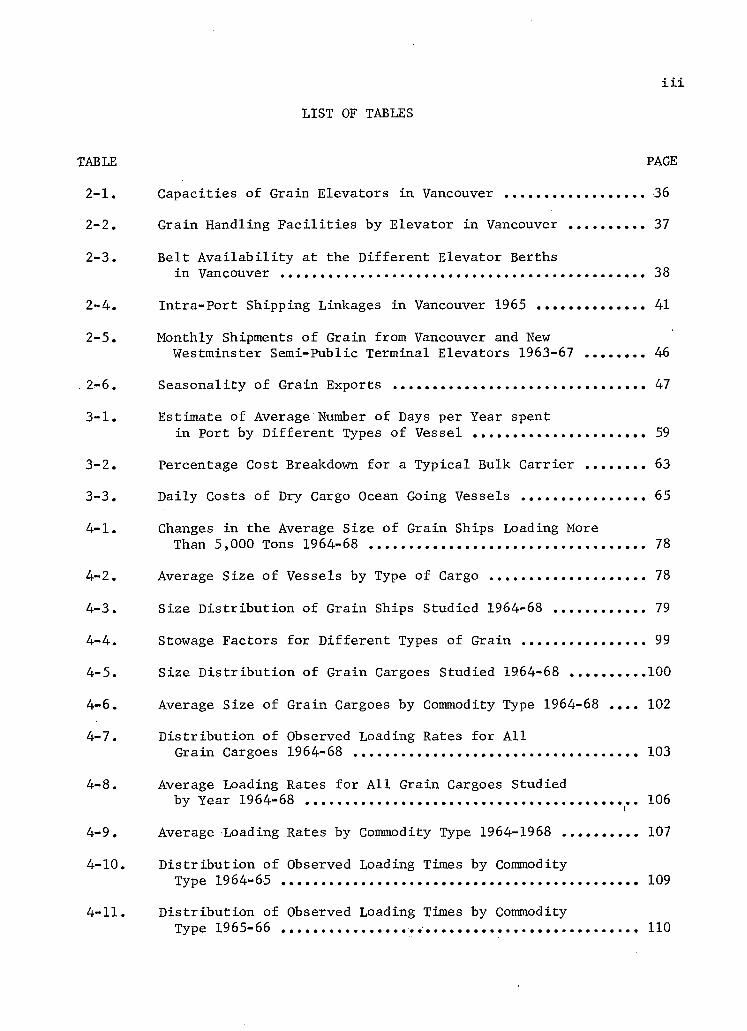
LIST OF TABLES
TABLE PAGE
2-1. C a p a c i t i e s of Grain E l e v a t o r s i n Vancouver 36
2-2. Grain Handling F a c i l i t i e s by E l e v a t o r i n Vancouver 37
2-3. B e l t A v a i l a b i l i t y at the D i f f e r e n t E l e v a t o r Berths
i n Vancouver 38
2-4. I n t r a - P o r t Shipping Linkages i n Vancouver 1965 41
2- 5. Monthly Shipments of Grain from Vancouver and New
Westminster Semi-Public Terminal E l e v a t o r s 1963-67 46
. 2̂ -6. S e a s o n a l i t y of Grain Exports 47
3- 1. Estimate of Average Number of Days per Year spent
i n Port by D i f f e r e n t Types of Vessel 59
3-2. Percentage Cost Breakdown f o r a T y p i c a l Bulk C a r r i e r 63
3- 3. D a i l y Costs of Dry Cargo Ocean Going Vessels 65
4- 1. Changes i n the Average S i z e of Grain Ships Loading More Than 5,000 Tons 1964-68 78
4-2. Average S i z e of Vessels by Type of Cargo 78
4-3. S i z e D i s t r i b u t i o n of G r a i n Ships Studied 1964-68 79
4-4. Stowage Factors f o r D i f f e r e n t Types of Grain 99
4-5. S i z e D i s t r i b u t i o n of Grain Cargoes Studied 1964-68 100
4-6. Average S i z e of Grain Cargoes by Commodity Type 1964-68 .... 102
4-7. D i s t r i b u t i o n of Observed Loading Rates f o r A l l Grain Cargoes 1964-68 103
4-8. Average Loading Rates f o r A l l Grain Cargoes Studied
by Year 1964-68 106
4-9. Average Loading Rates by Commodity Type 1964-1968 107
4-10. D i s t r i b u t i o n of Observed Loading Times by Commodity Type 1964-65 109
4-11. D i s t r i b u t i o n of Observed Loading Times by Commodity Type 1965-66 110
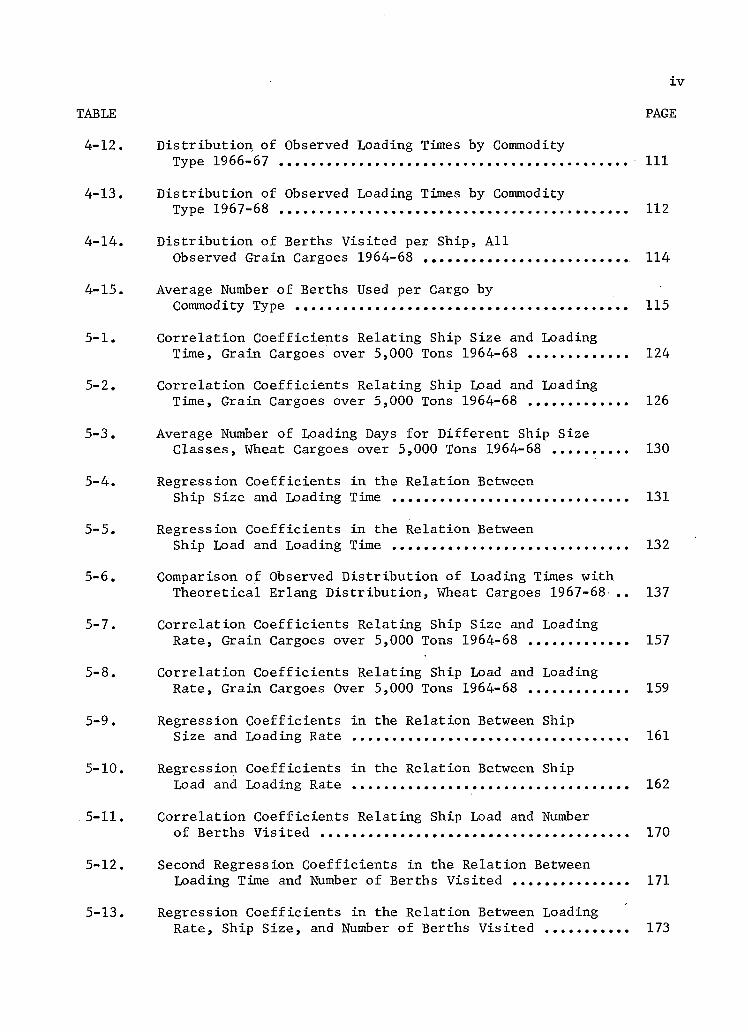
i v
TABLE PAGE
4-12. Di s t r i b u t i o n of Observed Loading Times by Commodity Type 1966-67 I l l
4-13. Distr i b u t i o n of Observed Loading Times by Commodity Type 1967-68 112
4-14. Di s t r i b u t i o n of Berths Vis i t e d per Ship, A l l Observed Grain Cargoes 1964-68 114
4- 15. Average Number of Berths Used per Cargo by Commodity Type 115
5- 1. Correlation Coefficients Relating Ship Size and Loading Time, Grain Cargoes over 5,000 Tons 1964-68 124
5-2. Correlation Coefficients Relating Ship Load and Loading Time, Grain Cargoes over 5,000 Tons 1964-68 126
5-3. Average Number of Loading Days for Different Ship Size Classes, Wheat Cargoes over 5,000 Tons 1964-68 130
5-4. Regression Coefficients i n the Relation Between Ship Size and Loading Time 131
5-5. Regression Coefficients i n the Relation Between Ship Load and Loading Time 132
5-6. Comparison of Observed D i s t r i b u t i o n of Loading Times with Theoretical Erlang D i s t r i b u t i o n , Wheat Cargoes 1967-68 .. 137
5-7. Correlation Coefficients Relating Ship Size and Loading Rate, Grain Cargoes over 5,000 Tons 1964-68 157
5-8. Correlation Coefficients Relating Ship Load and Loading Rate, Grain Cargoes Over 5,000 Tons 1964-68 159
5-9. Regression Coefficients i n the Relation Between Ship Size and Loading Rate 161
5-10. Regression Coefficients i n the Relation Between Ship Load and Loading Rate 162
5-11. Correlation Coefficients Relating Ship Load and Number of Berths V i s i t e d 170
5-12. Second Regression Coefficients i n the Relation Between Loading Time and Number of Berths V i s i t e d 171
5-13. Regression Coefficients in the Relation Between Loading Rate, Ship Size, and Number of Berths Vis i t e d 173
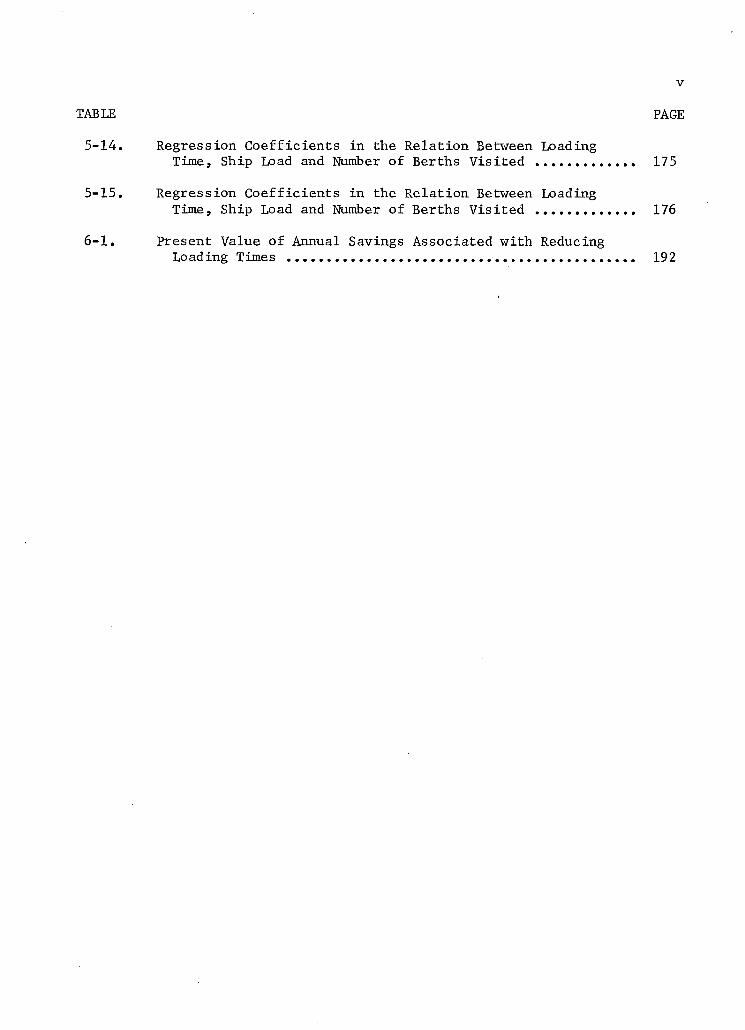
V
TABLE PAGE
5-14. Regression Coefficients in the Relation Between Loading Time, Ship Load and Number of Berths V i s i t e d 175
5- 15. Regression Coefficients in the Relation Between Loading Time, Ship Load and Number of Berths Visi t e d 176
6- 1. Present Value of Annual Savings Associated with Reducing Loading Times 192
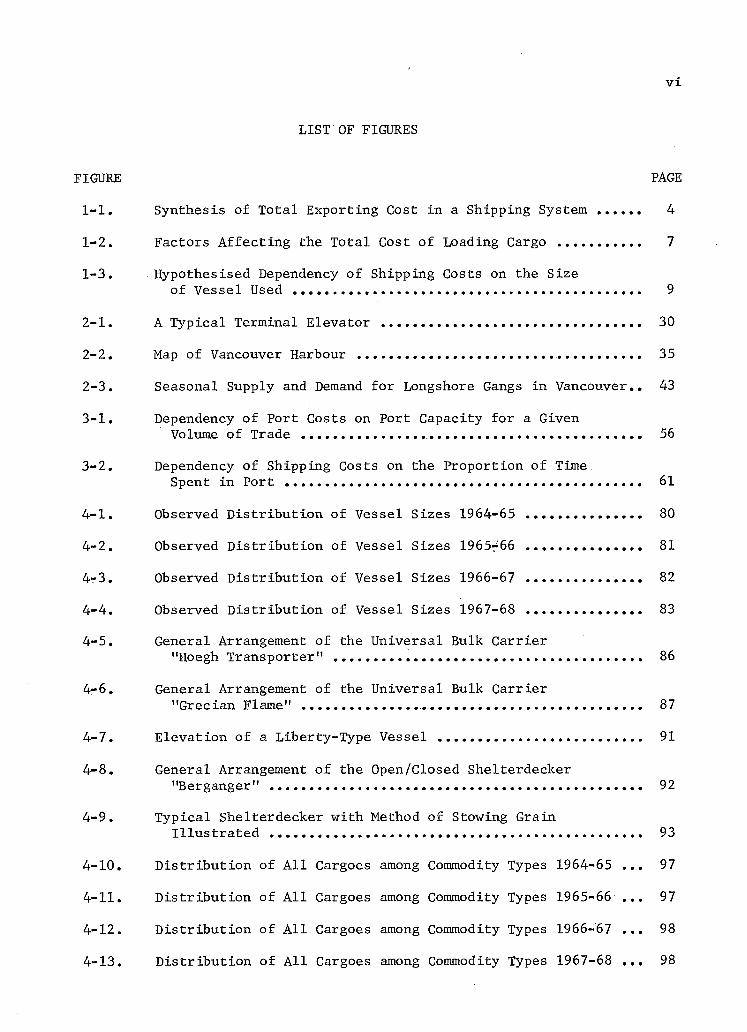
v i
LIST OF FIGURES
FIGURE PAGE
1-1. Synthesis of Total Exporting Cost i n a Shipping System 4
1-2. Factors Affecting the Total Cost of Loading Cargo 7
1- 3. Hypothesised Dependency of Shipping Costs on the Size
of Vessel Used 9
2- 1. A Typical Terminal Elevator 30
2-2. Map of Vancouver Harbour 35
2- 3. Seasonal Supply and Demand for Longshore Gangs i n Vancouver.. 43
3- 1. Dependency of Port Costs on Port Capacity for a Given Volume of Trade 56
3- 2. Dependency of Shipping Costs on the Proportion of Time Spent i n Port 61
4- 1. Observed D i s t r i b u t i o n of Vessel Sizes 1964-65 80
4-2. Observed D i s t r i b u t i o n of Vessel Sizes 1965--66 81
4r3. Observed D i s t r i b u t i o n of Vessel Sizes 1966-67 82
4-4. Observed Di s t r i b u t i o n of Vessel Sizes 1967-68 83 4-5. General Arrangement of the Universal Bulk Carrier
"Hoegh Transporter" 86 4-6. General Arrangement of the Universal Bulk Carrier
"Grecian Flame" 87
4-7. Elevation of a Liberty-Type Vessel 91
4-8. General Arrangement of the Open/Closed Shelterdecker "Berganger" 92
4-9. Typical Shelterdecker with Method of Stowing Grain I l l u s t r a t e d 93
4-10. D i s t r i b u t i o n of A l l Cargoes among Commodity Types 1964-65 ... 97
4-11. D i s t r i b u t i o n of A l l Cargoes among Commodity Types 1965-66 ... 97
4-12. D i s t r i b u t i o n of A l l Cargoes among Commodity Types 1966-67 ... 98
4-13. D i s t r i b u t i o n of A l l Cargoes among Commodity Types 1967-68 ... 98
v i i
FIGURE PAGE
4-14. D i s t r i b u t i o n of Loading Rates for A l l Cargoes 1964-65 104
4-15. D i s t r i b u t i o n of Loading Rates for a l l Cargoes 1965-66 •104
4-16. D i s t r i b u t i o n of Loading Rates for a l l Cargoes 1966/67 105
4- 17. D i s t r i b u t i o n of Loading Rates for a l l Cargoes 1967-68 105
5- 1. Comparison of Observed Distr i b u t i o n of Loading Times with Theoretical Erlang Distribution 138
5-2. Scatter Diagram of Ship Size and Observed Loading Rate, Wheat Cargoes 1964f65 141
5-3. Scatter Diagram of Ship Size and Observed Loading Rate, Wheat Cargoes 1965r66 142
5-4. Scatter Diagram of Ship Size and Observed Loading Rate, Wheat Cargoes 1966-67 143
5-5. Scatter Diagram of Ship Size and Observed Loading Rate, Wheat Cargoes 1967-68 144
5-6. Scatter Diagram of Ship Size and Observed Loading Rate, Mixed Cargoes 1964-65 145
5-7. Scatter Diagram of Ship Size and Observed Loading Rate, Mixed Cargoes 1965-66 146
5-8. Scatter Diagram of Ship Size and Observed Loading Rate, Mixed Cargoes 1966-67 147
5-9. Scatter Diagram of Ship Size and Observed Loading Rate, Mixed Cargoes 1967-68 148
5-10. Scatter Diagram of Ship Size and Observed Loading Rate, Barley Cargoes 1964-65 149
5-11. Scatter Diagram of Ship Size and Observed Loading Rate, Barley Cargoes 1965-66 150
5-12. Scatter Diagram of Ship Size and Observed Loading Rate, Barley Cargoes 1966-67 151
5-13. Scatter Diagram of Ship Size and Observed Loading Rate, Barley Cargoes 1967-68 152
5-14. Scatter Diagram of Ship Size and Observed Loading Rate, Seeds Cargoes 1964-65 153
5-15. Scatter Diagram of Ship Size and Observed Loading Rate, Seeds Cargoes 1965-66 154
v i i i
FIGURE PAGE
5-16. Scatter Diagram of Ship Size and Observed Loading Rate, Seeds Cargoes 1966-67 155
5-17. Scatter Diagram of Ship Size and Observed Loading Rate, Seeds Cargoes 1967-68 156
5-18. Scatter Diagram of Ship Size and Loading Rate for Grain Cargoes 1967-68, showing upper l i m i t of observations 165
5- 19. Hypothesised Dependency of Loading Rate on Ship Size 167
6- 1. Total Cost per Day i n Port as a Function of Ship Size 182
6-2. Total Loading Time Costs as a Function of Loading Rate for Different vessel Sizes 183
6-3. Time Cost of Loading a Ton of Cargo as a Function of Ship Size for Different Loading Rates 184
6-4. Loading Time Costs per Ton of Cargo as a Function of Ship Size 1964-65 186
6-5. Loading Time Costs per Ton of Cargo as a Function of Ship Size 1965/66 187
6-6. Loading Time Costs per Ton of Cargo as a Function of Ship Size 1966-67 188
6?7. Loading Time Costs per Ton of Cargo as a Function of Ship Size 1967-68 189
6-8. Average Costs of Moving Wheat, Canada to the United Kingdom 1933 to 1965 195
6-9. Comparative Component Items of Shipping Cost, 1965 196
CHAPTER I
INTRODUCTION
In a world where international trade plays an increasing part i n
the well being of the economy, and in a province which depends to a large
extent on the export of quantities of low value commodities, the economics
of the transport function are naturally of interest.
In the f i e l d of ocean shipping, considerable developments within
the industry have substantially altered the structure of costs of ocean
going vessels. Technological progress has empowered the construction of
ever larger, faster and more economical ships; changes in the pattern of
trade have made more specialised vessels a r e a l i t y ; changes in the whole
concept of cargo handling have speeded port operations; however, effective
u t i l i s a t i o n of the world f l e e t is s t i l l a problem.
It is estimated that cargo lin e r s spend almost 60 per cent of their
time in port and that even the free ranging tramp spends over 40 per cent
of i t s productive l i f e tied up at the quayside. This adds considerably
to the fixed cost of providing shipping service, since port time is not
only p r o f i t l e s s and unproductive (recognising that some time must be
spared for loading and discharging), but results i n great expense for the
ship owner. Wages s t i l l have to be paid and c a p i t a l charges continue to
require amortisation. These expenses are greater for the larger newer
ships than was the case with vessels in the past. This results in a
greater incentive to foreshorten the loading process, but this is not easy;
the turnaround time, of ships i n port i s a very i n t r i c a t e problem in
- 2 -
coordination and scheduling. In addition to the many variables which
intrude, a number of the inter-related base factors which determine port
time are outside the control of port authorities and shipowners. As a
re s u l t , any investigation which assists in c l a r i f y i n g the situation is
he l p f u l .
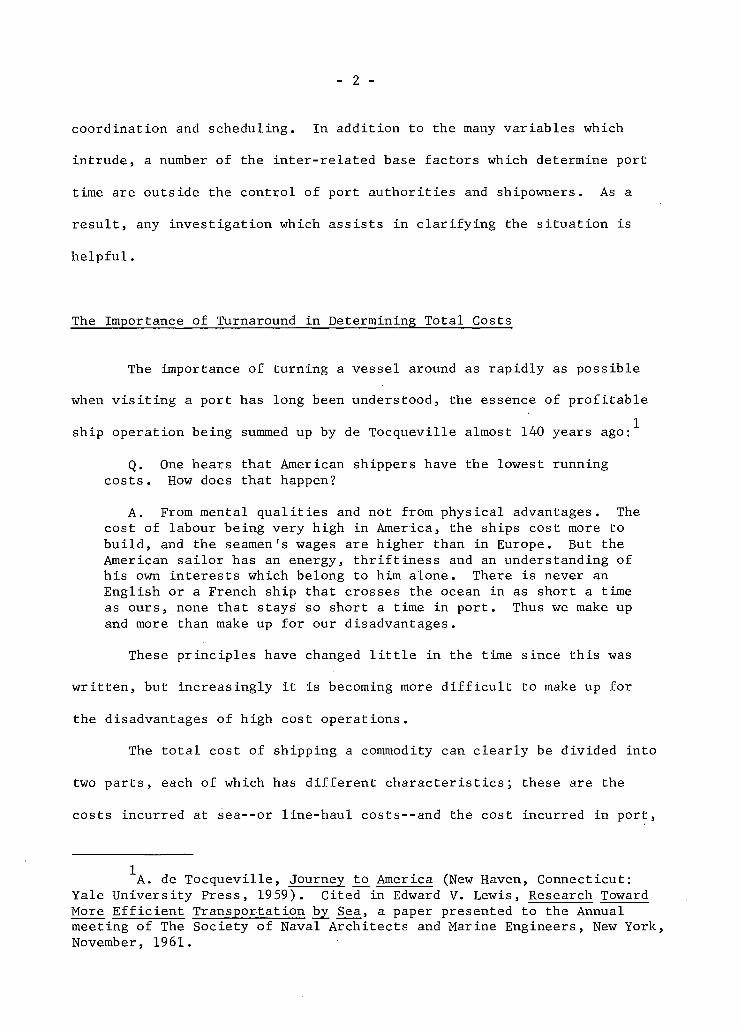
The Importance of Turnaround in Determining Total Costs
The importance of turning a vessel around as rapidly as possible
when v i s i t i n g a port has long been understood, the essence of profitable
ship operation being summed up by de Tocqueville almost 140 years ago:^
Q. One hears that American shippers have the lowest running costs. How does that happen?
A. From mental qu a l i t i e s and not from physical advantages. The cost of labour being very high in America, the ships cost more to bu i l d , and the seamen's wages are higher than in Europe. But the American s a i l o r has an energy, t h r i f t i n e s s and an understanding of his own interests which belong to him alone. There is never an English or a French ship that crosses the ocean in as short a time as ours, none that stays so short a time in port. Thus we make up and more than make up for our disadvantages.
These principles have changed l i t t l e in the time since this was
written, but increasingly i t is becoming more d i f f i c u l t to make up for
the disadvantages of high cost operations.
The t o t a l cost of shipping a commodity can clea r l y be divided into
two parts, each of which has different c h a r a c t e r i s t i c s ; these are the
costs incurred at sea--or line-haul costs--and the cost incurred in port,
A. de Tocqueville, Journey to America (New Haven, Connecticut: Yale University Press, 1959). Cited in Edward V. Lewis, Research Toward More E f f i c i e n t Transportation by Sea, a paper presented to the Annual meeting of The Society of Naval Architects and Marine Engineers, New York, November, 1961.
- 3 -
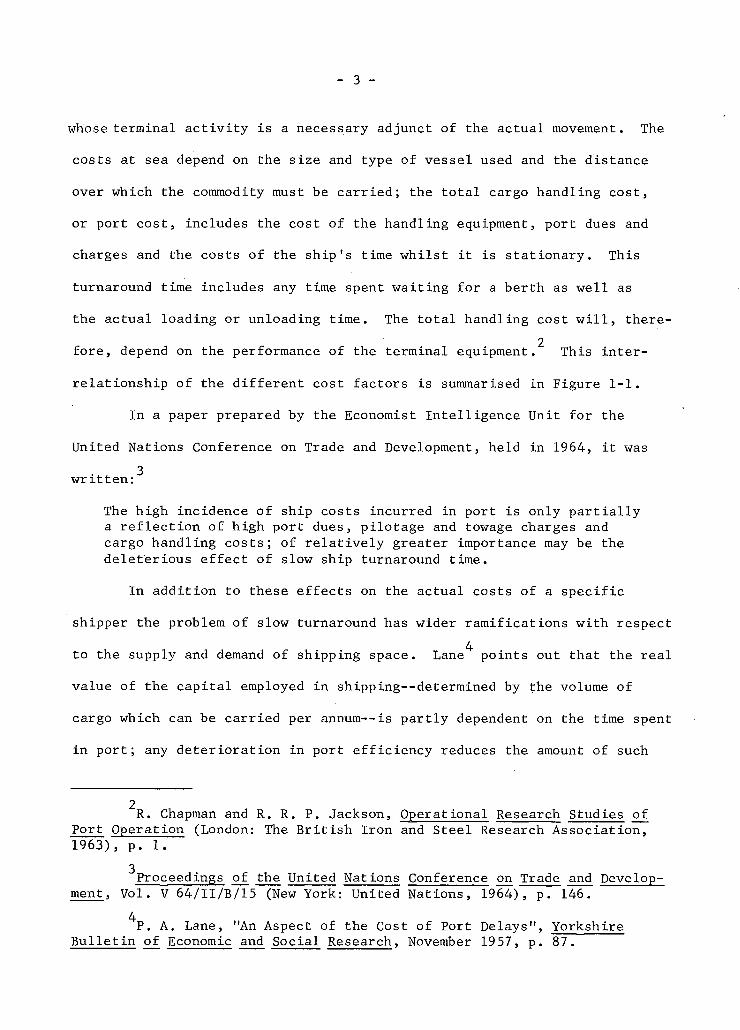
whose te r m i n a l a c t i v i t y i s a necessary adjunct of the a c t u a l movement. The
costs at sea depend on the s i z e and type of v e s s e l used and the distance
over which the commodity must be c a r r i e d ; the t o t a l cargo handling c o s t ,
or port c o s t , includes the cost of the handling equipment, port dues and
charges and the costs of the ship's time w h i l s t i t i s s t a t i o n a r y . This
turnaround time includes any time spent w a i t i n g f o r a berth as w e l l as
the a c t u a l loading or unloading time. The t o t a l handling cost w i l l , there-2
f o r e , depend on the performance of the t e r m i n a l equipment. This i n t e r
r e l a t i o n s h i p of the d i f f e r e n t cost f a c t o r s i s summarised i n Figure 1-1.
In a paper prepared by the Economist I n t e l l i g e n c e U n i t f o r the United Nations Conference on Trade and Development, held i n 1964, i t was
3 w r i t t e n :
The high incidence of ship costs incurred i n port i s only p a r t i a l l y a r e f l e c t i o n of high port dues, p i l o t a g e and towage charges and cargo handling c o s t s ; of r e l a t i v e l y greater importance may be the d e l e t e r i o u s e f f e c t of slow ship turnaround time.
In a d d i t i o n to these e f f e c t s on the a c t u a l costs of a s p e c i f i c
shipper the problem of slow turnaround has wider r a m i f i c a t i o n s w i t h respect 4
to the supply and demand of shipping space. Lane points out that the r e a l
value of the c a p i t a l employed i n s h i p p i n g — d e t e r m i n e d by the volume of
cargo which can be c a r r i e d per annum--is p a r t l y dependent on the time spent
i n p o r t ; any d e t e r i o r a t i o n i n port e f f i c i e n c y reduces the amount of such
R. Chapman and R. R. P. Jackson, Operational Research Studies of Port Operation (London: The B r i t i s h Iron and S t e e l Research A s s o c i a t i o n , 1963), p. 1.
3 Proceedings of the United Nat ions Conference on Trade and Develop
ment, V o l . V 64/II/B/15 (New York: United Nations, 1964), p. 146. 4 P. A. Lane, "An Aspect of the Cost of Port Delays", Y o r k s h i r e
B u l l e t i n of Economic and S o c i a l Research, November 1957, p. 87.

BASIC COST DATA
EFFECT OF PORT PERFORMANCE ON SHIPS TURNAROUND TIME
COST OF OPERATING SHIP AT SEA
COST OF OPERATING LOADING
EQUIPMENT IN. PORT
COST OF OPERATING SHIP IN PORT
•
-p-•
TOTAL LOADING COST
TOTAL EXPORTING COST
FIGURE 1-1
SYNTHESIS OF TOTAL EXPORTING COST IN A SHIPPING SYSTEM
Source: R. Chapman and R. R. P. Jackson, Operational Research Studies of Port Operation, (London: B r i t i s h Iron and Steel Research Association, 1963), p. 13.

- 5 -
c a p i t a l by reducing the number of voyages which can be completed in a
spe c i f i c time i n t e r v a l .
Since any vessel only earns freight when i t i s at sea, any time i n
port over and above the minimum required for loading or discharging repre
sents p r o f i t foregone as well as extra cost incurred; because ports are
such a v i t a l l i n k in the transportation chain, their e f f i c i e n c y i s of
c r i t i c a l importance in any effo r t to minimise the cost of transport. In
deed i t has been suggested that improvements in the ports w i l l be the most
l i k e l y single means of achieving any cost reductions in future maritime
transport."'
The crux of the turnaround si t u a t i o n i s that the economies realised
by employing a larger and faster ship may appear appreciable when only the
li n e haul part of the movement is considered. When the terminal expenses
are included, however, i t is possible--or indeed l i k e l y - - t h a t the increased
fixed charges incurred in port w i l l wipe out the anticipated saving. The
extent to which ship size determines port time is thus a measure of the
extent to which economies of scale can be implemented; i t , therefore,
becomes a v i t a l factor i n making correct investment decisions.
The Nature of the Problem
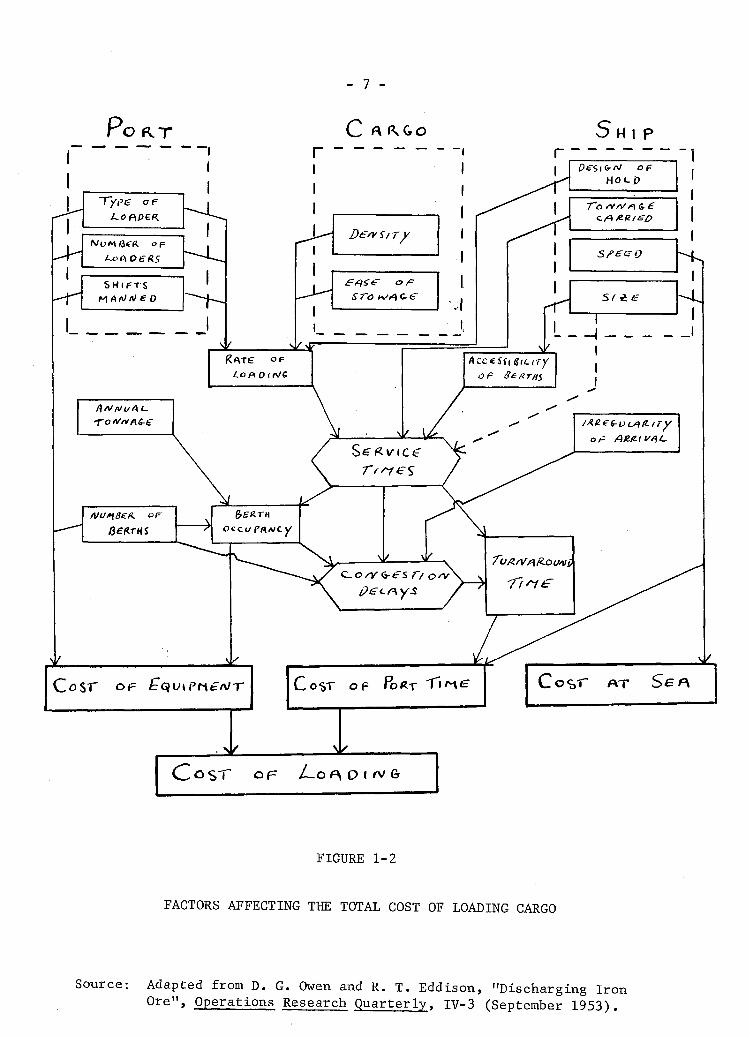
The simple synthesis of cost data shown in Figure 1-1 gives no
indication of the complex interrelationships which actually occur; a very
comprehensive model was b u i l t by Owen and Eddison, and a summary of their
The Development of Ports, a progress report by the Secretariat of the United Nations Conference on Trade and Development (New York: United Nations, 1967), p. 9.

- 6 -
work is the outline i n Figure 1-2.^
It is evident that the cost of operating port equipment on a
tonnage basis depends on the type of equipment and the extent to which
the berths are occupied. This i n turn is dependent on the number of
berths, the annual tonnage handled and the efficiency of the handling
operation, which shows up in the service time. Service time is affected
ultimately by the capacity of the equipment, but i n the short run is
altered by the characteristics of different cargoes and also by ship
des ign.
To the cost of port equipment must be added the cost of ship's
time whilst i n port; the daily cost obviously varies with the s i z e , type
and n a t i o n a l i t y of the vessel, and the t o t a l cost on the daily cost and
the length of time spent i n port. This l a t t e r variable i s affected by
the amount of congestion delay and by the service times. Although i t is
commonly held that these are influenced by the factors mentioned above,
namely cargo type, loading equipment, and hold design, i t i s also apparent
that the size of the vessel might have some e f f e c t .
There is some doubt i n the small amount of l i t e r a t u r e which exists
as to what, i f any, are the economies of scale present when larger ships
are i n port for the purpose of loading or discharging cargo. Of the quan
t i t a t i v e studies performed by p r a c t i t i o n e r s , only those r e l a t i n g to iron
D. G. Owen and R. T. Eddison, "Discharging Iron Ore", Operational Research Quarterly, Vol. 4 No. 3, September, 1953.
- 7 -
K T S H I p
-4-
Type a F
NuinQea, o p l~ot\0£r\S
S H I F T S
R(\T£ OF
niufi\ae&. OF
V
_2*1
Servicer
H o c p
7~o <vr/f\&£
Sf>£GQ
I 1 1
AccessasiLiTy
/ A R - € 6 - O L . * P - i T y
C o^T OF fofcT f i ^ C Cost" A T SeF\
d o S T O F Z _ o ^ D « r v G
FIGURE 1-2
FACTORS AFFECTING THE TOTAL COST OF LOADING CARGO
Source: Adapted from D. G. Owen and R. T. Eddison, "Discharging Iron Ore", Operations Research Quarterly, IV-3 (September 1953).
- 8 -
ore importation into Great B r i t a i n were accessible for this study; these
studies for the most part consist of applied queuing theory and simulation
models, and i t i s generally assumed that the capacity of the unloading
equipment w i l l be constantly maintained. This i s perhaps a r e a l i s t i c
assumption for a trade in which there i s considerable regularity of vessel
a r r i v a l , and when tonnage requirements can be estimated for some time into
the future; however, the studies have l i t t l e a p p l i c a b i l i t y for other trades,
apart from delineating the general principles to be considered in a port
study. g
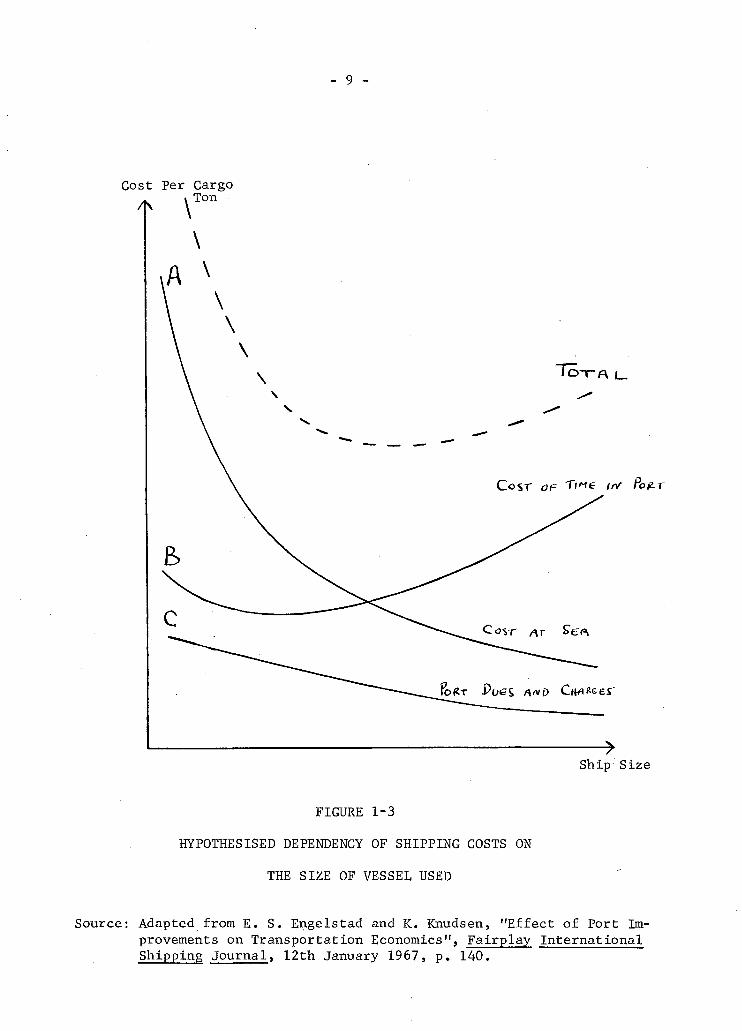
Among the theoreticians, Engelstad and Knudsen have proposed a
dependency of costs on ship size which is shown in Figure 1-3. The costs
of the ship at sea are represented by curve A; both running expenses and
c a p i t a l costs r i s e far less proportionately than the size of the vessel for
a given journey, and this leads to a curve with the same shape as the empiri-9
c a l l y observed time charter rates per ton. The cost of the ship's time
while in port is shown by curve B, which is made up of three constituent
See for example Chapman and Jackson, Op. C i t . ; Owen and Eddison, Op. C i t . ; D. F. D. Pope and D. A. Rigby, A Method for Estimating Future U.K. Ore Shipping Costs, a r e s t r i c t e d report of the B r i t i s h Iron and Steel Research Association, London; H.G. Jones, "A Shipping Problem", Operational Research Quarterly, Vol. 8 No. 3, 1957; D. T. Steer and A. C. C. Page, " F e a s i b i l i t y and Financial Studies of a Port I n s t a l l a t i o n " , Operational Research Quarterly, Vol. 12 No. 3, 1961; D. G. Nijman, "Optimum Size of Ore Ca r r i e r s " , W. G. Meredith and C. Wordsworth, "Size or Ore Carriers for the New Port Talbot Harbour", D. H. Kelley, P. J . Shipp and D. A. Rigby "Calculating the Optimum Size or Iron Ore Carriers", a l l in the Journal of the Iron and Steel I n s t i t u t e , Vol. 204, November, 1966.
8 E. S. Engelstad and K. Knudsen, "Effect of Port Improvements on
Transportation Economics", Fairplay International Shipping Journal, 12th January 1967, p. 140.
See Arnljot Stromme Svendsen, Sea Transport and Shipping Economics (Bremen: Weltschiffahrtsarchiv, 1958).
- 9 -
Cost Per Cargo /N \ T ° n
Ship :Size
FIGURE 1-3
HYPOTHESISED DEPENDENCY OF SHIPPING COSTS ON
THE SIZE OF VESSEL USED
Source: Adapted from E. S.,Engelstad and K. Knudsen, "Effect of Port Improvements on Transportation Economics", Fairplay International Shipping Journal, 12th January 1967, p. 140.

- 10 -
parts. F i r s t l y , the time required to enter harbour and secure at the
berth; this i s l i k e l y to be independent of ship size for a l l but the
largest vessels, and the cost per cargo ton is thus f a l l i n g . Secondly,
there i s the time lost due to administration and congestion i . e . waiting
for a berth. Since ships are assigned a berth i n general on a first-come-
firs t - s e r v e d basis, i t i s not f e l t that this waiting time w i l l be size
dependent; the cost per cargo ton is thus f a l l i n g . Thirdly, and usually
the dominant component, i s the time required for loading and/or unloading
cargo; Engelstad and Knudsen suggest that for a given i n s t a l l a t i o n with
given labour supply and work rules, the number of tons moved w i l l be
independent of ship s i z e . This causes costs to r i s e f a i r l y rapidly as
ships get larger.
In addition to the costs which are e x p l i c i t l y concerned with the
operation of the vessel, there are a number of dues, rates and fees which
are levied against i t when a port i s entered. These are represented i n
curve C and they normally increase less than proportionately with the
size of the vessel.
Evidently, the choice of an optimum vessel size for a particular
trade is strongly dependent on the precise shape of the U-shaped t o t a l
cost curve in the Figure, which is obtained by summing the three individual
curves described. This i n turn i s dependent on the assumptions made with
regard to the loading characteristics of larger ships.
Despite the assumptions made by Engelstad and Knudsen, Sturmey has 10
pointed out that:
S. G. Sturmey, Letter to the Editor, Fairplay International Shipping Journal, 26th January 1967, p. 9.
- 11 -
The argument that port time must r i s e as ships get larger i s an old and respectable one. I have never seen i t subjected to rigorous empirical v a l i d a t i o n .
In view of the importance of this size dependency and of the lack of any
quantitative evidence of i t s e f f e c t s , the purpose of this study i s to
investigate i t for the very limited case of a selection of ships which
have v i s i t e d the port of Vancouver.
The Scope and Extent of the Study
One of the d i f f i c u l t i e s involved i n researching turnaround time,
which has been echoed by at least two investigators,''"''" i s the lack of
access to relevant empirical data: although i t is not always clear whether
the problem is one of access or a v a i l a b i l i t y . Because of the competitive
pressures within the shipping industry, companies are reluctant to divulge
any operational information, and port authorities cannot be expected to
part with evidence whose main purpose is to highlight their inadequacies
and shortcomings.
Notwithstanding these d i f f i c u l t i e s , i t was found possible to obtain
d e t a i l s - - a l b e i t crude ones--of the loading times of 1,305 grain ships in 12
Vancouver; this sample constitutes the entire population of grain ships
which loaded more than 5,000 tons in the crop years from 1964/65 to 1967/68;
R. 0. Goss, "The Turnaround of Cargo Liners and Its Effect on Sea Transport Costs", Journal of Transport Economics and Po1 ic y , Vol. 1 No. 1, January, 1967, p.f^3; United Nations Department of Economics and Social A f f a i r s , The Turnaround Time of Ships in Port, (New York: United Nations, 1967), p. 5.
12 The Unpublished records of the B r i t i s h Columbia Grain Shippers'
Clearance Association.
- 12 -
of these observations more than one may refer to a given vessel, and some
vessels called a number of times during the period. The r e s t r i c t i o n s of
loadings to those over 5,000 tons serves to ensure that the vessels, for
the most part, are devoted en t i r e l y to grain, and general cargo l i n e r s
loading only small parcels are excluded. Most of the vessels in question
loaded wheat, but there i s a substantial number which took on l i g h t grains
such as barley and various seeds. These cargo types w i l l have to be
accounted for separately i n the analysis because of the different proper
t i e s and loading c h a r a c t e r i s t i c s .
The information recorded in the primary data consisted of the vessel
name, the month of a r r i v a l , the length of time spent loading, the number
of berths v i s i t e d , the t o t a l quantity and type of grain loaded, and the
country of destination.
The types of vessel included in the sample range from small general
purpose tramp ships to the largest bulk carriers designed especially for
the handling of considerable quantities of homogeneous material; also,
there i s a proportion of tankers which had been diverted into the grain
trade. Not quite a l l the vessels which appeared in the records were used
in the study; for some, the information given was incomplete, and others
proved d i f f i c u l t to identify so that their size might be determined. The
l a t t e r d i f f i c u l t y appeared more in the last crop year studied since new
launchings and changes of name and ownership were not yet assimilated into
the latest available edition of Lloyd's Register of Shipping.
Using this available information, the purposes of this study are
fourfold. F i r s t l y , the objective is to provide Sturmey's "old and respec
table" argument that, larger vessels spend more time loading, with a quan
t i t a t i v e t r i a l ; the f i r s t hypothesis can thus be stated:
- 13 -
.The t o t a l time spent loading a vessel with a given cargo w i l l increase as the size of the ship increases.
Secondly, the objective is to test the v a l i d i t y of Engelstad and Knudsen's
assumption of constant loading rates for a l l sizes of vessels. The second
hypothesis, therefore, takes the form:
The time spent loading each ton of a given cargo decreases as the size of the ship increases; this i s equivalent to stating that the loading rate i n tons per day increases as the size of the ship increases.
Naturally, these hypotheses are dependent on various conditions and
assumptions which w i l l be made clear in ensuing chapters.
Since i t i s not expected that ship size alone w i l l explain the
variations i n the observed loading rates and loading times, the th i r d
objective, not amenable to statement in one hypothesis, i s to obtain the
highest l e v e l of explanation possible by combining in a multiple linear
regression model ship s i z e , amount and type of cargo, and the number of
berths v i s i t e d . Because of the many and complex factors which can delay
ship loading, i t i s not anticipated that the results w i l l be p a r t i c u l a r l y
good when dealing with a l l the observations made; loading can be delayed
for reasons of grain shortage, labour disputes, mechanical trouble, poor
weather, forced berth changes, box car shortages, trimming problems,
inspection delays, and p l a i n incompetence, so assuming for the moment that
hypothesis number two is correct, i t may be surmised that although small
ships may never be observed to load rapidly, larger ships may occasionally
be observed to load slowly for any or a l l of the reasons mentioned above.
The quantity of prime interest then becomes the maximum loading rate which
is achieved by a certain size class of vessels; perhaps i t is this quantity
which represents loading under ceteris paribus conditions; this w i l l be
- 14 -
correlated with vessel size also in addition to the average performance.
The fourth objective of the study i s to explore the implications of
the results for the costs of loading vessels, and to determine in a general
way the benefits to be obtained by changes in the system of loading vessels
as i t is currently practised.
It should be stressed that this i s not intended to be a study of
the technological complexities of ship loading, neither i s i t aimed at
investigating the d i f f i c u l t i e s of transporting grain in Western Canada,
although some of the factors involved are inextricably interwoven with the
l a t t e r problem. The underlying interest i s one in the port economics of
bulk c a r r i e r s , and grain ships were chosen for certain s p e c i f i c reasons:
1. Compared, say, to general cargo, grain presents a r e l a t i v e l y uncomplicated loading process, i f that can be believed.
2. The movement of grain i s one in which a f a i r l y large range of ship sizes is evident.
3. Most grain ships f i l l themselves to their deadweight capacity, and although there are a considerable number of p a r t i a l cargoes, this i s less of a problem than with ships in the l i n e r trade.
4. The grain transportation system, of which ship loading i s only a small part, is of considerable consequence to the port of Vancouver, and i s also of some top i c a l interest i n view of the increasing severity of port t i e ups.
5. Because of the large grain shipments emanating from Vancouver, the necessary information proved to be available in the c i t y .
There are b a s i c a l l y two reasons why the observed loading rate of
larger ships may d i f f e r from that observed on smaller vessels:
1. Technological Reasons.
2. Economic Reasons.
Larger vessels may j u s t i f y investment i n more sophisticated handling
equipment, and increased space in the larger holds make for easier and more
- 15 -
convenient stowage. In addition, i t is possible although not essential,
that a larger ship is also a newer ship and as such i t may incorporate
certain small design points which greatly assist the loading and trimming
of grain.
As ships get larger, the standing charges associated with them
increase considerably. There i s , therefore, great incentive for the ship
owners to trade off these costs, which the ship incurs even when idle,
against higher loading costs; i.e. using overtime and extra longshore gangs.
Both these methods would show in the records as a higher loading rate. In
effect, of course, in this situation the size of a vessel is being used as
a proxy variable for the costs of ships idle time. A direct confirmation
of the cost - port time relationship would be most valuable, but the com
petitive secrecy of the shipping industry and the widespread ownership of
vessels calling in Vancouver proved insurmountable obstacles when attemp
ting to gather precise cost data for each ship.
In this regard i t is necessary to recognise some of the grave
weaknesses inherent in the primary data. F i r s t l y , there is no considera
tion of the time spent waiting by a vessel, so i t is not possible to inves
tigate the hypothesis that congestion delays are size-dependent. Secondly,
the time spent loading is registered only in days, and this greatly reduces
the sensitivity of the analysis; of course, the benefit of a loading advan
tage of only a few hours can be questioned for large vessels, especially
since there are sound social and personnel reasons for extending the port
stay. Thirdly, there is no record of the specific elevator at which the
vessel loaded; since physical installations vary somewhat among them, this
can be an important factor. Fourthly, there is no record of either the
- 16 -
number of s h i f t s or the number of loading belts used at a particular berth;
t h i s implies that i f a very high loading rate i s observed there i s no way
of t e l l i n g whether the cost of achieving i t was disproportionately high.
This i s probably the most important weakness.
It must be recognised that i n a problem of this nature i t i s not
usually possible to produce any simple, clear-cut s o l u t i o n — i f indeed there
i s such a solution. The nature of the process i s such that any study which
looks at the broad outline i s l i k e l y to be indeterminate in i t s conclusions,
while any study which incorporates a l l the variables is l i k e l y to be too
complex to handle. In the f i e l d of ocean shipping i t i s the exception which
often provides the only r u l e , and this i s only the unsophisticated f i r s t
look at an important and complex transportation l i n k .
The D e f i n i t i o n of Ship Size
Ship sizes are often quoted in several different ways, and these
can be confusing unless they are c l a r i f i e d . The system of measuring the
size of vessels is due to Moorsom who, i n 1854, enunciated the p r i n c i p l e
that the earning capacity of a vessel i s mainly governed by the cubic 13
capacity under the deck and on deck. The volume of a l l enclosed spaces
is measured and a tonnage assigned on the basis of one ton for each 100 cubic
feet of enclosed volume. This, the gross register tonnage, is thus not a
measure of weight but of space.
George J. Bonwick and E. C. Steer, Ship's Business ( f i f t h e d i t i o n ; London: The Maritime Press, 1963), p. 15.

- 17 -
Certain portions of the ship, such as the wheelhouse, galley,
b a l l a s t space, hatchways, and open shelterdeck are exempted from i n c l u
sion i n the gross register tonnage. If certain further deductions are made,
the net register tonnage i s obtained. These deductions are certain non
productive parts of the ship which nevertheless have to be added into the
gross figure. Encompassed in the deductions are crew accommodation,
navigation area, store rooms, donkey engine and bo i l e r spaces, pump rooms 14
and propelling spaces. Net register tonnage i s the usual measure on
which dues and taxes are levied.
Ship capacity i s also sometimes quoted in deadweight tons — this
being the t o t a l weight of cargo, bunkers, provisions, water and stores
which a vessel can l i f t when loaded to her maximum permissable draught
There i s no necessary relationship between the register and deadweight
tonnages for vessels i n general since this is dependent upon the l i n e s ,
lay-out and u t i l i s a t i o n of the h u l l ; however, some rules of thumb which
have been found to approximate many vessels are that the gross register
tonnage i s two thirds of the deadweight tonnage and the net register ton-16
nage i s about two f i f t h s of the deadweight.
Organisation of the Thesis
Having outlined the basis of the problem i n this introduction,
14 J. Bes, Chartering and Shipping Terms, (fourth e d i t i o n ; London:
Barker and Howard, 1956), p. 192. ^ I b i d ., p. 156. 16 C. F. H. Cufley, Ocean Freights and Chartering, (London: Staples
Press, 1962), p. 276.
- 18 -
Chapter I I i s concerned with describing port operations as they impinge
upon the vessel and o u t l i n i n g the many contributing factors to turn
around time. The method of loading a vessel i s described and the physical
f a c i l i t i e s for grain loading i n the port are l i s t e d .
In Chapter I I I the costs associated with the i d l e time of vessels
of different sizes are assembled, and i t is shown that speed of turnaround
has a marked bearing on the necessary freight rate. It i s also noted that
developments within the shipping industry are placing increased emphasis
on e f f i c i e n t port operation, but that c o n f l i c t i n g interests within the
port frequently i n h i b i t improvement.
Chapter IV contains an account of the study of ship size and loading
performance and presents the s t a t i s t i c a l evidence accumulated; in Chapter V
these findings are analysed and the hypotheses tested. Chapter VI points
up some of the implications of the study for lowering the export cost of
grain.
CHAPTER I I
A DESCRIPTION OF PORT OPERATIONS
The Constituent Factors of Turnaround Time
From the moment that a ship approaches a port of c a l l to the time
that i t s a i l s again with loading and discharging complete, there are many
tasks to be accomplished, and any one of them can cause the vessel to be
delayed to a greater or lesser extent. The time required for the turnaround
of a ship f a l l s conveniently into three stages. F i r s t , the a r r i v a l at and
departure of the vessel from within the confines of the port; secondly,
the time required to service the vessel for future voyages and to make
i t ready to take on cargo; t h i r d l y , the period spent actually taking on
cargo.
Delays can occur during each of these stages and can be caused by
a great many factors, not a l l of which are within the control of either
the shipowner or the port authorities. The situation in Vancouver is very
much as Bown has described the workings of ports everywhere:''"
Instances of remarkably good turnaround occur, as well as others that are not so good and some that are frankly bad. Thousands of people and dozens of organisations are concerned ... some overseas. There is no universal s p e c i f i c for good despatch and no outstanding single reason for poor performance.
When an incoming vessel approaches the harbour, i t is customary
A. H. J. Bown, Port Economics (second e d i t i o n , revised by W. A. Flere; London: Foxlow Publications, 1967), p. 136.
- 20 -
for a p i l o t to be taken on board. There is no obligation in Canadian
waters to accept the services of a p i l o t , but in the B r i t i s h Columbia
d i s t r i c t — w h e r e the Minister of Transport is the Pilotage authority--
payment of dues is compulsory whether or not the services have actually 2
been used. This procedure is not one which customarily causes any delay,
unless the state of the tide has to change before the vessel is permitted
to enter; this l a t t e r s i t u a t i o n can occur i f the approach channels are of
i n s u f f i c i e n t depth or width to permit unrestricted movement, as has been
the case with F i r s t Narrows for certain vessels. Clearly, wherever possible,
ships should be able to berth at any time of the day or night to avoid any
deferral of port work.
The second category of constituent a c t i v i t i e s of turnaround time
includes various basic l o g i s t i c items i n addition to f i t t i n g s and inspec
tions required for grain ships by the regulatory authorities. It is usually
necessary to take on fuel and v i c t u a l s for the crew, as well as ship's 3
stores such as paint, rope and maintenance items. In many cases, some of
this provisioning can be organised concurrently with cargo handling to
avoid excessive protraction of the port stay.
Before a vessel may be loaded with grain, i t i s necessary for the
holds to be cleaned and l i n e d ; the cleaning may simply be a matter of
sweeping out the hold, or, in the case of a tanker, steam cleaning and 2 F. S. Campbell (ed.), Ports: Dues, Charges and Accommodation
Throughout the World (London: George P h i l i p and Son, 1964), p. 570. 3 United Nations Department of Economic and Social A f f a i r s , The
Turnaround Time of Ships in Port, ST/ECA/97 (New York: United Nations, 1967), p. 13.
- 21 -
scrubbing to eliminate a l l traces of o i l . Lining of the holds with sacking
helps to prevent s h i f t i n g of the cargo, and the packing of burlap along
the tanktops prevents the penetration of grain into the b i l g e s . When
these precautions are complete, the ship must be inspected by the Port
Warden so that a "Grain Cargo C e r t i f i c a t e " may be obtained. It is common
practice in grain charterparties to stipulate that notice of readiness to
load can only be presented by the Master i f a c e r t i f i c a t e from a competent
surveyor is presented at the same time, to show that the ship is in a f i t
state to carry gram.
The cleaning and l i n i n g are generally carried out at any unoccupied
berth in the harbour, but since grain berths alongside elevators are
usually in demand, i t i s necessary to accomplish the task elsewhere and
change berths when readiness for loading is attained.
The t h i r d and f i n a l group of a c t i v i t i e s to be completed pertain to
the actual loading of the ship. This i s the most complex part of the port
stay and the interrelationships between the many cont r o l l i n g factors greatly
i n h i b i t effective investigation and improvement; small consolation is d e r i
ved from the fact that the loading of grain cargoes is not nearly as
complex an operation as the loading of general cargo. The bulk cargo is
r e a l l y the ultimate unit load;"* a complete shipload covered by one B i l l
of Lading with none of the work involved in t a l l y i n g , sorting to marks,
delivering to separate receivers and preparing claims for goods short
J. Bes, Chartering and Shipping Terms, (sixth e d i t i o n ; London: Barker and Howard, 1966), p. 53.
^R. B. Oram, Cargo Hand1ing and the Modern Port, (Oxford: Pergamon Press, 1965), p. 118.
- 22 -
landed.
The lack of available space at a grain berth is one of the prime
causes of delay once the ship i s ready to load; in such an event, the ship
must l i e in the anchorages u n t i l a suitable berth becomes available. A
d i s t i n c t i o n has occasionally been drawn i n the l i t e r a t u r e between an
"apparent" and an "actual" shortage of berths. The former can arise in
circumstances where the normal capacity of.a berth for handling grain
cannot be achieved because of congestion in the elevator or somewhere in
the grain transportation system ashore; the l a t t e r arises when the number
of ships and the volume of cargo is such that even at peak ef f i c i e n c y the
t r a f f i c i s too great tp be handled. This situation can arise at peak
periods in ports with a c y c l i c a l pattern of trade,.and has been observed
in Vancouver during the closing stages of the various " t i e ups" which have
taken place.
The problem of e f f e c t i v e berth a l l o c a t i o n i s complicated by the
necessity for many ships to load at more than one elevator. This can be
caused by the size of the cargo or by i t s type, and frequently both are
instrumental; larger vessels soon exhaust the supply of a particular grade
at a particular elevator and have to top off elsewhere, or indeed certain
grains are only available in a few locations and require a special journey
to pick them. up. Flax at the Columbia Elevator is an example of t h i s , and
oilseed cargoes are often loaded in small consignments around the harbour.
An apparent berth shortage can also be caused by vessels f i t t i n g themselves
out for the carriage of grain while l i e i n g at a grain berth; although this
See for example The Turnaround Time of Ships in Port, Op. C i t . , p. 14.
- 23 -
is not desirable, i t sometimes occurs when on commencement of the opera
tion no ready ships are available. I f one subsequently appears i t w i l l
have to wait both for f i t t i n g out and loading to be completed; in most
instances vessels f i t out elsewhere.
The speed of loading i t s e l f is determined in the l i m i t by the rated
capacity of the loading equipment in the elevators, but this is seldom
achieved. A restraining influence here is the necessity to abide by the
regulations which govern the carriage of grain by sea; these were drawn
up in their most recent version in 1960, by the International Convention
for the Safety of L i f e at Sea to give protection against the free flowing
nature of grain which renders i t l i a b l e to s h i f t i n g and so to upsetting
the trim and s t a b i l i t y of the carrying vessel.^ Any vessel whose net
register tonnage is more than one t h i r d f u l l of grain i s subject to them;
holds must be f u l l or else topped off with a specified number of layers of
bags; s h i f t i n g boards must also be placed in the grain along the centre l i n e
of the hold to a depth of about eight feet, to prevent l a t e r a l movement;
bulk grain cannot be stowed loose in the 'tweendecks of a vessel, but must
be contained in bins made of stout timber, whose individual capacity and
aggregate contents must riot exceed stipulated l i m i t s ; because grain in
bulk may s e t t l e up to 5 per cent during the course of a voyage, feeders
are compulsory so that the cargo space is f i l l e d automatically. These
feeders are box-like structures, open at the bottom, which are b u i l t into g
each hatchway and f i l l e d with grain; i n a modern bulk c a r r i e r , the hatchway
See for example Bes, Op. C i t . , pp. 176-183. g C. F. H. Cufley, Ocean Freights and Chartering, (London: Staples
Press, 1962), p. 355.
- 24 -
i t s e l f acts as the feeder and permanent bulkheads often do away with the
need for s h i f t i n g boards. These requirements are obviously time consuming
to f u l f i l l on a conventional tramp, and consideration of them w i l l be taken
up l a t e r in the analysis of observed loading times.
When grain enters the hold from the elevator spout, i t is not pos
s i b l e to f i l l out a l l the corners and crevices merely by directing the
flow; grain trimming machines are rigged below the spout and these scatter
grain around as i t enters. These machines accomplish the task i n a shorter
time than the shovelling by hand which used to take place; the grain i s
also more t i g h t l y packed and hence less l i a b l e to s h i f t i n g and s e t t l i n g .
When loading is complete and the vessel i s ready to s a i l , a f i n a l
inspection must be made by the Port Warden; he w i l l ensure that the grain
Regulations are being observed and that the vessel is not overloaded. The
completion of this inspection i s not often time consuming since the Warden
can be given adequate notice and can usually be present when required.
This sequence of operations adumbrated above is the one which must
be completed before a laden grain ship can leave the port. Since loading
is s t i l l an outdoor occupation, the weather can force delays; the damage
done to the cargo by r a i n or snow may well be greater than the cost of 9
closing down the ship.
In addition to these natural causes, congestion, i n e f f i c i e n t schedu
l i n g or f a i l u r e in other parts of the grain transportation system can
generate considerable delay; these w i l l be studied in an ensuing section,
when they w i l l be better understood after a review of the handling
Oram, 0p_. Cit., p. 36.
- 25 -
f a c i l i t i e s i n Vancouver.
Other Studies of Grain Loading
Although selected stages of the grain transportation system have
been subjected to scrutiny i n various studies, the problem of loading grain
into ships has received l i t t l e consideration other than a quali t a t i v e d i s
cussion of the many delaying factors.
The early study by C. D. Howe^ concentrates on surveying the
physical features of the Lower Mainland, and the later a r t i c l e by Stevens
i s merely a review of the grain trade from the geographical point of view.^
Fair's monograph on the transport of Canadian wheat to the sea covers only 12
the generalities of the system and in any event is rather out of date. The two works by MacGibbon are also s t r i c t l y of a descriptive nature and
13 cover a far wider f i e l d than merely transportation.
14 Although Case's work provides a good survey of current elevator
f a c i l i t i e s , with some estimates of future c a p a b i l i t y , the f i r s t i n v e s t i
gation to look into the quantitative specifics of ship loading i n Vancouver,
^C. D. Howe, Report on F a c i l i t i e s for Grain Shipments and Elevator Sites on the Fraser River and Burrard I n l e t , (Port Arthur: mimeographed, 1923).
11 Leah Stevens, "The Grain Trade of the Port of Vancouver B.C.",
Economic Geography, Vol. XII No. 2, (Ap r i l 1936), pp. 185-196. 12
L. M. Fa i r , The Transportation of Canadian Wheat to the Sea, McGill University Economic Studies No. 1, 1925.
13 D. A. MacGibbon, The Canadian Grain Trade, (Toronto: The MacMillan
Company, 1932) and The Canadian Grain Trade 1931-1951, (Toronto: University of Toronto Press, 1952).
14 A. H. Case, Future Requirements for the Hand1ing of Grain Through
P a c i f i c Coast Ports (unpublished Master's thesis, University of B r i t i s h Columbia, 1967).

- 26 -
which i s generally available, seems to be the B r i t i s h Columbia Research
Council Report of A p r i l 1967.''""' This treats the capability of the port
to handle a l l types of cargo which currently move through, and looked into
the loading rates for grain as well as for other commodities. However, no
attempt was made to look at loading times or indeed to explain the observed
v a r i a b i l i t y of loading rates. The essentials of this report as may pertain
only to grain were presented in a paper to the Grain Transportation Work
shop in September of 1967.^
A more detailed study of a l l the aspects of grain transportation
was contained in the report by Kates, Peat, Marwick and Company, which i s
not generally available but was presented to the Federal Government in
May 1967.''"̂ This was performed to develop short range recommendations to
increase quickly the capacity for exports, decrease delays and congestion,
and reduce, or at least hold transportation costs. I t is a very clear
exposition of the d i f f i c u l t i e s involved i n moving grain and deals with
ship loading at reasonable length. Having divided ships by size into three
categories, a s l i g h t difference i n average loading rate among the categories
was noted; ships above 20,000 dwt having a load rate some 5,000 bushels per
hour greater than vessels under 5,000 dwt.
B r i t i s h Columbia Research Council, Vancouver Harbour: T r a f f i c Trends and F a c i l i t y Analysis, (Vancouver: B.C. Research Council, 1967).
16 J . C. R. Clapham, G. S. Crawford and W. J . Sheriff, Grain Through
the Port of Vancouver, A paper presented to the Grain Transportation Workshop, Minaki, Ontario, September 1967.
17 Kates, Peat, Marwick and Company, West Coast Commodity Transporta
t i o n Study Part I, A report prepared for the Government of Canada, Department of Transport, May, 1967.
/
\
- 27 -
The Operation of a Terminal Elevator
In view of the dependence of ship loading time on the e f f i c i e n t
operation of the elevator equipment, an understanding of the loading
procedure is important.
Physically, the design of the basic plant has changed l i t t l e over 18
the years, and consisting as i t does primarily of concrete s i l o s or
bins, i t i s by nature long l a s t i n g . Many people interviewed by Case f e l t
that the o r i g i n a l concept of the terminal elevator had been so well develo-19
ped that there was l i t t l e room for improvement; the basic design of the
new Saskatchewan Wheat Pool elevator, recently brought into operation,
would seem to confirm this since i t follows the same design as terminals
b u i l t more than f i f t y years ago. This i s not to say that there is no
disagreement with the t r a d i t i o n a l methods; an alternative proposal developed
by a Vancouver firm w i l l be presented in a lat e r chapter.
B a s i c a l l y , the elevator lay out can be separated into two parts,
the workhouse and the storage area. The workhouse contains a l l the machi
nery for unloading, weighing and moving the grain around as well as machi
nery for cleaning and drying i t . The bins in the storage area are upright
concrete cylinders over and under which are belts connected with the work-20
house along which grain is put into and taken out of store. 18
See for example Milo S. Ketchum, The Design of Walls, Bins and Grain Elevators, (New York: McGraw H i l l , 1913) .
19 A. H. Case, 0p_. C i t . , p. 18.
20 The main features of elevator operation were established in a
personal interview with elevator s t a f f .
- 28 -
A l l grain i n Vancouver is brought to the elevator by r a i l , and
after having been checked as to grade, the car is unloaded. This is
accomplished either by a manually operated power shovel followed by
sweeping (in most of the elevators) or by a car dump which t i l t s the
whole car over and allows the grain to run out.
From the unloading p i t the grain i s carried to an elevator "leg",
which i s an endless belt with buckets attached; this l i f t s the grain to
the top of the elevator where i t f a l l s into a garner, which i s the recei
ving bin above the hopper on the scale. After being weighed, the grain
i s either put into a bin in the workhouse u n t i l i t can be treated, or i t
i s conveyed by belt to the storage area. When reaching the bin to which 21
i t has been consigned, a movable "tri p p e r " diverts the flow into the bin.
When i t i s desired to load a ship, the f i r s t step is to tap the
required bin by opening a movable s l i d e at i t s base, whereupon the grain
pours out onto a moving belt beneath the s i l o s . It is now conveyed back
to the leg, which elevates i t again to the garner and scale, and after
weighing i t i s carried by another belt into a shipping bin. This acts as
a buffer stock between the mechanical equipment in the elevator, and the
ship's holds; should loading have to cease for any reason, such as trimming
the cargo for instance, the operation of the elevator can continue and the
shipping bin f i l l s up.
The grain is extracted from the shipping bin in the same way as from
the storage bin and f a l l s onto a conveyor which runs in a raised gallery
along the length of the berth. This gallery can contain several belts i n
W. Malott (ed.), Grain and Its Marketing, (Chicago: Grain Exchange I n s t i t u t e , 1951), p. 158.
- 29 -
order to perform loading faster. At a selected position above the
hatchway of the ship which i s moored alongside, a movable tripper i s set
to divert the grain flow into the spout--an enclosed tube through which
the grain moves into the hold. Customarily, more than one scale i s used
and the grain moves through more than one shipping bin, but in essence
the procedure is as described above. A cross sectional view of an ele
vator is presented in Figure 2-1 to c l a r i f y the respective positions of
the different pieces of equipment.
Port F a c i l i t i e s and Their Capacity
The geographic advantages enjoyed by the port of Vancouver are
considerable; the harbour i t s e l f is an excellent one, well protected
from wind and weather and yet enclosing water of ample depth for the
largest ships; the climate i s good, with ice-free winters, and the t i d a l
range i s not excessive; the shore of the harbour on the south side adjoins
an area of f l a t land suitable for the i n d u s t r i a l development associated 22
with a port; the shoreline generally i s well suited to the construction 23
of wharves without dredging or excessive p i l i n g costs.
The main l i m i t a t i o n to the harbour has been the F i r s t Narrows
entrance with i t s minimum water depth of about 40 feet at low ti d e , but
with a spring t i d a l range of 13 feet, larger vessels could s t i l l enter at
See I . H. B. Cornwall, A Geographic Study of the Port of Vancouver, (Unpublished Master's thesis in the University of B r i t i s h Columbia, 1952).
23 G. T. Atamenko et a l . , The Port of Vancouver: an Urban Planning
Study, (University of B r i t i s h Columbia, Department of Planning, May, 1961), p. 8.

- 30 -
Courtety C. D. Howe ©•'Co., Port Arthur, Ont. .
X—Discharge spouts from elevator legs 2— 2500 bushel scale garner 3— 2500 bushel cleaner garner A—2500 bushel hopper scale 5—Mayo and telescopic distributing «pout« C—Screening* teparator 7— Loading tpouts to storage belts 8— Car loading tpouu
9—Shipping bin 1 0— Workhouse bin 1 1 — Boat loading spout 1 2— Car unloading shed I 3—Receiving separator H — 2500 bushel receiving hoppers 1 5 — Storage cupola 1 6— Storage binp
O M I •«CT1M
17—Storage basement IS—Substation 19— Drier garner 20— Drier
• 21—Boiler house 22—Dust Collector*
TYPICAL TERMINAL ELEVATOR, PORT ARTHUR 'AND FORT WHLLIAM, ONTARIO
FIGURE 2 - 1
Source: D . A. MacGibbon, The Canadian Grain Trade, (Toronto: MacMillan Company, 1 9 3 2 ) , p . 1 1 9 .
The
- 31 -
24 certain times of day. In i t s natural state, the width of the channel 25
was only 500 feet, but this was increased to about 1,400 feet in 1916.
The National Harbours Board has been planning for some time to increase
the depth, and i t has recently been confirmed from Ottawa that dredging 26
w i l l start this year to increase the depth to 50 feet at low t i d e .
Since most vessels require about f i v e feet of water under thei r keels to
permit safe manoeuvering and adequate handling, the harbour w i l l be open
to ships drawing 45 feet at a l l stages of the t i d e .
This F i r s t Narrows depth is not the only l i m i t i n g factor, as can
be appreciated from table 2-2 on page 37 which shows that few berths have
this depth of water; i t has been the practice in other world ports to load
large vessels "over the t i d e " and no doubt the same can be accomplished
here, i n the absence of shortages and delays.
Within the harbour there is adequate space for manoeuvering vessels,
but unpredictable currents can be a problem around Ballantyne Pier; this
is caused by a back eddy into Coal Harbour and ships must beware when 27
moving i n this area. Ship Masters are also warned about the back eddy at the Alberta Wheat Pool berth which can cause d i f f i c u l t y ; i t is thought
28 that dredging may have caused the t i d a l currents to change.
24 Canadian Ports and Seaway Directory, (Gardenvale, Quebec: National
Business Publications, 1967), p. 296. 25
B. B r o u i l l e t t e , "Le Port de Vancouver", L'Actualite Economique, Vol. 29, No. 3, 1953, p. 451.
26 New Item in the Toronto Globe and M a i l , 11th January 1969.
27 Cornwall, 0£. C i t . , p. 14. 28 Canadian Ports and Seaway Directory, Op. C i t . , p. 296.
- 32 -
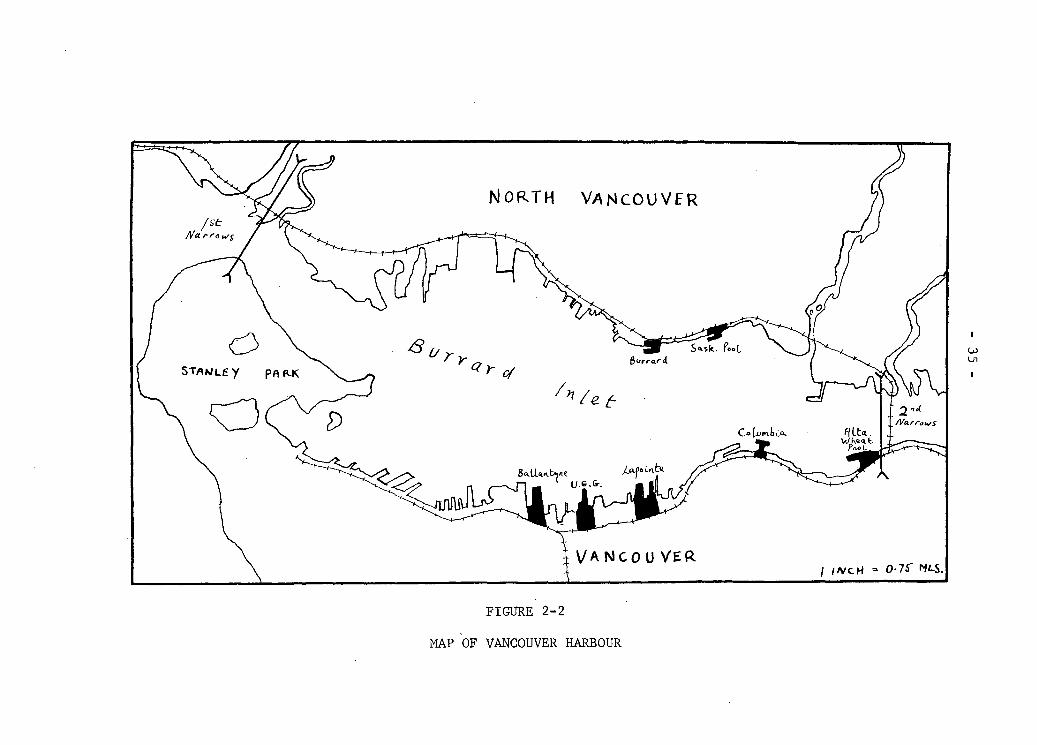
The p r i n c i p a l berths are situated along the south shore of the
harbour and extend from within the entrance at F i r s t Narrows to the Second
Narrows, a distance of about four miles. Beyond the bridge spanning Second
Narrows i s another extension of the harbour, but no grain f a c i l i t i e s are
located there.
The port of Vancouver is now amongst the top harbours in the world
regarding technological control of operations; located on the roof of a
shed on Centennial Pier, with a l l of the main harbour in view, i s a control
tower providing a v i s u a l and a radio l i n k of a l l aspects of harbour opera-29
trons.
Grain i s brought to the port area e n t i r e l y by r a i l , and of the
railways which serve the port only the Canadian P a c i f i c and the Canadian 30
National are of any importance. The boxcars are assembled by elevator
of destination i n the marshalling yards outside the port—Coquitlam in
the case of C P . and Port Mann for the C.N. There is unfortunately a
limited trackage at many of the elevators, and this means that frequent
car spotting is necessary. In some cases as many as four separate car 31
spots are necessary each day to f i l l elevator capacity.
Grain has always been a major factor i n the growth and expansion
of the port of Vancouver. From an i n i t i a l shipment of 50,000 bushels in
sacks in 1909, Vancouver has grown into the world's largest grain port News Item in The Vancouver Sun, 25th October 1968. 30
See Dominion Bureau of S t a t i s t i c s , The Grain Trade of Canada 1967/1968, (Ottawa: The Queen's Printer, 1968).
31 D. Yates, "Grain and the Port of Vancouver", Proceedings of the
Symposium on the Port of Vancouver, R. W. C o l l i e r , editor, (Vancouver: 1966), p. 90.

- 33 -
32 with shipments of approximately 200 m i l l i o n bushels annually.
The handling of such a large quantity of grain requires considerable
physical f a c i l i t i e s , whose c a p a b i l i t i e s w i l l be summarised below. Capaci
t i e s of port i n s t a l l a t i o n s and equipment are d i f f i c u l t to define and
depend i n general upon the pattern of vessel a r r i v a l s , the type of cargo,
the d i s t r i b u t i o n of ship sizes, the a v a i l a b i l i t y of longshore gangs and 33
the use of loading methods; however, the physical l i m i t s w i l l be outlined and some of the constraining factors mentioned.
It is also necessary to draw a d i s t i n c t i o n between the capacity of 34
a port and i t s e f f i c i e n c y ; whilst capacity is an absolute property
measuring the possible flow of grain i n , perhaps tons per day, e f f i c i e n c y
i s a measure of the costs incurred for obtaining a given l e v e l of capacity.
While two ports may have the same capacity, one of them may obtain that
capacity at less cost, and hence be more e f f i c i e n t . S i m i l a r l y , there may
well be different methods with d i f f e r i n g e f f i c i e n c i e s for attaining the
desirable shipping capacity in Vancouver. In this study, the comparison
of different methods of handling grain from shore to ship i s not attempted.
F i r s t l y , because i t i s a study in i t s e l f and is outside the main aims of
this approach, and secondly because a change i n the physical f a c i l i t i e s
of the port would require a very large investment. More appropriate i s
an investigation of the performance of existing equipment with a view to
improving i t s u t i l i s a t i o n .
32 National Harbours Board, The Port of Vancouver, I l l u s t r a t e d Pamphlet,
33 B r i t i s h Columbia Research Council, 0p_. C i t . , p. 2.
34 Petter C. Omtvedt, Report on the P r o f i t a b i l i t y of Port Investments
(Oslo, 1963), Mimeographed, p. 23.

- 34 -
At the present time there are seven grain terminals in Vancouver-
a l l located on the shores of the Burrard Inlet between F i r s t and Second
Narrows. Their respective positions are outlined in the map which con
s t i t u t e s Figure 2-2. When the empirical data for this study were gathered,
however, the new Saskatchewan Wheat Pool was not yet in use. The observed
loading characteristics of vessels, therefore, refer to a period when there
were only s i x terminals i n operation. These si x terminal complexes are
owned or operated by the various country elevator companies—by they pools
or private operations—which c o l l e c t the farmers' grain i n Western Canada.
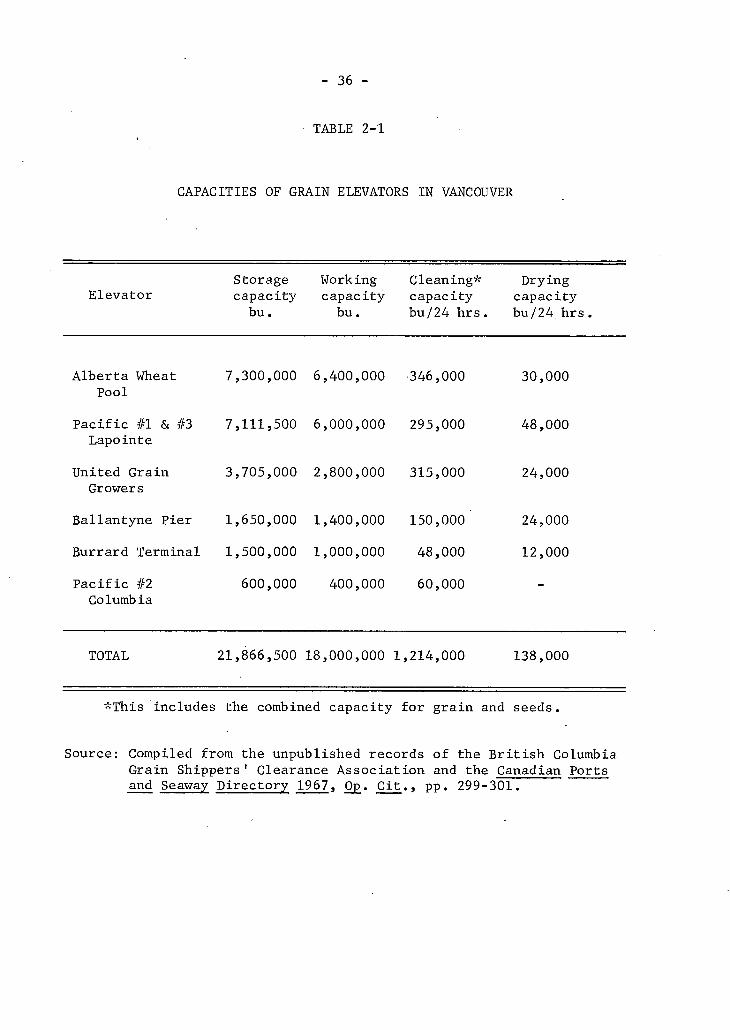
Details of elevator capacities are given in Table 2-1, which shows
the r e l a t i v e dominance of some of the elevators. The difference between
the absolute storage capacity and the working capacity i s caused by the
number of different grades of grain which the elevators are committed to
storing by their marketing p o l i c y . Since the grades have to be segregated,
unused space i n a bin i s not available for a different grade.
The handling f a c i l i t i e s at each elevator are collated in Table 2-2.
The d i v i s i o n of belts between berths is rather confusing because some ele
vators have more berths than can be a l l o t t e d two belts each; in addition,
some have berths whose u t i l i s a t i o n is dependent upon depriving a main berth
of a b e l t . This berth situation is c l a r i f i e d i n Table 2-3 which i d e n t i f i e s
these independent berths for each elevator. The ten p r i n c i p a l berths have 35
an average occupancy of 65 per cent. However, this is rather misleading
since two of the terminals—Burrard and Columbia—are less in demand than
the others and probably cause the average to understate the position at the
four major terminals. 35 B r i t i s h Columbia Research Council, Op. C i t . , p. 32.
MAP OF VANCOUVER HARBOUR
36
TABLE 2-1
CAPACITIES OF GRAIN ELEVATORS IN VANCOUVER
Elevator Storage Working Cleaning* Drying capacity capacity capacity capacity
bu. bu. bu/24 hrs. bu/24 hrs,
Alberta Wheat Pool
P a c i f i c #1 & #3 Lapointe
United Grain Growers
Ballantyne Pier
Burrard Terminal
P a c i f i c #2 Columb i a
7,300,000 6,400,000 346,000 30,000
7,111,500 6,000,000 295,000 48,000
3,705,000 2,800,000 315,000 24,000
1,650,000 1,400,000 150,000 24,000
1,500,000 1,000,000 48,000 12,000
600,000 400,000 60,000
TOTAL 21,866,500 18,000,000 1,214,000 138,000
*This includes the combined capacity for grain and seeds.
Source: Compiled from the unpublished records of the B r i t i s h Columbia Grain Shippers 1 Clearance Association and the Canadian Ports and Seaway Directory 1967, Op. C i t . , pp. 299-301.
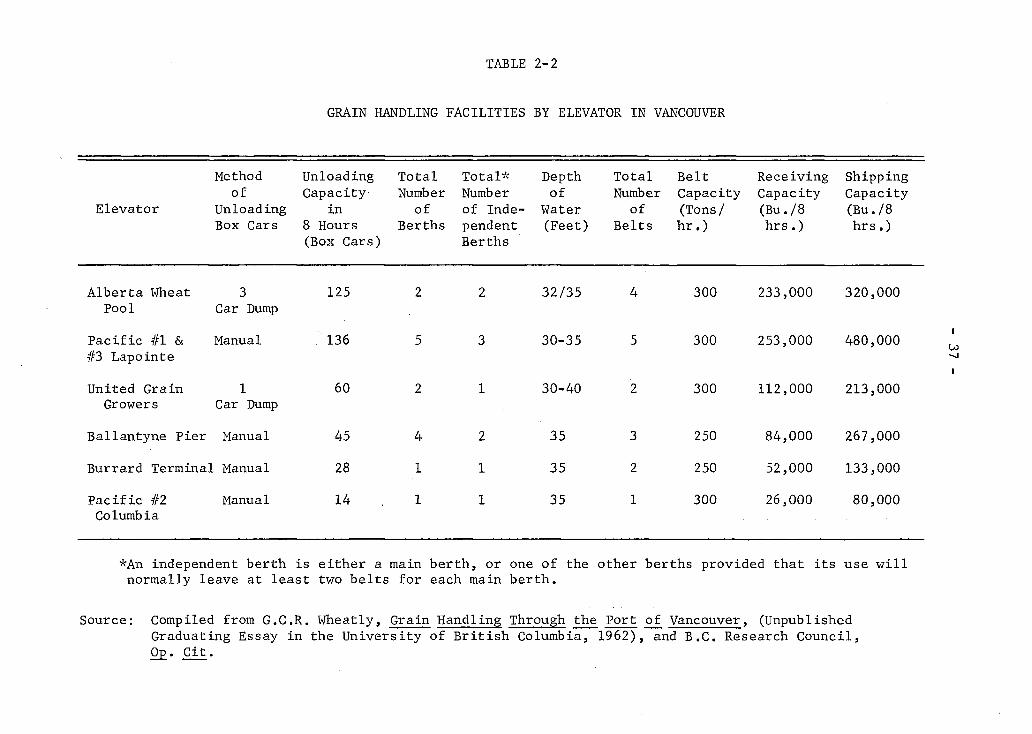
TABLE 2-2
GRAIN HANDLING FACILITIES BY ELEVATOR IN VANCOUVER
Elevator
Method of
Unloading Box Cars
Unloading Capacity
in 8 Hours (Box Cars)
Total Number
of Berths
Total* Number of Independent Berths
Depth Total Belt Receiving Shipping of Number Capacity Capacity Capacity
Water of (Tons/ (Bu./8 (Bu./8 (Feet) Belts hr.) hrs.) hrs.)
Alberta Wheat 3 Pool Car Dump
125 2 2 32/35 4 300 233,000 320,000
P a c i f i c #1 & Manual #3 Lapointe
136 5 3 30-35 5 300 253,000 480,000
United Grain 1 Growers Car Dump
60 2 1 30-40 2 300 112,000 213,000
Ballantyne Pier Manual 45 4 2 35 3 250 84,000 267,000
Burrard Terminal Manual 28 1 1 35 2 250 52,000 133,000
Pa c i f i c #2 Manual Columb i a
14 1 1 35 1 300 26,000 80,000
*An independent berth is normally leave at least
either a two belts
main for
berth, or each main
one of the berth.
other berths provided that i t s use wil!
Source: Compiled from G.C.R. Wheatly, Grain Handling Through the Port of Vancouver, (Unpublished Graduating Essay in the University of B r i t i s h Columbia, 1962), and B.C. Research Council, Op. C i t .
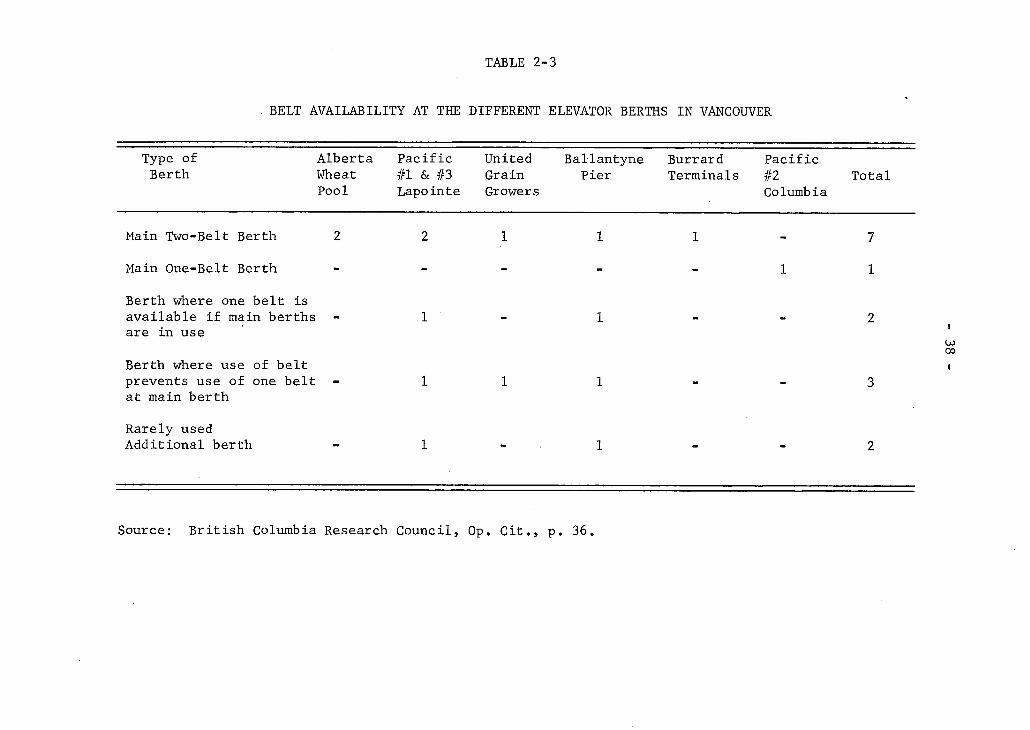
TABLE 2-3
BELT AVAILABILITY AT THE DIFFERENT ELEVATOR BERTHS IN VANCOUVER
Type of Alberta Berth Wheat
Pool
P a c i f i c #1 & #3 Lapointe
United Grain Growers
Ballantyne Pier
Burrard Terminals
P a c i f i c #2 Columbia
Total
Main Two-Belt Berth 2 2 1 1 1 - 7
Main One-Belt Berth - - - - 1 1
Berth where one belt is available i f main berths are in use
1 - 1 - - 2
Berth where use of belt prevents use of one belt at main berth
1 1 1 - - 3
Rarely used Additional berth 1 - 1 - - 2
Source: B r i t i s h Columbia Research Council, Op. C i t . , p. 36.
- 39 -
There is some d i f f e r e n t i a t i o n in the type of grain stocked by the
individual elevators. Burrard Terminals stocks specialty grains for
P a c i f i c Elevators, as well as wheat; the old Saskatchewan Wheat Pool on 36
Ballantyne Pier stores only wheat; the Columbia elevator i s used primaily
for f l a x ; the Alberta Wheat Pool stores a l l grains except rye, and the
other elevators stock almost a l l grains. The B r i t i s h Columbia Grain
Shippers 1 Clearance Association directs ships to a berth at which the
grain they want is available.
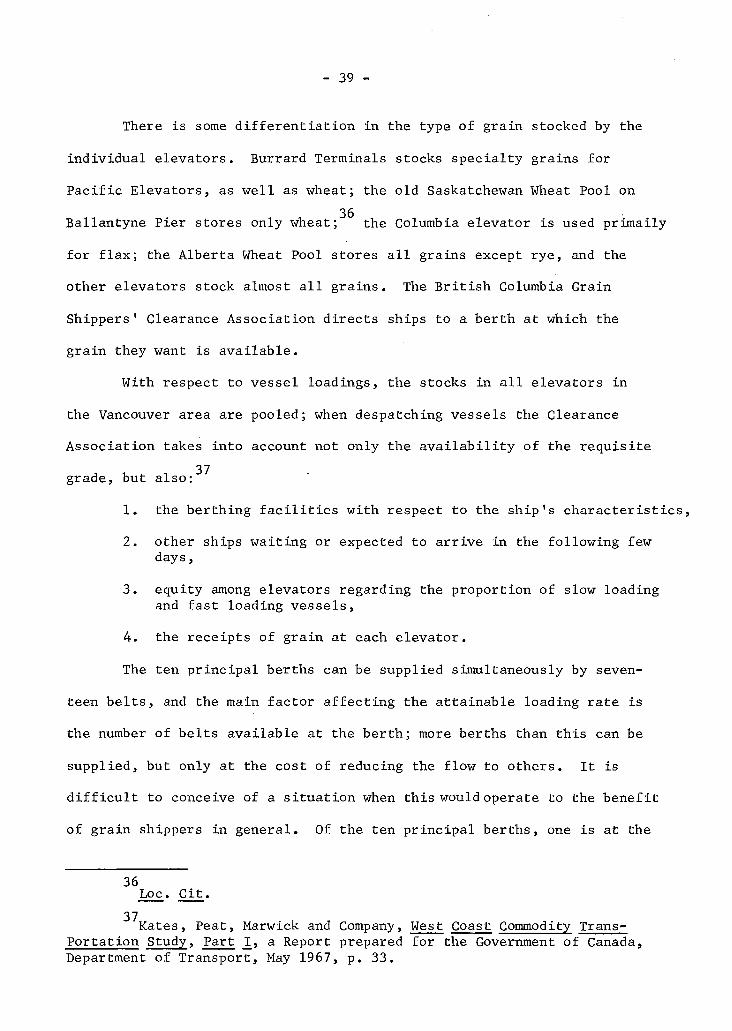
With respect to vessel loadings, the stocks i n a l l elevators in
the Vancouver area are pooled; when despatching vessels the Clearance
Association takes into account not only the a v a i l a b i l i t y of the requisite
grade, but a l s o : ^
1. the berthing f a c i l i t i e s with respect to the ship's c h a r a c t e r i s t i c s , 2. other ships waiting or expected to arrive in the following few
days, 3. equity among elevators regarding the proportion of slow loading
and fast loading vessels,
4. the receipts of grain at each elevator.
The ten p r i n c i p a l berths can be supplied simultaneously by seven
teen b e l t s , and the main factor affecting the attainable loading rate i s
the number of belts available at the berth; more berths than this can be
supplied, but only at the cost of reducing the flow to others. I t is
d i f f i c u l t to conceive of a s i t u a t i o n when this would operate to the benefit
of grain shippers in general. Of the ten p r i n c i p a l berths, one is at the
36 Loc. C i t .
37 Kates, Peat, Marwick and Company, West Coast Commodity Trans
portation Study, Part I, a Report prepared for the Government of Canada, Department of Transport, May 1967, p. 33.

- 40 -
Columbia elevator which, s p e c i a l i s i n g i n f l a x as i t does, handles only
about one per cent of the tonnage and another i s at Burrard Terminals
which has a low receiving and cleaning capability and cannot, therefore,
maintain the same berth occupancy as the other elevators. The second
berth at Ballantyne Pier i s also limited since i t may be needed for a
general cargo ship.
The rated tonnages per belt would imply that when loading at a
main berth and using two b e l t s , the maximum daily load would be approxi
mately 5,000 tons for an eight hour day. Of course, this means uninter
rupted loading, which i s almost impossible to maintain except for large
loads of a single type of grain when i t i s a l l available at one elevator.
Since in general a vessel i s allocated two b e l t s , except at the
Columbia elevator, the rate attained is not thought to be s i g n i f i c a n t l y
different between elevators; this i s encouraging i n view of the l i m i t a
tions in the empirical data which were brought out i n chapter I. The new
Saskatchewan Pool, of course, loads very much faster--at a rate of approxi-38
mately 100,000 bushels per hour for two vessels. Robinson has investigated the a c t i v i t y at these elevators as measured
by the number of c a l l s both from other berths i n the harbour and from the 39
open sea. His results are shown in Table 2-4 and include a l l vessels
which loaded grain, regardless of the amount. The figures for Lapointe
and Ballantyne piers are included for interest, but they contain observations
of ships which loaded cargo other than grain, as well as the grain
38 Case, Op. C i t . , pp. 88-90. This i s approximately 3,000 tons per
hour. 39
Ross Robinson, Spatial Structuring of Port Linked Flows (Unpublished Doctoral d i s s e r t a t i o n , University of B r i t i s h Columbia, 1968).
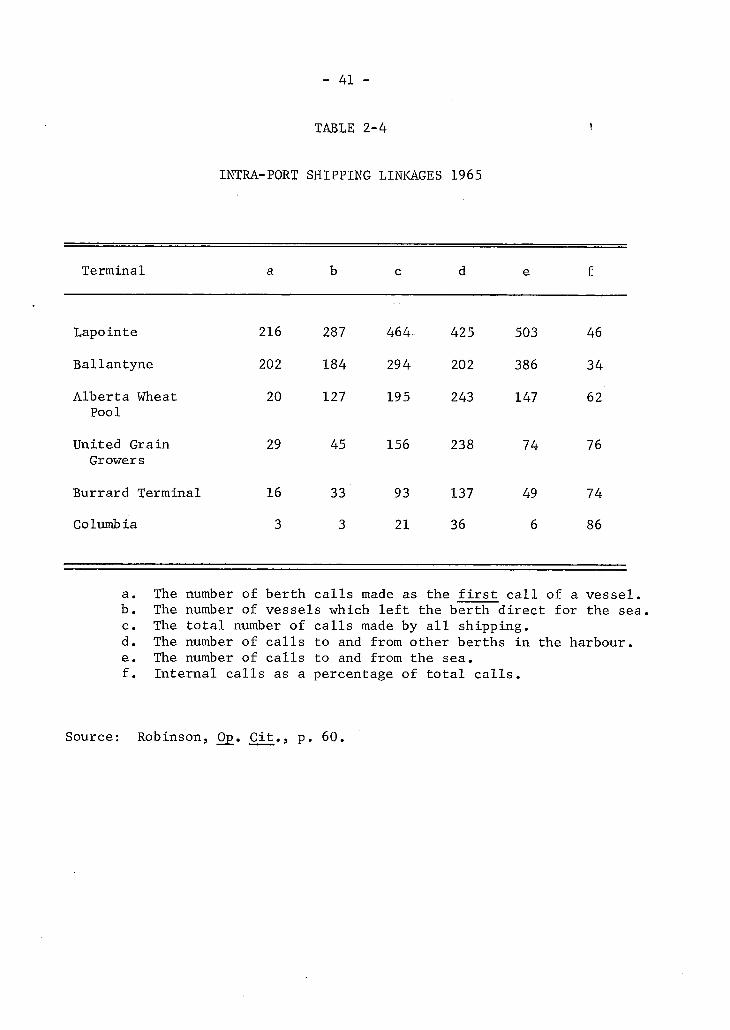
- 41 -
TABLE 2-4
INTRA-PORT SHIPPING LINKAGES 1965
Terminal a b c d e f
Lapointe 216 287 464- 425 503 46
Ballantyne 202 184 294 202 386 34
Alberta Wheat Pool
20 127 195 243 147 62
United Grain Growers
29 45 156 238 74 76
Burrard Terminal 16 33 93 137 49 74 Columbia 3 3 21 36 6 86
a. The number of berth c a l l s made as the f i r s t c a l l of a vessel. b. The number of vessels which l e f t the berth direct for the sea. c. The t o t a l number of c a l l s made by a l l shipping. d. The number of c a l l s to and from other berths i n the harbour. e. The number of c a l l s to and from the sea. f. Internal c a l l s as a percentage of t o t a l c a l l s .
Source: Robinson, 0p_. C i t . , p. 60.
- 42 -
observations. For the other elevators, the high proportion of i n t e r n a l l y
generated c a l l s shows how frequently grain ships have to s h i f t berth i n
order to take on a f u l l load.
Port Labour
The readiness and eff i c i e n c y of physical equipment is of l i t t l e
use unless labour i s available to take charge of i t s operation. The
attainment of reasonable loading rates i n Vancouver on a year round basis
is sometimes dependent on the a v a i l a b i l i t y of overtime labour and i t i s
frequently easy to show that i t is economically advantageous to the ship
owner to incur overtime costs; however, existing labour contracts make i t 40
d i f f i c u l t at times to obtain such overtime labour. There are 52 regular longshore gangs i n the port,, and these may be
41 supplemented by casual or "scratch" gangs. There are no night gangs as
such, any regular gangs unemployed during the day and some scratch gangs
are available. Figure 2-3 shows a smoothed pattern of supply and demand
for day gangs; day to day variations can be quite large, even though the
ov e r a l l smoothness is good. The demand builds up in the early winter and
tends to exceed supply through the winter and spring, dropping again i n
the early summer.
The loading of grain ships at a terminal elevator requires two
working crews; grainhandlers in the elevators and longshoremen on the
Kates, Peat, Marwick and Company, 0p_. C i t . , p. 89.
B r i t i s h Columbia Research Council, 0p_. C i t . , p. 41.

FIGURE 2-3
SEASONAL SUPPLY AND DEMAND FOR LONGSHORE GANGS IN VANCOUVER
Source: Based on two years data supplied by the B r i t i s h Columbia Maritime Employers Association and cited in Vancouver Harbour: T r a f f i c Trends and F a c i l i t y Analysis, (Vancouver: B r i t i s h Columbia Research Council, A p r i l , 1967).
- 44 -
42 ships. the two crews belong to different labour unions and their
working hours are governed by different contracts.
The grainhandlers are steady employees of the elevator company;
introducing a second s h i f t would involve h i r i n g more people on a permanent
basis, but up to four hours of overtime can be obtained at any time using
regular crews.
The h i r i n g of longshoremen on the other hand, is done by the day,
and according to t h e i r contract they cannot perform overtime except to
f i n i s h the loading of a vessel; overtime i n this instance means a few
hours of extra work done by the same gang after their regular hours. It
i s possible, though, to h i r e a gang for a second s h i f t (at time-and-a-half),
but they w i l l be i d l e for four hours after the grainhandlers stop work.
This makes for poor returns to h i r i n g an extra s h i f t , since only four hours
work are obtained for twelve hours pay. This s i t u a t i o n severely l i m i t s
f l e x i b i l i t y .
The Pattern of Vessel A r r i v a l s
The problem of providing s u f f i c i e n t f a c i l i t i e s i n the port area is
more complex than the mere provision of berths and elevators. Providing
a l i n k in the transportation chain must be distinguished from providing a
l i n k which is optimal respecting both transportation costs and physical 44
properties.
Statement by Mr. Meredith Berridge, i n a personal interview.
Kates, Peat, Marwick and Company, 0p_. C i t . , p. 96.
Omtvedt, 0p_. Cit.., p. 5.
- 45 -
The smallest capacity that any port can properly have corresponds
to the average flow of t r a f f i c . The maximum capacity required i s that
corresponding to the t r a f f i c at peak periods. Leaving aside waiting time,
and thinking only of loading time, i t seems possible that loading rates
w i l l suffer i n peak periods; this could arise f i r s t l y because of conges
tion i n the elevators, secondly because of a shortage of gangs, and t h i r d l y
because of efforts to use every available b e l t — t o the detriment in some 45
cases of berth service. On the other hand, of course, a period of peak
t r a f f i c may well provide the incentive for working more overtime and so
masking these e f f e c t s . In any event, i f the empirical findings are to be
correctly analysed, i t i s h e l p f u l to identify those portions of the year
which have been associated with heavy a c t i v i t y in the past.
The monthly shipments of grain from B r i t i s h Columbia semi-public
terminal elevators are shown i n Table 2-5, from which the general pattern
can be determined.
Between 1957 and 1967 the r a t i o of the yearly grain shipments to
that of the peak month has varied from eight to ten with a mean value of
nine. During this period, there has been no tendency for the r a t i o to 46
increase or decrease. July, August and September tend to be the slowest
months i n the West Coast ports, as shown by the seasonal adjustment factors
in Table 2-6. Understandably, the winter months when the St. Lawrence is
closed to navigation are busy ones, but some of the other fluctuations are See the inventory of f a c i l i t i e s in Table 2-3.
46 J. C. R. Clapham, G. S. Crawford, and W. J . S h e r i f f , "Grain
Through the Port of Vancouver", Proceedings of the Grain Transportation Workshop, Minaki, Ontario, September 1967, p. 97.
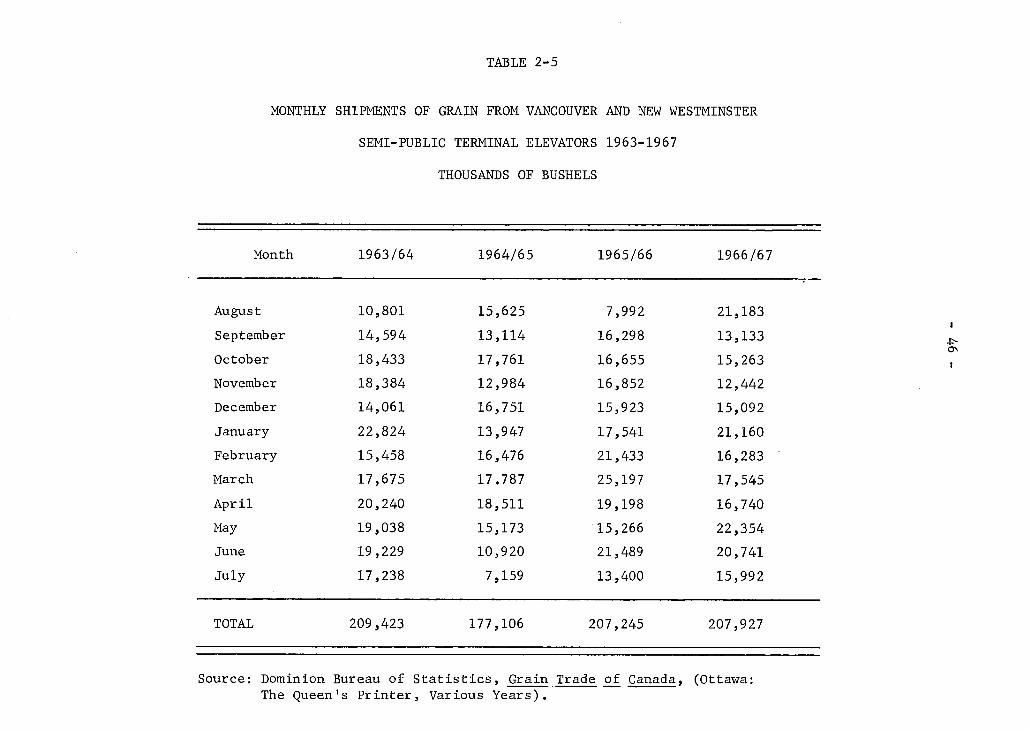
TABLE 2-5
MONTHLY SHIPMENTS OF GRAIN FROM VANCOUVER AND NEW WESTMINSTER
SEMI-PUBLIC TERMINAL ELEVATORS 1963-1967
THOUSANDS OF BUSHELS
Month 1963/64 1964/65 1965/66 1966/67
August 10,801 15,625 7,992 21,183 September 14,594 13,114 16,298 13,133 October 18,433 17,761 16,655 15,263 November 18,384 12,984 16,852 12,442 December 14,061 16,751 15,923 15,092 January 22,824 13,947 17,541 21,160 February 15,458 16,476 21,433 16,283 March 17,675 17.787 25,197 17,545 A p r i l 20,240 18,511 19,198 16,740 May 19,038 15,173 15,266 22,354 June 19,229 10,920 21,489 20,741 July 17,238 7,159 13,400 15,992
TOTAL 209,423 177,106 207,245 207,927
Source: Dominion Bureau of S t a t i s t i c s , Grain Trade of Canada, (Ottawa: The Queen's Printer, Various Years).
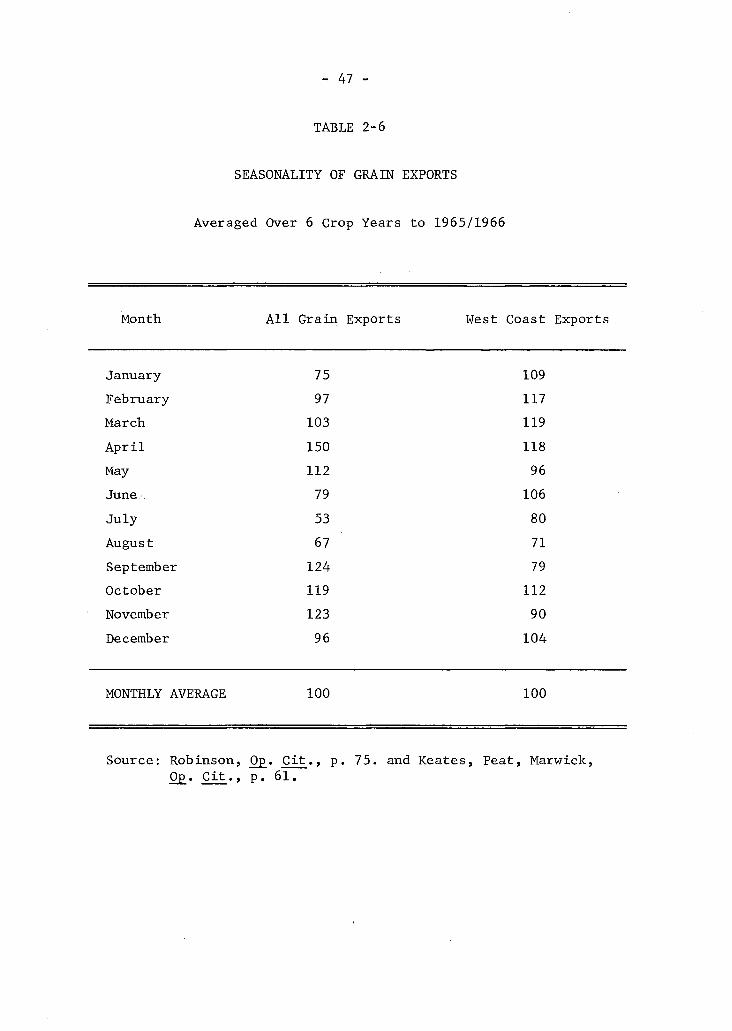
- 47 -
TABLE 2-6
SEASONALITY OF GRAIN EXPORTS
Averaged Over 6 Crop Years to 1965/1966
Month A l l Grain Exports West Coast Exports
January 75 109 February 97 117 March 103 119 A p r i l 150 118 May 112 96 June, 79 106 July 53 80 Augus t 67 71 September 124 79 October 119 112 November 123 90 December 96 104
MONTHLY AVERAGE 100 100
Source: Robinson, Op. C i t . ,
Op. C i t . , p p. 61.
. 75. and Keates, Peat, Marwick,
- 48 -
d i f f i c u l t to explain. For our purposes explanations are not esse n t i a l ,
s u f f i c e i t to be known that this s i t u a t i o n e x i s t s .
Some Possible Causes of Delay
The number of lin k s i n the grain transportation chain i s so large
that the possible causes of delay are very numerous. Following the start
of substantial sales of grain to China in 1961, the harbour has been sub-47
ject to periodic t i e ups. The f i r s t of these in 1961 led to the convening
of a P a c i f i c Grain Conference, and the formation of an Immediate Problems
Committee; their unpublished report assembled many of the possible causes 48
of delay and their work forms the basis of this section.
The f i r s t category of delays can be ascribed to congestion within the
terminal elevators, which in i t s e l f can have many causes. The pressure on
the Wheat Board to accept a l l grades of grain can resul t in the elevator
storage capacity being taken up by slow moving v a r i e t i e s ; these take up
valuable space and i n h i b i t the free flow of the more popular grades. In
addition, the elevators unload incoming boxcars s t r i c t l y i n order of a r r i v a l ,
i n order to avoid paying demurrage on the cars; this can result in the un
loading of grades for which there i s no immediate demand, while ships are
waiting for grain i n boxcars which are further down the queue. If the
elevator incurred the demurrage, of course, the benefit would accrue to
Gerald C. R. Wheatley, Grain Hand1ing Through the Port of Vancouver, (Unpublished graduating essay i n the University of B r i t i s h Columbia, 1962), p. 3.
48 P a c i f i c Coast Grain Conference, Report of the Immediate Problems
Committee, (Vancouver, 1961), Mimeographed, p. 3.
- 49 -
others, although i t might be possible to recover i t v i a higher charges.
Congestion can also occur occasionally due to the imbalance of certain
elevator f a c i l i t i e s ; i t was shown in Table 2-2 that an elevator can load
grain into a ship far faster than i t can perform the other operations such
as unloading boxcars, cleaning or d r y i n g — p a r t i c u l a r l y drying. Damp grain,
a result of poor harvest conditions, does not meet the required standards
for export unless i t i s dried, and the need for th i s does not occur often;
i t i s , therefore, not economic to i n s t a l l large drying capacity. The price
for this i s a long delay when poor weather does s t r i k e .
The second category of delays is occasioned by a shortage of i n
coming grain. This can stem primarily from a shortage of s p e c i f i c popular
grades at country points, or i t can be a resu l t of lack of s u f f i c i e n t box
cars in which to transport the grain. Slides, washouts or general increases
in the demand for cars can be instrumental i n t h i s , as wel l as congestion
or i n e f f i c i e n c y i n the railway marshalling yards.
The t h i r d and f i n a l category of delays contains those hitches which
originate during the performance of the port function—namely the transfer
of cargo from shore to ship. Bad weather can prevent loading as well as
delaying the a r r i v a l of some vessels and causing a bunch to dock at the
same time.
The onset of wet weather i s inconvenient for grain cargoes because
grain, being a l i v i n g organism, is subject to germination which depends on
i t s temperature and the presence of moisture, the greater the l a t t e r the 49
more w i l l v e n t i l a t i o n be needed on the voyage. It i s also a cargo which
L. G. Taylor and F. H. Trim, Cargo Work: The Care, Handling and Carriage of Cargoes, (sixth e d i t i o n ; Glasgow: Brown, Son and Ferguson, 1964) p. 22.
- 50 -
absorbs moisture very e a s i l y . In addition, condensation of moisture in
the cargo compartments must be prevented as far as possible because i t
exposes the seeds to attacks of mildew.
The scheduling of a r r i v a l s would have a s i g n i f i c a n t effect in
improving p r e d i c t a b i l i t y of loading times. As things stand, grain has to
be ordered a month before i t i s due to be shipped out, and the sixteen
or so days of latitude permitted an a r r i v i n g ship can cause grades to be
called for in an unanticipated sequence."^ I t i s this fluctuating demand
from vessels which causes i n e f f i c i e n t use of elevator space, depletion of
buffer stocks and the consequent pressure on the shore based f a c i l i t i e s .
The size and type of certain vessels can i n h i b i t manoeuvering; for
instance, a high forecastle can interfere with the grain spouts, and the
longer bulk carriers frequently overreach the berth. The "Sonic", for
example, i s 746 feet long and when berthing at the 470 foot United Grain 52
Growers berth two of her hatches projected past the end of the p i e r . If
for any reason the spout does not have a steep enough slope from the gallery
to the hatch, the grain may not flow as quickly as i t should.
Intermittent shortages of stevedoring gangs can occur, and, of course,
there are the contractual, not to mention the physical, limitations on
overtime already mentioned. Excessive trimming of a vessel or the neces
s i t y to bag over an incompletely f i l l e d hold greatly increase the loading
time required. Vessels not passed for loading or not ready to load some
times occupy grain berths to the exclusion of ready ships. The large
Cufley, 0p_. C i t . , p. 355.
Yates, 0£. C i t . , p. 89.
New Item in The Vancouver Sun, 12th February 1966.

- 51 -
number of grades of grain offered for sale means that no elevator, as a
r u l e , carries s u f f i c i e n t stock of a single grade to f i l l a large order;
completing a load thus entails several c a l l s at different berths, each of
which i s time consuming. From time to time there are delays in establishing
the grades of export cargoes.
It i s evident from this lengthy catalogue of problem areas that the
chances of something going wrong are high; the small margin between the
average throughput of the port and the maximum attainable capacity under
present conditions does not leave any room for error. Once a backlog of
orders builds up, i t takes some time to reach a steady state condition again.
As a consequence of the many possible causes for delay, apportionment
of blame becomes the matter for a "round robin". The Government has blamed
the railways, the railways have blamed the port, the port has blamed the
Wheat Board and the Wheat Board has blamed the farmer, who blames the 53
Government. I t is not the goal of this study to resolve this controversy
one way or the other, however, i t i s important to appreciate the factors
which can upset theories on the loading time of ships, and to take account
of them when the empirical data are being analysed.
The Control and Administration of the Port
As one of Canada's nine national harbours, the port of Vancouver
comes under the overall management and dire c t i o n of the National Harbours
Laurencom Writers, "Grain Handling Sparks Controversy at Vancouver", Canadian M i l l i n g and Feed, Vol. XLVII (May 1966), pp. 20-23. See also, J . K. Edwards, "Behind the Big West Coast Grain Back-up", Financial Post, 14th March 1966.

- 52 -
Board; this being an agency corporation of the Federal Government, conduc-54
ting i t s business on a quasi-commercial basis. In fact, the harbour is owned, controlled and administered by a m u l t i p l i c i t y of organisations,
55 some of which are quoted below from the survey by Atamenko et a l .
(a) The Federal Government, owner of a l l sea bottom from F i r s t Narrows east to Port Moody.
(b) The Provincial Government, owner of a l l sea bottom from F i r s t Narrows out to the harbour boundary.
(c) The National Harbours Board, administrator of the harbour waters, controller of navigation, collector of t o l l s , plus control of leasing Crown Federal lands in the inner harbour, owner of certain parcels of land in the inner harbour.
(d) The Canadian P a c i f i c Railway, owner of extensive lands along the south shore of the i n l e t .
(e) The City of Vancouver, has zoning control over the lessee of Crown or C.P.R. property.
(f) The municipalities of West Vancouver, City and D i s t r i c t of North Vancouver, Burnaby and Port Moody a l l have zoning control out to their boundaries, which i n some cases l i e 1,000 feet off shore.
Other agencies which have peripheral control of certain functional
areas include the T o l l s , Highways and Bridges Authority, the Department of
National Defence, the Department of Public Works, the Department of Trans
port, the Department of Fisheries, the Provincial Department of Lands, the
Customs and Immigration Department, the P o l l u t i o n Control Board, and the
Greater Vancouver Water D i s t r i c t . The complexities of administering this
system and setting policy for long term development are considerable.
Powers seem to be often overlapping, contradictory or supplementary between
54 The Progress and Development of the Port of Vancouver, National
Harbours Board, I l l u s t r a t e d pamphlet. "'"'Atamenko, et a l . 0p_. C i t . , pp. 35-37.
- 53 -
the various agencies, and the National Harbours Board, by i t s nature, i s
more concerned with the National Welfare than with the development of a
s p e c i f i c port region.
With i t s recently implemented plan to lease piers to private operators,
the Board hopes to remove i t s e l f from commercial pressures and at the same
time to bring some competitive s p i r i t into port operations. As Mr. William 56
Duncan, special projects o f f i c e r for the Board, recently said: ... we want to get out ot the day-to-day operations of the port. In the past we have contracted these operations to a stevedoring company, so we are not closely t i e d to these operations yet we attempt to administer them.
It has always been a matter of some pique i n Vancouver, that the
operation of i t s port, so v i t a l for prosperity, should be administered
three thousand miles away i n Ottawa. Urgent questions nearly always
occasion long delays, even i f "modern communications have lessened the ., 5 7 distance".
If improvements i n the port si t u a t i o n are to be made, i t seems that
the challenge may not be i n the provision of more advanced technical
f a c i l i t i e s , but i n properly organising the a c t i v i t i e s of man i n trans-58
portatron.
~^The Toronto Globe and M a i l , 16th December, 1967.
""^Statement by the Chairman of the National Harbours Board, reported i n The Province, 30th October 1968.
58 Address by H. A. Mann, Chairman of the National Harbours Board,
to the 56th Annual Convention of the American Association of Port Authorit i e s , Vancouver, September 1967.

CHAPTER I I I
TURNAROUND TIME AND PORT COSTS
The l i t e r a t u r e of ocean shipping has on the whole been well sprink
led with i n s p i r a t i o n a l a r t i c l e s on the advantages of reducing port time;
when a ship l i e s i d l e at the quay, i t is merely a rather expensive ware
house, and the costs for c a p i t a l and crew continue unabated. If any
excessive time is spent either loading or discharging, then this must be
reflected eventually in higher freight r a t e s — f r e i g h t rates which are
cle a r l y greater than they might be, given a greater awareness of the prob
lem.
Port delays can raise costs in a variety of ways through the under-
u t i l i s a t i o n of shipping, expensive port f a c i l i t i e s , and inland transport
equipment;''" as far as the ship owner i s concerned, increased outlay can
be required on account of greater stevedoring expenses ( i f the average
loading rate is low), increased port charges ( i f they are based on a daily
r a t e ) , increased variable voyage costs and increased c a p i t a l charges per
voyage; there is also less opportunity to turn a p r o f i t on a greater num
ber of voyages. These high costs are a strong inducement to decrease port
time wherever possible, and this can only be done by considering ship and 2
port together.
P. A. Lane, "An Aspect of the Cost of Port Delays", Yorkshire B u l l e t i n of Economic and Social Research, November 1957, p. 76.
2 Petter C. Omtvedt, Report on the P r o f i t a b i l i t y of Port Invest-
ments, (Oslo: mimeographed, 1963), p. 62.
- 55 -
The lowest cost per cargo ton i s not n e c e s s a r i l y reached by dec
r e a s i n g port time to the minimum t e c h n i c a l l y a t t a i n a b l e ; i n order to
decrease time spent l o a d i n g , s u c c e s s i v e l y greater amounts of investment
i n handling equipment need to be made, u n t i l at some point the s i z e of
the r e q u i r e d o u t l a y does not j u s t i f y the savings i n ship time. This i s a
conventional o p t i m i s a t i o n problem which i s summed up i n Figure 3-1.
Unf o r t u n a t e l y , because of f l u c t u a t i n g trade and the great range of v e s s e l
types and s i z e s which use most p o r t s , an optimum i s not easy to i d e n t i f y .
This point i s taken up again below.
An a d d i t i o n a l example of the e f f e c t s of port congestion has been 3
given by A l d c r o f t , who ascribes the v i o l e n t f r e i g h t r a t e boom of 1920
to the f a c t that the world supply of tonnage was e f f e c t i v e l y reduced to
a f r a c t i o n of i t s true s i z e , by long port s t a y s . Loading periods of more
than two months were by no means uncommon and t h i s r e s u l t e d i n a g r e a t l y
excessive demand, high f r e i g h t r a t e s , and the d i s p o s a l of v e s s e l s at
h i g h l y i n f l a t e d p r i c e s . When the bubble b u r s t , many firms were forced
i n t o l i q u i d a t i o n .
E m p i r i c a l Surveys of Time Spent i n Port
The a c t u a l time which a v e s s e l spends i n port must e v i d e n t l y be a
f u n c t i o n not only of the port and the type of v e s s e l , but a l s o of the cargo
and the nature of the tra d e . However, i t i s r e v e a l i n g to c o l l a t e some of
the references to port time so that a rough i n d i c a t i o n of the magnitude of
D. H. A l d c r o f t , "Port Congestion and the Shipping Boom of 1919-20", Business H i s t o r y , June 1961.
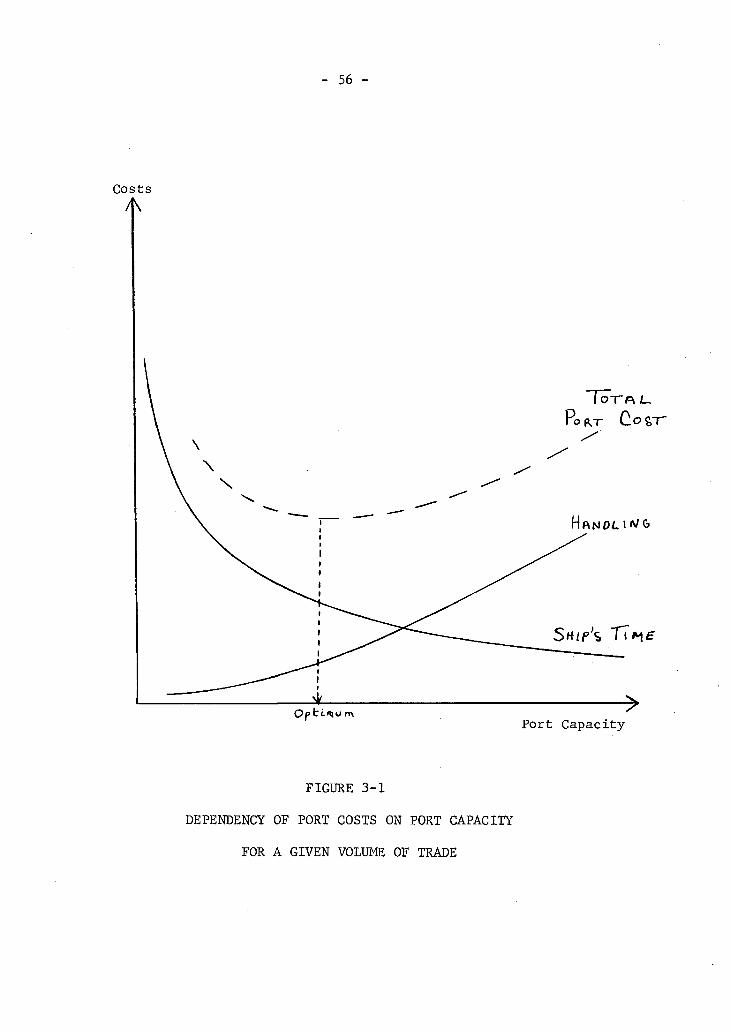
- 56 -
FIGURE 3-1
DEPENDENCY OF PORT COSTS ON PORT CAPACITY
FOR A GIVEN VOLUME OF TRADE

- 57 -
the problem can be obtained. 4
Oram suggests that i n 1929, out of a t o t a l year of 365 days, a
vessel could be counted on to be at sea for about 210 days; by 1937 this
had decreased to 200 and by 1950 to 130 days. The trend of this deteriora
tion is unmistakable, and Oram suggests that " i f the current figures were
available few knowledgeable persons would expect to see improvement".^
MacGillivray has observed the same disappointing increase in id l e
time in the post-war r e l a t i v e to the pre-war years. Comparing trades
where vessel u t i l i s a t i o n was s i m i l a r , a change from 46 per cent of the
year spent in port to 60 per cent was observed. This more than represented
one round voyage lost per year for the trade concerned. MacGillivray was
one of the f i r s t writers to point out the consequences of t h i s , which have
now become a familiar r e f r a i n : ^ The time which shipowners are saving at sea through building faster ships at very great cost i s being e n t i r e l y n u l l i f i e d by detention i n port.
Estimates of the proportion of the year spent in port i n recent times
are f a i r l y consistent. The O.E.C.D. annual review of maritime a f f a i r s sug-g
gested 58.9 per cent. The Rochdale committee of enquiry into the ports of
R. B. Oram, Cargo Handling and the Modern Port, (Oxford: Pergamon Press, 1965), p. 4.
^Loc. C i t .
W. MacGillivray, "Speed at Sea and Despatch i n Port", Transactions of the Royal Institute of Naval Architects, July 1948, p. 193.
^Loc. C i t .
^Organisation for Economic Co-operation and Development, Maritime Transport, (Paris: O.E.C.D., 1954).
- 58 -
9 Great B r i t a i n put forward 60 per cent. Lane documents a decline i n the
speed of port operation i n voyages between B r i t a i n and Australasia, and
put the proportion of port time at 59.1 per c e n t . ^ The Chairman of the
B r i t i s h and Commonwealth Shipping Company quoted 58 per cent in a message
to his shareholders.'''''" A more favourable figure for port time i s revealed
in an American study of some 1,300 voyages during which about 45 per cent . 1 2
of days were spent i n port. Svendsen has separated the characteristics of different types of
13 vessels and quotes the results reproduced i n Table 3-1.
In judging a l l these figures i t must be taken into account that
whereas sea days represent twenty four hour a day working, ports are
usually controlled by conventional hours i n the country of location; night
working i s s t i l l rare and there i s l i t t l e a c t i v i t y at weekends.
Furthermore, in many of these references there is no mention of
how the figures were determined nor to what types of vessels or voyages
they apply. It i s common practice for ships i n the l i n e r trade, for i n
stance, to maintain a schedule which involves waiting for cargo in many
9 Report of the Committee of Enquiry into the Major Ports of Great
B r i t a i n , Cmnd. 1824, (London: Her Majesty's Stationery Office, 1962), p.112, ^Lane, Qp_. C i t . , p. 90.
''"''"Sir Nicholas Cayzer, Speech to the 11th Annual General Meeting of the B r i t i s h and Commonwealth Shipping Company Ltd., 27 July 1966, cited in R. 0. Goss, "The Turnaround of Cargo Liners and i t s Effect on Sea Transport Costs", Journal of Transport Economics and Policy, Vol. I No. 1 January 1967.
12 E. Scott D i l l o n , F. G. Ebel, and A. R. Goodbeck, Ship Design for
Improved Cargo Hand1ing, a paper presented to the Chesapeake Section of the Society of Naval Architects arid Marine Engineers, October, 1961.
13 Arnljot Stromme Svendsen, Sea Transport and Shipping Economics,
(Bremen: Weltschiffahrts-Archiv, 1958).
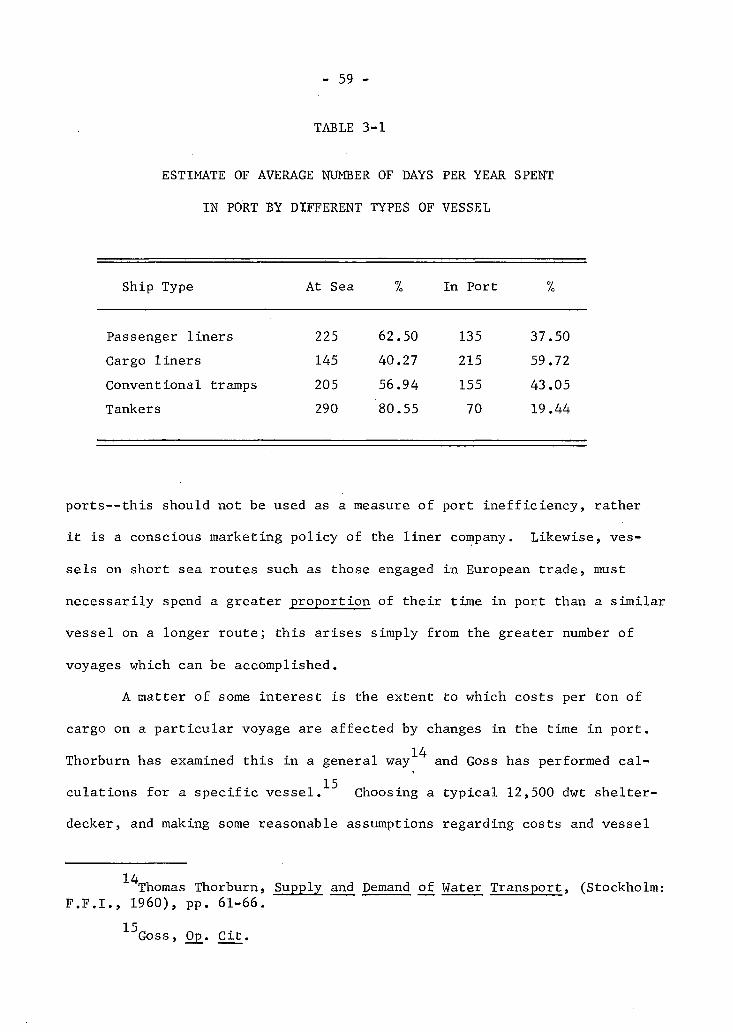
- 59 -
TABLE 3-1
ESTIMATE OF AVERAGE NUMBER OF DAYS PER YEAR SPENT
IN PORT BY DIFFERENT TYPES OF VESSEL
Ship Type At Sea % In Port %
Passenger l i n e r s 225 62.50 135 37.50 Cargo l i n e r s 145 40.27 215 59.72 Conventional tramps 205 56.94 155 43.05 Tankers 290 80.55 70 19.44
p o r t s — t h i s should not be used as a measure of port i n e f f i c i e n c y , rather
i t i s a conscious marketing policy of the l i n e r company. Likewise, ves
sels on short sea routes such as those engaged i n European trade, must
necessarily spend a greater proportion of their time in port than a similar
vessel on a longer route; this arises simply from the greater number of
voyages which can be accomplished.
A matter of some interest is the extent to which costs per ton of
cargo on a particular voyage are affected by changes in the time i n port. 14
Thorburn has examined this in a general way and Goss has performed c a l
culations for a s p e c i f i c vessel.'''"' Choosing a t y p i c a l 12,500 dwt shelter-
decker, and making some reasonable assumptions regarding costs and vessel
Thomas Thorburn, Supply and Demand of Water Transport, (Stockholm: F.F.I., 1960), pp. 61-66.
''""'Goss, 0p_. C i t .
- 60 -
u t i l i s a t i o n , he calculated the freight rate necessary to return 6 per cent
to the ship owner at varying rates of cargo handling. The results of his
calculations are depicted graphically i n Figure 3-2. A noticeable feature
of the curves i s the rapid increase in the required freight rate as the
proportion of time spent i n port increases.
Heaver has extended this type of analysis to cover a range of ves
s e l sizes i n the tanker and bulk c a r r i e r t r a d e s ; ^ i n this presentation
a si t u a t i o n highly relevant to the turnaround of grain ships is revealed.
If port time i s similar for large and small vessels, greater savings can
be achieved by improving the turnaround of the small vessels; this i s be
cause of the large number of sa i l i n g s needed to move a given volume of
cargo--hence there are more opportunities for saving t i m e . ^
The Cost of Ship's Time
Shipping costs are dependent on a very large number of factors; some
are connected with the ship (type, s i z e , age, c a p i t a l cost), some with
the mode of operation (speed, port c a l l s , loading and discharging), and
some with the type of operation (voyage length, route, crew costs, nature 18
of cargo). Usually they are c l a s s i f i e d into f i v e major categories:
1. Vessel operating expenses.
2. Vessel c a p i t a l charges.
T. D. Heaver, The Economics of Vessel Size, (Ottawa: National Harbours Board, 1968), See also H. Benford, "The Rational Selection of Ship Size", Shipping World and Shipbuilder, Vol. 161, (18th July 1968), p. 1235.
^ I b i d . , p. 65. 18 F. M. Fisser, Tramp Shipping, (Bremen: Weltschiffahrts-Archiv, 1957).
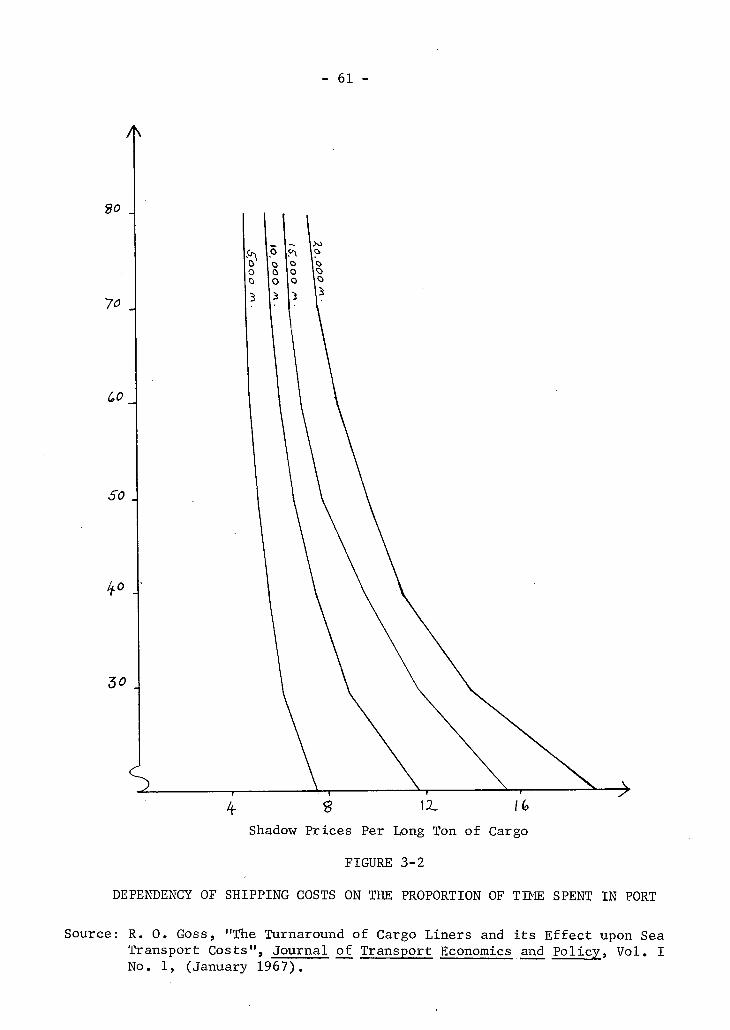
- 61 -
Shadow Prices Per Long Ton of Cargo
FIGURE 3-2
DEPENDENCY OF SHIPPING COSTS ON THE PROPORTION OF TIME SPENT IN PORT
Source: R. 0. Goss, "The Turnaround of Cargo Liners and i t s Effect upon Sea Transport Costs", Journal of Transport Economics and Policy, Vol. I No. 1, (January 1967).
- 62 -
3. Port dues.
4. Cargo handling.
5. General administration.
Crew costs, maintenance, and c a p i t a l charges are a l l more or less
dependent on the f l a g of r e g i s t r y , whereas insurance, cargo handling,
stores, port dues, and repairs are a l l internationally based.
The cost of ship's time, therefore, i s made up of the d a i l y operatin
expenses (crew costs, insurance, stores, al l o c a t i o n of repairs and main
tenance) plus the daily c a p i t a l charges and also administration, which i s
usually very small and amounts to the agency fees.
The t o t a l costs of a t y p i c a l 27,000 dwt, 15 knot bulk c a r r i e r break
down into these c l a s s i f i c a t i o n s as shown i n Table 3-2. Capital charges
are the largest single item, which is usual for ships of this size and type
ignoring fuel and port charges, c a p i t a l costs are also larger than a l l
other time costs put together.
Actual details of vessel costs are d i f f i c u l t to come by, and when
they are obtained tend to d i f f e r widely. This is a natural consequence
both of different modes of operation and of concealing costs from the com
p e t i t i o n .
The c a p i t a l cost of a vessel varies considerably with the country
of construction, but assuming access to the cheap yards i n , say, Japan the
price w i l l s t i l l vary according to the spe c i f i c a t i o n s . Some owners desire
a d i v e r s i t y of equipment which increases immediate cost but reduces the
r i s k of future unemployment i f trade patterns change; others, with a more
specialised use i n mind, can construct more cheaply. The l i f e of a ship
over which the cost i s written off is also a major determinant of t o t a l
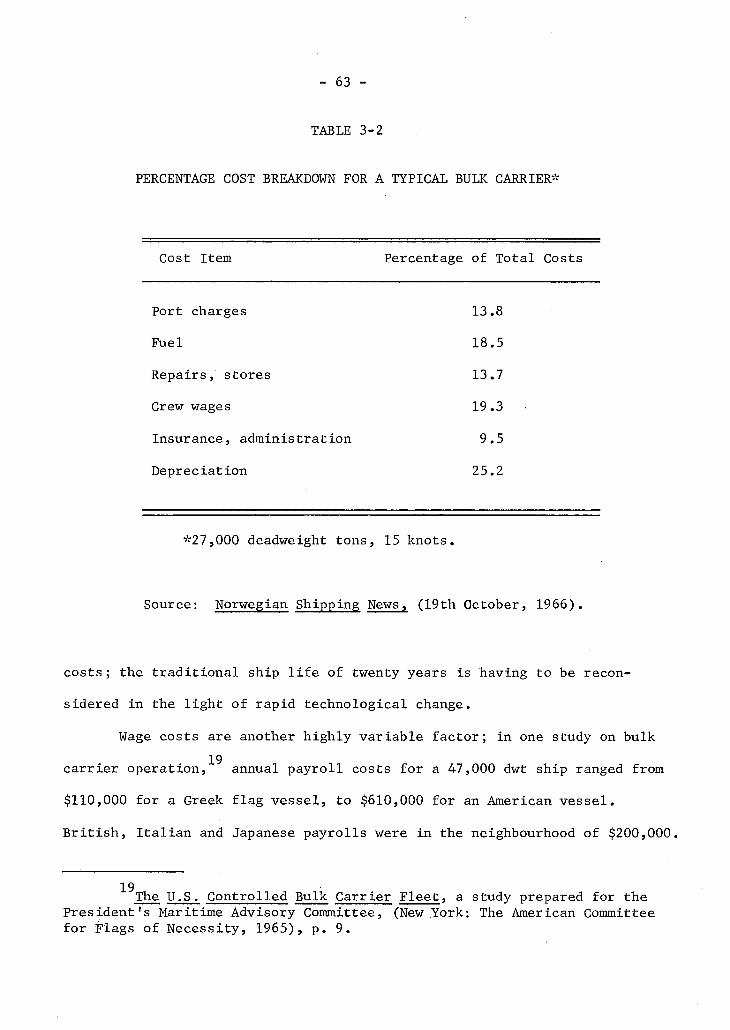
- 63
TABLE 3-2
PERCENTAGE COST BREAKDOWN FOR A TYPICAL BULK CARRIER*
Cost Item Percentage of Total Costs
Port charges
Fuel
Repairs, stores
Crew wages
Insurance, administration
Depreciation
13.8
18.5
13.7
19.3
9.5
25.2
*27,000 deadweight tons, 15 knots.
Source: Norwegian Shipping News, (19th October, 1966).
costs; the t r a d i t i o n a l ship l i f e of twenty years i s having to be recon
sidered i n the l i g h t of rapid technological change.
Wage costs are another highly variable factor; i n one study on bulk 19
ca r r i e r operation, annual payroll costs for a 47,000 dwt ship ranged from
$110,000 for a Greek fl a g vessel, to $610,000 for an American vessel.
B r i t i s h , I t a l i a n and Japanese payrolls were i n the neighbourhood of $200,000,
19 The U.S. Controlled Bulk Carrier Fleet, a study prepared for the
President's Maritime Advisory Committee, (New York: The American Committee for Flags of Necessity, 1965), p. 9.
- 64 -
The incidence of surveys and unexpected maintenance can introduce irregu-20
l a r i t y , but these can be allocated on an annual basis to avoid t h i s . 21
Of the actual costs which are available for a range of ship sizes, 22
those i n a 1967 research study by Cufley seem to be the most recent;
with increasing costs in a l l aspects of the industry this is a most im
portant consideration.,
These costs are presented i n Table 3-3 as being representative of
bulk c a r r i e r costs. The daily operating expenses are s l i g h t l y less than
the per diem c a p i t a l charges and form a smaller proportion of t o t a l ex
penses as ship size increases. The item c a p i t a l charges is a r e l a t i v e l y
unsophisticated, undiscounted approach incorporating 5 per cent p.a. of
o r i g i n a l cost as depreciation and 5% per cent interest on borrowed c a p i t a l ,
t h i s being the lowest available world rate (as of 1966) . The construction
costs are based on the November 1966 prices for diesel driven vessels.
Changes i n the Structure of Costs
Changes which have arisen in the cost characteristics of the shipping
industry place greater importance upon non-productive time. I t has been
R. 0. Goss, "Economic C r i t e r i a for Optimal Ship Design", Trans actions of the Royal Institute of Naval Architects, (October, 1965).
21 See for instance C. F. H. Cufley, World Freight Review 1964,
(London: The B r i t i s h Sulphur Corporation, 1965), p. 68; A. R. Ferguson et a l i a , The Economic Value of the United States Merchant Marine, (Chicago: Transportation Centre, Northwestern University, 1961); American Committee for Flags of Necessity, 0p_. C i t . , ; for construction costs, see Fair play International Shipping Journal, Semi-annual reviews, January and July, various years.
C. F. Cufley, The Ideal Tramp for the 1970's, (London: Barker and Howard, 1967), p. 20.

- 65 -
TABLE 3-3
DAILY COSTS OF DRY CARGO OCEAN GOING VESSELS
Deadweight Daily Expenses, Pounds S t e r l i n g * Tonnage
Operational Capital Total i n Port
10,000 250 220 470
15,000 280 260 540
25,000 325 360 685
50,000 450 580 1,030
100,000 550 935 1,485
200,000 650 1,580 2,230
*These costs were quoted prior to the devaluation of November 1967.
Source: C. F. H. Cufley, The Ideal Tramp for the 1970's, Op. C i t . , p. 20.
- 66 -
appreciated for many years that the cheapest l i n e haul movement can be
obtained by u t i l i s i n g the largest vessel which i s consistent with the
physical li m i t a t i o n s of the terminals between which the trade route l i e s ;
despite the longstanding nature of these p r i n c i p l e s , i t i s only recently
that technical progress i n ship design and construction has permitted the
operation of these large vessels. Both the evolution of new steels with
high strength to weight ratios and the development of building techniques
has cut down the weight of vessels while permitting the use of longer,
less reinforced h u l l s .
The increase i n the size of ships which has occurred has been well
documented, and the economies of scale achieved are the result of various
factors. F i r s t l y , the construction cost per ton f a l l s dramatically for 23
larger vessels and enables a given capacity to be attained at lower cost.
Secondly, the crew complement for a vessel rises less than proportionally
with s i z e ; there are thus economies i n manning. Thirdly, the economies
of scale operate hydrodynamically also; the greater the water l i n e length of a vessel, the greater the speed with a given power plant. For example, a 25,000 h.p. engine w i l l give a 50,000 dwt tanker a speed of 17 knots and
24 a 200,000 dwt tanker a speed of 15 knots. Fourthly, increases in world
25 trade have enabled shippers to use larger vessels.
23 Carleen O'Loughlin, The Economics of Sea Transport, (Oxford:
Pergamon Press, 1967), p. 122. 24
Sir William Lithgow, "New Designs May Revolutionise the Cargo Ship", Shipping Register and Shipbuilder, Vol. 50 No. 7, (July 1967), p. 8.
25 E. S. Engelstad, "Impact of World Trade on Shipping", Fairplay
International Shipping Journal, 20th October 1966.
- 67 -
Technological advances such as the ram and bulbous bow have the
capab i l i t y of increasing the speed of a vessel for a given power; i n
fact they are being used to decrease fuel consumption while maintaining
speed at about 15 k n o t s . ^ These advances result i n far lower operating
costs per ton than has been the case i n the past; however, the onus i s
one of keeping the ships employed because a given delay to a given ship
results i n far greater expense i f the ship i s larger.
In addition to these developments, recent advances in electronics
and control mechanisms have led to the increased use of automation i n 27
vessels. This i s mainly aimed at reducing the labour intensity of the
industry and the result, of course, is greater c a p i t a l expenditures and
lower running costs.
The rapid r i s e of the large ship has caused the premature demise
of many smaller c r a f t , and the average age of these vessels i s decreasing
r e l a t i v e to other vessels. Since the characteristics of old vessels are
written off c a p i t a l costs and higher running and maintenance expenses,
this development too leads to a greater proportion of fixed costs in the
industry.
A l l these changes have the same e f f e c t , namely that of reducing a
ship owner's control of his costs once a vessel i s delivered; laying off
crew no longer leads to much saving, and laying up the ship is no solution.
The road to prof i t a b l e operation i s v i a f u l l u t i l i s a t i o n of the ships'
26 D. J . M. Nolan, Bulk Carriers: Past, Present and Future, (London:
Ins t i t u t e of Chartered Shipbrokers, 1966), ch. 2, p. 7. 27 R. 0. Goss, "The Economics of Automation i n B r i t i s h Shipping",
Transactions of the Royal Institute of Naval Architects , Vol. 109 No. 3, (July 1967), p. 347.
- 68 -
carrying capacity, and this places a greater emphasis than before on the
increased speed of turnaround.
Port Dues and Charges
In addition to the time costs incurred by a vessel i n port, there
are certain e x p l i c i t payments to be made either of a f i s c a l nature, or for
the use of various harbour i n s t a l l a t i o n s .
The term dues is normally applied to payments required by the port
authority in return for the temporary use of s t a t i c f a c i l i t i e s which have 28
been created, improved and maintained by the authority. Charges, on
the other hand, are usually s p e c i f i c reimbursements for services rendered
either by the authority of by private organisations such as tug operators,
stevedores, shipping and forwarding agents, and elevator companies. The
grain handling charges of the l a t t e r do not affect ship owners s p e c i f i c a l l y
since they are levied against the buyer of the grain; however, they do
make up part of the t o t a l transportation cost.
The second important d i s t i n c t i o n i n this area of port costs i s that 29
between charges levied against the ship and charges against the cargo.
The former are normally dependent on the size of the vessel, and perhaps
i t s o r i g i n or destination, whereas the l a t t e r are usually fixed per ton of
cargo.
In Vancouver the t a r i f f s i t u a t i o n i s no less complex than i n most A. H. J. Bown, Port Economics, (second e d i t i o n , revised by W. A.
Flere; London: Foxlow Publications, 1967), p. 112. 29
W. E. Pickering, "Port Dues and Charges", Proceedings of the Symposium on the Port of Vancouver, R. W. C o l l i e r , editor, (Vancouver, 1966), p. 37.

- 69 -
other ports of the world; some payments are fixed for any vessel entry,
and some vary with the size of the vessel. In general, the charges do not
approach i n importance either the time costs of the vessel or the actual
cargo handling costs.
On a r r i v a l , a l l vessels are assessed for pilotage, based on 0.5
cents per net register ton and $1.0 per foot of draught plus a mileage
charge for the distance p i l o t e d , which is usually constant regardless of 30
the size of the vessel; towage, i f necessary, i s a size-dependent charge
also. Harbour dues amount to 3 cents per net register ton and sick mari
ner's dues to 2 cents per ton. On berthing the vessel is charged dockage
at 10 cents per eight hour period per l i n e a l foot of quay occupied, and
wharfage on the cargo handled. Not taken into account here are small
charges such as buoyage, b i l l of health, and Port Warden's fees which are
n e g l i g i b l e i n r e l a t i o n to the other factors.
Clearly, expenses of this nature are progressive with the size of
ship, but the difference between vessels of different sizes i s not r e a l l y
s i g n i f i c a n t ; dockage is the only cost variable with the loading period,
but i t i s small i n absolute terms.
The dominant port charge is that for stevedoring, especially i f
the vessel required l i n i n g or fumigating before loading can commence.
This expense is hard to predict, since i t varies with the time taken to
load as well as with the amount loaded. Larger vessels usually have a per
ton advantage here since s e l f trimming bulk carriers are e l i g i b l e for a
F. S. Campbell, (ed.), Ports: Dues, Charges, and Accommodation Throughout the World, (London: George P h i l i p and Son, 1964), pp. 571-594 and A. H. Case, Future Requirements for the Handling of Grain Through P a c i f i c Coast Ports, (unpublished Master's thesis, University of B r i t i s h Columbia, 1967), p. 73.
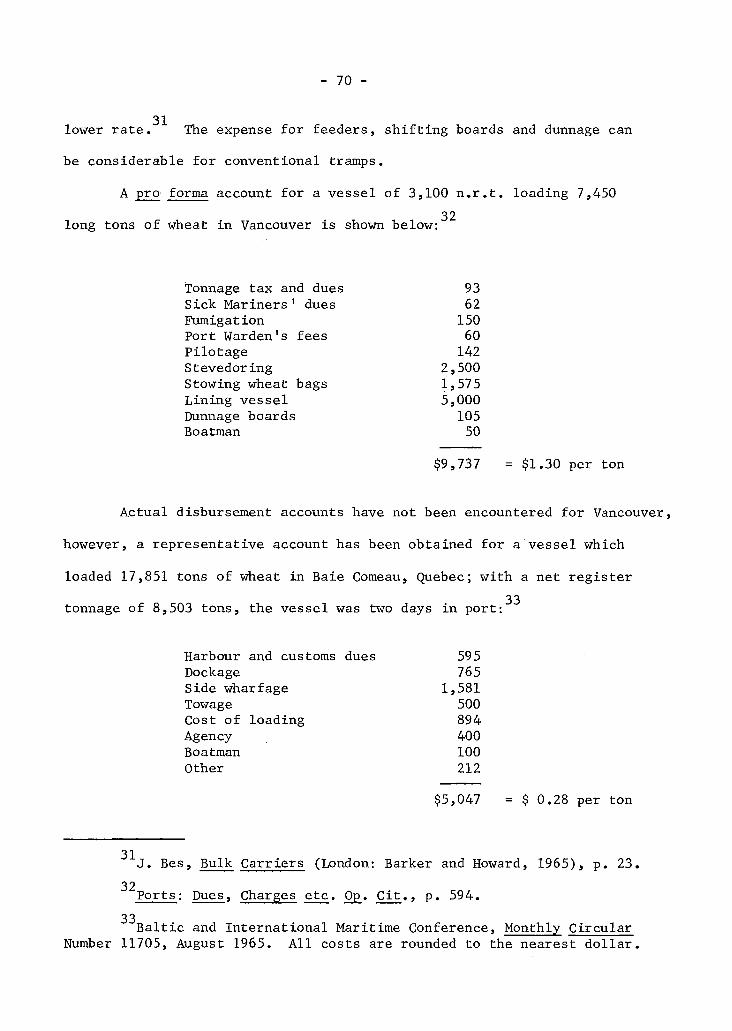
- 70 -
lower rate. The expense for feeders, s h i f t i n g boards and dunnage can
be considerable for conventional tramps.
A pro' forma account for a vessel of 3,100 n.r.t. loading 7,450 32
long tons of wheat i n Vancouver i s shown below:
Tonnage tax and dues 93 Sick Mariners 1 dues 62 Fumigation 150 Port Warden's fees 60 Pilotage 142 Stevedoring 2 ,500 Stowing wheat bags 1 ,575 Lining vessel 5 ,000 Dunnage boards 105 Boatman 50
$9,737 = $1.30 per ton
Actual disbursement accounts have not been encountered for Vancouver,
however, a representative account has been obtained for a vessel which
loaded 17,851 tons of wheat in Baie Comeau, Quebec; with a net register 33
tonnage of 8,503 tons, the vessel was two days i n port:
Harbour and customs dues 595 Dockage 765 Side wharfage 1,581 Towage 500 Cost of loading 894 Agency 400 Boatman 100 Other 212
$5,047 = $ 0.28 per ton
J . Bes, Bulk Carriers (London: Barker and Howard, 1965), p. 23. 32
Ports: Dues, Charges etc. Op. C i t . , p. 594. 33
B a l t i c and International Maritime Conference, Monthly Circular Number 11705, August 1965. A l l costs are rounded to the nearest d o l l a r .
- 71 -
Notwithstanding the t a r i f f differences between Baie Comeau and Vancouver,
this i s a good i l l u s t r a t i o n of the advantages of a bulk c a r r i e r for loading
a large cargo of grain.
Con f l i c t i n g Interests in the Port
Almost a l l the organisations operating within a port have a part to
play i n speeding the loading of vessels; however, the interests of different
parties are frequently opposed.
B a s i c a l l y , the three interests represented in a marine terminal are
the port authority or the owners, the ship owners, and the ultimate con
sumers of transport service. Only i n the case of integrated operations
such as those for o i l and ore are these interests unified in one body;
s i g n i f i c a n t l y , i t i s i n these trades that the best turnarounds occur.
The port authority, whether the port i s privately owned or publicly managed, is attempting i n some way to provide a good service—however nebulous a concept this may be. Attempts to s o l i d i f y objectives more concretely seems as d i f f i c u l t a job inside Vancouver's particular port authority
34
as i t i s outside. Nevertheless, the port manager's desire to u t i l i s e
resources under his control in the most e f f i c i e n t way i s l i k e l y , i f unchecked,
to result i n a high berth occupancy at the expense of a long waiting l i n e
of vessels. In some way, the appearance of expensive infrastructure l i e i n g
i d l e much of the time i s bad for employee morale, as well as being irrecon
c i l a b l e with economy to the i n s u f f i c i e n t l y informed taxpayer. This point,
H. A. Mann, Chairman of the National Harbours Board, address to the 56th Annual Convention of the American Association of Port Authorities, Vancouver, September 1967.
- 72 -
that continuous f u l l employment of dock and harbour i n s t a l l a t i o n is incompatible with maximum effici e n c y in the operation of ships, i s well brought
35
out by Daniels. Only i f voyage times are very short and the number of
vessels small can port f a c i l i t i e s be kept constantly i n use without causing
serious shipping delays. Neither of these qu a l i f i c a t i o n s apply to the
grain trade.
From the point of view of the vessel operator, almost any time i n
port is an imposition, and given free r e i n he would construct a large number
of berths so that any incoming ship could be guaranteed a place immediately
on a r r i v a l . This i s not so much because higher p r o f i t s could be earned
per trip--the keenness of competition in the open freight market is s u f f i c i e n t
to ensure that savings are passed along rapidly to the ultimate consumer—
but i t does ensure a better u t i l i s a t i o n of the f l e e t , and hence a greater
c a p i t a l turnover.
The consumer of transport services, whether this be shipper or
receiver, i s not concerned with these d i v i s i o n s , he desires safe, f a s t ,
r e l i a b l e transportation at the lowest cost. Since the ultimate destination,
in the case of export grain, l i e s outside of Canada, the immediate benefits
of investment here are f e l t elsewhere. Of course, exporters here may benefit
insofar as t o t a l demand is affected by changes i n the delivered price, and
increased charges can be imposed for the now improved service.
Other interests exist also i n the port system, smoothing relations
between the three major interests yet introducing further complications.
Longshore labour wants high pay and steady employment i n good working
W. J. Daniels, "The Economics of Berth Employment and Carrier Size", Dock and Harbour Authority, Vol. XLVII No. 553 (December 1966), p. 251.
- 73 -
conditions; stevedoring companies and agencies are frequently competing
for business and yet need to cooperate i f good turnaround i s to be achieved.
In p r i n c i p l e at least, i t i s possible to overview the problem and
at least estimate the number of loading i n s t a l l a t i o n s which offsets invest
ment against lost ship time i n the most advantageous combination for t o t a l
cost. Some form of queuing analysis might be performed, but no conclusions
have been published with regard to grain berths i n Vancouver, although a
simulation model has been constructed which should be capable of application 36
to this problem.
It i s almost impossible for any port to avoid congestion at some time
unless i t s capacity far exceeds that required for economic operation. The
greater the cost of a handling terminal, the higher w i l l be the berth u t i l i
sation which yields the optimum t o t a l cost. B e r t l i n suggests that the best u t i l i s a t i o n is l i k e l y to be around 75 per cent unless berths can be provided
37 very cheaply. This can only be a rule of thumb, yet i t i s worth noting that on the basis of this c r i t e r i o n the four major elevator terminals were
38 undoubtedly close to congestion during the study period.
The model was constructed by the B r i t i s h Columbia Research Council. 37
D. P. B e r t l i n , "Predictions for Port Planning", Dock and Harbour Authority, Vol. XLVII No. 553, (December 1966), p. 258.
38 See Chapter I I I . I t should be pointed out that the greater the
number of berths, the higher i s the u t i l i s a t i o n which can be achieved before a given l i m i t of acceptable delay i s reached. This means that a large port can sustain a higher throughput per berth than a small port at the same lev e l of congestion.

CHAPTER IV
THE MEASUREMENT OF PORT TIME AND VESSEL SIZE
The Choice of Variables
In order to investigate the relationship between the size of a
vessel and the time i t takes to load, i t i s necessary to choose variables
which r e f l e c t the desired information while not being distorted by extran
eous factors. This choice is constrained somewhat by the limitations i n
the accessible data, and the r e s u l t i n g selection may not be i d e a l .
For the size of vessels the net register tonnage was used, in the
form that i t appears i n Lloyd's Register for the ship i n question. As
has been pointed out previously, net register tonnage is a measure of the
cargo carrying volume measured in units of one hundred cubic feet. This
representation of size i s not without i t s disadvantages. F i r s t l y , different
nations have different formulas for calculating i t and the same ship may
be assigned different tonnages i n different countries; this i s a consequence
of the various allowances for the so-called "exempted spaces" such as crew's
quarters and engine room. Secondly, net register tonnage gives a false
picture of the size of open shelterdeck ships for technical reasons which
w i l l be enlarged upon in the ensuing section. Thirdly, although net
register tonnage bears a f a i r l y constant relationship to the deadweight
capacity for smaller ships, deadweight being approximately two and a half
times greater than net tonnage, this relationship i s dependent upon the
lines and layout of the ship; i t i s thus not always possible to estimate

- 7 5 -
the deadweight precisely i f given the net figure. Fourthly, the registered
tonnage is l i k e l y to be higher than average for general purpose bulk car
r i e r s which have water b a l l a s t tanks available for the alternative task of
carrying cargo; these are not exempted from measurement as they would be
i f they were f i t t e d with manholes only and could never be used to take
goods. Despite these objections, net register tonnage is the most con
venient measure of size because i t gives an idea of the space available
for cargo, and i t i s readily available, whereas grain cubic capacity, for
instance, is not. Using deadweight as a yardstick i s not very s a t i s f a c
tory when dealing with grain.ships, since i t i s quite possible that a given
vessel w i l l not be able to load a f u l l cargo of l i g h t grain on account of
i t s bulky nature; the stowage factor of the cargo may exceed the ship's
natural r a t i o of cubic to deadweight. Even for cargoes whose stowage
factor i s within this l i m i t considerations of safe trim, s t a b i l i t y or
compliance with the Grain Regulations may l i m i t the t o t a l tonnage taken
aboard.
The impact of the t h i r d objection i s somewhat limited i n this par
t i c u l a r study. It is a c h a r a c t e r i s t i c of most of the sample vessels that
they take on a load which closely approximates thei r deadweight capacity;
i t i s thus possible to consider the t o t a l load as a proxy variable for
deadweight and to treat i t as such. In f a c t , of course, t o t a l load is
l i k e l y to be a much more useful variable i n i t s own r i g h t . Although the
proportion of p a r t i a l cargoes is small, a notable exception has been the
good ship " S i g s i l v e r " whose deadweight capacity i s 105,000 tons of which
only 83,000 tons could be loaded in Vancouver because of i n s u f f i c i e n t
- 76 -
draught i n F i r s t Narrows.''" Such cases as this are fortunately rare.
The time spent loading i s measured i n days, and the observations
have a l l been rounded upwards to the nearest day; for example, even though
a vessel may only load for a few hours, that i s counted as a whole day.
This i s a l i m i t a t i o n of the primary data and causes the results to be
coarsened s l i g h t l y . The consistent rounding upward of the loading time
causes the loading rate to be generally understated; moreover, i t i s
l i k e l y that the loading rate w i l l be more understated for certain sizes
of ships, although i t i s not r e a l l y possible to identify these size ranges.
This i s best i l l u s t r a t e d by a simple example. Suppose that the limitations
of a certain set of shore based handling gear r e s t r i c t the maximum loading
rate to about 4,000 tons per day, then any ship loading four thousand tons
or a multiple thereof w i l l f u l l y u t i l i s e a whole number of working days--
any ship however, whose load f a l l s between two of these multiples w i l l take
up only a portion of a day which i s nevertheless recorded as a f u l l day.
In this way, certain loading rates—expressed i n tons per day—are under
stated, and this deviation i s dependent on the t o t a l load.
Loading rates are measured i n tons per day, since this removes any
reference to the t o t a l amount taken on board—with the exception of the
perturbation just mentioned. A l l cargo sizes are expressed in short tons
weight.
The Types of Vessel Involved
If the nature of the loading process i s to be understood, i t i s
News item i n The Province, 30th October 1968.

- 77 -
necessary to form some impression of the physical features of the vessels
being loaded. Factors such as the number of holds, the dimensions of the
hatchways, access to various parts of the cargo space and other structural
considerations w i l l affect the maximum loading rate attainable. It i s
obviously not feasible to examine in d e t a i l each ship i n the sample; how
ever, even though individual vessels have their p e c u l i a r i t i e s and idiosyn-
cracies, i t i s practicable to separate the vessels at least into their
major c l a s s i f i c a t i o n s and to outline the features of each.
One of the most s t r i k i n g changes to affect the shipping industry
i n recent times has been the substantial increase in the size of vessels,
which has been dealt with b r i e f l y i n the preceding chapter. An analysis
of the grain ships involved in this study reveals that this growth has not
passed Vancouver by. The change in the average size of ships taking on
grain cargoes i s represented i n Table 4-1, Between 1964 and 1967 the
average size increased from 6,524 n.r.t. to 7,600 n.r.t.; however, there
was a decline i n 1967/68 to 6,932 n.r.t.
The d i s t r i b u t i o n of ship sizes for the various years i s exhibited
i n Table 4-3. The increasing range of ship sizes i n later years is notice
able; whereas the modal value remains around 6,000 n.r.t., the t a i l of the
d i s t r i b u t i o n lengthens markedly. The presence of certain favoured ship
sizes i s evident, p a r t i c u l a r l y around s i x thousand and nine or ten thousand
net register tons (approximately t h i r t y thousand tons deadweight). The
large number of ships i n the 2,000 n.r.t. range which appear in the later
years i s due en t i r e l y to small tramps i n the Russian trade. For comparative
purposes, these distr i b u t i o n s are exhibited in percentage terms i n Figures
4-1, 4-2, 4-3 and 4-4. These figures document very conclusively the decline

- 78 -
TABLE 4-1
CHANGES IN THE AVERAGE SIZE OF GRAIN SHIPS LOADING
MORE THAN 5,000 TONS, 1964-1968
Year Average Size Standard Deviation Net Register Tons
1964-65 6,524 1,795 1965-66 7,007 2,482 1966-67 7,600 5,094 1967-68 6,932 3,331
TABLE 4-2
AVERAGE SIZE OF VESSELS BY TYPE OF CARGO, 1964-1968
Type of Cargo Average Vessel Size - n.r . t . 1964/65 1965/66 1966/67 1967/68
Wheat 6,363 6,510 7,187 6,638 Mixed 7,295 8,501 7,862 7,544 Barley 6,361 7,593 7,545 7,445 Seeds 6,496 7,929 7,629 7,150
Overall Average 6,524 7,007 7,600 6,932
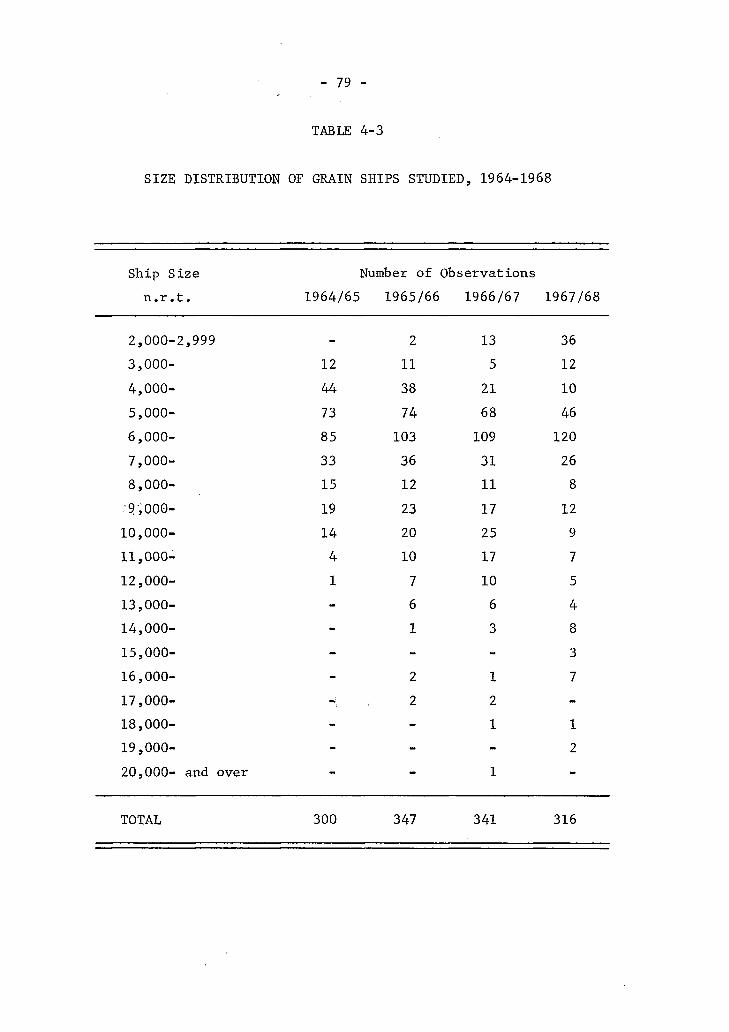
- 79 -
TABLE 4-3
SIZE DISTRIBUTION OF GRAIN SHIPS STUDIED, 1964-1968
Ship Size Number of Observations n.r.t. 1964/65 1965/66 1966/67 1967/68
2,000-2,999 2 13 36 3,000- 12 11 5 12 4,000- 44 38 21 10 5,000- 73 74 68 46 6,000- 85 103 109 120 7,000- 33 36 31 26 8,000- 15 12 11 8 9,000- 19 23 17 12 10,000- 14 20 25 9 11,000- 4 10 17 7 12,000- 1 7 10 5 13,000- 6 6 4 14,000- 1 3 8 15,000- - - 3 16,000- 2 1 7 17,000- 2 2 -18,000- - 1 1 19,000- - - 2 20,000- and over - 1 -
TOTAL 300 347 341 316
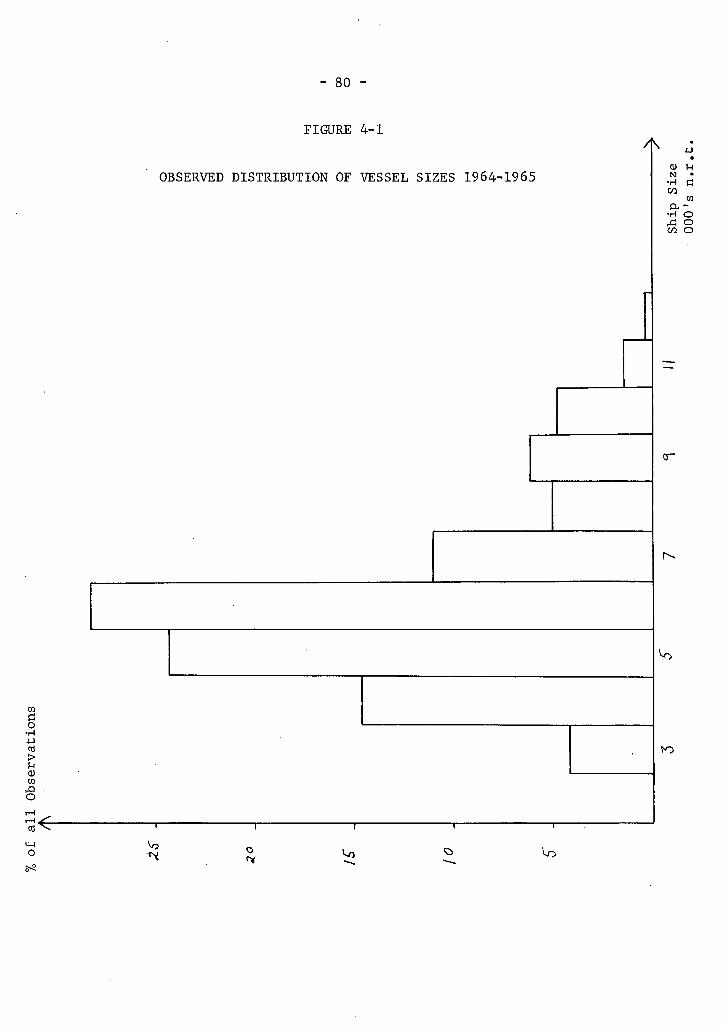
80
FIGURE 4-1
OBSERVED DISTRIBUTION OF VESSEL SIZES 1964-1965
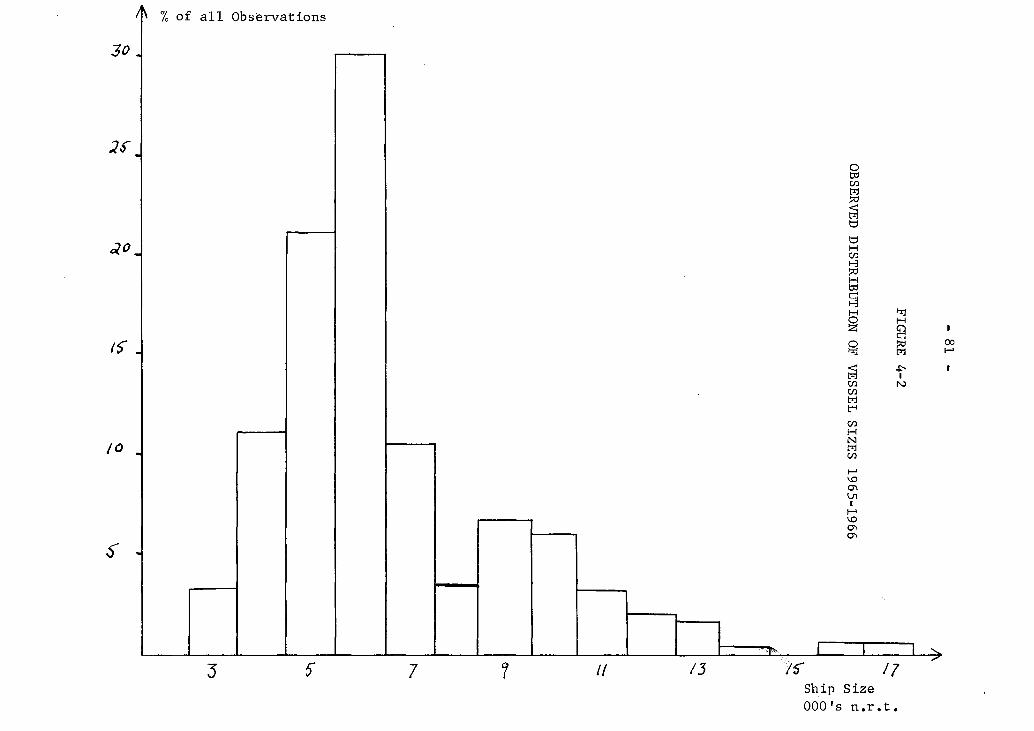
/\ % of a l l Observations
30
2£
if .
o td CO
< W H
H M CO H
» H W c=! H H O H S! s l O '—1 00
w -C-
1 t
CO ho CO td CO H N w CO
h-" VO O l Ol
1—1
VO
CTv
2 v T 5" 7 /3 75" //
Ship Size 000's n . r . t .
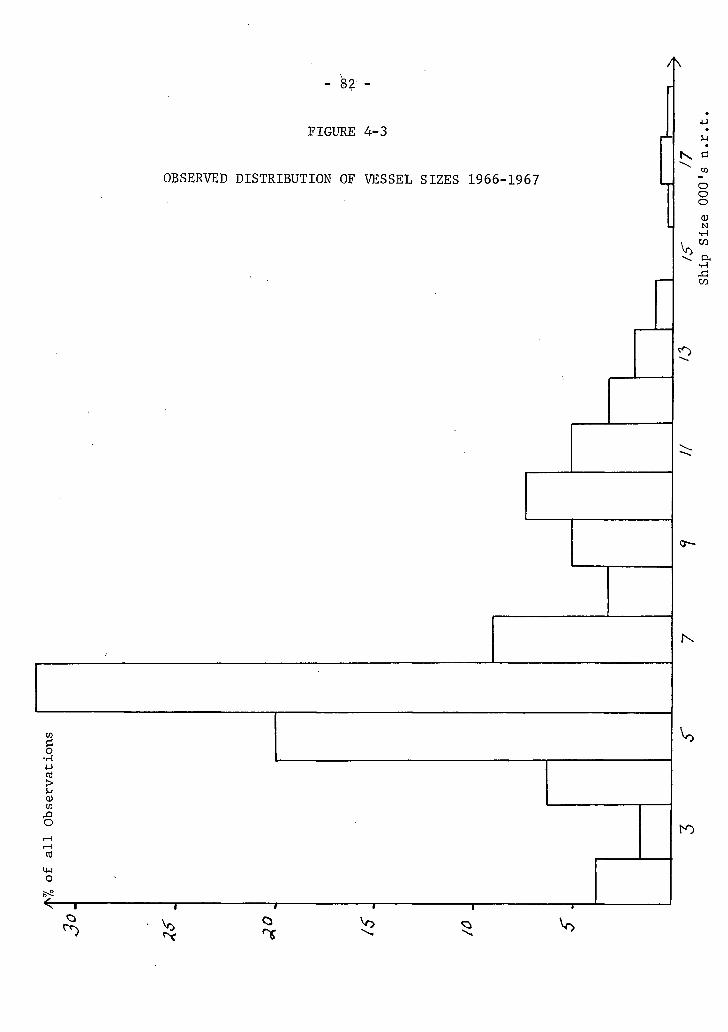
82
FIGURE 4-3 u K C
OBSERVED DISTRIBUTION OF VESSEL SIZES 1966-1967 o o o <v N
• H CO
<x •i-i
CO
C o •P > CD
o
o
Ci v.
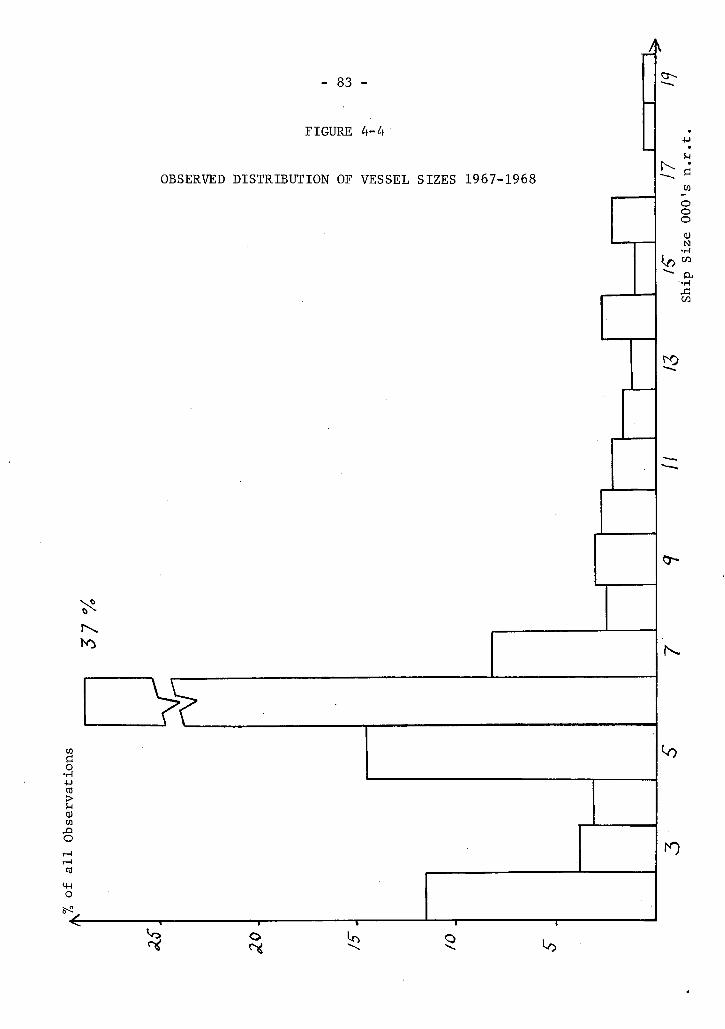
A 83
FIGURE 4-4
OBSERVED DISTRIBUTION OF VESSEL SIZES 1967-1968
to C o
> cu CD
O
O
^3 i o
—r-
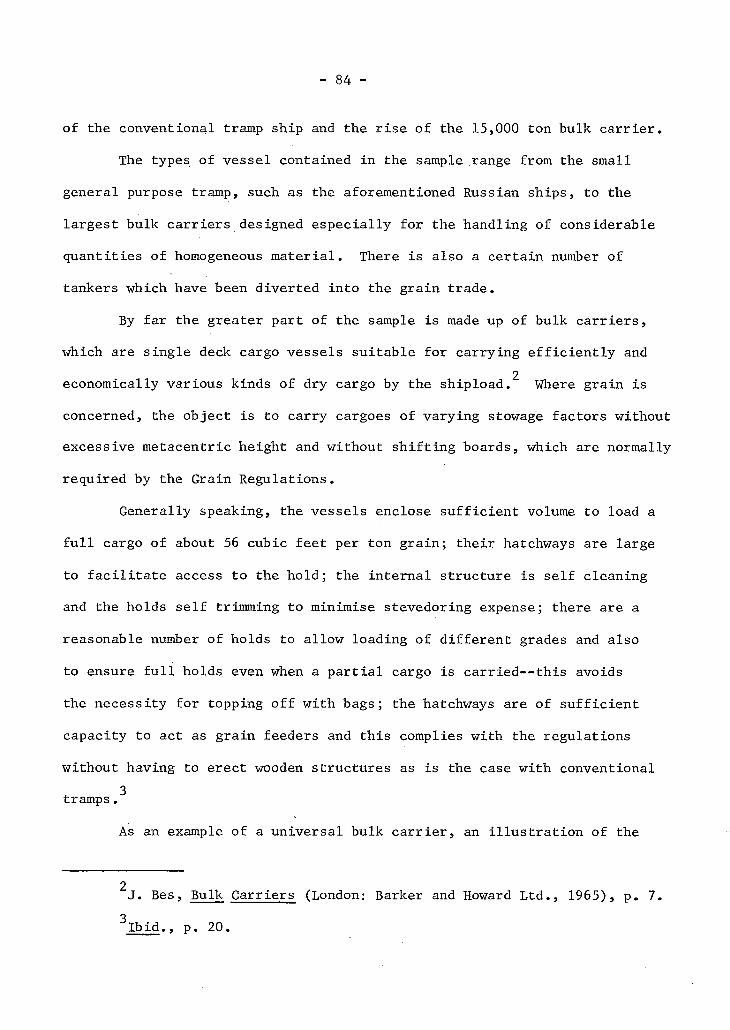
- 84 -
of the conventional tramp ship and the r i s e of the 15,000 ton bulk c a r r i e r .
The types of vessel contained in the sample range from the small
general purpose tramp, such as the aforementioned Russian ships, to the
largest bulk ca r r i e r s designed especially for the handling of considerable
quantities of homogeneous material. There i s also a certain number of
tankers which have been diverted into the grain trade.
By far the greater part of the sample i s made up of bulk c a r r i e r s ,
which are single deck cargo vessels suitable for carrying e f f i c i e n t l y and 2
economically various kinds of dry cargo by the shipload. Where grain i s
concerned, the object i s to carry cargoes of varying stowage factors without
excessive metacentric height and without s h i f t i n g boards, which are normally
required by the Grain Regulations.
Generally speaking, the vessels enclose s u f f i c i e n t volume to load a
f u l l cargo of about 56 cubic feet per ton grain; their hatchways are large
to f a c i l i t a t e access to the hold; the internal structure i s se l f cleaning
and the holds s e l f trimming to minimise stevedoring expense; there are a
reasonable number of holds to allow loading of different grades and also
to ensure f u l l holds even when a p a r t i a l cargo i s c a r r i e d — t h i s avoids
the necessity for topping off with bags; the hatchways are of s u f f i c i e n t
capacity to act as grain feeders and this complies with the regulations
without having to erect wooden structures as i s the case with conventional
tramps. 3
As an example of a universal bulk c a r r i e r , an i l l u s t r a t i o n of the
J. Bes, Bulk Carriers (London: Barker and Howard Ltd., 1965), p. 7. 3 I b i d . , p. 20.
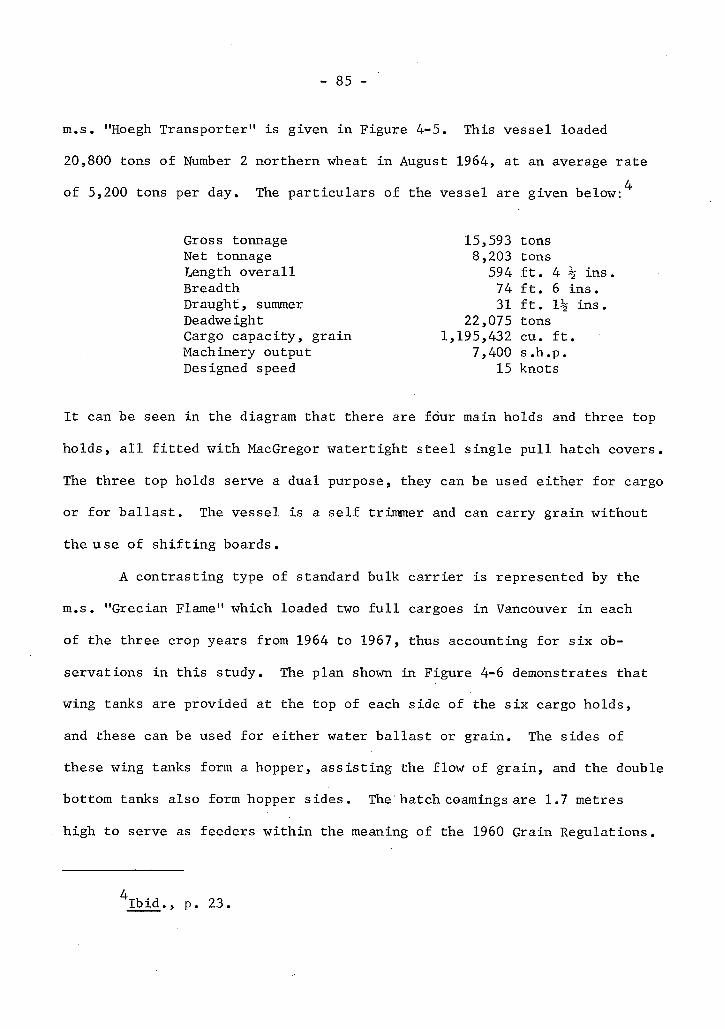
- 85 -
m.s. "Hoegh Transporter" i s given i n Figure 4-5. This vessel loaded
20,800 tons of Number 2 northern wheat i n August 1964, at an average rate 4
of 5,200 tons per day. The particulars of the vessel are given below:
Gross tonnage Net tonnage Length ov e r a l l Breadth Draught, summer Deadweight Cargo capacity, grain Machinery output Designed speed
15,593 tons 8,203 tons
594 f t . 4 \ ins, 74 f t . 6 i n s . 31 f t . 1% ins.
22,075 tons 1,195,432 cu. f t .
7,400 s.h.p. 15 knots
It can be seen i n the diagram that there are four main holds and three top
holds, a l l f i t t e d with MacGregor watertight steel single p u l l hatch covers.
The three top holds serve a dual purpose, they can be used either for cargo
or for b a l l a s t . The vessel i s a s e l f trimmer and can carry grain without
the use of s h i f t i n g boards.
A contrasting type of standard bulk c a r r i e r i s represented by the
m.s. "Grecian Flame" which loaded two f u l l cargoes i n Vancouver i n each
of the three crop years from 1964 to 1967, thus accounting for s i x ob
servations i n this study. The plan shown in Figure 4-6 demonstrates that
wing tanks are provided at the top of each side of the s i x cargo holds,
and these can be used for either water b a l l a s t or grain. The sides of
these wing tanks form a hopper, as s i s t i n g the flow of grain, and the double
bottom tanks also form hopper sides. The hatch coamings are 1.7 metres
high to serve as feeders within the meaning of the 1960 Grain Regulations.
4 I b i d . , p. 23.
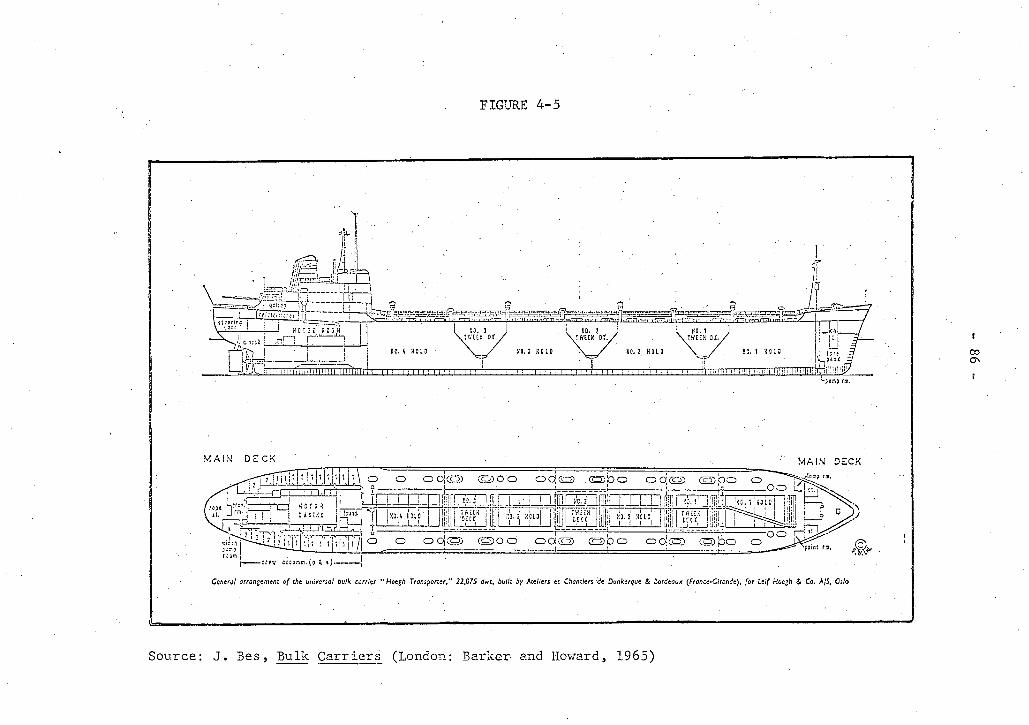
FIGURE 4-5
Source: J . Bes, Bulk Carriers (London: Barker and Howard, 1965)
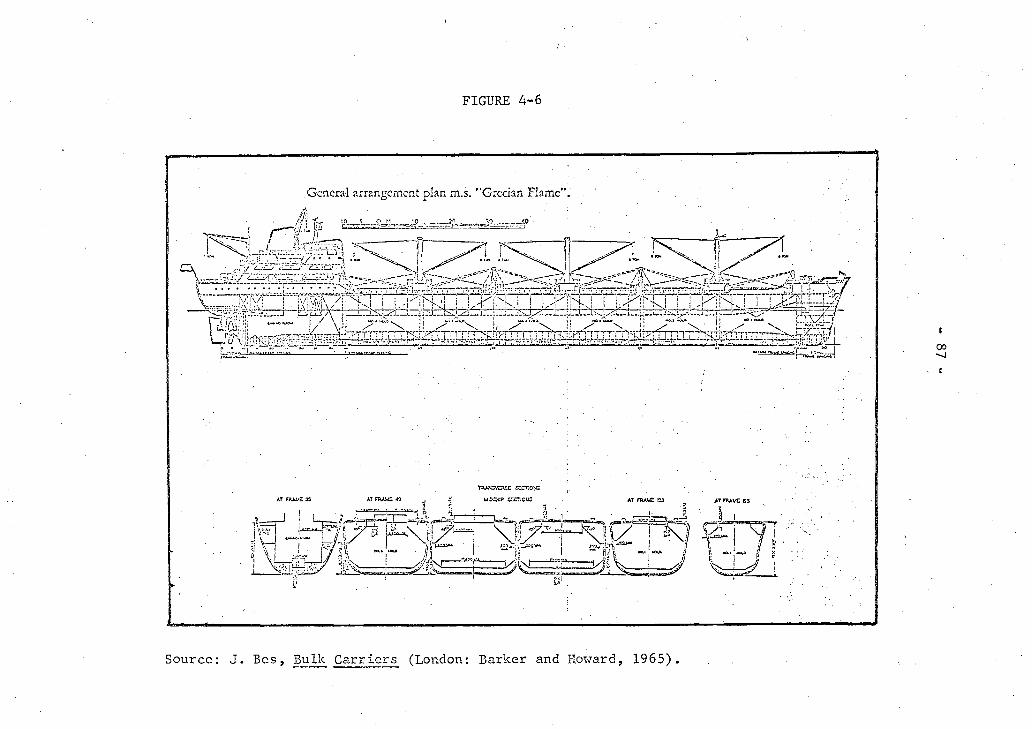
F I G U R E 4 - 6
Source: J. Bes, Bulk Carriers (London: Barker and Howard, 1 9 6 5 ) .
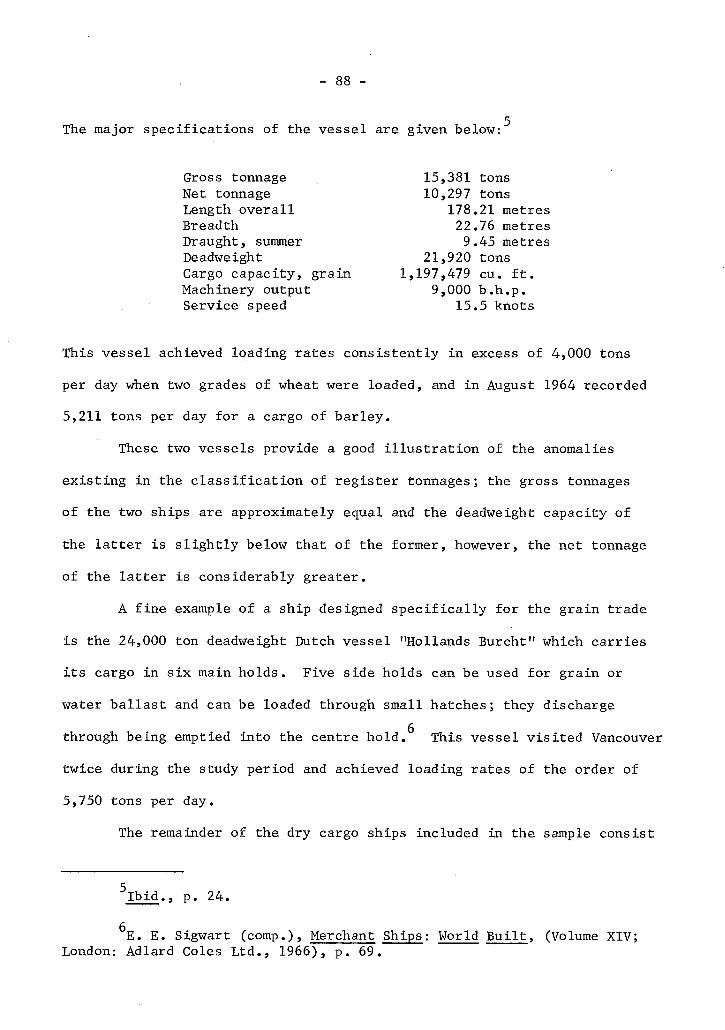
- 88 -
The major specifications of the vessel are given below:^
Gross tonnage 15,381 tons Net tonnage 10,297 tons Length o v e r a l l 178.21 metres Breadth 22.76 metres Draught, summer 9.45 metres Deadweight 21,920 tons Cargo capacity, grain 1,197,479 cu. f t . Machinery output 9,000 b.h.p. Service speed 15.5 knots
This vessel achieved loading rates consistently i n excess of 4,000 tons
per day when two grades of wheat were loaded, and i n August 1964 recorded
5,211 tons per day for a cargo of barley.
These two vessels provide a good i l l u s t r a t i o n of the anomalies
existing i n the c l a s s i f i c a t i o n of register tonnages; the gross tonnages
of the two ships are approximately equal and the deadweight capacity of
the l a t t e r i s s l i g h t l y below that of the former, however, the net tonnage
of the l a t t e r i s considerably greater.
A fine example of a ship designed s p e c i f i c a l l y for the grain trade
i s the 24,000 ton deadweight Dutch vessel "Hollands Burcht" which carries
i t s cargo i n s i x main holds. Five side holds can be used for grain or
water b a l l a s t and can be loaded through small hatches; they discharge
through being emptied into the centre hold.^ This vessel v i s i t e d Vancouver
twice during the study period and achieved loading rates of the order of
5,750 tons per day.
The remainder of the dry cargo ships included in the sample consist
5 l b i d . , p. 24.
E. E. Sigwart (comp.), Merchant Ships: World B u i l t , (Volume XIV; London: Adlard Coles Ltd., 1966), p. 69.
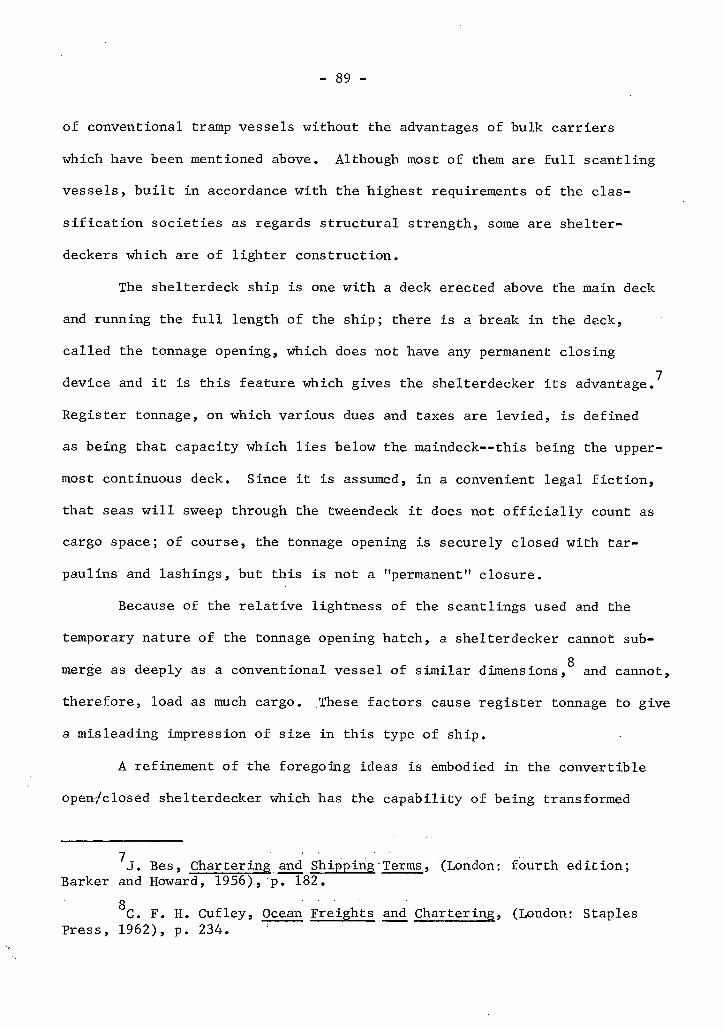
- 89 -
of conventional tramp vessels without the advantages of bulk carriers
which have been mentioned above. Although most of them are f u l l scantling
vessels, b u i l t in accordance with the highest requirements of the clas
s i f i c a t i o n societies as regards structural strength, some are shelter-
deckers which are of l i g h t e r construction.
The shelterdeck ship i s one with a deck erected above the main deck
and running the f u l l length of the ship; there i s a break in the deck,
called the tonnage opening, which does not have any permanent closing
device and i t i s this feature which gives the shelterdecker i t s advantage.^
Register tonnage, on which various dues and taxes are levied, i s defined
as being that capacity which l i e s below the maindeck—this being the upper
most continuous deck. Since i t i s assumed, i n a convenient legal f i c t i o n ,
that seas w i l l sweep through the tweendeck i t does not o f f i c i a l l y count as
cargo space; of course, the tonnage opening i s securely closed with tar
paulins and lashings, but this i s not a "permanent" closure.
Because of the r e l a t i v e lightness of the scantlings used and the
temporary nature of the tonnage opening hatch, a shelterdecker cannot sub-g
merge as deeply as a conventional vessel of similar dimensions, and cannot,
therefore, load as much cargo. These factors cause register tonnage to give
a misleading impression of size in this type of ship.
A refinement of the foregoing ideas i s embodied in the convertible
open-/closed shelterdecker which has the capability of being transformed
J . Bes, Chartering and Shipping Terms, (London: fourth e d i t i o n ; Barker and Howard, 1956), p. 182.
g C. F. H. Cufley, Ocean Freights and Chartering, (London: Staples
Press, 1962), p. 234.
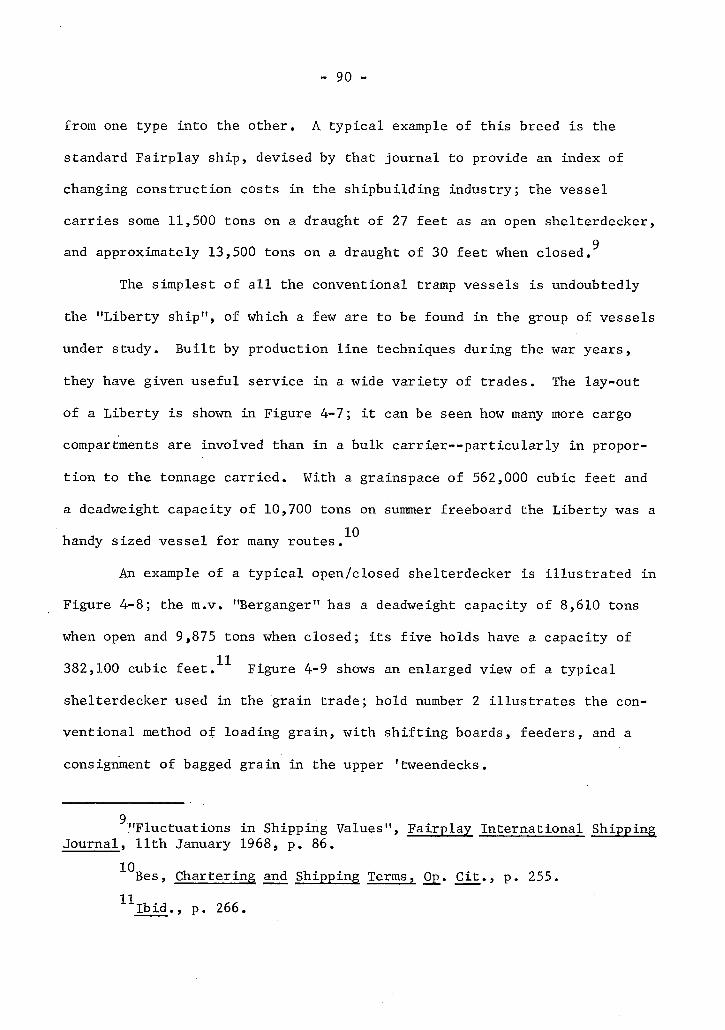
- 90 -
from one type into the other. A t y p i c a l example of this breed i s the
standard Fairplay ship, devised by that journal to provide an index of
changing construction costs in the shipbuilding industry; the vessel
carries some 11,500 tons on a draught of 27 feet as an open shelterdecker, 9
and approximately 13,500 tons on a draught of 30 feet when closed.
The simplest of a l l the conventional tramp vessels is undoubtedly
the "Liberty ship", of which a few are to be found in the group of vessels
under study. B u i l t by production l i n e techniques during the war years,
they have given useful service i n a wide variety of trades. The lay-out
of a Liberty i s shown i n Figure 4-7; i t can be seen how many more cargo
compartments are involved than in a bulk c a r r i e r — p a r t i c u l a r l y i n propor
t i o n to the tonnage carried. With a grainspace of 562,000 cubic feet and
a deadweight capacity of 10,700 tons on summer freeboard the Liberty was a
handy sized vessel for many r o u t e s . ^
An example of a t y p i c a l open/closed shelterdecker i s i l l u s t r a t e d i n
Figure 4-8; the m.v. "Berganger" has a deadweight capacity of 8,610 tons
when open and 9,875 tons when closed; i t s f i v e holds have a capacity of
382,100 cubic feet.''"''' Figure 4-9 shows an enlarged view of a t y p i c a l
shelterdecker used in the grain trade; hold number 2 i l l u s t r a t e s the con
ventional method of loading grain, with s h i f t i n g boards, feeders, and a
consignment of bagged grain in the upper 'tweendecks.
9 "Fluctuations i n Shipping Values", Fairplay International Shipping
Journal, 11th January 1968, p. 86. "^Bes, Chartering and Shipping Terms, Op. C i t . , p. 255. 1 1 I b i d . , p. 266.
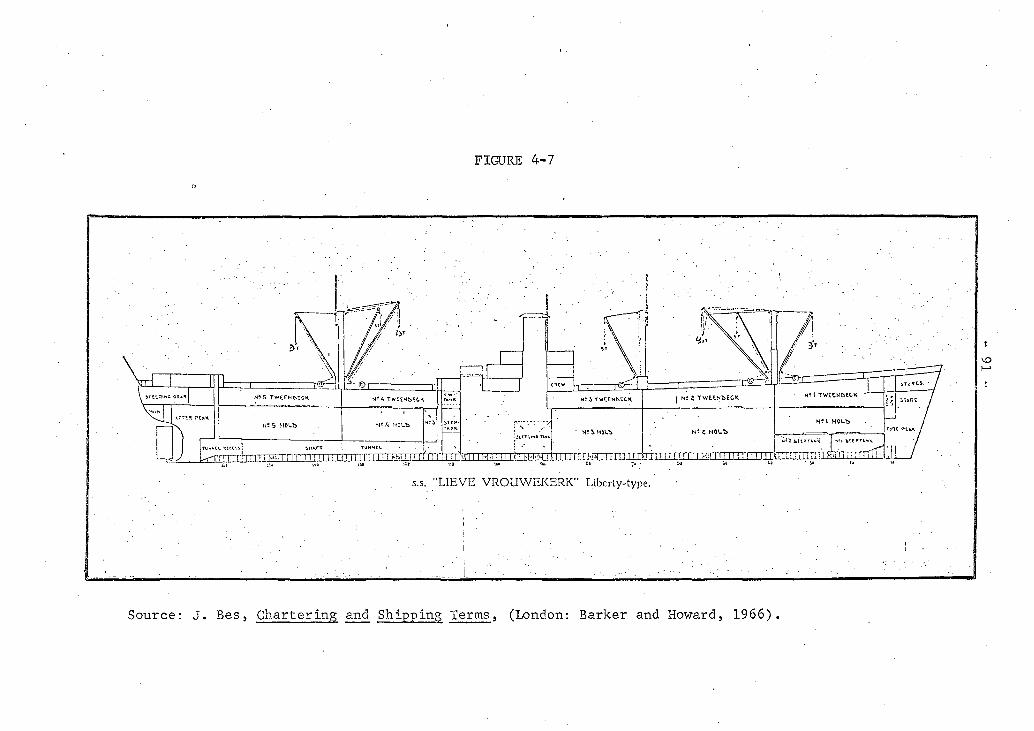
FIGURE 4 - 7
Source: J . Bes, Chartering and Shipping Terms, (London: Barker and Howard, 1966).
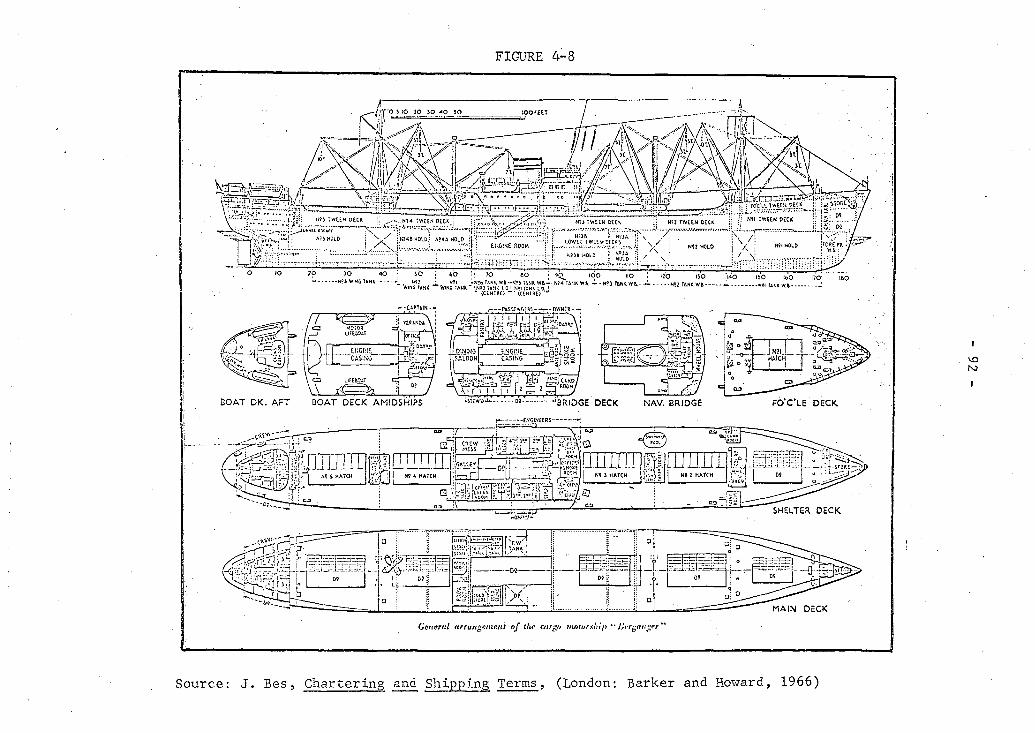
FIGURE 4-8
Source: J. Bes, Chartering and Shipping Terms. (London: Barker and Howard, 1966)

FIGURE 4-9
TYPICAL SHELTERDECKER WITH METHOD OF STOWING GRAIN ILLUSTRATED
Source: Canadian Department of Agriculture.
- 94 -
The size of the hatchways i s naturally one determinant of the ease
and speed of loading. Most tramps have f i v e holds with an equal number of
hatchways, each about 25 feet wide. Although each of the hatches could be
the same length, i t i s unusual; generally two of the hatches tend to be about 12
30 feet long with between 35 and 40 feet for each of the remaining three.
A very small proportion of the sample i s made up of tankers which
have come into the grain trade, although the heyday of the tanker as a
carr i e r of grain occurred before the commencement of our study period.
Thanks to the semi-liquid behaviour of granular materials, the stowage of
grain i n the tanks of such a ship i s a practicable proposition, even though
loading and discharge usually take more time than for a dry bulk c a r r i e r .
The cleaning and f i t t i n g of the vessel is f a i r l y easy, but i t does have a
more r e s t r i c t e d market since the United Kingdom does not accept grain car
goes in tankers and some other countries only accept tanker transport for
feed grains.
The fundamentals of tanker design are dictated by the behaviour of
the li q u i d s they carry when subjected to violent motion in a l l dimensions;
because of a li q u i d ' s small or usually non-existent angle of repose and i t s
propensity to resonant surging when disturbed rhythmically, tankers are
divided by o i l - t i g h t bulkheads into many different compartments—the number 14
being greatly i n excess of the number of holds i n a dry cargo vessel.
The delays inherent i n changing the loading equipment from one to another 12
Cufley, Op. C i t . , p. 241. 13 C. Alexandersson and G. Norstrom, World Shipping, (New York: John
Wiley and Sons, 1963), p. 103. 14 Cufley, 0p_. CjLt., p. 264.
are thus mu l t i p l i e d . In addition, access to the tanks i s by small openings
only, which do not allow the same room to manoeuvre as do large hatchways.
The Types of Cargo Involved
When gathered from the primary source,''""' the data were supposed to
include a l l grain cargoes of more than 5,000 tons loaded i n Vancouver during
the four crop years 1964 to 1968; however, on analysing the observations
i t was found that a small number of cargoes with a t o t a l weight of less
than 5,000 tons had been included. I t was not f e l t that they would d i s t o r t
the results unduly and so they were retained i n the analysis.
The term "grain" i s usually taken to include a l l cargoes such as wheat,
maize, oats, rye, barley, r i c e , pulses, and seeds; "heavy grain" means a l l
grain other than oats, barley and cotton seed."^ For our particular purpose,
the cargoes shipped f a l l neatly into four categories.
There are:
1. Wheat cargoes involving only one grade or at the most two d i f ferent grades of wheat.
2. "Mixed" cargoes involving three or more different grades of wheat, with possibly small quantities of other grain i n addition.
3. Barley cargoes, which are l i g h t e r than the others for a given volume.
4. Cargoes of oilseeds, such as rape, f l a x and mustard seeds. These cargoes sometimes include quantities of other grain such as rye, oats or buckwheat.
The unpublished records of the B r i t i s h Columbia Grain Shippers 1
Clearance Association. 16 George J. Bonwick and E. C. Steer, Ship's Business, ( f i f t h e d i t i o n ;
London: The Maritime Press, 1963), p. 124.

- 96 -
The d i s t r i b u t i o n of the t o t a l number of observed cargoes among these
commodity types is shown graphically i n Figures 4-10, 4-11, 4-12, and 4-13
for the four crop years analysed. Wheat is the dominating influence,
accounting for some 60 per cent of a l l tonnage shipped i n each of the four
years; mixed cargoes are next in importance, approximately equalling seeds
with about 15 per cent each and barley makes up the remainder.
The density of the cargo obviously has a bearing on the loading
c h a r a c t e r i s t i c s , since a greater bulk of the l i g h t e r commodities must be
moved to make up a given weight. An idea of density i s given by the
stowage factor of the material in question, which is the amount of space,
i n cubic feet, occupied by one ton. For free flowing bulk cargoes, such as
grain, which are capable of being trimmed and l e v e l l e d , one can say that
the number of cubic feet required per ton i s equal to the stowage factor;
t h i s being the case since there i s no broken stowage and the grain f i l l s a l l 17
the i n t e r s t i c e s between the ship's frames. Densities of cereals vary to
some extent with the shipment area and the condition of the grain, particu
l a r l y i t s moisture content; however, an idea of stowage factors can be
obtained from Table 4-4, i n which i t can be seen that wheat i s the heaviest
grain and an equivalent amount of clipped oats, for example, w i l l occupy
approximately half as much space again.
The actual d i s t r i b u t i o n of load sizes observed in the sample is
presented in Table 4-'5. For each crop year, the range of observations i s
considerable and i t is noticeable that the dispersion increases with the
passage of time. The largest cargo loaded in 1964/65 amounted to some
Cufley, Op_. C i t . , p. 401.
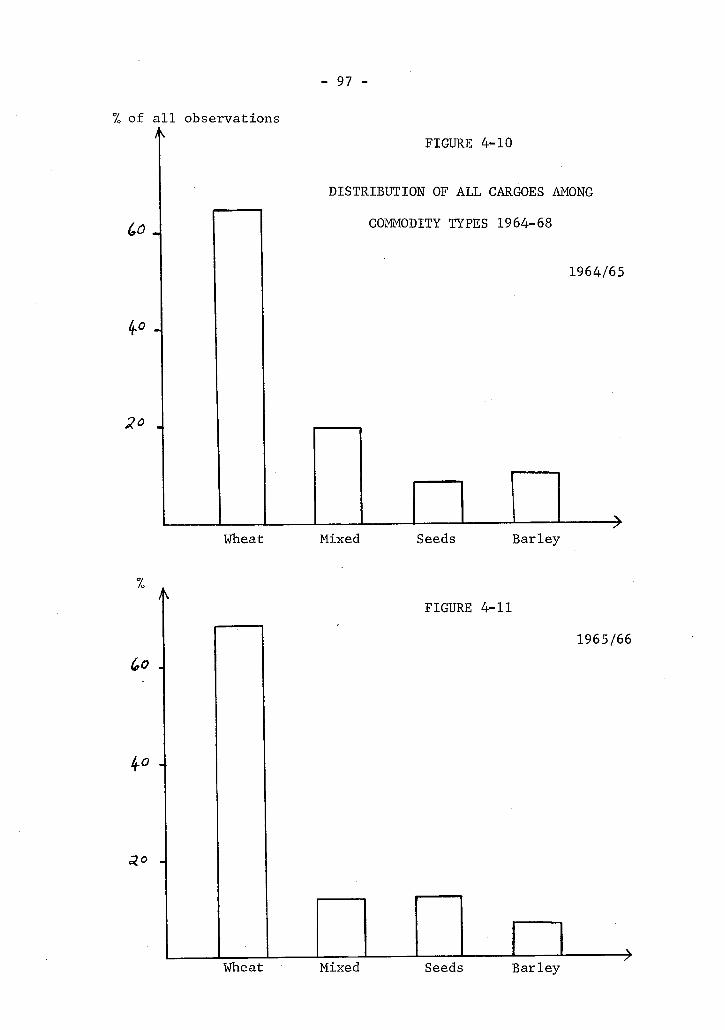
- 97 -
% of a l l observations
Wheat
FIGURE 4-10
DISTRIBUTION OF ALL CARGOES AMONG
COMMODITY TYPES 1964-68
1964/65
Mixed Seeds Barl e y
FIGURE 4-11
1965/66
Lo 1
3.° A
Wheat Mixed 1 1 1 >
Seeds Bar l e y
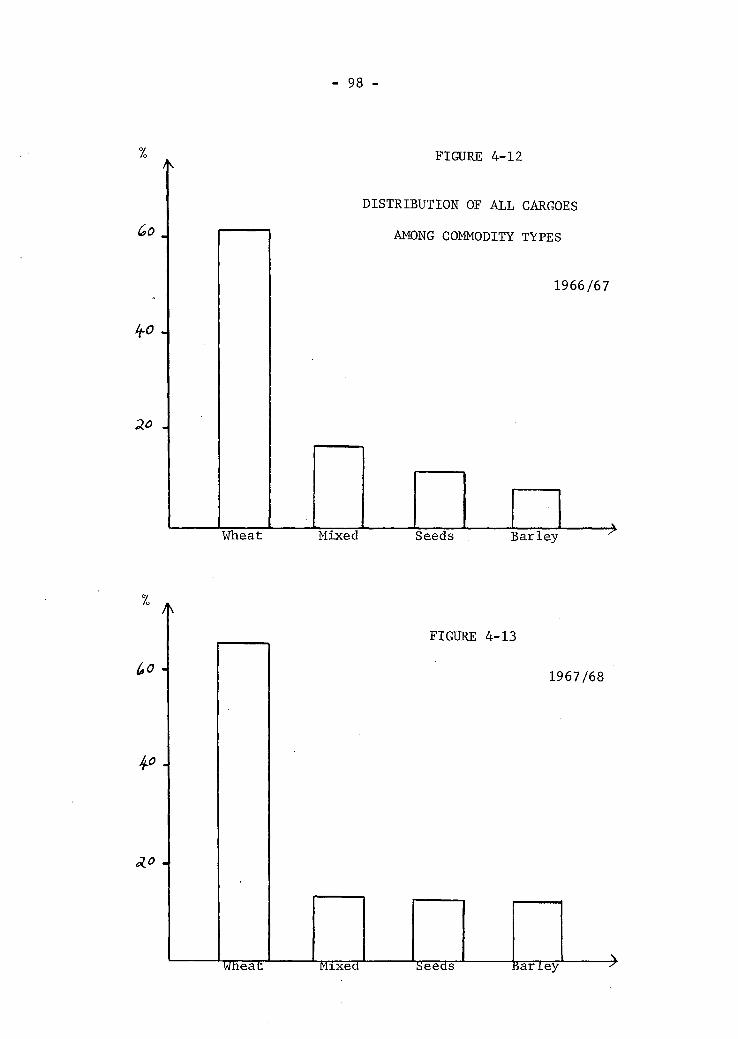
- 98 -
FIGURE 4-12
Co .
DISTRIBUTION OF ALL CARGOES
AMONG COMMODITY TYPES
ItO .
1966/67
2.0 .
Wheat Mixed Seeds Barley
FIGURE 4-13
1967/68
4fi
Wheat Mixed Seeds "iarley

- 99 -
TABLE 4-4
STOWAGE FACTORS FOR DIFFERENT TYPES OF GRAIN
Type of Grain STOWAGE FACTOR IN BULK CUBIC FEET PER TON
Wheat 45 - 48
Rye 48 - 50
Rapeseed 51 - 53
Flaxseed 54 - 57
Barley 50 - 59
Buckwheat 56 - 59
Oats (clipped) 60 - 65
Oats (undipped) 70 - 72
Source: Compiled from The Bulk Cargoes (London: Coram, 1954) and C. F. H. Cufley, Ocean Freights and Chartering, (London: Staples Press, 1962).
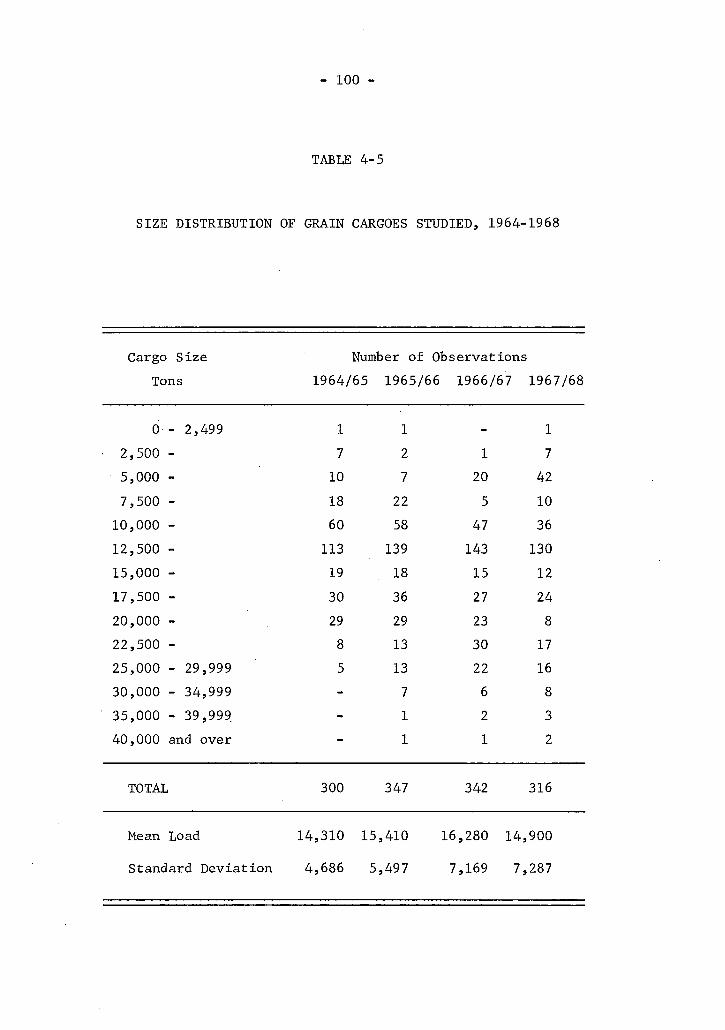
- 100 -
TABLE 4-5
SIZE DISTRIBUTION OF GRAIN CARGOES STUDIED, 1964-1968
Cargo Size Number of Observations Tons 1964/65 1965/66 1966/67 1967/68
0 - 2,499 1 1 _ 1 2,500 - 7 2 1 7 5,000 - 10 7 20 42 7,500 - 18 22 5 10 10,000 - 60 58 47 36 12,500 - 113 139 143 130 15,000 - 19 18 15 12 17,500 - 30 36 27 24 20,000 - 29 29 23 8 22,500 - 8 13 30 17 25,000 - 29,999 5 13 22 16 30,000 - 34,999 - 7 6 8 35,000 - 39,999 - 1 2 3 40,000 and over - 1 1 2
TOTAL 300 347 342 316
Mean Load 14,310 15,410 16,280 14,900
Standard Deviation 4,686 5,497 7,169 7,287
- 101 -
29,000 tons, whereas the 1 argest cargo loaded in 1967/68 was 84,000 tons
aboard the " S i g s i l v e r " . The modal tonnage has remained the same at about
13,750 tons.
It i s interesting and possibly revealing to break down the overall
average cargo size into the averages for each commodity type i n order to
establish i f there are any s i g n i f i c a n t differences. This is done i n
Table 4-6.
The average load increased steadily and substantially over the
f i r s t three years, from 14,310 tons to 16,280 tons, but declined i n
1967/68 to 14,900 tons. This seems attributable to a general decrease
in the size of a l l commodity loads, rather than to any one par t i c u l a r
product. Within the commodity groupings, there seems to be l i t t l e consis
tent change and the load sizes fluctuate somewhat from year to year, as
do the r e l a t i v e rankings of the types of load.
The D i s t r i b u t i o n of Loading Rates
The loading rates observed for the sample of ships under study
ranged from approximately 900 tons per day for the slowest to around
9,500 tons per day for the fastest. The d i s t r i b u t i o n of loading rates
for a l l types of grain i n the four crop years i s contained in Table 4-7
Expressed in percentage terms, these observations are represented
in Figures 4-14, 4-15, 4-16 and 4-17. There is a marked tendency for the
number of higher loading rates to increase i n the lat e r years, and the
modal rate moved up from 2,500 tons per day to 3,500 tons per day in
1967/68. The o v e r a l l average loading rate has i n fact improved substantially
with the passage of time; between 1964 and 1968 there was an improvement of
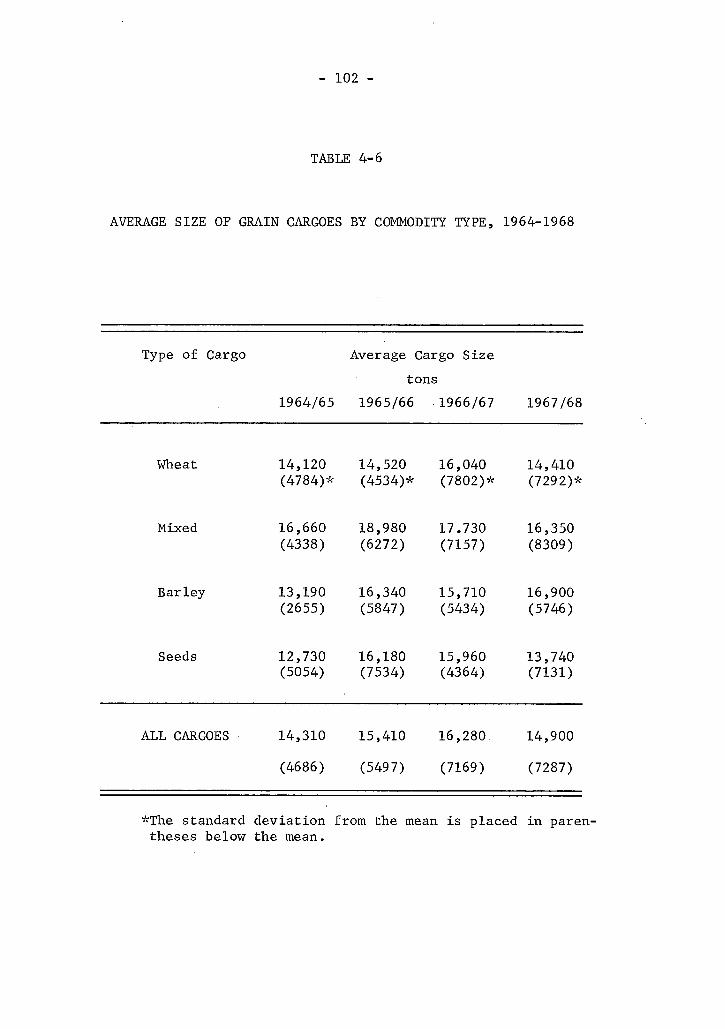
- 102 -
TABLE 4-6
AVERAGE SIZE OF GRAIN CARGOES BY COMMODITY TYPE, 1964-1968
Type of Cargo Average Cargo Size tons
1964/65 1965/66 1966/67 1967/68
Wheat 14,120 (4784)*
14,520 (4534)*
16,040 (7802)*
14,410 (7292)*
Mixed 16,660 (4338)
18,980 (6272)
17.730 (7157)
16,350 (8309)
Barley 13,190 (2655)
16,340 (5847)
15,710 (5434)
16,900 (5746)
Seeds 12,730 (5054)
16,180 (7534)
15,960 (4364)
13,740 (7131)
ALL CARGOES 14,310 15,410 16,280 14,900
(4686) (5497) (7169) (7287)
*The standard deviation from the mean is placed i n parentheses below the mean.
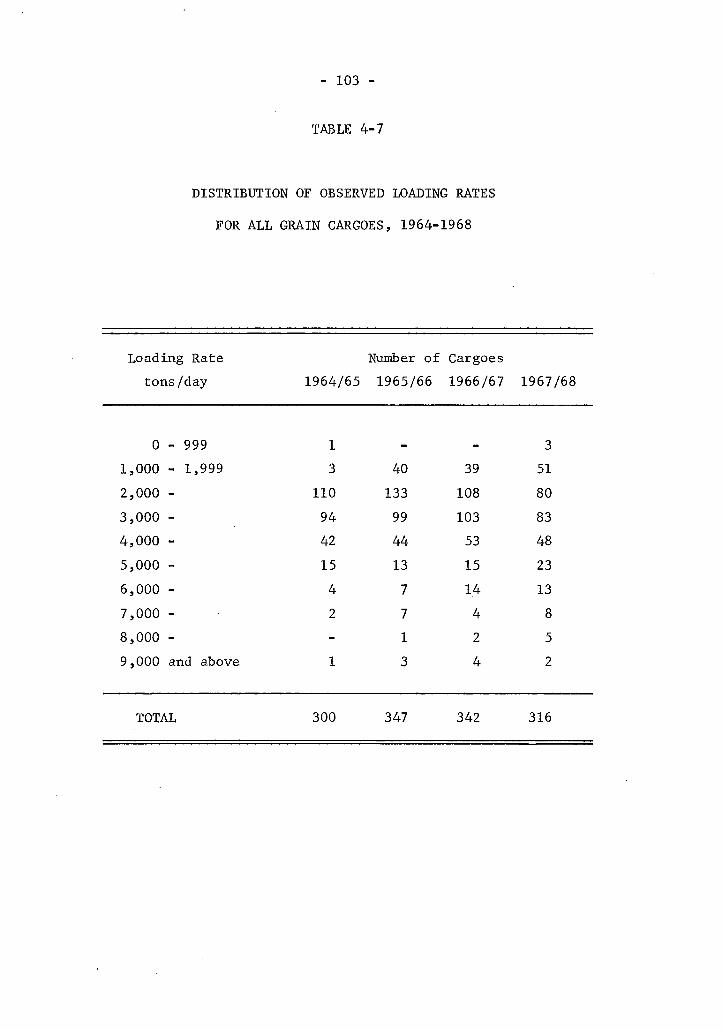
- 103 -
TABLE 4-7
DISTRIBUTION OF OBSERVED LOADING RATES
FOR ALL GRAIN CARGOES, 1964-1968
Loading Rate Number of Cargoes tons/day 1964/65 1965/66 1966/67 1967/68
0 - 999 1 - - 3 1,000 - 1,999 3 40 39 51 2,000 - 110 133 108 80 3,000 - 94 99 103 83 4,000 - 42 44 53 48 5,000 - 15 13 15 23 6,000 - 4 7 14 13 7,000 - 2 7 4 8 8,000 - - 1 2 5 9,000 and above 1 3 4 2
TOTAL 300 347 342 316
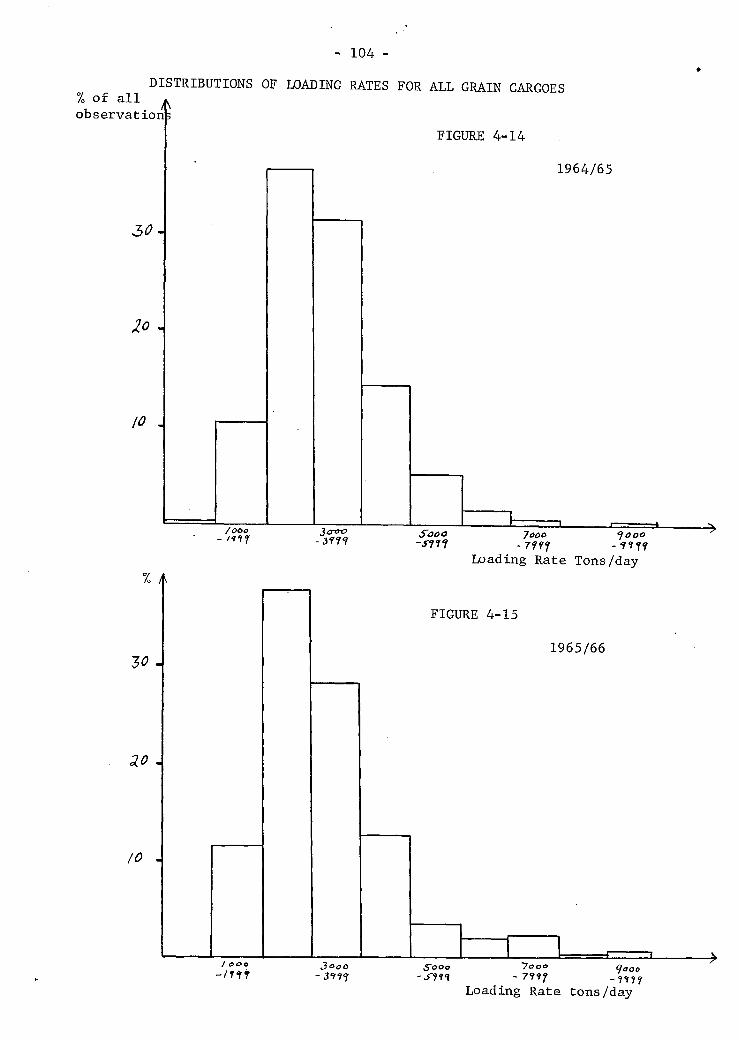
- 104 -
DISTRIBUTIONS OF LOADING RATES FOR ALL GRAIN CARGOES % of a l l observation^
FIGURE 4-14
30-
10 -
to .
1964/65
/OOO 1111 -if It
Sooo 7ooo loot) -Silt -7ff9 -1119
Loading Rate Tons/day
30 -
20 .
10 -
FIGURE 4-15
1965/66
/ OOe 3°oo - 3111
Sooo - S i l l
~7°o° ciaaa
~ 7<?,?? -1111 Loading Rate tons/day
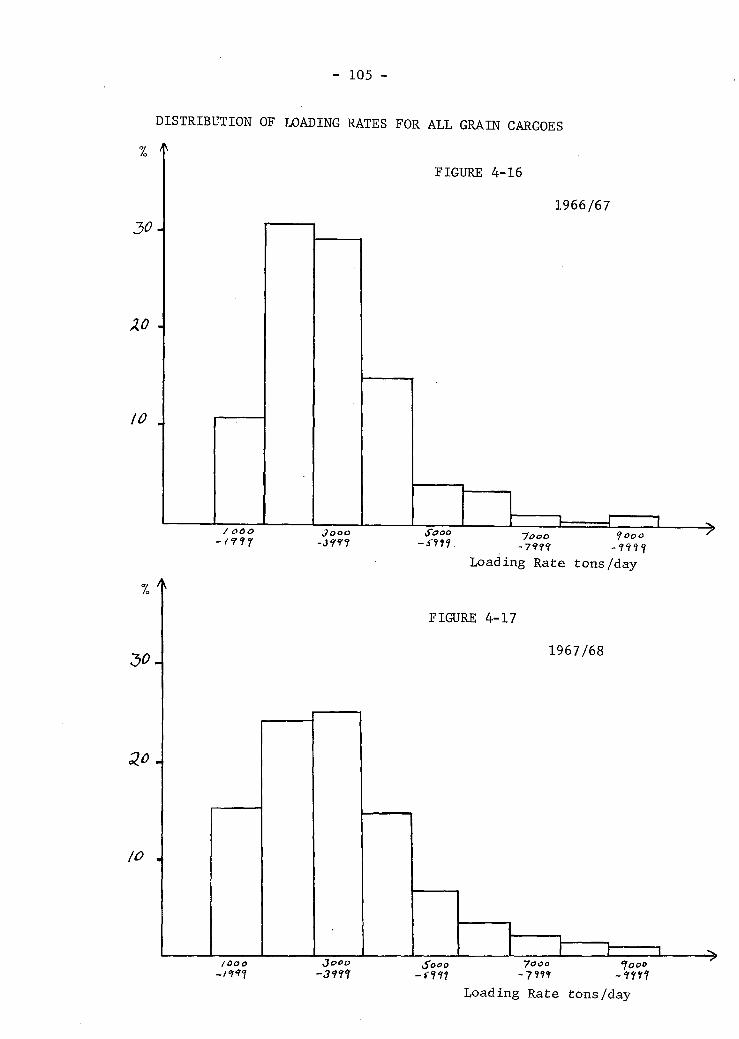
105
DISTRIBUTION OF LOADING RATES FOR ALL GRAIN CARGOES
30.
XO -
10 .
FIGURE 4-16
1966/67
1 / OOO
-nil Jooo -mi
Sooo - S i l l .
Jooo fooo -791° -1119
Loading Rate tons/day
30-
Zo.
io .
FIGURE 4-17
1967/68
/OOO -1111
Jooo -3111
Sooo - f i l l
yoo -7111
Loading Rate tons/day fooo

- 106 -
almost ten per cent, as shown i n Table 4*8.
TABLE 4-8
AVERAGE LOADING RATES FOR ALL GRAIN CARGOES STUDIED, 1964-1968
Crop Year Average Loading Rate tons per day
Standard D e v i a t i o n tons per day
1964/65 3,272 1,159
1965/66 3,306 1,400
1966-67 3,489 1,481
1967-68 3,592 1,636
I t i s a l s o n o t i c e a b l e that the standard d e v i a t i o n of the obser
v a t i o n s has been i n c r e a s i n g as the d i s t r i b u t i o n becomes l e s s peaked. The
s i z e of the standard d e v i a t i o n i t e s e l f i s s u f f i c i e n t to point up the ext
remes which are observed.
These o v e r a l l l o a d i n g r a t e s can be very misleading because the
d i f f e r e n c e s between commodity types is s u b s t a n t i a l . One or two grades of
wheat g e n e r a l l y provide no problem; when three or more grades of wheat are
invo l v e d there i s understandably a greater delay. Cargoes of assorted
o i l s e e d s are u s u a l l y made up of va r i o u s small batches which slow the loading
process c o n s i d e r a b l y ; b a r l e y i s a l i g h t e r cargo and so re q u i r e s more bulk
to be s h i f t e d f o r an equivalent load by weight. The average loading r a t e s
broken down by commodity type are shown i n Table 4-9. The d i f f e r e n c e
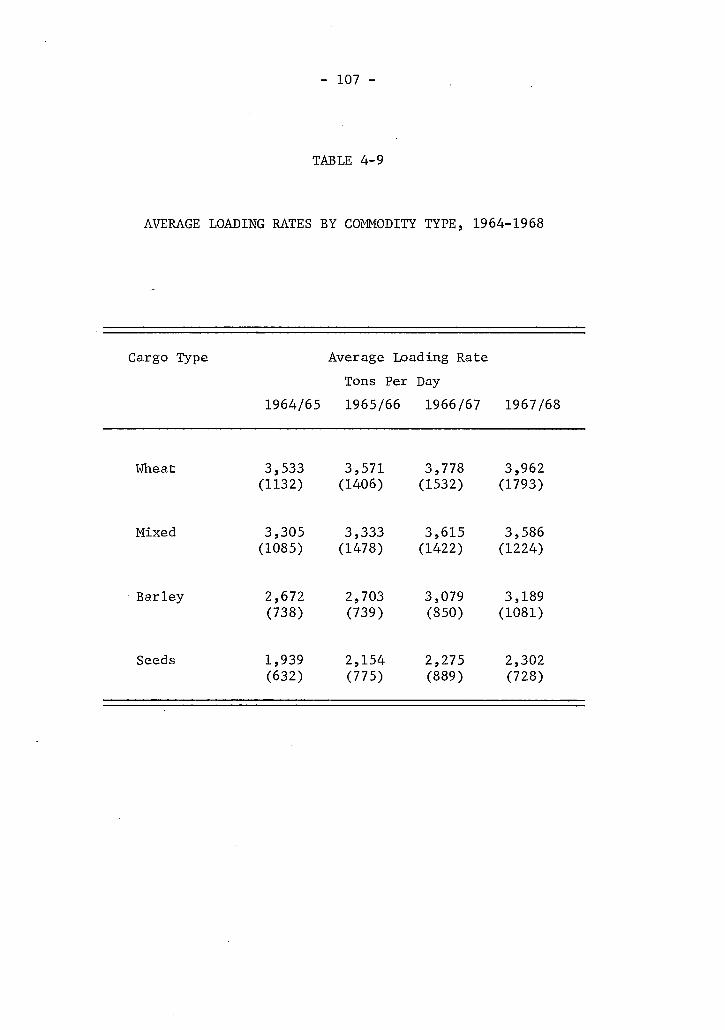
- 107 -
TABLE 4-9
AVERAGE LOADING RATES BY COMMODITY TYPE, 1964-1968
Cargo Type Average Loading Rate Tons Per Day
1964/65 1965/66 1966/67 1967/68
Wheat 3,533 (1132)
3,571 (1406)
3,778 (1532)
3,962 (1793)
Mixed 3,305 (1085)
3,333 (1478)
3,615 (1422)
3,586 (1224)
Barley 2,672 (738)
2,703 (739)
3,079 (850)
3,189 (1081)
Seeds 1,939 (632)
2,154 (775)
2,275 (889)
2,302 (728)
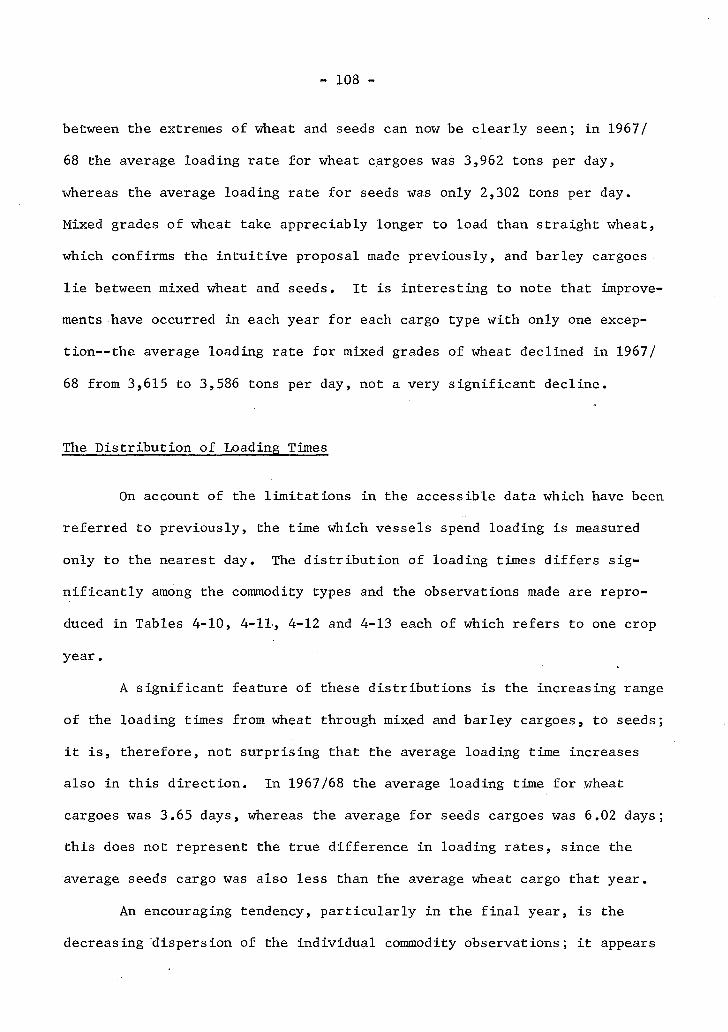
- 108 -
between the extremes of wheat and seeds can now be cl e a r l y seen; i n 1967/
68 the average loading rate for wheat cargoes was 3,962 tons per day,
whereas the average loading rate for seeds was only 2,302 tons per day.
Mixed grades of wheat take appreciably longer to load than straight wheat,
which confirms the i n t u i t i v e proposal made previously, and barley cargoes,
l i e between mixed wheat and seeds. I t i s interesting to note that improve
ments have occurred in each year for each cargo type with only one excep
t i o n — t h e average loading rate for mixed grades of wheat declined i n 1967/
68 from 3,615 to 3,586 tons per day, not a very s i g n i f i c a n t decline.
The D i s t r i b u t i o n of Loading Times
On account of the limitations i n the accessible data which have been
referred to previously, the time which vessels spend loading i s measured
only to the nearest day. The d i s t r i b u t i o n of loading times d i f f e r s s i g
n i f i c a n t l y among the commodity types and the observations made are repro
duced in Tables 4-10, 4-11-, 4-12 and 4-13 each of which refers to one crop
year.
A s i g n i f i c a n t feature of these distr i b u t i o n s i s the increasing range
of the loading times from wheat through mixed and barley cargoes, to seeds;
i t i s , therefore, not surprising that the average loading time increases
also in this d i r e c t i o n . In 1967/68 the average loading time for wheat
cargoes was 3.65 days, whereas the average for seeds cargoes was 6.02 days;
th i s does not represent the true difference i n loading rates, since the
average seeds cargo was also less than the average wheat cargo that year.
An encouraging tendency, p a r t i c u l a r l y i n the f i n a l year, i s the
decreasing dispersion of the individual commodity observations; i t appears
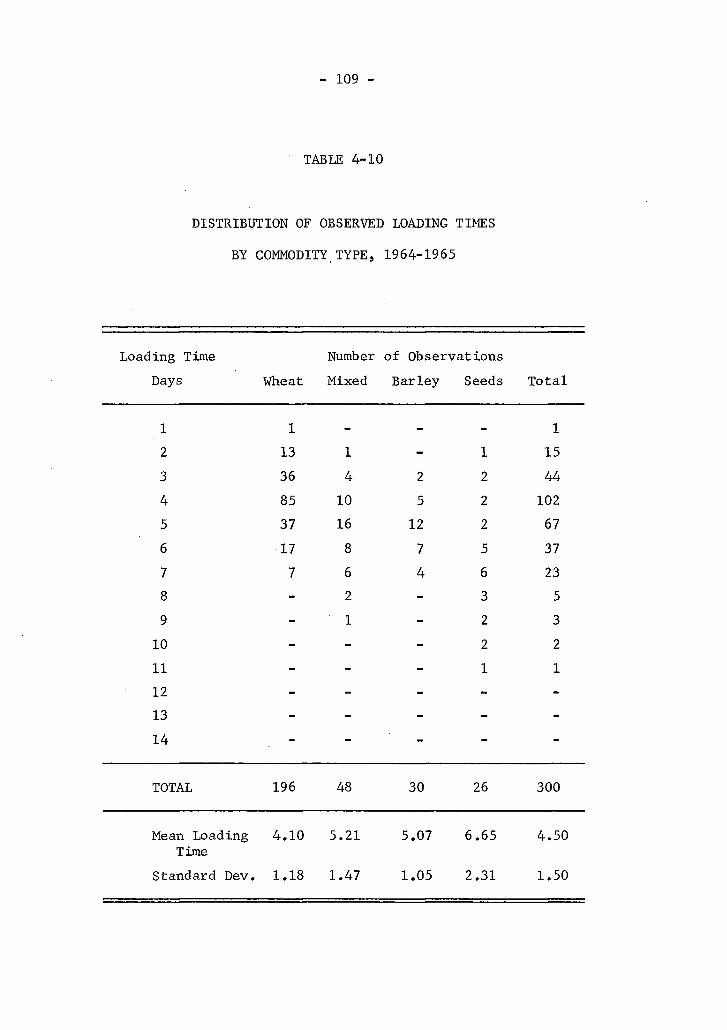
- 109 -
TABLE 4-10
DISTRIBUTION OF OBSERVED LOADING TIMES
BY COMMODITY, TYPE, 1964-1965
Loading Time Number of Observations Days Wheat Mixed Barley Seeds Total
1 1 - - - 1 2 13 1 - 1 15 3 36 4 2 2 44 4 85 10 5 2 102 5 37 16 12 2 67 6 17 8 7 5 37 7 7 6 4 6 23 8 - 2 - 3 5 9 - 1 - 2 3 10 - - 2 2 11 - _ 1 1 12 13 14
TOTAL 196 48 30 26 300
Mean Loading 4.10 5.21 5.07 6.65 4.50 Time
Standard Dev. 1.18 1.47 1.05 2.31 1.50

- 110 -
TABLE 4-11
DISTRIBUTION OF OBSERVED LOADING TIMES
BY COMMODITY TYPE, 1965-66
Loading Time Number of Observations Days Wheat Mixed Barley Seeds Total
1 - - - - -2 6 1 1 1 9 3 53 2 2 - 57 4 89 6 2 1 98 5 60 11 4 6 81 6 20 6 3 6 35 7 6 8 6 8 28 8 2 4 3 8 17 9 1 2 1 5 9 10 - 1 1 3 5 11 - 2 - 2 4 12 - - 1 2 3 13 - - - 1 1 14 - - - - -
TOTAL 237 43 24 43 347
Mean Loading Time 4.28 6.30 " 6.29 7.61 4.68
Standard Dev. 1.14 2.46 2.31 2.28 1.73
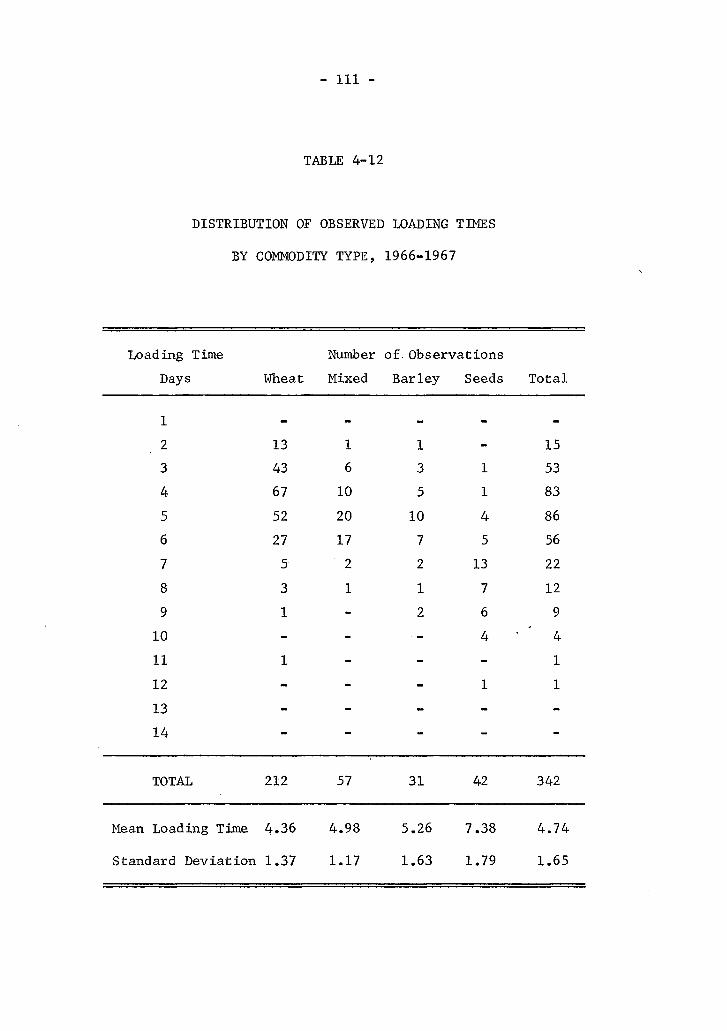
- I l l -
TABLE 4-12
DISTRIBUTION OF OBSERVED LOADING TIMES
BY COMMODITY TYPE, 1966-1967
Loading Time Number of Observations Days Wheat Mixed Barley Seeds Total
1 _ _ _ _ _
2 13 1 1 - 15 3 43 6 3 1 53 4 67 10 5 1 83 5 52 20 10 4 86 6 27 17 7 5 56 7 5 2 2 13 22 8 3 1 1 7 12 9 1 - 2 6 9 10 - - 4 ' " 4 11 1 - - - 1 12 - - - 1 1 13 - - - - -14 - - - - -
TOTAL 212 57 31 42 342
Mean Loading Time 4.36 4.98 5.26 7.38 4.74
Standard Deviation 1.37 1.17 1.63 1.79 1.65
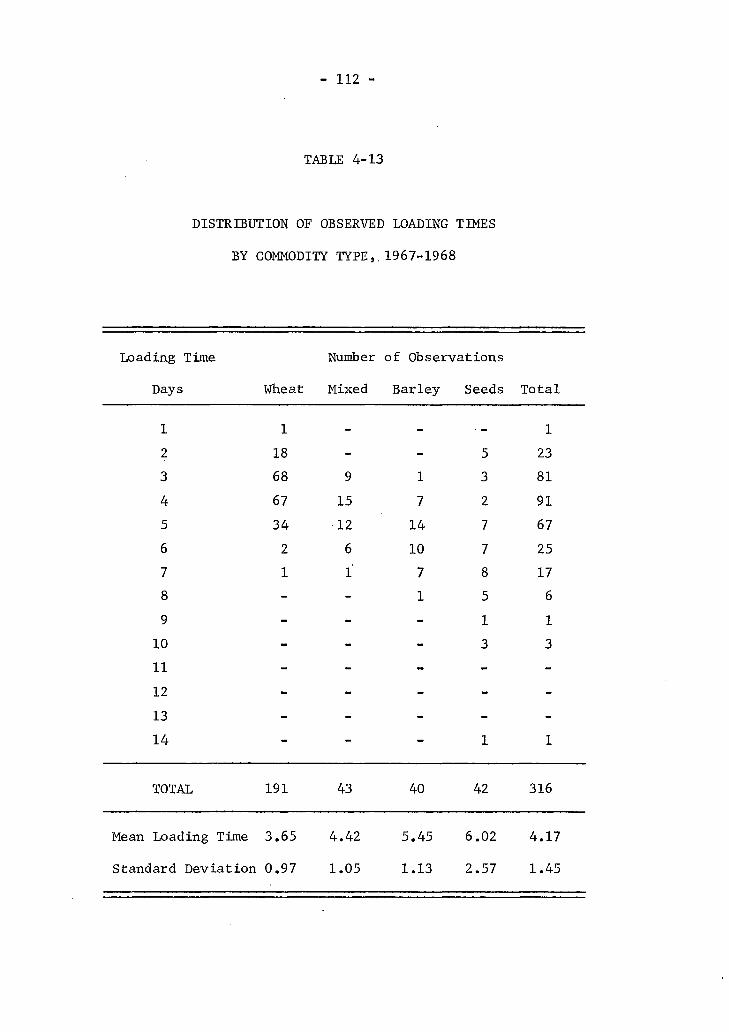
- 112 -
TABLE 4-13
DISTRIBUTION OF OBSERVED LOADING TIMES
BY COMMODITY TYPE, 1967-1968
Loading Time Number of Observations
Days Wheat Mixed Barley Seeds Total
1 1 - - - 1 2 18 - 5 23 3 68 9 1 3 81 4 67 15 7 2 91 5 34 12 14 7 67 6 2 6 10 7 25 7 1 1" 7 8 17 8 - - 1 5 6 9 - - 1 1 10 - - 3 3 11 - - - -12 - - - -13 - - - -14 - - 1 1
TOTAL 191 43 40 42 316
Mean Loading Time 3.65 4.42 5.45 6.02 4.17
Standard Deviation 0.97 1.05 1.13 2.57 1.45

- 1 1 3 -
that there are not so many lengthy d e l a y s , and the d i s t r i b u t i o n i s governed
more by the q u a n t i t y of cargo than by extraneous f a c t o r s . Having regard
to the changes i n the average s i z e of cargo, there has been a s i g n i f i c a n t
improvement i n loading times. The average lo a d i n g time f o r wheat was 4.10
days i n 1964/65 f o r an average cargo of 14,120 tons and 3.65 days i n 1967/
68 f o r an average cargo of 14,410 tons; f o r seeds, the average loading
time i n 1964/65 was 6.65 days f o r an average cargo of 12,730 tons and i n
1967/68 i t was 6.02 days f o r an average cargo of 13,740 tons. The loading
time f o r b a r l e y during t h i s p eriod increased from 5.07 days to 5.45 days,
but the average s i z e of b a r l e y cargoes had increased a l s o by some 28 per
cent.
The Frequency of Berth Changes
The n e c e s s i t y f o r a change of b e r t h adds considerably to the time
r e q u i r e d to load a v e s s e l ; i t i s , t h e r e f o r e , important to e s t a b l i s h a
p a t t e r n of b e r t h movements so that the u n d e r l y i n g determinants of loading
time may be r e v e a l e d . Table 4-14 gives the d i s t r i b u t i o n of b e r t h movements
f o r a l l types of g r a i n shipments.
I t can be seen that two berths per ship i s the modal value f o r each
crop year analysed and that the average number of berths f o r each v e s s e l i s
a l s o i n the neighbourhood of two. The d i s p e r s i o n of the observations can
be seen to decrease s l i g h t l y over time, although the b r e v i t y of the time
s e r i e s makes a d e f i n i t e c o n c l u s i o n unwise.
I t i s l i k e l y t hat the movement between berths i s i n some way depen
dent on the type of cargo taken on board; Table 4-15 shows the average
number of berthings per v e s s e l f o r each type of l o a d .

- 114 -
TABLE 4-14
DISTRIBUTION OF BERTHS VISITED PER SHIP,
ALL OBSERVED GRAIN CARGOES 1964-1968
Berths Visi t e d Number of Vessels
1964/65 1965/66 1966/67 1967/68
1 83 85 97 103
2 143 136 149 132
3 56 96 81 67
4 15 26 15 11
5 2 4 - 3
6 1 - -
TOTAL 300 347 342 316
Mean Berths V i s i t e d 2.05 2.21 2.05 1.98
Standard Deviation 0.88 0.94 0.83 0.87
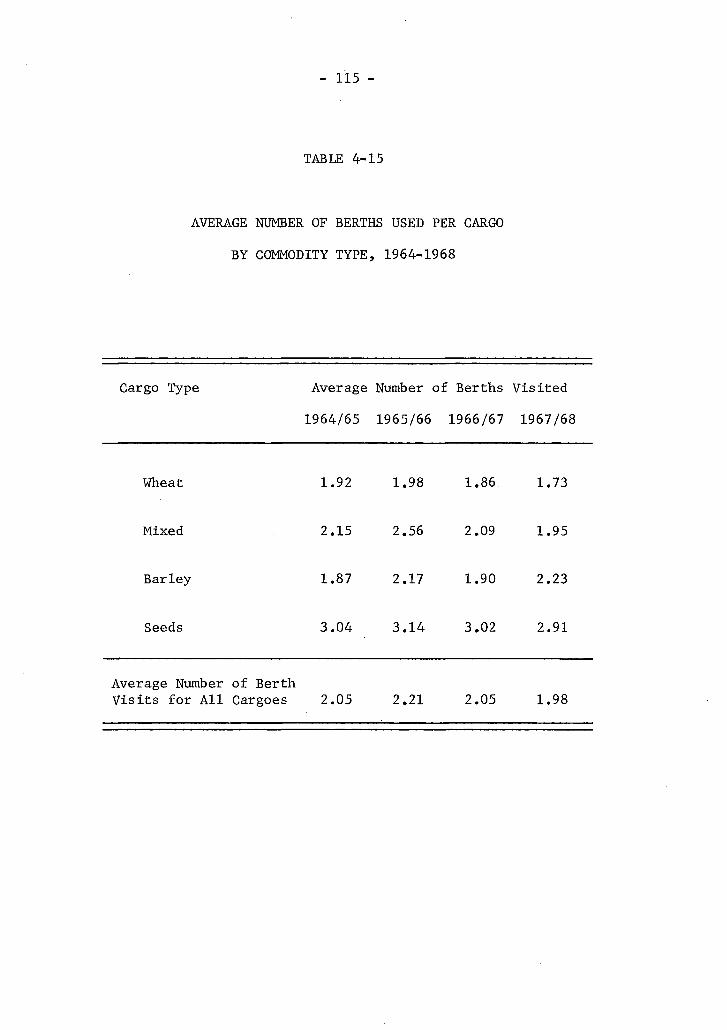
- 115 -
TABLE 4-15
AVERAGE NUMBER OF BERTHS USED PER CARGO
BY COMMODITY TYPE, 1964-1968
Cargo Type Average Number of Berths Visit e d
1964/65 1965/66 1966/67 1967/68
Wheat 1.92 1.98 1.86. 1.73
Mixed 2.15 2.56 2.09 1.95
Barley 1.87 2.17 1.90 2.23
Seeds 3.04 3.14 3.02 2.91
Average Number of Berth V i s i t s for A l l Cargoes 2.05 2.21 2.05 1.98
-116 -
The results for each type of cargo are reasonably consistent over
the period covered by the data. Wheat is the best performer with an
average of rather less than 2 berths per load, while seeds require the
most changing with an average of about 3 berths per load; barley and mixed
cargoes l i e somewhere between the two. There seems to be a trend towards
fewer berthings per cargo, except for barley, but since average barley
cargoes have been increasing this i s not necessarily inconsistent.
The number of berthings per cargo has considerable implications for 18
the optimal use of the harbour. In the i r 1967 study Kates, Peat, Marwick
used an overall average of 1.9 berths per load since their sample was
affected by the l i n e r c a l l s and small shipments not included i n this i n v e s t i
gation. The incidence of an appreciable number of seed 'shipments could
cause thei r recommendations to understate the physical f a c i l i t i e s required
to obviate a l l but "acceptable" delays.
Kates, Peat, Marwick and Company, West Coast Commodity Transporta tion Study Part I, a Report prepared for the Government of Canada, Department of Transport, May 1967, p. 41.

CHAPTER V
THE ANALYSIS OF PORT TIME AND VESSEL SIZE
Having established the p r o f i l e s and characteristics of the vessel
sample, and having some knowledge of the port f a c i l i t i e s and operations
i n Vancouver, i t i s now possible to attempt a test of the hypotheses set
up in the f i r s t chapter.
Linear Relationships Between Two Variables
In this analysis, i t is hoped to find out something about two
variables--vessel size and the time spent i n port. In some cases, a re
lationship between two such variables may be known theoretically to be a
functional one and the empirical investigation is performed in order to
c l a r i f y the structure of the function. In other cases, such as the one i n
which we are interested, there is usefulness in probing the degree of
association between the variables even i f a functional relationship,
implying s t r i c t correspondence, is neither apparent nor l o g i c a l l y sound;
this l a t t e r relationship is called a s t a t i s t i c a l relationship.
When presented with a bivariate d i s t r i b u t i o n , such as that between
ship size and, say, loading rate, we can assume that there i s no causal
relationship between the observed values but that they both vary together
due to extraneous influences, and then merely measure the c o - v a r i a b i l i t y ;
this i s done in correlation analysis. If correlation analysis is applied
Mary Gibbons N a t r e l l a , Experimental S t a t i s t i c s , National Bureau of Standards Handbook 91 (Washington D.C.: United States Department of Commerce, 1963), p. 5-1.
- 118 -
to a bivariate d i s t r i b u t i o n involving two quantities between which a
dependency i s assumed, then the analysis treats the data symmetrically 2
and i s neutral concerning the direction of dependency; this i s because
the assumed dependency i s not based on ideas of correlation, but on some
n o n - s t a t i s t i c a l considerations such as the technology of ship loading
gear, or the economic considerations of ship owners.
In correlation analysis, the pairs of observations should be selec
ted at random without pre-determining either of the variables, since this
l a t t e r method w i l l d i s t o r t the results when estimating the parameters of 3
a population from those of a sample. Since the group of vessels under
study is only marginally different from the population of grain vessels
which loaded more than fiv e thousand tons i n Vancouver, the problems of
sampling do not r e a l l y a r i s e . It might be suggested that this group of
vessels be treated as a sample of the world population of bulk carriers in
the grain trade, but the r e a l i t i e s of port conditions vary so enormously
from place to place that this would neither be sound s t a t i s t i c s nor sound
common sense. What may be more widely applicable, however, is the form of
any relationship found and the degree of any correlation observed.
When the population observed is not a true bivariate d i s t r i b u t i o n ,
but a population which is a c o l l e c t i o n of sub-populations of one variable
corresponding to fixed values of the other.variable, then correlation
analysis i s not applicable; however, we can define a correlation coefficient Taro Yamane, S t a t i s t i c s : An Introductory Analysis, (second e d i t i o n ;
New York: Harper and Row, 1967), p. 443. 3 Na t r e l l a , 0p_. C i t . , p. 5-8.
- 119 -
in this case which is a measure of the closeness of f i t of the regression
line to the data—regression s t i l l being valid under these conditions.
If i t is assumed that there is a basic direction of dependency
between the variables under consideration, even i f the relationship is a
s t a t i s t i c a l one, then regression analysis can be applied. If the scatter
of points gives an impression of a straight line relationship, and i f this
accords with preconceived ideas about the nature of the relationship, i t
can be postulated that the relation is a straight line; the problem then
becomes to find the line which best expresses the association. The line,
of course, is of the form Y = A + BX. The "best f i t t i n g " line is usually
estimated by the least squares method, which involves finding a line such
that the average of the squares of the distances from each point to the
line is minimised. Squaring the deviation gives emphasis to large devia
tions and avoids the problem of the sign of the deviation.
In the f i r s t hypothesis put forward in Chapter I, a dependency
between ship size and loading time was suggested; i t would not be a reason
able expectation, however, to predict exactly the time spent loading from
the size of the vessel—rather, i t might be possible to estimate the average
loading time of a l l vessels of a given size for future reference. There
are, of course, two regression lines, one for predicting Y from X and one
for predicting X from Y. If loading time or loading rate is considered as
the dependent variable Y, the latter form is of no interest in practice.
When the correlation coefficients and regression lines have been
evaluated, i t is necessary to have some idea of the significance of the
results before conclusions can be drawn. In the case of correlation co
efficients, one can construct a test of the hypothesis that the correlation
- 120 -
4 c o e f f i c i e n t i s zero. This i s done i n two stages:
1. Specify the a l t e r n a t i v e hypothesis that one i s prepared to accept i f one does not accept that the c o r r e l a t i o n i s zero. Keeping an open mind, t h i s w i l l be "that the c o r r e l a t i o n c o e f f i c i e n t i s not zero"; i . e . a two t a i l e d t e s t i s a p p l i e d .
2. D i v i d e the p o s s i b l e values of the c o r r e l a t i o n c o e f f i c i e n t i n t o two g r o u p s — t h e values which, i f observed, would lead to a r e j e c t i o n of the hypothesis i n favour of the a l t e r n a t i v e , and the values which would warrant acceptance of the h y p o thesis.
This procedure i s not of course p r e c i s e ; the observed c o r r e l a t i o n
may sometimes assume extreme values and there are two kinds of e r r o r which
i n t r u d e . The f i r s t e r r o r i s to r e j e c t the hypothesis of no c o r r e l a t i o n
when i t i s i n f a c t t r u e ; the second type of e r r o r i s to accept the hypo
t h e s i s of no c o r r e l a t i o n when i t i s i n f a c t f a l s e . The u s u a l procedure i s
to f i x the p r o b a b i l i t y of type I e r r o r at some s p e c i f i e d l e v e l and to make
the p r o b a b i l i t y of type I I e r r o r as small as p o s s i b l e . The assigned prob
a b i l i t y of not making a type I e r r o r i s c a l l e d the s i g n i f i c a n c e of the
t e s t .
When d e a l i n g w i t h c o e f f i c i e n t s i n the r e g r e s s i o n equation, i t i s
n a t u r a l l y important to know the l i k e l y e r r o r s i n the c o e f f i c i e n t s ; however,
sinc e i n general the dependencies observed are weak, i t i s more important
to know how w e l l the r e g r e s s i o n l i n e f i t s the observed values of the v a r i
a b l e s . In order to measure the former, the standard e r r o r of the c o e f f i c i e n t
can be used, and f o r the l a t t e r the square of the c o r r e l a t i o n c o e f f i c i e n t ,
c a l l e d the c o e f f i c i e n t of determination, w i l l be quoted. This c o e f f i c i e n t 2 5 R i s a measure of various p r o p e r t i e s of the r e g r e s s i o n .
4 Government of Canada, Royal Commission on T r a n s p o r t a t i o n (Volume
I I I ; Ottawa: The Queen's P r i n t e r , 1962), p. 186. 5Yamane, 0p_. C i t . , pp. 392-399.
- 121 -
F i r s t l y , i t can be used as a measure of improvement showing the
r e l a t i v e reduction i n the t o t a l sum of squares, or t o t a l error, when the 2
regression l i n e i s f i t t e d . Secondly, R can be used as a measure of the
closeness of f i t of the regression l i n e to the observed values. Thirdly,
i t can be used as a measure of the l i n e a r i t y of the observations; because 2
of i t s usefulness, the value of R w i l l be quoted together with any regres
sion equation.
It i s perhaps necessary here to insert a b r i e f caveat on correlation 2
and regression analysis. The mere discovery of a high value of either R
or the correlation coe f f i c i e n t does not prove causation; i t simply suggests
that the collected data are consistent with the hypothesis set up. Any
high values are in any event meaningless without the underpinning of a l o g i
c a l model, and only by a more thorough investigation by the substantive
sciences can one come to a conclusion regarding causation.^ Vessel Size and Loading Time
The f i r s t hypothesis put forward at the start of this thesis suggested
that larger ships would spend more time loading than smaller ships. This
would seem to be i n t u i t i v e l y the case, in that larger ships carry a greater
cargo and, therefore, occupy a given set of shore based handling gear for a
longer period. This is assuming, of course, that ships take on a f u l l load
and that p a r t i a l cargoes are not a s i g n i f i c a n t feature of vessel loadings;
fortunately, these conditions generally hold for the sample being analysed,
although the crop year 1964-65 did have a considerable number of p a r t i a l
Ibid., p. 459.
- 122 -
carg o e s — p a r t i c u l a r l y of barley and oilseeds. Additional complications of
this simple theory arise because of the differences in f a c i l i t i e s and
operations at the various grain elevators in the port. As was outlined
in Chapter I I , not only does the rated capacity of the loading belts vary
from elevator to elevator, but the number of belts allocated to a particular
berth is not consistent; in addition, no record is available of the amount
of overtime worked. This l a t t e r point can be important because some sub-
samples of vessels can have greatly increased incentives for a faster turn
around, p a r t i c u l a r l y those from high-cost countries.
The question of p a r t i a l cargoes has a rather greater importance for
grain than has been made clear. Because of i t s free flowing nature, an
incomplete load i s able to s h i f t e a sily i n the hold from side to side as
the ship moves; i f this adversely affects the metacentric height, severe
problems of i n s t a b i l i t y can be encountered. As a consequence, the Inter
national Convention for the Safety of L i f e at Sea has l a i d down regulations
for the safe stowage of grain, and these include the provision that p a r t i a l
cargoes:
... s h a l l be level l e d and topped off with bagged grain or other suitable cargo, t i g h t l y stowed, and extending to a height of not less than four feet above the top of the bulk g r a i n . 7
This bagging and stowing can naturally consume a disproportionate
amount of time, and could cause p a r t i a l cargoes to appear as marked excep
tions in any analysis of loading time; however, these regulations do not
apply to a l l vessels indiscriminately. When a bulk c a r r i e r i s specially
The International Convention for the Safety of L i f e at Sea, New Grain Rules 1960, Chapter VI, Regulation 5(b); cited i n George J . Bonwick and E. C. Steer, Ship's Business, ( f i f t h e d i t i o n ; London: The Maritime Press, 1963), pp. 302-318.
9
- 123 -
designed with two or more v e r t i c a l or sloping graintight longtitudinal
d i v i s i o n s , which l i m i t the effect of any transverse s h i f t of grain, then
the foregoing requirements need not be f u l f i l l e d . Most bulk carriers
meet these provisions, and should a p a r t i a l cargo be loaded every e f f o r t
i s made to ensure that a l l holds in use are f u l l .
I f ship size—measured in net register t o n s — i s correlated with the
number of days spent loading, the r e s u l t i n g coefficients of correlation
are presented i n Table 5-1 for the.different cargoes in the different years.
The o v e r a l l correlation for each year i s positive and s i g n i f i c a n t ,
ranging from 0.17 i n 1965/66 to 0.34 i n 1964/65. The lowest values were
obtained i n 1965/66 and i n 1966/67 which were years during which the port
i n Vancouver was troubled by t i e ups. Labour d i f f i c u l t i e s slowed the flow
of exports during the summer of 1965, and during the autumn a general g
shortage of boxcars developed r e l a t i v e to demand; over the whole winter
there was a general shortage of certain grades of grain to compound the
d i f f i c u l t y . In 1966 an eight day railway s t r i k e beginning on August 26th
hindered shipping, but this was only a prelude to the West Coast dock d i s -9
pute which stopped work for twenty one days from November 17th.
Of the sixteen individual commodity values, only f i v e are not s i g
n i f i c a n t at the 90 per cent l e v e l — a l l the remainder being s i g n i f i c a n t at
least at the 98 per cent l e v e l ; a l l the s i g n i f i c a n t results show an appreci
able correlation between ship size and the time spent loading. Of the f i v e
non-significant r e s u l t s , three occurred in the crop year 1964/65, which The Canadian Wheat Board, Annual Report 1965/66, (Winnipeg, 1966).
The Canadian Wheat Board, Annual Report 1966/67, (Winnipeg, 1967).
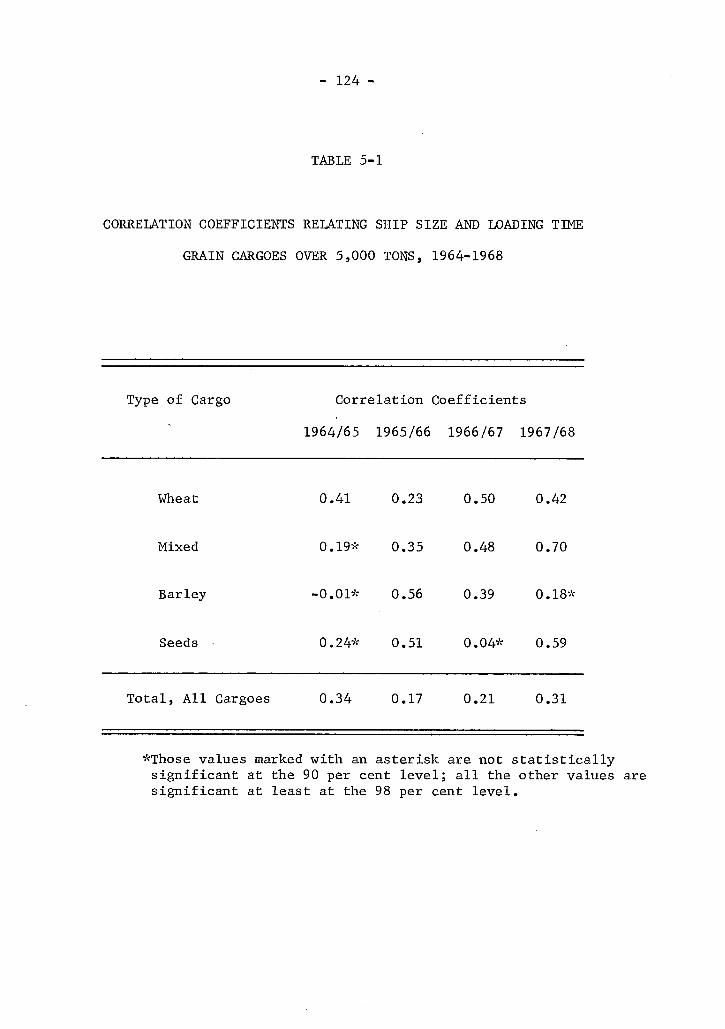
- 124 -
TABLE 5-1
CORRELATION COEFFICIENTS RELATING SHIP SIZE AND LOADING TIME
GRAIN CARGOES OVER 5,000 TONS, 1964-1968
Type of Cargo Correlation Coefficients
1964/65 1965/66 1966/67 1967/68
Wheat 0.41 0.23 0.50 0.42
Mixed 0.19* 0.35 0.48 0.70
Barley •0.01* 0.56 0.39 0.18*
Seeds 0.24* 0.51 0.04* 0.59
Total, A l l Cargoes 0.34 0.17 0.21 0.31
*Those values marked with an asterisk are not s t a t i s t i c a l l y s i g n i f i c a n t at the 90 per cent l e v e l ; a l l the other values are sig n i f i c a n t at least at the 98 per cent l e v e l .

- 125 -
could be due to the smaller number of observations in that year, or to
some over-riding e f f e c t .
The wheat results are the most consistent of the group, possibly
on account of the lack of complication i n the loading process, but more
l i k e l y because of the large number of observations--in the neighbourhood
of two hundred for each year; the best correlation observed was 0.50 i n
1966/67. A l l the values obtained are s i g n i f i c a n t l y different from zero
at the 99.9 per cent l e v e l .
The largest correlation found among a l l the observations was that
of 0.70 for mixed wheat cargoes i n 1967/68, which was s i g n i f i c a n t at the
99.9 per cent l e v e l . The values for 1965/66 and 1966/67 were also s i g
n i f i c a n t , but at the 98 per cent and 99 per cent levels respectively; the
exception i n the case of mixed wheat was the correlation observed i n 1964/65
which i s not s i g n i f i c a n t l y different from zero even at the 90 per cent l e v e l .
In the case of barley cargoes, two of the observed values were not
significant--those of 1964/65 and 1967/68. The former was the only nega
t i v e value found, although i t barely q u a l i f i e s as negative. The remaining
two values were appreciable correlations of 0.56 and 0.39 respectively.
Cargoes of seeds provided two observations which were not s i g n i f i c a n t ,
i n 1964/65 and 1966/67. The remaining two were both s i g n i f i c a n t at the
99.9 per cent l e v e l ; these values were also comparatively high, at 0.51
and 0.59.
An alternative way of measuring the size of a ship i s by the amount
of cargo which i t takes aboard. Before attempting to explain the deviating
values revealed above, i t may be illuminating to investigate the correlation
between time spent loading and the amount actually loaded. The results of
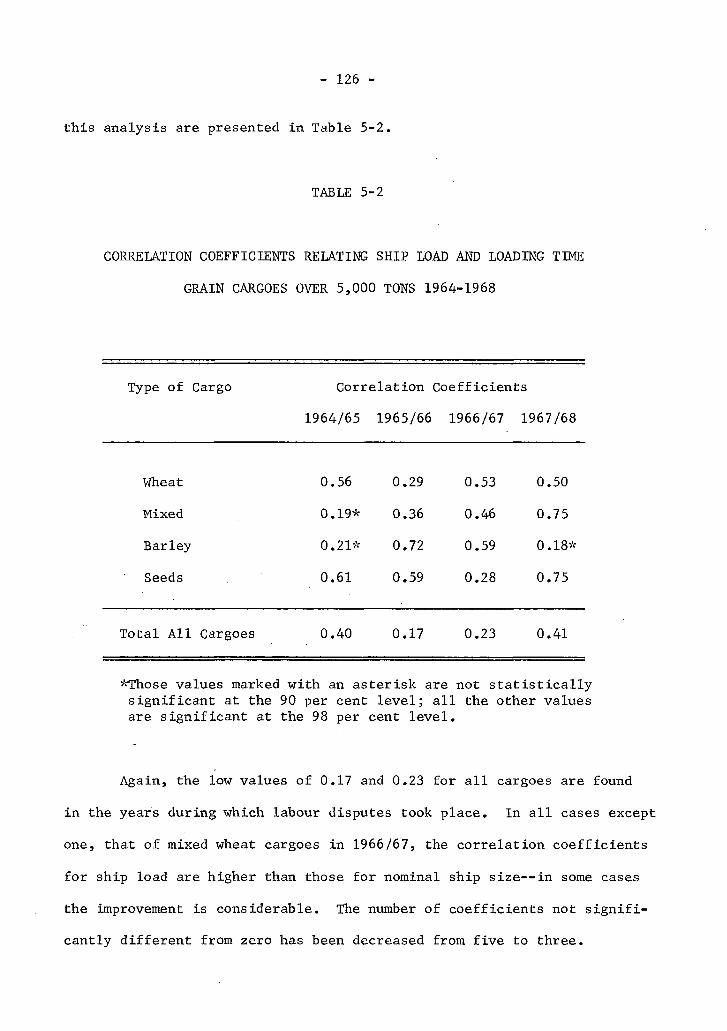
- 126 -
this analysis are presented i n Table 5-2.
TABLE 5-2
CORRELATION COEFFICIENTS RELATING SHIP LOAD AND LOADING TIME
GRAIN CARGOES OVER 5,000 TONS 1964-1968
Type of Cargo Correlation Coefficients
1964/65 1965/66 1966/67 1967/68
Wheat 0.56 0.29 0 .53 0.50
Mixed 0.19* 0.36 0 .46 0.75
Barley 0.21* 0.72 0 .59 0.18*
Seeds 0.61 0.59 0 .28 0.75
Total A l l Cargoes 0.40 0.17 0 .23 0.41
*Those values marked with an asterisk are not s t a t i s t i c a l l y s i g n i f i c a n t at the 90 per cent l e v e l ; a l l the other values are s i g n i f i c a n t at the 98 per cent l e v e l .
Again, the low values of 0.17 and 0.23 for a l l cargoes are found
i n the years during which labour disputes took place. In a l l cases except
one, that of mixed wheat cargoes i n 1966/67, the correlation coefficients
for ship load are higher than those for nominal ship s i z e — i n some cases
the improvement is considerable. The number of coefficients not s i g n i f i
cantly different from zero has been decreased from f i v e to three.

- 127 -
These exceptions may be due to various underlying factors, enumerated
below:
1. There may be an i n s u f f i c i e n t number of observations in the group of vessels studied.
2. There may be an appreciable number of p a r t i a l cargoes.
3. There may be a number of vessels whose register tonnage i s not a good measure of carrying capacity.
4. There may be a number of occasions when an unusual amount of overtime was worked on smaller vessels.
5. There may be a different usage of elevator loading belts for different vessels.
6. A range of loading times may have been affected adversely by extraneous factors which can arise during the grain handling process, notably labour trouble and grain shortages.
7. Certain special provisions i n the charter party may provide increased incentive to rapid turnaround. For instance, i f the vessel were bound for a notoriously slow discharging port, a reversible laydays provision would enable the owner to make up in Vancouver the days he would l i k e l y lose at the destination.
Factors (1) and (2) can be established with some c l a r i t y by an
inspection of the raw data; factor (3) can be investigated i n p r i n c i p l e
by resorting to an analysis of the records issued by the c l a s s i f i c a t i o n
s o c i e t i e s — n o t a b l y Lloyd's Register; factors (4), (5), (6) and (7) how
ever are not within the ambit of the available s t a t i s t i c s and th e i r exis
tence can only be a matter of conjecture.
Taking f i r s t the case of mixed wheat cargoes in 1964/65, an inspec
t i o n of the data reveals that the number of observations i s not unduly
low, likewise the consistency of the two correlation coefficients suggests
that i t is neither p a r t i a l cargoes nor an inadequate measure of ship size
which i s to blame; more l i k e l y i s the effect of some extraneous factors,
but these are d i f f i c u l t to i s o l a t e since reference to the tables exhibited

- 128 -
in Chapter IV reveals that the average loading rate, loading time and
number of berths per shipload are not out of l ine for mixed cargo relative
to other cargo types in 1964/65. The only apparent difference is a rather
larger vessel s ize .
Barley cargoes in 1964/65 were signif icantly less than ship capacity
in a number of instances, which suggests why the correlation between ship
size and loading time was so poor and why there was a considerable improve
ment when correlating ship load to loading time. The lack of s ta t i s t i ca l
significance in the latter result seems largely due to the small number of
observations, but the value is s t i l l low relative to the others.
Barley cargoes in 1967/68 also show a low correlation, possibly due
to the rather high number of berths per barley cargo in that particular
year and the fact that the average barley cargo was larger; the average
vessel loading barley was, however, smaller.
Bearing in mind that the correlation coefficients are probably some
what understated because of the crude measure of loading time, i t seems
that in general there is a reasonable correlation between ship size and
the number of days used to take on a load; however, the weakness of the
correlation suggests that small ships frequently encounter delays, and large
ships turnaround rapidly on occasion. In the case of a ship which, given
favourable conditions, would load in a very short time, there are reasons
for extending the port stay which are sound from a labour relation point
of view. After a long sea voyage, standing watches six or seven days a
week, the crew is probably ready for a break in routine, and possibly their
productivity in the ensuing voyage is enhanced by a night or two ashore.
Some ship operators in some trades at least stipulate that to allow time
- 129 -
for provisioning and re-signing the crew, no vessel should be turned around
i n less than 1.5 days.^
Having established this admittedly weak corr e l a t i o n , the average
number of loading days for each size range of vessels can be examined;
these are presented in Table 5-3. Because of the limited number of obser
vations for the other cargo types, this analysis i s presented only for
wheat cargoes.
It can be seen that the observations do not follow a very regular
pattern, in fact they are highly i r r e g u l a r , possibly because of the small
number of observations i n each size class. Attempts to regress ship size
against ship loading time are not notably successful, as evidenced by
Table 5-4 in which the regression coefficients are presented. Most of the 2
R values are extremely small, and as a predictor of probable port time
given vessel s i z e , the equations are evidently a f a i l u r e . This could be
due to the discrete nature of the observations, but the number of berth
changes required is also thought to be a factor i n this lack of explanation,
and this variable w i l l be introduced in a later section.
If ship load i s regressed against loading time, a s l i g h t improvement
is obtained i n almost every case, as shown i n Table 5-5. In some cases,
this relationship now accounts for some 50 per cent of the va r i a t i o n i n
loading times, but i n the poor cases this explicable portion deteriorates
to only four or five per cent. The poor nature of agreement could well
be due to a fau l t in the basic assumption of linear regression analysis--
namely that the relationship i s l i n e a r ; however, given the scatter of
R. Chapman and R. R. C. Jackson, Operational Research Studies of Port Operation, (London: The B r i t i s h Iron and Steel Research Association, 1963), p. 7.
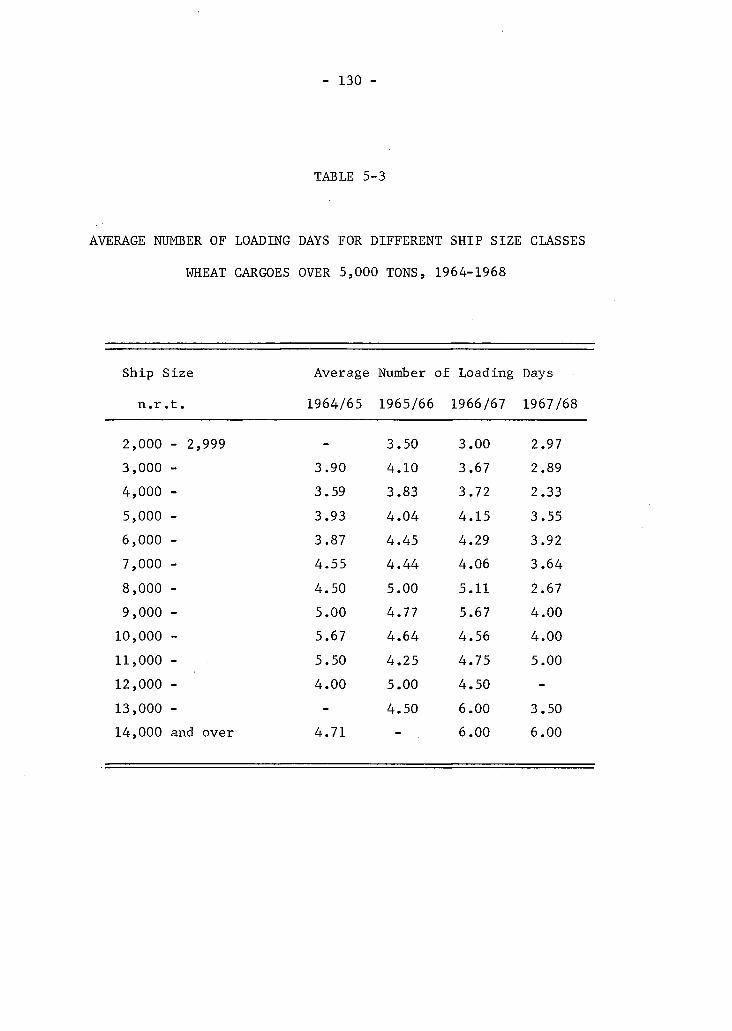
- 130 -
TABLE 5-3
AVERAGE NUMBER OF LOADING DAYS FOR DIFFERENT SHIP SIZE CLASSES
WHEAT CARGOES OVER 5,000 TONS, 1964-1968
Ship Size Average Number of Loading Days
n.r . t . 1964/65 1965/66 1966/67 1967/C
2,000 - 2,999 - 3.50 3.00 2.97 3,000 - 3.90 4.10 3.67 2.89 4,000 - 3.59 3.83 3.72 2.33 5,000 - 3.93 4.04 4.15 3.55 6,000 - 3.87 4.45 4.29 3.92 7,000 - 4.55 4.44 4.06 3.64 8,000 - 4.50 5.00 5.11 2.67 9,000 - 5.00 4.77 5.67 4.00 10,000 - 5.67 4.64 4.56 4.00 11,000 - 5.50 4.25 4.75 5.00 12,000 - 4.00 5.00 4.50 -13,000 - - 4.50 6.00 3.50 14,000 and over 4.71 - 6.00 6.00
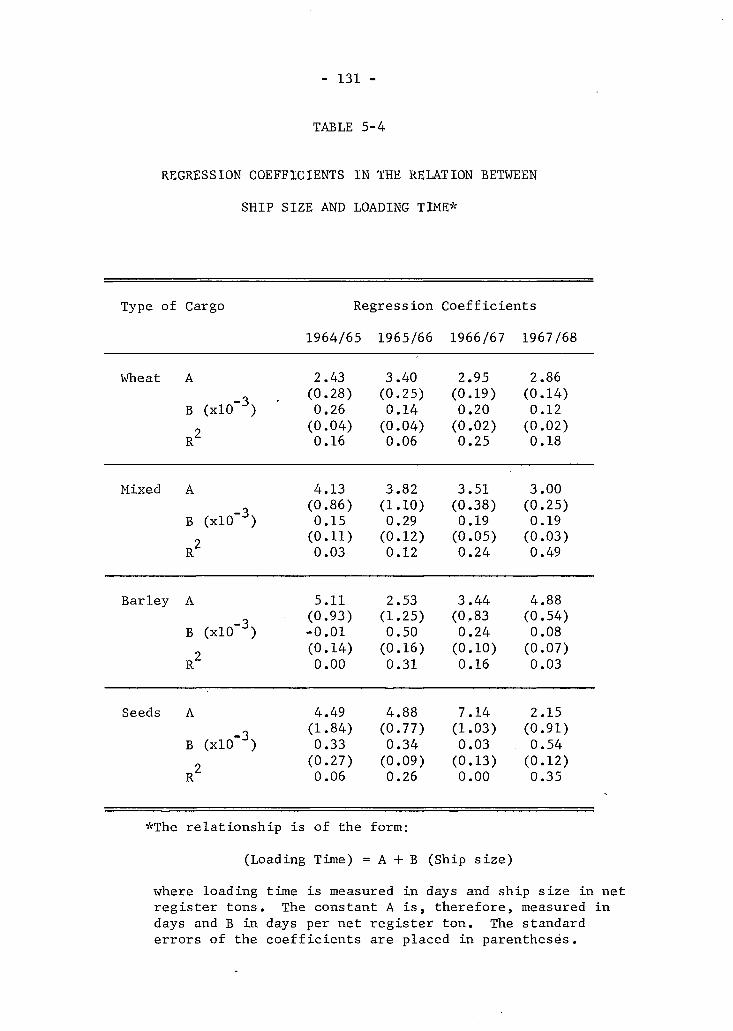
- 131 -
TABLE 5-4
REGRESSION COEFFICIENTS IN THE RELATION BETWEEN
SHIP SIZE AND LOADING TIME*
Type of Cargo Regression Coefficients
1964/65 1965/66 1966/67 1967/68
Wheat A 2.43 3.40 2.95 2.86 (0.28) (0.25) (0.19) (0.14)
B (xlO J ) 0.26 0.14 0.20 0.12 9 (0.04) (0.04) (0.02) (0.02)
R 0.16 0.06 0.25 0.18
Mixed A 4.13 3.82 3.51 3.00 (0.86) (1.10) (0.38) (0.25)
B (xlO J ) 0.15 0.29 0.19 0.19 (0.11) (0.12) (0.05) (0.03)
R 0.03 0.12 0.24 0.49
Barley A
B ( x l O - 3 )
R
5.11 (0.93) -0.01 (0.14) 0.00
2.53 (1.25) 0.50 (0.16) 0.31
3.44 (0.83 0.24 (0.10) 0.16
4.88 (0.54) 0.08 (0.07) 0.03
Seeds A
B (xlO )
R 2
4.49 (1.84) 0.33 (0.27) 0.06
4.88 (0.77) 0.34 (0.09) 0.26
7.14 (1.03) 0.03 (0.13) 0.00
2.15 (0.91) 0.54 (0.12) 0.35
*The relationship i s of the form:
(Loading Time) = A + B (Ship size)
where loading time i s measured in days and ship size i n net register tons. The constant A i s , therefore, measured i n days and B in days per net register ton. The standard errors of the coefficients are placed in parentheses.
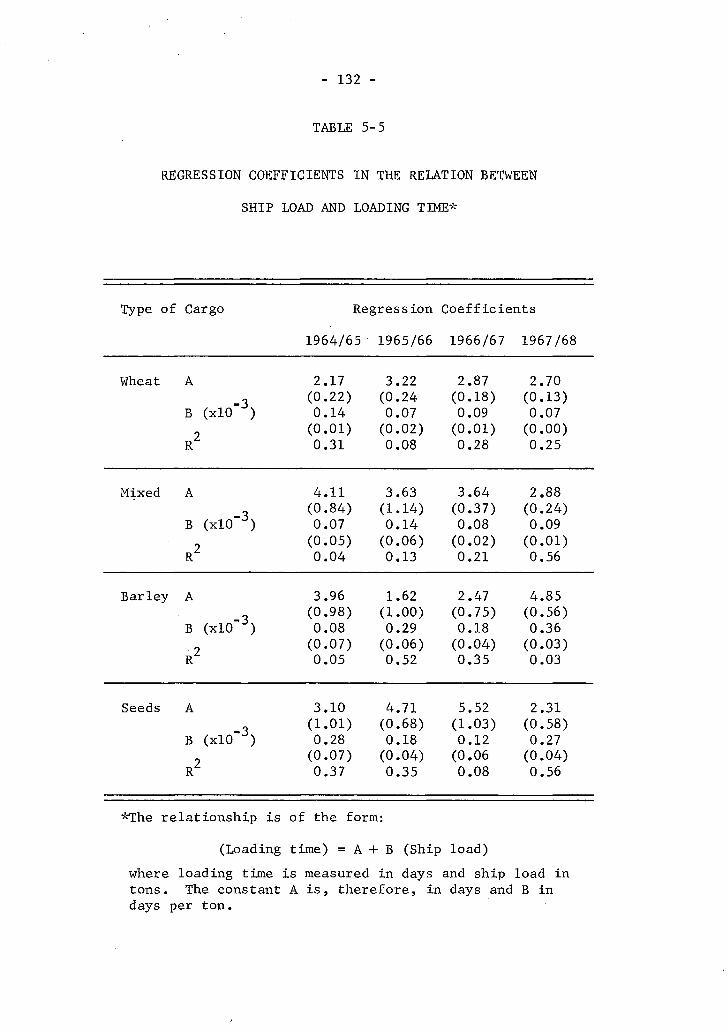
- 132 -
TABLE 5-5
REGRESSION COEFFICIENTS IN THE RELATION BETWEEN
SHIP LOAD AND LOADING TIME*
Type of Cargo Regression Coefficients
1964/65 1965/66 1966/67 1967/68
Wheat A 2.17 3.22 2.87 2.70 _3 (0.22) (0.24 (0.18) (0.13)
B (xlO ) 0.14 0.07 0.09 0.07 (0.01) (0.02) (0.01) (0.00)
R 0.31 0.08 0.28 0.25
Mixed A 4.11 3.63 3.64 2.88 (0.84) (1.14) (0.37) (0.24)
B (xlO ) 0.07 0.14 0.08 0.09 (0.05) (0.06) (0.02) (0.01)
R 0.04 0.13 0.21 0.56
Barley A 3.96 1.62 2.47 4.85 (0.98) (1.00) (0.75) (0.56)
B (xlO ) 0.08 0.29 0.18 0.36 0 (0.07) (0.06) (0.04) (0.03) R Z 0.05 0.52 0.35 0.03
Seeds A 3.10 4.71 5.52 2.31 (1.01) (0.68) (1.03) (0.58)
B (xlO ) 0.28 0.18 0.12 0.27 9 (0.07) (0.04) (0.06 (0.04)
R 0.37 0.35 0.08 0.56
*The relationship i s of the form:
(Loading time) = A + B (Ship load) where loading time i s measured i n days and ship load i n tons. The constant A i s , therefore, in days and B in days per ton.
- 133 -
observations i t i s unlikely that any higher degree relationship would
produce a better f i t .
Some published s t a t i s t i c s are available to the shipping industry
on rates of loading i n grain ports throughout the world. Bes''"''' has
collated some s t a t i s t i c s on performance in Vancouver, which amount to no
more than a statement of the loads and trading times of some twelve ships.
The information given is sparse and the cargo i s c l a s s i f i e d merely as grain
and not i d e n t i f i e d further. In no sense is any analysis performed upon
the data. The information i s supposedly for the guidance of charterers
when s t i p u l a t i n g a-loading rate to be achieved under a particular charter
party. Of the twelve ships he chooses as being representative, f i v e took
on the i r cargoes during the t i e up of October/November 1966, and so cannot
f a i r l y be adjudged normal. Of the remaining seven vessels, one loaded a
cargo of seeds and was forced to v i s i t three berths, two loaded barley,
which has been shown to be slower that wheat, and only four took on wheat,
with which they achieved a good loading rate. None of these details
appeared in the work i n question, but came to l i g h t during this study. In
view of the differences in characteristics of the various cargoes, i t seems
misleading to quote loading rates without annotation of some sort.
One other source of s t a t i s t i c s on bulk carrier turnaround is the
review of bulk c a r r i e r trades published by Fearnley and Egers Chartering 12
Company. This publication quotes a loading time i n Vancouver of 11 days
J. Bes, Despatch of Tramp Ships, (London: Barker and Howard, 1967), p. 18.
12 Trades of World Bulk Carriers 1966, (Oslo: Fearnley and Egers
Chartering Company, 1967), p. 26.
- 134 -
in 1965 and 10 days in 1966 for bulk carriers loading grain; these vessels
being defined as having a deadweight capacity greater than 14,000 tons.
These figures include the period spent waiting for a berth.
In order to attempt a v e r i f i c a t i o n of these figures, a l l those vessels
loading more than 14,000 tons were extracted from the sample and considered
separately. For the two crop years 1964/65 and 1965/66 the average loading
periods were 4.70 days for wheat, 6.26 days for mixed wheat, 6.53 days for
barley and 8.02 days for seeds. To these must be added an estimate for
waiting time, but these results do reinforce the dangers inherent i n not
allowing for different cargoes, and in generalising where ship loading i s
concerned.
The D i s t r i b u t i o n of Loading Times
Since the model based on vessel size dependency is not r e a l l y
explanatory of the time taken to load, i t i s of interest to explore the
p o s s i b i l i t y that loading time is a stochastic variable. If vessel size
has only a small e f f e c t , the consequence may be that the size dependency
is masked by the variations i n other factors.
Suppose that vessel loading time i s a stochastic variable and that
the probability of completing the loading of a ship i s u per unit time;
assume also, for ease of analysis, that a certain number of ships are
waiting to be loaded and that no more are a r r i v i n g for the moment. I f
P^ is the probability that exactly n vessels are either being loaded or
waiting to be loaded at one berth, an equation for P as a function of time
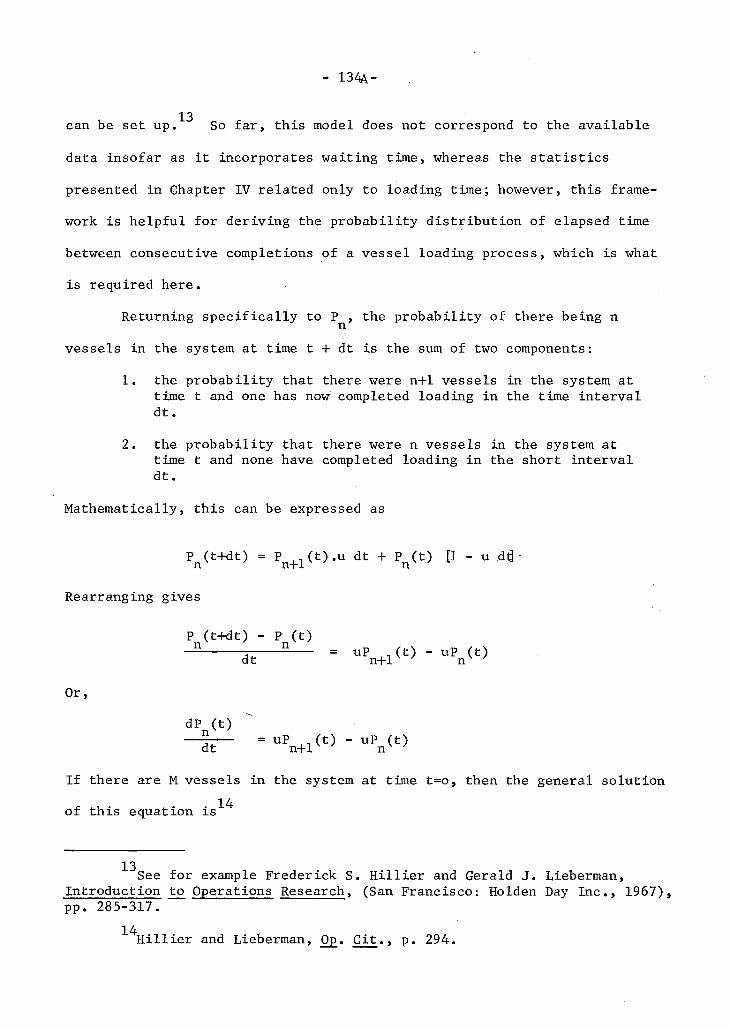
- 134A-
13 can be set up. So f a r , this model does not correspond to the available
data insofar as i t incorporates waiting time, whereas the s t a t i s t i c s
presented i n Chapter IV related only to loading time; however, this frame
work i s helpful for deriving the probability d i s t r i b u t i o n of elapsed time
between consecutive completions of a vessel loading process, which i s what
is required here.
Returning s p e c i f i c a l l y to P , the probability of there being n
vessels in the system at time t + dt i s the sum of two components:
1. the probability that there were n+1 vessels in the system at time t and one has now completed loading i n the time i n t e r v a l dt.
2. the probability that there were n vessels in the system at time t and none have completed loading i n the short i n t e r v a l dt.
Mathematically, this can be expressed as
P (t+dt) = P ,.(t).u dt + P (t) [1 - u dt| n n+1 n
Rearranging gives
P (t+dt) - P (t) = uP _(t ) - uP (t) dt n+l v ' n
Or,
dP_(t) - 3 T - = U P n + l ( t ) " UV f c>
If there are M vessels in the system at time t=o, then the general solution
of this equation i s
13 See for example Frederick S. H i l l i e r and Gerald J . Lieberman,
Introduction to Operations Research, (San Francisco: Holden Day Inc., 1967), pp. 285-317.
14 H i l l i e r and Lieberman, 0p_. C i t . , p. 294.
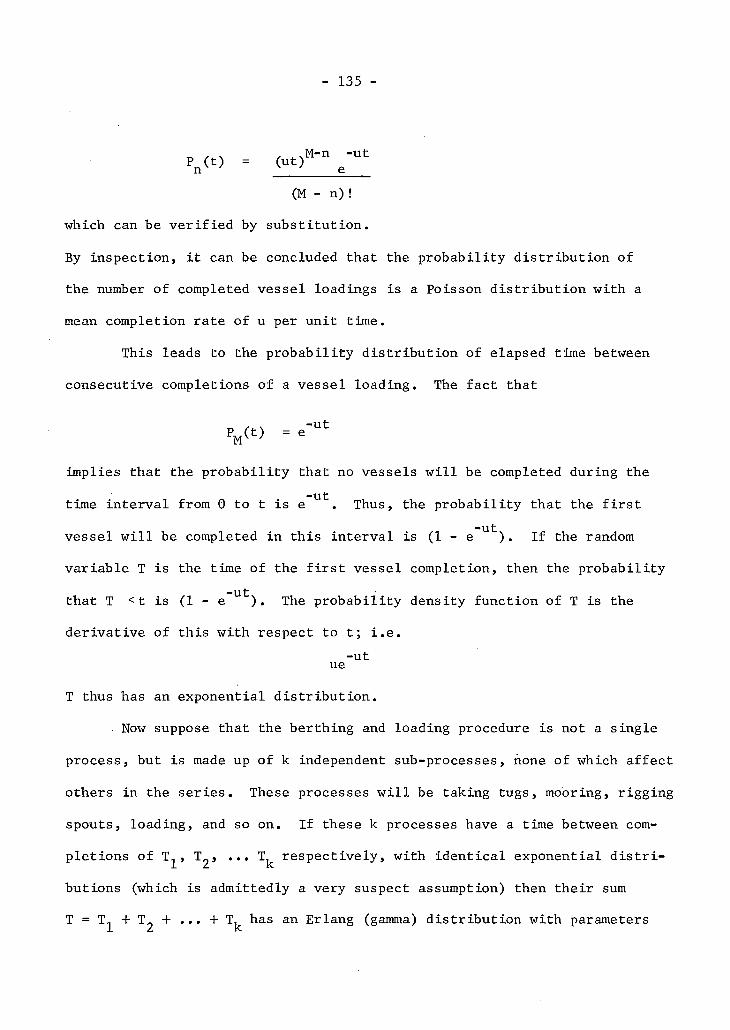
- 135 -
P ( t ) = (ut) n x ' e (M - n) !
which can be v e r i f i e d by s u b s t i t u t i o n .
By i n s p e c t i o n , i t can be concluded that the p r o b a b i l i t y d i s t r i b u t i o n of
the number of completed v e s s e l loadings i s a Poisson d i s t r i b u t i o n w i t h a
mean completion r a t e of u per u n i t time.
This leads to the p r o b a b i l i t y d i s t r i b u t i o n of elapsed time between
consecutive completions of a v e s s e l l o a d i n g . The f a c t that
p M(t)
i m p l i e s that the p r o b a b i l i t y that no v e s s e l s w i l l be completed during the
time i n t e r v a l from 0 to t i s e U t . Thus, the p r o b a b i l i t y that the f i r s t
v e s s e l w i l l be completed i n t h i s i n t e r v a l i s (1 - e U t ) . I f the random
v a r i a b l e T i s the time of the f i r s t v e s s e l completion, then the p r o b a b i l i t y -ut
that T <t i s (1 - e ). The p r o b a b i l i t y density f u n c t i o n of T i s the d e r i v a t i v e of t h i s w i t h respect to t ; i . e .
-ut
ue
T thus has an exponential d i s t r i b u t i o n .
Now suppose that the b e r t h i n g and loading procedure i s not a s i n g l e
process, but i s made up of k independent sub-processes, none of which a f f e c t
others i n the s e r i e s . These processes w i l l be t a k i n g tugs, mooring, r i g g i n g
spouts, l o a d i n g , and so on. I f these k processes have a time between com
p l e t i o n s of T^, T^, ... T^ r e s p e c t i v e l y , w i t h i d e n t i c a l exponential d i s t r i
butions (which i s admittedly a very suspect assumption) then t h e i r sum
T = T^ + T2 + ... + T^ has an Erlang (gamma) d i s t r i b u t i o n w i t h parameters
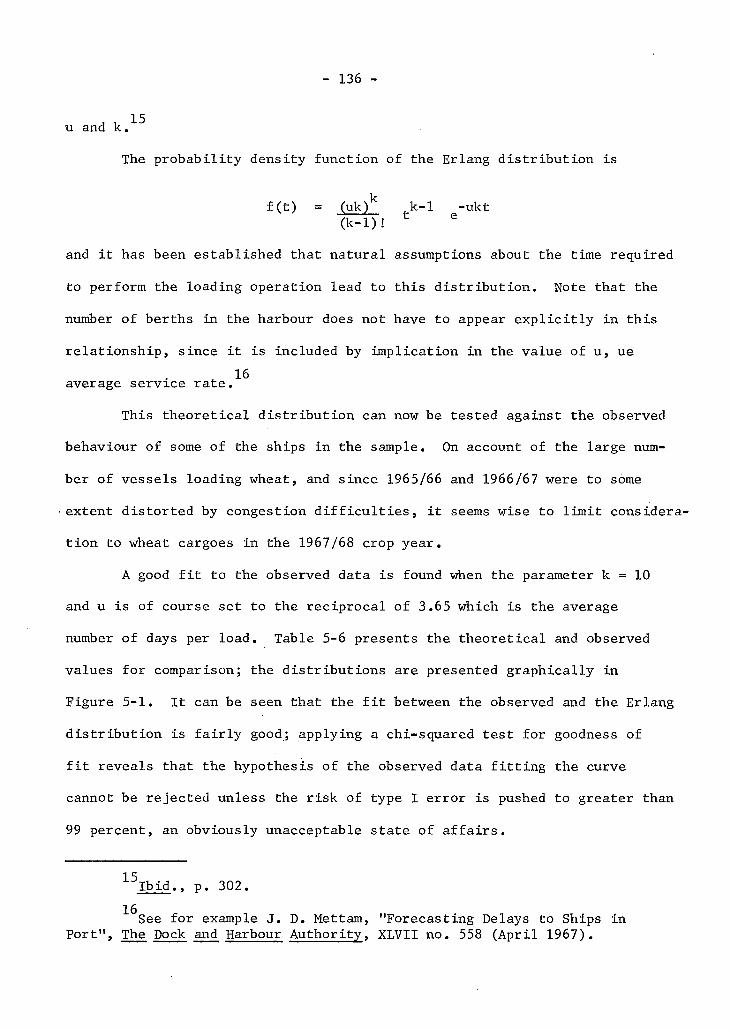
- 136 -
u and k."*"̂
The probability density function of the Erlang d i s t r i b u t i o n i s
f ( t ) = (uk)* .k-1 -(k-1)!
ukt
and i t has been established that natural assumptions about the time required
to perform the loading operation lead to this d i s t r i b u t i o n . Note that the
number of berths in the harbour does not have to appear e x p l i c i t l y i n this
r e l a t i o n s h i p , since i t i s included by implication i n the value of u, ue , 1 6
average service rate.
This theoretical d i s t r i b u t i o n can now be tested against the observed
behaviour of some of the ships i n the sample. On account of the large num
ber of vessels loading wheat, and since 1965/66 and 1966/67 were to some
extent distorted by congestion d i f f i c u l t i e s , i t seems wise to l i m i t considera
t i o n to wheat cargoes i n the 1967/68 crop year.
A good f i t to the observed data i s found when the parameter k = 10
and u i s of course set to the reciprocal of 3.65 which i s the average
number of days per load. Table 5-6 presents the theoretical and observed
values for comparison; the distrib u t i o n s are presented graphically in
Figure 5-1. I t can be seen that the f i t between the observed and the Erlang
d i s t r i b u t i o n i s f a i r l y good; applying a chi-squared test for goodness of
f i t reveals that the hypothesis of the observed data f i t t i n g the curve
cannot be rejected unless the r i s k of type I error is pushed to greater than
99 percent, an obviously unacceptable state of a f f a i r s . 1 5 I b i d . , p. 302.
^See for example J. D. Mettam, "Forecasting Delays to Ships i n Port", The Dock and Harbour Authority, XLVII no. 558 (A p r i l 1967).
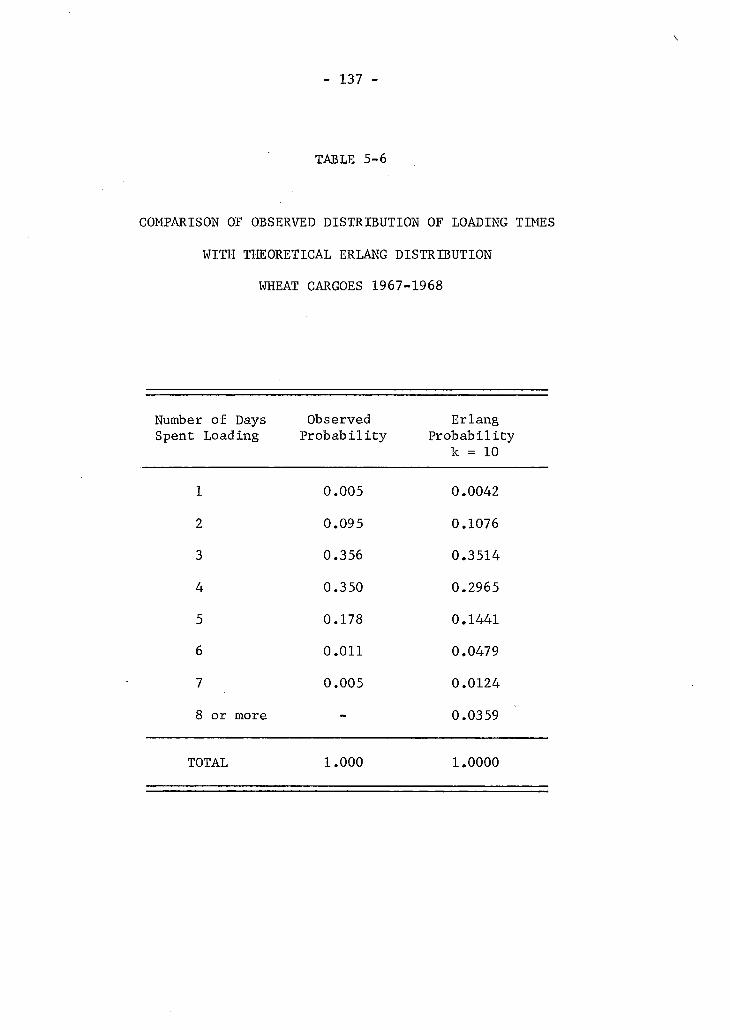
- 137 -
TABLE 5-6
COMPARISON OF OBSERVED DISTRIBUTION OF LOADING TIMES
WITH THEORETICAL ERLANG DISTRIBUTION
WHEAT CARGOES 1967-1968
Number of Days Spent Loading
Observed Probability
Erlang Probability
k = 10
1 0.005 0.0042
2 0.095 0.1076
3 0.356 0.3514
4 0.350 0.2965
5 0.178 0.1441
6 0.011 0.0479
7 0.005 0.0124
8 or more - 0.0359
TOTAL 1.000 1.0000
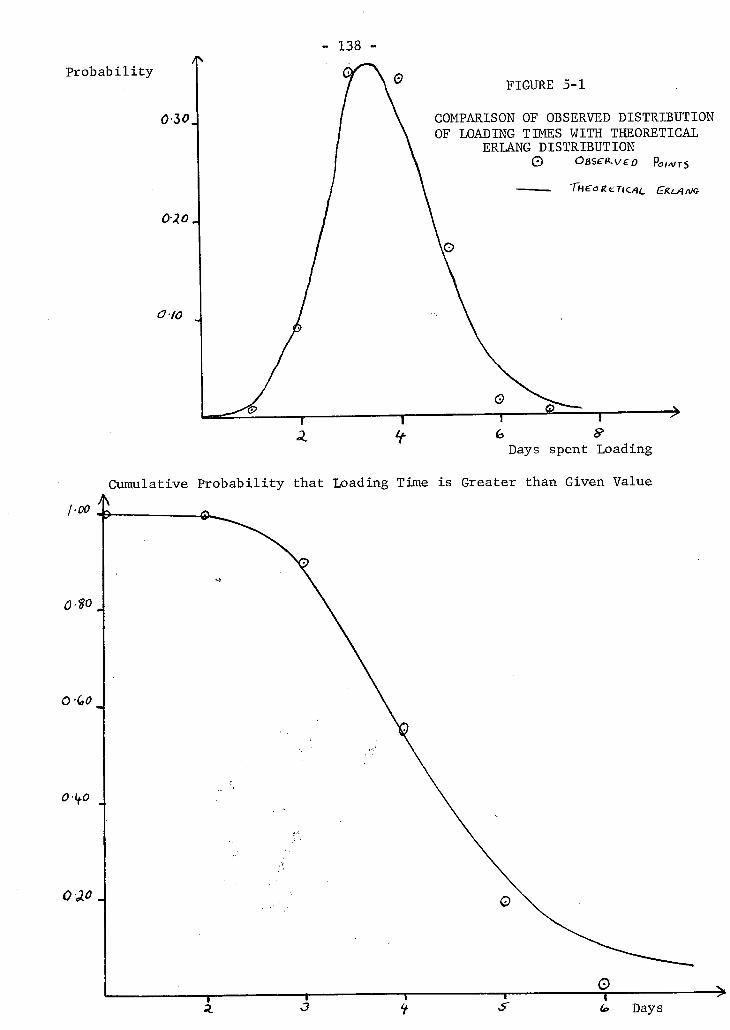
- 138 -Probability
Cumulative Probability that Loading Time is Greater than Given Value
- 139 -
This high value of k i s most interesting. Obviously, the loading
of a vessel i s indeed made up of a great many sub-routines, none of which
have a great bearing on the others; however, i n general, the duration of
most of these constituent tasks i s short i n comparison with the actual
loading and this often tends to conceal their importance. Mettam''"̂ found
a close relationship to the k = 1 curve for a sample of general cargo ship
loading times and concluded that the effect of the a n c i l l a r y a c t i v i t i e s
had been masked because they made up such a small proportion of the t o t a l
loading time. The grain ships studied here, however, spend a very much
shorter time at the berth than do general cargo vessels and possibly this
masking effect does not occur.
An examination of a t y p i c a l port log i s s u f f i c i e n t to estimate roughly 18
the number of separate constituents of loading time. The sample vessel,
which must remain anonymous, was one which loaded 6,300 tons of No. 2 Mani
toba Northern Wheat in 1965. The sequence of operations was as follows:
1. The vessel berths at the elevator. .
2. The hatch covers are removed.
3. The grain spout and trimmer are rigged.
4. There is a waiting period for grain to start flowing.
5. The grain i s loaded, with breaks for the gangs' lunch hour.
6. The spout and trimmer are removed.
7. The Hatches are covered up.
1 7 I b i d . 18
This log came from a confidential source in the Vancouver shipping community.
- 140 -
This i s l i k e l y to be repeated on several successive days, which, of
course, adds up to more than ten operations; however, some of these tasks
occupy only a few minutes and perhaps thei r effect i s not f e l t . Having
regard to this sequence of operations, i t i s apparent why the rated loading
capacity of the shore based equipment is seldom attained.
Vessel Size and Loading Rate
The t o t a l time spent loading for a ship of a certain size i s natu
r a l l y of interest to both ship owners and port authorities; for the former
on account of i d l e time considerations, and for the l a t t e r for the provision
of adequate f a c i l i t i e s . The shipper on the other hand is concerned with
the rate of handling cargo; the number of tons loaded in a day d i r e c t l y
affects the cost to him of the vessel's time whilst i n port. Having
examined the f i r s t dependency i n a previous section, attention can now be
given to the second.
Observing four different cargo types over four different crop years
gives r i s e to sixteen sets of observations, and these sets are presented
i n a series of scatter diagrams i n Figures 5-2 through 5-17; i n each of
these, the achieved loading rate i n tons per day is plotted against the
size of the vessel in net register tons. A scanning of the pattern of
observations reveals that for most of the sets there i s a d i s t i n c t tendency
for the loading rate to increase with ship s i z e , providing tentative evidence
in favour of one of the o r i g i n a l hypotheses. This relationship can be quan
t i f i e d to a.certain extent by resorting to correlation analysis, which
reveals correlation coefficients that are presented in Table 5-7.

Loading Rate » Tons/day (3
WHEAT 1964-65
— i — — —i 1 1 1—
2000 4000 6000 8000 10,000 . FIGURE 5-2
SCATTER DIAGRAM OF SHIP SIZE AND OBSERVED LOADING RATE
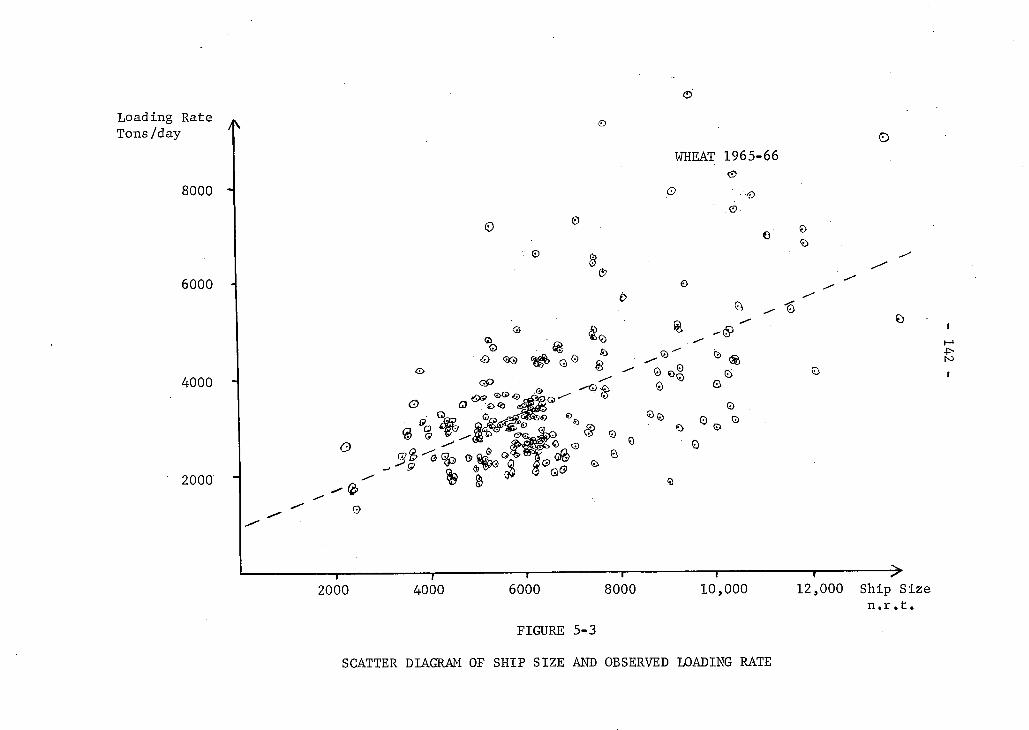
Loading Rate Tons/day
8000 H
6000
4000 H
2000 1
6)
0
0
WHEAT 1965-66
.0
— , r — i 1 1 < > 2000 4000 6000 8000 10,000 12,000 Ship Size
n . r . t .
FIGURE 5-3
SCATTER DIAGRAM OF SHIP SIZE AND OBSERVED LOADING RATE
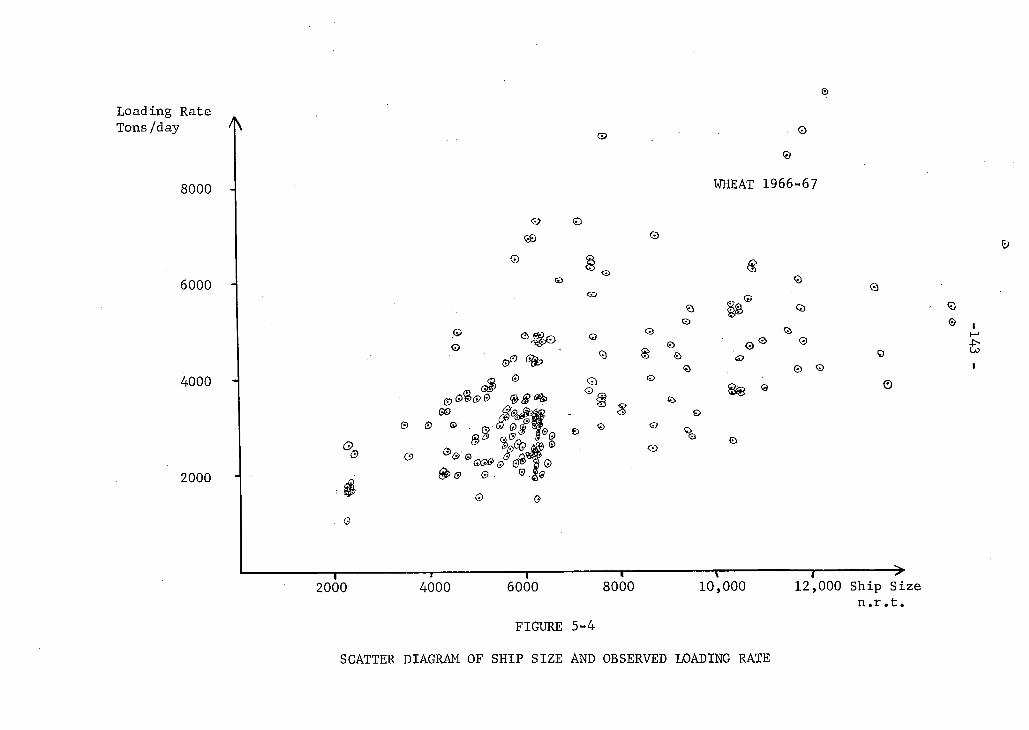
Loading Rate Tons/day
8000
6000 H
4000 H
2000
©
WHEAT 1966-67
© © © . M Q ®ma
<3
61
«5> » » 0 ®@Q3&@"Q^Q)
®
© © ©
2000 4000 6000 8000 t 10,000 12,000 Ship Size
n.r.t. FIGURE 5-4
SCATTER DIAGRAM OF SHIP SIZE AND OBSERVED LOADING RATE
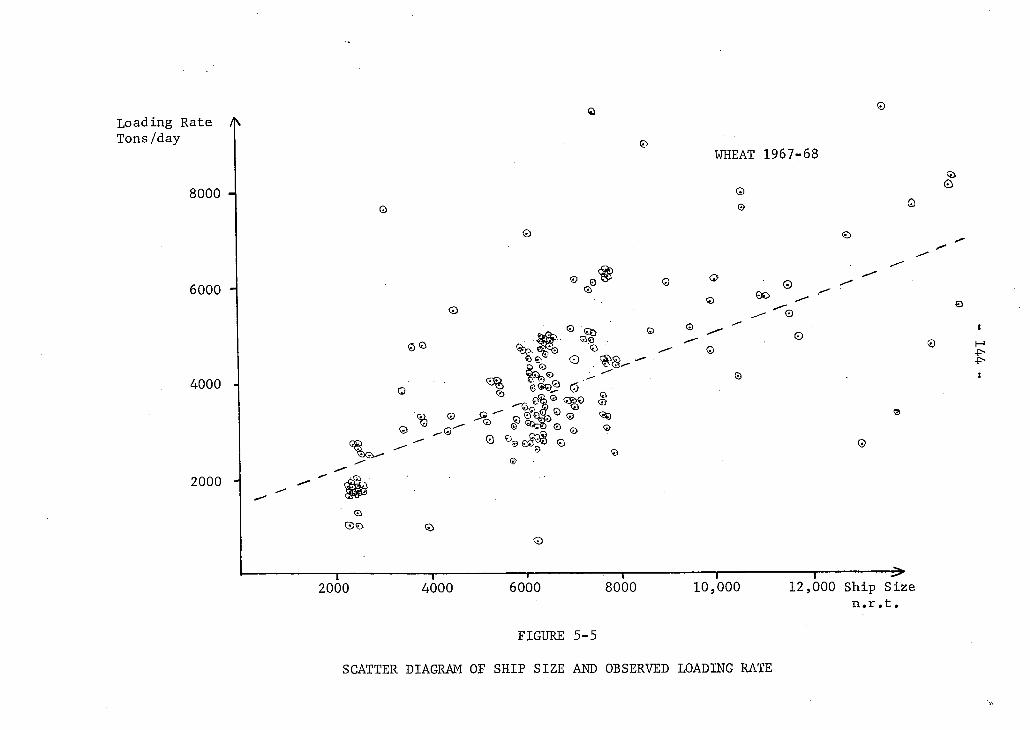
Loading Rate /]\ Tons/day
8000 H
6000 H
4000 A
2000
2000
0©
©
©
4000
© B ' CB
cb
9
CD
WHEAT 1967-68
©
©
©
6000 8000
© ©
©
©
©
1 1 10,000 12,000 Ship Size
n.r . t .
4> 4>
FIGURE 5-5
SCATTER DIAGRAM OF SHIP SIZE AND OBSERVED LOADING RATE
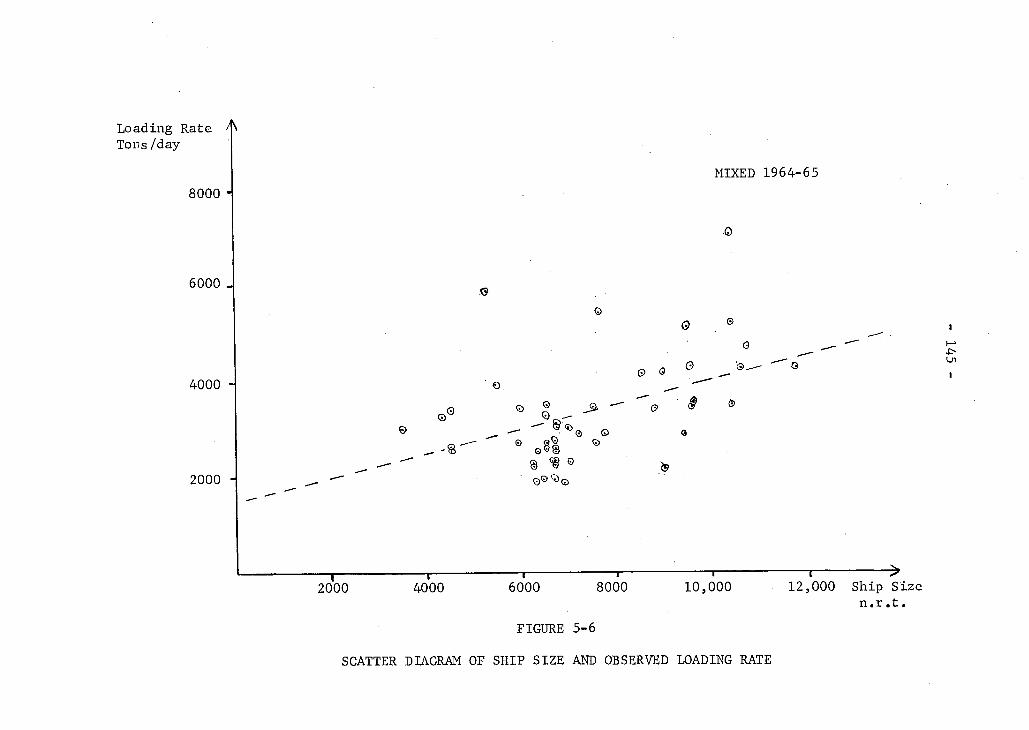
Loading Rate ^ Tons/day
8000 i
6000 J
4000 A
2000 H
MIXED 1964-65
0 o
6>
§ <5>
e .81 ®
, 1 1 1 ' 1 ^ 2000 4000 6000 8000 10,000 12,000 Ship Size
n.r.t. FIGURE 5-6
SCATTER DIAGRAM OF SHIP SIZE AND OBSERVED LOADING RATE
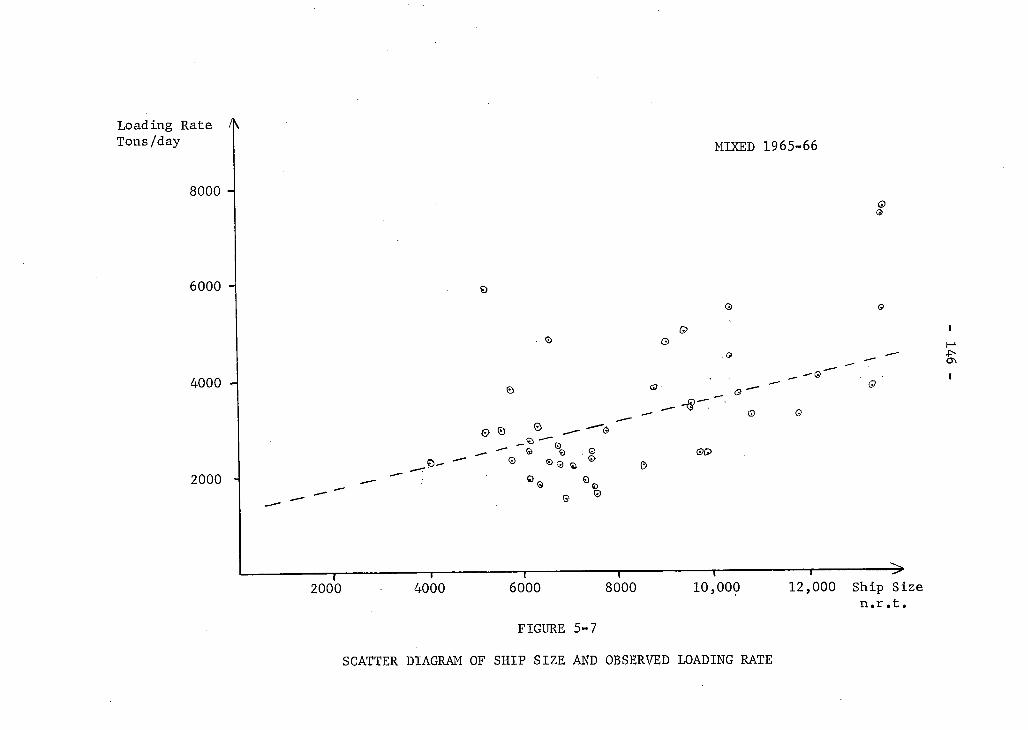
Loading Rate /\\ Tons/day
8000 H
6000 A
4000 A
2000
© © ©
MIXED 1965-66
© 0
s 9 « ©
4>-
1 " 1 1 1 1 1 ^ 2000 4000 6000 8000 10,000 12,000 Ship Size
n.r . t . FIGURE 5-7
SCATTER DIAGRAM OF SHIP SIZE AND OBSERVED LOADING RATE

Loading Rate ^ Tons/day
8000 H
6000 A
4000 A
2000 A
— I — 2000
MIXED 1966-67
&
©
<•> © © 8 ©
4000 6000 8000 10,000 12,000 Ship Size n.r . t .
FIGURE 5-8
SCATTER DIAGRAM OF SHIP SIZE AND OBSERVED LOADING RATE
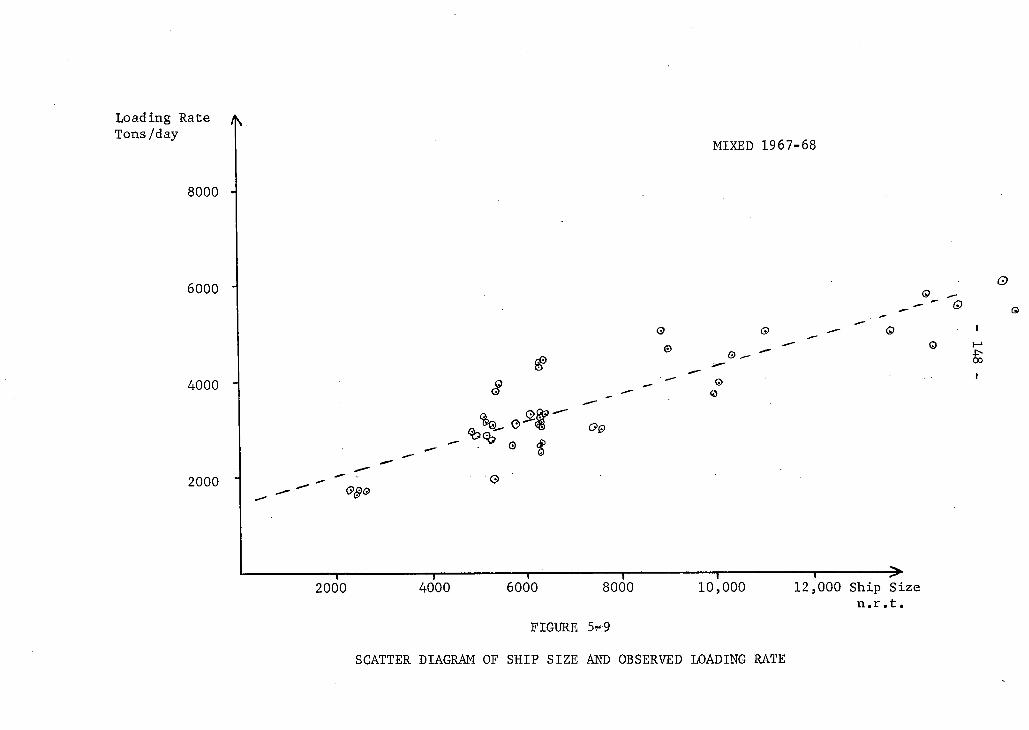
Loading Rate ^ Tons/day
8000
6000 1
4000
2000
MIXED 1967-68
0
4> oo
2
& *** • 0 £
Q®0
2000 4000 6000 1—
8000 10,000 12,000 Ship Size n.r.t.
FIGURE 5r-;9
SCATTER DIAGRAM OF SHIP SIZE AND OBSERVED LOADING RATE
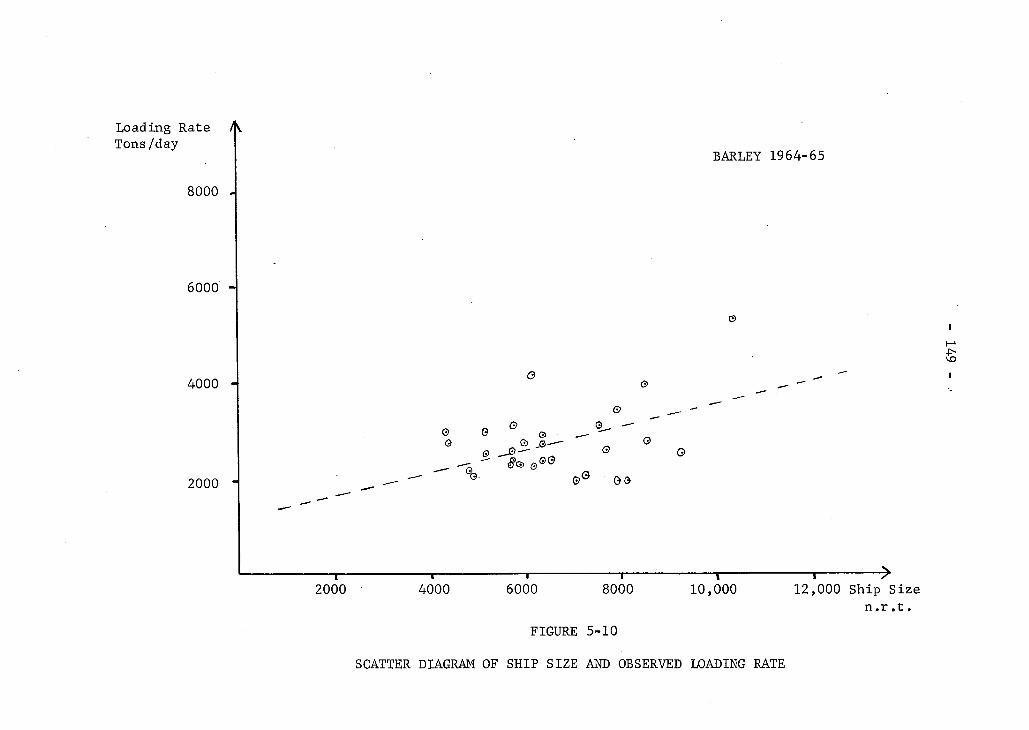
Loading Rate /K Tons/day BARLEY 1964-65
0 0 ©
03
1— 8000
1 10,000 2000 4000 6000 12,000 Ship Size
n.r . t . FIGURE 5-10
SCATTER DIAGRAM OF SHIP SIZE AND OBSERVED LOADING RATE

Loading Rate Tons/day
8000 A
6000 A
4000
2000 A
BARLEY 1965-66
fflO
© —
© ©
© a 9
— i — 1 1 1 1 1 ^ 2000 4000 6000 8000 10,000 12,000 Ship Size
n.r.t. FIGURE 5-11
SCATTER DIAGRAM OF SHIP SIZE AND OBSERVED LOADING RATE
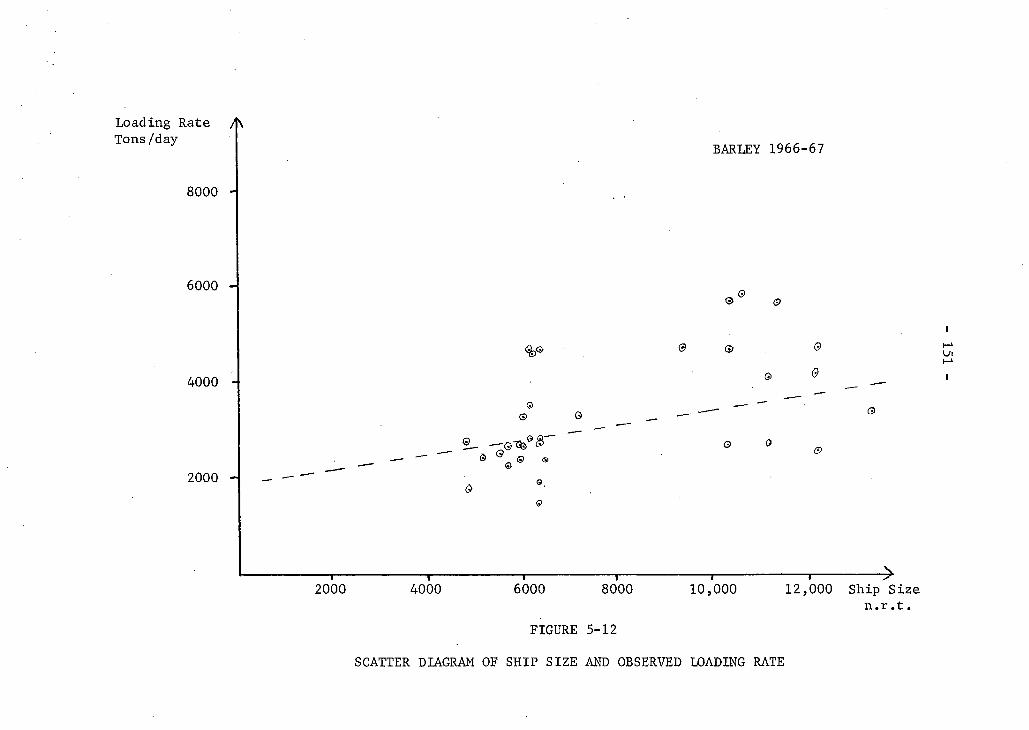
Loading Rate /̂\ Tons/day
8000 A
6000 H
4000 A
2000 H
C?
9
BARLEY 1966-67
~ 0
® C P
0 © © © 0
0 0
2000 4000 6000 8000 10,000 12,000 Ship Size n.r.t.
FIGURE 5-12
SCATTER DIAGRAM OF SHIP SIZE AND OBSERVED LOADING RATE
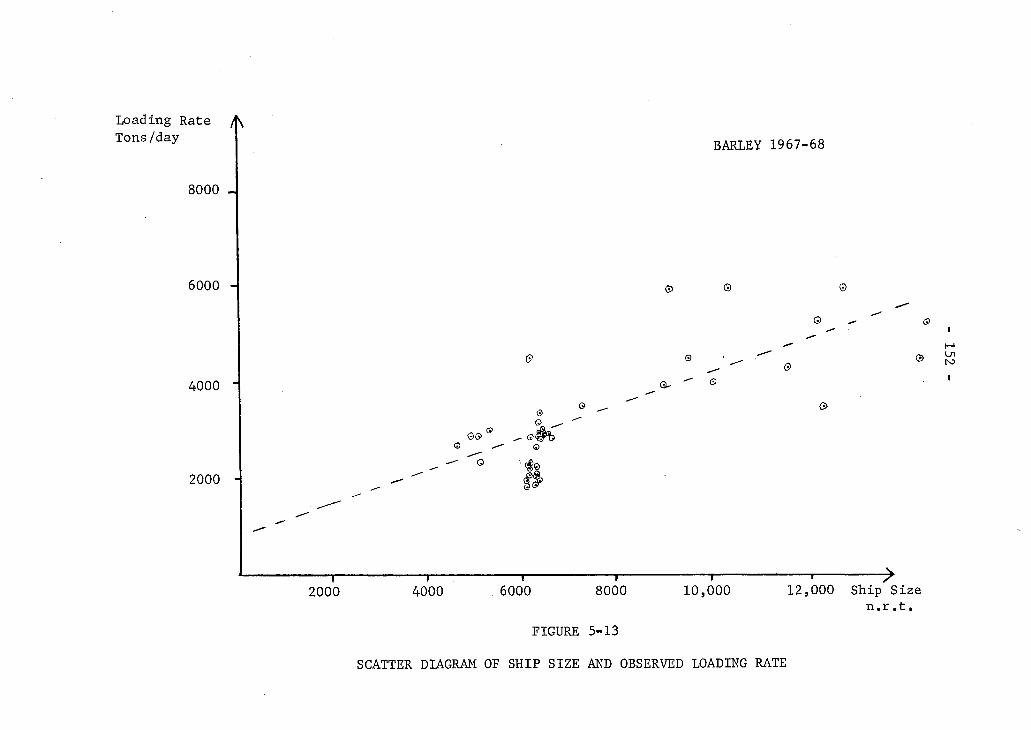
Loading Rate /K Tons/day BARLEY 1967-68
©
o
©9 ©
;<f©
1 r— 4000 6000
> —
8000 2000 10,000 12,000 Ship Size n.r . t .
FIGURE 5-13
SCATTER DIAGRAM OF SHIP SIZE AND OBSERVED LOADING RATE
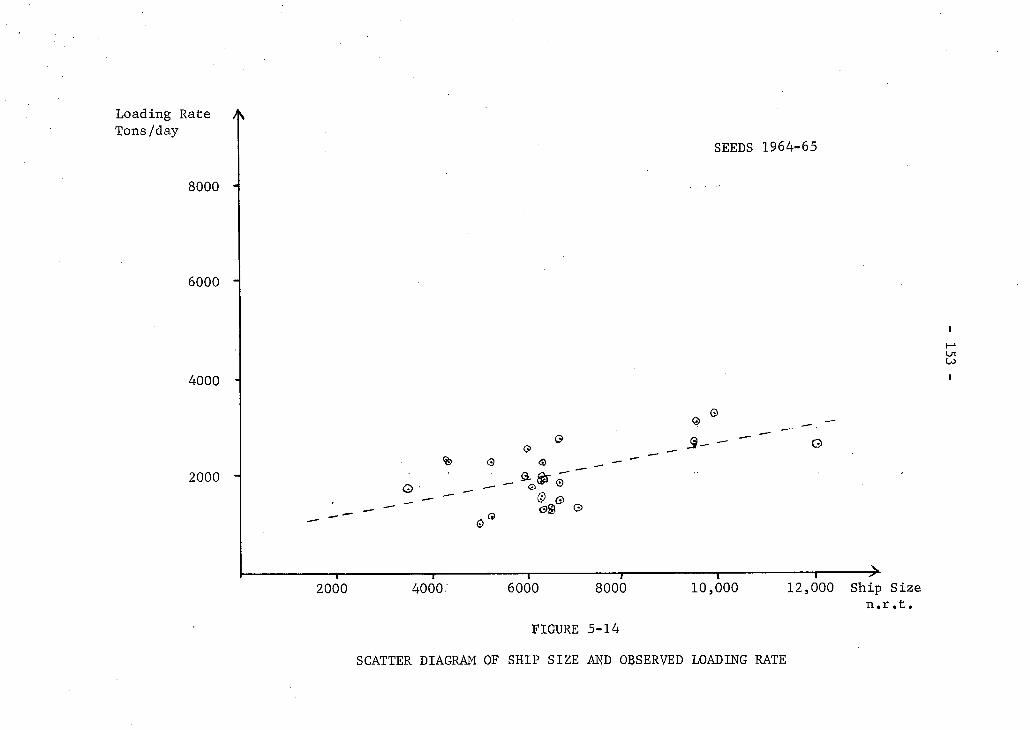
Loading Rate Tons/day
8000 H
6000 H
4000 H
2000 H
SEEDS 1964-65
Ln LO
& 3-
Q
O
& G> 0g ©
2000 4000 6000 T~ 8000 10,000 12,000 Ship Size
n.r.t. FIGURE 5-14
SCATTER DIAGRAM OF SHIP SIZE AND OBSERVED LOADING RATE
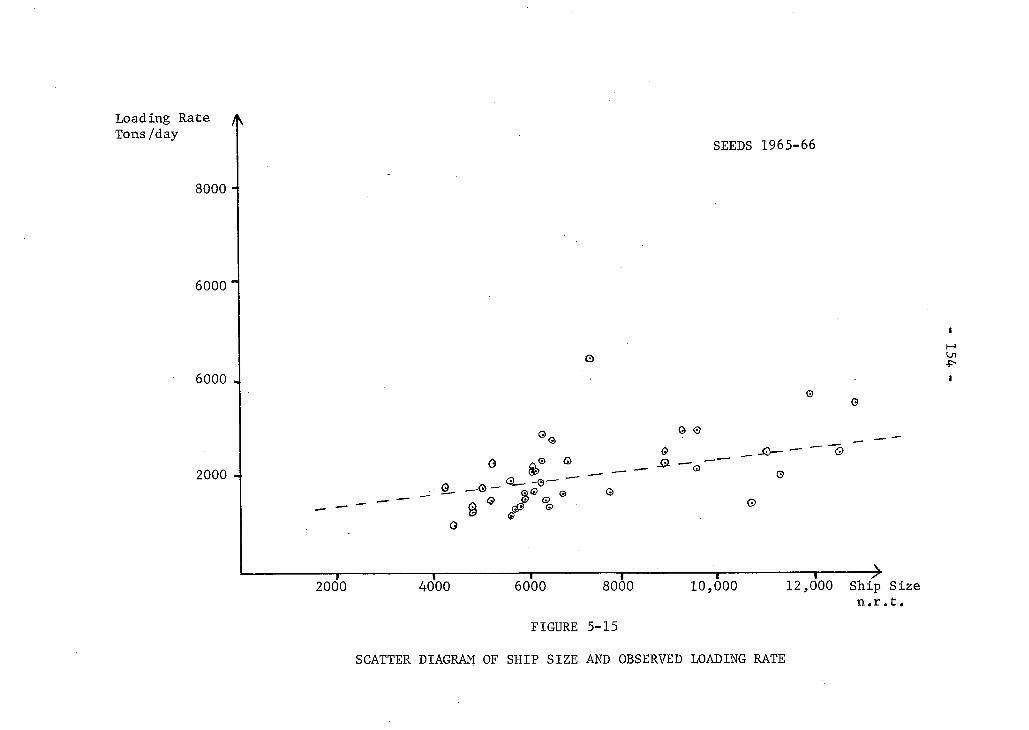
Loading Rate /K Tons/day SEEDS 1965-66
© 0
$ T _ - -
©
4>
2000 4000 6000 8000
FIGURE 5-15
10,000 12,000 Ship Size n.r.t.
SCATTER DIAGRAM OF SHIP SIZE AND OBSERVED LOADING RATE
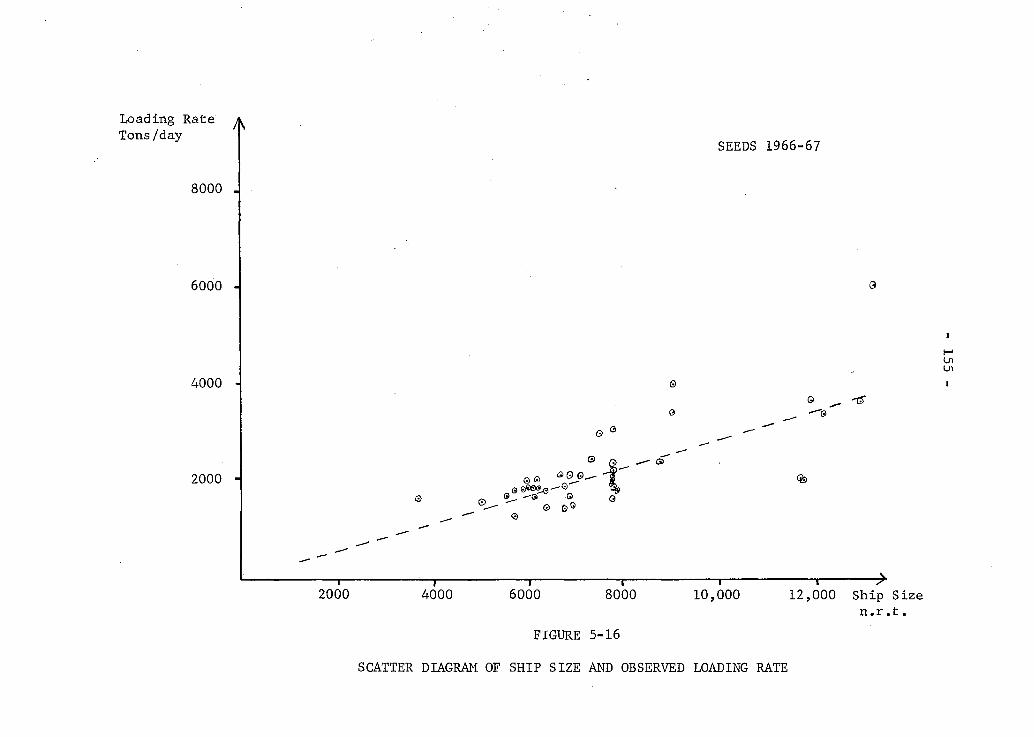
Loading Rate \ Tons/day SEEDS 1966-67
0
0
© ^ -IS" —©
Ln
2000 4000 6000 8000
FIGURE 5-16
10,000 12,000 Ship Size n.r.t.
SCATTER DIAGRAM OF SHIP SIZE AND OBSERVED LOADING RATE
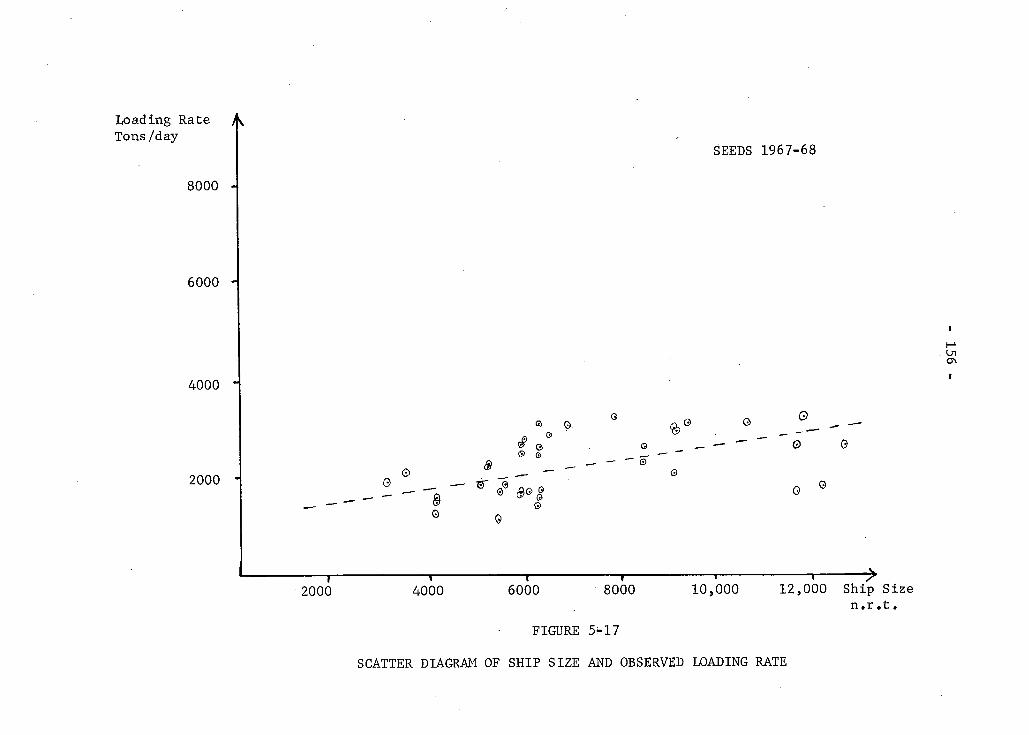
Loading Rate A Tons/day
SEEDS 1967-68
8000 A
6000
4000 A
2000 A G 0
0 ©
G
0 0 0
G Q
0
2000 4000 6000 8000 . • >
10,000 12,000 Ship Size n.r . t .
FIGURE 5-17
SCATTER DIAGRAM OF SHIP SIZE AND OBSERVED LOADING RATE
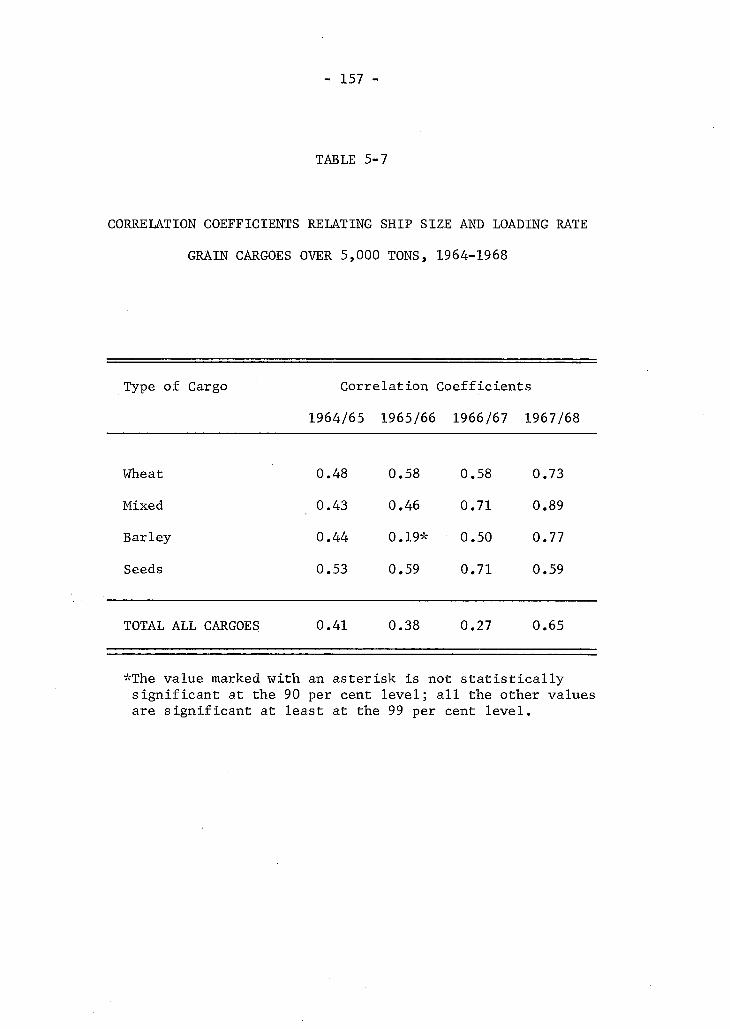
- 157 -
TABLE 5-7
CORRELATION COEFFICIENTS RELATING SHIP SIZE AND LOADING RATE
GRAIN CARGOES OVER 5,000 TONS, 1964-1968
Type of Cargo Correlation Coefficients
1964/65 1965/66 1966/67 1967/68
Wheat 0.48 0.58 0.58 0.73
Mixed 0.43 0.46 0.71 0.89
Barley 0.44 0.19* 0.50 0.77
Seeds 0.53 0.59 0.71 0.59
TOTAL ALL CARGOES 0.41 0.38 0.27 0.65
*The value marked with an asterisk i s not s t a t i s t i c a l l y s i g n i f i c a n t at the 90 per cent l e v e l ; a l l the other values are s i g n i f i c a n t at least at the 99 per cent l e v e l .
- 158 -
While not being generally strong, the correlations are nevertheless
consistent. The best value i s that of 0.89 for mixed wheat cargoes in
1967/68 and the lowest is the 0.19 for barley i n 1965/66; the l a t t e r value
i s not s i g n i f i c a n t l y different from zero even at the 90 per cent l e v e l .
The low values of the o v e r a l l correlation r e l a t i v e to those of the i n d i v i
dual cargo types underscores the importance of taking cargo into account;
mere c l a s s i f i c a t i o n as grain does much to obscure the differences i n
loading performance which actually occur.
For both wheat and mixed wheat cargoes the coefficients have
increased steadily over the study period, and t h i s , coupled with a v i s u a l
check of the scatter diagrams, confirms that less extreme and uncharac
t e r i s t i c observations are found i n the lat e r years. This points i n the
direc t i o n of an improvement i n despatching techniques, and i t i s doubly
encouraging that i t occurs for wheat--the dominant cargo type.
These correlation values described are l i k e l y to be adversely
affected by any p a r t i a l cargoes which appear i n the sample, and i n addition
the size of certain vessels i s inadequately described by the i r net register
tonnage as has been discussed above. By correlating loading rate with the
size of the ship load, these effects can be removed while the size component
is hopefully retained. Performing these calculations yields the coefficients
presented i n Table 5-8. I t can be seen that every value has either increased
or remained the same; no values have deteriorated i n significance. The best
value is again 0.89 for mixed wheat cargoes i n 1967/68 and the lowest 0.28
for barley i n 1965/66. The figures for 1967/68 seem to be generally higher
than i n other years and the correlation i s quite marked.
A phenomenon observed in the scatter diagrams is that of "clumping"
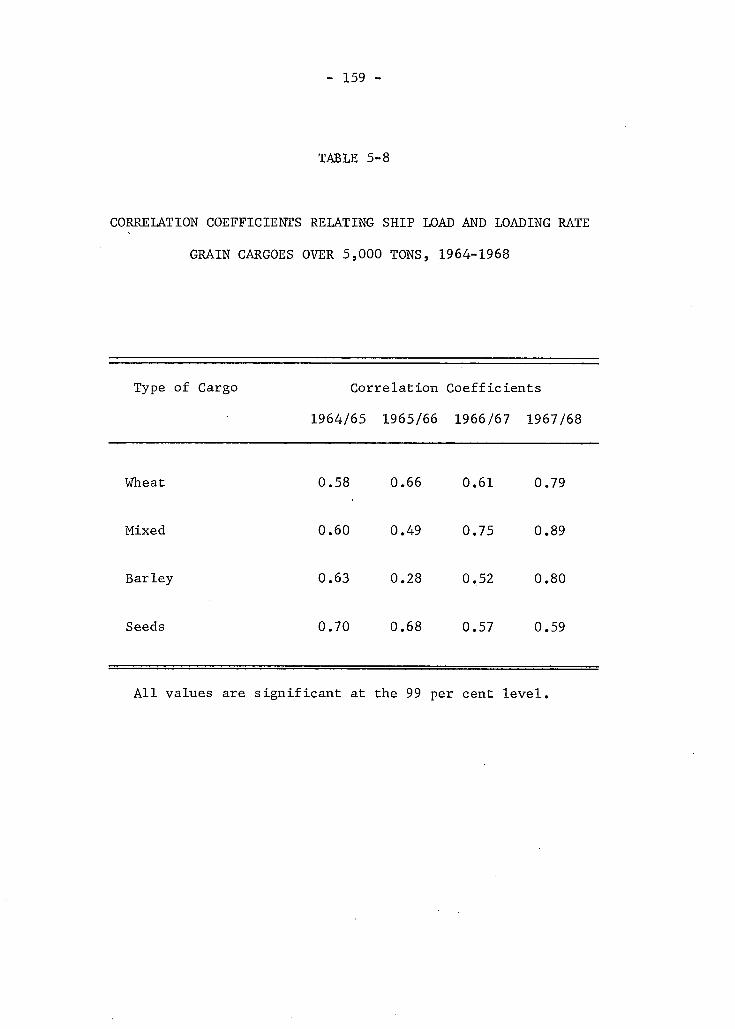
- 159 -
TABLE 5-8
CORRELATION COEFFICIENTS RELATING SHIP LOAD AND LOADING RATE
GRAIN CARGOES OVER 5,000 TONS, 1964-1968
Type of Cargo Correlation Coefficients
1964/65 1965/66 1966/67 1967/68
Wheat 0.58 0.66 0.61 0.79
Mixed 0.60 0.49 0.75 0.89
Barley 0.63 0.28 0.52 0.80
Seeds 0.70 0.68 0.57 0.59
A l l values are s i g n i f i c a n t at the 99 per cent l e v e l .
- 160 -
of the observations; for a given ship s i z e , the observed loading rates tend
to f a l l into groups. This i s a consequence of the discrete nature of the
measured loading time. Since ships of a given size generally carry the
same amount of cargo, the difference between, say, a three day loading
period and a four day loading period can cause an appreciable difference
in the observed loading rate. Each of the clumps of observations therefore,
corresponds to a given loading time, with the shortest loading time most
extreme from the axis (since this leads to a very high loading r a t e ) .
As a possible predictor of loading rate given ship s i z e , some sort
of regression model i s perhaps of use; we can postulate a simple r e l a t i o n
ship of the form
(loading rate) = A + B (ship size)
i n which case the coefficients of the best f i t t i n g least squares l i n e can
be established. Putting this into effect gives the results i n Table 5-9.
The explanatory portion of the results i s nowhere remarkable, but 2
seems higher in 1967/68 than i n other years. The highest R value was
0.79 for mixed wheat cargoes i n 1967/68, and the lowest was for the by
now regular exception barley in 1965/66. Again, an improvement might be
expected when loading rate i s regressed against ship load. 2
As witnessed by Table 5-10 this i s i n fact the case; only one R
value f a i l e d to increase i n the second case, that of seeds cargoes in
1966/67. Of the remainder, some t h i r t y or forty per cent of the v a r i a t i o n
i n the data i s now explained, but this i s s t i l l by no means satisfactory.
Of course, even leaving aside berth changes, which w i l l be dealt with l a t e r ,
there are many circumstances which can cause deviations i n the pattern of
ship loading.
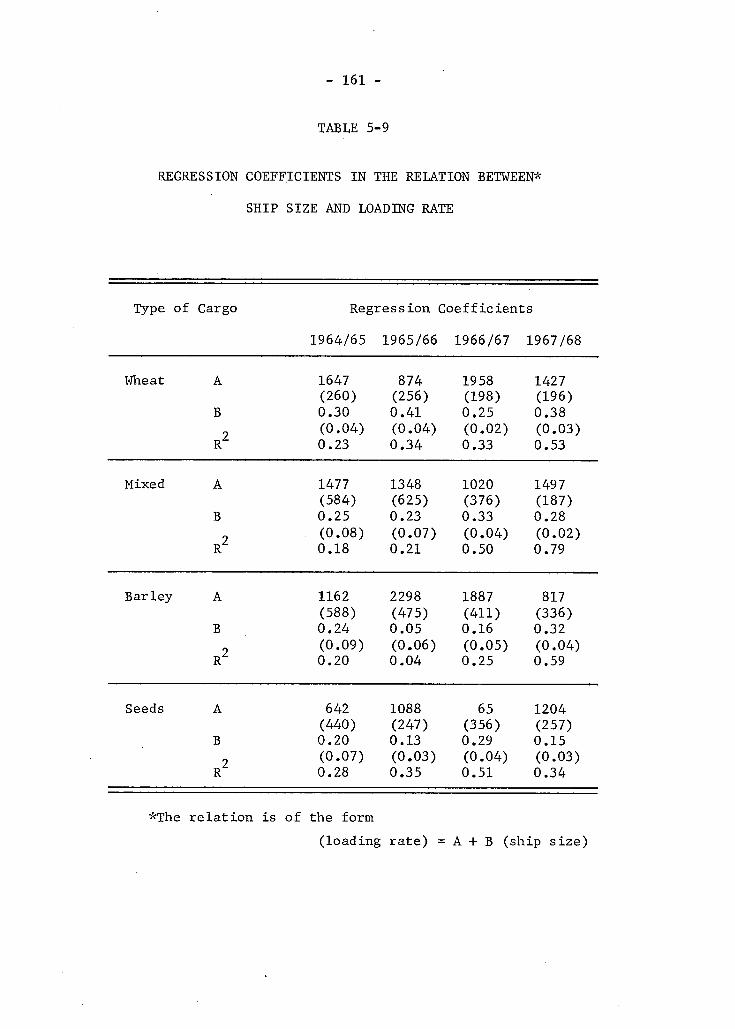
- 161 -
TABLE 5-9
REGRESSION COEFFICIENTS IN THE RELATION BETWEEN*
SHIP SIZE AND LOADING RATE
Type of Cargo Regression Coefficients
1964/65 1965/66 1966/67 1967/68
Wheat A 1647 874 1958 1427 (260) (256) (198) (196)
B 0.30 0.41 0.25 0.38 9
(0.04) (0.04) (0.02) (0.03) R Z 0.23 0.34 0.33 0.53
Mixed A 1477 1348 1020 1497 (584) (625) (376) (187)
B 0.25 0.23 0.33 0.28 9 (0.08) (0.07) (0.04) (0.02)
R Z 0.18 0.21 0.50 0.79
Barley A 1162 2298 1887 817 (588) (475) (411) (336)
B 0.24 0.05 0.16 0.32 9 (0.09) (0.06) (0.05) (0.04)
R Z 0.20 0.04 0.25 0.59
A 642 1088 65 1204 (440) (247) (356) (257)
B 0.20 0.13 0.29 0.15 9 (0.07) (0.03) (0.04) (0.03)
Rl 0.28 0.35 0.51 0.34
*The r e l a t i o n i s of the form (loading rate) = A + B (ship size)
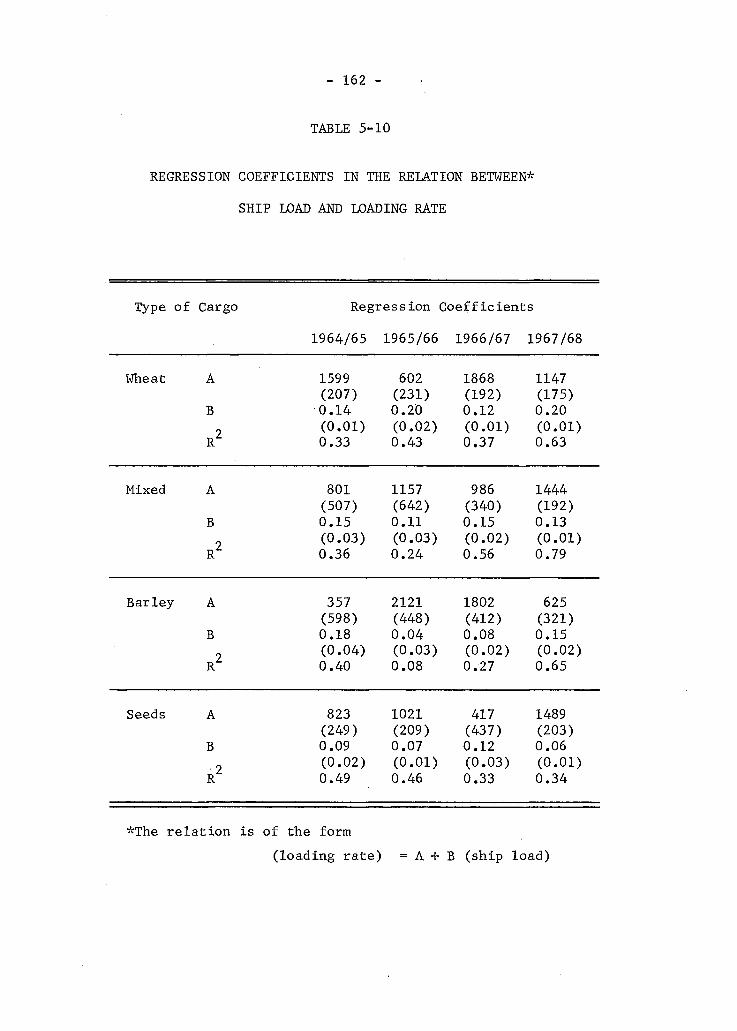
- 162 -
TABLE 5-10
REGRESSION COEFFICIENTS IN THE RELATION BETWEEN*
SHIP LOAD AND LOADING RATE
Type of Cargo Regression i Coefficients
1964/65 1965/66 1966/67 1967/68
Wheat A 1599 602 1868 1147 (207) (231) (192) (175)
B 0.14 0.20 0.12 0.20 0 (0.01) (0.02) (0.01) (0.01)
R 0.33 0.43 0.37 0.63
Mixed A 801 1157 986 1444 (507) (642) (340) (192)
B 0.15 0.11 0.15 0.13 9 (0.03) (0.03) (0.02) (0.01)
R 0.36 0.24 0.56 0.79
Barley A 357 2121 1802 625 (598) (448) (412) (321)
B 0.18 0.04 0.08 0.15 9 (0.04) (0.03) (0.02) (0.02)
R 0.40 0.08 0.27 0.65
Seeds A 823 1021 417 1489 (249) (209) (437) (203)
B 0.09 0.07 0.12 0.06 9 (0.02) (0.01) (0.03) (0.01)
R 0.49 0.46 0.33 0.34
*The r e l a t i o n i s of the form (loading rate) = A + B (ship load)

- 163 -
Some of these d i s t o r t i n g factors have been mentioned in the preceding
analysis of loading times, but there are additional ones. F i r s t l y , the
intrusion of a weekend or holiday into the anticipated loading period may
cause an e f f o r t to be made to complete the vessel before the holiday
s t a r t s ; having regard to the prospective id l e time, the ship owner may
consider overtime and extra gangs a worthwhile investment. This action
would increase the observed loading rate, even though the l e v e l attained
might not be an economic one i n normal circumstances. Secondly, the
incidence of the cancellation date of an ensuing charter might well cause
a ship owner to load at a prodigious rate; with the prospect of losing two
or three months prof i t a b l e employment some extra stevedoring charges would
be well worthwhile. Again the rate attained might we l l be exceedingly
uneconomic having regard only to short run factors. Thirdly, the size of
a ship i s not always an indication of the sophistication of i t s handling
equipment. Tankers are obvious candidates for inclusion i n this c lass,
generally loading rather more slowly than dry bulk carriers of the same
capacity. Even small improvements in the physical layout can make a sub
s t a n t i a l difference to ease of handling. The case of the "Angelo S c i n i -
c a r e l l o " is a good i l l u s t r a t i o n of t h i s . In January 1967 this vessel loaded
almost 24,000 tons of feed barley and because of inadequate access into the
wing tanks, considerable d i f f i c u l t y was encountered i n trimming the load;
the loading rate attained was approximately 2,600 tons per day. As a
result of this poor performance, the owners inserted at no great expense
an extra hole i n the w a l l of the tank; this obviated the need for hand
trimming on her next v i s i t to Vancouver i n 1968, and the loading rate which 19
was achieved rose to almost 3,700 tons per day.
19 Statement by Mr. Meredith Berridge i n a personal interview.
- 164 -
The only way that these factors can be isolated is by examining i n
d e t a i l each deviant loading rate noted on any of the scatter diagrams.
In theory, this might be possible, but i n practice the data which i s easily
accessible i s inadequate to the task.
If the minutae of the ship loading records are desired, i t i s
necessary to explore many separate primary sources. Various aspects of
the operation are covered in records kept by the stevedoring companies,
the elevator companies, the shipping agencies, the National Harbours Board,
and the multifarious trade associations; however, many of these agencies
regard their records as confidential and access i s not eas i l y gained by
the researcher.
Because of the many possible problems encounterable i n ship loading,
some delay beyond the optimal becomes l i k e l y . I t is thus possible that the
observed loading rates for each size class of vessels w i l l range from a
low figure (representing extreme delay) to a maximum figure (representing
the optimum attainable rate under ideal circumstances, or as near to this
state as has ever been achieved). In other words, small ships may never
be observed to load rapidly but large ships may be observed to load slowly
for any or a l l of the reasons which have been mentioned so f a r . It i s this
maximum achieved loading rate which one might expect to be correlated with
ship s i z e . The empirical findings can now be examined to see i f this
theory can be substantiated.
Consider for example Fogure 5-18 which i s a scatter diagram of
loading rate against ship size for a l l grain cargoes i n 1967/68. There i s
a marked boundary to the area covered with observations which, for c l a r i t y ,
has been marked with a dotted l i n e . Crudely, this would seem to support
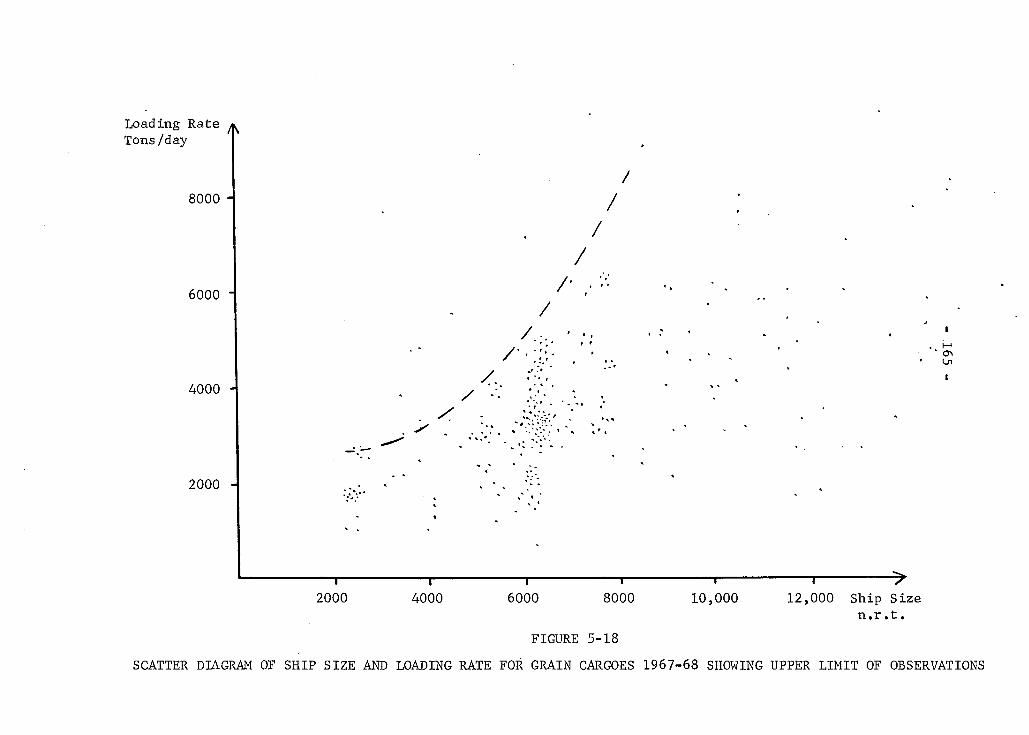
Loading Rate ^ Tons/day
8000 H
6000 i
4000 H
/
/ /
/
/ /
/
2000
1 1 1 1 1 i >
2000 4000 6000 8000 10,000 12,000 Ship Size n.r . t .
FIGURE 5-18 SCATTER DIAGRAM OF SHIP SIZE AND LOADING RATE FOR GRAIN CARGOES 1967-68 SHOWING UPPER LIMIT OF OBSERVATIONS

- 166 -
the above hypothesis. Investigating the points along the boundary further
reveals that for the smallest vessels, between 2,000 and 4,000 n . r . t . , the
points represent loading times of two days; for ship sizes between 4,000
and 7,000 n . r . t . the boundary represents a loading period of three days;
for ship sizes above this figure the boundary becomes indistinct due to
lack of sufficient observations, but the dominating loading period would
seem to be four days. Although very occasionally a vessel has been known
to load in a single day, or in two days for large ships, i t seems that
these values of two days and three days represent minima which i t is not
thought practicable or economic to reduce.
This suggests that the real relationship between size and loading
rate is not a straight l ine as was assumed in the regression model, but
a r i s ing step function with discontinuit ies , something akin to Figure
5-19.
The most obvious explanation of these discontinuities is most
probably the correct one--that they are caused merely by the discrete
measurement of loading time which was used. The breaks occur at ship sizes
of 4,000 and 7,000 n . r . t . respectively, and the cargo capacity of the former
is about 10,000 tons and that of the latter is about 17,500 tons. Making
allowances for opening the hatches, trimming and so on, the capacity of a
grain berth using two belts for a single eight hour shift is roughly 5,000
tons per day. A vessel of either 4,000 or 7,000 n . r . t . w i l l thus u t i l i s e
at f u l l stretch a two or three day loading period respectively. Any vessel
s l ight ly larger may occasionally work overtime to f in i sh , but generally
w i l l require a few hours on the ensuing day to complete i ts load; because
of the way that the records are kept, this counts as a f u l l day of loading
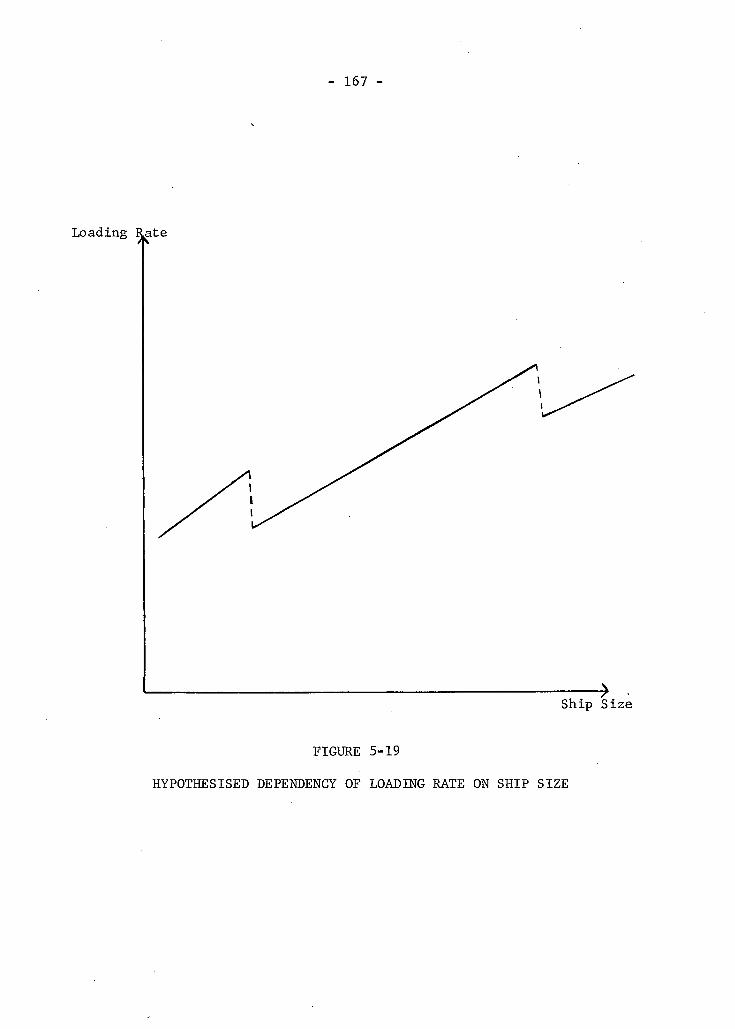
- 167 -
Loading R̂ ate
Ship Size
FIGURE 5-19
HYPOTHESISED DEPENDENCY OF LOADING RATE ON SHIP SIZE
- 168 -
and so gives r ise to the steps in the function. This only deals with the
shape of the boundary and does not invalidate the concept; i t does confirm
that which shippers of such "integrated" commodities as iron ore have known
for some time—a better average performance is maintained by matching the
vessel to the shore based equipment and vice versa.
An empirical test of a l l the "boundary" points, encompassing the
entire range of ship sizes, reveals that the correlation between loading
rate and ship size is 0.81, which is a strong correlat ion. However, there
are comparatively few observations for ships in excess of 8,000 n . r . t . and
there is no discernible upper l imit to the loading rate in this region. If
we res tr ic t the correlation analysis only to vessel sizes below 8,000 n . r . t .
the correlation coefficient is 0.90; this is a highly significant correlation
and is strong evidence that for loading situations which are undisturbed,
loading rate is dependent upon and increases with ship size; the second
hypothesis thus receives support in the ceteris paribus case. The shape
of the boundary in Figure 5-18 is also consistent with a non-linear re la
tionship between attainable loading rate and ship size—loading rate in
creasing rapidly for larger ship sizes. This is in accord with expectations
based on the technological improvements possible in these larger vessels.
Movement Between Berths
Basical ly , there are two underlying causes of a berth change. The
size of a vessel may be too great for i t to be f i l l e d at any one elevator,
or the diverse nature of the cargo may require v i s i t s to different berths.
The f i r s t factor contributes towards lengthening the loading time of large
ships, but the second factor is equally applicable to any size of vessel .
- 169 -
Inevitably, there are a certain number of small vessels which take on
cargoes with many constituent parts, and this may delay them as long as
the larger vessels.
The relationship between berth changes and cargo type was presented
in Table 4-14 where the increase i n the number of berth v i s i t s for the more
complicated cargoes can be c l e a r l y seen. If the number of berths v i s i t e d
i s correlated with ship load, on the other hand, the results obtained are
shown i n Table 5-11.
Correlation on the whole i s not good, with several values not s i g n i f i
cantly different from zero at the 90 per cent l e v e l . The most consistent
results are for wheat, which is to be expected since i t i s the most homo
geneous cargo and the most widely stocked.
Another aspect of berth movements is the additional time added to
that normally required for loading when a berth change is necessary. An
idea of this quantity can be had from the second (B) c o e f f i c i e n t i n the
regression equation of loading time against number of berths v i s i t e d . The
values of these c o e f f i c i e n t s , along with t h e i r respective standard errors,
are shown in Table 5-12.
These results are f a i r l y consistent within the different cargo types.
Considering a working day to be made up of eight hours, the results for
wheat imply that a delay of between f i v e and s i x hours is associated with
each change of berth. This agrees remarkably well with the value of f i v e 20
hours reported in the study by Kates, Peat, Marwick and Company.
Kates, Peat, Marwick and Company, West Coast Commodity Trans portation Study Part 1, a Report prepared for the Government of Canada, Department of Transport, May 1967, p. 91.
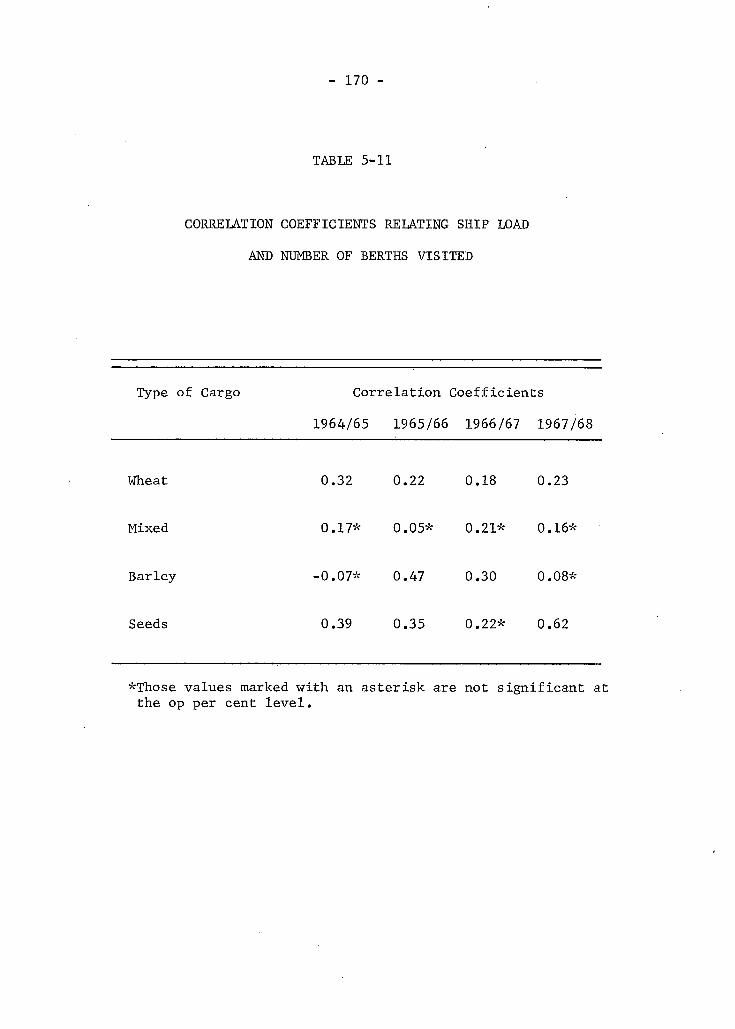
- 170 -
TABLE 5-11
CORRELATION COEFFICIENTS RELATING SHIP LOAD
AND NUMBER OF BERTHS VISITED
Type of Cargo Correlation Coefficients
1964/65 1965/66 1966/67 1967/68
Wheat 0.32 0.22 0.18 0.23
Mixed 0.17* 0.05* 0.21* 0.16*
Barley -0.07* 0.47 0.30 0.08*
Seeds 0.39 0.35 0.22* 0.62
*Those values marked with an asterisk are not s i g n i f i c a n t at the op per cent l e v e l .
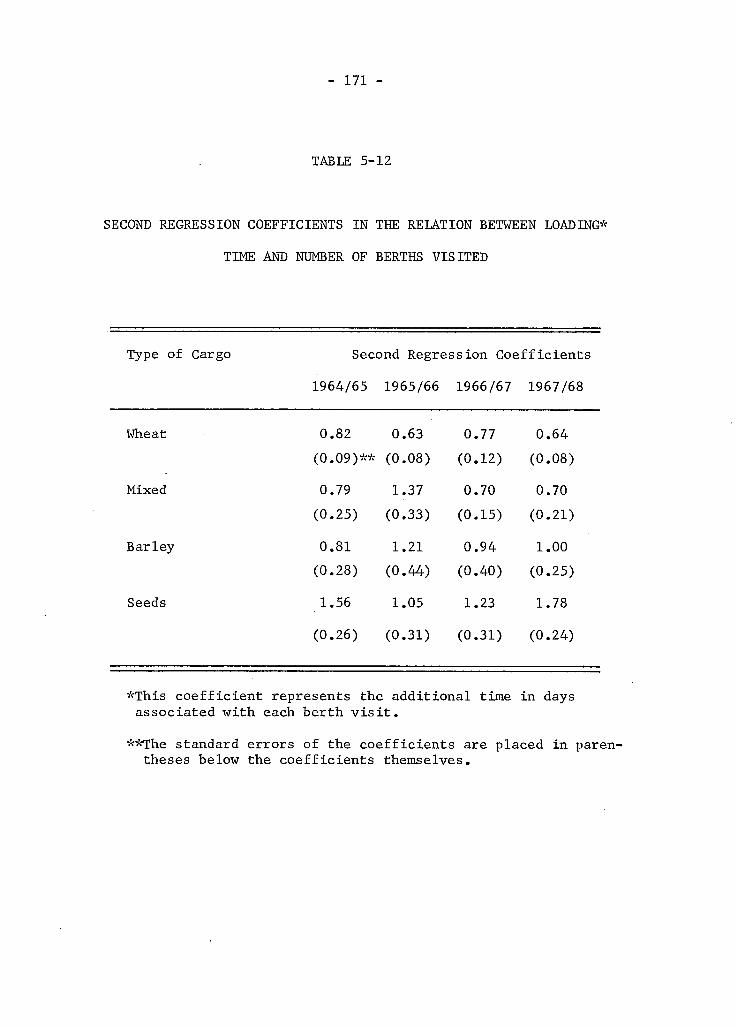
- 171 -
TABLE 5-12
SECOND REGRESSION COEFFICIENTS IN THE RELATION BETWEEN LOADING*
TIME AND NUMBER OF BERTHS VISITED
Type of Cargo Second Regression Coefficients
1964/65 1965/66 1966/67 1967/68
Wheat 0.82 0.63 0.77 0.64 (0.09)** (0.08) (0.12) (0.08)
Mixed 0.79 1.37 0.70 0.70 (0.25) (0.33) (0.15) (0.21)
Barley 0.81 1.21 0.94 1.00 (0.28) (0.44) (0.40) (0.25)
Seeds 1.56 1.05 1.23 1.78
(0.26) (0.31) (0.31) (0.24)
*This c o e f f i c i e n t represents the additional time in days associated with each berth v i s i t .
**The standard errors of the coefficients are placed i n parentheses below the coefficients themselves.

- 172 -
This fixed delay seems to be rather longer in the case of other cargo
types--seeds for instance seem to be associated with a delay of between
eight and twelve hours for each berth change.
This i s s p e c i f i c evidence of the cost of berth changes to the users
of ocean transportation; the benefits to be derived from c o l l e c t i n g supplies
of a given grade of grain i n one place would seem to be considerable. This
point w i l l be taken up again l a t e r , in Chapter VI.
A Two Variable Model
It has been established in previous sections that on account of the
many perturbing factors loading rates and loading times are riot very well
explained on the basis of ship size or berth changes alone. Of the many
variables which influence port time only cargo type, ship size and load,
and the number of berth changes have been found amenable to i s o l a t i o n or
quantification. In this section an attempt w i l l be made to improve the
f i t of the predicted to the actual results by constructing a two variable
regression model for each cargo type.
The f i r s t model takes the form of
(loading rate) = A + B (ship size) + C (berths v i s i t e d )
and the calculated values of the coefficients are presented i n Table 5-13, 2
along with the respective values of R for each regression. 2
Notice that compared with Table 5-9, the value of R has been
improved in every case, i n some instances substantially, which might have
been expected since the internal logic of the model has been improved.
If ship size i s replaced in th i s model by the load taken aboard by the ship,
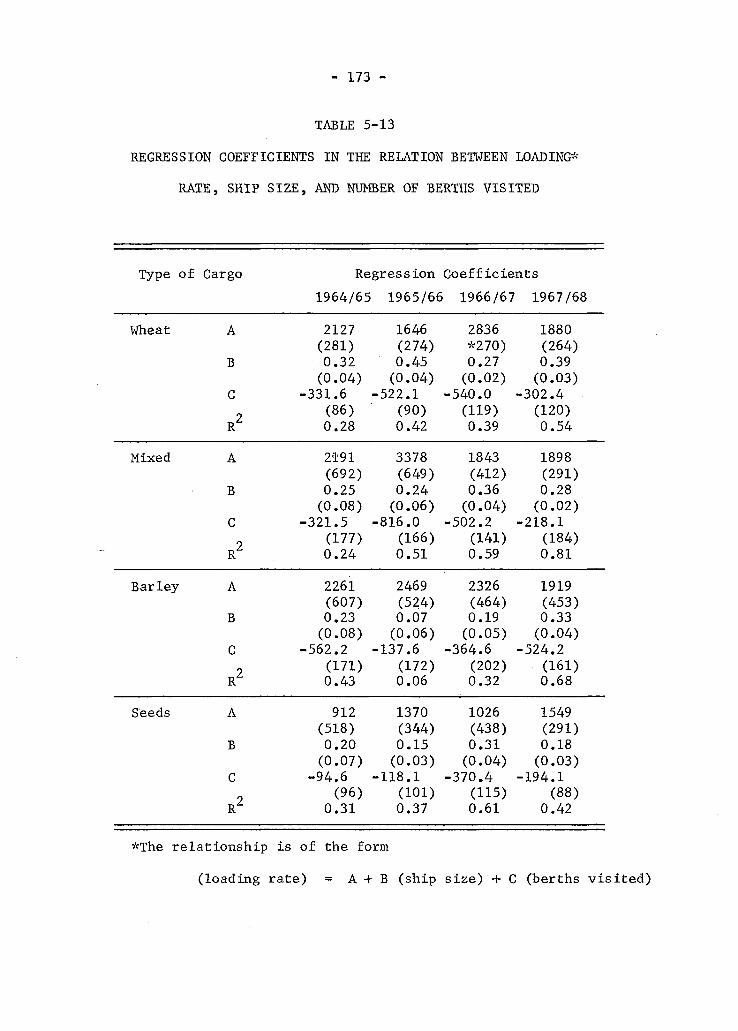
- 173 -
TABLE 5-13
REGRESSION COEFFICIENTS IN THE RELATION BETWEEN LOADING*
RATE, SHIP SIZE, AND NUMBER OF BERTHS VISITED
Type of Cargo Regression Coefficients 1964/65 1965/66 1966/67 1967/68
Wheat A 2127 1646 2836 1880 (281) (274) *270) (264)
B 0.32 0.45 0.27 0.39 (0.04) (0.04) (0.02) (0.03)
C -331.6 -522.1 -540.0 -302.4 9 (86) (90) (119) (120)
R Z 0.28 0.42 0.39 0.54
Mixed A 2191 3378 1843 1898 (692) (649) (412) (291)
B 0.25 0.24 0.36 0.28 (0.08) (0.06) (0.04) (0.02)
C -321.5 -816.0 -502.2 -218.1 9 (177) (166) (141) (184)
R 0.24 0.51 0.59 0.81
Barley A 2261 2469 2326 1919 (607) (524) (464) (453)
B 0.23 0.07 0.19 0.33 (0.08) (0.06) (0.05) (0.04)
C -562.2 -137.6 -364.6 -524.2 9 (171) (172) (202) (161)
R 0.43 0.06 0.32 0.68
Seeds A 912 1370 1026 1549 (518) (344) (438) (291)
B 0.20 0.15 0.31 0.18 (0.07) (0.03) (0.04) (0.03)
C -94.6 -118.1 -370.4 -194.1 9 (96) (101) (115) (88)
R 0.31 0.37 0.61 0.42
*The relationship i s of the form
(loading rate) = A + B (ship size) + C (berths v i s i t e d )

- 174 -
the results i n Table 5-14 are obtained. In only two cases has the value 2
of R declined; seeds cargoes i n 1966/67 and a very s l i g h t decline for
wheat cargoes in 1967/68. Introducing berth changes as well as ship size
has thus increased the explanatory portion of actual loading rates to 80
per cent i n some cases and to more than 50 per cent i n most.
A similar model can be constructed for loading time, so that the
regression i s of the form (loading time) = A + B (ship load) + C (berths v i s i t e d )
The calculated values of the least squares regression coefficients are 2
shown i n Table 5-15, Comparing the R values with those i n Table 5-5,
i t can be seen that there has been an improvement i n every case.
Conclusions
Having performed the analysis which has f i l l e d the preceding chapter,
for c l a r i t y the conclusions can now be collated b r i e f l y with particular
reference to the o r i g i n a l hypotheses.
1. "The t o t a l time spent loading a vessel with a given cargo w i l l increase as the size of the ship increases".
Reference to Table 5-1 on page 124 reveals that a positive correlation
exists for a l l cargo types between ship size and loading time; the correla
t i o n i s strongest and most consistently s i g n i f i c a n t for wheat cargoes, for
which there are many observations, and whose loading process i s r e l a t i v e l y
uncomplicated. In general, the correlation i s not as marked as might be
supposed, but to a certain extent this could be due to the coarse measure
of loading time. Sturmey's contention thus receives q u a l i f i e d but not over
whelming support.

- 175 -
TABLE 5-14
REGRESSION COEFFICIENTS IN THE RELATION BETWEEN LOADING RATE*
SHIP LOAD, AND NUMBER OF BERTHS VISITED
Type of Cargo Regression Coefficients 1964/65 1965/66 1966/67 1967/68
Wheat A 2113 1437: 2249 2438 (203) (240) (270) (239)
B 0.17 0.23 0.16 0.15 (0.01) (0.01) (0.01) (0.01)
C -536.9 -580.4 -578.5 -433.0 9 (77) (81) (109) (121)
R 0.58 0.54 0.48 0.51
Mixed A 1905 3176 1826 1915 (450) (636) (369) (267)
B 0.14 0.12 0.17 0.15 (0.02) (0.03) (0.02) (0.01)
C -473.4 -833.4 -538.6 -352.3 o (140) (161) (129) (119)
R 0.59 0.54 0.66 0.81
Barley A 1680 2326 2223 1566 (347) (469) (474) (438)
B 0.14 0.05 0.09 0.17 (0.02) (0.03) (0.03) (0.02)
C -493.5 -224.3 -325.1 -569.6 9 (143) (175) (196) (142)
R 0.71 0.14 0.33 0.74
Seeds A 1332 1411 1365 2120 (226) (297) (524) (224)
B 0.12 0.08 0.13 0.09 (0.01) (0.01) (0.03) (0.02)
C -284.4 -164.3 -396.3 -386.6 9 (62) (91) (140) (107)
R 0.82 0.50 0.44 0.42
*The relationship i s of the form
(loading rate) = A + B (ship load) + C (berths v i s i t e d )

- 176 -
TABLE 5-15
REGRESSION COEFFICIENTS IN THE RELATION BETWEEN LOADING TIME*
SHIP LOAD, AND NUMBER OF BERTHS VISITED
Type of Cargo Regression Coefficients 1964/65 1965/66 1966/67 1967/68
Wheat A 1.63 2.40 1.96 1.78 (0.21) (0.25) (0.27) (0.15)
B (xlO 0.81 0.52 0.80 0.70 (0.10) (0.14) (0.12) (0.07)
C 0.67 0.57 0.60 0.51 9 (0.08) (0.08) (0.11) (0.08)
R 0.45 0.23 0.29 0.52
Mixed A 2.71 0.40 2.68 2.04 (0.75) (1.20) (0.40) (0.33)
B (xlO ) 0.57 1.31 0.59 0.79 (0.31) (0.47) (0.18) (0.14)
C 0.73 1.33 0.60 0.54 9 (0.23) (0.30) (0.14) (0.15)
R 0.22 0.41 0.41 0.61
Barley A 2.85 1.15 1.72 2.90 (0.64) (1.05) (0.86) (0.78)
B (xlO 0.63 2.47 1.55 0.13 (0.32) (0.65) (0.46) (0.33)
C 0.73 0.51 0.57 1.03 9 (0.26) (0.39) (0.36) (0.25)
R 0.33 0.56 0.41 0.33
Seeds A 0.80 3.13 2.80 0.61 -A (0.83) (0.94) (1.17) (0.64)
B (xlO • ) 1.35 1.47 0.72 1.92 (0.42) (0.39) (0.56) (0.52)
C 1.35 0.67 1.14 0.97 9 (0.23) (0.29) (0.31) (0.31)
R 0.70 0.43 0.31 0.71
*The relationship i s of the form
(loading time) = A + B (ship load) + C (berths v i s i t e d )
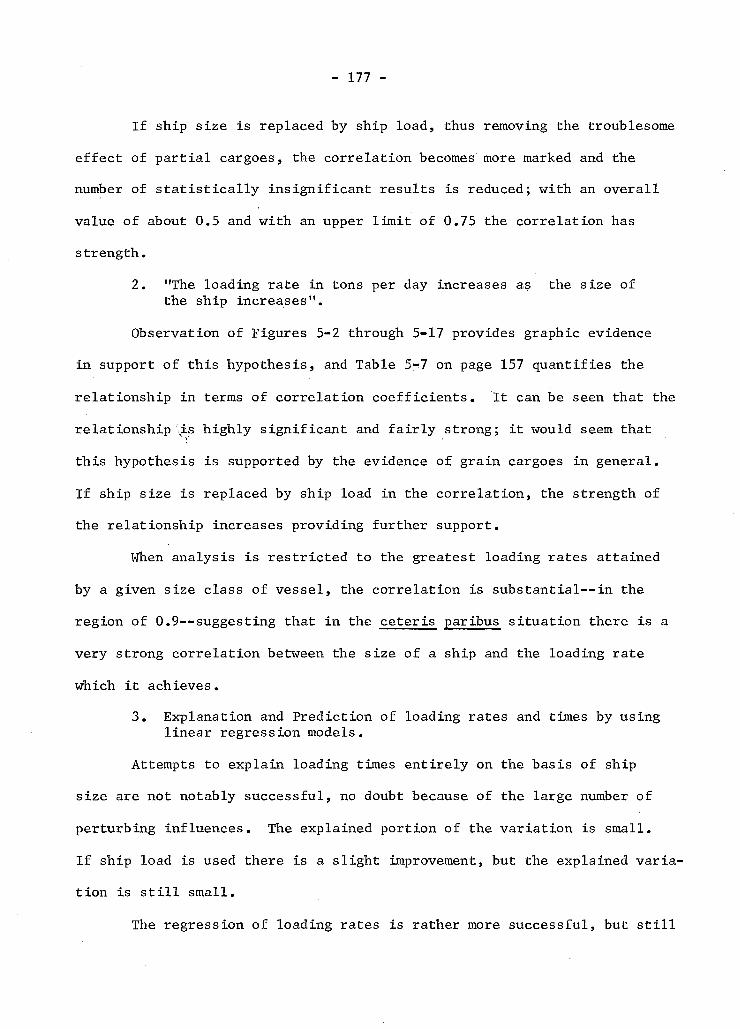
- 177 -
If ship s i z e i s replaced by ship load, thus removing the troublesome
e f f e c t of p a r t i a l cargoes, the c o r r e l a t i o n becomes more marked and the
number of s t a t i s t i c a l l y i n s i g n i f i c a n t r e s u l t s i s reduced; with an o v e r a l l
value of about 0.5 and with an upper l i m i t of 0.75 the c o r r e l a t i o n has
strength.
2. "The loading rate i n tons per day increases as the s i z e of the ship increases".
Observation of Figures 5-2 through 5-17 provides graphic evidence
in support of t h i s hypothesis, and Table 5^7 on page 157 quantifies the
r e l a t i o n s h i p i n terms of c o r r e l a t i o n c o e f f i c i e n t s . I t can be seen that the
r e l a t i o n s h i p '\is highly s i g n i f i c a n t and f a i r l y strong; i t would seem that
t h i s hypothesis is supported by the evidence of grain cargoes i n general.
If ship s i z e i s replaced by ship load i n the c o r r e l a t i o n , the strength of
the r e l a t i o n s h i p increases providing further support.
When analysis i s r e s t r i c t e d to the greatest loading rates attained
by a given s i z e class of v e s s e l , the c o r r e l a t i o n i s s u b s t a n t i a l - - i n the
region of 0.9—suggesting that i n the c e t e r i s paribus s i t u a t i o n there i s a
very strong c o r r e l a t i o n between the s i z e of a ship and the loading rate
which i t achieves.
3. Explanation and Pred i c t i o n of loading rates and times by using l i n e a r regression models.
Attempts to explain loading times e n t i r e l y on the basis of ship
s i z e are not notably successful, no doubt because of the large number of
perturbing influences. The explained portion of the v a r i a t i o n is small.
If ship load i s used there i s a s l i g h t improvement, but the explained v a r i a
t i o n i s s t i l l small.
The regression of loading rates i s rather more successful, but s t i l l

- 178 -
not outstanding. The basics of the regressions, as exhibited in Tables
5-4, 5-5, 5-9 and 5-10 are, however, encouraging. The standard errors of
the coefficients are not unduly large and the second coefficient is always
positive within the l imit of i ts possible error .
When movement between berths is incorporated into a two variable
regression model the explained portion of the variation increases. The
success or fai lure of a regression model cannot be succinctly stated—of
great importance is the required level of confidence and the use to which
i t is to be put.
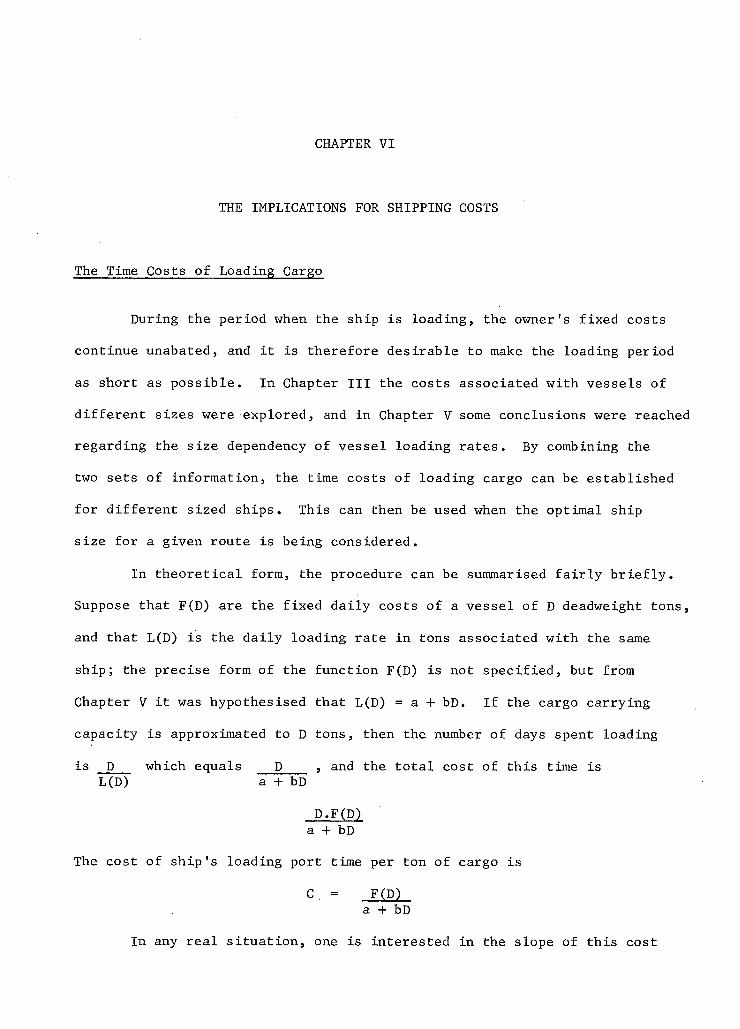
CHAPTER VI
THE IMPLICATIONS FOR SHIPPING COSTS
The Time Costs of Loading Cargo
During the period when the ship i s loading, the owner's fixed costs
continue unabated, and i t i s therefore desirable to make the loading period
as short as possible. In Chapter I I I the costs associated with vessels of
different sizes were explored, and in Chapter V some conclusions were reached
regarding the size dependency of vessel loading rates. By combining the
two sets of information, the time costs of loading cargo can be established
for different sized ships. This can then be used when the optimal ship
size for a given route is being considered.
In theoretical form, the procedure can be summarised f a i r l y b r i e f l y .
Suppose that F(D) are the fixed daily costs of a vessel of D deadweight tons,
and that L(D) is the daily loading rate i n tons associated with the same
ship; the precise form of the function F(D) is not specified, but from
Chapter V i t was hypothesised that L(D) = a + bD. If the cargo carrying
capacity i s approximated to D tons, then the number of days spent loading
i s D which equals D , and the t o t a l cost of this time i s L(D) a + bD
D.F(D) a + bD
The cost of ship's loading port time per ton of cargo i s
C = F(D) a + bD
In any rea l s i t u a t i o n , one is interested in the slope of this cost
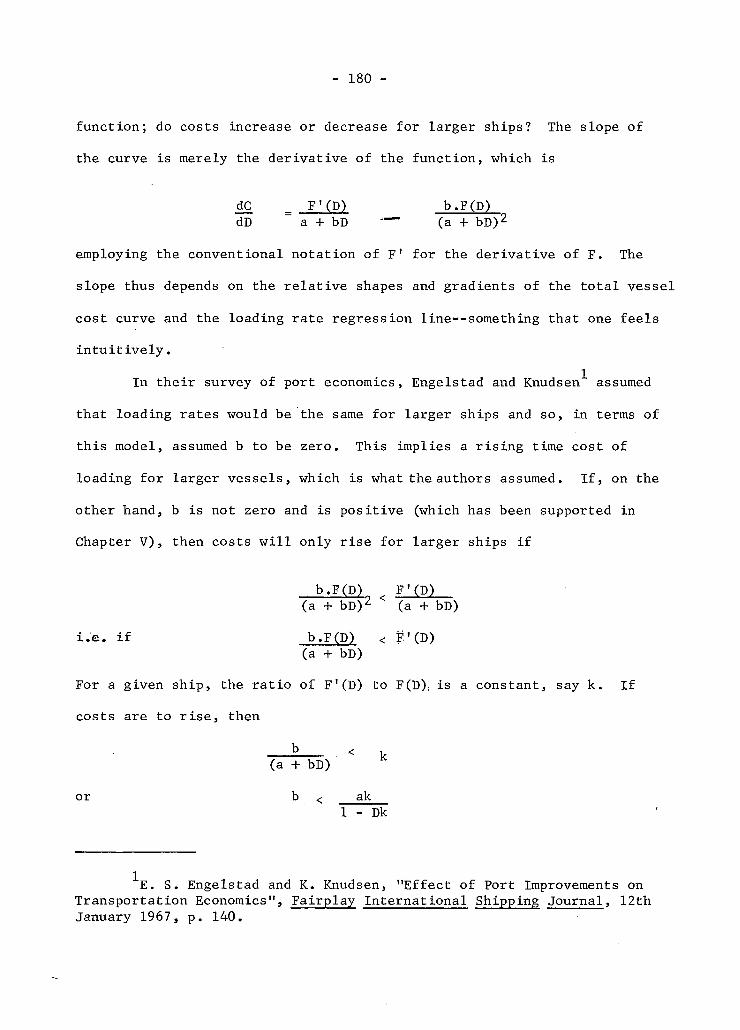
- 180 -
function; do costs increase or decrease for larger ships? The slope of
the curve is merely the derivative of the function, which is
dC = F'(D) b.F(D) dD a + bD (a + bD) 2
employing the conventional notation of F' for the derivative of F. The
slope thus depends on the r e l a t i v e shapes and gradients of the t o t a l vessel
cost curve and the loading rate regression line—something that one feels
i n t u i t i v e l y .
In their survey of port economics, Engelstad and Knudsen"'" assumed
that loading rates would be the same for larger ships and so, in terms of
this model, assumed b to be zero. This implies a r i s i n g time cost of
loading for larger vessels, which is what the authors assumed. I f , on the
other hand, b i s not zero and is positive (which has been supported in
Chapter V), then costs w i l l only r i s e for larger ships i f
b.F(D) F'(D) (a + bD) 2 < (a + bD)
i.e.. i f b.F(D) < F 1 (D) (a + bD)
For a given ship, the r a t i o of F'(D) to F(D), is a constant, say k. I f
costs are to r i s e , then b < k
(a + bD)
or b < ak 1 - Dk
E. S. Engelstad and K. Knudsen, "Effect of Port Improvements on Transportation Economics", Fairplay International Shipping Journal, 12th January 1967, p. 140.

- 181 -
So, i f the time costs of loading are to f a l l with increasing ship
s i z e , i t is not s u f f i c i e n t that loading rate merely increase with size - -
i t must increase at a rate which more than compensates for the greater
operating costs of a larger ship. This i s merely the formalised derivation
of a conclusion which might have been reached i n t u i t i v e l y . By inserting
figures assembled and derived in previous sections of the thesis, i t i s
possible to calculate the predictions of this study regarding the costs of
loading time. Since the mathematical form of the function F(D) is not known,
i t i s easiest to do this graphically.
The most recent costs of bulk c a r r i e r operation to be found were in 2
a 1967 study by Cufley and were quoted in Chapter I I I ; they are presented
graphically i n Figure 6-1. They relate to a vessel under B r i t i s h registry
and the prices have been converted into dollars at pre-devaluation rates.
Assuming that a vessel takes up i t s f u l l deadweight capacity in
cargo, the t o t a l loading time for different sizes of vessels at different
loading rates can be simply calculated; multiplying this by the daily cost
gives a t o t a l cost of loading time which is presented for interest i n
Figure 6-2.
If the daily cost i s divided by the loading rate, the result i s a
time cost per ton of cargo loaded. The family of curves in Figure 6-3 rep
resents this cost for different ship sizes at different rates of loading.
In combining these cost data with the loading rate analysis of this
study there i s a d i f f i c u l t y regarding the measure of ship s i z e ; whereas the
costs are based on deadweight tons, the loading rate variations are based
C. F. H. Cufley, The Ideal Tramp for the 1970's, (London: Barker and Howard, 1967), p. 20.
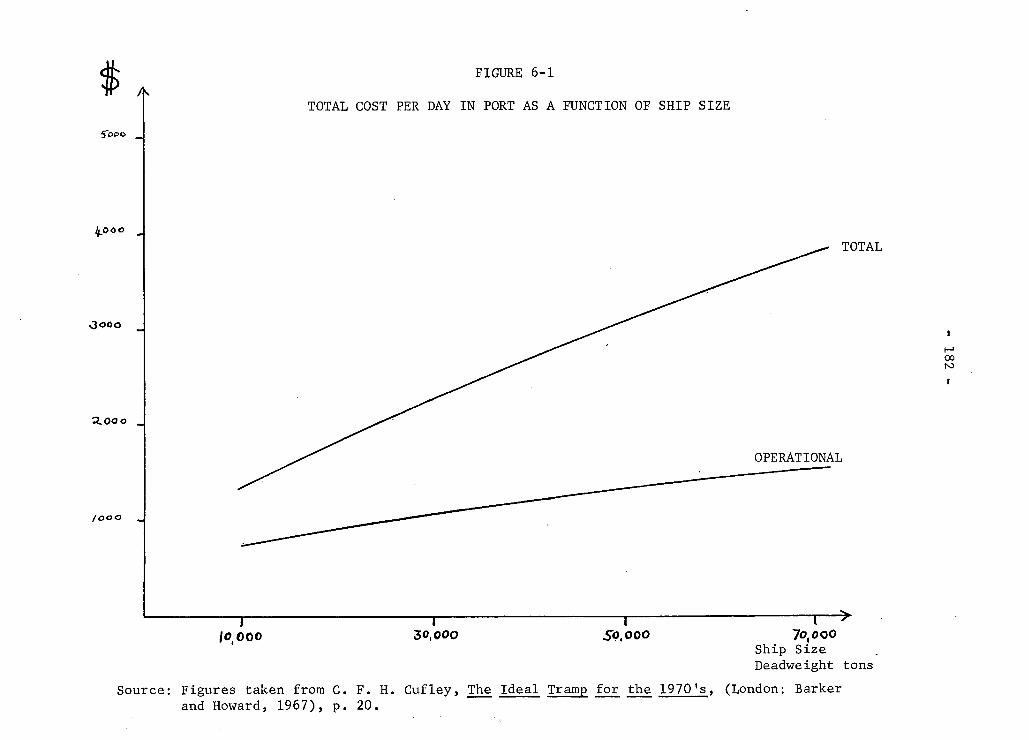
I 1 1 1 — ^ /o.ooo 30,000 50,000 7o,ooo
Ship Size Deadweight tons
Source: Figures taken from C. F. H. Cufley, The Ideal Tramp for the 1970's, (London: Barker and Howard, 1967), p. 20.
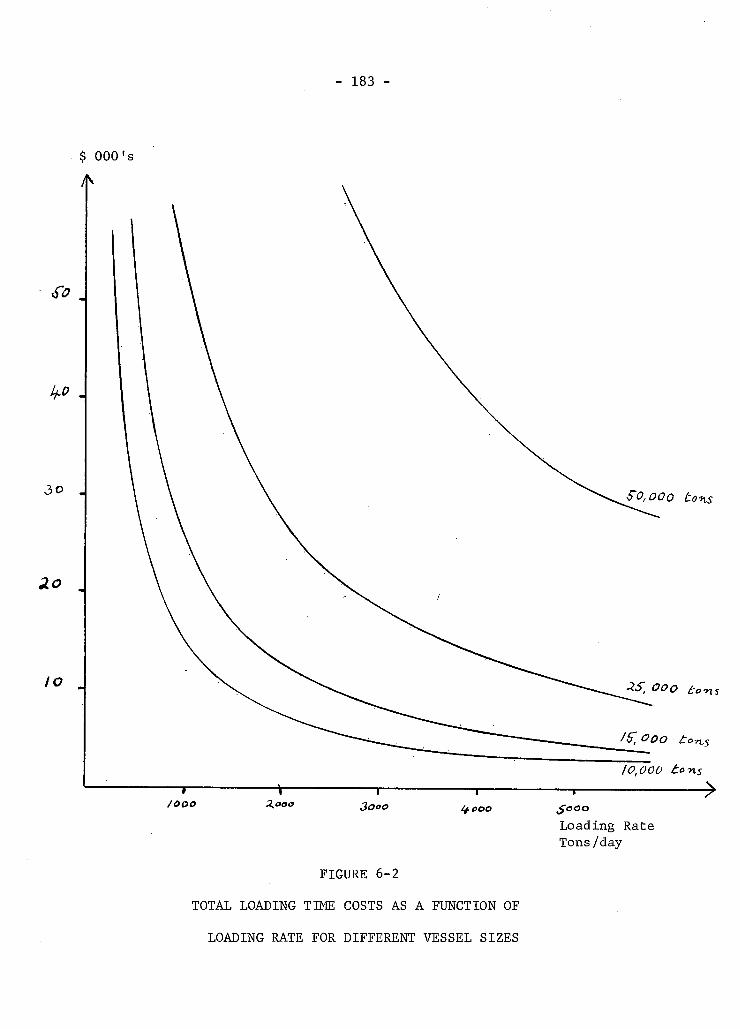
- 183 -
1— /OOO
/f, OOO ton.s
/0,b~00 to-n.s
X.000 3ooo — r — t+ooo
FIGURE 6-2
TOTAL LOADING TIME COSTS AS A FUNCTION OF
LOADING RATE FOR DIFFERENT VESSEL SIZES
Soao
Loading Rate Tons/day
TIME COST OF LOADING A TON OF CARGO AS A FUNCTION OF SHIP SIZE FOR DIFFERENT LOADING RATES

- 185 -
on net register tons. A good rule of thumb for a wide range of ship sizes
i s that 2.5 tons of deadweight capacity i s equivalent to 1 net register 3
ton; an alternative approach i s to regard ship load,in the sample as being
synonymous with the deadweight of the carrying vessel. The former r e l a t i o n
ship tends to break down for larger bulk c a r r i e r s , and the l a t t e r approxi
mation i s evidently untrue for some; however, since a regression i s computed
over a large c o l l e c t i o n of ships i t is f e l t that the l a t t e r estimate i s
the better one.
The procedure for determining the cost per ton for a given ship size
is as follows. For an arbitrary loading rate (for convenience one for which
a curve i s plotted in Figure 6-3) a ship size corresponding to i t i s found
from the regression equation presented i n Table 5-10 in Chapter V; for this
ship size and this loading rate, a cost per ton i s read off in Figure 6-3.
Notice that since the step from loading rate to ship size i s not s t r i c t l y an
estimation, but merely a reversal of the normal argument, this regression
equation can be used. Performing this task for each cargo type i n the four
crop years studied gives r i s e to the cost curves exhibited in Figures 6-4
through 6-7.
In view of the more explanatory two-variable regression incorporating
berth changes which i s exhibited in Table 5-14, i t might be argued that this
would be a better basis on which to work. However, this more sophisticated
regression leads to a closely spaced family of curves of very similar shape
to the ones actually obtained, but with one member of the family for each
possible number of berth v i s i t s . Comparison of the all-important B c o e f f i
cients i n the two cases, confirms that the difference between the two is very
Cufley, Op_. C i t . , p. 276
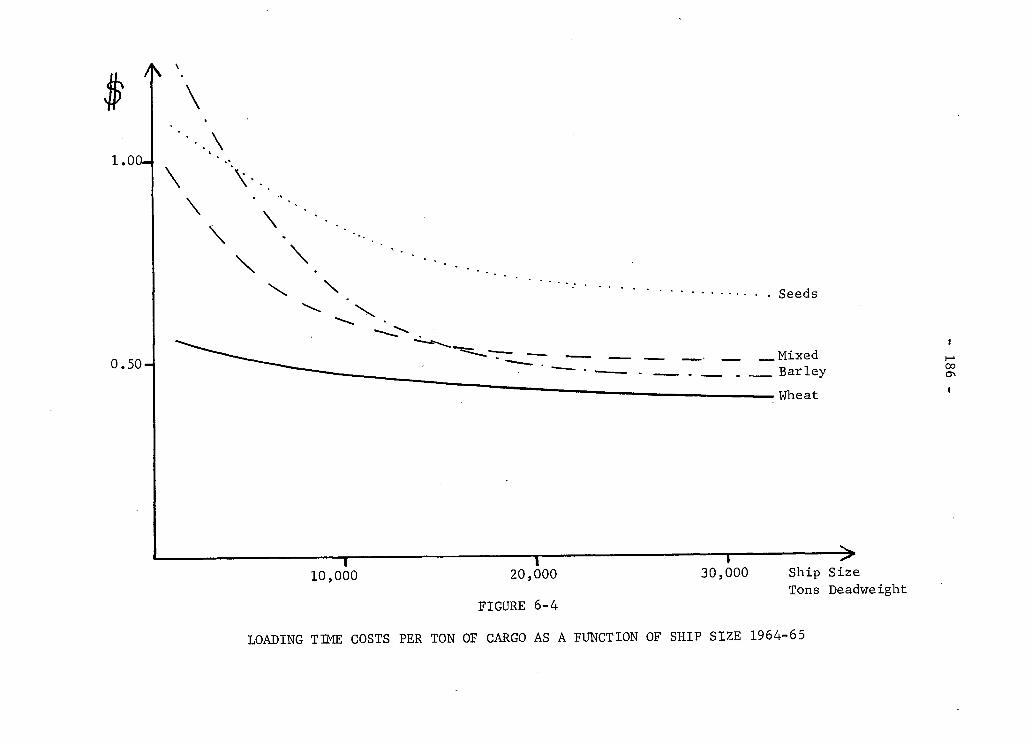
, , r - >
10,000 20,000 30,000 Ship Size Tons Deadweight
FIGURE 6-4
LOADING TIME COSTS PER TON OF CARGO AS A FUNCTION OF SHIP SIZE 1964-65
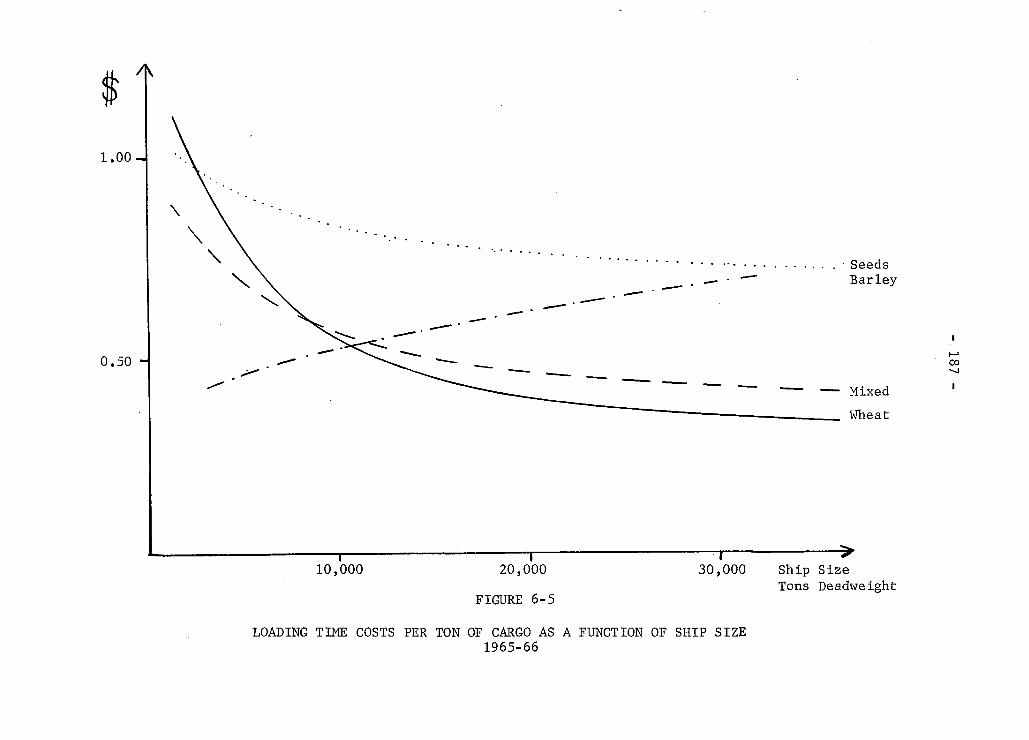
10,000 20,000 30,000 Ship Size Tons Deadweight
FIGURE 6-5 LOADING TIME COSTS PER TON OF CARGO AS A FUNCTION OF SHIP SIZE
1965-66
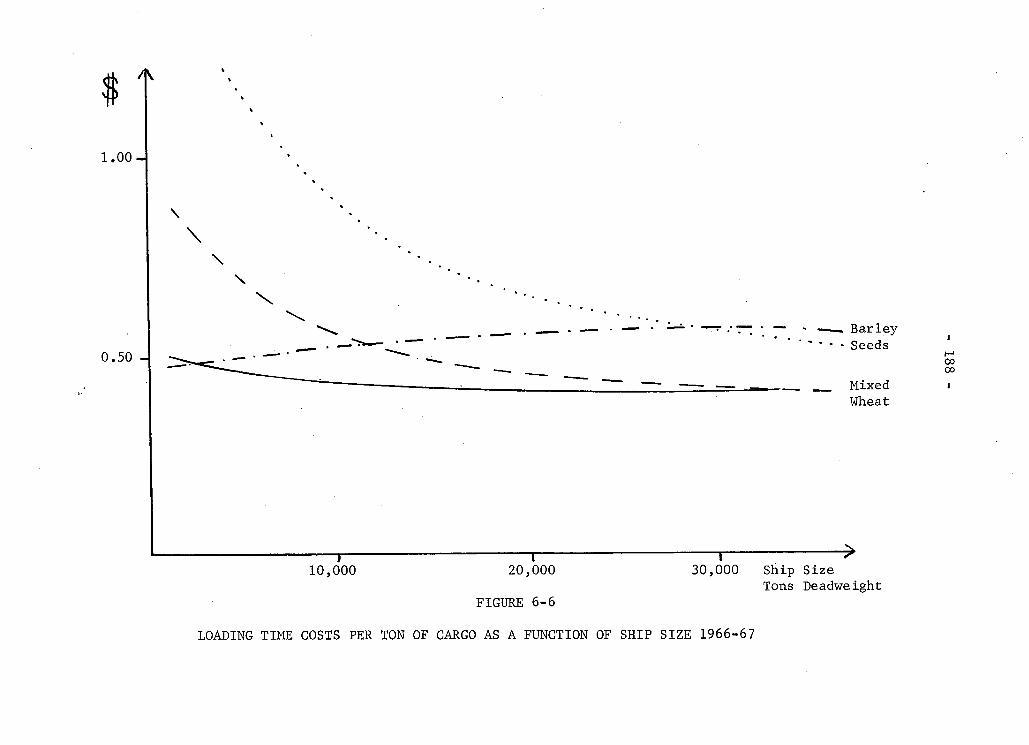
1 1 1 / " 10,000 20,000 30,000 Ship Size
Tons Deadweight FIGURE 6-6
LOADING TIME COSTS PER TON OF CARGO AS A FUNCTION OF SHIP SIZE 1966-67
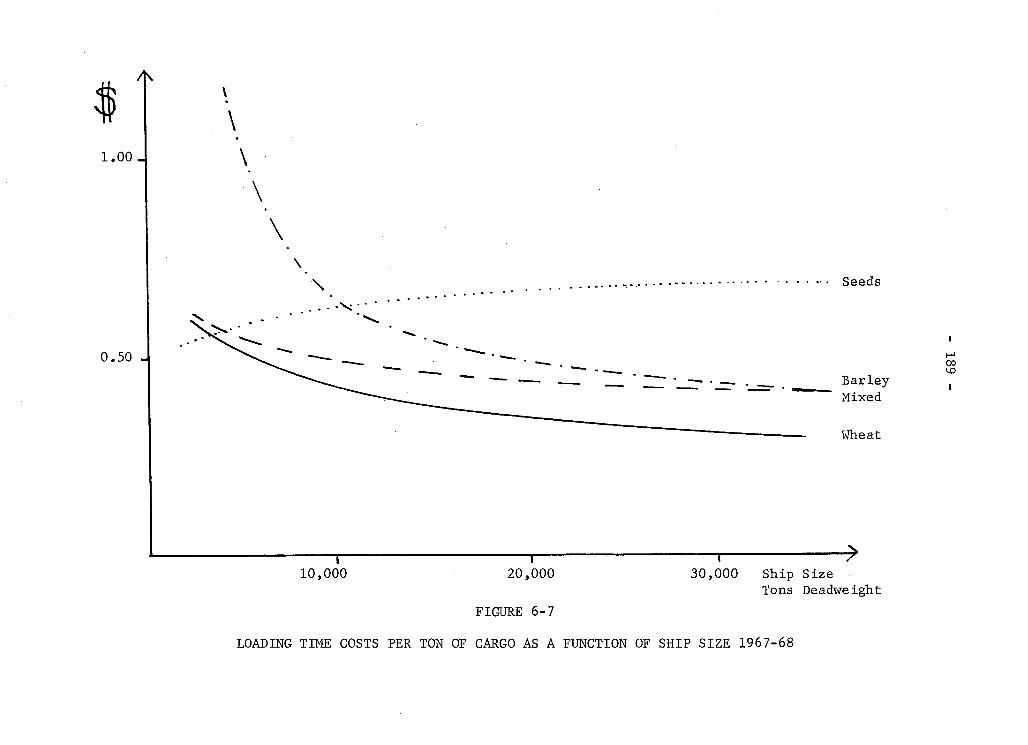
r~ 10,000
— I — 20,000
FIGURE 6-7
I > 30,000 Ship Size
Tons Deadweight
LOADING TIME COSTS PER TON OF CARGO AS A FUNCTION OF SHIP SIZE 1967-68

- 190 -
s l i g h t . Considering the very approximate cost figures used, and that the
stated objectives are merely to investigate the form of the relationship,
the figures in Table 5-10 are adequate.
A danger to be avoided is the extrapolation of regression lines
beyond the region i n which data was available for their derivation; this
places an upper l i m i t of around 30,000 or 35,000 tons on the size of ships
for which costs can be estimated. I t i s not pretended that these costs are
i n any way accurate; f i r s t l y , because reported costs are in general only
an approximation, secondly, because actual costs d i f f e r considerably between
individual vessels of the same t y p e — e s p e c i a l l y i f they are registered under
different f l a g s ; and t h i r d l y because the regression l i n e gives only an
estimate of the loading rate. I t i s f e l t , however, that although these
results are crude they do indicate the form of the relationship, which i s
determined not by the figures but by the r e l a t i v e gradients of the respec
t i v e functions.
Turning now to the actual curves, i t i s evident that there is a
f a i r l y close s i m i l a r i t y between 1964/65 and 1967/68, both of which are
regarded by the shipping community as more "normal" years than 1965/66
and 1966/67, which are also a l i k e . The pattern for wheat and mixed wheat
cargoes is consistent throughout, with wheat being cheaper to load than
the more diverse mixed wheat, as might be expected, Seeds cargoes seem
to hover around the c r u c i a l divide between r i s i n g costs and f a l l i n g costs,
whereas the pattern for barley seems to be clearcut at least in the undis
turbed years.
It should be remembered when judging these curves that the regression
lines from which they are in part derived are not always highly explanatory

- 191 -
of observed loading rates; i t i s , therefore, possible for an individual
vessel to incur costs which are appreciably d i f f e r e n t .
The Provision of a New F a c i l i t y
Taking the figures for 1967/68 as a basis, 316 vessels called at 4
Vancouver to load cargoes of grain which exceeded 5,000 tons; on average,
they each spent 4% days taking on their cargo and an unspecified time
waiting for a berth. The new Saskatchewan Wheat Pool elevator has a
loading capacity of 50,000 bushels per hour to a single vessel;"' i f this
rate were achieved i n other elevators i t seems reasonable to suppose that
the average loading time could be reduced by about two days--assuming that
grain i s available at the coast. This would save approximately 632 ship
days per year and with an average vessel size of about 7,000 net register
tons, a daily cost per ship of about $1,750. In t o t a l , this amounts to
some $1,109,000 annually, without regard for any p r o f i t foregone by the
ship owners as a result of excessive loading time. I t i s possible that
the data collected, by rounding up the loading time to the next whole day,
overstates the cost of loading time for small ships more than for larger
ships. Since there are more of the smaller vessels the possible savings
from any improvement may well be s l i g h t l y overstated.
If the economic horizon for vessels of current technology i s
Excluding those vessels which could not be i d e n t i f i e d . See Chapter I.
"'a. H. Case, Future Requirements for the Hand 1 ing of Grain Through P a c i f i c Coast Ports, (unpublished Master's thesis, University of B r i t i s h Columbia, 1967),

- 192 -
considered to be about ten years, the present value of this annual outlay
can be found by discounting at an appropriate rate bearing i n mind the
caveat above; the choice of a suitable rate has always been associated with 6 ' some controversy, but i t seems doubtful i f the current l e v e l of s o c i a l time
preference i s less than 8 per cent and i f an investment were being considered
by private interests i t i s l i k e l y that a rate of about 10 per cent would be
used.
The present value of this saving over a ten year period at various
rates of discount i s exhibited in Table 6-1.
TABLE 6-1
PRESENT VALUE OF ANNUAL SAVINGS ASSOCIATED
WITH REDUCING LOADING TIMES
Rate of Discount Present Value of $1.109m Received Annually for Ten Years
6% $ 8,162,240
8% 7,441,390
10% 6,814,805
It appears that from the point of view of the ship owners, who incur
See E. F. Renshaw, "A Note on the Measurement of Benefits from Public Investment i n Navigation Projects", American Economic Review, September 1957; R. 0. Goss, "Towards an Economic Appraisal of Port Investments",. Journal of Transport Economics and P o l i c y, Vol. I No. 3 (September 1967); A. R. Prest and R. Turvey, "Cost-Benefit Analysis: A Survey", Economic Journal, (December 1965).
- 193 -
these costs, i t would be worth investing around $7m i f the savings estimated
above could be secured. Taking a long view, widespread port improvements
would have the effect of increasing the available amount of ocean trans
portation capacity, which could undercut freight rates; however, the scope
for improvement i n individual ports i s considerable before;.this takes place.
The question which immediately comes to mind, is whether i t would
be feasible to double the achieved loading rate i n the harbour by spending
th i s amount of money. Since the current average loading rate is low com
pared to the current rated capacity i t might seem that by streamlining
procedures some improvement could be obtained with existing equipment.
Round the clock port operation i s an obvious suggestion, but this would
raise problems of recruitment and overcapacity during slack periods. The
cost of a loading b e l t , rated to carry about 5,000 tons per hour is in
the region of $300 per l i n e a l foot i f i t i s constructed on the l e v e l . 7
In conjunction with the actual belt improvement the elevator weighing and
box car receiving c a p a b i l i t i e s would have to be stepped up. The cost of
disrupting the e x i s t i n g f a c i l i t i e s while improvement took place would be
high. Without a detailed engineering study i t i s d i f f i c u l t to say what
the costs would eventually be.
If i t were to prove an economic investment, from where could the
c a p i t a l be provided? Since a l l the immediate benefits from the project
accrue outside the country, i t is hardly a suitable project for Government
investment. If the demand for wheat is price e l a s t i c , however, i t i s
possible that reduced transportation charges would increase the prospective
Statement by Mr. R. H. Atkinson and Mr. T. H. John i n a personal interview.
-194 -
market for Canada's crop. Since the ship owners are the immediate bene
f i c i a r i e s i t would be possible to recover increased port charges from
them, perhaps on a s l i d i n g scale related to turnaround. I t is necessary
to observe that although ship owners are paid demurrage under existing
charters, this i s not usually s u f f i c i e n t to cover costs, and i n any case
stipulated loading rates are based upon current experience. I f these
increased charges could be recovered then the project could become a
profi t a b l e one for the elevator companies to undertake. Since the volume
of grain moving through the port i s now about 200 m i l l i o n bushels annually,
a saving of about a m i l l i o n dollars represents about 0.5 cents a bushel,
not an inconsiderable sum when the costs of moving grain are considered.
For comparative purposes, the t o t a l cost of shipping grain to the U.K. i s
presented i n Figure 6-8, and the constituent items of this cost i n Figure
6-9.
If one considers that the size of grain ships i s l i k e l y to increase
i n the future, and that the export of grain from Western Canada to Asia
i s u n l i k e l y to have ceased i n ten years, i t i s perhaps permissable to
evaluate an investment on the basis of a twenty year l i f e . In this case
an investment of at least $12m would be economic i f average loading time
could be reduced by two d a y s — t h i s i s not accounting for the increased
cost of larger vessels. The major determinant of project l i f e i s the
anticipated increase in trade, since an improvement now may well be over
taken by a r i s e i n the annual tonnage which has to be handled.
Although these calculations are no more than crude approximations,
at the very least i t appears that the situ a t i o n warrants further study.

/oo-
FIGURE 6-8
AVERAGE COSTS OF MOVING WHEAT FROM CANADA TO THE UNITED KINGDOM, VIA PACIFIC COAST PORTS
SEASONS OF NAVIGATION 1933 to 1965
T 113?
Source: Board of
1
Grain Commissioners
1
ins for Canada
1—
l??o IfSS lf(oO
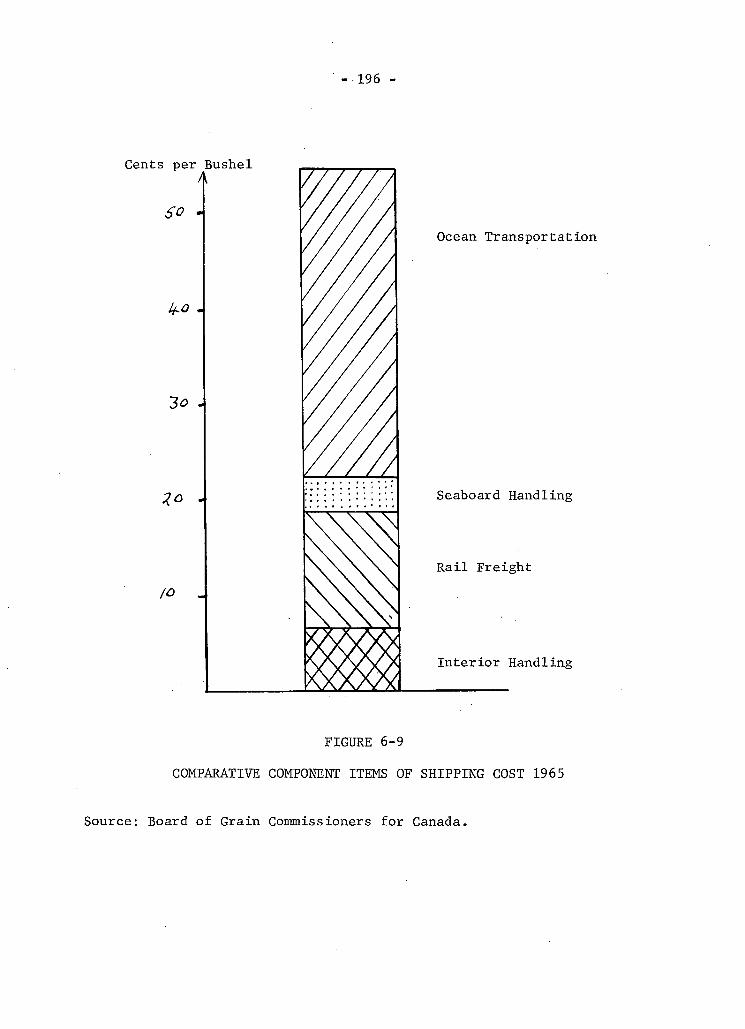
196 -
Ocean Transportation
Seaboard Handling
R a i l Freight
Interior Handling
FIGURE 6-9
COMPARATIVE COMPONENT ITEMS OF SHIPPING COST 1965
ce: Board of Grain Commissioners for Canada.
- 197 -
A Reorganisation of Inventory
It became evident in Chapter IV that many vessels have to change
berths i n order to take on a f u l l cargo, and some of them several times.
This can be due either to i n s u f f i c i e n t tonnage of a particular grade being
available, or to an i n s u f f i c i e n t range of grades i n the case of an assorted
cargo; either way, i t i s a r e f l e c t i o n on the inventory policy of the ele
vators, each of which t r i e s to stock most grades of grain. If the grades
to be marketed were divided among the elevators i n such a way that a greater
proportion of vessels could load completely at one berthing, some saving to
ship owners would be evident which might be recovered, as before, v i a
higher charges.
By way of i l l u s t r a t i o n , assume that the pattern of grain storage
were altered in such a way that 90 per cent of vessels could load at one
berthing, and the remainder at not more than two berthings. This i s i n
contrast to the s i t u a t i o n at present where only 33 per cent of vessels load g
at one berthing, and only 74 per cent at one or two berthings.
Applying this to the ship a r r i v a l s during 1967/68 reveals that the
316 vessels would have made 348 berth v i s i t s under the hypothesised improve-9
ment whereas they actually made some 626 v i s i t s . Reference to Table 5-12
reveals that each berth change i s associated with a fixed delay of approxi
mately 5 hours for wheat cargoes and up to about 12 hours for seeds cargoes;
taking a weighted average delay time of approximately 6 hours (using as
These figures are for 1967/68; see Table 4-13 on page 112.
Calculated from Table 4-13.

- 198 -
weights the proportion of vessels i n each cargo category, obtained from
Table 4-12) shows that the 278 excess berth v i s i t s consumed 1,168 hours
of 209 working ship days.
Valuing each ship day at $1,750 as was done i n the previous section,
i t transpires that these berth changes.cost ship owners in general about
$365,750. This annual cost can be discounted at say 10 per cent over ten
years, which yields a present value of $2,248,000. This puts a lower l i m i t
on the current value to ship owners of eliminating berth changes, since
f u e l i s consumed and tugs may be required i n addition. Grain i n the port
is already pooled for shipment, i t would seem that this was merely carrying
pooling one stage further.
Possible Innovations i n Grain Loading Equipment
Grain handling equipment of the type currently in use has been
employed for many years; of the possible ways of moving grain from storage
elevator to shipside, the most promising improvements would seem to stem
from the "dual quadrant" type of ship loader developed for bulk terminals
by Swan Wooster Engineering of Vancouver.
The heart of the system is a pair of shuttle conveyors which reach
over the ship to deposit the cargo. Each conveyor rides a rotating bridge
pivoted at some distance from the ship i n order that the combined actions
of shuttle and slew may make possible a linear sweep along the length of
the s h i p . ^ The ship can thus be loaded f u l l y i n a l l hatches without being
J. V. MacDonald, "Recent Innovations i n Marine Terminal Design", ICHCA Journal, March, 1968, p. 8.
- 199 -
relocated at the berth. The cargo can be positioned more precisely in the
hold and loading can go on continuously on one or another loading conveyor.
Since fore and aft hatches are loaded simultaneously there are fewer trim
ming problems; the shuttling movement overcomes the d i f f i c u l t y of loading
ships with different beams and the v e r t i c a l f a l l of the grain i s reduced
to a minimum.
There is an economic advantage also, since there are savings i n both
operational and c a p i t a l costs. The former, because of s i m p l i c i t y and ease
of maintenance, and the l a t t e r because of the absence of a large gallery
together with i t s supporting p i e r ; for a deep berth the l a t t e r is a s i g n i f i
cant item.
The f l e x i b i l i t y which results from the basic s i m p l i c i t y of the concept
is appealing and the method has been applied to some non-grain bulk terminals
such as those at Vancouver Wharves, Neptune Terminals and Roberts Bank. A
simil a r system i s i n use at the Myrtle Grove Grain Elevator outside New
Orleans on the M i s s i s s i p p i River and one i s being considered for a new grain
terminal at Everett, Washington
Although i t i s a r a d i c a l departure from the loading system presently
i n use, i t s manifest advantages should ensure i t at least consideration i f
any improvements are planned i n the Vancouver grain terminals.
Personal interview with Mr. J . V. MacDonald, Mr. R. C. Atkinson and Mr. H. T. John of Swan Wooster Engineering Co. Ltd.
CHAPTER VII
SUMMARY
Ocean transportation has reached a stage of development i n which
the world's ports are assuming new importance, forming as they do a key
l i n k i n the chain of transportation between producer and consumer. Cost
reductions have been achieved through technological innovation and the
introduction of large bulk c a r r i e r s ; however, this l i n e of approach i s now
subject to rapidly decreasing marginal returns. The time has come to
pursue economies i n the more complex f i e l d of terminal organisation with
a view to reducing the round-trip times of the c a r r i e r . If the greatest
benefit i s to be gained from transportation investment, l o s t time i n and
around the port area must be recovered.
Because of the rapidly increasing fixed costs of large, automated
vessels, lost time i n port has become considerably more expensive and in
many instances the line-haul savings can be negated. The extent to which
port time increases for these larger vessels is an important consideration
i n any r a t i o n a l choicer.of vessel size for a part i c u l a r trade. There is
l i t t l e evidence in the available l i t e r a t u r e regarding the economies of
scale present when large ships are i n port, and the purpose of th i s study
was to investigate the loading times of grain carriers i n the port of
Vancouver. In the course of the investigation, interesting sidelights were
thrown on the grain handling and transportation system i n Western Canada.
The turnaround time of vessels i s made up of a large number of con
stituent factors; the approaches to the harbour have to be negotiated, the
- 201 -
vessel has to be victualled and supplied with fuel , and i t has to be pre
pared for its cargo and then loaded. Delays can occur during any of
these operations and because of the great complexity and interlocking
relationships of the port system there is no outstanding single reason for
poor performance and no single remedy for speeding operations.
Observation of grain loading revealed that performance is highly
dependent on the type of grain; one or two grades of wheat compose the
simplest cargoes to handle, while oilseeds are troublesome since they
require loading in small batches around the harbour. The fixed delay
associated with berth changes is thus large. Barley, being a lighter grain
requires more careful trimming.
Analysis of the loading behaviour of ships of different sizes is
obscured by the many possible delays; loading can be halted for reasons
of grain shortage, labour disputes, mechanical trouble, poor weather, forced
berth changes, box car shortages, trimming problems and inspection delays.
Nevertheless, -ch'e data gathered, do show a dist inct correlation between
ship size and both loading time and loading rate . Linear regression analysis
shows that a large part of the variation in the results can be explained
by ship size, cargo type and changes of berth; this establishes the fixed
delay associated with a berth change.
By combining the loading rate-ship size dependency and the dependency
of daily costs on ship size, an estimate of the relationship between ship
size and the time cost of loading was obtained.
Having regard to the manner in which grain loading is organised,
there are various improvements which can be suggested; however, these cannot
be real ly meaningful without consideration of the whole grain transportation
- 202 -
system which i s outside the scope of this study. Notwithstanding t h i s , the
increasing of the physical capacity as well as the elimination of berth
changes seem prime areas for further investigation.
Suggestion for Further Research
Most studies raise almost as many questions as they attempt to
answer and this i s no exception. I f actual costs of vessel operation could
be obtained i t would be of interest to determine i f more expensive ships
achieve a shorter turnaround, as one might expect. In addition, a closer
look at the individual vessel records would be of benefit i n explaining
the observed v a r i a t i o n ; perhaps there exists some common circumstance which
has not been revealed by this investigation. As has been mentioned, a
detailed appraisal of the benefits associated with providing more handling
capacity i n the port and with more e f f i c i e n t pooling of the grain i s long
overdue.
If nothing else, perhaps this thesis has indicated that the potential
benefits to be derived from improvement i n the port segment of the trans
portation network are considerable. They w i l l be attained only i f ship
owners, shippers, designers and investors take cognizance of the situ a t i o n
and- come together to master i t ; only i n this way w i l l new attitudes, concepts
and procedures be developed so that existing problems can be solved and
future problems, hopfully, anticipated.
- 203 -
BIBLIOGRAPHY
A. BOOKS
Alexandersson, G., and G. Norstrom. World Shipping. New York: John Wiley and Sons, 1963.
Berglund, A. Ocean Transportation. New York: Longmans, 1951.
Bes, J . Tanker Chartering and Management. London: Barker and Howard, 1956.
. Bulk Carriers. London: Barker and Howard, 1965.
. Chartering and Shipping Terms. Sixth e d i t i o n . London: Barker and Howard, 1966.
. Despatch of Tramp Ships. London: Barker and Howard, 1967.
B i r d , James. The Geography of the Port of London. London: Hutchinson University Library, 1957.
Bonavia, M. R. Economics of Transport. Cambridge: James Nisbet and Company, 1963.
Bonwick, G. J . , and E. C. Steer. Ship's Business. London: The Maritime Press, 1963.
Bown, A. H. J. Port Economics. Second e d i t i o n , revised by W. A. Flere. London: Foxlow Publications, 1967.
, and C. A. Dove. Port Operation and Administration. Second e d i t i o n , revised by E. S. Tooth. London: Chapman and H a l l , 1960.
Branch, A. E. Elements of Shipping. London: Chapman and H a l l , 1964.
Campbell, F. S. (ed.). Ports: Dues, Charges and Accommodation Throughout the World. London: George P h i l i p and Son, 1964.
Cufley, C. F. H. Ocean Freights and Chartering, London: Staples Press, 1962.
. World Freight Review 1964. London: The B r i t i s h Sulphur Corporation, 1965.
. The Ideal Tramp for the 1970's• London: Barker and Howard, 1966.
F a i r , M. L. Port Adminis trat ion in the United States. Cambridge, Maryland: Cornell Maritime Press, 1954.
- 204 -
Ferguson, A l l e n , et a l . The Economic Value of the United States Merchant Marine. Evanston: Northwestern University, 1961.
Fisher, R. A., and Frank Yates. S t a t i s t i c a l Tables for B i o l o g i c a l , A g r i c u l t u r a l and Medical Research. Fourth e d i t i o n . Edinburgh: Oliver and Boyd, 1953.
Fis s e r , F. M. Tramp Shipping. Bremen: Weltschiffahrts-Archiv. 1957.
Hedden, Walter P. Mission: Port Development. Washington D.C.: American Association of Port Authorities, 1967.
H i l l i e r , Frederick S., and Gerald J. Lieberman. Introduction to Operations Research. San Francisco: Holden Day Inc., 1967.
Hind, J. Anthony, (ed.). Ship's Gear '66. London: Fishing News (Books), 1966.
Kane, Edward J . Economic S t a t i s t i c s and Econometrics. New York: Harper and Row, 1968.
Ketchum, Milo S. The Design of Walls, Bins and Grain Elevators. Second ed i t i o n . New York: McGraw H i l l , 1913.
MacGibbon, D. A. The Canadian Grain Trade. Toronto: The MacMillan Company, 1932.
. The Canadian Grain Trade 1931-1951. Toronto: Toronto University Press, 1952.
Malott, W. Grain and Its Marketing. Chicago: Grain Exchange I n s t i t u t e , 1951.
McDowell, Carl E., and Helen M. Gibbs. Ocean Transportation. New York: McGraw H i l l , 1954.
McElwee, R. S. Port Development. New York: McGraw H i l l , 1926.
Metcalfe, J. V. Principles of Ocean Transportation. New York: Simmons Boardman, 1959.
Morgan, F. W. Ports and Harbours. Second e d i t i o n . London: Hutchinson, 1958.
N a t r e l l a , M. G. Experimental S t a t i s t i c s . National Bureau of Standards, United States Department of Commerce, Handbook 91. Washington: Government Printing Office, 1963.
O'Loughlin, Carleen. The Economics of Sea Transport. Oxford: Pergamon Press, 1967.
Oram, R. B. Cargo Hand1ing and the Modern Port. Oxford: Pergamon Press, 1968.
- 205 -
Pritchard, R. P r a c t i c a l Stevedoring. Glasgow: Brown,. Son and Ferguson, 1963.
Redal, T. T. P a c i f i c Coast Marine Cargo Handling. Seattle: University of Washington, 1962.
Rothery, A. E. The Ports of B r i t i s h Columbia. Garden City: Doubleday Doran and Company, 1943.
Sigwart, E. E. (comp.). Merchant Ships: World B u i l t . Volume XIV. London: Adlard Coles Ltd., 1966.
Stevens, E. F. Shipping Practice. London: Pitman, 1962.
Sturmey, S. G. B r i t i s h .Shipping and World Competition. London: The Athione Press, 1962.
Svendsen, Arnljot Stromme. Sea Transport and Shipping Economics. Bremen: Weltschiffahrts-Archiv, 1958.
Taylor, L. G., and F. H. Trim. Cargo Handling. Glasgow: Brown, Son and Ferguson, 1964.
The Bulk Cargoes. London: Goram, 1954.
Thorburn, Thomas. Supply and Demand of Water Transport. Stockholm: FFI, 1960.
Thomas, R. E. Stowage: The Properties and Stowage of Cargoes. F i f t h e d i t i o n , revised by 0.0. Thomas. Glasgow: Brown, Son and Ferguson, 1963.
Yamane, Taro. S t a t i s t i c s : An Introductory Analysis. Second e d i t i o n , New York: Harper and Row, 1967.
B. ARTICLES
Aldcr o f t , D. H. "Port Congestion and the Shipping Boom of 1919-20", Business History (June 1961).
Axelson, S t i g . "The Seaport", Dock and Harbour Authority XLVII (May 1967).
Bailey, Ruth G. "Vancouver, Port of No Limitation", Harbour and Shipping (October 1965).
Baudelaire, J . G. "Ideal Port Organisation", Dock and Harbour Authority XLVII (July, August 1966).
Benford, H. "The Rational Selection of Ship Size", Shipping World and Shipbuilder CLXI (18th July 1968).
- 206 -
B e r t l i n , D. P. "Predictions for Port Planning", Dock and Harbour Authority XLVII (December 1966).
B i l e s , S i r John. "The Draught and Dimensions of the Most Economical Ship';', Transactions of the Royal Institute of Naval Architects, 1931.
B r o u i l l e t t e , B. "Le Port de Vancouver", L'Actualite Economique, XXIX-3, 1953.
Daniels, W. J . "The Economics of Berth Employment and Carrier Size", Dock and Harbour Authority XLVII (December 1966).
Engelstad, E. S. "Impact of World Trade on Shipping", Fairplay International Shipping Journal 20th October 1966.
. and K. Knudsen. "Effect of Port Improvements on Transportation Economics", Fairplay International Shipping Journal 12th January 1967.
Fi n n i s , S. A. "The Challenge Facing the Ports", Institute of Transport Journal XXXII-3 Inarch 1967).
Fullinwider, E. G. "Experience i n Longshore Research", International Cargo Handling Coordination Association Sixth Technical Conference, 1963.
Goss, R. 0. "Economic C r i t e r i a for Optimal Ship Design", Transactions of the Royal I n s t i t u t e of Naval Architects October 1965.
. "The Economics of Automation i n B r i t i s h Shipping", Transactions of the Royal Institute of Naval Architects 1965.
. "The Turnaround of Cargo Liners and Its Effect on Sea Transport Costs", Journal of Transport Economics and Policy 1-1 (January 1967).
. "Towards an Economic Appraisal of Port Investments", Journal of Transport Economics and Policy 1-3 (September 1967)
Hopper, A. G., P. H. Judd and G. Williams, "Cargo Handling and i t s Effect on Dry Cargo Ship Design", Transactions of the Royal I n s t i t u t e of Naval Architects A p r i l 1964.
Jones, H. G. "A Shipping Problem", Operations Research Quarterly VIII-3 1957.
Lane, P. A. "An Aspect of the Cost of Port Delays", Yorkshire B u l l e t i n of Economic and Social Research (November 1957).
L e s l i e , E. A. "Vancouver, Canada's Second Port", Foreign Trade CI-2 (February 1954).
Lithgow, S i r William. "New Designs may Revolutionise the Cargo Ship", Shipping Register and Shipbuilder L-7 (July 1967) .
- 207 -
MacDonald, J . V. "Recent Innovations i n Marine Terminal Design", Inter- National Cargo Handling Coordination Association Journal (March 1968) .
MacGillibray, W. "Speed at Sea, Despatch i n Port", Transaction of the Royal Ins t i t u t e of Naval Architects July 1948.
Maclnnes, T. "The Port of Vancouver", Canadian Geographical Journal II-4 1931.
Meredith, W. G. and C. Wordsworth. "Size of Ore Carriers for the New Port Talbot Harbour", Journal of the Iron and Steel Institute CCIV (November 1966) .
Mettam, J . D. "Forecasting Delays to Ships i n Port", Dock and Harbour Authority XLVII (A p r i l 1967).
Murray, J . M. "Future Development of Merchant Ships", Shipping Register and Shipbuilder L-2 (February 1967).
Nagorski, B. "Lay Out of Port F a c i l i t i e s " , Dock and Harbour Authority XLIV (July 1963).
Naylor, C. J. "Measuring Performance i n Modern Marine Terminals", ICHCA Journal (July 1966).
Nijman, D. G. "Optimum Size of Ore Carriers", Journal of the Iron and Steel Institute CCIV (November 1966).
Owen, D. G. and R. T. Eddison. "Discharging Iron Ore", Operations Research Quarterly IV-3 (September 1953).
"Port of Vancouver", World Ports XXIX-11 (August 1967).
Renshaw, E. F. "A Note on the Measurement of Benefits from Public Investment i n Navigation Projects", American Economic Review (September 1957.
Shinto, Hisashi. "Ships", Transportation Research Forum, Kansas City: 1968.
Steer, D. T. and A. G. Page. " F e a s i b i l i t y and Financial Studies of a Port I n s t a l l a t i o n " , Operations Research Quarterly XII-3 (September 1961).
Stevens, Leah. "The Rise of the Port of Vancouver", Economic Geography X I I - l (January 1936).
. "The Grain Trade of the Port of Vancouver B.C.", Economic Geography XII-2 ( A p r i l 1936).
Sturmey, S. G. "Trends i n Shipping Economics", Shipping Register and Shipbuilder (October 1967).
"Trade Trends and Ship Design", Fairplay International Shipping Journal 7th March '68.
- 208 -
Yost, W. H. "Ocean Transport and Port Development", Dock and Harbour Authority XLIII (February 1964).
C. REPORTS, MONOGRAPHS, THESES
Atamenko, G. et a l . The Port of Vancouver. Vancouver: University of B r i t i s h Columbia, Department of Community and Regional Planning, 1961.
Bracken, J . Report of the Enquiry into the D i s t r i b u t i o n of Railway Boxcars. Ottawa: The Queen's Pri n t e r , 1958.
B r i t i s h Columbia Research Council. Vancouver Harbour: T r a f f i c Trends and F a c i l i t y Analysis. Vancouver: BCRC, 1967.
Canadian Wheat Board. Annual Report. Various years.
Case, A. H. Future Requirements for the Handling of Grain Through P a c i f i c Coast Ports. Unpublished Master's thesis, University of B r i t i s h Columbia, 1967.
Chapman, R. and R. R. P. Jackson. Operations Research Studies of Port Operation. Iron and Steel Research Association, 1963.
C o l l i e r , R. W. (ed.). Symposium on the Port of Vancouver. Vancouver: University of B r i t i s h Columbia, Department of Extension, 1966.
Cornwall, I.H.B. A Geographical Study of the Port of Vancouver in Relation to i t s Coastal Hinterland. Unpublished Master's Thesis, University of B r i t i s h Columbia, 1952.
D i l l o n , E. Scott, F. G. Ebel and A. R. Goodbeck. Ship Design for Improved Cargo Handling. A paper presented to the Chesapeake section of the Society of Naval Architects and Marine Engineers, October 1961.
F a i r , L. M. The Transportation of Canadian Wheat to the Sea. McGill University Economic Studies No. 1, 1925.
Grain Transportation Committee, Proceedings of the Grain Transportation Workshop, Minski, Ontario, September 1967.
Heaver, T. D. The Economics of Vessel Size. Ottawa: National Harbours Board, 1968.
Howe, C. D. Report on the F a c i l i t i e s for Grain Shipments and Elevator Sites on the Fraser River and Burrard I n l e t . Port Arthur: Mimeographed, 1923.
International Cargo Handling Coordination Association. Proceedings of the Symposium on Ship Turnaround E f f i c i e n c y . London: ICHCA, January 1958.
- 209 -
Kates, Peat, Marwick and Company. West Coast Commodity Transportation Study Part I. A report prepared for the Government of Canada, Department of Transport, Vancouver: May 1967.
Kerfoot, D. E. Mar i t ime Foreign Trade of B r i t i s h Columbia. Unpublished Master's Thesis, University of B r i t i s h Columbia. 1964.
Lewis, E. V. Research Towards More Efficient,-Transportation by Sea. Paper presented to the Society of Naval Architects and Marine Engineers, New York: November 1961.
Mann, H. A. Ports and the Human Challenge. Address to the American Associat i o n of Port Authorities, Vancouver: September 1967.
Maritime Cargo Transportation Conference. Research Techniques i n Maritime Transportation. National Academy of Sciences, National Research Council Publication 720, Washington, 1959.
Nolan, D. J. M. Bulk Carriers: Past, Present and Future. London: Institute of Chartered Shipbrokers, Mimeographed, 1966.
Omtvedt, Petter C. Report on the P r o f i t a b i l i t y of Port Investments. Oslo: Mimeographed, 1963.
Organisation for Economic Cooperation and Development. Maritime Transport. Paris: OECD, various years.
Pope, D. F. D. and D. A. Rigby. A Method for Estimating Future U.K. Ore Shipping Costs. Restricted Report of the B r i t i s h Iron and Steel Research Association. London: 1966.
Report of the Committee of Enquiry into the Major Ports of Great B r i t a i n , (the Rochdale Report). Cmnd.1824. London: Her Majesty's Stationery Office, 1962.
Robinson, Ross. Spatial Structuring of Port Linked Flows. Unpublished Doctoral d i s s e r t a t i o n , University of B r i t i s h Columbia, 1968.
United Nations. The Turnaround Time of Ships i n Port. New York: Department of Economic and Social A f f a i r s , 1967.
United Nations. The Development of Ports. New York: Committee on Trade and Development, January 1967.
D. STATISTICS, PAMPHLETS
Canadian Ports and Seaway Directory. Gardenvale, Quebec: National Business Publications, 1967.
Dominion Bureau of S t a t i s t i c s . The Grain Trade of Canada. Various years.

-210 -
National Harbours Board. Port of Vancouver. I l l u s t r a t e d pamphlet, n.p. n.d.
. Progress and Development of the Port of Vancouver, n.p. n.d.
E. NEWSPAPERS
The Vancouver Sun.
The Province.
The Toronto Globe and M a i l .
The Financial Post.
The Journal of Commerce.
F. UNPUBLISHED MATERIALS
Ship loading records of the B r i t i s h Columbia Grain Shippers' Clearance Association.