Embed Size (px)
Citation preview

Munich Personal RePEc Archive
A study of performance of public sector
banks in Thane city under the Prime
Minister’s Jan Dhan Yojana
Swami, Madhubala
R.A.D.A.V. College, Mumbai, University of Mumbai
September 2016
Online at https://mpra.ub.uni-muenchen.de/98682/
MPRA Paper No. 98682, posted 20 Feb 2020 11:10 UTC
brought to you by COREView metadata, citation and similar papers at core.ac.uk
provided by Munich Personal RePEc Archive

A STUDY OF PERFORMANCE OF PUBLIC SECTOR BANKS IN
THANE CITY UNDER THE PRIME MINISTER’S JAN DHAN YOJANA
A MINOR RESEARCH REPORT (76)
SUBMITTED TO
THE UNIVERSITY OF MUMBAI
BY
DR. MADHUBALA SWAMI
ASSOCIATE PROFESSOR AND HEAD OF THE DEPARTMENT OF
ECONOMICS
RAMANAND ARYA D.A.V. COLLEGE
BHANDUP (E)
MUMBAI 400042
SEPTEMBER, 2016

A STUDY OF PERFORMANCE OF PUBLIC SECTOR BANKS IN
THANE CITY UNDER THE PRIME MINISTER’S JAN DHAN YOJANA
Contents
Paragraph
No.
Description Page
Nos.
1.0 CHAPTER 1: INTRODUCTION 1-13
1. 1.1 2. Introduction 3. 1
1.1.1 Financial Inclusion (Exclusion) 3
1.1.2 Financial Inclusion Initiatives 4
1.2 Objectives 4
1.3 Significance of the Study 5
1.4 PMJDY 5
1.4.1 Strategy for Achievement of Objectives 6
1.5 The Mission Mode of the PMJDY 7
1.6 Role of Technology in Financial Inclusion 9
1.7 Challenges Faced in Implementation of PMJDY 10
1.7.1 Telecom Connectivity 10
1.7.2 Awareness and Sensitisation 10
1.7.3 Keeping the Accounts Operational 11
1.7.4 Commission to Banks for DBT 11
1.7.5 Coverage of Difficult Terrains 11
1.8 Role of Major Stake Holders 11
1.9 Chapter Scheme 12
1.9.1 Introduction 12
1.9.2 Review of Literature 12
1.9.3 Research Methodology 12
1.9.4 Data Analysis and Findings 13
1.9.5 Recommendations and Conclusion 13
1.9.6 Limitations of the Study 13
1.9.7 Way Forward 13
2.0 CHAPTER 2: REVIEW OF LITERATURE 14-19
2.1 Introduction 14
2.1.1 Financial Inclusion Initiatives Abroad 14
2.1.2 Feasibility of Bank Correspondent Model 15

2.1.3 Dimensions of Financial Exclusion 16
2.1.4 Financial Inclusion Index 16
2.1.5 Financial Inclusion and Human Development 17
2.1.6 Financial Inclusion and PMJDY 18
3.0 CHAPTER 3: RESEARCH METHODOLOGY 20-21
3.1 Research Methodology 20
4.0 CHAPTER 4: DATA ANALYSIS AND FINDINGS 22-72
4.1 Introduction 22
4.2 Achievements of PMJDY All Over India 22
4.2.1 Analysis of Number of Accounts Opened Under PMJDY as on
31.01.2015
22
4.2.2 Analysis of Percentage Composition of Shares of Each Category of
Banks in Different Types of Accounts Opened as on 31.01.2015
24
4.2.3 Analysis of Percentage Composition of Different Types of Accounts
Within Each Category of Banks as on 31.01.2015
26
4.2.4 Analysis of Number of Accounts Opened Under PMJDY as on
31.08.2016
29
4.2.5 Analysis of Percentage Composition of Share of Each Category of
Banks in Different Types of Accounts as on 31st August, 2016
33
4.2.6 Analysis of Percentage Composition of Different Types of Accounts
(Within Each Category of Banks) as on 31st August, 2016
37
4.2.7 Analysis of Percentage Growth in Accounts under the Scheme as on
31st August, 2016 vs. 31st January, 2015
41
4.2.8 Comparative Analysis of Composition of Percentage Share of Each
Category of banks in Different Types of Accounts as on 31st August,
2016 vs. 31st January, 2015
52
4.2.9 Comparative Analysis of Percentage Composition of Different
Types of Accounts Within Each Category of Banks, as on 31st
August, 2016 vs. 31st January, 2015:
53
4.3.0 Findings of the Sample Survey 53
4.3.1 Bankers' Opinion on Financial Inclusion Model for PMJDY 54
4.3.2 Active Accounts opened under PMJDY 55
4.3.3 Percentage Share of BPL and APL Account Holders 56
4.3.4 Number of Insurance Claims 57
4.3.5 Incremental Cost to Banks and Impact on Profitability 58
4.3.6 Bankers’ Opinion about PMJDY 59

4.3.7 Difficulties Faced by Bankers in Achieving PMJDY Targets 61
4.3.8 Life Covers Offered under PMJDY 62
4.3.9 Claimants of Accident Cover Offered under PMJDY 63
4.3.10 Subscribers to Pension Scheme ‘Swavalamban’ or APY 64
4.3.11 Methodology Adopted for Creating Awareness of PMJDY 66
4.3.12 Impact of PMJDY on Profitability of PSBs 66
4.3.13 Suggestions by PSBs to Scale up Financial Inclusion 67
4.3.14 Summary and Conclusion 68
4.3.14.1 Analysis of Growth in Amount of Deposits with Banks under
PMJDY
69
5.0 CHAPTER 5: RECOMMENDATIONS AND CONCLUSION 73-77
5.1 Introduction 73
5.2 Suggestive Measures 73
5.3 Limitations of the Study 75
5.4 The Way Forward 76
5.5 Conclusion 77
References 78-80
Questionnaire 81-83
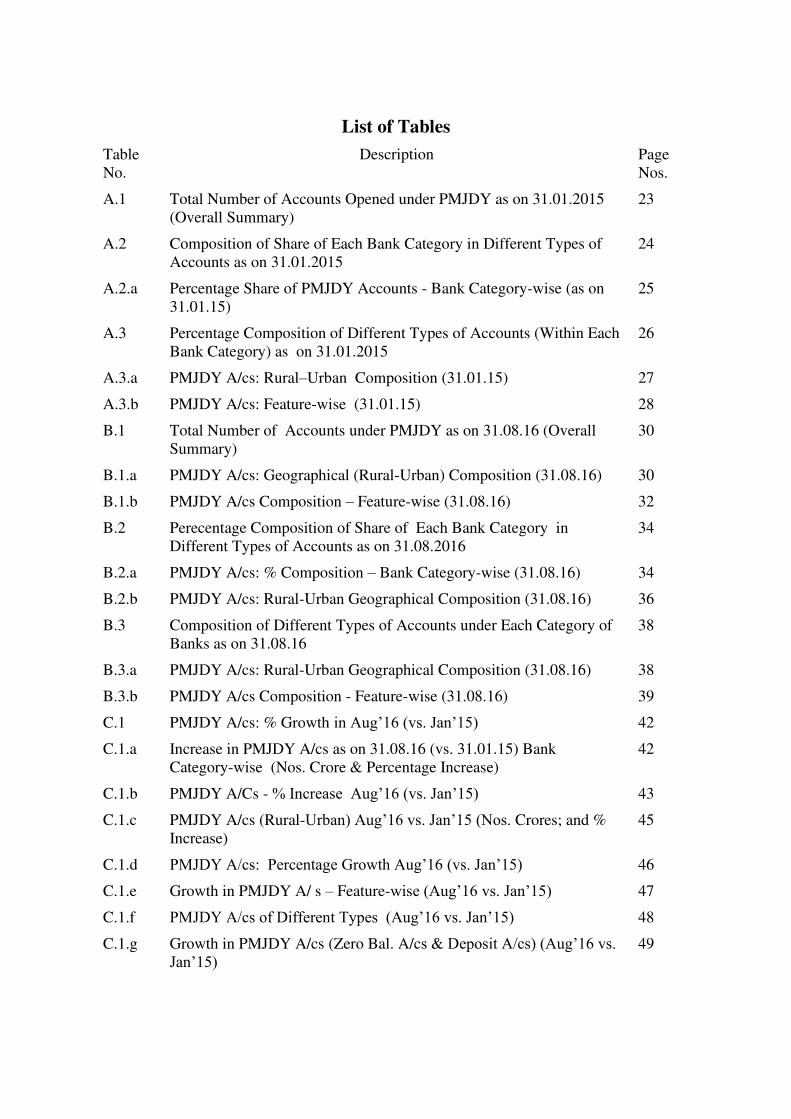
List of Tables
Table
No.
Description Page
Nos.
A.1 Total Number of Accounts Opened under PMJDY as on 31.01.2015
(Overall Summary)
23
A.2 Composition of Share of Each Bank Category in Different Types of
Accounts as on 31.01.2015
24
A.2.a Percentage Share of PMJDY Accounts - Bank Category-wise (as on
31.01.15)
25
A.3 Percentage Composition of Different Types of Accounts (Within Each
Bank Category) as on 31.01.2015
26
A.3.a PMJDY A/cs: Rural–Urban Composition (31.01.15) 27
A.3.b PMJDY A/cs: Feature-wise (31.01.15) 28
B.1 Total Number of Accounts under PMJDY as on 31.08.16 (Overall
Summary)
30
B.1.a PMJDY A/cs: Geographical (Rural-Urban) Composition (31.08.16) 30
B.1.b PMJDY A/cs Composition – Feature-wise (31.08.16) 32
B.2 Perecentage Composition of Share of Each Bank Category in
Different Types of Accounts as on 31.08.2016
34
B.2.a PMJDY A/cs: % Composition – Bank Category-wise (31.08.16) 34
B.2.b PMJDY A/cs: Rural-Urban Geographical Composition (31.08.16) 36
B.3 Composition of Different Types of Accounts under Each Category of
Banks as on 31.08.16
38
B.3.a PMJDY A/cs: Rural-Urban Geographical Composition (31.08.16) 38
B.3.b PMJDY A/cs Composition - Feature-wise (31.08.16) 39
C.1 PMJDY A/cs: % Growth in Aug’16 (vs. Jan’15) 42
C.1.a Increase in PMJDY A/cs as on 31.08.16 (vs. 31.01.15) Bank
Category-wise (Nos. Crore & Percentage Increase)
42
C.1.b PMJDY A/Cs - % Increase Aug’16 (vs. Jan’15) 43
C.1.c PMJDY A/cs (Rural-Urban) Aug’16 vs. Jan’15 (Nos. Crores; and %
Increase)
45
C.1.d PMJDY A/cs: Percentage Growth Aug’16 (vs. Jan’15) 46
C.1.e Growth in PMJDY A/ s – Feature-wise (Aug’16 vs. Jan’15) 47
C.1.f PMJDY A/cs of Different Types (Aug’16 vs. Jan’15) 48
C.1.g Growth in PMJDY A/cs (Zero Bal. A/cs & Deposit A/cs) (Aug’16 vs. Jan’15)
49

C.1.h PMJDY A/cs: Rise in Bank Deposit Amt.: 31.08.16 (vs. 31.01.15)
(Rs.Crores)
50
C.1.i PMJDY A/cs: Rise in Deposits – Bank Category-wise: 31.08.16 (vs.
31.01.15) (Rs. Crores)
51
D.1 Bankers’ Opinion about Financial Inclusion Model 55
E.1 Active Accounts (In Percent) 56
F.1 Share of BPL/APL Accounts (In percent) 57
G.1 Bankers’ Opinion about Impact of PMJDY on Profitability of PSBs 59
H.1 Bankers’ Opinion about PMJDY 60
I.1 Difficulties Faced by Bankers in Achieving PMJDY Targets 61
J.1 Life Cover Seekers Record with the Banks 63
K.1 Branch wise Claimants of Accident Cover 64
L.1 Subscribers to Pension Scheme APY 65
M.1 Impact of PMJDY on Profitability of PSBs 67
N.1 Suggestions by PSB to Scale up Financial Inclusion 68
O.1 Analysis of Growth in Amount of Deposits with Banks under
PMJDY70
70
O.2 Linkage in The Amount of Lowest Average Deposit with Highest
Percentage Growth in Total Deposits
70

List of Graphs
Graph
No.
Description Page
Nos.
A.2.a PMJDYA/cs: Composition (31.01.15) - Bank Category wise (Nos.
Crs. & %)
25
A.3.a PMJDY A/cs: Geographical Composition (31.01.15) (Nos. Crs &
%)\
27
A.3.b % Composition of PMJDY a/cs of Different Types (as on 31.01.15) 28
B.1.a PMJDY a/cs: Geographical Composition (31.01.15) (Nos. CRs. &
%)
31
B.1.b % Composition of PMJDY a/cs of Different Types (as on 31.08.16) 32
B.2.a PMJDY a/c: Composition (31.08.16) – Bank Categories (Nos. Crs;
& %)
35
B.2.b PMJDY a/cs: Geographical Composition (31.08.16) (Nos. Crs. &
%)
36
B.3.a PMJDY a/cs: Geographical Composition (31.01.15) (Nos. Crs. &
%)
39
B.3.b % Composition of PMJDY a/cs of Different Types (as on 31.08.16) 40
C.1.a. Increase in PMJDY a/cs – Bank Category-wise (Nos. Crs. & %
Increase)
43
C.1.b PMJDY a/cs: % Growth – Bank Category wise (Aug’16 vs. Jan’15) 44
C.1.c PMJDY a/cs – Growth in Rural & Urban Areas (Nos. Crs. & %
Increase)
45
C.1.d % Growth in PMJDY a/cs: Urban - Rural Split (Aug’16 vs. Jan’15) 46
C.1.e Growth in Different Types of a/cs under PMJDY (Aug’16 vs. Jan’15) (Nos. Crs.)
47
C.1.f % Growth in PMJDY a/cs of Different Types (Aug’16 vs. Jan’15) 48
C.1.g Growth in Nos of Bank Deposit a/cs under PMJDY (31.08.16 vs.
31.08.15)
49
C.1.h PMJDY: Rise in Bank Deposit Amounts (Rs. Crs.) – Overall 50
C.1.i Rise in Deposit Amount (Rs. Crs.) – Bank Category-wise 51
D.1 Bankers’ Opinion about Financial Inclusion Model 55
E.1 Active Accounts (In Percent) 56
F.1 Share of BPL/APL Accounts (In percent) 57
G.1 Bankers’ Opinion about Impact of PMJDY on Profitability of PSBs 59
H.1 Bankers’ Opinion about PMJDY 60
I.1 Difficulties Faced by Bankers in Achieving PMJDY Targets 61

J.1 Life Cover Seekers Record with the Banks 63
K.1 Branch wise Claimants of Accident Cover 64
L.1 Subscribers to Pension Scheme APY 65
M.1 Impact of PMJDY on Profitability of PSBs 67
N.1 Suggestions by PSB to Scale up Financial Inclusion 68

DECLARATION
I wish to state that the work embodied in this Minor Research Project titled, “A Study of
Performance of Public Sector Banks in Thane City under the Prime Minister’s Jan Dhan
Yojana” forms my own contribution to the research work. I declare that the form and content
of the above-mentioned research project are original and have not been submitted, in part or
full, or published in any form earlier. Wherever reference has been made to any previous work
of others in this research project, it has been duly acknowledged as such and is included in the
Bibliography.

1

1
A STUDY OF PERFORMANCE OF PUBLIC SECTOR BANKS IN
THANE CITY UNDER THE PRIME MINISTER’S JAN DHAN YOJANA
CHAPTER 1
INTRODUCTION
1.1 Introduction
The Prime Minister’s Jan Dhan Yojana (PMJDY) was announced on 15th August, 2014 as an
integrated approach towards achieving financial inclusion by the National Democratic Alliance
(NDA) government. The plan envisages universal banking facilities to all households in the
country, access to credit and social security in the form of insurance cover and pension facilities.
The beneficiaries of this scheme would get an indigenous Rupay card with in-built accident
insurance cover of Rupees one lakh. The plan also envisages transfer of all doles/subsidies to
the poor from the central, state and local bodies through direct benefits transfer (DBT) to these
accounts. This will save thousands of crores spent by the government for the poor which have
been hitherto siphoned off by unscrupulous middlemen.
Inclusive growth is in-built in India’s ecosystem. Nationalisation of banks, priority sector
lending, progressive taxation, subsidies earmarked for the disadvantaged sections of the society,
setting up Regional Rural Banks (RRBs), Self-help Groups Bank Linkage Programme (SBLP),
microfinance etc. are various steps taken by the government to bring the excluded masses into
mainstream economy. The idea of branchless banking was first mooted by the RBI in 2005.
Since the Eleventh Plan (2007-12) period onwards the approach of the government towards
financial inclusion has been more focussed. The government appointed Rangarajan Committee
on financial inclusion in 2008, Nachiket More Committee in 2013 to suggest measures to deepen
efforts of financial inclusion.
The committee on financial inclusion under the chairmanship of Dr. C. Rangarajan (2008)
defined financial inclusion as,

2
“Access to finance by the poor and vulnerable groups is a prerequisite for inclusive
growth. In fact, providing access to finance is a form of empowerment of the vulnerable
groups. Financial inclusion denotes delivery of financial services at an affordable cost
to the vast sections of the disadvantaged and low income groups. The various financial
services included credit, savings, insurance and payments and remittance facilities. The
objective of financial inclusion is to extend the scope of activities of the organized
financial system to include within its ambit people with low incomes. Through
graduated credit, the attempt must be to lift the poor from one level to another so that
they come out of poverty."
The RBI defines financial inclusion as:
“Financial Inclusion is the process of ensuring access to appropriate financial
products and services needed by all sections of the society in general and
vulnerable groups such as weaker sections and low income groups in particular
at an affordable cost in a fair and transparent manner by mainstream
institutional players.”
CGAP defines financial inclusion as:
“Financial Inclusion may be defined as the process of ensuring access to
financial services and adequate credit when needed by vulnerable group such as
weaker section and low income group at an affordable cost”
According to G20:
“Financial Inclusion refers to a state in which all working age adults have
effective access to credit, savings, payment, and insurance from formal service
providers. “Effective access” involves convenient and responsible service
delivery, at a cost affordable to the customer and sustainable for the provider,
with the result that financially excluded customers use formal financial
services rather than existing informal options”
1.1.1 Financial Inclusion (Exclusion)
Financial inclusion (or, alternatively, financial exclusion) has been defined in the literature in
the context of a larger issue of social inclusion (or exclusion) in a society. One of the early

3
attempts by Leyshon and Thrift (1995) defined financial exclusion as referring to those
processes that serve to prevent certain social groups and individuals from gaining access to the
formal financial system. According to Sinclair (2001), financial exclusion means the inability
to access necessary financial services in an appropriate form.
Exclusion can come about as a result of problems with access, conditions, prices, marketing or
self-exclusion in response to negative experiences or perceptions. Carbo et al. (2005) have
defined financial exclusion as broadly the inability of some societal groups to access the
financial system. The Government of India’s Committee on Financial Inclusion in India begins
its report by defining financial inclusion as the process of ensuring access to financial services
and timely and adequate credit where needed by vulnerable groups such as the weaker sections
and low income groups at an affordable cost. (Rangarajan Committee 2008). Thus, most
definitions indicate that financial exclusion is manifestation of a much broader issue of social
exclusion of certain societal groups such as the poor and the disadvantaged. Financial inclusion
is defined as a process that ensures the ease of access, availability and usage of the formal
financial system for all members of an economy. This definition emphasizes several dimensions
of financial inclusion, viz., accessibility, availability and usage of the financial system. These
dimensions together build an inclusive financial system. As banks are the gateway to the most
basic forms of financial services, banking inclusion/exclusion is often used as analogous to
financial inclusion/exclusion. In this paper also, we will use banking inclusion as analogous to
financial inclusion.
These definitions interpret financial inclusion as: i) Provision of financial services at affordable
cost and in a transparent manner to the poor and weaker sections of the society, ii) providing a
range of financial services such as credit, savings, remittances and insurance to the poor at a
sustainable basis.
1.1.2 Financial Inclusion Initiatives
Post-independence various measures such as nationalisation of banks, priority sector lending,
Self-help Groups Bank Linkage Programme (SBLP), expansion of banks’ branch network,
establishment of Regional Rural Banks (RRBs) were aimed at financial inclusion. In the mid-
term policy review in 2005-06, the Reserve Bank of India (RBI) had advised banks to align their

4
policies with the government’s agenda of financial inclusion. The banks were asked to open
‘No-Frills’ accounts for the poor people wherein they are required to keep a minimum or no
balance in such accounts. Alongside other measures such as bank appointing self-help groups
(SHGs), non-government organisations (NGOs), correspondents (BCs), bank facilitators (BFs)
in unbanked areas in hilly terrains and rural areas have been aimed at deepening and widening
financial inclusion.
As Nobel Laureate Prof. Amartya Sen has also noted, “the thrust of developmental policy in
India has undergone a paradigm shift from an exclusive focus on efficiency to one on equity;
from the rate and pattern of growth, and on inequalities, distribution of income and wealth to
the extent to which people are deprived of the requirements for leading a fulfilling life and suffer
‘capability deprivation’.
In India the banking industry has grown both horizontally and vertically. But the penetration of
banks in rural areas is inadequate due to which villagers are still dependent on non-institutional
sources of finance such as money lenders and commission agents. With technological
advancement India provides favourable conditions to transform the financial fabric. There is a
strong network of 1,15,000 bank branches, around 1,55,000 post offices, 72% mobile
penetration, a robust network of computer based service providers, a world class ID system and
an extensive national payment infrastructure.
1.2 Objectives
This study is conducted to achieve the following objectives:
1. To study the extent of financial inclusion achieved by the public sector banks under the
Prime Minister’s Jan Dhan Yojana.
2. To examine the issues related to achievement of financial inclusion targets by the PSBs
with reference to PMJDY.
3. To investigate the impact of PMJDY on the profitability of PSBs.
4. To make suggestive policy recommendations based on the outcomes of the study.
1.3 Significance of the Study

5
There are a couple of studies on PMJDY since it was launched two years back but there are no
known studies on its implementation and impact on the performance of public sector banks in
Thane city. To fill this gap this study has been undertaken to add value to the literature on this
all-encompassing scheme of financial inclusion. This study has covered four aspects of PMJDY
i.e. Jan Dhan – opening of zero balance accounts of the financially excluded, financial literacy,
Jan Suraksha – providing life and accident insurance cover to the poor and Swavalamban –
providing old age pensions to the people working in the unorganised sector. This study has not
taken into consideration the fifth aspect i.e. ‘Mudra’ scheme which entitles the poor people to
seek collateral free loans for starting enterprises for self-employment. Mudra scheme has been
launched recently and enough data is not available. The impact of this nascent scheme can be
observed only after a few years when the enterprises have already been established. Due to these
reasons ‘Mudra’ scheme has not been included in this study.
1.4 PMJDY
PMJDY, the flagship scheme of the NDA government on financial inclusion was announced on
15th August, 2014 and was launched on 28th August, 2014.
The scheme is rolled out in phases. In the first phase (15th August, 2014 to 14th August, 2015)
the scheme aims at:
1. Providing universal access to banking facilities.
2. Providing Basic Banking Accounts for saving and remittances and Rupay debit cards
with an inbuilt accident cover of Rupees one lakh.
3. Promote financial literacy.
The second phase (15th August, 2015 to 15th August, 2018) of PMJDY will incorporate:
1. An overdraft facility up to Rs.5000 to the account holder after satisfactory performance
of saving and credit history for six months.
2. Creation of Credit Guarantee Fund for coverage of defaults in overdraft accounts.
3. Provision of micro insurance.
4. Pension scheme like Swavalamban for the unorganised sector workers.
6
In the second phase the scheme aims at coverage of hilly, tribal and difficult areas for providing
banking services.
5. The rural and semi-urban areas would be mapped into Sub Service Areas (SSAs)
comprising 1000 to 1500 households with an average of three to four villages except
north eastern and hilly regions.
6. Around 74000 villages with a population of 2000 which were covered under
Swabhimaan campaign will be converted into brick and mortar branches with staff
strength of 1+1 or 1+2 within next three to five years.
1.4.1 Strategy for Achievement of Objectives
In order to achieve objectives of the PMJDY the government will be adopting a broad
collaborative strategy. The public private partnership model will be encouraged and the
emphasis will be on making maximum use of inter-departmental synergies to achieve
objectives. Emphasis will be laid on the existing infrastructure of post offices in rural areas and
using the services of Dak Sewaks as Bank Mitr (Bank Correspondents) to reach out to the
unbanked population and provide them banking services at their door step.
The PMJDY scheme envisages fine tuning of the BC model with the help of technological
advancement and incorporating operational flexibility. Banks will use RBI’s scheme for subsidy
on rural ATMs and UIDAI’s subsidy on micro ATMs to provide banking services in unbanked
rural areas at affordable cost. There will be convergence of National Rural Livelihood Mission
(NRLM) in the rural areas and National Urban Livelihood Mission (NULM) in the urban areas
to cover each household with a bank account under this scheme.
1.5 The Mission Mode of the PMJDY
The first pillar of the PMJDY is expansion of bank branches network. There will be mapping
of rural areas in the entire country through Sub Service Area (SSA) approach. Fully enabled
online fixed point Bank Mitr or Business correspondents (BCs) will be deployed to reach out to
the unbanked population. To promote efficiency and pace of coverage, public private
partnership model will be adopted. Mapping of the SSAs and allocation of SSAs to different
banks has already been done.

7
The banks would set up brick and mortar branches in around 74,351 villages with population
more than 2000 with staff strength of 1+1 or 1+2 which were earlier covered by BCs in earlier
campaigns in 3-5 years.
The government would monitor the progress of the scheme through a portal of the Department
of Financial Services (DFS).
The second pillar of the scheme is opening of Basic Saving Bank Deposit Accounts (BSBDA).
There are around 5.92 crore rural households and 1.5 crore urban households yet to be covered
by opening of BSBDA. These accounts will be linked with the Aadhaar number of the account
holder and would become a single point to receive Direct Benefit Transfer (DBT) from the
Central, State and local government bodies. The banks would be compensated with a 2%
commission from the government for appointing BCs but on DBT the government has not so
far fixed any commission for the banks.
For opening of accounts of the uncovered population, the banks will follow camp mode. The
banks will organise camps to ensure that accounts may be opened for all eligible residents in a
time bound manner. Each account holder would be provided with financial literacy sessions to
manage their money and credit facility sessions.
An overdraft (OD) facility of Rs.5000 will be provided to the account holder after six months
of satisfactory performance of their saving and credit history. This OD facility would be covered
by Credit Guarantee Fund (CGF) proposed to be created by the government.
The Third Pillar of this scheme is financial literacy. It is learnt from the experience of
microfinance companies and SHGs that the financially excluded need to be made aware of
benefits of access to financial services. Thus PMJDY will rely on financial literacy centres
(FLCs) for financial literacy and credit counselling (FLCC) to reduce financial exclusion. As
per the RBI 718 FLCCs have been established by the end of 2013 and 2.2 million people were
made aware through camps, chaupals, seminars and workshops during 2013-14.
The Fourth Pillar is creation of a credit guarantee fund (CGF) with a corpus of Rs.1000 crores.
It is proposed to be housed in THE National Credit Guarantee Corporation (NCGC). The
provision of OD of Rs.5000 will help the poor to meet exigencies of healthcare, farming related
expenses etc. and would save people from the clutches of money lenders.
8
The Fifth Pillar is provision of micro insurance to the poor people. Insurance density and
insurance penetration in India is very low as compared to advanced countries. The IRDA Micro
Insurance Regulations, 2005 has defined micro insurance as an insurance policy – life or general
with a sum assured of Rs.50000 or less. With the notification of the IRDA (Micro Insurance)
Regulations 2005 there has been steady increase in micro insurance providers. Micro insurance
schemes introduced under PMJDY are – Pradhan Mantri Jeevan Bima Yojana, Pradhan Mantri
Jeevan Suraksha Yojana at a very low premium of Rs.12 per annum and Rs.330 per annum
respectively.
The Sixth Pillar of PMJDY is pension scheme ‘Swavalamban’ for workers in the unorganised
sector. Around 400 million of the 1.23 billion (85%) Indian population is working in the
unorganised sector. Out of this 120 million are women and majority of them have no access to
formal old age income security scheme. Tenuous work conditions, irregular income flows,
absence of safety nets and poor access to social security renders these unorganised workers
vulnerable to economic shocks. Swavalamban scheme is a landmark initiative of the
government of India to provide old age income protection to the unorganised/informal sector
workers. The objective of this scheme is to encourage informal sector workers to save small
amounts during their working period to draw pension in their old age. This scheme is open to
any Indian citizen working in the unorganised sector in the age group 18-60 years. The
Government of India contributes Rs.1000 per annum for a stipulated period to all eligible NPS
Swavalamban accounts where the subscriber deposits a minimum of Rs.1000 to maximum of
Rs.12000 p.a. The benefit of the Government of India co-contribution is presently available up
to 2016-17. The scheme is regulated by Pension Fund Regulatory and Development Authority
(PFRDA) which is a statutory body created by an Act of the Parliament.
The scheme has received an overwhelming response highlighting the unmet demand for such
social security schemes. Aanganwadi workers, SHGs, ASHA workers and construction workers
have joined this scheme in large numbers. The total number of subscribers has reached 2.7
million in the financial year 2013-14. More than 50% subscribers are below 40 years of age and
more than 70% are women. Till March 2014 the government’s contribution was Rs.363 crores
and subscriber’s contribution is Rs.564 crores.
1.6 Role of Technology in Financial Inclusion

9
Technology and financial inclusion work in tandem in providing low cost financial services to
the excluded. In order to make financial services available across the length and breadth of the
country latest technological products such as Electronic Know Your Customer (e-KYC), mobile
banking services etc. can be a game changer. Under the guidance of RBI various organisations
like National Payments Corporation of India (NPCI), Institute for Development & Research in
Banking Technology (IDRBT) etc. are contributing significantly in bringing new technology
products. A bouquet of new technology savvy products has been introduced to reach out to the
unbanked people in remote and hilly regions as well as in rural areas. These are:
• Electronic Know Your Customer (e-KYC)
• Transaction through Mobile Banking
• Immediate Payment System (IMPS)
• Micro-ATMs
• National Unified USSD Platform (NUUP)
• RuPay Debit cards
• Aadhaar Enabled Payment System (AEPS)
• Aadhaar Payments Bridge System (APBS)
The success of any mega scheme depends on continuous monitoring and quick action
mechanism set in place to meet any contingencies. Various social security schemes introduced
earlier by the government failed to achieve objectives and targets due to poor implementation
and inappropriate monitoring. The government has created a multi-layered system of reporting
with State, district and village level administrative infrastructure.
1.7 Challenges Faced in Implementation of PMJDY
There are various challenges which are expected to make implementation of this scheme
difficult.
1.7.1 Telecom Connectivity
In hilly and difficult terrains it is difficult to set up Bank Mitras due to poor telecom
connectivity. The Department of Telecommunications (DOT) has ensured that these issues can

10
be resolved with mutual consultations with banks. Banks are advised to use National Optical
Fibre Network (NOFN) when it reaches the Panchayat level.
1.7.2 Awareness and Sensitisation
The success of this scheme depends on spreading awareness and sensitisation of the potential
beneficiaries. The public needs to be aware of the presence of Bank Mitr and banking facilities
provided by them such as accepting small deposits, providing RuPay cards and overdraft facility
of Rs.5000. They also need to be made aware of that this overdraft is a credit to them and needs
to be paid back to the bank to get fresh limits.

11
1.7.3 Keeping the Accounts Operational
Another problem is to keep the accounts operational. For direct benefit transfers (DBT) in case
of MNREGA and LPG these accounts. At present there is a lot of duplicity of these accounts as
SSA approach has not been followed.
1.7.4 Commission to Banks for DBT
For opening and maintaining accounts under PMJDY and the DBT system for LPG and
MNREGA banks incur additional administrative costs. The task force on Aadhaar Enabled
Unified Payment Infrastructure had recommended in its report in 2012 that a last mile
transaction cost of 3.14% with a cap of Rs.20 per transaction should be budgeted through Micro-
ATMs or ATMs.
1.7.5 Coverage of Difficult Terrains
There are challenges faced in terms of telecom connectivity and road infrastructure in hilly areas
of North East, Himachal Pradesh, Jammu and Kashmir, Uttarakhand and 82 Left Wing
Extremism (LWE) districts. Reaching out to the financially excluded in these regions is a
difficult and time consuming task. Therefore it may spill over to Phase II of the scheme.
1.8 Role of Major Stake Holders
The success of PMJDY depends on mutual cooperation and co-ordination among the stake
holders of the scheme.
• The Department of Financial Services will have overall ownership of the Mission Mode
Project of Financial Inclusion and monitoring of the scheme.
• The Departments of Central Government will coordinate with each other for passing the
benefits of 26 social welfare schemes.
1.9 Chapter Scheme

12
The study is presented in five chapters following the logical flow of thought and objectives of
the study.
1.9.1 Introduction
Financial inclusion has been a topical issue of research in India as well as rest of the world since
the beginning of nineteen century. In India, in spite of various measures undertaken by the
government the stark fact is that still around 40% of the population remains outside mainstream
banking services. PMJDY is a recent initiative of the present government to bring the financially
excluded into the ambit of mainstream financial services. The first chapter delves into the
various objectives, aspects, provisions and challenges of this mega programme of financial
inclusion.
1.9.2 Review of Literature
This chapter examines various studies conducted in various parts of the country by individual
researchers and by experts to study the impact of PMJDY. The findings of these studies indicate
that the present state of financial inclusion in India is not commendable. The performance of
north eastern states is very poor in achieving higher score of financial inclusion. There are
technological stumbling blocks such as poor connectivity in reaching out to the financially
excluded in the hilly and difficult terrains. There are issues regarding remuneration to the Bank
Mitr and commission to the banks for opening zero balance accounts of the financially excluded
population.
1.9.3 Research Methodology
The quality of research depends on the research design and methodology used in conducting
sample survey and analysis of data. This chapter illustrates the research design and research
methodology used in this study. The research design is mainly exploratory. There are 116 PSB
branches in Thane city. A detailed questionnaire was prepared to collect data about targets
achieved and difficulties faced in implementation of PMJDY by PSB branches in Thane city.
Secondary sources of data such as PMJDY website, RBI website, various reports and research
studies conducted on the implementation of the scheme were used for this research study.
1.9.4 Data Analysis and Findings
13
PMJDY was introduced and implemented in 2014. Since this scheme is in its nascent stage only
past one and a half years data is available from the banks. Only 12 bank branches co-operated
to fill up the questionnaire that too with a significant amount of coaxing. Bank managers of
other branches which were contacted refused to provide information stating that it is internal
matter of banks and the researcher needs to seek permission of the head office for any
information regarding targets and problems faced in implementation of PMJDY. This chapter
elucidates the data analysis techniques used and findings of the study.
1.9.5 Recommendations and Conclusion
This chapter summarises the study and makes suggestive policy recommendations based on the
objectives and findings of the study.
1.9.6 Limitations of the Study
This Chapter describes the challenges faced in accessing primary data and hence limitations on
accuracy of the results, though supplemented by extensive secondary data analysis.
1.9.7 Way Forward
This Chapter points to the enormous scope for further research on different aspects emerging
from implementation of the scheme.

14
CHAPTER 2
REVIEW OF LITERATURE
2.1 Introduction
Financial inclusion includes provision of financial services such as saving bank accounts, credit
at reasonable cost and insurance (life and non-life) to those who find these services inaccessible
due to poverty. The Rangarajan Committee defines financial inclusion as a process of ensuring
access to financial services such as adequate and timely supply of credit to the weaker sections
at an affordable cost. India, at present has a fairly vast network of banks and financial
institutions. The Reserve Bank of India (RBI) has taken various steps to promote financial
inclusion since 1960 with the nationalisation of 14 major commercial banks. Since the late
nineties, the RBI and National Bank for Agriculture and Rural Development (NABARD) have
taken several initiatives such as – SHG Bank Linkage Project (SBLP), Kissan Credit Cards
(KCC), relaxed Know Your Customers (KYC) norms, introduction of Business Correspondents
(BCs) and Business Facilitators (BFs) in unbanked rural areas, Direct Benefit Transfers (DBTs)
and no frills banking services. The recent issuance of banking licenses to Bandhan, a
microfinance institution in West Bengal, and to IDFC can also be considered as the regulator’s
step towards deepening financial inclusion. In spite of all these efforts a vast proportion of the
population remains financially excluded. This chapter examines studies undertaken by various
researchers to study and analyse various government schemes on financial inclusion.
2.1.1 Financial Inclusion Initiatives Abroad
Several countries have initiated legislative measures, for example, the Community
Reinvestment Act (1997) of the United States of America requires banks to offer credit
throughout their area of operation and prohibits them from targeting only the rich
neighbourhoods. The French law against exclusion (Loi du 29 Juillet 1998 contre le exclusion)
emphasises an individual’s right to have a bank account. In the United Kingdom, a Financial
15
Inclusion Task Force was constituted by the government in 2005 in order to monitor the
development on financial inclusion.
Among several initiatives of the banking sector in promoting financial inclusion are the German
Bankers’ Association’s voluntary code (1996) to provide for an everyman ‟current banking
account that facilitates basic banking transactions, introduction of “Mzansi”, a low cost bank
account, in 2004 for financially excluded people by the South African Banking Association and
initiatives by the Reserve Bank of India (RBI) to achieve greater financial inclusion, such as
facilitating no-frills accounts and General Credit Cards for low deposit and credit. Alternate
financial institutions, such as microfinance institutions and Self-Help Groups, are also promoted
in many countries in order to provide financial services to the excluded.
2.1.2 Feasibility of Bank Correspondent Model
P.K. Das (2009) has examined the feasibility of Business Correspondents (BC) and Business
Facilitators (BF) model in Uttar Pradesh. His study reveals that 90% respondents prefer all types
of door-step banking services but the transaction costs are high. Banks are not interested in
utilising post offices as they believe that post offices are banks’ competitors and banks can
provide superior products to their clients. All heads of bank branches surveyed by the author
agree that use of technology such as Point of Sale (POS) terminal deployed by the banks can
minimise problems in providing door-step banking services. His study recommends that use of
BCs can reduce cost of banking services by about 50% as compare to brick and mortar banking
and should be used for achieving 100% financial inclusion.
Shobhana Vasudevan (2009) has studied the feasibility of BC and BF model in slums of Dharavi
in Mumbai in scaling up financial inclusion. Her study reveals that BC and BF models for
achieving greater financial inclusion would work better than brick and mortar branches in these
slums as majority of population have little financial literacy.
A recent study by the RBI (Annual Report, 2015-16) on BC model of financial inclusion has
stressed on the need for certification and training of BCs. It also brings out the need for adequate
remuneration, infrastructure, imparting of technological know-how, effective cash management

16
skills to BCs for enhancing financial inclusion. The report also highlights maintaining a registry
of BCs for better supervision of their activities.
A study on efficacy of SHG-Bank Linkage model by the RBI (Annual Report, 2015-16) points
out that the banks could consider appointing Bank Mitr functioning under Deendayal Antodaya
Yojana-National Rural Livelihood Mission (DAY-NRLM) as BC agents so that they can
transact business for SHGs members as well as other customers of banks.
The RBI’s Committee on Mid-Term Path on Financial Inclusion submitted its report in
December 2015. This report affirms that PMJDY has led to substantial increase in financial
products to the poor but there are significant gaps in terms of usage, ‘last-mile’ service delivery,
exclusion of women and small and marginal farmers and a very low formal link for the micro
and small enterprises.
2.1.3 Dimensions of Financial Exclusion
Financial exclusion is multi-dimensional (Sarma, 2010). It can be in the form of Access
exclusion wherein the population remains excluded due to either remoteness of financial system
or due to the process of risk management of financial system. It can be Condition exclusion
when due to certain inappropriate conditions the population remains excluded. It is also found
in the form of Price exclusion when the population remains excluded due to unaffordability of
financial services. When financial exclusion occurs due to target marketing and sales it is called
Marketing exclusion. It exists as Self-exclusion when due to psychological barriers or due to
fear of refusal the population exclude themselves from the financial system (Kempson and
Whyley, 1999a, Kempson and Whyley, 1999b).
2.1.4 Financial Inclusion Index
Sarma (2010) has attempted to construct a financial inclusion index by taking into consideration
three dimensions – banking penetration (BP), availability of banking services (BS) and usage
of banking system (BU). It may come handy for the government to evaluate the performance of
financial inclusion measures taken from time to time.

17
Sadhan Kumar (2011) worked out an Index on financial inclusion (IFI) based on three variables
namely penetration (number of adults having bank account), availability of banking services
(number of bank branches per 1000 population) and usage (measured as outstanding credit and
deposit). The results indicate that Kerala, Maharashtra and Karnataka has achieved high
financial inclusion (IFI >0.5), while Tamil Nadu, Punjab, A.P, H.P, Sikkim, and Haryana
identified as a group of medium financial inclusion (0.3 <IFI<0.5) and the remaining states have
very low financial inclusion.
2.1.5 Financial Inclusion and Human Development
Bagli’s study (2012) about financial inclusion has revealed that there is a positive link between
financial inclusion and human development in states of India. He has pointed out that the present
state of financial inclusion in India is not commendable. He asserts that financial literacy among
the marginalised is necessary to enhance financial inclusion.
Acharya Debashish and Parida Tapas K. (2013) constructed an index of financial inclusion for
different states. Their study reveals that north eastern states have performed poorly on financial
inclusion as the value of index for these states is very low. The performance of South Indian
states is better with a higher index value. Their study also tried to find a correlation between
rural poverty numbers and financial inclusion index which shows that the correlation is negative.
Thus better financial inclusion can lead to lowering of poverty in rural areas. They suggest that
credit delivery in rural areas needs to be improved as there is significant unmet demand for
formal sources of credit.
Chowhan and Pandey (2014) concluded that financial inclusion helps in mitigating exploitation
of the poor by the usurious class of money lenders. It helps in protecting resources of the poor
at the time of emergencies due to access to mainstream financial resources.
2.1.6 Financial Inclusion and PMJDY

18
Khuntia (2014) studied various financial inclusion initiatives of the government with special
reference to the PMJDY.
Divyesh Kumar (2014) has attempted to study financial inclusion with reference to PMJDY
scheme and infers that the success of the scheme depends on continuous reviews and checks by
the government.
Patnaik, Satpathy and Supkar (2015) studied financial inclusion in Odisha. Their study shows
that a very small portion of the surveyed population had a bank account due to low level of
income and lack of savings. In their opinion banks can reach out to this segment of population
and include them in mainstream banking services by opening their zero balance accounts.
Sonam K. Gupta (2015) has analysed the number of accounts opened and active accounts under
PMJDY.
Joshi and Rajpurohit (2016) studied the impact of PMJDY in enhancing the financial inclusion
in rural sector in India very recently. They conclude that this scheme has not made much
progress in achieving targets as the rural folks are still not very much aware of the provisions
of this scheme. They still do not have access to banking facilities. A major stumbling block in
the way of financial inclusion is lack of financial literacy.
Suresh, Srinivasa and Vijay Kumar (2016) jointly studied the financial inclusion initiatives with
special reference to PMJDY in India. In their opinion the scheme can meet the challenges,
improve banking infrastructure and monitoring for effective financial inclusion but the real
challenge can be delivery of financial services. They recommend leveraging of post office
network in rural areas for achieving financial inclusion.
Kaur and Singh (2015) have attempted to analyse PMJDY and have suggested that measures
such as setting up biometric ATMs for the illiterate, introduction of customised products,
simplified documentation and participation by the private banks can help in achieving the targets
of PMJDY.
Raval (2015) studied financial inclusion initiatives in India and opines that financial inclusion
of the low income groups and the economically disadvantaged classes can achieve better results
if they are backed with similar initiatives by the private sector and proactive approach of the
general public.

19
Balasubramanian (2015) constructed a model with variables – number of earning family
members, size of the family, nature of employment and average monthly income to study the
saving habits of people. He concludes that these variables and financial literacy plays a crucial
role in determining saving habits of people.
These studies reveal various dimensions of financial exclusion or lack of financial inclusion i.e.
causes on demand and supply side, impact of various government initiatives to improve
financial inclusion and the challenges faced in doing so. The impact of government’s mammoth
scheme PMJDY on improving financial inclusion has yet to be seen as it was started only two
years back. The major challenges the government is facing are related to spreading awareness
about this scheme, technological hitches and keeping the newly opened accounts alive.

20
CHAPTER 3
RESEARCH METHODOLOGY
3.1 Research Methodology
The research design of this study has been primarily exploratory. There are 116 branches of
public sector banks (PSBs) in thane city. A detailed structured questionnaire was prepared and
distributed to the branch heads (Branch Managers) of around 90 branches for the sample survey
out of which only 20 branch managers agreed to provide data for this study. Personal interviews
were conducted to collect information about implementation of PMJDY and the progress made
by each of these bank branches to scale up financial inclusion. Data collected through
questionnaires and personal interviews was tabulated and analysed for preparing this report.
Many banks’ branches have done good field work to popularise this scheme and have opened a
good number of PMJDY accounts. They have readily shared data regarding these accounts. It
has been observed that bank branches that have not performed well are not ready to share details
of number of accounts opened or people who have registered themselves for insurance cover
under this scheme. As public sector employees, branch managers of banks do not want to be on
record to voice out difficulties faced by them for implementation of this scheme. One can
understand their difficulties such as the workload of existing employees has increased as the
government has not increased manpower to shoulder additional workload of reaching out to the
financially excluded people and opening their accounts.
Under the auspices of financial inclusion, the government has recently launched ‘Mudra’
scheme which aims at providing financial assistance to individuals to start micro enterprises.
Banks have to provide collateral free loans to individuals under this scheme which the banks
are afraid would lead to bad loans in future. Public sector banks are already having a very large
amount of stress assets and ‘Mudra’ scheme may further add to that. However, this study has
not included ‘Mudra’ scheme as it has been recently launched and very few banks have so far
provided loans to the budding entrepreneurs. Therefore due to lack of sufficient data this scheme
has not been included in this study.

21
Data from secondary sources such as reports published by the Reserve bank of India, Ministry
of Finance, Government of India, financial dailies, journals and quarterly balance sheets of PSBs
have been used to supplement primary data.
Data collected through the sample survey and supplemented by secondary data has been
analysed with simple statistical methods for this report. Since the scheme was launched only
two years back i.e. in August, 2014, there is lack of time series data on PMJDY. Due to this
there is very little scope to treat data with advanced statistical tools. The tabulated data has been
presented in tables and graphs. The study uses a simple model to examine the extent to which
the financial inclusion targets set by the PMJDY scheme have been achieved by PSBs in Thane
city depending on their response related to questions.

22
CHAPTER 4
DATA ANALYSIS AND FINDINGS
4.1 Introduction
To study the impact of PMJDY on financial inclusion of the excluded masses in Thane city, a
sample survey has been conducted from February, 2016 to the first week of June, 2016.
According to the Bank of Maharashtra, the lead bank of this scheme in Thane district, there are
116 branches of public sector bank branches (PSBs) in Thane city. The Heads of around 90
PSB bank branches were contacted and a detailed questionnaire was distributed. They were
requested to provide data about PMJDY implemented by their respective branch. Due to non-
cooperation of some of the branch heads, data could be obtained only from 20 branches of
various PSBs. To supplement the data collected by the sample survey, data from secondary
sources such as progress report of the scheme from PMJDY website, RBI publications and
studies conducted by other researchers has been used. Data has been tabulated, analysed using
simple statistical techniques and presented in this chapter.
4.2 Achievements of PMJDY All over India
The progress of the scheme is uploaded on the PMJDY official website. In this section an
analysis of the overall progress of the scheme all over India is presented.
4.2.1 Analysis of Number of Accounts Opened Under PMJDY as on 31.01.2015
The following Table 4.1 summarizes the overall position of the aggregate numbers of all kinds
of accounts opened by different categories of banks under the Pradhan Mantri Jan Dhan Yojana
(‘PMJDY’ or ‘the scheme’) as on 31st January, 2015.
Table: A.1: Total Numbers of Accounts Opened under PMJDY as on 31.01.2015 (Overall Summary)

23
Category of Banks
Rural - Urban Spread
Total A/cs# (Nos.
in Crore)
Profile of Accounts Deposit
Balance In A/cs
(In Rs. Crore)
Rural Accounts (Nos. in Crore)
Urban Accounts (Nos. in Crore)
RuPay Debit Card (Nos.
in Crore)
Aadhaar Seeded
Accounts (Nos. in Crore)
Accounts With Zero
Balance (Nos. in Crore)
Accounts With
Deposit (Nos. in Crore)
PSBs* 5.33 4.51 9.84 9.12 N.A. 6.55 3.29 8,175
RRBs** 1.85 0.33 2.18 1.50 N.A. 1.59 0.59 1,599
Pvt. Banks*** 0.32 0.20 0.52 0.46 N.A. 0.30 0.22 726
G Total 7.50 5.05 12.55 11.08 N.A. 8.45 4.10 10,500
* Public Sector Banks ** Rural Regional Banks ***Private Sector Banks # Accounts
Source: www.pmjdy.com
As is evident from Table A.1, of the total number of 12.55 crore accounts opened as on 31st
January, 2015, predominantly, the largest number of 9.84 crore (78.5%) accounts were opened
by the Public Sector Banks (‘PSBs’), followed by 2.18 crore (17.4%) accounts by the Regional
Rural Banks (‘RRBs’), and the least number of accounts 0.52 crore (4.2%) by the Private Sector
Banks (‘private banks’). The same pattern (PSBs being the highest numbers, RRBs coming
next in the middle, and private banks being the lowest) is seen in the absolute numbers of
accounts opened in the rural areas, and in the urban areas; as well as the accounts opened with
different features (i.e. with RuPay debit cards, and Zero balance), as detailed below.
As regards the rural-urban geographical spread, among the total 12.55 crore accounts opened
by all banks, 7.50 crore (59.8%) were rural accounts and 5.05 crore (40.2%) were urban
accounts. PSBs have led with largest numbers, followed by RRBs, and private banks
respectively in the numbers of accounts opened both in the rural as well as in the urban areas.
Out of PSBs total 9.84 crore accounts under the scheme, 5.33 crore (54.1%) were rural
accounts, and 4.51 crore (45.9%) were urban accounts. Out of total 2.18 crore accounts of
RRBs’ under the scheme, 1.85 crore (84.9%) were rural accounts, and 0.33 crore (15.1%) were
urban accounts. And of the total 0.52 crore accounts of private banks under the scheme, 0.32
crore (61.6%) were rural accounts, and 0.20 crore (38.4%) were urban accounts.
And features-wise, of the total 12.55 crore accounts, 11.08 crore (88.3%) were with RuPay
debit cards (‘RuPay cards’), and 8.45 crore (67.3%) accounts were with Zero balance amount
(‘Zero balance accounts’), and 4.10 crore (32.7%) accounts were with some deposit amount
(‘Deposit accounts’). And again true to the major pattern, the highest numbers of accounts with

24
each of these features were by the PSBs, next significantly lower numbers, by the RRBs, and
the lowest numbers by the private sector banks. Out of the PSBs’ total 9.84 crore accounts
opened under the scheme, 9.12 crore were issued with RuPay cards, and 6.55 crore accounts
were having Zero balance. Among the RRBs’ total 2.18 crore accounts, 1.50 crore were with
RuPay cards, and 1.59 crore with Zero balance amount. And within the private sector banks’
meagre number of just 0.52 crore accounts opened, 0.46 crore were with RuPay cards, and 0.30
crore with Zero balance.
Of the total 4.10 crore accounts having some deposit balance amount, the aggregate deposits
amounted to Rs.10500 crore, of which Rs.8175 crore (77.9%) were lying with the PSBs,
Rs.1599 crore (15.2%) with the RRBs and Rs.726 crore (6.9%) with the private sector banks.
4.2.2 Analysis of Percentage Composition of Share of Each Category of Banks in Different
Types of Accounts Opened as on 31.01.2015
The Table A.2 below shows the overall position of the percentage composition within the
respective regional spread and the type of accounts opened by different categories of banks
under PMJDY as on 31st January, 2015.
Table A.2: Percentage Composition of Share of Each Bank Category in Different Types of A/cs as on 31.01.2015
Category ofBanks
Rural - Urban Spread Total Accounts (Nos in Crore)
Profile of Accounts Deposit Balance
In Accounts
(Rs. in Crore)
Rural Accounts (Nos. in
Crore)
Urban Accounts (Nos. in Crore)
RuPay Debit Card
(Nos in Crore)
Aadhaar Seeded A/cs
(Nos. in Crore)
AccountsWith Zero
Balance (Nos. in Crore)
Accounts With Deposit (Nos. in Crore)
PSBs 71.1% 89.5% 78.5% 82.3% N.A. 77.6% 80.3% 77.9%
RRBs 24.6% 6.5% 17.4% 13.5% N.A. 18.9% 14.3% 15.2%
Pvt. Banks 4.3% 4.0% 4.2% 4.1% N.A. 3.5% 5.5% 6.9%
G. Total 100.0% 100.0% 100.0% 100.0% N.A. 100.0% 100.0% 100.0%
Source: PMJDY website
Of all the 12.55 crore accounts opened, the predominant share 9.84 crore (78.5%) being of PSB
banks, the next significantly lower share of 2.18 crore (17.4%) of RRBs; and the least miniscule
share 0.52 crore (4%) of private banks, as seen in the Table A.2.a, and Graph A.2.a below.
Table A.2.a: Percentage Share of PMJDY Accounts – Bank Category-wise (31.01.15)

25
Nos. Crore. %
PSU Banks 9.84 78.5%
RRB's 2.18 17.4%
Private Banks 0.52 4.2%
G.Total 12.55 100.0%
Graph: A.2.a
Source: PMJDY website
Similar pattern is seen within the respective composition of the accounts opened with RuPay
card (PSBs 82.3%, RRBs 13.5%, private banks 4.1%), the accounts with Zero balance (PSBs
77.6%, RRBs 18.9%, private banks 3.5%), the accounts with some deposit balance (PSBs
33.4%, RRBs 26.9%, private banks 42.8%), and the amount of deposits (PSBs 77.9%, RRBs
15.2%, private banks 6.9%); as well as in the Rural accounts (PSBs 71.1%, RRBs 24.6%,
private banks 4.3%), and the Urban accounts (PSBs 89.5%, RRBs 6.5%, private banks 4.0%).
However the following noteworthy points emerge from the analysis:
1. While PSBs undoubtedly lead with their predominant percentage share in both the Rural
as well as the Urban accounts;
a. Expectedly RRBs have done relatively better in Rural accounts, having opened
24.6% of the total Rural accounts, than the Urban accounts (6.5% of the total Urban
accounts); and

26
b. PSBs have been relatively better in opening urban accounts (89.5% of total Urban
accounts) than the Rural accounts (71.1% of total Rural accounts).
2. While private banks had opened 0.52 crore (4.2%) of total accounts under the scheme,
their share (of Rs726 crore) in amount of total deposits is relatively better as a percentage
(6.9%) than their percentage share in the number of accounts (4.2%), due to higher amount
of average balance in each of their accounts.
4.2.3 Analysis of Percentage composition of Different Types of Accounts within Each
Category of Banks as on 31.01.2015
Within the total accounts opened by each category of banks (i.e. PSBs, RRBs, and private
banks) as on 31st January, 2015, the data is further analyzed to reflect the percentage
composition of the regional spread (Rural-Urban accounts) and also the respective percentage
composition of different types of accounts opened by each category of banks. This is
summarized in the following Table A.3
Table A.3: Percentage Composition of Different Types of Accounts (Within Each Bank Category) as on 31.01.2015
Category of Banks
Rural - Urban Spread Total Accounts
(Nos in Crore)
Profile of Accounts Deposit Balance In A/cs (Rs. in
Crore)
Rural Accounts
(Nos. in Crore)
Urban Accounts (Nos. in Crore)
RuPay Debit Card
(Nos in Crore)
Aadhaar Seeded
Accounts
(Nos. in Crore)
A/cs With Zero
Balance (Nos. in Crore)
Accounts With
Deposit (Nos. in Crore)
PSBs 54.1% 45.9% 100.0% 92.7% N.A. 66.6% 33.4% 33.4%
RRBs 84.9% 15.1% 100.0% 68.7% N.A. 73.1% 26.9% 26.9%
Pvt. Banks 61.6% 38.4% 100.0% 87.7% N.A. 57.2% 42.8% 42.8%
G. Total 59.8% 40.2% 100.0% 88.3% N.A. 67.3% 32.7% 32.7%
Source: PMJDY website
Analysis of Regional (Urban-Rural) Spread:
Broadly, out of the total 12.55 crore accounts opened under the scheme by all banks, a majority
of accounts i.e. 59.8% (7.50 crore) were in Rural areas, while 40.2% (5.05 crore) were in Urban
areas; as summarized in the Table A.3.a, and Graph A.3.a, here-under.
Table A.3.a

27
PMJDY A/Cs: Rural–Urban (Composition) (31.01.15)
Nos. Crore. % Share
Rural A/Cs 7.50 59.8%
Urban A/c 5.05 40.2%
Total 12.55 100.0%
Graph A.3.a
Source: PMJDY website
A further analysis of the regional spread (Rural-Urban accounts) as seen in the main Table 4.3
above, shows that in the Rural accounts RRBs have the highest percentage share (84.9%) of
total accounts opened under the scheme; and surprisingly followed by private banks with the
next higher and significant percentage share (61.6%) of their total accounts opened; and PSBs
show the lowest percentage share (54.1%) of their total accounts opened under the scheme.
In the Urban accounts, in percentage terms while the PSBs had the highest percentage (45.9%)
of their total accounts under the scheme, the private banks came a close second (with 38.4% of
their total accounts) under the scheme; and RRBs were with the lowest share (15.1%).
Features-wise Analysis of Accounts:
The following Table A.3.b, and Graph A.3.b show the overall position of the accounts opened
with different features by all banks under the scheme as on 31st January, 2015.

28
This shows that of all accounts opened by all banks, 88.3% accounts were with issued with
RuPay cards, and 67.3% accounts were with Zero balance.
Table A.3.b
PMJDY A/cs: Feature-wise (31.01.15)
% Shares
RuPay Card A/cs 88.3%
Zero Balance A/cs 67.3%
Aadhaar Seeded A/cs N.A.
Graph A.3.b
Source: PMJDY website
And within the category of accounts with RuPay Cards, the PSU banks lead with 92.7% of
their accounts opened with RuPay card (9.12 crore nos.), Private Banks come next with 87.7%
(0.46 crore nos.), and RRB’s with 68.7% (1.50 crore nos.).
However, within the category of accounts with Zero balance, the RRB’s lead in terms of
percentage share of their accounts with Zero balance with 73.1% (1.59 crore nos.), followed
by PSB banks with 66.6% share (1.59 crore nos.), and Private banks being the lowest with
57.2% share (0.30 crore nos.).
Conversely, within the class of accounts with some deposit balance, the Private banks were
ahead in terms of the percentage share of their total accounts with deposit being 42.8% (though
with meagre 0.22 crore nos.), followed by PSBs with 33.4% share (3.29 crore nos.), and RRBs

29
with 26.9 % share (0.59 nos.) coming as last, in percentage share. Similar pattern was evident
in in terms of the percentage shares, as regards the amount of deposit in their accounts too.
4.2.4 Analysis of Number of Accounts Opened Under PMJDY as on 31.08.2016
The ensuing Table 4.4 summarizes the position of total number of accounts opened under
PMJDY as on 31st August, 2016.
There has been a remarkable growth in the number of accounts opened under the scheme, both
Rural and Urban, by each category of banks, RuPay cards, as well as the amounts of deposits in
the said accounts as evident from the Table B.1 below.

30
Table B.1: Total Number of Accounts under PMJDY as on 31.08.16 (Overall Summary)
Category of Banks
Rural - Urban Spread
Total Accounts (Nos
in Crore)
Profile of Accounts Deposit Balance
In Account
s (Rs. in Crore)
Rural Accounts (Nos.
in Crore)
Urban Account
s (Nos. in Crore)
RuPay Debit Card (Nos
in Crore)
Aadhaar Seeded
Accounts
(Nos. in Crore)
Accounts With Zero
Balance (Nos. in Crore)
Accounts With
Deposit (Nos. in Crore)
PSBs 10.72 8.4 19.12 15.33 10.16 4.69 14.43 33,379
RRBs 3.55 0.58 4.13 2.88 1.72 0.87 3.26 7,199
Pvt. Banks
0.52 0.33 0.85 0.79 0.35 0.31 0.54 1,517
G. Total 14.79 9.31 24.10 19.00 12.23 5.87 18.23 42,094
Source: PMJDY website
The total number of accounts opened under the scheme by all banks grew to 24.10 crore (92.1%
growth)
Of the total 24.10 crore accounts under the scheme as on 31st August, 2016, PSBs have a lion’s
share of Rs.19.12 crore (79.3% of total accounts), followed by RRBs’ Rs.4.13 crore (17.1%)
and private sector banks with very small share of 0.85 crore (3.5%).
Analysis of Regional (Rural-Urban) Spread:
The following Table B.1.a and the related Graph B.1.a summarize the overall Regional (Rural-
Urban) spread of the aggregate accounts opened under the scheme by all banks.
Table B.1.a
PMJDY A/cs: Geographical (Rural-Urban) Composition (31.08.16)
Nos. Crore. % Share
Rural A/cs 14.79 61.4%
Urban A/cs 9.31 38.6%
Total 24.10 100.0%

31
Graph B.1.a
Source: PMJDY website
In the rural urban split:
• RRBs lead with the highest percentage 86% of their accounts being in rural sector
(14% urban)
• Surprisingly private sector banks come second with 61.2% of their accounts in the
rural sector (38.8% urban).
• PSBs being the last with 56.1% of accounts in rural segment (43.9% urban).
The rural urban comparison during the period broadly remains similar with marginal
fluctuations in percentages.
Feature-wise Analysis of Accounts:
The ensuing Table B.1.b and the related Graph B.1.b summarize the overall position of the
aggregate accounts of different features opened under the scheme by all banks.
32
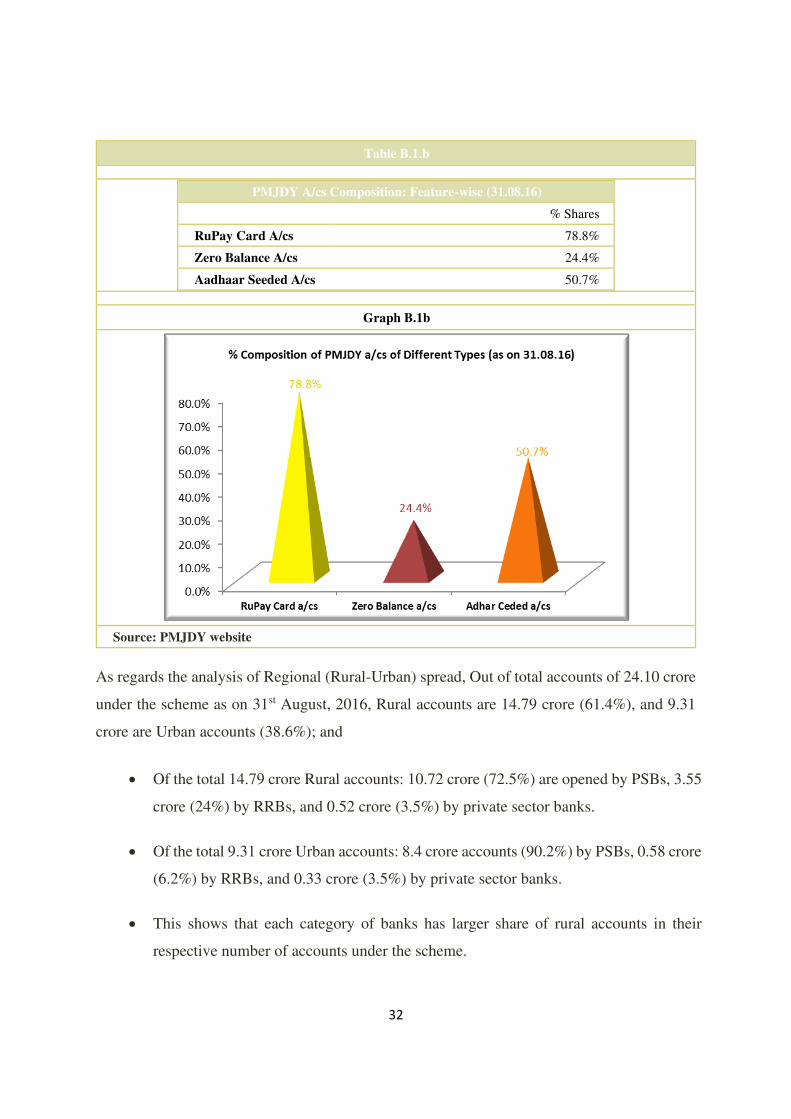
Table B.1.b
PMJDY A/cs Composition: Feature-wise (31.08.16)
% Shares
RuPay Card A/cs 78.8%
Zero Balance A/cs 24.4%
Aadhaar Seeded A/cs 50.7%
Graph B.1b
Source: PMJDY website
As regards the analysis of Regional (Rural-Urban) spread, Out of total accounts of 24.10 crore
under the scheme as on 31st August, 2016, Rural accounts are 14.79 crore (61.4%), and 9.31
crore are Urban accounts (38.6%); and
• Of the total 14.79 crore Rural accounts: 10.72 crore (72.5%) are opened by PSBs, 3.55
crore (24%) by RRBs, and 0.52 crore (3.5%) by private sector banks.
• Of the total 9.31 crore Urban accounts: 8.4 crore accounts (90.2%) by PSBs, 0.58 crore
(6.2%) by RRBs, and 0.33 crore (3.5%) by private sector banks.
• This shows that each category of banks has larger share of rural accounts in their
respective number of accounts under the scheme.

33
Features-wise Analysis:
As regards the RuPay cards, of the total number of accounts of 24.10 crore under the scheme as
on 31st August, 2016, 19.00 crore nos. accounts (78.8%) were issued RuPay cards [PSBs were
leading with the highest number of 15.33 crore RuPay card accounts (80.7% of total RuPay
accounts)], followed by RRBs with 2.88 crore RuPay card accounts (15.2%), and Private Banks
were trailing with the lowest 0.79 crore RuPay card accounts (4.2%).
As far as the Aadhaar seeded accounts are concerned, a total number of 12.23 crore accounts
were Linked to the Aadhaar card. Of these, PSBs had the largest numbers of 10.16 crore (83.1%
of total Aadhaar seeded accounts), while the RRBs had the next but distant lower number of
1.72 crore (14.1%), and the private banks had the lowest and miniscule number of 0.35 crore
(2.0%) Aadhaar linked accounts.
With regard to the total 5.87 crore accounts with Zero balance, the highest number of 4.69 crore
(79.9%) were with PSBs, and next significant lower number of 0.87 crore (14.8%) with RRBs,
and the lowest number of 0.31 crore (5.3%) accounts with the private banks.
Out of the total 18.23 crore number of accounts with some positive balance of deposit, in terms
of numbers, the PSBs topped the list with 14.43 crore number of accounts (79.2%), followed
by the RRBs with 3.26 number accounts (17.9%), and the private sector banks being at the
bottom with 0.54 crore number of accounts (3.0%).
And the aggregate amount of deposits with all banks under the scheme quadrupled to Rs.42,094
crore (300.9% growth) as on 31st August, 2016. Of this, the largest amount of deposits of
Rs33,379 crore (79.3% of total deposits) were with PSBs, and the RRBs coming next with
sizeable amount of Rs7199 crore deposits (17.1%), and private sector being the lowest in
amount of Rs1517 crore (3.6%).
4.2.5 Analysis of Percentage Composition of Share of Each Category of Banks in Different
Types of Accounts as on 31st August, 2016
The Table B.2 below highlights the percentage compositions of total accounts within each type
of accounts.

34
Table B.2: Percentage Composition of Share of Each Bank Category in Different Types of Accounts as on 31.08.2016 Category of Banks
Rural - Urban Spread
Total Accounts (Nos
in Crore)
Profile of Accounts Deposit Balance
In Account
s (Rs. In Crore)
Rural Accounts (Nos.
in Crore)
Urban Account
s (Nos. in Crore)
RuPay Debit Card (Nos
in Crore)
Aadhaar Seeded
Accounts
(Nos. in Crore)
Accounts With Zero
Balance (Nos. in Crore)
Accounts With
Deposit (Nos. in Crore)
PSBs 72.5% 90.2% 79.3% 80.7% 83.1% 79.9% 79.2% 79.3%
RRBs 24.0% 6.2% 17.1% 15.2% 14.1% 14.8% 17.9% 17.1%
Pvt. Banks
3.5% 3.5% 3.5% 4.2% 2.9% 5.3% 3.0% 3.6%
G. Total 100.0% 100.0% 100.0% 100.0%
100.0% 100.0% 100.0% 100.0%
Source: PMJDY website
The Overall Position:
The following Table B.2.a, and Graph B.2.a provide the overall picture of the total accounts
opened by each category of banks both in numbers as well as in percentage of the total number
of accounts under PMJDY as on 31st August, 2016.
Table B.2.a
PMJDY A/cs: Composition – Banks Category-wise (31.08.16)
Nos. Crore. % Share
PSU Banks 19.12 79.3%
RRB's 4.13 17.1%
Private Banks 0.85 3.5%
Grand Total 24.1 100.0%

35
Graph B.2.a
Source: PMJDY website
As on 31st August, 2016, of the total number of accounts opened, PSBs continue to dominate
(with 79.3% share); RRBs still remaining the second distant players (with 17.1% share) and
the private sector banks are at the bottom (with just 3.5% share). This is in line with the earlier
basic major trend seen in the accounts under PMJDY as on 31st January, 2015.
Regional (Rural-Urban) Spread Analysis as on 31st August, 2016:
As on 31st August, 2016, the overall Geographical or Regional (Rural-Urban) spread is
explained in the Table B.2.b and Graph B.2.b, as under:
Out of the total 24.10 accounts under PMJDY, the Rural accounts were 14.79 crore in number
(61.4% of total), and Urban accounts were 9.31 crore (38.6%).

36
Table B.2.b
PMJDY A/cs: Rural-Urban Geographical Composition (31.08.16)
Nos. Crore % Share
Rural A/cs 14.79 61.4%
Urban A/cs 9.31 38.6%
Total 24.10 100.0%
Graph B.2.b
Source: PMJDY website
On analyzing further, it is seen that: the PSBs are on the forefront with the highest percentage
share and with major lead, followed by the RRBs who come next, and the private banks having
the lowest percentage shares of the Rural accounts as well as the Urban accounts:
• Rural accounts: PSBs 72.5%, RRBs 24%, and Private banks 3.5%
• Urban accounts: PSBs 90.2%, RRBs 6.2%, and Private banks 3.5%
A further analysis of the rural and urban account split by each category of bank, as noticed in
the Table 4.5.2 reveals that even though PSBs command the highest shares (72.5% in rural
accounts, 90.2% urban accounts), RRBs’ accounts expectedly have significantly better relative
share in rural accounts (24%) than the urban accounts (6.2%); and private sector banks share
in urban accounts (3.5%) remains the same as in the rural accounts (3.5%).

37
Features-wise Analysis of Accounts as on 31st August, 2016
As on 31st August, 2016 also in terms of the percentage of the total accounts of the respective
kind (i.e. RuPay card accounts, Zero balance accounts, and Aadhaar seeded accounts) follow
more or less the similar trend, as earlier (i.e. PSBs having dominant share, followed by the
RRBs being distant number two with much smaller share, and the Private banks having the
smallest and miniscule percentage share), as specified below:
• Rural RuPay cards: 80.70% PSBs, 15.2% RRBs, 4.2% private sector banks.
• Aadhaar seeded accounts: 83.1% PSBs, 14.1% RRBs, 2.9% private sector banks.
• Zero balance accounts: 79.9% PSBs, 14.8% RRBs, 5.3% private sector banks.
The deposit balance composition also being on similar pattern:
• 79.3% by PSBs, 17.1% by RRBs, 3.6% by private sector banks.
4.2.6 Analysis of Percentage Composition of Different Types of Accounts within Each
Category of Banks as on 31st August, 2016
The table B.3 below presents the overall position in terms of percentage shares of different
types of accounts within the total accounts opened by each category of banks (i.e. PSBs, RRBs,
and Private banks).

38
Table B.3: Composition of Different Types of Accounts under Each Category of Banks as on 31.08.16
Category of Banks
Rural - Urban Spread
Total Accounts
(Nos in Crore)
Profile of Accounts Deposit Balance In A/cs (Rs. in Crore)
Rural Accounts (Nos. in Crore)
Urban Accounts (Nos. in Crore)
RuPay Debit Card
(Nos in Crore)
Aadhaar Seeded
Accounts (Nos. in Crore)
Accounts With Zero
Balance (Nos. in Crore)
Accounts With
Deposit (Nos. in Crore)
PSBs 56.1% 43.9% 100.0% 80.2% 53.1% 24.5% 75.5% 75.5%
RRBs 86.0% 14.0% 100.0% 69.7% 41.6% 21.0% 79.0% 79.0%
Pvt. Banks 61.2% 38.8% 100.0% 92.9% 41.2% 36.5% 63.5% 63.5%
G. Total 61.4% 38.6% 100.0% 78.8% 50.7% 24.4% 75.6% 75.6%
Source: PMJDY website
Regional (Rural-Urban) Spread as on 31st August, 2016:
As on 31st August, 2016, the overall Geographical or Regional (Rural-Urban) spread is
explained in the Table B.3.a. and Graph B.3.a, as under:
Out of total 24.10 accounts opened under PMJDY by all banks, the Rural accounts were 14.79
crore in number (61.4% of total), and Urban accounts were 9.31 crore (38.6%).
Table B.3.a
PMJDY A/cs: Rural-Urban Geographical Composition (31.08.16)
Nos. crore % Share
Rural A/cs 14.79 61.4%
Urban A/cs 9.31 38.6%
Total 24.10 100.0%

39
Graph B.3.a
Source: PMJDY website
Within the above broad, rural-urban split, a further analysis reveals that:
• The RRBs lead with the highest percentage 86% of their accounts being in rural sector
(14% urban)
• Surprisingly the private sector banks come second with 61.2% of their accounts in the
rural sector (38.8% urban).
• The PSBs being the last with 56.1% of accounts in rural segment (43.9% urban).
Comparatively, the rural-urban spread during this period in percentage terms also broadly
remains on similar lines as earlier, with marginal fluctuations in percentages.
Features-wise Analysis of Accounts as on 31st August, 2016:
The following Table B.3.b and Graph B.3.b portrays the overall position of Accounts with
different features opened by all banks put together.
Table B.3.b
PMJDY A/cs Composition -Feature-wise (31.08.16)
% Shares
RuPay Card A/Cs 78.8%
Zero Balance A/Cs 24.4%
Aadhaar Seeded A/Cs 50.7%
Graph B.3.b

40
At the overall level, of the total 24.10 crore accounts among all categories of banks put together,
in the percentage terms, a maximum of 78.8% accounts (19 crore) were with the RuPay cards,
followed by 50.7% accounts (12.23 crore) being the Aadhaar linked accounts, and 24.4%
accounts (5.87 crore) being with Zero balance, and 75.6% accounts (18.23 crore) having some
deposit balance amount.
On the next level of analysis of the total 24.10 crore accounts with different features opened
by each category of banks (i.e. PSBs, RRBs, and Private banks) under the scheme as on 31st
August, 2016, the following points emerge:
• RuPay Cards: Of the total 19 crore RuPay cards accounts, the Private sector banks
account for the maximum percentage of 92.9%, followed by PSU Banks with
80.2%, and RRB’s being the lowest with 69.7% of their total accounts under the
scheme opened with RuPay cards.
• Aadhaar seeded accounts: Of the total 12.23 crore Aadhaar card linked accounts,
PSBs had the highest percentage (53.1%) of their total accounts being Aadhaar-
linked, followed by RRBs with 41.6% of their accounts being Aadhaar seeded, and
Private sector banks having the lowest percentage (41.2%) of their accounts linked
to Aadhaar card. In fact, RRBs and Private banks come quite close to PSBs, with
Source: PMJDY website

41
41.6% and 41.2% shares respectively of their accounts as Aadhaar seeded (though
in absolute terms, PSUs lead hugely with 10.16 crore Aadhaar seeded accounts,
followed by RRB’s 1.72 crore accounts, and Private Banks with 0.35 crore
accounts).
• Zero Balance accounts: In total 5.87 crore accounts with Zero balance, Private sector
banks have the maximum percentage (36.5%) of their total accounts being with Zero
balance, followed by PSBs (24.5%), and RRB’s (21%)
• Deposit Accounts: However, out of the total 18.23 crore number of accounts with
some positive balance of deposit, the private sector banks have the highest
percentage (42.8%) of their total accounts under the schemes having some balance;
while PSBs came next with lower percentage (33.4%) and RRBs with the least but
a close figure of 26.9%.
An important observation on the position of these accounts under the scheme is the sizeable
quantum of deposit balances aggregating to Rs.42,094 crore [Rs33,379 crore (79.3%) with
PSBs, Rs7,199 crore (17.1%) with RRBs, and Rs1,517 crore (3.6%) with private sector banks].
4.2.7 Analysis of Percentage Growth in Accounts under the Scheme as on 31st August,
2016 vs. 31st January, 2015
The Table C.1 below shows the overall growth matrix, presenting percentage growth in each
type of accounts opened under the PMJDY by each category of banks.
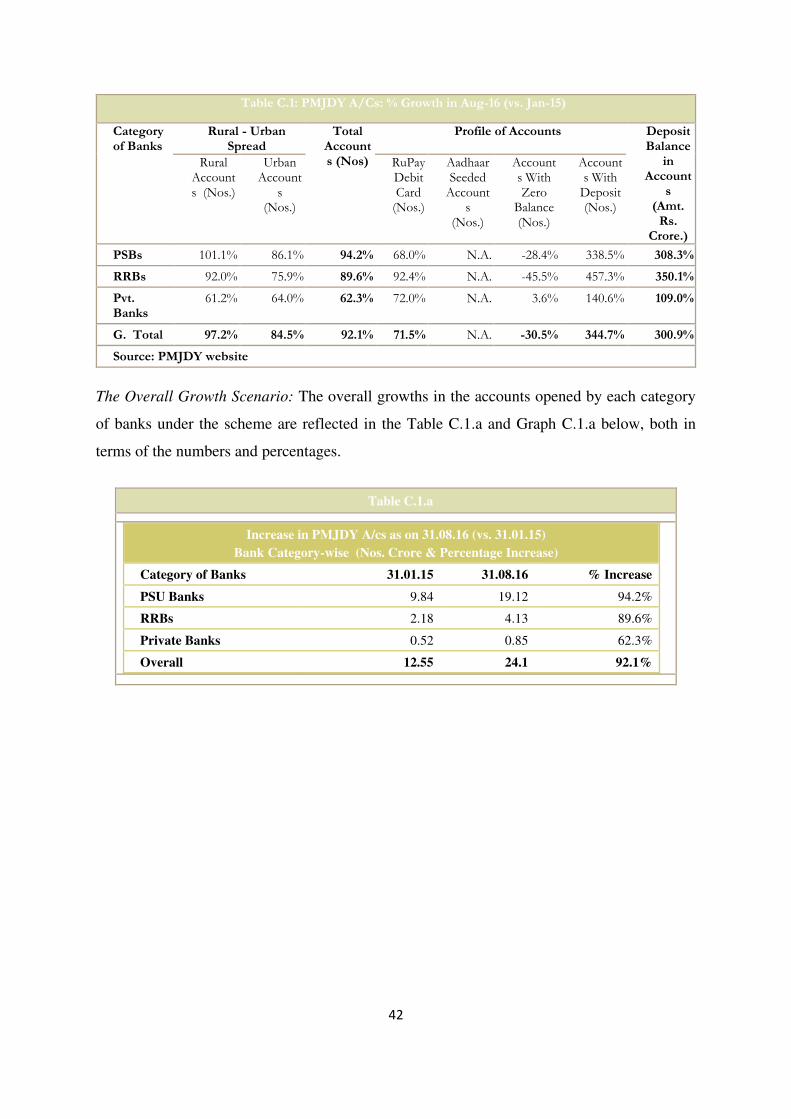
42
Table C.1: PMJDY A/Cs: % Growth in Aug-16 (vs. Jan-15)
Category of Banks
Rural - Urban Spread
Total Accounts (Nos)
Profile of Accounts Deposit Balance
in Account
s (Amt.
Rs. Crore.)
Rural Accounts (Nos.)
Urban Account
s (Nos.)
RuPay Debit Card
(Nos.)
Aadhaar Seeded
Accounts
(Nos.)
Accounts With Zero
Balance (Nos.)
Accounts With
Deposit (Nos.)
PSBs 101.1% 86.1% 94.2% 68.0% N.A. -28.4% 338.5% 308.3%
RRBs 92.0% 75.9% 89.6% 92.4% N.A. -45.5% 457.3% 350.1%
Pvt. Banks
61.2% 64.0% 62.3% 72.0% N.A. 3.6% 140.6% 109.0%
G. Total 97.2% 84.5% 92.1% 71.5% N.A. -30.5% 344.7% 300.9%
Source: PMJDY website
The Overall Growth Scenario: The overall growths in the accounts opened by each category
of banks under the scheme are reflected in the Table C.1.a and Graph C.1.a below, both in
terms of the numbers and percentages.
Table C.1.a
Increase in PMJDY A/cs as on 31.08.16 (vs. 31.01.15)
Bank Category-wise (Nos. Crore & Percentage Increase)
Category of Banks 31.01.15 31.08.16 % Increase
PSU Banks 9.84 19.12 94.2%
RRBs 2.18 4.13 89.6%
Private Banks 0.52 0.85 62.3%
Overall 12.55 24.1 92.1%

43
Graph C.1.a
Source: PMJDY website
Analyzing the growth both in the numbers and percentage terms, we find that the aggregate
number of all accounts under the scheme nearly doubled to 24.10 crore on 31st August, 2016
from 12.55 crore on 31st January, 2015 (with an increase of 92.1%). And within this overall
growth, accounts with PSBs grew to 94.2% to 19.12 crore as on 31st August, 2016, from earlier
9.84 crore; RRBs rose by 89.6% to 4.13 crore, from 2.18 crore; and Private banks by 62.3% to
0.85 crore, from 0.52 crore.
The Table C.1.b and Graph C.1.b presented below show only the percentage increases in the
total accounts under the scheme as on 31st August, 2016, compared to the position earlier as on
31st January, 2015.
Table C.1.b
PMJDY A/cs: Percentage Increase – Aug’16 (vs. Jan’15) % Growth
PSU Banks 94.2%
RRB's 89.6%
Private Banks 62.3%
Overall 92.1%
Graph C.1.b

44
Source: PMJDY website
As would be seen from the Tables C.1.a and C.1.b and Graphs C.1.a and C.1.b above, the
number aggregate of total accounts almost doubled to 24.10 crore on 31st August, 2016 from
12.55 crore earlier on 31st January, 2015 (with a massive increase of 92.1%); and within this
overall growth,
• PSBs show the highest jump 94.2% (a steep 101% increase in rural accounts and 86.1%
in urban accounts).
• RRBs also show a high rise of 89.6% (92.0% in rural accounts and 75.9% in urban
accounts).
• Private sector banks also record a sizeable growth of 62.3% (61.2% in rural accounts
and 64% in urban accounts).
This analysis shows that all constituents have recorded substantial percentage increases in the
accounts under the scheme: PSBs 94.2%, RRBs 89.6%, and Private banks 62.3% increase; and
with these, the PSBs and RRBs have strengthened their respective positions further.

45
Growth in Rural & Urban Accounts:
Table C.1.c
PMJDY A/cs (Rural-Urban) Aug’16 vs. Jan’15 (Nos. Crore; and % Increase)
31.01.15 31.08.16 % Increase
Rural A/cs 7.50 14.79 97.2%
Urban A/cs 5.05 9.31 84.5%
Total A/cs 12.55 24.10 92.1%
Graph C.1.c
Source: PMJDY website
Both the Rural accounts and the Urban accounts have grown handsomely as on 31st August,
2016 in comparison to the position as on 31st January, 2016 - with Rural accounts increasing
by 97.2% to 14.79 crore numbers, from 7.50 crore numbers; and the Urban accounts rising by
84.5% to 9.31 crore, as evident from the Table 4.7.4a, and Graph 4.7.4b below:
Purely in percentage terms, the aggregate number of all accounts grew by 92.1%, backed by
97.2% increase in Rural accounts and 84.5% rise in Urban accounts, as shown in the Table
C.1.d and Graph C.1.d, below:

46
Table C.1.d
PMJDY A/cs: Percentage Growth Aug-16 (vs. Jan-15)
Regional Spread % Growth
Rural A/cs 97.2%
Urban A/cs 84.5%
Overall A/cs 92.1%
Graph C.1.d
Source: PMJDY website
Features-wise Growth:
The Table 4.7.5a and Graph 4.7.5b below explains the position of different types of accounts
with respective features (RuPay card, Zero balance, Deposits, Aadhaar-linked) on 31st August,
2016 vs. 31st January, 2015, along with percent increases.

47
Table C.1.e
Growth in PMJDY A/cs - Feature-wise (Aug’16 vs. Jan’15)
31.01.15 31.08.16 % Increase
RuPay Card A/cs 11.08 19.00 71.5%
Zero Bal. A/cs 8.45 5.87 -30.5%
Deposit A/cs 4.10 18.23 344.7%
Aadhaar Seeded N.A. 12.23 N.A.
Total A/cs 12.55 24.10 92.1%
Graph C.1.e
Source: PMJDY website
As noticed from the comparative position of number of accounts and percentage of growth on
31st August, 2016 (over 31st January, 2015) as shown in the above Table C.1.e and Graph C.i.e,
the overall number of accounts of different types of features, grew by 92.1% to 24.10 crore
numbers, from 12.55 crore numbers; the accounts with different features showed different
pattern – some exhibiting growth and other showing drop. The RuPay card accounts increased
significantly by 71.5% to 19 crore numbers, from 11.08 crore numbers; and Aadhaar-linked
accounts numbered 12.23 crore (comparative past data of Aadhaar accounts as on 31st January,
2016 not being available, the percentage growth is not shown, but is considered as Nil for the
graphical presentation).

48
The Table C.1.f and accompanying Graph C.1.f below demonstrate just the percentage change
in the accounts with different features.
Table C.1.f
PMJDY A/cs of Different Types: Aug-16 (vs. Jan-15)
Feature-wise A/cs % Growth
RuPay Card A/cs 71.5%
Zero Balance A/cs -30.5%
Deposit A/cs 344.7%
Overall A/cs 92.1%
Graph C.1.f
Source: PMJDY website
As reflected in the above table and graph, within the overall rise of 92.1% in all accounts,
RuPay card accounts grew by a decent 71.5%, Zero balance accounts dropped significantly by
30.5%, whereas the number of accounts with some Deposit balance showed a whopping
increase of 344.7%.
RuPay Cards Accounts: While the total RuPay cards significantly rose to an overall 71.5%
during this period; within this, in terms of the percentage growth, surprisingly RRBs topped
with the most robust growth of 92.4% in RuPay cards issued, followed next by the Private
banks that issued 72% more RuPay cards, and PSBs being the lowest in percentage terms with
68% higher number of RuPay cards issued.
Changes in Zero Balance Accounts and Deposit Accounts:
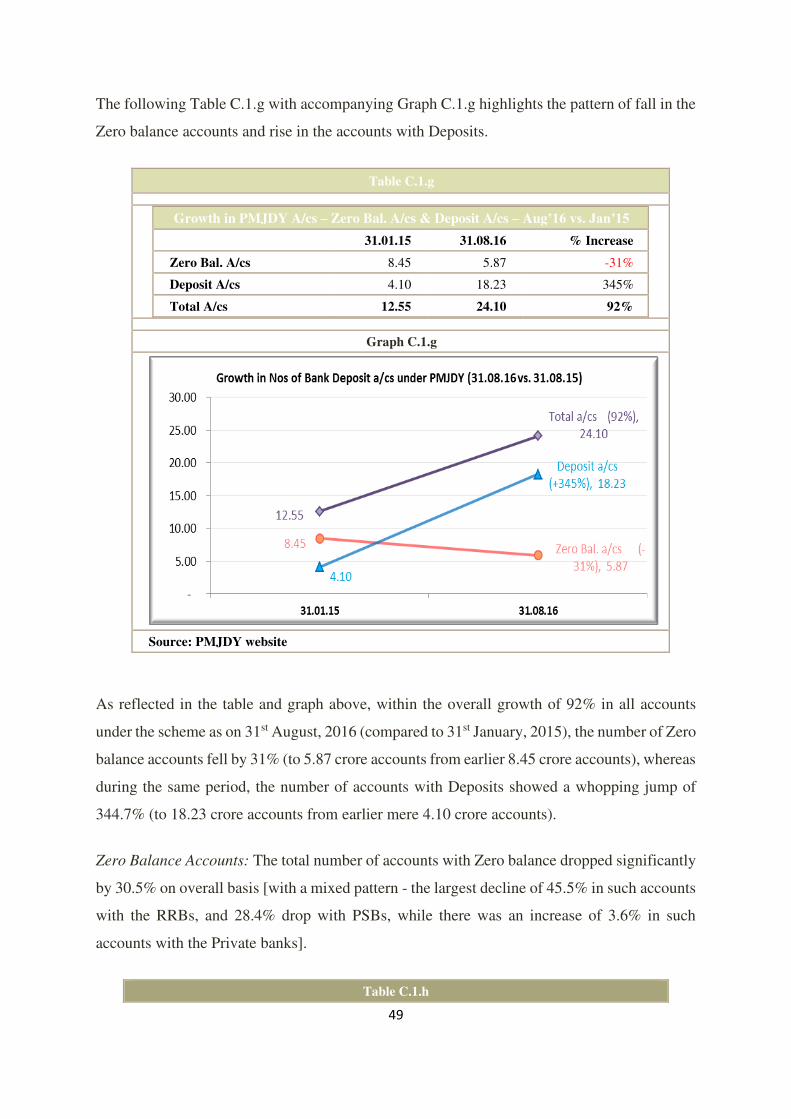
49
The following Table C.1.g with accompanying Graph C.1.g highlights the pattern of fall in the
Zero balance accounts and rise in the accounts with Deposits.
Table C.1.g
Growth in PMJDY A/cs – Zero Bal. A/cs & Deposit A/cs – Aug’16 vs. Jan’15
31.01.15 31.08.16 % Increase
Zero Bal. A/cs 8.45 5.87 -31%
Deposit A/cs 4.10 18.23 345%
Total A/cs 12.55 24.10 92%
Graph C.1.g
Source: PMJDY website
As reflected in the table and graph above, within the overall growth of 92% in all accounts
under the scheme as on 31st August, 2016 (compared to 31st January, 2015), the number of Zero
balance accounts fell by 31% (to 5.87 crore accounts from earlier 8.45 crore accounts), whereas
during the same period, the number of accounts with Deposits showed a whopping jump of
344.7% (to 18.23 crore accounts from earlier mere 4.10 crore accounts).
Zero Balance Accounts: The total number of accounts with Zero balance dropped significantly
by 30.5% on overall basis [with a mixed pattern - the largest decline of 45.5% in such accounts
with the RRBs, and 28.4% drop with PSBs, while there was an increase of 3.6% in such
accounts with the Private banks].
Table C.1.h

50
PMJDY A/Cs: Rise in Bank Deposit Amt.: 31.08.16 (vs. 31.01.15) (Rs.Crore)
31.01.15 31.08.16 Increase Increase
Banks Category Rs. Crore. Rs. Crore. Rs. Crore. %
Overall 10,500 42,094 31,594 300.9%
Graph C.1.h
Source: PMJDY website
Deposit Accounts:
The total number of accounts with Deposits rose sharply by 344.7% on the whole [While within
this overall rise, RRBs recorded the highest increase of 457.3%, followed by the PSBs with the
next higher growth of 338.5%, and Private bank with the least (but sizeable) growth of 140.6%.
Growth in Bank Deposits under PMJDY:
The following Table C.1.i. and accompanying Graph C.1.i demonstrate the rise in Bank
Deposits under the scheme as on 31st August, 2016 (compared to the earlier period as on 31st
January, 2015).
A startling development noticed in this analysis is that the overall amount of Deposits under
PMJDY jumped by a whopping Rs31,594 Crore (by 300.9%) and quadrupled to Rs42,094 crore
as on 31st August, 2016, from earlier Rs10,500 crore as on 31st January, 2015.
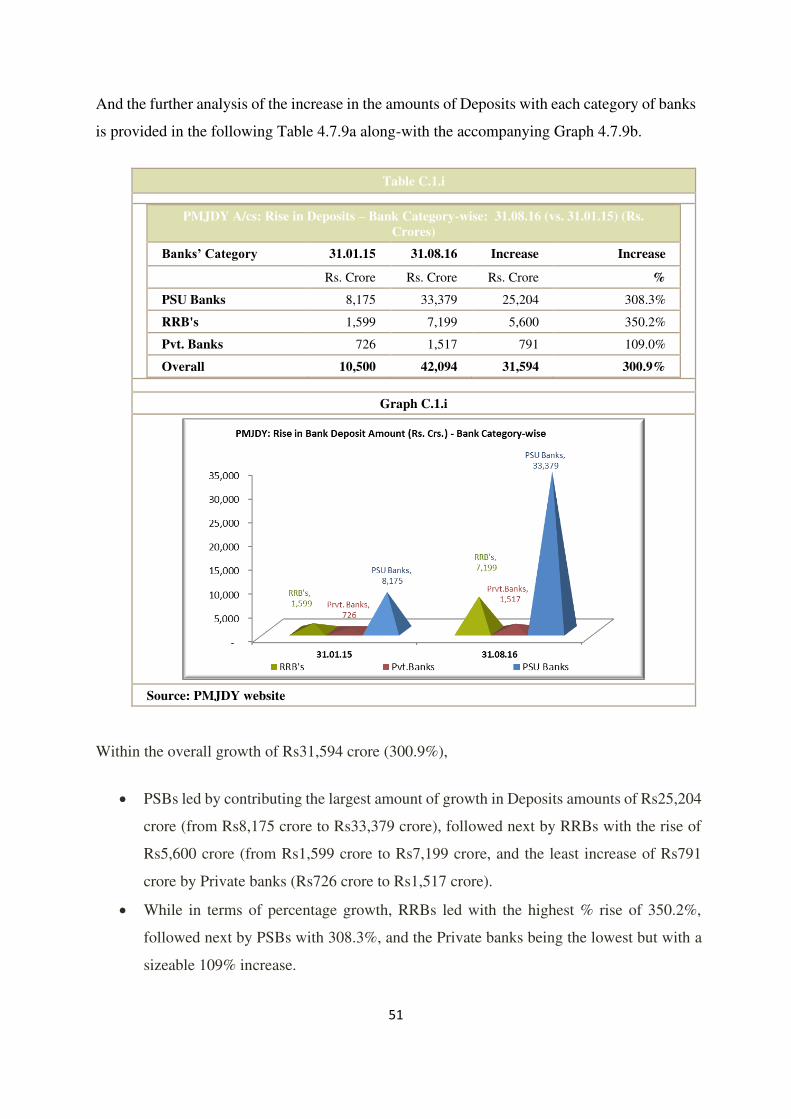
51
And the further analysis of the increase in the amounts of Deposits with each category of banks
is provided in the following Table 4.7.9a along-with the accompanying Graph 4.7.9b.
Table C.1.i
PMJDY A/cs: Rise in Deposits – Bank Category-wise: 31.08.16 (vs. 31.01.15) (Rs.
Crores)
Banks’ Category 31.01.15 31.08.16 Increase Increase
Rs. Crore Rs. Crore Rs. Crore %
PSU Banks 8,175 33,379 25,204 308.3%
RRB's 1,599 7,199 5,600 350.2%
Pvt. Banks 726 1,517 791 109.0%
Overall 10,500 42,094 31,594 300.9%
Graph C.1.i
Source: PMJDY website
Within the overall growth of Rs31,594 crore (300.9%),
• PSBs led by contributing the largest amount of growth in Deposits amounts of Rs25,204
crore (from Rs8,175 crore to Rs33,379 crore), followed next by RRBs with the rise of
Rs5,600 crore (from Rs1,599 crore to Rs7,199 crore, and the least increase of Rs791
crore by Private banks (Rs726 crore to Rs1,517 crore).
• While in terms of percentage growth, RRBs led with the highest % rise of 350.2%,
followed next by PSBs with 308.3%, and the Private banks being the lowest but with a
sizeable 109% increase.

52
This proves that the opening of accounts under PMJDY by all categories of banks made good
business and economic sense for them (which is reflected in the enormous rise in the amounts
of deposits and fall in the number of Zero balance accounts with each of them); while bringing
the unbanked population under the banking net; and serving the social purpose.
4.2.8 Comparative Analysis of Composition of Percentage Share of Each Category of
Banks in Different Types of Accounts as on 31st August, 2016 vs. 31st January, 2015
The following facts emerge in comparison of two periods i.e. 31st August 2016 and 31st
January, 2015 from a comparative analysis of percentage share of each type of accounts in
different categories of banks.
1. RuPay Cards: The share of RuPay cards of RRBs (in the total) marginally improves to
15.2% (from the earlier 13.5%) but there is a dip in the PSBs share to 80.7% (from 82.3%).
2. Zero Balance Accounts: In the Zero balance accounts the share of PSBs improves slightly
to 79.9% (from the earlier 77.6%) and of private sector banks improves to 5.3% (from
3.5%) while the share of RRBs drops to 14.8% (from 18.9%).
3. Others: Other compositions very marginally fluctuate in narrow bands.
4.2.9 Comparative Analysis of Percentage Composition of Different Types of Accounts
within Each Category of Banks) as on 31st August, 2016 vs. 31st January, 2015:
RuPay Card Accounts: Compared to the earlier period as on 31st January, 2015 composition of
the RuPay cards of the respective banks (as a percentage of the total accounts of the respective
category of banks under the scheme), PSBs were the highest earlier (with 92.7%), followed by
the private sector banks (87.7%) and RRBs the lowest (68.7%) of their respective total accounts
with RuPay cards, as on 31st January, 2015. However, on 31st August, 2016, the pecking order
has changed with now private sector banks leading with (92.9% of their accounts under the
scheme being RuPay cards); while the PSBs have now being relegates to the second position
in the percentage terms (80.2% of their accounts under the scheme being RuPay cards); while

53
the RRBs remain the third (with 69.7% of their accounts under the scheme being with RuPay
cards, having changed just marginally from earlier 68.7%).
Zero Balance Accounts: As on 31st August, 2016, in comparison with 31st January, 2015, the
position of accounts with Zero balance (in terms of the percentage of total accounts with the
respective category of banks), the analysis shows the fall in numbers of accounts with the Zero
balance accounts (or conversely the rise in the accounts with positive balance or deposits):
o The steepest fall of 52.1% (from 73.1% to 21%) with RRB’s;
o Followed by drop of 42.1% (from 66.6% to 24.50%) with the PSBs; and
o The least decrease of 20.7% (57.2% to 36.5%) with Private Banks.
4.3 Findings of the Sample Survey
An analysis of the sample survey of PSBs conducted in Thane city to examine the impact of
PMJDY on financial inclusion is presented in this section. The sample survey data shows that
20 out of 116 branches of PSBs surveyed opened 10921 accounts and mobilised savings of
Rs.1,07,71721. As public sector banks, the targets of PMJDY thrust upon the banks have to
be achieved. In spite of the fact that the government has not allocated any financial or physical
resources to the PSBs to achieve the financial inclusion targets, they are required to
periodically report to the government the progress made in opening accounts as well as
provision of other products of PMJDY to the poor such as life and health insurance, micro
pension scheme Atal Pension Yojana (APY) and micro loans under Mudra scheme etc.
4.3.1 Bankers' Opinion on Financial Inclusion Model for PMJDY
The survey data about bankers’ opinion regarding an appropriate financial inclusion model
that can assist them in achieving 100% financial inclusion is presented in table 4.1SA below.
Around 58% bankers were of the opinion that BC (Bank Mitr) model is most suitable in
reaching out to the financially excluded population while 16.67% believed that BCs as well as
Kirana stores can serve unbanked population for opening their accounts. Only 8.33% bankers
opined that mobile banking, NGOs and sensitising school children to indirectly reach out to
their parents by organising camps in their schools can be channels for deepening financial
inclusion.

54

55
Table D.1: Bankers’ Opinion about Financial Inclusion Model
Opinion on FI Model %
BC 25%
BCs and Kirana Stores 15%
Mobile Banking 5%
NGOs 5%
Sensitising parents through school/college children 45%
Can’t say 5%
Total 100%
Graph D.1
Source: Sample Survey
4.3.2 Active Accounts opened under PMJDY
The target driven PSBs opened accounts under PMJDY by organising camps in rural and urban
areas. But many of these accounts are lying dormant after opening. The following table 4.2Sa
and graph 4.2Sb is presented below illustrates it.

56
Table E.1: Active Accounts (In Percent)
Bank Name Active Accounts (In %)
IDBI Bank, Pride Park, GB Road 98.84%
Indian Overseas Bank, Naupada 32%
SBI, Hiranandani Estate, GB Road 25%
Other Banks Data not available
Graph E.1
Source: Sample Survey
4.3.3 Percentage Share of BPL and APL Account Holders
The sample survey examines the share of PMJDY accounts opened by the banks from two
different economic categories of financially excluded population i.e. BPL and APL
households. The survey data reveals that 75.20% account holders are from BPL households
and 24.80 account holders are from APL households. The details are presented below in Table
4.3Sa and Figure 4.3Sb. This shows that PMJDY is a very good channel to transfer doles for
the poor directly to the bank accounts of the poor without any pilferage.

57
Table F.1: Share of BPL/APL Accounts (In percent)
BPL / APL Percentage
BPL APL
75.20% 24.80%
Graph F.1
Source: Sample Survey
4.3.4 Number of Insurance Claims
The survey data shows that only five insurance claims have been received by the PSBs so far
since the inception of the scheme. There are 469 subscribers for Atal Pension Yojana (APY)
insurance scheme with the PSBs. This shows that there is need to popularise the benefits of
this scheme to scale up the number of its subscribers. The IDBI bank branch in Pride park
complex on Ghodbunder Road received a contribution of Rs.155420 towards APY. Other
banks did not provide data on subscribers of APY. It may be due to the fact that they have not
campaigned for this scheme appropriately and the account holders are not aware of the benefits
of this scheme.

58
4.3.5 Incremental Cost to Banks and Impact on Profitability
To examine whether PMJDY is adding further to the already stressed assets of PSBs, the
survey data seeks information about the incremental cost banks have to incur for
implementation of this scheme. However, the respondent banks report that there is not much
effect of PMJDY on the profitability of banks. The banks have to incur additional costs of
organising camps, print brochures and other campaign material and pass books for the account
holders. Yet the survey data shows that banks are ready to incur these costs as they believe
that it is their social responsibility to bring the unbanked population into mainstream banking
system. So far the PSB banks surveyed for this study have not yet provided overdraft facility
of Rs.5000 to account holders under PMJDY scheme. The bank managers are of the opinion
that once the overdraft facility is started, it may make a dent into their profitability. However,
they expressed the need for additional staff for handling the additional workload related to this
scheme.
The overall opinion of the bankers about this scheme is that it is a good scheme to scale up
financial inclusion in India. The Bankers believe that it makes good economic sense also as
small savings in these accounts have increased over a period of time. As is already shown
above there is around 300% increase in deposit accounts and a fall in zero balance account
over a period of one year of implementation of this scheme.

59
Table G.1: Bankers’ Opinion about Impact of PMJDY on Profitability of PSBs
Incremental Cost to Banks Response (%)
Yes 95%
Can't Say 5%
Graph G.1
Source: Survey Data
4.3.6 Bankers’ Opinion about PMJDY
Majority of the banks surveyed (90%) are of the opinion that this scheme is a good scheme of
financial inclusion. Only few bankers (10%) opine that this scheme of financial inclusion is
not welcomed by banks as the government is not making any provision for additional physical
and financial infrastructure. Banks are already burdened with routine work and the existing
manpower is unable to bear further burden of PMJDY workload. This is presented below in
table 4.6Sa and graph 4.6Sb.

60
Table H.1: Bankers’ Opinion about PMJDY
Opinion about scheme Response (%)
Good Scheme of Financial Inclusion 90%
Not Good 10%
Graph H.1
Source: Sample Survey
Regarding the impact of PMJDY on their profitability, majority of bankers believe that there
is no significant impact of this scheme on Banks’ profitability. There is one-time increase in
costs which is incurred on publicising this scheme such as cost of banners, brochures,
organising camps in schools, colleges, societies and localities and printing new passbooks etc.
However, they believe that the scheme has not been publicised in a right manner by the
government as people perceive that through this scheme they will receive Rs.5000 from the
bank which the government has contributed for PMJDY.

61
4.3.7 Difficulties Faced by Bankers in Achieving PMJDY Targets
In spite of various schemes of financial inclusion introduced by the governments in power
over a period of time a large proportion of the population still remains out of the mainstream
financial system. This is why PMJDY has been very aggressive in thrusting time bound targets
upon the banks in the financial system which they are required to achieve. Due to various
constraints the banks are facing a number of stumbling blocks which have been presented
below in the table and graph.
Table I.1: Difficulties Faced by Bankers in Achieving PMJDY Targets
Difficulties faced by Banks Response (%)
No 4%
Inoperative accounts 1%
Time consuming process 10%
Lack of awareness 2%
Over worked staff 2%
No specific difficulties 1%
Total 20%
Graph I.1
Source: Sample Survey
Many banks’ branches have done good field work to popularise this scheme and have opened
a good number of PMJDY accounts. They have readily shared data regarding these accounts.
It has been observed that the bank branches that have not performed well are not ready to share
details of number of accounts opened or people who have registered themselves for insurance
cover under this scheme. As public sector employees, branch managers of banks do not want
to be on record to voice out difficulties faced by them for implementation of this scheme. Main

62
difficulties are that the workload of existing employees has increased as the government has
not increased manpower to shoulder additional workload of reaching out to the financially
excluded people and opening their accounts. Some of the bankers are of the opinion that
Payment Banks and Bank correspondents can be involved to achieve financial inclusion targets
under PMJDY. But there are issues regarding remuneration to the BCs, infrastructural and
technological problems.
The PMJDY is including more schemes in phases for increasing self-employment
opportunities along with various poverty alleviation programmes. The recently launched
‘Mudra’ scheme aims at providing financial assistance to individuals to start micro enterprises.
Banks have to provide collateral free loans to individuals under this scheme which the banks
are afraid would lead to bad loans in future. Public sector banks are already having a very large
amount of stress assets and ‘Mudra’ scheme may further add to that. However, this study has
not included ‘Mudra’ scheme as sufficient data is not available for analysis.
It has been noticed that most of the accounts opened under the PMJDY are inoperative. These
accounts have been opened using e-KYC and the account holders have been informed that
after they obtain valid documents their accounts will be linked to Aadhaar card. But due to
non-submission of KYC documents, many of these accounts have not yet been Aadhaar seeded
due to which the direct benefit transfer (DBT) of subsidies by the government cannot be linked
to these accounts, thus defeating the efforts of the government for scaling up financial
inclusion.
4.3.8 Life Covers Offered under PMJDY
In India both insurance density (ratio of premium to total population) and insurance
penetration (percentage of insurance premium underwritten in a given year to Gross Domestic
Product) are very low as compared to many developing economies. The poor are the most
vulnerable to sickness and accident hazards due to their living conditions but they hardly have
any money to buy insurance cover. There is very little awareness among the poor about safety
nets available to them at very low price to protect themselves against catastrophic and health
hazards such as chronic sickness or accidental death of a family member. The PMJDY aims at
providing various insurance products at affordable premium to the poor. In spite of the

63
awareness drives organised by the banks through banners and by the central government
through their websites and media the table 4.8Sa and graph 4.8Sb presented below shows very
low subscription to the scheme.
Table J.1: Life Cover Seekers Record with the Banks
Name of Bank Branch Number of Life Cover seekers
Dena Bank, G.B. Road 600
Canara Bank, Stn. Road 400
Allahabad Bank, Naupada 400
Vijaya Bank, Tulsi Dham 301
Indian Overseas Bank 16
Other Banks Data Unavailable
Graph J.1
Source: Sample Survey
4.3.9 Claimants of Accident Cover Offered under PMJDY
There is an in-built accident cover provided to the Rupay card holders to the tune of
Rs.1,00,000. The following table 4.9Sa and graph 4.9Sb shows the claims filed for accidents
under the PMJDY. Since the risk cover sought by the poor under this scheme is very low, the
number of claims are also very less.
Table K.1: Branch wise Claimants of Accident Cover
Accident cover submitted to PSB Number of claimants
Dena Bank, G.B. Road 1
SBI, Hiranandani Estate 1
Canara Bank, Stn. Rd. 1

64
IDBI, Bank, Pride Park Branch 2
None so far 16
Graph K.1
Source: Sample Survey
4.3.10 Subscribers to Pension Scheme ‘Swavalamban’ or APY
In India a vast segment (85%) of the workforce is employed in the unorganised sector. There
has been an increase in the employment opportunities in the unorganised sector post
liberalisation period. The workforce employed in the informal or unorganised sector do not
have any social security such as old age pensions. Poverty and absence of social security
measures in their old age lands them in destitution. Swavalamban scheme is a landmark
initiative of the government of India to provide old age income protection to the
unorganised/informal sector workers. The PMJDY provides a safety net in the form of Atal
Pension Yojana (APY) at a very low premium to the poor who can have a regular flow of
income of a small amount in their old age by contributing a very small amount monthly till the
age of 60 years. There is a significant amount of flexibility regarding the contribution and the
duration up to which they would like to have pension in their old age. The sample survey data
presented in table 4.10Sa and Graph 4.10b shows the progress of this scheme in Thane city.
Table L.1: Subscribers to Pension Scheme APY
Subscribers of APY Nos. of Respondents
SBI, Hiranandani Estate 200
PNB, Naupapda 115

65
Dena Bank, G.B. Rd. 49
IDBI Bank, Pride Park 45
Allahabad, Naupada 28
Vijaya Bank, Tulsi Dham 28
Indian Overseas Bank 2
Union Bank, Stn. Rd. 2
Don’t have data 12
Graph L.1
Source: Survey Data

66
4.3.11 Methodology Adopted for Creating Awareness of PMJDY
To create awareness about PMJDY the PSBs organised camps in schools, Panchayat premises
in villages, displayed banners in regional languages at strategic places such as the bank offices,
market place and the place where camps are organised. The bank staff has been involved in
field work to contact people who did not have a bank account so far due to lack of address
proof and other documents required for opening a bank account.
4.3.12 Impact of PMJDY on Profitability of PSBs
Although the banks have not been able to provide data about whether this scheme has made a
dent into their profits, secondary data obtained from a consulting firm Mckinsey report which
was presented at a recent bankers’ retreat at NIBM, Pune, has been used to examine this issue.
This report reveals that Indian banks made good progress in improving access to banking
services and maintaining stability in the preceding decade from 2004 to 2014. The number of
financially excluded households decreased from 41% to 35%. The ratio of loans to GDP went
up from 0.3% in 2004 to 0.5% in 2014. Net NPAs to loans was also down from 2.9% in 2004
to 2.2% in 2014. But the profitability of banks has declined as the compound annual growth
rate of profits declined from 46% in 2004 to 5% in 2014. The return on equity in this period
halved from 19.8% to 9.6%. The net NPAs-to-loans ratio doubled from 1.1% in 2011 to 2.2%
in 2014 which does not include restructuring of loans that has gone up from 3.5% of all loans
in 2011 to 8% in 2014. To top it all the credit growth rate has been slow which can be due to
high cost.
The survey data shows that 80% of the banks do not feel that their profitability is affected due
to PMJDY. It is true that they have to incur cost on organising awareness camps, spend money
on printing of brochures, banners, pass-books and other display material but they get small
amount of deposits also. Even the secondary data analysed earlier in this chapter shows that
there is surge in the deposits of all category of banks. Only 10% banks believe that their
profitability is affected and 10% can’t say whether this scheme has affected their profitability.
This data has been presented in the following table 4.12Sa and graph 4.12Sb below:
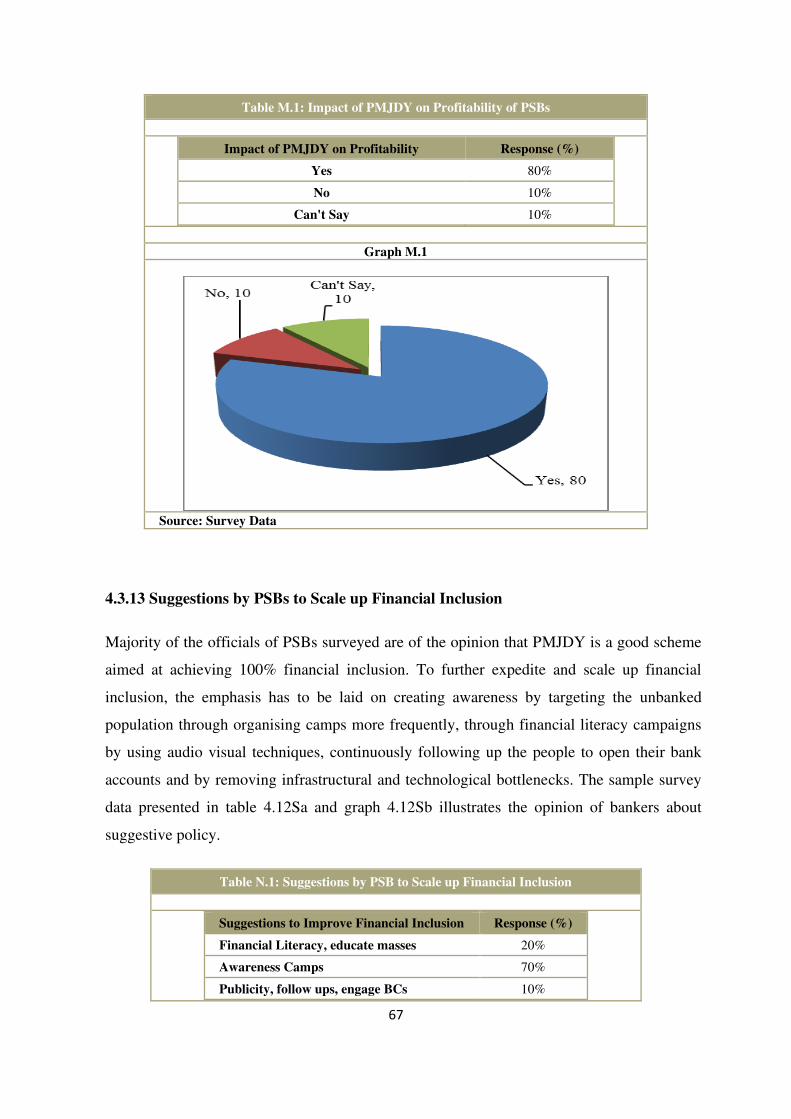
67
Table M.1: Impact of PMJDY on Profitability of PSBs
Impact of PMJDY on Profitability Response (%)
Yes 80%
No 10%
Can't Say 10%
Graph M.1
Source: Survey Data
4.3.13 Suggestions by PSBs to Scale up Financial Inclusion
Majority of the officials of PSBs surveyed are of the opinion that PMJDY is a good scheme
aimed at achieving 100% financial inclusion. To further expedite and scale up financial
inclusion, the emphasis has to be laid on creating awareness by targeting the unbanked
population through organising camps more frequently, through financial literacy campaigns
by using audio visual techniques, continuously following up the people to open their bank
accounts and by removing infrastructural and technological bottlenecks. The sample survey
data presented in table 4.12Sa and graph 4.12Sb illustrates the opinion of bankers about
suggestive policy.
Table N.1: Suggestions by PSB to Scale up Financial Inclusion
Suggestions to Improve Financial Inclusion Response (%)
Financial Literacy, educate masses 20%
Awareness Camps 70%
Publicity, follow ups, engage BCs 10%

68
Graph 4.12Sb
Source: Sample Survey Data
4.3.14 Summary and Conclusion
Most accounts under the scheme were opened in Rural areas (61.4% of total) as on 31st August,
2016.
Large proportion of total accounts being with Rupay cards (78.8%) as on 31st August, 2016.
PSU Banks with predominant share of absolute numbers as well as in terms of percentage
composition of each type of accounts with different features both in rural as well as urban area:
• RRBs come a distant second – being roughly 1/3rd to 1/5th of PSB’s accounts
• Private banks have very small /miniscule share – 1/4th to 1/6th of the RRB’s (and very
small fraction of PSBs)
• PSBs lead even in the Rural accounts in terms of absolute numbers. But in terms of
percentage share of their respective accounts, RRBs have significantly lead followed by
Private Bank, and PSBs being the last.
• The Banks hierarchy order changes dramatically when it comes to the average amount
of deposits per account: with the Private banks being on the top with Rs3237/-, the PSBs
coming next with Rs2733/-, and the RRBs coming the last with Rs2484/- with average
deposits per account as on 31st January, 2015. And the order completely reverses from
the original as on 31st August, 2016, to: the Private Banks being the highest with

69
Rs2811/-, the RRBs in the middle with Rs2313/-, and the PSBs at the bottom with
Rs2207/- average deposit balance per account as on 31st August, 2016.
• Though initially a large proportion nearly 2/3rd (67.3%) accounts (8.45 crore nos.) were
with Zero balance as on 31st January, 2015; however, the Zero balance accounts came
down sharply to 24% (5.87 crore nos.) despite almost doubling of the accounts (from
12.55 crore nos. to 24.10 crore nos.) during this period.
• All categories have benefitted with massive rise of Rs31,595 crores in the amounts of
deposits in the accounts under PMJDY from 31st January, 2015 to 31st August, 2016, as
explained below.
4.3.14.1 Analysis of Growth in Amount of Deposits with Banks under PMJDY
• The average amount of deposit per account went down with all categories of banks as
on 31st August, 2016 compared to 31st January, 2015.
• There seems to be a strong linkage/correlation between the lowest average amount of
deposit and the highest percentage increase in deposit. This shows the strategy of
keeping the lowest deposit amount per account by RRBs has paid off with the highest
percentage increase in their total deposit amounts, as reflected in the analysis in the
following two tables:

70
Table O.1: Analysis of Growth in Amount of Deposits with Banks under PMJDY Category of Banks
Total Deposit Amounts (Rs. Crore) Average Deposit Amount Per Account (Rs.)
31.01.15 31.08.16 Increase in
Deposits Amt.
Percent Increase
in Deposit
s Amount
31.01.15
31.01.16
Increase/ (Decrease)
% Increase./ (Decrease
)
Rs. Crs. Rs. Crs. Rs. Crs. Rs. Rs. Rs.
PSBs 8,175 33,379 25,204 308.3% 2,484 2,313 (171) (6.9%)
RRBs 1,599 7,199 5,600 350.1% 2,733 2,207 (526) (19.2%)
Private Banks 726 1,517 791 109.0% 3,237 2,811 (425) (13.1%)
Overall Total 10,500 42,094 31,595 300.9% 2,561 2,309 (252) (9.8%)
Source: Author’s analysis of secondary data
Table O.2: Linkage in Amount of Lowest Average Deposit With Highest % Growth in Total Deposits
Category of Banks Average Deposit Amount Per Account % Increase in Total Deposit Amounts
(31st Aug'16 vs. 31st Jan'15)
31.01.15 31.08.16 Ranking Order
% Increase Ranking Order
Rs. Rs.
RRBs 2,733 2,207 Lowest 350.1% Highest
PSBs 2,484 2,313 Middle 308.3% Middle
Private Banks 3,237 2,811 Highest 109.0% Lowest
Overall Total 2,561 2,309 300.9%
Source: Author’s analysis of secondary data
This initiative of the Government of India (GOI) for financial inclusion in the form of PMIDY
has apparently been a good success thanks to the enormous push by the Government at the
highest level, with the target based approach adopted for the banks and all concerned, with
accountability fixed, and strict monitoring on regular basis and appropriate actions where
needed. The progress in the last about two years of the launch of the PMJDY is commendable
having brought roughly 19.2% of India’s total population of nearly 125.4 crore [Source:
India’s population 1254 million in 2015 as per www.tradingeconomics.com]. But India still
needs to take big strides to bring the remaining large number of unbanked population in the
banking net.
While the PSBs (with their predominant share of 79.3 %), and the RRBs (with their sizeable
share of 17.1% as on 31st August, 2016) have played a major role; the Private Banks have been
laggards (with a meagre 3.5% of total accounts opened). The government’s implementing
agencies need to devise ways to persuade and incentivize Private Banks to leverage their large

71
network of branches and whole heartedly participate in the scheme; and substantially raise
their share of total accounts under PMJDY.
It is true that the PSBs have done commendable work with their dominant share of 79.3% in
total accounts under the scheme; the contribution of 17.1% accounts by RRBs is no small feat,
and needs to be acknowledged and appreciated, given their limited reach. It is observed that
further expansion of RRBs branches network in the strategic rural pockets of the country with
mass unbanked/under-banked population, would be useful for bringing the
unbanked/underbanked rural people in the banking net.
Yet another point that emerges from this analysis is that it is a good strategy for the banks to
offer Zero balance accounts to the unbanked people (or reduce the amount of average deposit
requirement); as the analysis shows that the RRBs with the lowest average amount of deposit
per account (Rs2207/- as on 31st August, 2016) showed the highest percentage growth rate
(350.01%) in the amounts of their deposits under the scheme compared to 31st January, 2015.
This would eventually help the banks’ business in the long run.
Another related observation that comes out of the above analysis is that, though a large number
of the new account holders under the scheme (8.45 crore as on 31st January, 2015) started with
Zero balance (and some with very low token balance), started depositing money in their
accounts as they became familiar with banking transactions. This is evident from the massive
drop in the number of accounts with Zero balance from 8.45 crore to 5.87 crore.
Even though the aggregate number of accounts under the scheme nearly doubled to 24.10 crore
from 12.55 crore during the comparison period (31st August 2016 vs. 31st January 2015); the
amount of deposit balances leap frogged and quadrupled to Rs.42094 crore (from Rs.10,500
crore) during the same period.
Yet another important fact that emerges from this study is contrary to the common
misconception that the opening of bank accounts under PMJDY is just a burden of charitable
nature for the banks. In fact, the vast amounts of deposits (~ Rs42,094 crore) mobilized by all
categories of banks, makes good business and economic sense for the banks, as they are
expected to benefit by earning an additional annual income upwards of roughly Rs2,950 crore
p.a. on the accounts opened under this scheme with the interest spread of ~7% p.a. (assuming
the weighted average lending interest rate of ~11% p.a. and savings account interest rate of
~3% to 4% p.a.). This large incremental net interest income is expected to offset the cost of

72
servicing the PMJDY accounts. And the cost of servicing are expected to get consistently
lower and lower with the application of continuously improving banking technology.
Though it may sound too simplistic, as it may be argued that banks are expected to maintain
low (or no interest) bearing reserves with the Reserve Bank of India (RBI); and also they have
priority sector lending obligations, with very low interest rates. However, applying the
marginal cost principle, the author would like to counter-argue that on such deposits (which
are expected to keep increasing in future, with the rising income levels and improvement in
the banking habits of the account holders) the net interest income would be expected to rise;
while the cost of servicing the accounts would tend to get lower and lower with the new
banking technology. Also in the course of time, these account holders would start using other
banking services (e.g. funds remittances/ money transfers, etc.), which would bring additional
resources for the banks. The cost of acquisition of such accounts on mass scale under the
scheme tends to be lower compared to acquiring new accounts while competing with other
banks in the normal course. Thus such accounts under the PMJDY would eventually turn out
to be profitable business in due course.
The PMJDY has been a path breaking initiative, being pursued with remarkable alacrity. While
this is serving an important social cause of financial inclusion of the unbanked poor people; at
the same time it makes good business and ecommerce sense for the banks. It is a blue ocean
for the banks, as it helps expand their customer base from the earlier untapped segment of
population; and would keep banks in growing their business and popularity in the long run.
Despite criticism from certain quarters about the aggressive means and methods adopted; the
results show that the PMJDY has been a resounding success. And the government should
continue pursuing it vigorously on an ongoing basis without any let up.

73
CHAPTER 5
RECOMMENDATIONS AND CONCLUSION
5.1 Introduction
PMJDY is an ambitious project of the government for cent percent financial inclusion. It aims
at poverty alleviation with a multi-pronged strategy of opening bank accounts of the financially
excluded, providing social security benefits such as old age pension, life and health insurance,
developing entrepreneurship with small loans under ‘Mudra’ scheme and transferring subsidies
directly to the poor through their bank accounts without any leakages. The scheme has made
good progress since its implementation in mid-August, 2014 by opening 22.29 crore accounts
both in rural and urban areas by 29th June, 2016.
In spite of a well-planned roll out of the scheme, it has not yet achieved the expected success
due to some stumbling blocks. While literacy rate is around 70%, financial literacy rate is still
abysmally low in India. This is becoming a major hurdle in spreading awareness among the
poor and financially excluded people. The government’s campaigns in print media are rendered
totally ineffective due to high rate of illiteracy among the poor. Only way to reach out to them
is through personal contact by organising camps which is a time consuming and expensive
medium. Along with the existing workload the bank staff feels over burdened with additional
workload of organising camps, creating awareness, opening additional accounts and providing
information about various products of PMJDY to the public. To make this scheme successful
the government needs to devise a fool proof strategy to achieve the maximum outcome of the
scheme.
5.2 Suggestive Measures
• The present strategy of the government on financial inclusion using print and visual
media needs to be tweaked. Instead, door to door financial literacy campaigns
providing detailed understanding and future benefits of the scheme would have better
impact.

74
• Banks may not be able to carry out such campaigns with their existing manpower.
Since the government is saving a considerable amount of money by better targeting of
subsidies, it can be utilised for such campaigns by involving unemployed educated
youth, self-help groups and educated unemployed housewives.
• Many of the government’s well intended schemes lose out due to lack of monitoring.
For scaling up financial inclusion, the government should monitor this scheme on a
continuous basis. The government has to find out innovative ways to make newly
opened accounts under the scheme Aadhaar seeded so that these people are able to get
subsidies in their accounts and their accounts remain active.
• Banks can be incentivised for implementing this scheme. This will encourage them to
scale up financial inclusion. The government should share cost of appointing BCs with
the banks so that banks can use services of BCs to scale up financial inclusion.
• Many banks fear that due to new accounts, foot falls may increase in bank branches
and the existing staff may not be able to manage the additional workload. The
government can resolve this issue by increasing manpower with new recruitments and
upgradation of technology.
• If banks can cater to small transactions of deposits or withdrawals of customers by
outsourcing them to kirana stores or Paan kiosks which can be linked with technology
such as point of sale (POS) instruments, this problem can be dealt with efficiently.
• Financial inclusion and literacy are very closely correlated. A literate person
understands the benefits of opening an account and becomes aware of various
government schemes aimed at removal of poverty through print and audio media. The
government should aim at cent per cent literacy along with cent per cent financial
inclusion.
• Banks should be encouraged to use the vast network of existing post-offices to reach
out to the unbanked population. Post offices can be used as bank correspondents or
agents. This can be a path breaking step for amplifying financial inclusion.
• In some of the sub-Saharan South African countries, the governments have been able
to increase financial inclusion by increasing mobile density. Cheaper mobile

75
instruments which can have texts in regional languages, affordable internet connection
and mobile banking facilities can help in scaling up financial inclusion to a large extent.
It is heartening to mention that the government has already taken up the task of making
India a digital nation.
5.3 Limitations of the Study
The PMJDY was launched on 28th August, 2014. The scheme has completed two years and has
made commendable progress in bringing financially excluded masses into mainstream financial
system. With a multi-pronged strategy, it aims at providing social security to the poor through
pension scheme, life and accident insurance cover. In the initial stage, the emphasis has been on
opening banks accounts of the unbanked population followed by offering a bouquet of services
to the poor through this scheme in phases – such as micro loans for entrepreneurial initiatives
for self-employment and for education.
The scope of this study is limited to examine the performance of public sector banks in Thane
city in achieving financial inclusion targets of PMJDY since its implementation over a period
of two years. It covers the targets achieved by PSBs in bringing unbanked population of Thane
city into mainstream banking system, difficulties faced by them in the course of financial
inclusion drive and their opinion about the financial inclusion model that can help in speedy
achievement of cent percent financial inclusion.
Availability of sufficient primary research data has been a major limiting factor for this study.
Out of total 116 branches of PSBs in Thane city, though the questionnaire was distributed to 90
PSB branch heads; the sample survey data could be obtained only from 20 branches despite
follow-up. Due to non-cooperation by most of the branch heads of PSBs, and the limited short
time available for completion of this this study, an extensive analysis of primary data has not
been feasible. This limits the scope of this study and the small size of the sample may affect
accuracy of the results.
To overcome this limitation of a small sample, secondary data about this scheme from the
PMJDY website has been supplemented to examine the performance of PSBs in achieving
financial inclusion targets all over India. Since data about all types of banks i.e. public sector

76
banks, private sector banks and regional rural banks is also available from the PMJDY website,
it has been possible to analyse comparatively the performance of PSBs vis-a-vis other types of
banks. The comparative study highlights the fact that PSBs have done well and played a
predominant role in achieving financial inclusion targets.
The survey data results are also broadly in line with the pattern of performance of PSBs all over
India.
5.4 The Way Forward
This study is a starting point, and has an enormous scope of further analysing the problem of
financial inclusion. With sufficient financial resources and time availability, this study can be
extended to pan India and can cover other aspects, including the bouquet of financial services
available under the scheme. A survey of beneficiaries who have been recently added into
mainstream financial system to examine the impact of this scheme will add another dimension
to the investigation which will provide useful insights to design various financial products for
the poor.
An effort has been made to study the impact of a few of the financial services; though majorly
opening of bank accounts for the unbanked people, which is the Launchpad for all other
products. This study provides a springboard to study the performance as well as the impact of
various other financial products under the PMJDY. The ball has been set rolling; and the
researchers can use their analytical skills and imagination to explore further. The scope is
tremendous.

77
5.5 Conclusion
The analysis of performance of PSBs under PMJDY shows that this scheme has achieved
tremendous success in scaling up financial inclusion of the unbanked population in India. In just
a period of two years there has been remarkable growth in bank accounts of the poor people
who were earlier out of the mainstream financial system. The challenge for the banks as well as
the government is to keep these bank accounts active and linked to proper identity of the account
holds such as Aadhaar card. Once this has been achieved, the government will be able to transfer
its poverty alleviation benefits to the target population without any pilferages. With a vast
segment of the population still under poverty line, illiteracy and corruption the task of financial
inclusion and poverty alleviation is arduous. But a beginning has been made in the right
direction with precise focus and policy tools and the success is sure in near very future.

78
References:
Acharya, Debashis & Parida, T.K. (2013). Financial inclusion in India: Why not Happened? A
Project Report submitted to the Indian Institute of Banking and Finance under the Macro
Research Award 2012-13. Retrieved from http://www.iibf.org.in/documents/reseach-
report/Final-Report-on-FI-for-IIBF-by-DAcharya-and-TParida.pdf
A, S., Naryana, D., Kumar, D. (2016). A Study on Financial Inclusion Initiatives and Challenges
in India with Reference to PMJDY. IRA-International Journal of Management and Social
Sciences, 3(3).
Bagli, S. (2012). A Study of Financial Inclusion in India. RADIX International Journal of
Economics & Business Management, 1(8)
Balasubramanian, C. (2015). Predicting Regular Saving Behaviour of the Poor Using Decision
Trees – An Important Input to Financial Inclusion in India. Scholedge International Journal of
Management & Development, 2(8), 16-30.
Carbo, S., Gardner, E. P., & Molyneux, P. (2005). Financial Exclusion. New York: Palgrave
Macmillan. DOI: 10.1057/9780230508743
Chattopadhyay S.K. (2011). Financial Inclusion in India: A Case Study of West Bengal, Reserve
Bank of India Working Paper, Vol. July 2, No. WPS (DEPR): 8/2011.
Chowhan, S. S., & Pande, J. C. (2014). Pradhan Mantri Jan Dhan Yojana: A Giant Leap
Towards Financial Inclusion. International Journal of Research in Management & Business
Studies, 1(4), 19-22.
Das, P. K. (2009). Feasibility Study of Business Correspondent/Business Facilitator Models for
Financial Inclusion in Uttar Pradesh. Accessed from IIBF website on September 22, 2016:
file:///E:/PMJDY%20Ref.Arts/Welcome%20to%20Indian%20Institute%20of%20Banking%2
0&%20Finance.html
Dreze, Jean & Sen, Amartya, (1999). India: Economic Development and Social Opportunity,
OUP Catalogue, Oxford University Press, number 9780195648317. Retrieved from
<https://ideas.repec.org/b/oxp/obooks/9780195648317.html>

79
Gupta, S. (2015). Performance Appraisal of the Pradhan Mantri Jan Dhan Yojana, IOSR Journal
of Business and Management (IOSR-JBM),17 (9), 35-39.
Joshi, M.C. and Rajpurohit, V.P. (2016). Awareness of Financial Inclusion: An Empirical
Study. Research Review International Journal of Multidisciplinary Research 1(6), 1-6.
Kaur, H., & Singh, K. N. (2015). Pradhan Mantri Jan Dhan Yojana (Pmjdy): A Leap towards
Financial Inclusion in India. International Journal of Emerging Research in Management
&Technology, 4 (1), 25-29.
Kavaljit Singh, Jan Dhan Yojana: Ambitious but Ambiguous Plan: Mainstream, 52 (44).
Kempson, E. and C. Whyley (1999a). Kept out or opted out? Understanding and combating
financial exclusion. Bristol: Policy Press.
Kempson, E. and C. Whyley (1999b). Understanding and combating financial exclusion.
Insurance Trends, 21: 18-22.
Khuntia, Rajanikant (2014). Pradhan Mantri Jan Dhan Yojana (PMJDY): A New Drive towards
Financial Inclusion in India. Zenith International Journal of Business Economics and
management Research, 4 (11), 10-20.
Kumar, Divyesh (2014). Financial Inclusion Using Pradhan Mantri Jan-Dhan Yojana –A
Conceptual Study, Asia Pacific Journal of Research, 1 (20), 37-42.
Leyshon A. and Thrift N. (1995). Geographies of Financial Exclusion: Financial Abandonment
in Britain and the United States. Transactions of the Institute of British Geographers, New
Series, 20(3), 312-41.
Mrunal, PM Jan Dhan Yojana: Salient Features, Benefits & Limitations: Retrieved from
http://mrunal.org/2014/10/bankingpmjandhanyojanaaccountsalientfeaturesbenefitslimitationsc
riticism.html
Narayana, A.S., & Kumar, D. (2016). A Study on Financial Inclusion Initiatives and Challenges
in India With Reference to PMJDY. IRA-International Journal of Management & Social
Sciences, 3(3), 652-659.

80
Patnaik, B.C.M., Satpathy, I. & Supkar, A.C. (2015). Pradhan Mantri Jan Dhan Yojna (Pmjdy)
– A New Direction for Mainstreaming the Financially Excluded. International Journal of
Management (IJM), 6 (2), 31-42.
Rajanikanta Khuntia (2014), "Pradhan Mantri Jan Dhan Yojana (PMJDY): A New Drive
towards Financial Inclusion in India", ZENITH International Journal of Business Economics
& Management Research, 4 (11), 10-20.
Rangarajan Committee (2008). Report of the Committee on Financial Inclusion. Government
of India. Retrieved from https://rbidocs.rbi.org.in/rdocs/Speeches/PDFs/MFI101213FS.pdf
Raval, H. R. (2015). Shaping New India through Financial Inclusion in form of PMJDY.
International Journal of Research in Humanities & Social Sciences, 3 (5), 34-38.
Sarma M and J. Pais (2010). Financial Inclusion and Development, Journal of International
Development, DOI: 10.1002/jid.1698 (in print)
Sharma, M (2008). Index of Financial Inclusion. Working Paper no. 215, ICRIER.
Sinclair S. P. (2001). Financial exclusion: An introductory survey. Report of Centre for
Research in Socially Inclusive Services, Heriot-Watt University, Edinburgh.
Vasudevan, S. (2009). Suitability of Business Correspondent Model for Financial Inclusion in
slums in Mumbai. Retrieved from http://www.iibf.org.in/documents/reseach-report/Report-
20.pdf
Websites accessed on 26.05.2016
http://www.bankofmaharashtra.in/Swbhimaan.asp
http://www.pmjdy.gov.in/
http://finmin.nic.in/the_ministry/dept_eco_affairs/dea.asp
https://www.rbi.org.in/
https://www.irdai.gov.in/Defaulthome.aspx?page=H1