Embed Size (px)
Citation preview
© 2016 Dhanashree Arun Mundhey et al. This is an open access article distributed under the terms of the Creative Commons Attribution License -NonCommercial-
ShareAlikeUnported License (http://creativecommons.org/licenses/by-nc-sa/3.0/).
Journal of Applied Pharmaceutical Science Vol. 6 (10), pp. 159-169, October, 2016 Available online at http://www.japsonline.com
DOI: 10.7324/JAPS.2016.601022
ISSN 2231-3354
A Study of Method Development, Validation and Forced Degradation
for Quantification of Buprenorphine Hydrochloride in a
Microemulsion Formulation
Dhanashree Arun Mundhey
1*, Vishal V. Rajkondawar
1, Anwar S. Daud
1, Nidhi P. Sapkal
2
1Centre for Advanced Research & Innovation (CARIn), Zim Laboratories Ltd. B-21/22, MIDC Area, Kalmeshwar 441501 Dist. Nagpur (M.S.), India.,
2Professor Pharmaceutical Chemistry, Gurunanak College of Pharmacy, Nari, Kamgarnagar, Nagpur (M.S.), India .
ARTICLE INFO
ABSTRACT
Article history:
Received on: 11/06/2016
Revised on: 08/08/2016
Accepted on: 18/09/2016
Available online: 29/10/2016
Objective: Development and validated of a simple, selective RP-HPLC method for the determination of
buprenorphine hydrochloride in pharmaceutical microemulsion formulation. A forced degradation study of
developed formulation was carried out in accordance with International Conference on Harmonization (ICH)
guidelines Q1 (R2). Method: The chromatogram was obtained with 10 mmolL−1
potassium phosphate buffer
adjusted to pH 6.0 with triethanolamine and acetonitrile (17:83, v/v) as mobile phase, C18 HPLC column (250 ×
4.6 mm i.d., 5 µm) kept at 30◦C and UV detection at 284 nm. The compound was eluted isocratically at a flow
rate of 1.0 mL min−1
. Results: The average retention time for buprenorphine was 14.319 min. The method was
validated according to the ICH guidelines. The validation characteristics included accuracy, precision, linearity,
range, specificity, limit of Quantitation and robustness. The calibration curves were linear (R2 > 0.999) over the
concentration range 1.0 – 500.0 µgmL−1
for buprenorphine hydrochloride and recovery study for the compound
was above 95 %. No spectral or chromatographic interferences from the microemulsion excipients were found.
The drug was found to be labile under oxidative stress condition; whereas stable under all other stress
conditions. Conclusion: This method is simple, rapid and suitable for routine quality control analysis.
Key words: Buprenorphine
hydrochloride, High-
performance liquid
chromatography,
Microemulsion formulation,
forced degradation study.
INTRODUCTION
Buprenorphine hydrochloride (BU) is chemically
known as (6R, 7R, 14S)-17cyclopropylmethyl- 7, 8-dihydro-7-[(l
S)-1-hydroxy-1, 2, 2 trimethylpropyl]-6-0-methyl-6, 14-ethano-
17-normorphine hydrochloride (USP, 2007; Drugbank, 2016;
Sweetman, 2009; Ash et al., 1996). The molecular formula of
BU is C29H41NO4, HCl and the molecular weight is 504.1
(Fig. 1). It is a potent semi-synthetic opiate analgesic with a
potency of 20-40 times higher than that of morphine (Heel et al.,
1979). As an analgesic, it is used successfully by intramuscular,
intravenous and sublingual routes to treat moderate to severe pain
as well as chronic pain (Hoskin et al., 1991). It is also indicated
to treat opioid dependence by sublingual route (Dailymed, 2016).
* Corresponding Author
Email: dhanashree.mundhey @ zimlab.in
Literature survey reveals various analytical methods available for
the quantitative determination of BU, individually and in
combination with other drugs.
BU in biological samples analyzed mainly using
chromatographic methods such as gas chromatography with
electron-capture detector (Everhart et al., 1997), HPLC with UV
detector (Tebbett et al., 1985; Hackett et al., 1986); fluorescence
detector (Liu et al., 2005; Garrett et al., 1985); electrochemical
detector (Garcia-Fernandez et al., 2001) and some hyphenated
techniques like HPLC-MS (Polettini et al., 1997; Moody et al.,
2002; Pirnay et al., 2006; Rodriguez-Ross et al., 2007). But, as
these methods reported for analysis of biological samples, these
involve sample preparation steps consisting of extraction and/or
derivatization before analysis. Thus, these methods are not suitable
for analyzing BU in bulk drug or formulations. Mostafavi et al.
reported a simultaneous estimation method for BU along with
naloxone and noroxymorphine for tablet formulation using HPLC .
160 Mundhey et al. / Journal of Applied Pharmaceutical Science 6 (10); 2016: 159-169
with UV detector at 210 nm (Mostafavi et al., 2009). But this
method is suitable only for those formulations where no excipient
absorbs at this wavelength range. To improve bioavailability of
BU, researchers formulate it into novel drug delivery systems like
microemulsion, which contain excipients like oils, surfactants, co-
surfactants etc. Many of these components are known to absorb in
the 200 – 250 nm region of UV spectrum (Baboota et al., 2007;
Wuelfing et al., 2006; Johnson, 2013). In this case method
reported by Mostafavi et al. (2009) and Tebbett et al. (1985) is not
suitable. Thus, there is a need to develop analytical method for
quantitative estimation of BU in microemulsion formulation.
Fig.1: Chemical structure of Buprenorphine (BU).
The aim of the present study was to develop a simple,
efficient, selective and validated RP-HPLC procedure for
estimation of buprenorphine in ME formulation. The method
requires no extraction or derivatization steps reducing additional
chromatographic interferences and complexity of the method. The
method validated according to the International Conference on
Harmonization (ICH) guidelines Q2 (R1) (ICH, 2005).
According to the current ICH “Stability Testing
Guidelines” Q1 A (R2), forced degradation studies of BU were
also carried out (ICH, 2003) to give additional information of
stability of BU during formulation, analysis and storage (Reynolds
et al., 2002).
MATERIALS AND METHODS
BU-ME developed in the Centre for Advanced Research
and Innovation (CARIn), Zim Laboratories, used for analytical
method development. All other reagents were of HPLC grade
obtained from Merk Specialties Pvt. Ltd. Water purified via a
Milli-Q® Reference System, Millipore SAS (Molsheim, France)
used for all purposes.
Standard solution
Standard stock solution of BU was prepared in methanol
to obtain a concentration of 500 µgmL−1
.
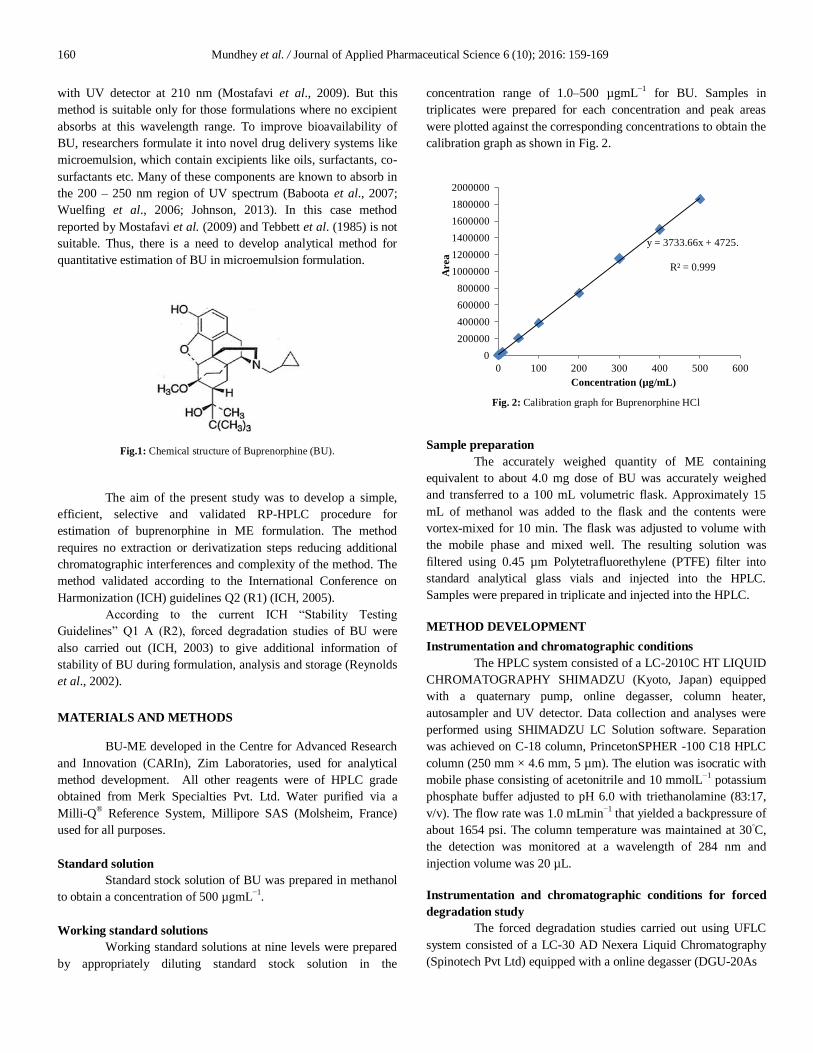
Working standard solutions
Working standard solutions at nine levels were prepared
by appropriately diluting standard stock solution in the
concentration range of 1.0–500 µgmL−1
for BU. Samples in
triplicates were prepared for each concentration and peak areas
were plotted against the corresponding concentrations to obtain the
calibration graph as shown in Fig. 2.
Fig. 2: Calibration graph for Buprenorphine HCl
Sample preparation
The accurately weighed quantity of ME containing
equivalent to about 4.0 mg dose of BU was accurately weighed
and transferred to a 100 mL volumetric flask. Approximately 15
mL of methanol was added to the flask and the contents were
vortex-mixed for 10 min. The flask was adjusted to volume with
the mobile phase and mixed well. The resulting solution was
filtered using 0.45 µm Polytetrafluorethylene (PTFE) filter into
standard analytical glass vials and injected into the HPLC.
Samples were prepared in triplicate and injected into the HPLC.
METHOD DEVELOPMENT
Instrumentation and chromatographic conditions
The HPLC system consisted of a LC-2010C HT LIQUID
CHROMATOGRAPHY SHIMADZU (Kyoto, Japan) equipped
with a quaternary pump, online degasser, column heater,
autosampler and UV detector. Data collection and analyses were
performed using SHIMADZU LC Solution software. Separation
was achieved on C-18 column, PrincetonSPHER -100 C18 HPLC
column (250 mm × 4.6 mm, 5 µm). The elution was isocratic with
mobile phase consisting of acetonitrile and 10 mmolL−1
potassium
phosphate buffer adjusted to pH 6.0 with triethanolamine (83:17,
v/v). The flow rate was 1.0 mLmin−1
that yielded a backpressure of
about 1654 psi. The column temperature was maintained at 30◦C,
the detection was monitored at a wavelength of 284 nm and
injection volume was 20 µL.
Instrumentation and chromatographic conditions for forced
degradation study
The forced degradation studies carried out using UFLC
system consisted of a LC-30 AD Nexera Liquid Chromatography
(Spinotech Pvt Ltd) equipped with a online degasser (DGU-20As
y = 3733.66x + 4725.
R² = 0.999
0
200000
400000
600000
800000
1000000
1200000
1400000
1600000
1800000
2000000
0 100 200 300 400 500 600
Area
Concentration (µg/mL)
Mundhey et al. / Journal of Applied Pharmaceutical Science 6 (10); 2016: 159-169 161
prominence degasser), column heater (CTO-20 AC prominence
column oven), auto sampler (Sil-30AC Nexera auto sampler) and
UV detector (SPD-20 A prominence UV/vis detector) and DAD
detector (SPD-M 20A prominence diode array detector was used
to determine the peak purity. Analysis was performed at ambient
temperature and detection was carried out in the range of 200 –
400 nm. Column specifications, mobile phase, flow rate and
injection volume was same as mention under Instrumentation and
chromatographic conditions.
Calibration graph for chromatographic measurement of BU
The area were measured for BU in the concentration
range of 1.0, 5.0, 10.0, 50.0, 100.0, 200.0, 300.0, 400.0, 500.0 µg
ml-1 using above mentioned chromatographic conditions.
Calibration graphs were plotted for BU at concentration range of
1.0-500 µg ml-1
as shown in Fig. 2.
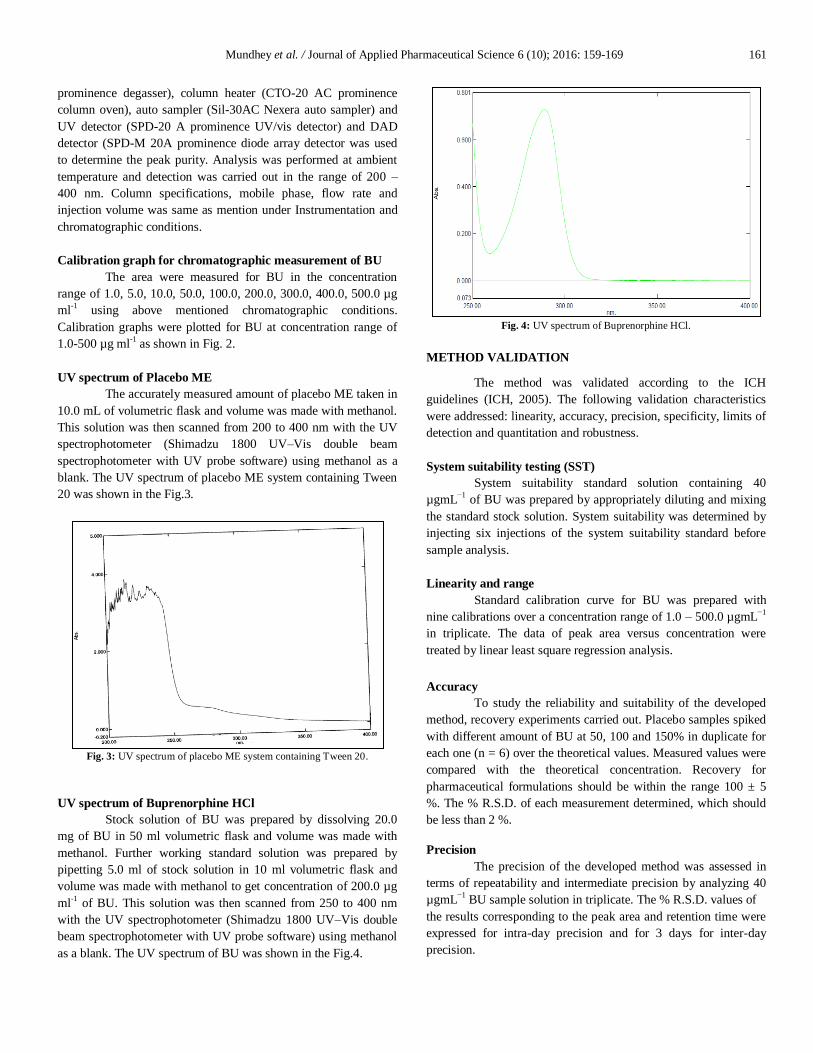
UV spectrum of Placebo ME
The accurately measured amount of placebo ME taken in
10.0 mL of volumetric flask and volume was made with methanol.
This solution was then scanned from 200 to 400 nm with the UV
spectrophotometer (Shimadzu 1800 UV–Vis double beam
spectrophotometer with UV probe software) using methanol as a
blank. The UV spectrum of placebo ME system containing Tween
20 was shown in the Fig.3.
Fig. 3: UV spectrum of placebo ME system containing Tween 20.
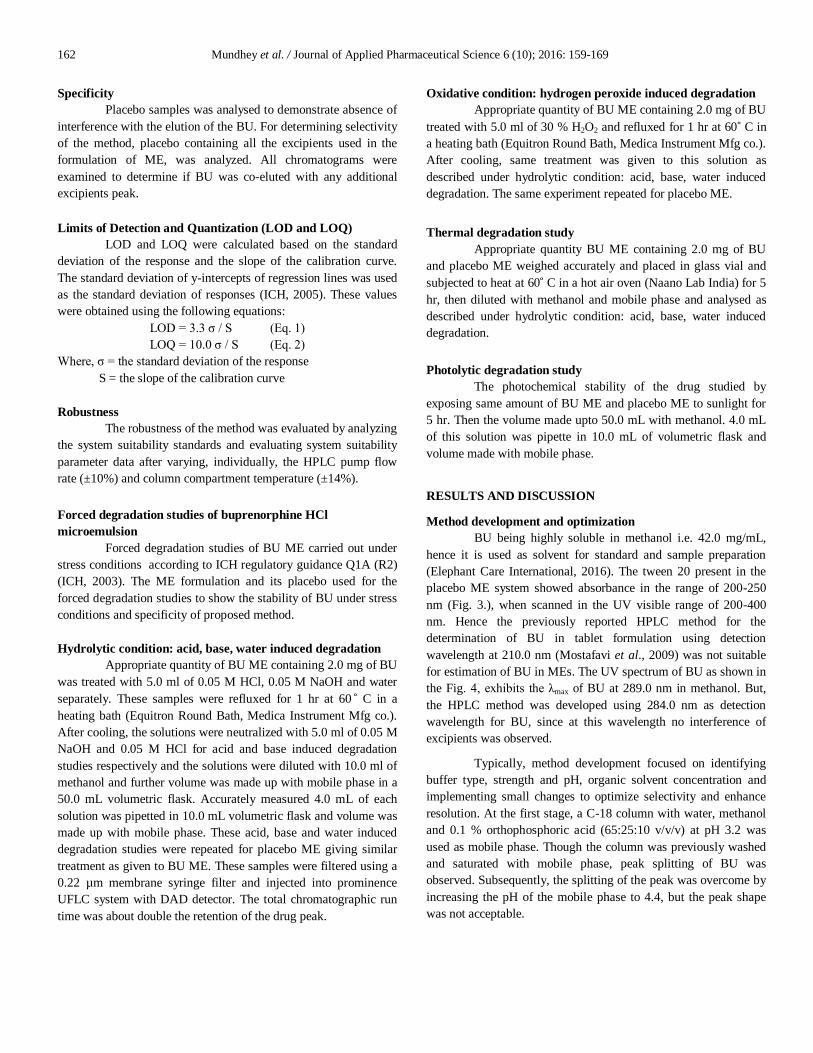
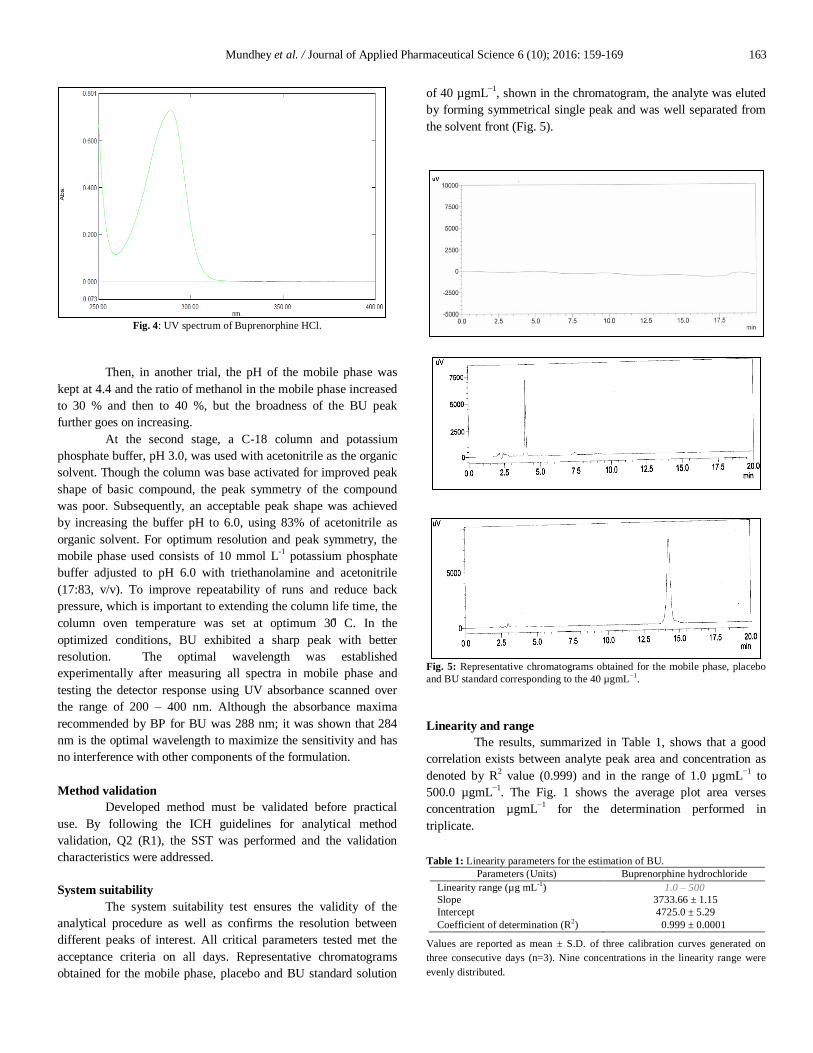
UV spectrum of Buprenorphine HCl
Stock solution of BU was prepared by dissolving 20.0
mg of BU in 50 ml volumetric flask and volume was made with
methanol. Further working standard solution was prepared by
pipetting 5.0 ml of stock solution in 10 ml volumetric flask and
volume was made with methanol to get concentration of 200.0 µg
ml-1 of BU. This solution was then scanned from 250 to 400 nm
with the UV spectrophotometer (Shimadzu 1800 UV–Vis double
beam spectrophotometer with UV probe software) using methanol
as a blank. The UV spectrum of BU was shown in the Fig.4.
Fig. 4: UV spectrum of Buprenorphine HCl.
METHOD VALIDATION
The method was validated according to the ICH
guidelines (ICH, 2005). The following validation characteristics
were addressed: linearity, accuracy, precision, specificity, limits of
detection and quantitation and robustness.
System suitability testing (SST)
System suitability standard solution containing 40
µgmL−1
of BU was prepared by appropriately diluting and mixing
the standard stock solution. System suitability was determined by
injecting six injections of the system suitability standard before
sample analysis.
Linearity and range
Standard calibration curve for BU was prepared with
nine calibrations over a concentration range of 1.0 – 500.0 µgmL−1
in triplicate. The data of peak area versus concentration were
treated by linear least square regression analysis.
Accuracy
To study the reliability and suitability of the developed
method, recovery experiments carried out. Placebo samples spiked
with different amount of BU at 50, 100 and 150% in duplicate for
each one (n = 6) over the theoretical values. Measured values were
compared with the theoretical concentration. Recovery for
pharmaceutical formulations should be within the range 100 ± 5
%. The % R.S.D. of each measurement determined, which should
be less than 2 %.
Precision
The precision of the developed method was assessed in
terms of repeatability and intermediate precision by analyzing 40
µgmL−1
BU sample solution in triplicate. The % R.S.D. values of
the results corresponding to the peak area and retention time were
expressed for intra-day precision and for 3 days for inter-day
precision.
162 Mundhey et al. / Journal of Applied Pharmaceutical Science 6 (10); 2016: 159-169
Specificity
Placebo samples was analysed to demonstrate absence of
interference with the elution of the BU. For determining selectivity
of the method, placebo containing all the excipients used in the
formulation of ME, was analyzed. All chromatograms were
examined to determine if BU was co-eluted with any additional
excipients peak.
Limits of Detection and Quantization (LOD and LOQ)
LOD and LOQ were calculated based on the standard
deviation of the response and the slope of the calibration curve.
The standard deviation of y-intercepts of regression lines was used
as the standard deviation of responses (ICH, 2005). These values
were obtained using the following equations:
LOD = 3.3 σ / S (Eq. 1)
LOQ = 10.0 σ / S (Eq. 2)
Where, σ = the standard deviation of the response
S = the slope of the calibration curve
Robustness
The robustness of the method was evaluated by analyzing
the system suitability standards and evaluating system suitability
parameter data after varying, individually, the HPLC pump flow
rate (±10%) and column compartment temperature (±14%).
Forced degradation studies of buprenorphine HCl
microemulsion
Forced degradation studies of BU ME carried out under
stress conditions according to ICH regulatory guidance Q1A (R2)
(ICH, 2003). The ME formulation and its placebo used for the
forced degradation studies to show the stability of BU under stress
conditions and specificity of proposed method.
Hydrolytic condition: acid, base, water induced degradation
Appropriate quantity of BU ME containing 2.0 mg of BU
was treated with 5.0 ml of 0.05 M HCl, 0.05 M NaOH and water
separately. These samples were refluxed for 1 hr at 60 C in a
heating bath (Equitron Round Bath, Medica Instrument Mfg co.).
After cooling, the solutions were neutralized with 5.0 ml of 0.05 M
NaOH and 0.05 M HCl for acid and base induced degradation
studies respectively and the solutions were diluted with 10.0 ml of
methanol and further volume was made up with mobile phase in a
50.0 mL volumetric flask. Accurately measured 4.0 mL of each
solution was pipetted in 10.0 mL volumetric flask and volume was
made up with mobile phase. These acid, base and water induced
degradation studies were repeated for placebo ME giving similar
treatment as given to BU ME. These samples were filtered using a
0.22 µm membrane syringe filter and injected into prominence
UFLC system with DAD detector. The total chromatographic run
time was about double the retention of the drug peak.
Oxidative condition: hydrogen peroxide induced degradation
Appropriate quantity of BU ME containing 2.0 mg of BU
treated with 5.0 ml of 30 % H2O2 and refluxed for 1 hr at 60 C in
a heating bath (Equitron Round Bath, Medica Instrument Mfg co.).
After cooling, same treatment was given to this solution as
described under hydrolytic condition: acid, base, water induced
degradation. The same experiment repeated for placebo ME.
Thermal degradation study
Appropriate quantity BU ME containing 2.0 mg of BU
and placebo ME weighed accurately and placed in glass vial and
subjected to heat at 60 C in a hot air oven (Naano Lab India) for 5
hr, then diluted with methanol and mobile phase and analysed as
described under hydrolytic condition: acid, base, water induced
degradation.
Photolytic degradation study
The photochemical stability of the drug studied by
exposing same amount of BU ME and placebo ME to sunlight for
5 hr. Then the volume made upto 50.0 mL with methanol. 4.0 mL
of this solution was pipette in 10.0 mL of volumetric flask and
volume made with mobile phase.
RESULTS AND DISCUSSION
Method development and optimization
BU being highly soluble in methanol i.e. 42.0 mg/mL,
hence it is used as solvent for standard and sample preparation
(Elephant Care International, 2016). The tween 20 present in the
placebo ME system showed absorbance in the range of 200-250
nm (Fig. 3.), when scanned in the UV visible range of 200-400
nm. Hence the previously reported HPLC method for the
determination of BU in tablet formulation using detection
wavelength at 210.0 nm (Mostafavi et al., 2009) was not suitable
for estimation of BU in MEs. The UV spectrum of BU as shown in
the Fig. 4, exhibits the λmax of BU at 289.0 nm in methanol. But,
the HPLC method was developed using 284.0 nm as detection
wavelength for BU, since at this wavelength no interference of
excipients was observed.
Typically, method development focused on identifying
buffer type, strength and pH, organic solvent concentration and
implementing small changes to optimize selectivity and enhance
resolution. At the first stage, a C-18 column with water, methanol
and 0.1 % orthophosphoric acid (65:25:10 v/v/v) at pH 3.2 was
used as mobile phase. Though the column was previously washed
and saturated with mobile phase, peak splitting of BU was
observed. Subsequently, the splitting of the peak was overcome by
increasing the pH of the mobile phase to 4.4, but the peak shape
was not acceptable.
Mundhey et al. / Journal of Applied Pharmaceutical Science 6 (10); 2016: 159-169 163
Fig. 4: UV spectrum of Buprenorphine HCl.
Then, in another trial, the pH of the mobile phase was
kept at 4.4 and the ratio of methanol in the mobile phase increased
to 30 % and then to 40 %, but the broadness of the BU peak
further goes on increasing.
At the second stage, a C-18 column and potassium
phosphate buffer, pH 3.0, was used with acetonitrile as the organic
solvent. Though the column was base activated for improved peak
shape of basic compound, the peak symmetry of the compound
was poor. Subsequently, an acceptable peak shape was achieved
by increasing the buffer pH to 6.0, using 83% of acetonitrile as
organic solvent. For optimum resolution and peak symmetry, the
mobile phase used consists of 10 mmol L-1
potassium phosphate
buffer adjusted to pH 6.0 with triethanolamine and acetonitrile
(17:83, v/v). To improve repeatability of runs and reduce back
pressure, which is important to extending the column life time, the
column oven temperature was set at optimum 30 C. In the
optimized conditions, BU exhibited a sharp peak with better
resolution. The optimal wavelength was established
experimentally after measuring all spectra in mobile phase and
testing the detector response using UV absorbance scanned over
the range of 200 – 400 nm. Although the absorbance maxima
recommended by BP for BU was 288 nm; it was shown that 284
nm is the optimal wavelength to maximize the sensitivity and has
no interference with other components of the formulation.
Method validation
Developed method must be validated before practical
use. By following the ICH guidelines for analytical method
validation, Q2 (R1), the SST was performed and the validation
characteristics were addressed.
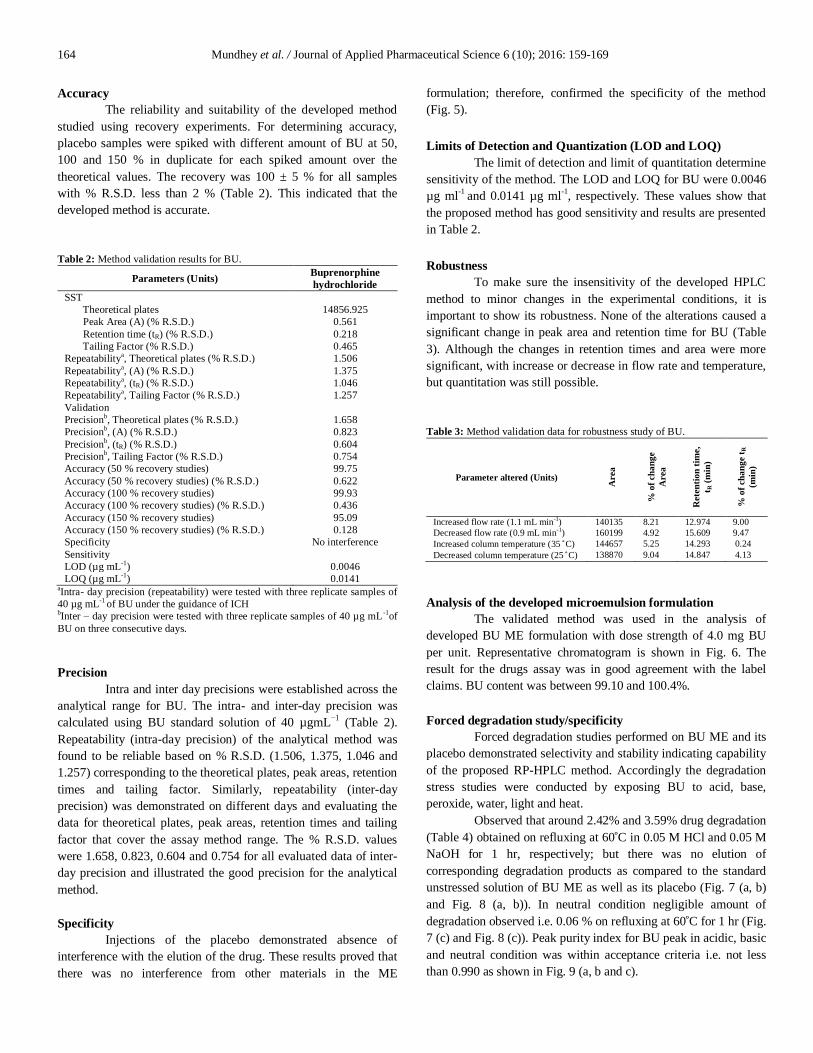
System suitability
The system suitability test ensures the validity of the
analytical procedure as well as confirms the resolution between
different peaks of interest. All critical parameters tested met the
acceptance criteria on all days. Representative chromatograms
obtained for the mobile phase, placebo and BU standard solution
of 40 µgmL−1
, shown in the chromatogram, the analyte was eluted
by forming symmetrical single peak and was well separated from
the solvent front (Fig. 5).
Fig. 5: Representative chromatograms obtained for the mobile phase, placebo
and BU standard corresponding to the 40 µgmL−1
.
Linearity and range
The results, summarized in Table 1, shows that a good
correlation exists between analyte peak area and concentration as
denoted by R2 value (0.999) and in the range of 1.0 µgmL
−1 to
500.0 µgmL−1
. The Fig. 1 shows the average plot area verses
concentration µgmL−1
for the determination performed in
triplicate.
Table 1: Linearity parameters for the estimation of BU.
Parameters (Units) Buprenorphine hydrochloride
Linearity range (µg mL-1
) 1.0 – 500
Slope 3733.66 ± 1.15
Intercept 4725.0 ± 5.29
Coefficient of determination (R2) 0.999 ± 0.0001
Values are reported as mean ± S.D. of three calibration curves generated on
three consecutive days (n=3). Nine concentrations in the linearity range were
evenly distributed.
164 Mundhey et al. / Journal of Applied Pharmaceutical Science 6 (10); 2016: 159-169
Accuracy
The reliability and suitability of the developed method
studied using recovery experiments. For determining accuracy,
placebo samples were spiked with different amount of BU at 50,
100 and 150 % in duplicate for each spiked amount over the
theoretical values. The recovery was 100 ± 5 % for all samples
with % R.S.D. less than 2 % (Table 2). This indicated that the
developed method is accurate.
Table 2: Method validation results for BU.
Parameters (Units) Buprenorphine
hydrochloride
SST
Theoretical plates
Peak Area (A) (% R.S.D.)
14856.925
0.561
Retention time (tR) (% R.S.D.) 0.218
Tailing Factor (% R.S.D.) 0.465
Repeatabilitya, Theoretical plates (% R.S.D.) 1.506
Repeatabilitya, (A) (% R.S.D.) 1.375
Repeatabilitya, (tR) (% R.S.D.) 1.046
Repeatabilitya, Tailing Factor (% R.S.D.) 1.257
Validation
Precisionb, Theoretical plates (% R.S.D.) 1.658
Precisionb, (A) (% R.S.D.) 0.823
Precisionb, (tR) (% R.S.D.) 0.604
Precisionb, Tailing Factor (% R.S.D.) 0.754
Accuracy (50 % recovery studies) 99.75
Accuracy (50 % recovery studies) (% R.S.D.) 0.622
Accuracy (100 % recovery studies) 99.93
Accuracy (100 % recovery studies) (% R.S.D.) 0.436
Accuracy (150 % recovery studies) 95.09
Accuracy (150 % recovery studies) (% R.S.D.) 0.128
Specificity No interference
Sensitivity
LOD (µg mL-1
) 0.0046
LOQ (µg mL-1
) 0.0141 aIntra- day precision (repeatability) were tested with three replicate samples of
40 µg mL-1
of BU under the guidance of ICH bInter – day precision were tested with three replicate samples of 40 µg mL
-1of
BU on three consecutive days.
Precision
Intra and inter day precisions were established across the
analytical range for BU. The intra- and inter-day precision was
calculated using BU standard solution of 40 µgmL−1
(Table 2).
Repeatability (intra-day precision) of the analytical method was
found to be reliable based on % R.S.D. (1.506, 1.375, 1.046 and
1.257) corresponding to the theoretical plates, peak areas, retention
times and tailing factor. Similarly, repeatability (inter-day
precision) was demonstrated on different days and evaluating the
data for theoretical plates, peak areas, retention times and tailing
factor that cover the assay method range. The % R.S.D. values
were 1.658, 0.823, 0.604 and 0.754 for all evaluated data of inter-
day precision and illustrated the good precision for the analytical
method.
Specificity
Injections of the placebo demonstrated absence of
interference with the elution of the drug. These results proved that
there was no interference from other materials in the ME
formulation; therefore, confirmed the specificity of the method
(Fig. 5).
Limits of Detection and Quantization (LOD and LOQ)
The limit of detection and limit of quantitation determine
sensitivity of the method. The LOD and LOQ for BU were 0.0046
µg ml-1
and 0.0141 µg ml-1
, respectively. These values show that
the proposed method has good sensitivity and results are presented
in Table 2.
Robustness
To make sure the insensitivity of the developed HPLC
method to minor changes in the experimental conditions, it is
important to show its robustness. None of the alterations caused a
significant change in peak area and retention time for BU (Table
3). Although the changes in retention times and area were more
significant, with increase or decrease in flow rate and temperature,
but quantitation was still possible.
Table 3: Method validation data for robustness study of BU.
Parameter altered (Units)
Area
% o
f ch
an
ge
Area
Rete
nti
on
tim
e,
t R (
min
)
% o
f ch
an
ge t
R
(min
)
Increased flow rate (1.1 mL min-1) 140135 8.21 12.974 9.00
Decreased flow rate (0.9 mL min-1) 160199 4.92 15.609 9.47
Increased column temperature (35 C) 144657 5.25 14.293 0.24
Decreased column temperature (25 C) 138870 9.04 14.847 4.13
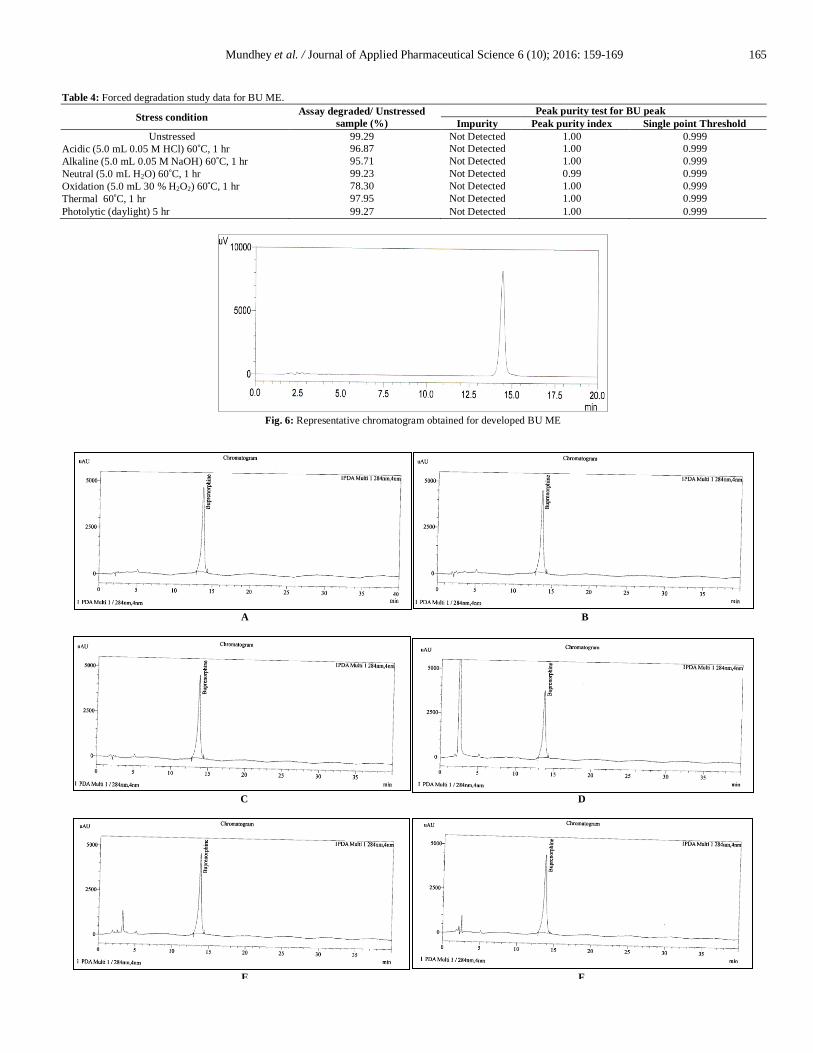
Analysis of the developed microemulsion formulation
The validated method was used in the analysis of
developed BU ME formulation with dose strength of 4.0 mg BU
per unit. Representative chromatogram is shown in Fig. 6. The
result for the drugs assay was in good agreement with the label
claims. BU content was between 99.10 and 100.4%.
Forced degradation study/specificity
Forced degradation studies performed on BU ME and its
placebo demonstrated selectivity and stability indicating capability
of the proposed RP-HPLC method. Accordingly the degradation
stress studies were conducted by exposing BU to acid, base,
peroxide, water, light and heat.
Observed that around 2.42% and 3.59% drug degradation
(Table 4) obtained on refluxing at 60 C in 0.05 M HCl and 0.05 M
NaOH for 1 hr, respectively; but there was no elution of
corresponding degradation products as compared to the standard
unstressed solution of BU ME as well as its placebo (Fig. 7 (a, b)
and Fig. 8 (a, b)). In neutral condition negligible amount of
degradation observed i.e. 0.06 % on refluxing at 60 C for 1 hr (Fig.
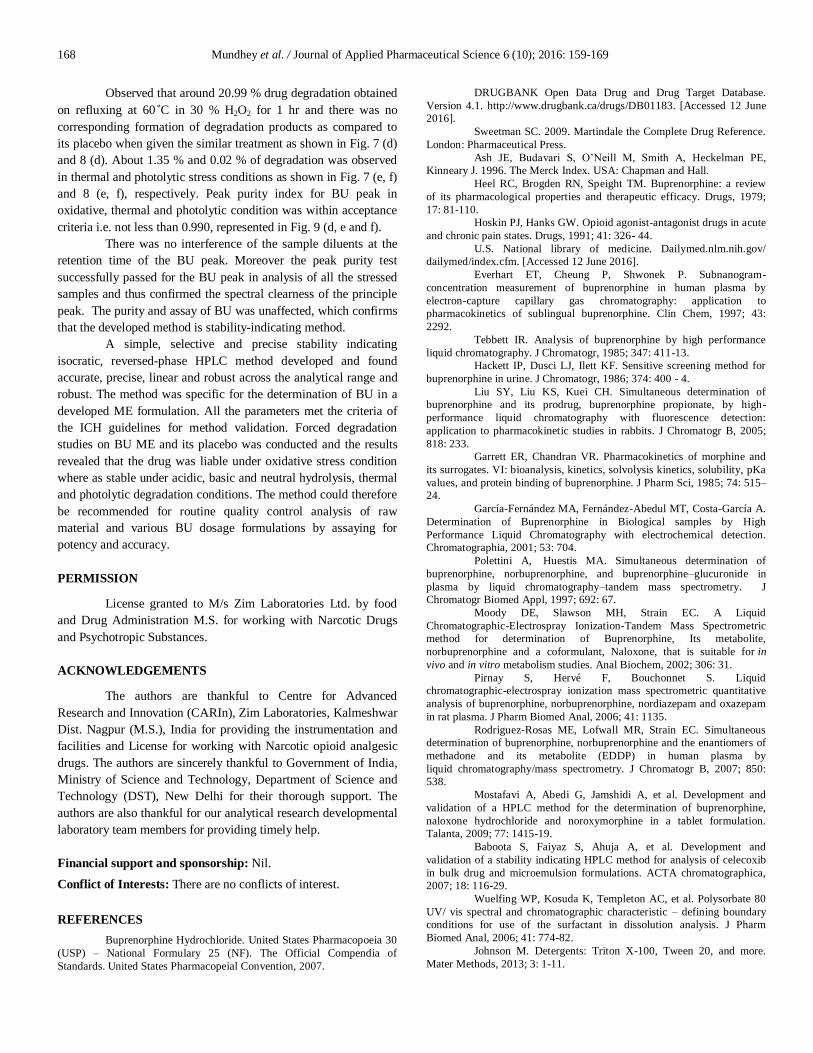
7 (c) and Fig. 8 (c)). Peak purity index for BU peak in acidic, basic
and neutral condition was within acceptance criteria i.e. not less
than 0.990 as shown in Fig. 9 (a, b and c).
Mundhey et al. / Journal of Applied Pharmaceutical Science 6 (10); 2016: 159-169 165
Table 4: Forced degradation study data for BU ME.
Stress condition Assay degraded/ Unstressed
sample (%)
Peak purity test for BU peak
Impurity Peak purity index Single point Threshold
Unstressed 99.29 Not Detected 1.00 0.999
Acidic (5.0 mL 0.05 M HCl) 60 C, 1 hr 96.87 Not Detected 1.00 0.999
Alkaline (5.0 mL 0.05 M NaOH) 60 C, 1 hr 95.71 Not Detected 1.00 0.999
Neutral (5.0 mL H2O) 60 C, 1 hr 99.23 Not Detected 0.99 0.999
Oxidation (5.0 mL 30 % H2O2) 60 C, 1 hr 78.30 Not Detected 1.00 0.999
Thermal 60 C, 1 hr 97.95 Not Detected 1.00 0.999
Photolytic (daylight) 5 hr 99.27 Not Detected 1.00 0.999
Fig. 6: Representative chromatogram obtained for developed BU ME
A B
C D
E F
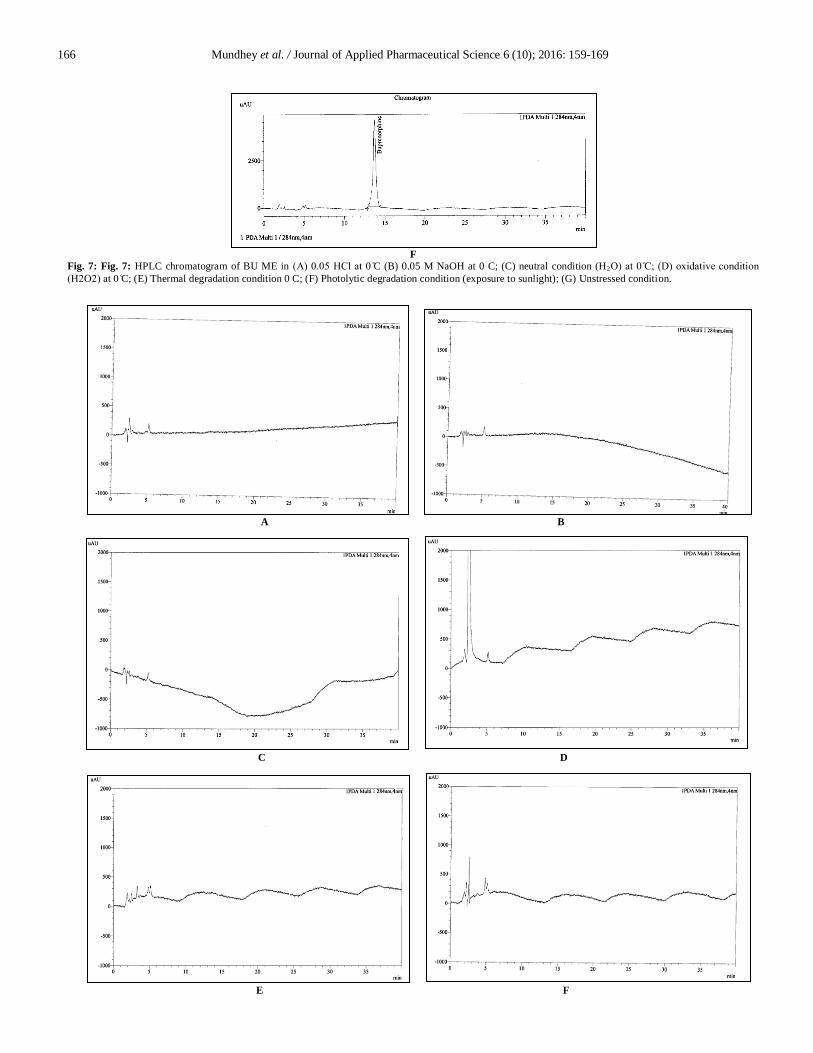
166 Mundhey et al. / Journal of Applied Pharmaceutical Science 6 (10); 2016: 159-169
F
Fig. 7: Fig. 7: HPLC chromatogram of BU ME in (A) 0.0 HCl at 0 C (B) 0.05 M NaOH at 0 C; (C) neutral condition (H2O) at 0 C (D) oxidati e condition
(H2O2) at 0 C; (E) Thermal degradation condition 0 C; (F) Photolytic degradation condition (exposure to sunlight); (G) Unstressed condition.
A B
C D
E F
Mundhey et al. / Journal of Applied Pharmaceutical Science 6 (10); 2016: 159-169 167
F
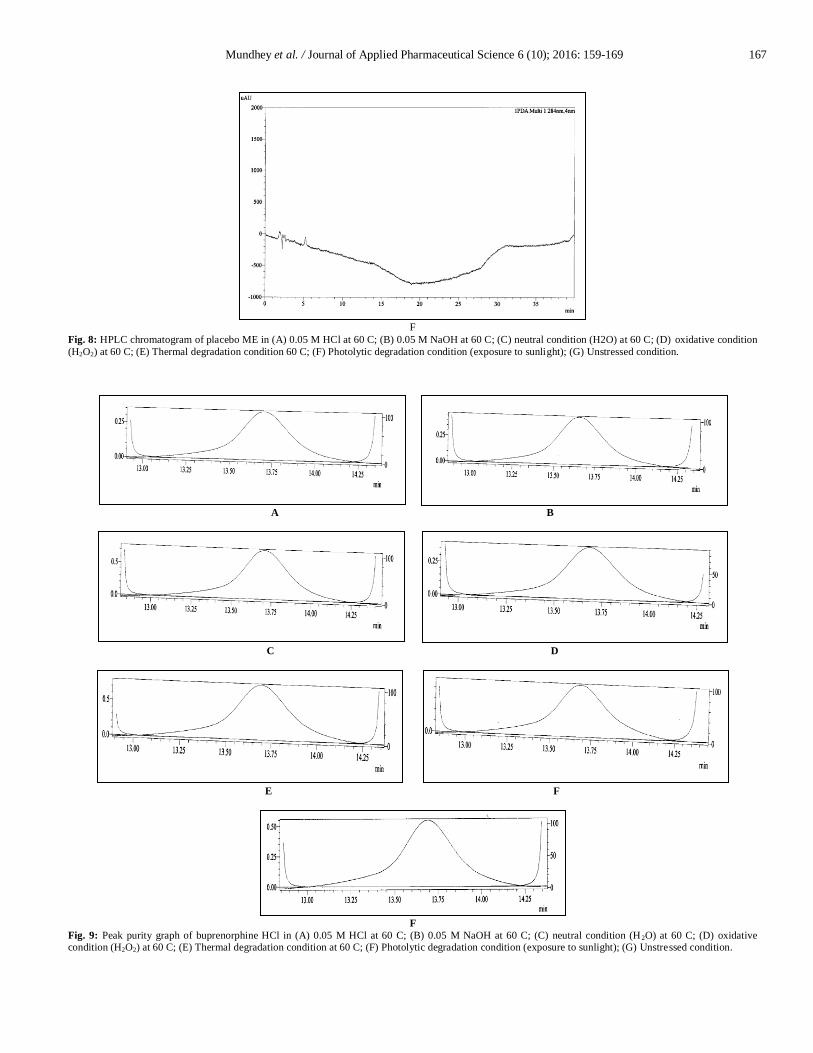
Fig. 8: HPLC chromatogram of placebo ME in (A) 0.05 M HCl at 60 C; (B) 0.05 M NaOH at 60 C; (C) neutral condition (H2O) at 60 C; (D) oxidative condition
(H2O2) at 60 C; (E) Thermal degradation condition 60 C; (F) Photolytic degradation condition (exposure to sunlight); (G) Unstressed condition.
A B
C D
E F
F
Fig. 9: Peak purity graph of buprenorphine HCl in (A) 0.05 M HCl at 60 C; (B) 0.05 M NaOH at 60 C; (C) neutral condition (H 2O) at 60 C; (D) oxidative condition (H2O2) at 60 C; (E) Thermal degradation condition at 60 C; (F) Photolytic degradation condition (exposure to sunlight); (G) Unstressed condition.
168 Mundhey et al. / Journal of Applied Pharmaceutical Science 6 (10); 2016: 159-169
Observed that around 20.99 % drug degradation obtained
on refluxing at 60 C in 30 % H2O2 for 1 hr and there was no
corresponding formation of degradation products as compared to
its placebo when given the similar treatment as shown in Fig. 7 (d)
and 8 (d). About 1.35 % and 0.02 % of degradation was observed
in thermal and photolytic stress conditions as shown in Fig. 7 (e, f)
and 8 (e, f), respectively. Peak purity index for BU peak in
oxidative, thermal and photolytic condition was within acceptance
criteria i.e. not less than 0.990, represented in Fig. 9 (d, e and f).
There was no interference of the sample diluents at the
retention time of the BU peak. Moreover the peak purity test
successfully passed for the BU peak in analysis of all the stressed
samples and thus confirmed the spectral clearness of the principle
peak. The purity and assay of BU was unaffected, which confirms
that the developed method is stability-indicating method.
A simple, selective and precise stability indicating
isocratic, reversed-phase HPLC method developed and found
accurate, precise, linear and robust across the analytical range and
robust. The method was specific for the determination of BU in a
developed ME formulation. All the parameters met the criteria of
the ICH guidelines for method validation. Forced degradation
studies on BU ME and its placebo was conducted and the results
revealed that the drug was liable under oxidative stress condition
where as stable under acidic, basic and neutral hydrolysis, thermal
and photolytic degradation conditions. The method could therefore
be recommended for routine quality control analysis of raw
material and various BU dosage formulations by assaying for
potency and accuracy.
PERMISSION
License granted to M/s Zim Laboratories Ltd. by food
and Drug Administration M.S. for working with Narcotic Drugs
and Psychotropic Substances.
ACKNOWLEDGEMENTS
The authors are thankful to Centre for Advanced
Research and Innovation (CARIn), Zim Laboratories, Kalmeshwar
Dist. Nagpur (M.S.), India for providing the instrumentation and
facilities and License for working with Narcotic opioid analgesic
drugs. The authors are sincerely thankful to Government of India,
Ministry of Science and Technology, Department of Science and
Technology (DST), New Delhi for their thorough support. The
authors are also thankful for our analytical research developmental
laboratory team members for providing timely help.
Financial support and sponsorship: Nil.
Conflict of Interests: There are no conflicts of interest.
REFERENCES
Buprenorphine Hydrochloride. United States Pharmacopoeia 30
(USP) – National Formulary 25 (NF). The Official Compendia of
Standards. United States Pharmacopeial Convention, 2007.
DRUGBANK Open Data Drug and Drug Target Database.
Version 4.1. http://www.drugbank.ca/drugs/DB01183. [Accessed 12 June
2016].
Sweetman SC. 2009. Martindale the Complete Drug Reference.
London: Pharmaceutical Press.
Ash JE, Buda ari S, O’Neill M, Smith A, Heckelman PE,
Kinneary J. 1996. The Merck Index. USA: Chapman and Hall.
Heel RC, Brogden RN, Speight TM. Buprenorphine: a review
of its pharmacological properties and therapeutic efficacy. Drugs, 1979;
17: 81-110.
Hoskin PJ, Hanks GW. Opioid agonist-antagonist drugs in acute
and chronic pain states. Drugs, 1991; 41: 326- 44.
U.S. National library of medicine. Dailymed.nlm.nih.gov/
dailymed/index.cfm. [Accessed 12 June 2016].
Everhart ET, Cheung P, Shwonek P. Subnanogram-
concentration measurement of buprenorphine in human plasma by
electron-capture capillary gas chromatography: application to
pharmacokinetics of sublingual buprenorphine. Clin Chem, 1997; 43:
2292.
Tebbett IR. Analysis of buprenorphine by high performance
liquid chromatography. J Chromatogr, 1985; 347: 411-13.
Hackett IP, Dusci LJ, Ilett KF. Sensitive screening method for
buprenorphine in urine. J Chromatogr, 1986; 374: 400 - 4.
Liu SY, Liu KS, Kuei CH. Simultaneous determination of
buprenorphine and its prodrug, buprenorphine propionate, by high-
performance liquid chromatography with fluorescence detection:
application to pharmacokinetic studies in rabbits. J Chromatogr B, 2005;
818: 233.
Garrett ER, Chandran VR. Pharmacokinetics of morphine and
its surrogates. VI: bioanalysis, kinetics, solvolysis kinetics, solubility, pKa
values, and protein binding of buprenorphine. J Pharm Sci, 1985; 74: 515–
24.
García-Fernández MA, Fernández-Abedul MT, Costa-García A.
Determination of Buprenorphine in Biological samples by High
Performance Liquid Chromatography with electrochemical detection.
Chromatographia, 2001; 53: 704.
Polettini A, Huestis MA. Simultaneous determination of
buprenorphine, norbuprenorphine, and buprenorphine–glucuronide in
plasma by liquid chromatography–tandem mass spectrometry. J
Chromatogr Biomed Appl, 1997; 692: 67.
Moody DE, Slawson MH, Strain EC. A Liquid
Chromatographic-Electrospray Ionization-Tandem Mass Spectrometric
method for determination of Buprenorphine, Its metabolite,
norbuprenorphine and a coformulant, Naloxone, that is suitable for in
vivo and in vitro metabolism studies. Anal Biochem, 2002; 306: 31.
Pirnay S, Hervé F, Bouchonnet S. Liquid
chromatographic-electrospray ionization mass spectrometric quantitative
analysis of buprenorphine, norbuprenorphine, nordiazepam and oxazepam
in rat plasma. J Pharm Biomed Anal, 2006; 41: 1135.
Rodriguez-Rosas ME, Lofwall MR, Strain EC. Simultaneous
determination of buprenorphine, norbuprenorphine and the enantiomers of
methadone and its metabolite (EDDP) in human plasma by
liquid chromatography/mass spectrometry. J Chromatogr B, 2007; 850:
538.
Mostafavi A, Abedi G, Jamshidi A, et al. Development and
validation of a HPLC method for the determination of buprenorphine,
naloxone hydrochloride and noroxymorphine in a tablet formulation.
Talanta, 2009; 77: 1415-19.
Baboota S, Faiyaz S, Ahuja A, et al. Development and
validation of a stability indicating HPLC method for analysis of celecoxib
in bulk drug and microemulsion formulations. ACTA chromatographica,
2007; 18: 116-29.
Wuelfing WP, Kosuda K, Templeton AC, et al. Polysorbate 80
UV/ vis spectral and chromatographic characteristic – defining boundary
conditions for use of the surfactant in dissolution analysis. J Pharm
Biomed Anal, 2006; 41: 774-82.
Johnson M. Detergents: Triton X-100, Tween 20, and more.
Mater Methods, 2013; 3: 1-11.
Mundhey et al. / Journal of Applied Pharmaceutical Science 6 (10); 2016: 159-169 169
Text on validation of analytical procedures: text and
methodology Q2 (R1), Triplicate International Conference on
Harmonization (ICH) text, ICH Tech coordination; 2005.
Test on stability of new drug substances and products Q1A
(R2), Triplicate International Conference on Harmonization (ICH) text,
ICH Tech coordination; 2003.
Reynolds DW, Facchine KL, Mullaney JF, et al. Available
guidance and best practices for conducting forced degradation studies.
Pharmaceutical Technology, 2002:48e56. http://www.pharmtech.com.
Elephant Care International. The elephant formulary:
Buprenorphine hydrochloride. http://www.elephantcare.org/
Drugs/buprenor.htm. [Accessed 12 June 2016].
How to cite this article:
Mundhey DA, Rajkondawar VV, Daud AS, Sapkal NP. A Study of Method Development, Validation and Forced Degradation for Quantification of Buprenorphine Hydrochloride in a Microemulsion Formulation. J App Pharm Sci, 2016; 6 (10): 159-
169.