Embed Size (px)
Citation preview
University of Plymouth
PEARL https://pearl.plymouth.ac.uk
04 University of Plymouth Research Theses 01 Research Theses Main Collection
2005
A STUDY OF MEDITERRANEAN
BLUEFIN TUNA (Thunnus thynnus L.)
WITH REFERENCE TO STOCK
IDENTIFICATION AND MANAGEMENT
STRATEGIES
FARRUGIA, ANDREINA FENECH
http://hdl.handle.net/10026.1/1995
University of Plymouth
All content in PEARL is protected by copyright law. Author manuscripts are made available in accordance with
publisher policies. Please cite only the published version using the details provided on the item record or
document. In the absence of an open licence (e.g. Creative Commons), permissions for further reuse of content
should be sought from the publisher or author.
A STUDY OF MEDITERRANEAN BLUEFIN TUNA (Thunnus
thynnus L.) WITH REFERENCE TO STOCK
IDENTIFICATION AND MANAGEMENT STRATEGIES
by
AND REIN A FENECH F ARRUGIA
A thesis submitted to the University of Plymouth
In partial fulfilment for the degree of
DOCTOR OF PHILOSOPHY
School of Earth, Ocean and Environmental Sciences
December 2005

ANDREINA FENECH FARRUGIA
Abstract
The management of bluefin tuna (Thunnus thynnus) in the north Atlantic has been based on the
assumption that there are two separate stocks (an eastern Atlantic stock, including the
Mediterranean Sea and a western Atlantic stock). This hypothesis has never been scientifically
confirmed. This study provides evidence of unique stock characteristics of the bluefin tuna
population targeted specifically in the Mediterranean and aims at showing that it is a single stock
suitable for its own management regime. This has been done through the study of the biological
parameters of bluefin tunas sampled in the Mediterranean, including biometric relationships, age
determination, size at first maturity and reproductive studies. The identity of the Mediterranean
stock has also been examined through tagging activities, extraction and chemical analysis of the
otoliths and through genetic studies. Old and new exploitation techniques within the
Mediterranean have been analysed in order to identify trends in landings, existence of illegal,
unreported and unregulated catches and to conclude whether or not the bluefin tuna population in
the Mediterranean is being overexploited. Results obtained all lead to the conclusion that the
Mediterranean stock is an independent stock confined to the Mediterranean with minimal exchange
through the Strait of Gibraltar. This study provides a strong argument for the management of the
bluefin tuna population in the Mediterranean as a unique stock biologically independent of the
Atlantic stock.

Table of Contents
Chapter I Introduction 1 1.1 The Mediterranean Sea 2 1.2 General Remarks on Scombrids 3
1.2.1 Thunnus thynnus (Linneaus, 1758) 7 1.2.2 Taxonomy and Morphology 7 1.2.3 Ecology 8 1.2.4 Feeding and Predation 9 1.2.5 Growth and Natural Mortality 9 1.2.6 Reproduction 10
1.3 Stock 12 1.4 Exploitation ofBluefin Tuna 13
1.4.1 Fisheries 13 1.4.2 Bluefin Tuna Catches 15
1.5 New Types of Exploitation 17 1.5.1 Marketing ofBiuefin Tuna 19 1.5.2 Review of the Distribution of Bluefin Tuna Farms 21
1.6 International Commission for the Conservation of Atlantic 22
Tunas 1.6.1 Current Regulations of ICCAT 23 1.6.2 Delineation of Stock 25
1.7 Aims and Objectives 27 1.8 Summary 31
Chapter 2 Biometric Relationships 33 2.1 Introduction 34 2.2 Literature Review 35 2.3 Material and Methods 36 2.4 Results 37 2.5 Discussion 52 2.6 Summary 55
Chapter 3 Age Determination 56 3.1 Introduction 57 3.2 Literature Review 57 3.3 Material and Methods 59 3.4 Results 62 3.5 Discussion 67 3.6 Summary 67
Chapter 4 Assessing the Reproductive Status of Bluefin tuna in the 70 Mediterranean
4.1 Introduction 71 4.2 Literature Review 72 4.3 Material and Methods 74
4.3.1 Reproductive Studies 74 4.3.2 Age at first maturity 79
4.4 Results and Discussions 80 4.4.1 Reproductive Studies 80 4.4.2 Age at first maturity 84
4.5 Summary 88 Chapter 5 The Development of Electronic Tagging Experimentation of 89
Bluefin Tuna in the Mediterranean 5.1 Introduction 90 5.2 Literature Review 90

5.3 Material and Methods 93 5.4 Results I 01 5.5 Discussion 103 5.6 Summary 106
Chapter 6 Innovative Approaches in Stock Identification 107 6.1 Introduction 108 6.2 Literature Review 109 6.3 Material and Methods Ill
6.3.1 Chemical Analysis ofBiuefin Tuna Otoliths Ill 6.3.2 Genetic Studies 117
6.4 Results 120 6.4.1 Chemical Analysis of Bluefin Tuna Otoliths 120 6.4.2 Genetic Studies 122
6.5 Summary 128 Chapter 7 Exploitation Techniques for Bluefin Tuna 129
7.1 Introduction 130 7.2 Exploitation ofBiuefin Tuna 130 7.2.1 Changes in the Fishing Industry 133
7.2.2 Changes in Fishing Gear 135 7.2.3 Changes in Fishing Area 138
7.3 Is Bluefin Tuna Population Being Overexploited? 139 7.4 Difficulties Arising from Tuna Farming 143
7.4.1 Increasing Effort 143 7.4.2 Possibility of Tuna Laundering 144 7.4.3 Body weight increase of farmed tuna 146 7.4.4 Conversion Factors from products to the round weight of Bluefin 147
Tuna 7.4.5 Difficulties in sampling 147 7.4.6 Effects on the Environment 147 7.4.7 Future of Tuna Farming 148
Chapter 8 Discussion, Management Strategies and Recommendations ISO 8.1 Introduction !51 8.2 Stock identification \51 8.3 Management Strategies 155 8.4 Recommendations !59
List of References 162 Appendices on CD Publications on CD
List of Tables
Table 1.1 Characteristics of the bluefin tuna farms present within the Mediterranean Sea 21 Table 2.1 Number of Samples Collected 38 Table 2.2 Mean Fork length and Standard Deviation per Year 42 Table 2.3 Mean Fork Length and Standard Deviation per Country 49 Table 2.4 Length-weight relationship for bluefin tuna caught by several gears and 50
fishing areas Table 2.5 Values for growth curve round weight= a fork length b 51 Table 3.1 A preliminary age-length key prepared for large bluefin tuna ( the fractions 64
represent the number ofbluefin tuna at each age class)' Table 3.2 Values and parameters 64 Table 3.3 Demographic composition of bluefin tuna catch for 1999 in Maltese islands 65
obtained after extrapolating the results to the whole bluefin tuna catch obtained during 1999
Table 4.1 Gonad weight and calculated Gonadsomatic Index for female bluefin tuna 81 observed
Table 4.2 Percentage and frequency of mature and immature bluefin tuna female 84 specimens by size class
Table 5.1 Details of the tagging activities carried out in Malta, July 2004 98 Table 5.2 Table summarising tag returns 102 Table 6.1 Characteristics of the bluefin tuna from which otoliths were extracted 114 Table 6.2 Description of samples collected for study 118 Table 6.3 Samples size, number of haplotypes and molecular diversity indices for each 125
sample and for the entire data set Table 6.4 Results AMOV A pairwise comparison among the three different samples and 126
the previous data from the Mediterranean. Values above diagonal shows the <1>51
and values below its probability.
Table7.1 Total bluefin tuna imports to Japan from tuna fanning by Mediterranean
132 countries during the year 2002 (Miyake, P. estimated from BTSD data)
List of Figures
Fig 1.1
Figl.2 Fig 1.3
Fig I.4
Fig I.5 Fig I.6 Fig 1.7 Fig 1.8 Fig I.9 Fig l.l 0 Fig 2.I Fig 2.2 Fig 2.3 Fig 2.4 Fig 2.5 Fig 2.6 Fig 2.7 Fig 2.8 Fig 2.9 Fig 2.10 Fig 2.11 Fig2.12 Fig 2.I3 Fig 2.I4 Fig 2.I5 Fig 2.I6 Fig 2.I7 Fig 2.I8 Fig 2.I9
Fig 2.20 Fig 3.I
Fig 3.2 Fig 3.3 Fig 3.4
Fig 3.5 Fig 4.1
Fig4.2
Fig4.3
Fig 4.4
Topographic and bathymetric map of the Mediterranean basin (map produced with the OceanMap by combining a number of different data sets) Classification of scombrids Thunnus thynnus (Linaeus, I758) Areas of reproduction for Thunnus thynnus in the Atlantic Ocean and the Mediterranean Sea Stock
3
5 7 I I
I2 Areas of exploitation by different fishing methods I4 Historical evolution ofbluefin tuna catches 16 Average prices of fresh bluefin tuna in the Osaka Market 20 Distribution ofbluefin tuna farming sites in the Mediterranean Sea 22 Separation ofbluefin tuna stocks 27 Main Landing Ports 36 Length measurement ofbluefin tuna 37 No of bluefin tuna caught at each length range- I999 39 No ofbluefin tuna caught at each length range- 2000 40 No ofbluefin tuna caught at each length range- 2001 40 No ofbluefin tuna caught at each length range- 2002 4I No ofbluefin tuna caught at each length range- 2003 4I Historical series of the length classes during each year, I999-2003 42 Length distributions ofbluefin tuna landed by Tunisian traps 44 Length distributions ofbluefin tuna landed by Moroccan traps 44 Length distributions ofbluefin tuna landed by Spanish traps 45 Length distributions ofbluefin tuna landed Libyan traps 45 Length distributions of bluefin tuna landed by Tunisian purseiners 46 Length distributions ofbluefin tuna landed by Spanish purseiners 46 Length distributions ofbluefin tuna landed by Spanish hand lines 47 Length distributions ofbluefin tuna landed by Moroccan hand lines 47 Length distributions ofbluefin tuna landed by Maltese long lines 48 Length distributions of blue fin tuna caught by Libyan longlines 48 Comparison of bluefin tuna length-weight relationships in different regions 50 on the Mediterranean utilising different gears Comparison of results ofthis study with previous studies 51 Map indicating area around the Maltese islands from where bluefin tuna was 60 caught Technique for the extraction of the first dorsal ray 60 Region along dorsal ray from where section has to be taken 61 Length-frequency distribution of bluefin tuna caught by longline fishery 65 around the Maltese islands in 1999 Bluefin tuna dorsal spine sections (annuli clearly visible) 66 Location throughout the Mediterranean From where Buefin Tuna gonads and 79 spines where collected A & B Microphotographs of gonads ofbluefin tuna caught in Malta. Mature 82 spawning BFT female showing hydrated oocytes (Microphotographs taken at the Histological Laboratory ofiEO Malaga, Spain) C & D Microphotographs of gonads of bluefin tuna caught in Malta. Mature 83 female showing atresia and postovulatory follicles (Microphotographs taken at the Histological Laboratory of lEO Malaga, Spain) Microphotographs of gonads of bluefin tuna caught in Malta. Immature 83 female F Mature male (Microphotographs taken at the Histological Laboratory of lEO Malaga, Spain)
Fig4.5 Fig 5.1 Fig 5.2 Fig 5.3 Fig 5.4 Fig 5.5 Fig 5.6 Fig 5.7 Fig 5.8 Fig 6.1 Fig 6.2 Fig 6.3 Fig 6.4
Fig. 6.5
Fig. 6.6
Fig. 6.7
Fig. 7.1 Fig. 7.2
Variation of percentage maturity with size class 85 Overview of the operational research of the tagging project 95 Archival pop up tag 96 Bluefin tuna fattening cage 99 Encircling the bluefin tuna 99 Directing the bluefin tuna onto the stretcher I 00 Lifting the net I 00 Lifting the blue fin tuna I 0 I Pop up locations of tags attached to bluefin tuna 103 Operational Management involved in project 112 Main Locations from where samples were collected 118 A bluefin tuna otolith 121 Box plots of elemental concentrations of otoliths of bluefin tuna collected 122 from the central Mediterranean. Concentrations given in parts per million with the exception of calcium Neighbor-Joining tree using Kimura two-parameters distance of the 12 123 distinct sequences. Numbers in the internal branches showed bootstrap values higher than 75% after I 000 replicates. Clade I, Il and Ill sequences are used as references for their own clades Phylogenetic tree based upon the Neigbour-joining distance of the distinct 124 sequences. The numbers on the branches show bootstrap values exceeding 50% Neighbor-joining tree with Tamura-Nei distance (a= 0.27) of the bluefin tuna 127 haplotypes. Values in the branches. Mediterranean farmed bluefin tuna 131 Baitfish used for feeding farmed bluefin tuna 135

To .my· husbandAidr:ian
~and my dli/Ughters
Krista ~andKyt;a

Acknowledgements
lt is a pleasure that I acknowledge a deep sense of gratitude towards all those who helped
me attain my objectives throughout the project.
I would like to espress my sincere gratitude to Mr. Paul Willerton, my Director of Studies
for his uninterrupted help, support and words of advice throughout the work and research
carried out to complete this project and to Prof. Laurence Mee, my supervisor for his
constant support.
I would like to thank FAO-COPEMED Large Pelagics Project for financing most of the
activities carried out in this project. I wish to express my gratitude and appreciation to Mr.
Jose Miguel de la Sema (Spanish Oceanographic Institute, Malaga, Spain), Dr. Caries Pia
(University of Girona, Spain), Profs. Gregorio de Metrio (Univeristy of Bari, Italy) and Dr.
Jay Rooker (Texas A & M University, USA) for their help and advice during my work and
for allowing me to use their laboratories. I am also obliged to Abdellah Srour (National
Institute for Aquatic Research, Morocco), Abdellah Hattour (National Institute for Marine
Sciences and Technologies, Tunisia) and Dr. Mohammed el Tawil (Marine Biology
Research Centre, Libya) for allowing me to coordinate work with them and gather the
needed information and samples.
Special thanks go to the Maltese observers on board, staff at the Fisheries Conservation
and Control Division (FCCD) and staff of the local farms for their constant collaboration.
I would also like to thank Dr. Anthony Gruppetta, Director General, FCCD for his constant
encouragement.

11 am indebted. to my husband Adfian andr 1his family for >their 'consiani patience,
tmderstamliqg and affection. Finally, rbut not: least ,,, wish to tliank ~y parents' andi ,my
friend Susan, fm · ilieif\consiant support and .encouragement ·especially during ihose' times
when lfeldwotild ne~er'complete this dissertation,
AUTHOR'S DECLARATION
At no time during the registration for the degree of Doctor of Philosophy has the author been registered for any other University award without prior agreement of the Graduate Committee.
Most of this study was financed by FAO-COPEMED Large Pelagics Project. Further details will be given in the appropriate chapters.
A programme of advanced research training was undertaken which included attending various short courses on related aspects of the thesis.
Relevant scientific seminars and conferences were regularly attended at which work was often presented; external institutions were visited for consultation purposes and several papers prepared for publication.
Publications:
Scientific Committee for Research and Statistics (SCRS)/99/93 Report submitted to ICCA T -SCRS on research activities about large pelagics in the Mediterranean Sea in the framework of Project COPEMED. Farrugia, A., de la Sema, J.M., Srour, A., El Tawil, M. & Hattour, A. 839- 846
SCRS/00/108 Preliminary study on the age estimation of bluefin tuna (Thunnus thynnus L.) around the Maltese Islands. Farrugia, A.& Rodriguez-Cabello, C. 771-775
SCRS/00/ 134 Resultados preliminares del proyecto F AO-COPEMED. de la Sema, J.M., Srour, A., Farrugia, A., Hattour, A., El Tawil, M. & Abid, N. 1895-1912
SCRS/01/130 Contribucion del proyecto FAO-COPEMED a la investigacion biologica del atun rojo en el Mediterraneo. de la Serna, J.M., Srour, A., Farrugia, A., Hattour, A., El Tawil, M.
SCRS/0 Ill 64 National Report of Malta, 2000 Farrugia, A. 1768-1770
SCRS/ 02/ National Report of Malta, 2001 Fenech Farrugia, A
SCRS/02/094 Sex-ratio by length-class of bluefin tuna (Thunnus thynnus L.) caught by Maltese Longliners. Farrugia A.
SCRS/02/095 Description of Maltese bluefin tuna (Thunnus thynnus L.) fisheries. Farrugia A.
SCRS/02/096 Revision of historical catches of bluefin tuna made by Maltese longliners. Farrugia A.
SCRS/0211 72 Mitochondrial Genetic Characterization Of Bluefin Tuna (Thunnus thynnus) From Three Mediterranean (Libya, Malta, Tunisia); And One Atlantic Locations (Gulf Of Cadiz). Viiias, J., Pia, C., El Tawil, M., Hattour, A., Farrugia A. & de la Sema, 1. M.
SCRS/02/36 General Review of Bluefin Tuna Farming In The Mediterranean Area. Miyake, P., de la Sema, J.M., Di Natale, A., Farrugia, A., Katavic, 1., Miyabe, N. & Ticina, V.
SCRS/03/048 Revision of Historical Catches of Swordfish made by Maltese Longliners. A. Fenech Farrugia.
SCRS/03/049 Description of Swordfish Bycatches made with Bluefin Tuna Longlines near Malta during 2002. Fenech Farrugia, A, de la Sema, J.M. & Ortiz de Urbina, J.M.
SCRS/03/138 By-catch de la pesqueria de palangre de superficie dirigido al at(m rojo (Thunnus thynnus) en el mediternlneo centro-oriental. Farrugia, A., El Tawil, M., de la Sema, J. M. & Macias, D.
SCRS/03/ instruction for entry to the National Report Form on Current Bluefin Farming Practices in the Mediterranean
SCRS/03/ Cooperation between Italy, Malta and Copemed in the bluefin tuna tagging using electronic archival pop/up tags.
SCRS/ 03/ National Report of Malta 2002 A. Fenech Farrugia
SCRS/04/ National Report of Malta, 2004 A. Fenech Farrugia
Size and age at sexual maturity in female bluefin tuna (Thunnus thynnus L. 1758) from the Mediterranean Sea. Corriero, A., Karakulak, S., Santamaria, N. Deflorio, M., Addis, P., Desantis, S., Cirillo, F., Fenech Farrugia, A., Vassallo, R., de la Sema, J. M. Oray, I., Cau, A & de Metrio, G.
Presentation and Conferences Attended:
- Since 1999 attended annually the Scientific Committee for Research and Statistics of ICCAT as the scientific representative for Malta.
- Regularly attended working groups and annual meetings of the COPEMED Large Pelagics Project since nominated National Coordinator for this project.
- Regularly attended working groups and annual meetings of the EU Project Reprodott (Fisheries) (Domestication of Thunnus thynnus, the bluefin tuna- strategies for European development in the context of a global market).
- Regularly attended meetings of the Ad Hoc GFCMIICCA T working group on sustainable tuna farming/fattening practices in the Mediterranean since nominated rapporteur
- Invited as a speaker in the first ReproDott Conference held between the 4- 8111 February, 2002 in Cartagena, Spain
- Invited as a speaker in the Euro-Mediterranean conference for the marine environment held between the 12- 14'" September, 2003 in Tunis, Tunisia
External Contacts:
Dr. Victor Restrepo, Chief Scientist, ICCAT Dr. Julie Porter, Scientific Editor, ICCAT Papa Kebe, Chief Statistician, ICCAT Rafael Robles, Director COPEMED Jose Miguel de la Serna, Coordinator of FAO COPEMED Large Pelagics Project Dr. David Macias, Consultant on Histology, lEO Malaga, Spain Jose Maria Ortiz de Urbina, Consultant on Stock Studies, lEO Malaga, Spain Abdellah Hattour, Chief Scientist on Large Pelagics, Tunisia Mohammed el Tawil, Chief Scientist on Large Pelagics, Libya Abdellah Srour, Chief Scientist on Large Pelagics, Morocco Dr. Caries Pia, University ofGirona, Spain Dr. Peter Miyake, Consultant on Large Pelagics, Japan Profs. Gregorio de Metrio, Consultant on Large Pelagics, University of Bari, Italy Dr. Jay Rooker, Assistant Professor of Marine Biology, Texas A & M University at Galveston Juan Antonio Caminas, Director lEO Malaga, Spain Antonio Garcia, Coordinator of ReproDott Project Isik Oray, Chief Scientist on Large Pelagics, Turkey Dr. Jean Marc Fromentin, IFREMER, France Alessandro Lovatelli, GFCM
Word count of main body of thesis: 32,880
Signed:
Date: 141h November 2005

.IN'ifRODHCTllON
1.1 The Mediterranean Sea
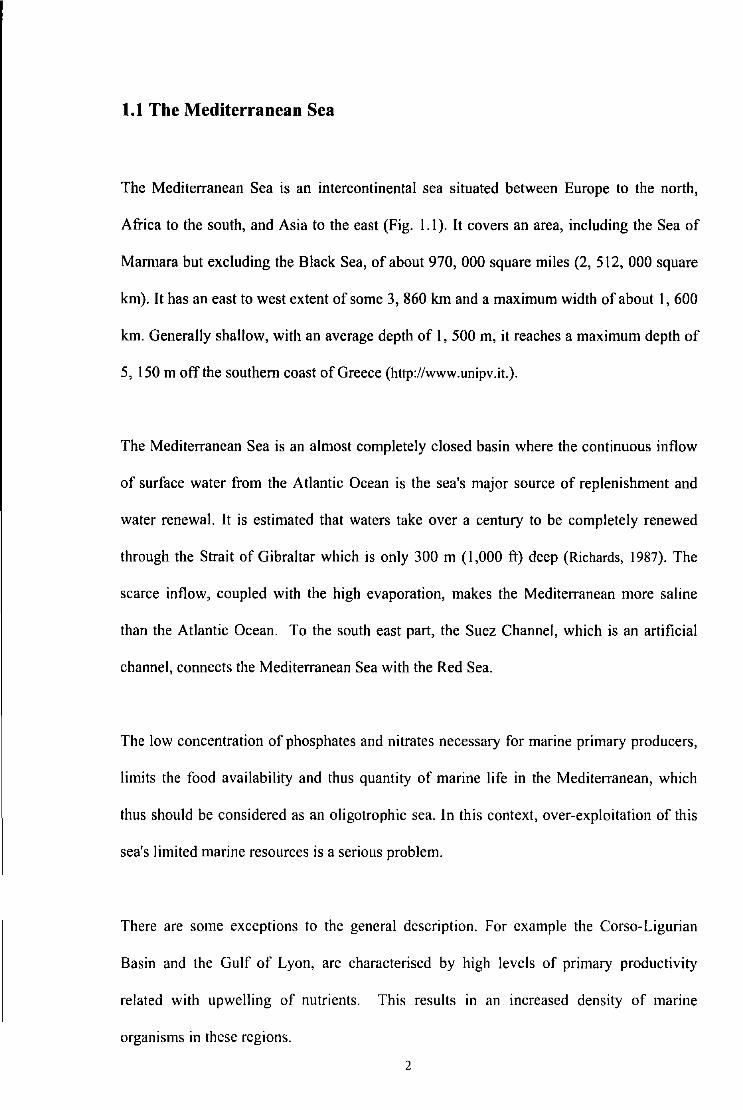
The Mediterranean Sea is an intercontinental sea situated between Europe to the north,
Africa to the south, and Asia to the east (Fig. 1.1). It covers an area, including the Sea of
Marrnara but excluding the Black Sea, of about 970, 000 square miles (2, 512, 000 square
km). It has an east to west extent of some 3, 860 km and a maximum width of about I, 600
km. Generally shallow, with an average depth of I, 500 m, it reaches a maximum depth of
5, !50 m off the southern coast of Greece (http://www.unipv.it.).
The Mediterranean Sea is an almost completely closed basin where the continuous inflow
of surface water from the Atlantic Ocean is the sea's major source of replenishment and
water renewal. It is estimated that waters take over a century to be completely renewed
through the Strait of Gibraltar which is only 300 m (I ,000 ft) deep (Richards, 1987). The
scarce inflow, coupled with the high evaporation, makes the Mediterranean more saline
than the Atlantic Ocean. To the south east part, the Suez Channel, which is an artificial
channel, connects the Mediterranean Sea with the Red Sea.
The low concentration of phosphates and nitrates necessary for marine primary producers,
limits the food availability and thus quantity of marine life in the Mediterranean, which
thus should be considered as an oligotrophic sea. Jn this context, over-exploitation of this
sea's limited marine resources is a serious problem.
There are some exceptions to the general description. For example the Corso-Ligurian
Basin and the Gulf of Lyon, are characterised by high levels of primary productivity
related with upwelling of nutrients. This results in an increased density of marine
organisms in these regions.
2
Atlantic Ocean
l
AFRICA Mediterranean Sea
]()() ml
]()()km EoPc
Fig 1.1 Map of the Mediterranean Sea (http://www.unipv.it)
1.2 General Remarks on Scombrids
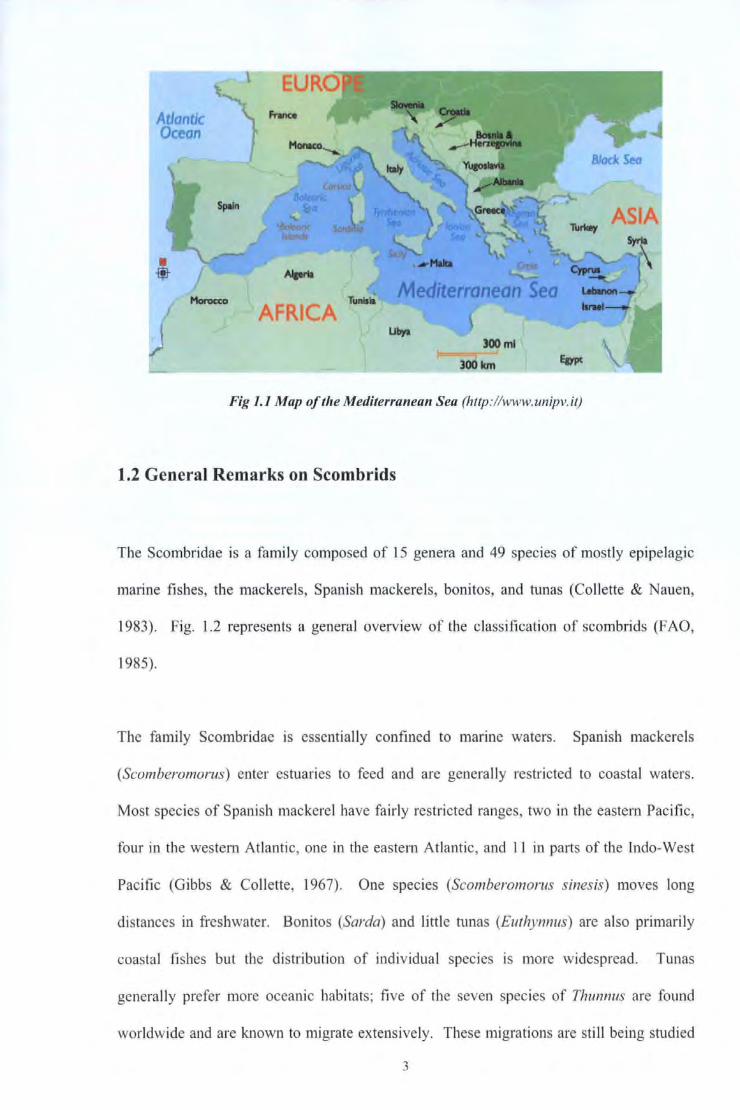
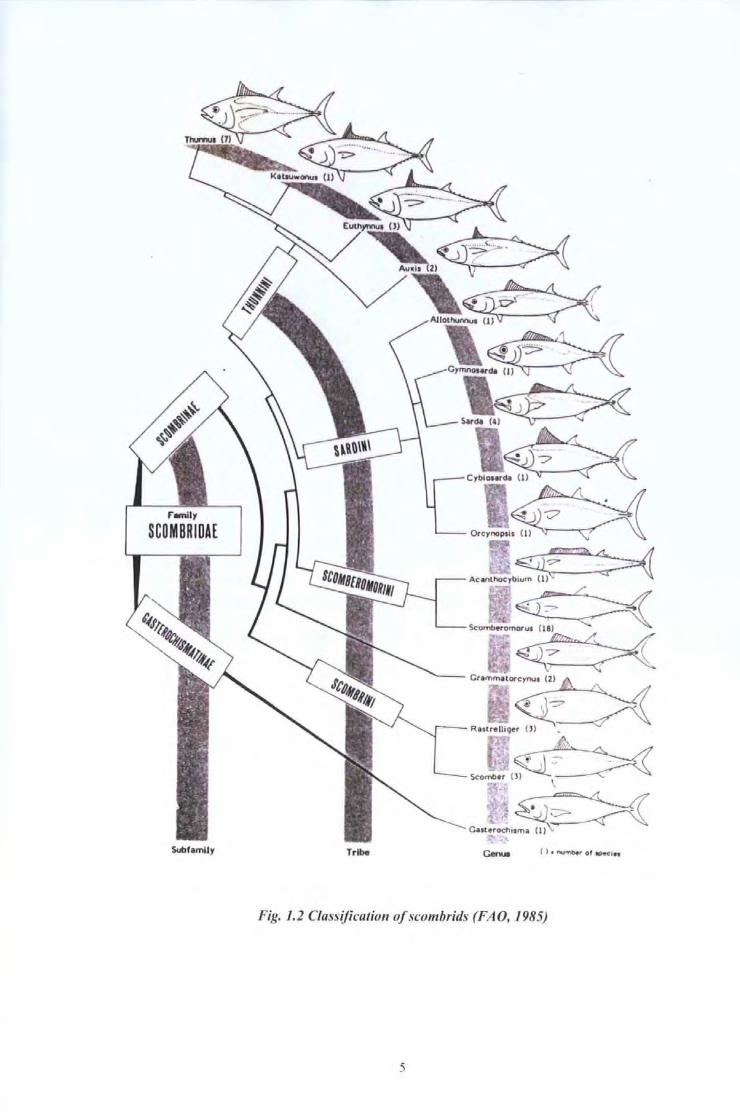
The Scombridae is a family composed of 15 genera and 49 species of mostly epipelagic
marine fishes, the mackerels, Spanish mackerels, bonitos, and tunas (Collette & Nauen,
1983). Fig. 1.2 represents a general overview of the classification of scombrids (FAO,
1985).
The family Scombridae is essentially confined to manne waters. Spaillsb mackerels
(Scomberomorus) enter estuaries to feed and are generally restricted to coastal waters.
Most species of Spanish mackerel have fairly restricted ranges, two in the eastern Pacific,
four in the western Atlantic, one in the eastern Atlantic, and 11 in parts of the lndo-West
Pacific (Gibbs & Collette, 1967). One species (Scomberomorus sinesis) moves long
distances in freshwater. Bonitos (Sarda) and little tunas (Euthynnus) are also primarily
coastal fishes but the distribution of individual species is more widespread. Tunas
generally prefer more oceanic habitats; five of the seven species of Thunnus are found
worldwide and are known to migrate extensively. These migrations are still being studied
3

in detail in order to determine their nature, i.e. whether they occur randomly or else if they
follow regular annual cycles.
Scombrids are dioecious (separate sexes) and most display little or no sexual dimorphism
in structure or colour pattern. Females of many species attain larger sizes than males.
Batch spawning of most species takes place in tropical and subtropical waters, frequently
inshore. The eggs are pelagic and hatch into planktonic larvae.
Scombrids are active predators. The mackerels (Scomber and Rastrelliger) filter plankton
out of the water with their long gillrakers. The Spanish mackerels, bonitos and tunas feed
on larger prey, small fishes, crustaceans and squids. The main predators of smaller
scombrids are other predacious fish, particularly larger scombrids and billfishes.
4
SYbfamUy Tribe
~ Acanthoc:yboum (I)
~ ~~~
Rastrelliqer () ) ,
~ Scorrber (~\~
'~ Cast:;oeho~~~
Fig. 1.2 Classification ofscombrids (FAO, 1985)
5

Mackerels and tunas support very important commercial and recreational fisheries as well
as substantial artisanal fisheries throughout the tropical and temperate waters of the world.
Many species of tunas and mackerels are the target of long-distance fisheries.
The principal fishing methods used for fish schooling near the surface include purse
seining, drift netting, hook and line/bait boat fishing and trolling. Recreational fishing
methods involve mostly surface trolling and pole and line fishing, while numerous
artisanal fisheries deploy a great variety of gear including bag nets, cast nets, lift nets, gill
nets, beach seines, hook and line, hand lines, harpoons, specialised traps and fish corrals.
Virtually all scombrids are highly appreciated fish for their high quality flesh. While
mackerels and Spanish mackerels are marketed fresh, frozen, canned, smoked and salted,
most of the catch of tunas is canned, though they may also be marketed fresh to Asian
countries. The high price paid for premium meat of bluefin tuna in the sashimi markets is
continuously attracting interest for tuna fishing.
As a result of increasing fuel pnces, more sophisticated spotting methods have been
introduced in scombrid fisheries for the purpose of reducing expensive search time. Such
methods include satellite imagery, airplane spotting and more efficient use of monthly
surface temperature charts and other hydrographical information that can now more
reliably be applied with our increased understanding of the correlation between
environmental parameters and scombrid behaviour. With satellite imagery, sea surface
data of many sorts including temperature, chlorophyll, etc. is available several times a day.
6

1.2.1 Thunnus thynnus (Linoaeus, 1758)
Fig. 1.3 shows the appearance of a bluefin tuna which is classified as follows:
Phylum Chordata
Class Osteichthyes
Order Perciformes
Fami ly Scornbridae
Genus Thunnus
Species thy nnus
Fig 1.3 Thumms thymws (Limraeus, 1 758)(FAO, 1985)
1.2.2 Taxonomy and Morphology
The bluefin tuna is a very large species that commonly reaches lengths greater than 200 cm
weighing several hundred kilograms (Colette & Nauen, 1983). The all tackle angling
record is a 304 cm bluefin tuna weighing 679 kg caught in 1979 off Nova Scotia (IG FA,
1995).
7

The colour of the back of the bluefin tuna is a dark metallic blue. The lower sides and the
belly are silvery white with colourless transverse lines alternated with colourless dots. The
first dorsal fin is yellow or bluish, the second is reddish brown. The anal and dorsal fin lets
are dusky yellow edged with black whilst the median caudal keel is black in adults
(ICCAT, 1978; Cort, 1980).
The bluefin tuna is deepest near the middle of the first dorsal fin base. The second dorsal
fin is higher than the first one. The pectoral fins are short ( 17 to 21% of fork length).
They never reach the inter space between the dorsal fins.
Internal distinctive features of the bluefin tuna include 34 to 43 gill rakers on the first arch.
The ventral surface of the liver is striated whilst a swimbladder is absent. 39 vertebrae are
present i.e. 18 precaudal plus 21 caudal (Colette & Nauen, 1983).
1.2.3 Ecology
The northern bluefin tuna is an epipelagic species, usually oceanic but seasonally coming
close to shore and living in temperate waters (Colette & Nauen, 1983). Adult northern
bluefin tuna tolerate a wide range of temperatures from 6°C to 30°C (Sharp & Dizon, 1978)
and the highest catches are made in waters between l5°C and 22°C (Rivas, 1978).
It has been generally assumed by ICCA T {International Commission for the Conservation
of Atlantic Tunas) that separate stocks inhabit the western Atlantic and the eastern Atlantic
and Mediterranean Sea. Up to a size of 40 to 80 kg, northern bluefin tunas school by size,
sometimes together with albacore, yellowfin, bigeye, skipjack or frigate tuna (Colette &
Nauen, 1983).
8

Giant bluefin tuna (reaching a weight of between 200 and 600 kilograms) exhibit in some
cases, a rigidly defined school structure, whose degree of organisation and rules are
functions of the number of individuals in the school. According to Partridge et al., ( 1983),
the bluefin tuna schools can form a parabolic shape school when hunting that suggests co
operative predation.
1.2.4 Feeding and Predation
Bluefin tunas feed on a large variety of prey, and this variation in the food spectrum is
mainly attributed to behavioural differences (Colette & Nauen, 1983).
On one hand, bluefin tunas can exhibit a chasing behaviour where preys such as small
schooling fishes (anchovies, sauries, hakes) or squids are vigorously chased by either
isolated fish or a structured school. On the other hand, bluefin tunas can exhibit a modified
filter feeding behaviour to feed on crabs and other less agile organisms (Colette & Nauen,
1983).
Bluefin tuna are usually preyed on by killer whales, pilot whales and black fish (Colette &
Nauen, 1983).
1.2.5 Growth and Natural Mortality
Atlantic bluefin tuna can grow to over 300 cm and reach 600 kg. ICCAT have reported that
bluefin tuna from the westem Atlantic grow more slowly but generally reach a larger
maximum size (ICCAT, 1996).
9
The oldest age considered reliable is 30 years, based on an estimated age of 2 years at
tagging and about 28 years at liberty, although it is believed that bluefin tuna may live to
older ages (ICCA T, 1996).
Until 1990, annual natural mortality rate was assumed to be 0.1 for assessment purposes
for western Atlantic bluefin tuna and 0.18 for eastern Atlantic bluefin tuna including the
Mediterranean (Clay, 1991).
1.2.6 Reproduction
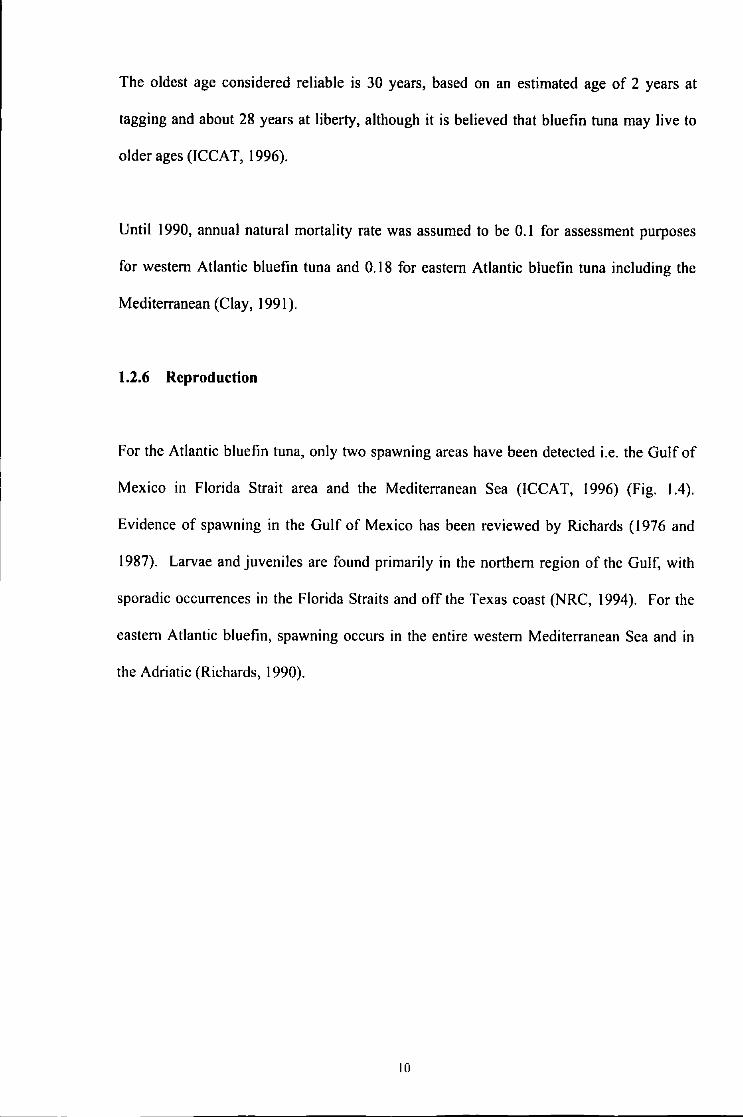
For the Atlantic bluefin tuna, only two spawning areas have been detected i.e. the Gulf of
Mexico in Florida Strait area and the Mediterranean Sea {ICCAT, 1996) (Fig. 1.4).
Evidence of spawning in the Gulf of Mexico has been reviewed by Richards (1976 and
1987). Larvae and juveniles are found primarily in the northern region of the Gulf, with
sporadic occurrences in the Florida Straits and off the Texas coast (NRC, 1994). For the
eastern Atlantic bluefin, spawning occurs in the entire western Mediterranean Sea and in
the Adriatic (Richards, 1990).
10
No1ilt ~ Amrrka/
AtlaJttic
Q kf\OWI'I area of reprodutllon
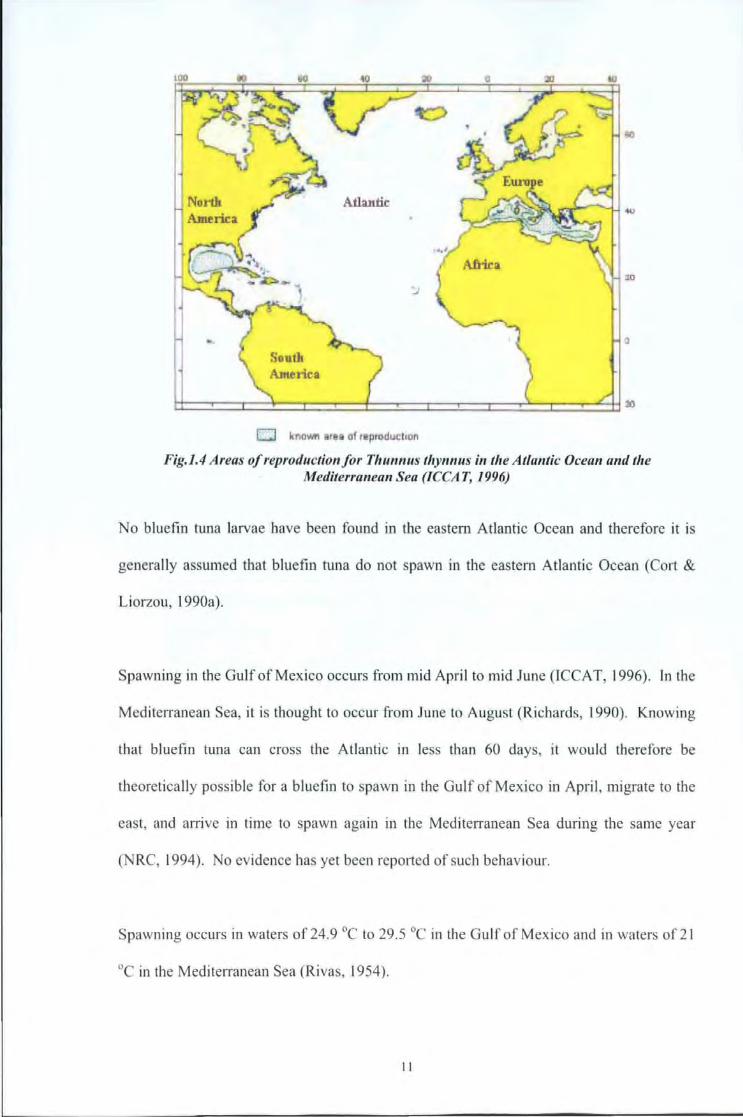
Fig.J.4 Areas of reproduction for Thunnus thymws in the Atlantic Ocean and the Mediterranean Sea (ICCAT, 1996)
No bluefin tuna larvae have been found in the eastern Atlantic Ocean and therefore it is
generally assumed that bluefin tuna do not spawn in the eastern Atlantic Ocean (Cort &
Liorzou, l990a).
Spawning in the Gulf of Mexico occurs from mid April to mid June (I CCA T, 1996). In the
Mediterranean Sea, it is thought to occur from June to August (Richards, 1990). Knowing
that bluefin tuna can cross the Atlantic in less than 60 days, it would therefore be
theoretically possible for a bluefin to spawn in the Gulf of Mexico in April, migrate to the
east, and arrive in time to spawn again in the Mediterranean Sea during the same year
(NRC, 1994). No evidence has yet been reported of such behaviour.
Spawning occurs in waters of 24.9 °C to 29.5 °C in the Gulf of Mexico and in waters of 2 1
°C in the Mediterranean Sea (Rivas, 1954).
11
1.3 Stock
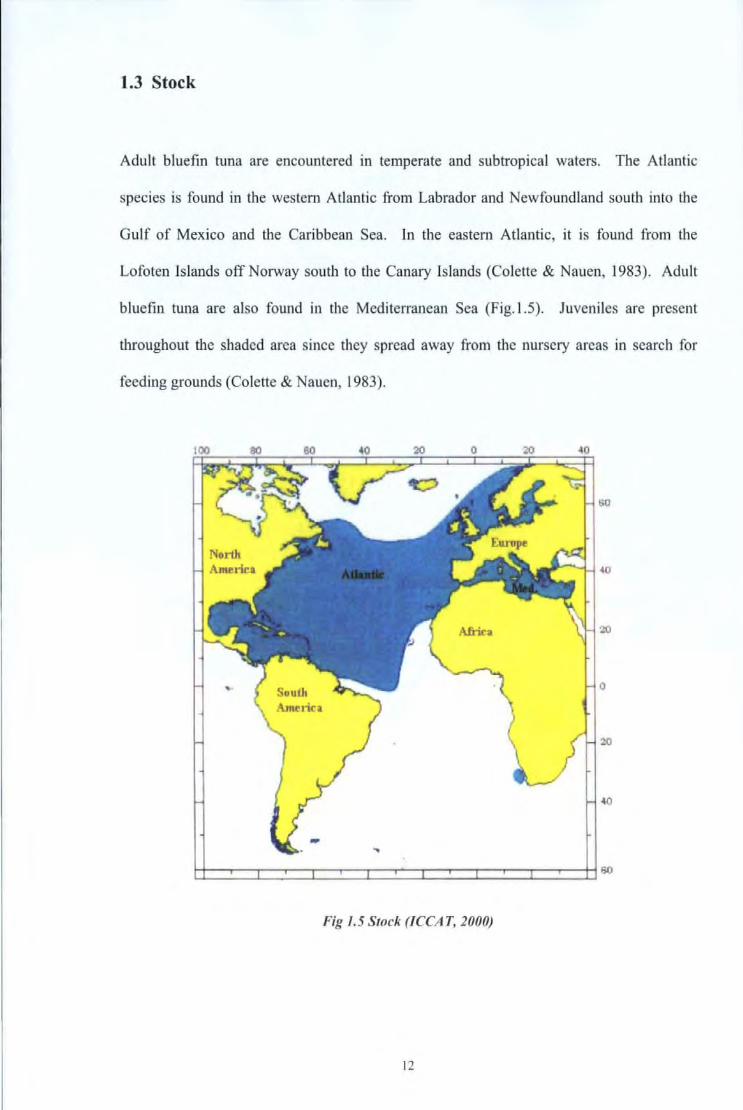
Adult bluefin tuna are encountered in temperate and subtropical waters. The Atlantic
species is found in the western Atlantic from Labrador and Newfoundland south into the
Gulf of Mexico and the Caribbean Sea. ln the eastern Atlantic, it is found from the
Lofoten Islands off Norway south to the Canary Islands (Colette & Nauen, 1983). Adult
bluefin tuna are also found in the Mediterranean Sea (Fig.l .5). Juveniles are present
throughout the shaded area since they spread away from the nursery areas in search for
feeding grounds (Colette & Nauen, 1983).
Fig 1.5 Stock (ICCAT, 2000)
12
In the western Atlantic, juveniles are thought to occur in the summer over the continental
shelf, primarily from about 34 "N to 41 OW and offshore of that area in the winter (ICCAT,
1996).
1.4 Exploitation of Bluefin Tuna
1.4.1 Fisheries
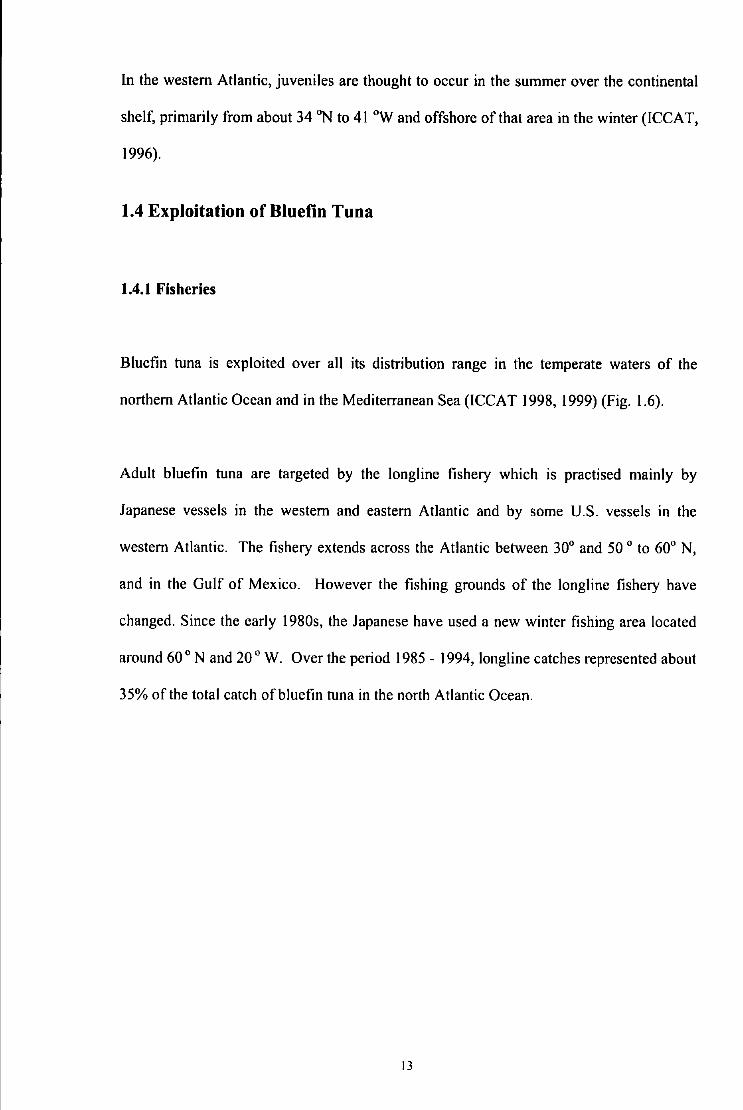
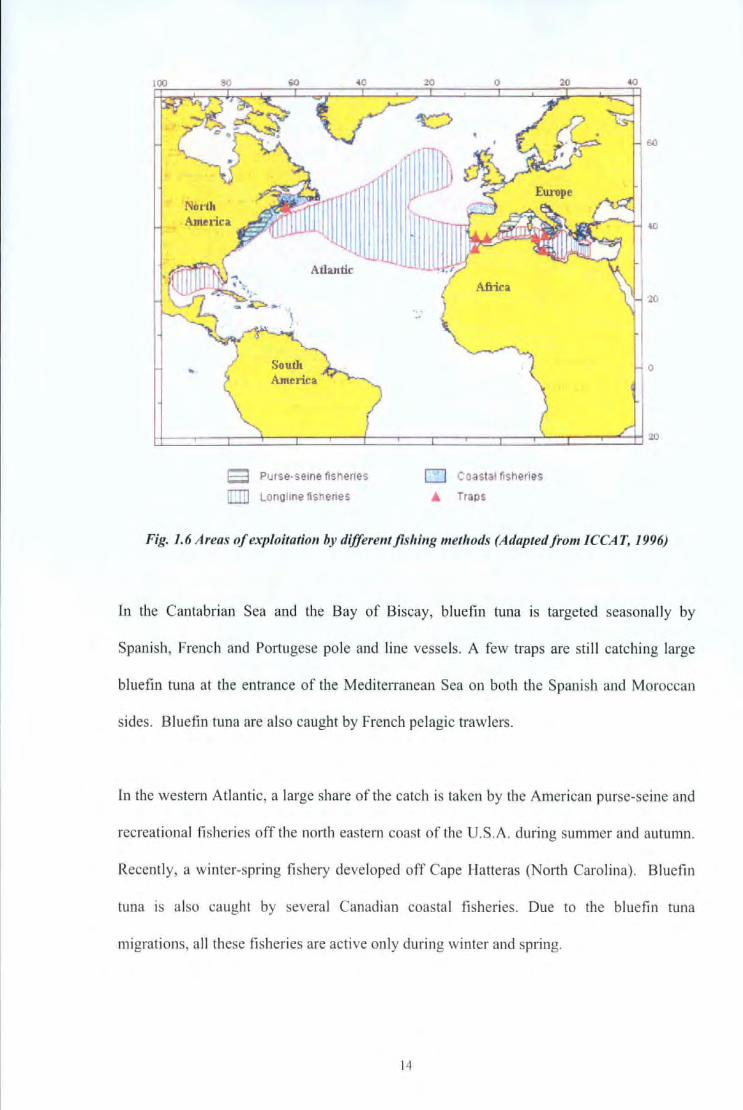
Bluefin tuna is exploited over all its distribution range in the temperate waters of the
northern Atlantic Ocean and in the Mediterranean Sea (ICCA T 1998, 1999) (Fig. 1.6).
Adult bluefin tuna are targeted by the longline fishery which is practised mainly by
Japanese vessels in the western and eastern Atlantic and by some U.S. vessels in the
western Atlantic. The fishery extends across the Atlantic between 30° and 50 o to 60° N,
and in the Gulf of Mexico. However the fishing grounds of the longline fishery have
changed. Since the early 1980s, the Japanese have used a new winter fishing area located
around 60 oN and 20 o W. Over the period 1985 - 1994, long1ine catches represented about
35% of the total catch ofbluefin tuna in the north Atlantic Ocean.
13
Not1h Amuira
9 Purse·seme fishenes
[]] Longllne lisnenes
20 0
0 Coastal fishenes
A Traps
60
to
0
Fig. 1. 6 Areas of exploitatio11 by differel1t fiShing methods (Adapted from ICCAT, 1996)
In the Cantabrian Sea and the Bay of Biscay, bluefin tuna is targeted seasonally by
Spanish, French and Portugese pole and line vessels. A few traps are still catching large
bluefm tuna at the entrance of the Mediterranean Sea on both the Spanish and Moroccan
sides. Bluefm tuna are also caught by French pelagic trawlers.
In the western Atlantic, a large share ofthe catch is taken by the American purse-seine and
recreational fisheries off the north eastern coast of the U.S .A. during summer and autumn.
Recently, a winter-spring fishery developed off Cape Hatteras (North Carolina). Bluefin
tuna is also caught by several Canadian coastal fisheries. Due to the bluefin tuna
migrations, all these fisheries are active only during winter and spring.
14
Two migrations have been identified in the Mediterranean. The first is known as the
forward or genetic migration. This allows bluefin tuna to move into the spawning grounds
and lasts from April to June. The second migration is known as the reverse or trophic
movement. This migration extends from July till October and during this period the tuna is
very active in search of food (COPEMED Annual Report, 2002).
1.4.2 Bluefin Tuna Catches
Because bluefin tuna come very close to shore and because of the quality of its flesh, its
exploitation is very old and has been described during the period of the Roman Empire. At
this time, bluefin tuna were caught in the Mediterranean Sea and around the Strait of
Gibraltar by traps and by nets thrown from vessels (COPEMED Annual Report, 2000).
During the mid-201h century, the catch of spawnmg bluefin tuna by Atlantic and
Mediterranean traps have decreased with the disappearance of the traps due to the
inefficiency of this gear compared to other methods. Also, traps target tunas which move
very close to land but nowadays, mainly due to climatic changes (COPEMED Annual
Report, 2002), bluefin tuna is not approaching as close to the shore as before.
Purse seine, longline and pole and line fisheries, which catch more juveniles than adults,
have continued to develop.
In the northeast Atlantic, purse seine fishery is predominantly used to catch bluefin tuna.
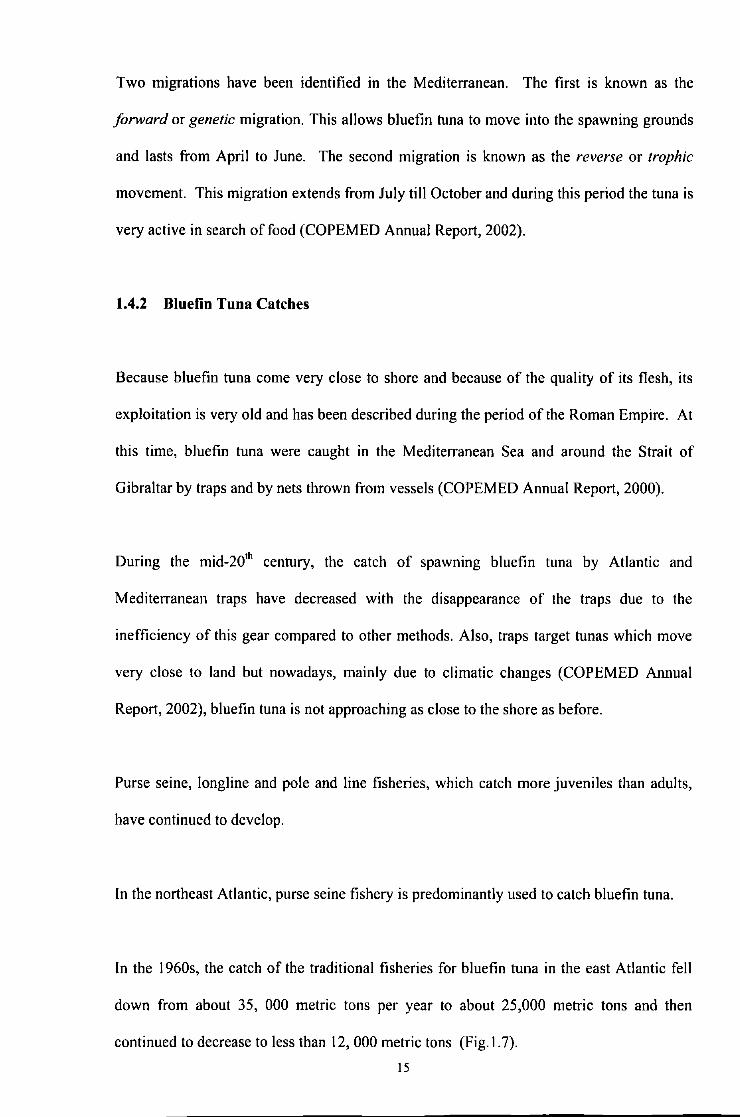
In the 1960s, the catch of the traditional fisheries for bluefin tuna in the east Atlantic fell
down from about 35, 000 metric tons per year to about 25,000 metric tons and then
continued to decrease to less than 12, 000 metric tons (Fig. I. 7).
15
-Total
---AT.E+MED
-.-AT.W
20000
10000
Fig. 1. 7 Historical evo/utiou of b/uefin tuna catches (ICCAT, 2005)
Since then, the share of the catch realised by the longline fishery has slightly increased
(about 2,500 to 3,000 metric tons since 1991 ). Landings by traps have remained at a low
level, the amount of bluefin tuna caught by other gears (as target species or as by catch)
has increased whilst the amount of bluefin tuna caught by purse seines has increased
significantly.
The pole and line fishery has remained stable since 1960 at about 2,500 metric tons per
year.
In the western Atlantic, catch of bluefin tuna rapidly increased with the development of the
longline fishery. Bluefin catch by the surface fisheries of the western Atlantic, have
remained at a similar level since 1960 (around 2,000 metric tons per year) wi th however, a
maximum in the beginning of the 1970s.
The Mediterranean Sea is characterised by a variety of vessel types and fishing gears with
many landing sites located in 17 coastal states. With such a large number of landing sites,
16
the statistics are difficult to obtain and their reliability sometimes questionable. Historical
statistics show that there were important catches through the last millenia with the most
ancient gear being the trap. Other fisheries, like the purse seine fishery emerged in the
1960s. Based on estimates of 1995 - 2000 catches, the greater proportion of the catch was
from purse seine and longline for the Mediterranean. Nowadays, the purse seine fleet
accounts for 60- 80% of the Mediterranean catch (WWF, 2004).
In 2002, ICCAT carried out its most recent stock assessment. In 2001, landings for the
East Atlantic and Mediterranean amounted to 34, 563 metric tons, which is less than 1998
(39, 097 metric tons) and slightly more than or similar to 1999 and 2000 (32, 454 and 37,
752 metric tons respectively).
1.5 New Types of Exploitation
A new expanding practice in the Mediterranean is tuna farming. The concept of farming is
very different from that of aquaculture. In the case of aquaculture species, the whole cycle
would have been closed. This means that the broodstock are able to spawn in captivity and
that the larvae obtained can be grown until they reach the adult size. In the case of bluefin
tuna, the cycle has not yet been closed since spawning has been achieved to some degree in
captivity but not growth of the larvae to the adult size.
Tuna farming is defined as the rearing of bluefin tuna in cages in order to increase
commercial value by increasing its fat content. There have been several trials of bluefin
aquaculture, in which case, tuna are kept for few years (between 3 to 5 years) in a cage
until they reach a good commercial size.
17
Tuna fanning started in Canada in the late 1960s by a Japanese company (Miyake et al.,
2003). The fanning was motivated by a highly specialised and categorised Japanese tuna
market, where bluefin tuna have the highest commercial value if the meat contains proper
fat contents. In the past, the highest value attached to such a bluefin tuna was about U.S.
$900 per kilogram at the Tsukiji fish market (more commonly sold at U.S. $200 to 300 per
kg). This tuna is sold for the preparation of sashimi. On the other hand, daily in the same
market, a large quantity of lean bluefin tuna are sold for just a few dollars per kg. Thus the
idea was to convert the lean cheap tuna into fat tuna for sashimi commanding the higher
pnce.
Originally, large but lean bluefin tuna (generally post-spawning) captured by the trap
fishery were kept in a cage (pen) for a few months during which period bait fish are fed to
tuna to increase fat contents. Almost all these tuna were shipped to the Japanese market,
particularly at the time the price is peaked (i.e. towards the end of the year). In this way,
the tuna value increases more than hundred fold during a few months (Miyake et al.,
2002).
In the Mediterranean Sea, the tuna fanning industry started in late 1970s in Ceuta (near
Gibraltar). Until the 1980s, the small to medium (under 120 kg) sized tuna caught in the
Mediterranean by purse seiners were sold at the local market at a price range much less
than the prime large tunas which were exported to the sashimi market, mainly because of
the lower fat contents and the less brilliant red colour of the flesh. However, it was
discovered in late 1980s that even those medium sized tuna could be sold for a reasonably
good price if the fat contents were high.
In the mean time, the southern bluefin tuna of the medium size caught by the Australian
purse seine fishery went into the fanning in the 1980s. These products established a
18

completely new market in Japan. Stimulated by the success of southern bluefin farming,
the Japanese farms started a similar type of farming operations in the Mediterranean Sea in
the mid 1990s. The concept of this new type of farming involves the transfer of live tuna
caught by purse seiners into cages. Purse seiners are the only mobile gear able to capture
bluefin tuna alive. This feature makes purse seiner fleets an essential factor to the tuna
farming industry. This new type of farming has spread very rapidly throughout the
Mediterranean and is now carried out in various countries and the quantities are increasing
very rapidly as well (Miyake et al., 2003).
Consequently bluefin tuna farming has a lot of socio-economic impact on the
Mediterranean tuna fishing industry and the Japanese market. It also has impact on stock
management.
1.5.1 Marketing of bluefin tuna
Bluefin tuna is regarded as a high grade product in Japan and is involved in an unusual
marketing system, by seafood standards. Each fish is individually inspected for various
attributes before being flown to Japan for the fresh tuna market. The consumption of
bluefin tuna depends strongly on the specific Japanese culture. It is almost exclusively
eaten raw in Japan. The four basic attributes on which fresh bluefin tuna traders rely to
measure product quality are the freshness, fat content, colour and shape of the individual
fish. Auction market officials in Japan grade these attributes from A - E (A representing
the highest and E the lowest possible grade) to assist Japanese wholesale buyers in their
purchasing (Carroll, Anderson & Martinez-Garmendia, 200 I).
In 200 I, Mediterranean farmed tuna for the frozen market were selling at 20 - 40 Euros
per kg. Fig. 1.8 gives the average prices of fresh bluefin tuna in the Osaka market during
19
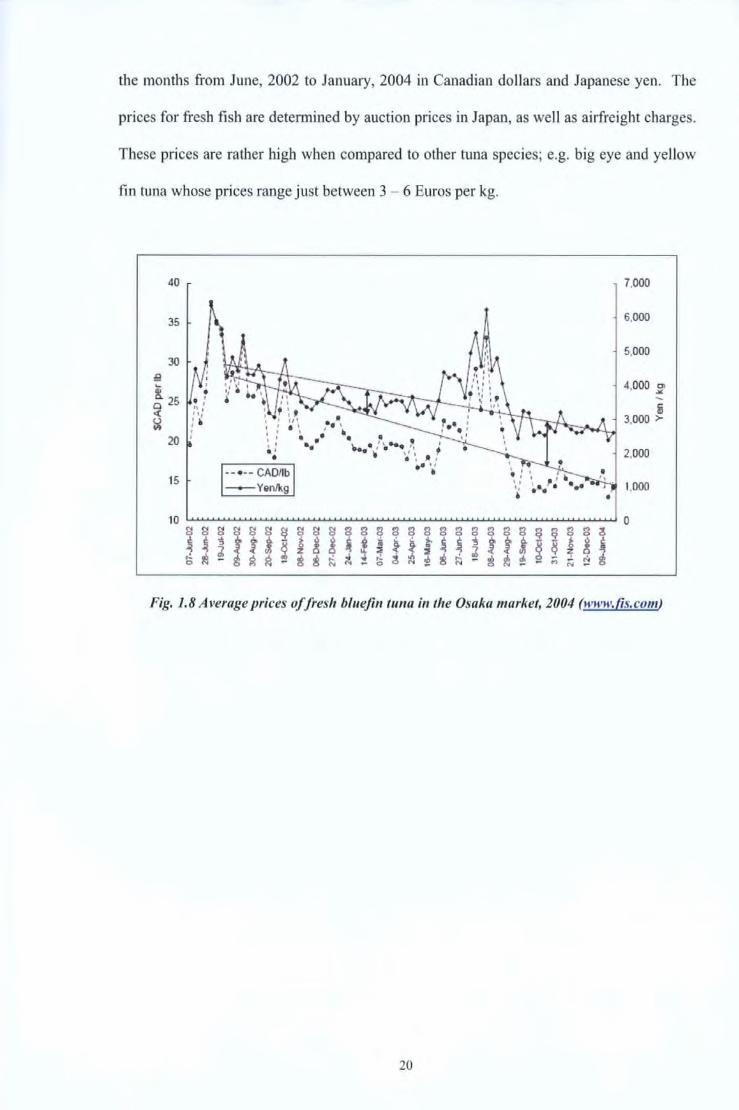
the months from June, 2002 to January, 2004 in Canadian dollars and Japanese yen. The
prices for fresh fish are determined by auction prices in Japan, as well as airfreight charges.
These prices are rather high when compared to other tuna species; e.g. big eye and yellow
fin tuna whose prices range just between 3 - 6 Euros per kg.
40 7,000
35 6,000
30 5,000
~ ... 8. 25 0 c(
~
4,000 Jf -i 3,000 >
20 2,000
15 1,000 •
10 0 s s s ~ ~
'5
s J.
Fig. 1.8 Average prices of fresh bluefin tuna in the Osaka market, 2004 (www.{is.com)
20
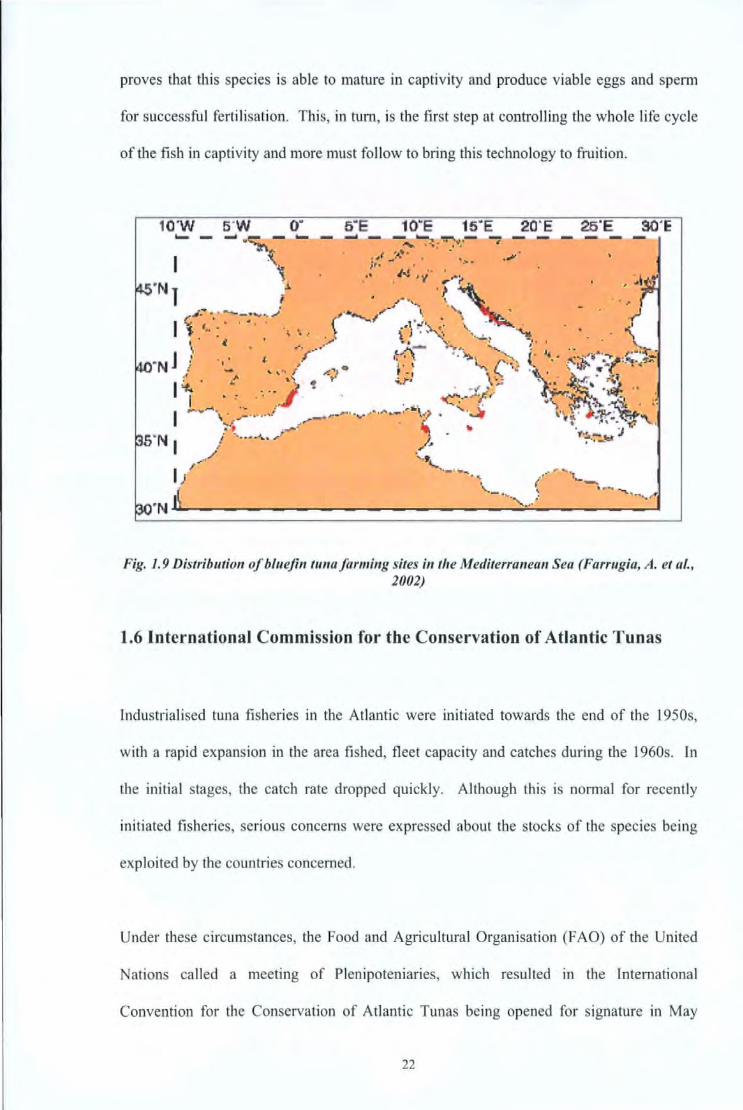
1.5.2 Review of the distribution of bluefin tuna farms
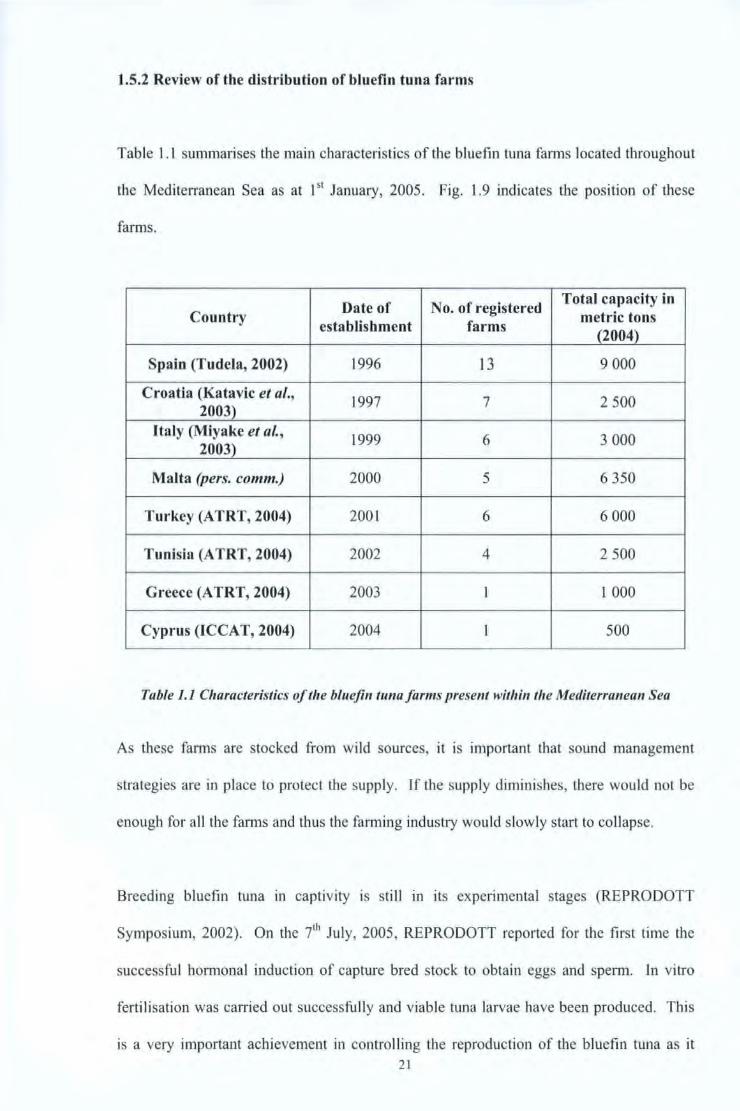
Table l . l summarises the main characteristics of the bluefin tuna farms located throughout
the Mediterranean Sea as at 151 January, 2005. Fig. 1.9 indicates the position of these
farms.
Date of No. of registered Total capacity in
Country metric tons establishment farms
(2004)
Spain (Tudela, 2002) 1996 13 9 000
Croatia (Katavic et al., 1997 7 2 500
2003) Italy (Miyake et al.,
1999 6 3 000 2003)
Malta (pers. comm.) 2000 5 6 350
Turkey (ATRT, 2004) 200 1 6 6 000
Tunisia (A TRT, 2004) 2002 4 2 500
Greece (A TRT, 2004) 2003 1 1 000
Cyprus (ICCAT, 2004) 2004 I 500
Table 1.1 Characteristics of the bluefin tuna farms present within the Mediterranean Sea
As these farms are stocked from wild sources, it is important that sound management
strategies are in place to protect the supply. If the supply diminishes, there would not be
enough for all tbe farms and thus the farm ing industry would s lowly start to collapse.
Breeding bluefin tuna in captivity is still in its experimental stages (REPRODOTT
Symposium, 2002). On the t 11 July, 2005, REPRODOTT reported for the first time the
successful hormonal induction of capture bred stock to obtain eggs and sperm. In vitro
fert il isation was carried out successfully and viable tuna larvae have been produced. This
is a very important achievement in controlling the reproduction of the bluefin tuna as it 21
proves that this species is able to mature in captivity and produce viable eggs and sperm
for successful fertilisation. This, in turn, is the first step at controlling the whole life cycle
of the fish in captivity and more must follow to bring this technology to fruition.
Fig. 1. 9 Distribution of bluefin tuna farming sites in the Mediterranean Sea (Farrugia, A. et al., 2002)
1.6 International Commission for the Conservation of Atlantic Tunas
Industrialised tuna fisheries in the Atlantic were initiated towards the end of the 1950s,
with a rapid expansion in the area fished, fleet capacity and catches during the 1960s. ln
the initial stages, the catch rate dropped quickly. Although this is normal for recently
initiated fisheries, serious concerns were expressed about the stocks of the species being
exploited by the countries concerned.
Under these circumstances, the Food and Agricultural Organisation (FAO) of the United
Nations called a meeting of Plenipoteniaries, which resulted in the international
Convention for the Conservation of Atlantic Tunas being opened for signature in May
22
1966, in Rio de Janeiro, Brazil. A Commission, the International Commission for the
Conservation of Atlantic Tunas (ICCAT) was established under this Convention.
The Convention came into effect in 1969, after being ratified by seven signatory countries.
The first Commission meeting was held in Rome in December, 1969, and the Secretariat
was established in Madrid, at the invitation of the Government of Spain, with activities
starting in 1970 (http: www.iccat.es).
While the actual objectives of the Commission are defined in the Convention, the goals of
the Commission have undergone substantial changes, as have the circumstances and
conditions of attaining these goals. Major factors have been advances in research and
reporting techniques, improvements m fishing equipment, and the public's increasing
awareness of environmental concerns.
The Commission is mainly concerned with collection of statistics, research concepts,
techniques and activities and giving management advice and regulations. The enforcement
of these regulations is still in the hands of the Contracting Parties and ICCAT itself does
not have inspectors to carry out this work. In the case of the European Union, the
enforcement is also up to the Member States but then the European Union has its own
inspectors which visit the Member States to make sure that these regulations are being
enforced (http:www.iccat.es).
1.6.1 Current Regulations of ICCAT
In the 1960s, the catch of the traditional fisheries for bluefin tuna in the east Atlantic fell
down from about 20, 000 metric tons per year to about 2,000 metric tons. Combined with
the drop in the catch in the western Atlantic, this resulted in the adoption of the first
management measures by ICCA T in the 1970s.
23
In 1975, a mm1mum size of 6.4 kg with a 15 % tolerance, in number of fish, was
recommended for the entire Atlantic (including the Mediterranean). The main aim of this
regulation was to stop all landings of juvenile bluefin tuna which were being caught
immediately after leaving the nursery grounds.
The Commission recommended in 1994 that bluefin tuna catches in the east Atlantic ocean
and Mediterranean Sea should be reduced from 1993 or 1994 levels (whichever is higher)
by 25 % starting in 1996 and until 1998. While this regulation could not be evaluated
finally until the 1998 catches had been reported, overall the 1996 and 1997 catches were
8.4 % and 2.9 % higher, respectively than 1994 levels. It would therefore appear that this
regulation had not been fully enforced by the Contracting Parties.
In 1998, the quotas regulation rules were revised according to the 1998 assessment.
Quotas were fixed at 32,000 metric tons and 29,500 metric tons for the east stock in 1999
and 2000 respectively. As the European Community (EC) joined ICCA T in 1998, the
quotas were fixed for the EC and no longer for the individual European countries as was
done before 1998.
A regulation entered into force on I June 1994 which prohibits large pelagic longliners of
more than 24 metres in length from fishing in the Mediterranean during the months of June
and July. The objective of this regulation is to limit fishing mortality.
There is a prohibition of purse seine fishing in the Mediterranean in August and the use of
airplanes or helicopters in June (entered into force on 4 August 1997). The dates chosen
for this measure adopted in 1996 were not based on solid scientific information and thus
alternate closure dates were proposed. A change in the dates of the closure was decided in
24
1998: May I st to 31st for the Adriatic Sea and July 16th August 15th for the rest of the
Mediterranean.
An ADAPT Virtual Population Analysis was developed with appropriate specifications
(ICCAT, 1998). However results of this assessment differ somewhat due to an abrupt
increase of the catches of the spawning fish since 1994 and also due to the revision of the
catch statistics by various countries. Consequently it was decided to carry out ICCA T
assessments using a constant natural mortality for all age groups and all years equal for
both stocks to 0.14.
1.6.2 Delineation of Stock
ICCA T has for many years assessed bluefin tuna on the hypotheses that there are two
separate stocks- the Eastern Atlantic stock, including the Mediterranean and the Western
Atlantic stock (Fig. 1.1 0). The current boundary line that came about in 1980 was based on
apparent discontinuities in the distribution of catches at that time, on the limited biological
knowledge, as well as on taking more or less the midpoints, geographically, from the
continents to the east and west. As indicated earlier the two presumed stocks are thought
to have independent spawning grounds. Each stock is subject to different management
restrictions with the most prominent being a low quota for the western fishery of 3, 000
metric tons and a higher quota for the eastern fishery dominated by European countries of
32, 000 metric tons (ICCAT, 1996).
However these hypotheses have remained untested and exchange rates, if any, between the
Atlantic and the Mediterranean remain unknown. A recent review of the scientific bases for
the management of Atlantic bluefin tuna recommends that the two stock hypothesis be
rigorously tested (Miyake, 1998).
25
Now there is also an increasing literature survey evidence of the tagging experiments (Block
et al., 1998, 2000; Lutcavage et al., 1999, 2000; De Metrio et al., 2000) that there is a residing
population in the Mediterranean. The extent of bluefin tuna movement within and between
the eastern and western Atlantic regions including migrations through the Straits of Gibraltar
and the effects these movements might have on the choice of management strategies need to
be examined. These conflicting theories are causing debates between the American and
Mediterranean countries concerned during the annual ICCAT management meetings {ICCAT,
2004).
Block et al., (2005) analyzed the data over a nine-year period and discovered that bluefin
tuna have a complex migratory life-cycle that varies depending on the season, as well as
the age and body size of the fish. The study confirmed that the North Atlantic is home to
at least two populations of bluefin - a western stock that spawns primarily in the Gulf of
Mexico and an eastern stock that breeds in the Mediterranean Sea. It appears that some
bluefin tunas from the east may feed in the Atlantic until they are old enough to become
breeders, at which point they go back to the Mediterranean spawning grounds and are
unlikely to move out again. Full details of these migrations and behaviour are not yet
available to date.
Knowledge of the actual exchanges could affect the conclusion of future stock assessments
{ICCAT, 2000) since the determination of both the extent of mixing of mature bluefin tuna
and the fidelity to an Atlantic or Mediterranean spawning ground is critical for future bluefin
tuna management. Barbara Block (2005) suggested that ICCAT should take into
consideration the new ongoing research studies using pop up tags and consider changing
fishing policy to reflect it.
26

t OO 10
..
20
Atlantic
stock ea
...
Fig 1.10 Separation ofbluefin tuna stocks (ICCAT, 1996)
1. 7 Aims and Objectives
40
The report of the workshop on bluefin tuna mixing (ICCA T, 200 I) points out that the stock
structure of bluefin tuna has been the subject of intensive discussion by scientists since the
ICCAT began its scientific work in 1971. Wbile the management approach initiated in
1982 may have been appropriate at the time, much has changed since then; mainly the
development of more efficient gears and the development of tuna farming.
Bluefin tuna has until now been managed as two separate stocks for almost 20 years but
there is increasing evidence of a residing bluefin tuna population in the Mediterranean
(B lock et al., 2005). These conflicting theories are causing debates between all parties
27
concerned and are not resulting in the effective management of this vulnerable bluefin tuna
population.
Noting the lack of recovery of the eastern and western stock even after 20 years of
management as well as the information coming from new sources, e.g. tagging; it seems
that the current management procedures are not sufficient to rebuild the Atlantic and the
Mediterranean stocks. The 45 °W degree management boundary is largely arbitrary and it
does not express the fundamental strategy in the management of Atlantic bluefin tuna if
sustainability is to be established.
ICCAT (1998) emphasised the need for increased research to redefine these boundaries
while at the same time implementing immediate measures to protect the bluefin tuna
population. These revised management measures will also need to take into account the
new exploitation techniques which have taken over the historical exploitation techniques
within the Mediterranean.
As a result the FAO-COPEMED Large Pelagics Project was set up (ICCAT, 1999).
Research on biology and fisheries is better accomplished if countries with fisheries
targeting bluefin tuna are involved in joint projects with a view towards providing
information for a better understanding of the population biology and stock status. This
Project was the principle source of funding for this thesis. It allowed the incorporation of
non EC members to research activities, supported by FAO funds through COPEMED
Project. The author was the co-ordinator for Malta and the rapporteur during the meetings
attended. Other countries involved in the project were Spain, Morocco, Tunisia and Libya.
The aim of this thesis is to examine the hypothesis that the Mediterranean stock of bluefin
tuna is largely independent of the bluefin tuna population in the Atlantic.
28

To meet this aim, the following objectives were set up:
• To review all literature associated with establishing the identity of stocks and the
techniques available to support this (before each experiment)
• To determine biometric relationships on the Mediterranean bluefin tuna stock and
establish differences for comparison with Atlantic stock/s (Chapter 2)
• To set up an age-length key for larger tunas that will provide essential information in
all aspects of studies carried out on bluefin tuna and comparison with Atlantic tunas
(Chapter 3)
• To perform a reproductive study to determine the level of sexual maturity of bluefin
tuna within the Mediterranean stock (Chapter 4)
• To determine the age at first sexual maturity of the Mediterranean bluefin tuna stock
and compare it with that of the Atlantic stock (Chapter 4)
• To carry out stock identification through:
• tagging activities (Chapter 5)
• chemical analysis of the otoliths (Chapter 6) and
• genetic analysis (Chapter 6)
• To analyse new exploitation strategies in order to determine how they are affecting the
bluefin tuna stocks in the Mediterranean Sea and come up with better management
strategies which provide solutions that are targeted more specifically to the current
situations (Chapter 7).
As international demands remam high for large bluefin tuna, intensive fishing rmses
concerns for the long-term sustainability of this resource. Given the large potential profits
and the many competing users in the bluefin tuna fishery, conservation efforts have
29

sparked international disputes. lt is under these conditions that this study aims to provide a
basic framework for the sustainable management of the bluefin tuna population in the
Mediterranean Sea integrating biology with the demands imposed by global economics and
politics.
30

1.8 Summary
I. Bluefin tuna IS exploited over all its distribution range by different countries and
different gears.
2. The Mediterranean Sea is the main area where bluefin tuna is targeted.
3. Bluefin tuna is regarded as a prized table fish and as a high grade product in Japan.
4. Bluefin tuna is exploited over all its distribution range by different countries and
different gears.
5. There is a strong evidence of over fishing.
6. A new expanding practice in the Mediterranean is tuna farming. This has brought a lot
of socio-economic impacts on the Mediterranean tuna fishing.
7. I CCA T is concerned with the collection of statistics, research concepts, techniques and
activities and giving management advice and regulations which are then enforced by
the Contracting Parties.
8. Current management regime based on poor scientific evidence particularly where stock
delineation is concerned.
9. Increasing evidence of a Mediterranean stock that is distinct from Atlantic stocks.
31

:1~0; ~If :above statement. 1s true, it will reqmre management measures speci(ic .to ·the.
Mediterranean.
rJ'I. The rpu_rpose :of: this thesis' is tO ,present revldence from the series '.ofexperiments listed
above to show that within the bounds of 1probability .~:residing, Mediterranean. stock
exi~~s.
32

·o]eMrE'Fac' REiLATii(JNSHIPS·
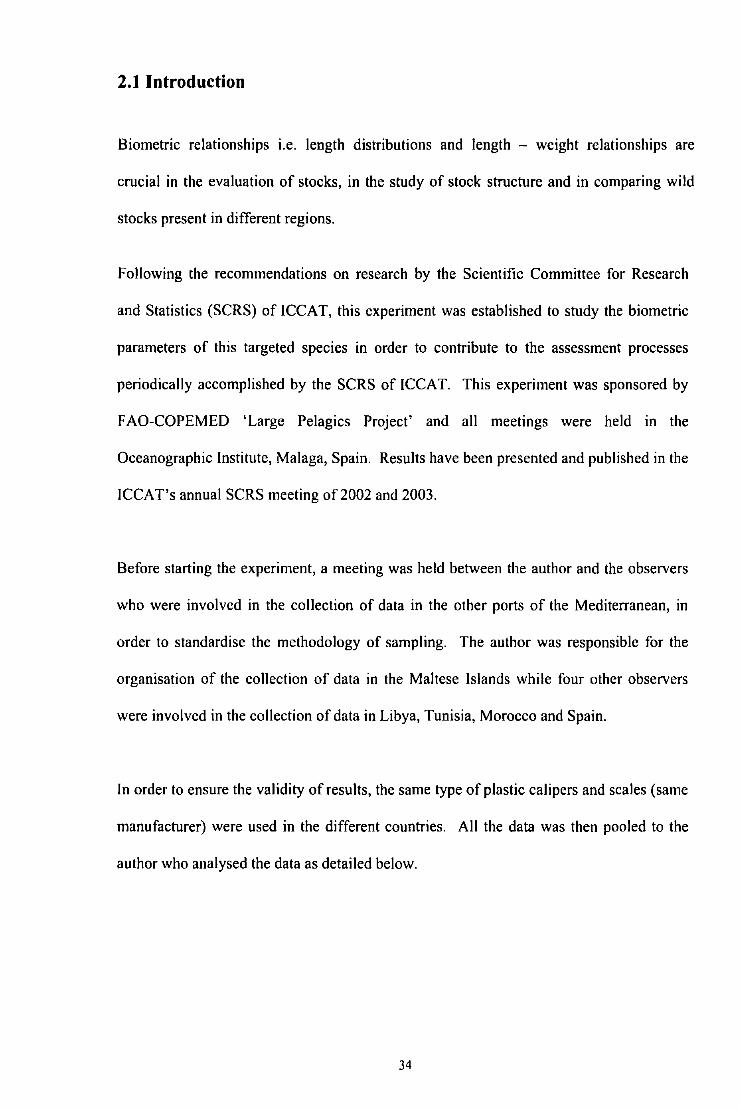
2.1 Introduction
Biometric relationships i.e. length distributions and length - weight relationships are
crucial in the evaluation of stocks, in the study of stock structure and in comparing wild
stocks present in different regions.
Following the recommendations on research by the Scientific Committee for Research
and Statistics (SCRS) of ICCAT, this experiment was established to study the biometric
parameters of this targeted species in order to contribute to the assessment processes
periodically accomplished by the SCRS of ICCA T. This experiment was sponsored by
FAO-COPEMED 'Large Pelagics Project' and all meetings were held in the
Oceanographic Institute, Malaga, Spain. Results have been presented and published in the
ICCA T's annual SCRS meeting of 2002 and 2003.
Before starting the experiment, a meeting was held between the author and the observers
who were involved in the collection of data in the other ports of the Mediterranean, in
order to standardise the methodology of sampling. The author was responsible for the
organisation of the collection of data in the Maltese Islands while four other observers
were involved in the collection of data in Libya, Tunisia, Morocco and Spain.
In order to ensure the validity of results, the same type of plastic calipers and scales (same
manufacturer) were used in the different countries. All the data was then pooled to the
author who analysed the data as detailed below.
34
2.2 Literature review
Several studies regarding bluefin tuna in the Atlantic and in the Mediterranean have
focussed on biometric relationships: Rodriguez-Roda (1983), Rey & Alot (1987), Rey et
al. ( 1987), Cort ( 1990) and De la Sema et al. ( 1992). The general conclusions for the
aforementioned studies were that different length - weight relationships were present for
the Atlantic Ocean and the Mediterranean Sea.
ln fact, in the Field Manual of I CC AT ( 1990), different length-weight relationships are
found for bluefin tuna caught in the Atlantic and bluefin tuna targeted in the
Mediterranean:
East Atlantic Round weight= 2.95 x 10·5 x Fork Length 2 8\Rey & Cort, Unpubl.)
West Atlantic Round weight = 2.86 X I o-5 X Fork Length2
·82(Parrack & Phares,
1979)
Mediterranean Round weight= 1.96 X I 0"5 X Fork Length 3
•01 (Beardsley, 1971)
These results are so old that a new study is required to test their validity. Further
confirmation through this experiment of the different length - weight relationships for the
west Atlantic, east Atlantic and the Mediterranean would help in the differentiation of
stocks and would lead more to the conclusion of a permanent residing stock in the
Mediterranean. The results will also contribute to the assessment processes periodically
accomplished by the SCRS of ICCA T which are an essential tool in ensuring the
sustainability of the species.
35
2.3 Materials and Methods
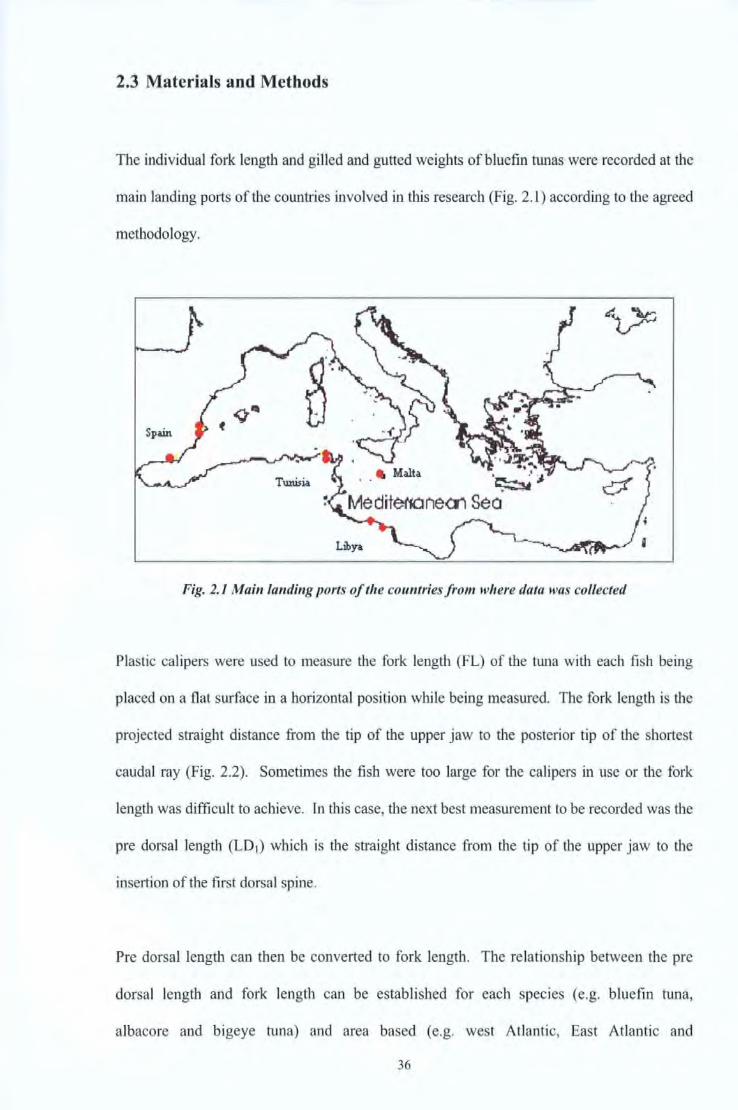
The individual fork length and gilled and gutted weights of bluefin tunas were recorded at the
main landing ports of the countries involved in this research (Fig. 2.1) according to the agreed
methodology.
Fig. 2.1 Main landing ports oftlte countries from where data was collected
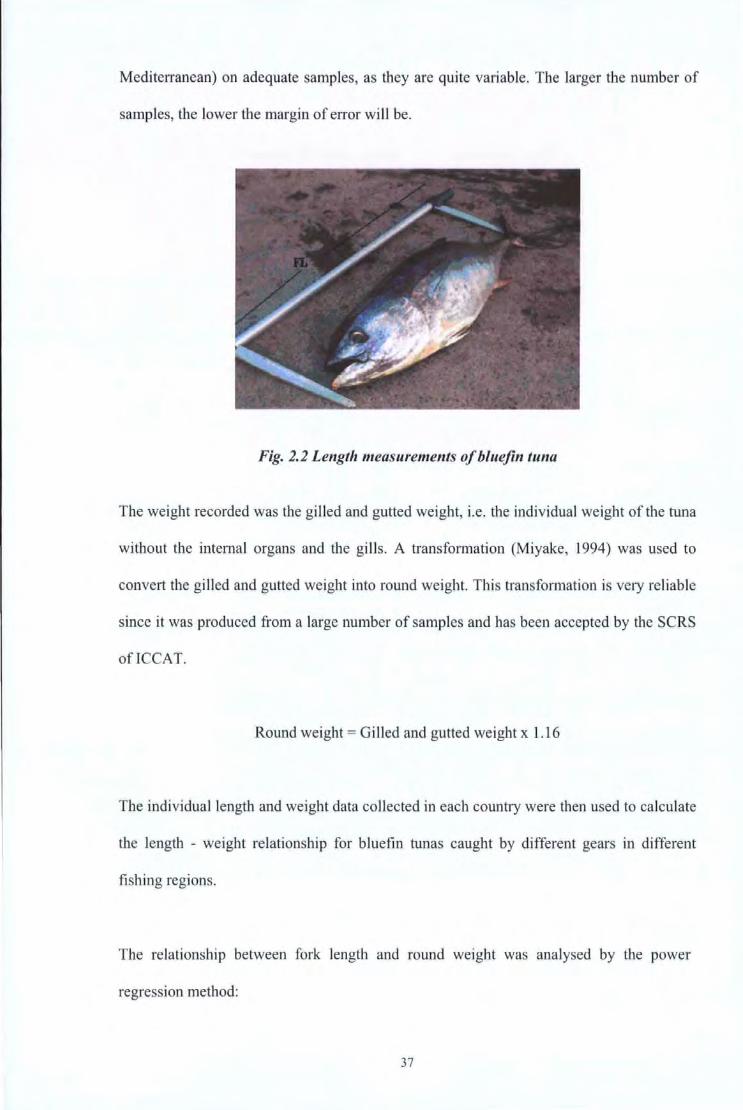
Plastic calipers were used to measure the fork length (FL) of the tuna with each fish being
placed on a flat surface in a horizontal position while being measured. The fork length is the
projected straight distance from the tip of the upper jaw to the posterior tip of the shortest
caudal ray (Fig. 2.2). Sometimes the fish were too large for the calipers in use or the fork
length was difficult to achieve. In this case, the next best measurement to be recorded was the
pre dorsal length (LD1) which is the straight distance from the tip of the upper jaw to the
insertion of the first dorsal spine.
Pre dorsal length can then be converted to fork length. The relationship between the pre
dorsal length and fork length can be established for each species (e.g. bluefin tuna,
albacore and bigeye tuna) and area based (e.g. west Atlantic, East Atlantic and
36
Mediterranean) on adequate samples, as they are quite variable. The larger the number of
samples, the lower the margin of error will be.
Fig. 2.2 Length measurements of bluefin tuna
The weight recorded was the gilled and gutted weight, i.e. the individual weight of the tuna
without the internal organs and the gills. A transformation (Miyake, 1994) was used to
convert the gilled and gutted weight into round weight. This transformation is very reliable
since it was produced from a large number of samples and has been accepted by the SCRS
ofiCCAT.
Round weight= Gi lied and gutted weight x 1.16
The individual length and weight data collected in each country were then used to calculate
the length - weight relationship for bluefin tunas caught by different gears in different
fishing regions.
The relationship between fork length and round weight was analysed by the power
regression method:
37
Round Weight= a Fork Lengthb.
where a = growth index
b = exponential index
Therefore, the response variable analysed was the natural logarithm of length.
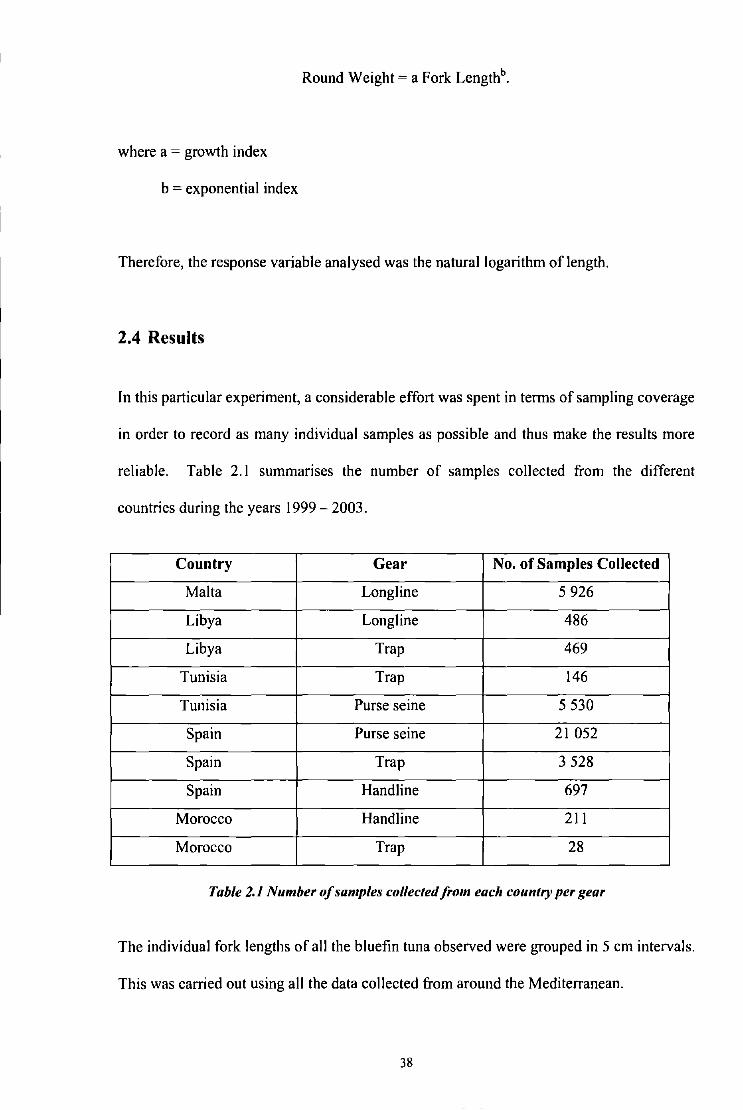
2.4 Results
In this particular experiment, a considerable effort was spent in terms of sampling coverage
in order to record as many individual samples as possible and thus make the results more
reliable. Table 2.1 summarises the number of samples collected from the different
countries during the years 1999 - 2003.
Country Gear No. of Samples Collected
Malta Longline 5 926
Libya Long line 486
Libya Trap 469
Tunisia Trap 146
Tunisia Purse seine 5 530
Spain Purse seine 21 052
Spain Trap 3 528
Spain Handline 697
Morocco Handline 211
Morocco Trap 28
Table 2.1 Number of samples collected from each country per gear
The individual fork lengths of all the bluefin tuna observed were grouped in 5 cm intervals.
This was carried out using all the data collected from around the Mediterranean.
38
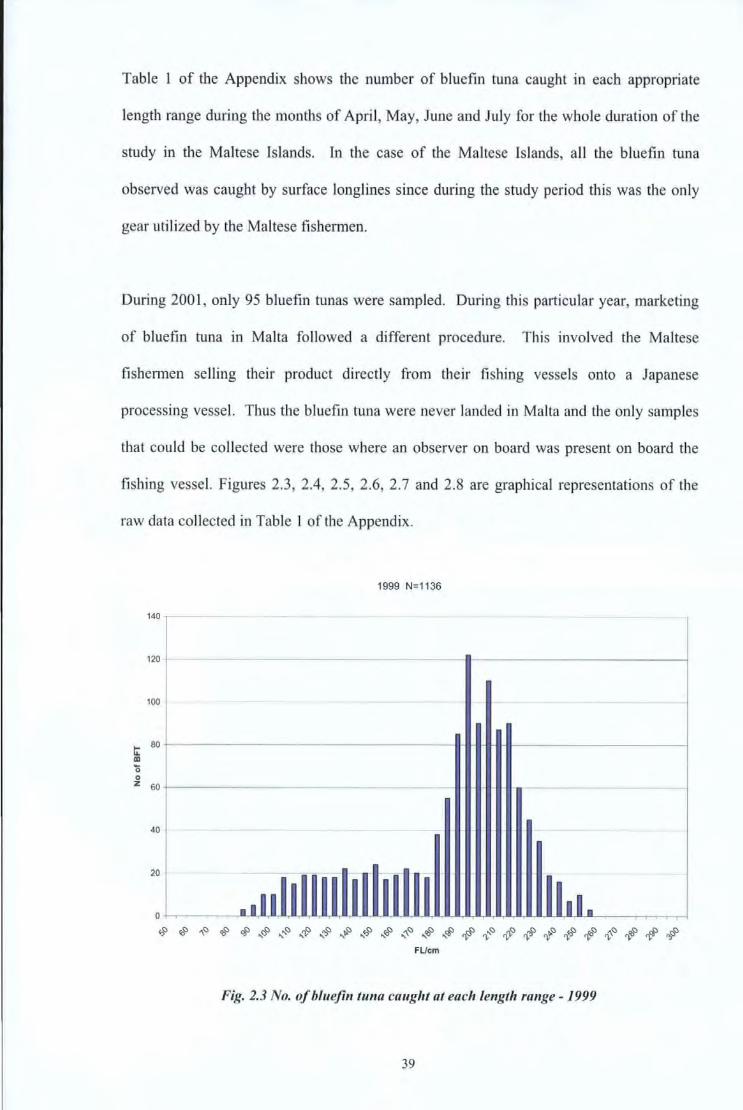
Table 1 of the Appendix shows the number of bluefin tuna caught in each appropriate
length range during the months of April, May, June and July for the whole duration of the
study in the Maltese Islands. In the case of the Maltese Islands, all the bluefin tuna
observed was caught by surface longlines since during the study period this was the only
gear utilized by the Maltese fishermen.
During 2001, only 95 bluefin tunas were sampled. During this particular year, marketing
of bluefin tuna in Malta followed a different procedure. This involved the Maltese
fishermen selling their product directly from their fishing vessels onto a Japanese
processing vessel. Thus the bluefin tuna were never landed in Malta and the only samples
that cou ld be collected were those where an observer on board was present on board the
fishing vessel. Figures 2.3, 2.4, 2.5, 2.6, 2.7 and 2.8 are graphical representations of the
raw data collected in Table I of the Appendix.
1999 N=1136
140
I 120
100
t Cll
80 -
0 0 z 60
40
20
0 •• 11 I l 1 1tl. ~~~~~~~~$~$$~$~#~#~~$$~~~#
FUcm
Fig. 2.3 No. of blueji11 tuna caught at each let~gth ra11ge - 1999
39
200
180
160
140
120
t:: ID '0 100 0 z
80
60
40
20
0 '
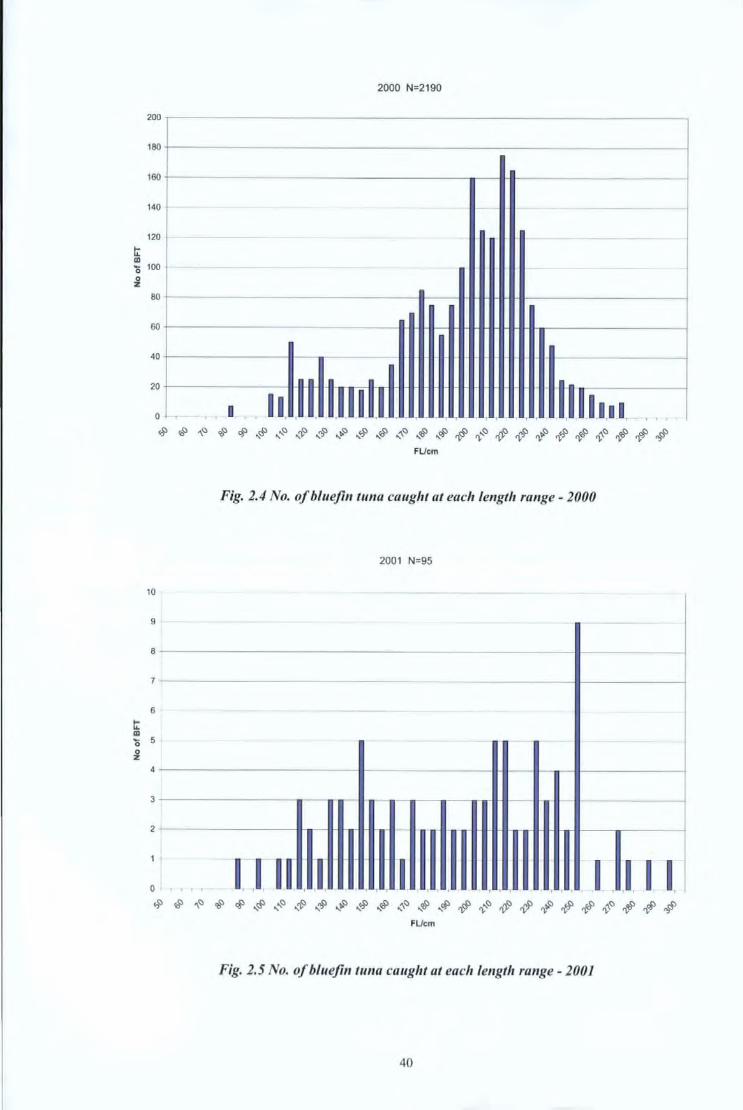
2000 N=2190
• . . u. n 111111 - -
~111.11. ' ' ' ~~~~~~~~~~&$~~~#~~~~$$~~~#
10
9
8
6
t:: ID '0 5 0 z
4
3
2
0
FUcm
Fig. 2.4 No. of bluejin tuna caught at each length ra11ge- 2000
2001 N=95
-
-
1.1nhf .11JU ' ' L ~0 I I
~~~~~~~~~~&$~~~#~~~~~$~~~# FUcm
Fig. 2.5 No. of bluefin tuna caught at each le11gtlr range - 2001
40
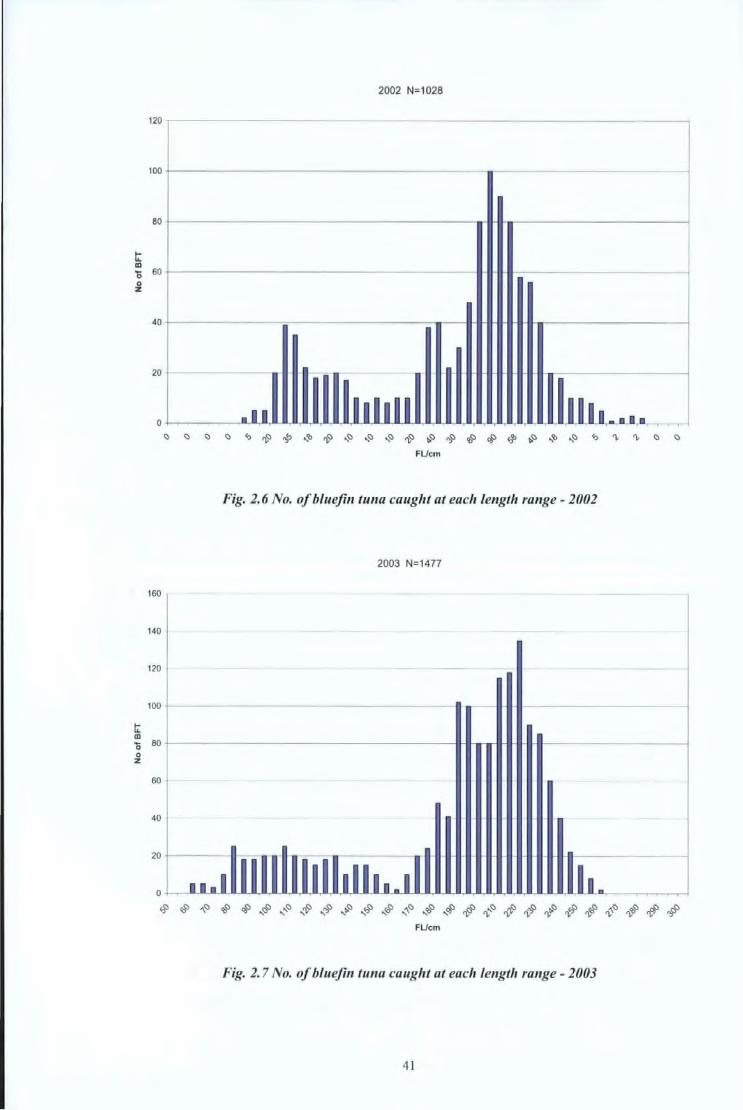
2002 N=1028
120
100
80 -
t;: ID 0 60 0 z
t;: ID
0 0 z
40
20
0
160
140
120
I
-
I
-
••• 111111 ~ ~ ~ ~ ~ ~ ~ ~ ~ ~ ~ ~ ~ ~ ~ ~ ~ ~ ~ ~ ~ ~ ~ ~ ~ ~ ~
FUcm
Fig. 2. 6 No. of bluefin tuna caught at each length range- 2002
2003 N=1477
100 .
80
60
40
20
O ~_.UULA~LA~~~~~~LA~UL~~~uy~~LA~WL~~LA~--~~~~
~~~~~~~~~~$~~$~~~#~~$$~~~# FUcm
Fig. 2. 7 No. of bluefin tuna caught at each length range - 2003
41
Historical series
200
180
160
140
120
t: Ill '0 100 0 z
80
60
40
20
0 ~~~~~~4--F~~~~~~~~~==~~~~~~~~~~~~~~
~~~~~~~~~~$$~$~$~~~~~~~~$# FUcm
-2000 - 2001 1999 - 2002 - 2003
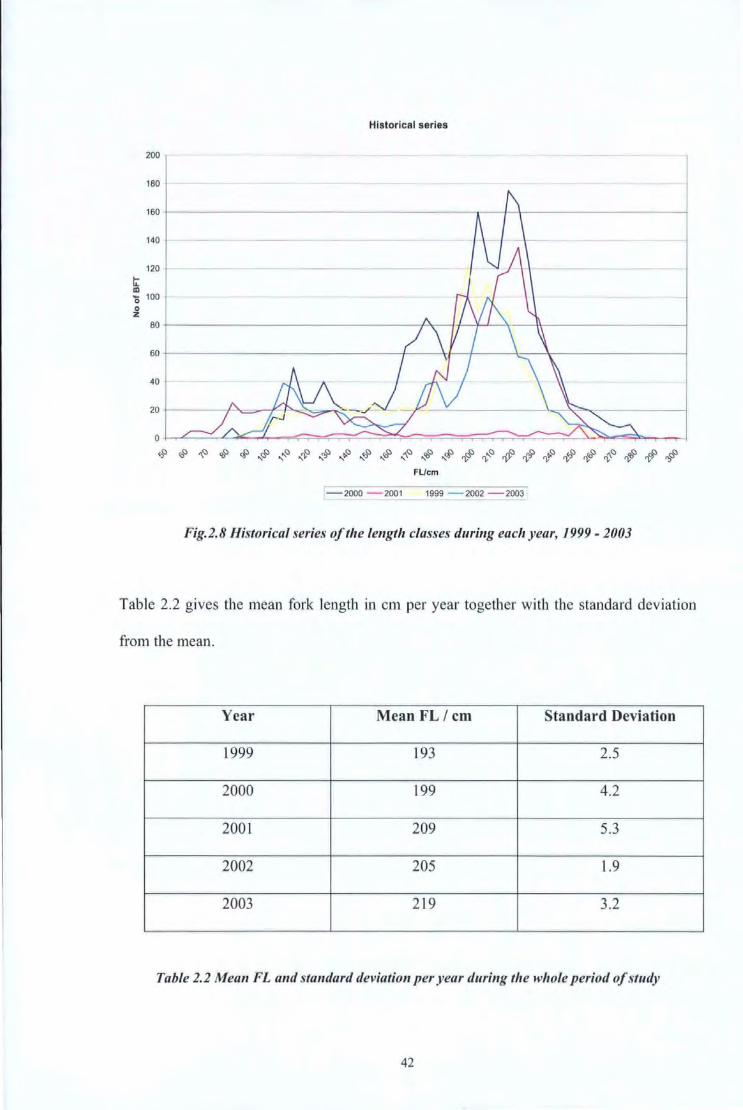
Fig.2.8 Historical series of the length classes during each year, 1999-2003
Table 2.2 gives the mean fork length in cm per year together with the standard deviation
from the mean.
Year Mean FL/ cm Standard Deviation
1999 193 2.5
2000 199 4.2
2001 209 5.3
2002 205 1.9
2003 219 3.2
Table 2.2 Mean FL and standard deviation per year during the whole period of study
42

The ANOV A test was carried out to determine whether any statistical differences are
present between the mean fork lengths calculated for the different years. At the 95%
confidence level, no significant difference was found between the results (0.0221 ).
In the other countries of the Mediterranean, the biometric measurements of bluefin tunas
were recorded and processed using the same methodology.
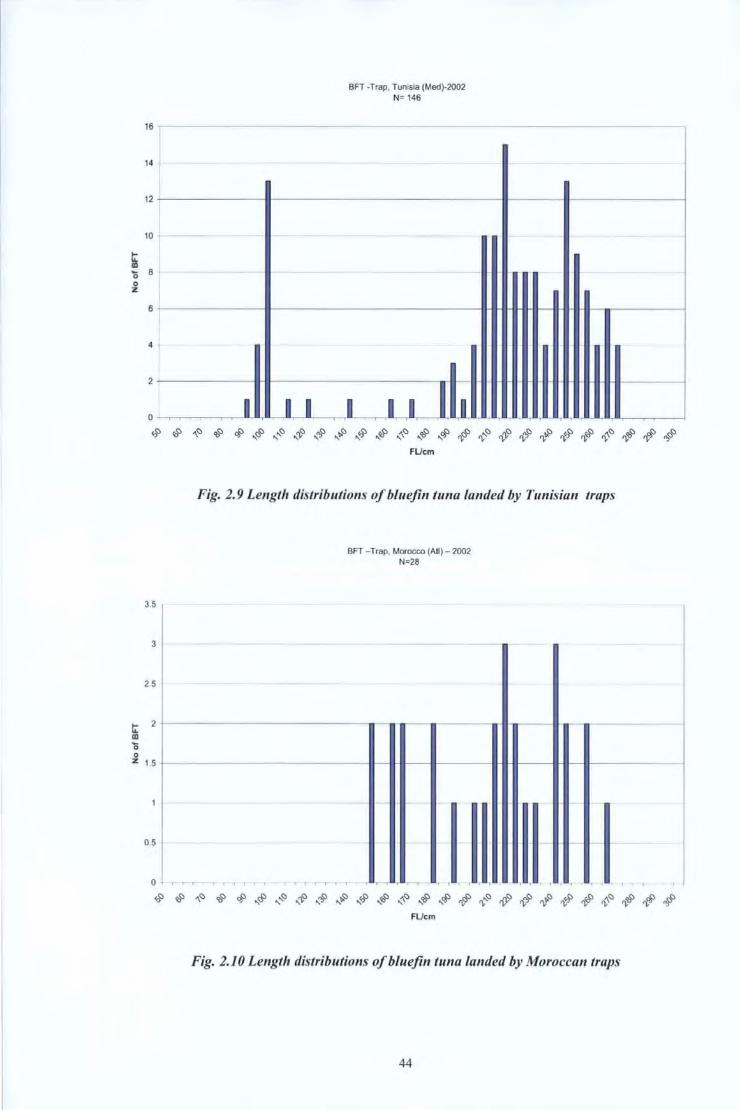
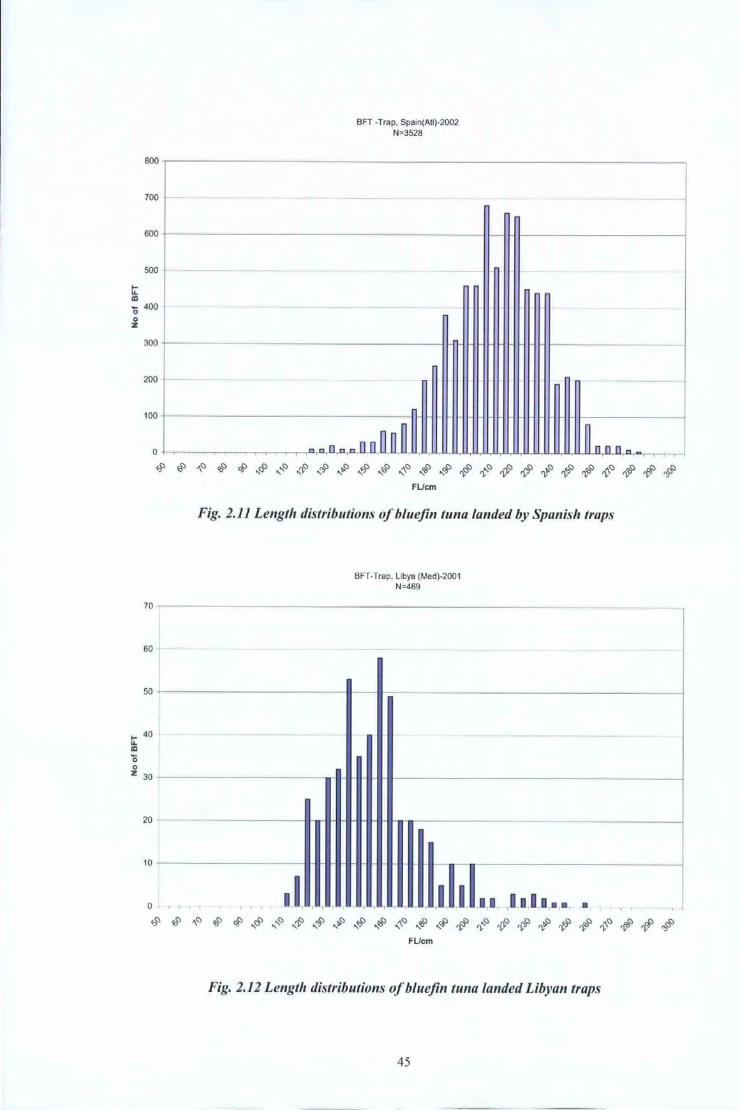
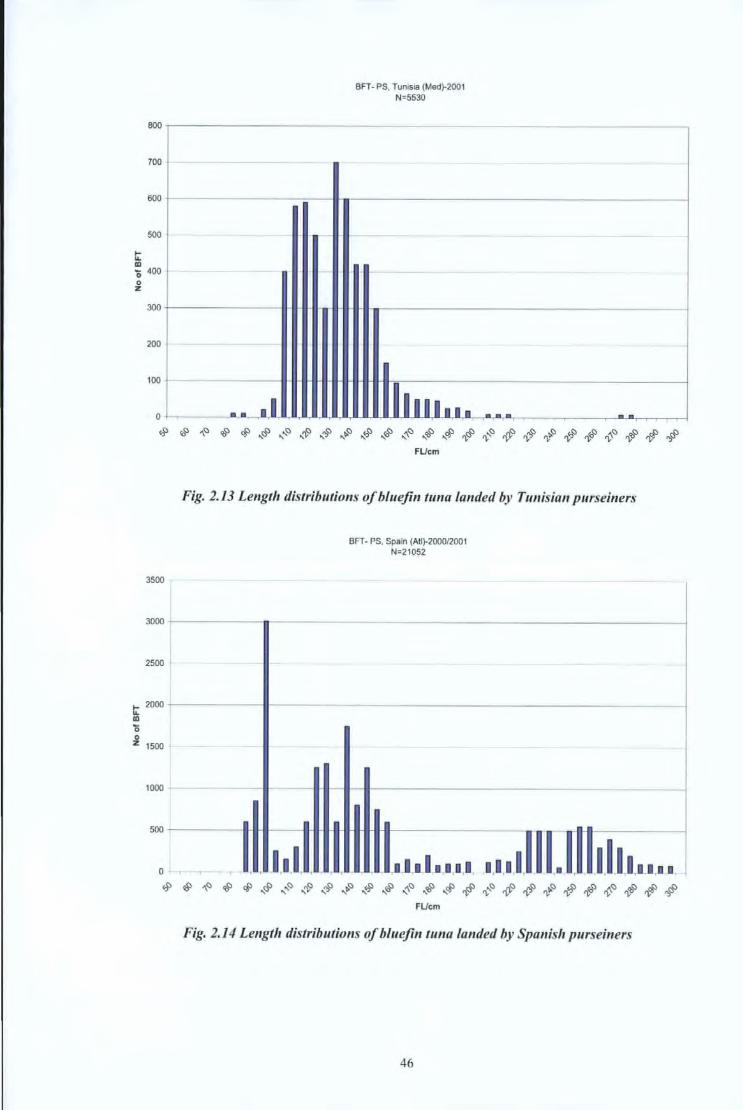
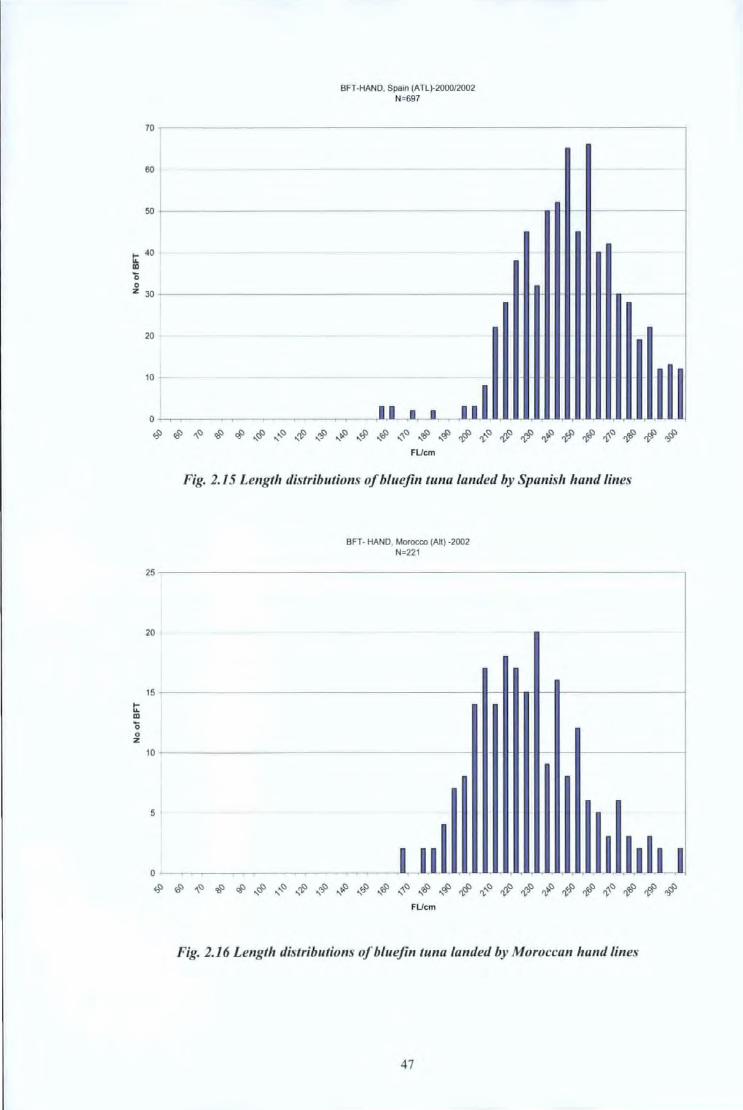
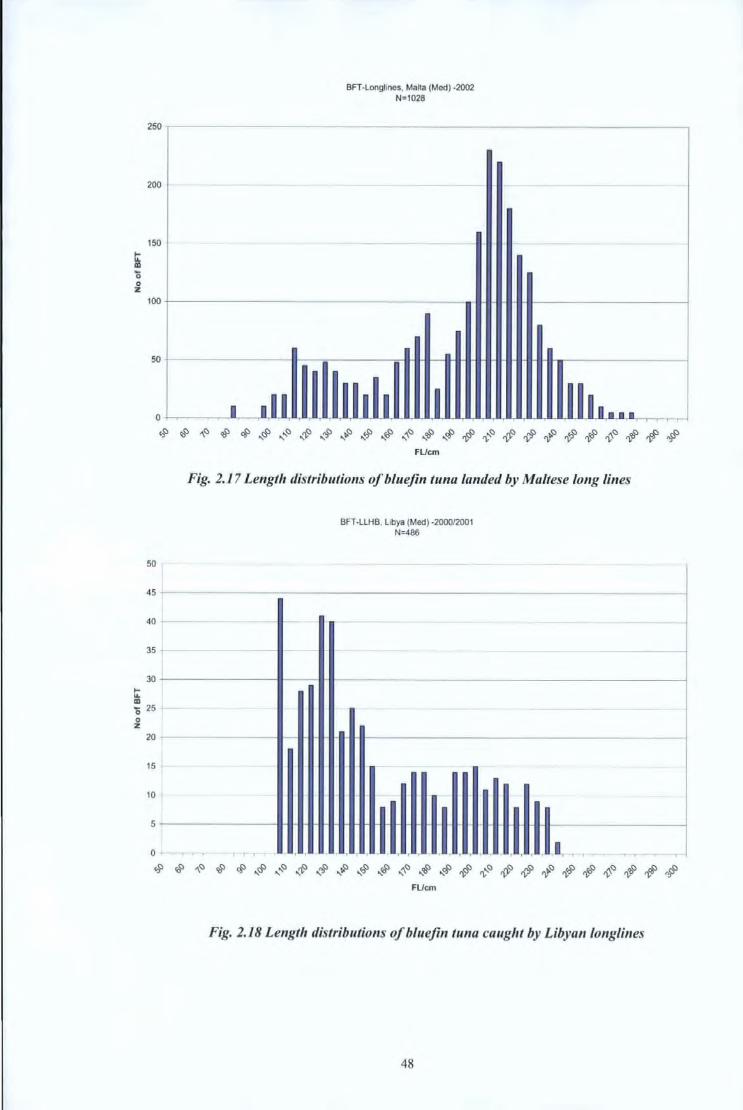
Fig. 2.9 to Fig 2.18 show the length distributions of bluefin tuna which had been caught by
the main gears (trap nets, purse seine, hand lines and drifting surface longlines) used in
Malta, Libya, Tunisia, Morocco and Spain.
43
16
14
12
10
tL: Cl)
'0 8 0 z
6
4
2
0 I I I
BFT-Trap, Tumsia (Med)-2002 N= 146
I I I I I
- --
T
~~~~~~~~~~~$~$~~~~~~~~~~~#
3.5
3
25
tL: 2 Cl)
0 0 z 1.5
05
0
FUcm
Fig. 2.9 Length distributions of bluefin tuna landed by Tunisian traps
--
' '
BFT-Trap, Morocco (AU)- 2002 N=28
l ....- T ....-- T ..1 .11. n ' . ' .I ~~~~~~~~~~~$~$~~~~~~~$~~~#
FUcm
Fig. 2.10 Length distributions of bluefin tuna landed by Moroccan traps
44
I
•
800
700
600
500
t:: CD - 400 0 0 z
300
200
100
0
BFT -Trap, Spa~n(AU)-2002 N: 3528
_n_n nnnnnnn~
t-
- - - - -
- - -
~ n n_n_o_ ~~~~~~~~~~$~~~~~~~~~$~~~~#
70
60
50
~ 40 IL CD
0 0 z 30
20
10
0
FUcm
Fig. 2.11 Length distributions of bluejin tuna landed by Spanish traps
I
- - --r- r- .I. '
8FT-Trap, Libya (Med)-2001 N:469
-
1.1 - , I 1,1 ·•••••••
• ~~ . '
~~~~~~~~~~$~~~~~~~~~$~~~~# FUcm
Fig. 2.12 Length distributions ofbluejin tuna landed Libyan traps
45
800
700
600
500
t: CD 0 400 0 z
300
200
100
0 •• ••
I~
~ -
- -
BFT- PS. Tunisia (Med}-2001 N=5530
lllllna • .. ~~~~~~~~~~$~~~~~~~~~$$~~~#
3500
3000
2500
t: 2000
CD
0 0 z 1500
1000
500
0 '
FUcm
Fig. 2.13 Length distributions of bluefin tuna landed by Tunisian purseiners
" 1.11.,
BFT- PS, Spain (Atl)-200012001 N=21052
- -J-ltL I,D I_ 1,111,
-
-
.• ' I.II•T·· I I
~~~~~~~~~~$~~~~~~~~~$$~~~# FUcm
Fig. 2.14 Length distributions of bluejin tuna landed by Spanish purseiners
46
BFT-HAND. Spain (ATL)-2000/2002 N=697
70 -----------------------------------------------------------------.
60
so +-'------------------------------------- -------.--1 1-- 11-------------i
t: 40 ID
0 0
z 30 --------------------------------------------~ .. ~.--~~-.,r-----~
t: ID
0 0 z
20
10
~~~~~~~~$~$$~$~#~~~~$$~#~# FUcm
Fig. 2.15 Length distributions of bluefin tuna landed by Spanish hand lines
BFT- HAND. Morocco (All) -2002 N=221
25 -----------------------------------------------------------------
20
15 ----------------------------------------~--~rl-~l-------------~
10 ----------------------------------------l~~.-~~~~-------------~
5
~~~~~~~~$~$$~$~#~~~~$$~#~# FUcm
Fig. 2.16 Length distributions of bluefin tuna landed by Moroccan hand lines
47
ti: Ill
'0 0 z
BFT-Longlines, Mana (Med) -2002 N:1028
0 ~------~--~aJ~~~~YL~~aJ~~UL~~~ ·~~~~~~~~~~~~
50
45
40
35
30
ti: Ill '0 25 0 z
20
15
10
5
0
~~~~~~~~~~$$~~~~~~~~$#~~~# FUcm
Fig. 2.17 Length distributions of bluejin tuna landed by Maltese long lines
-~ ~~ ~ '
BFT -LLHB, Libya (Med) -200012001 N:486
-
T . ' i ... .. '
~~~~~~~~~~$$~~~~~~~~$#~~~# FUcm
Fig. 2.18 Length distributions of bluejin tuna caught by Libyan /onglines
48
l
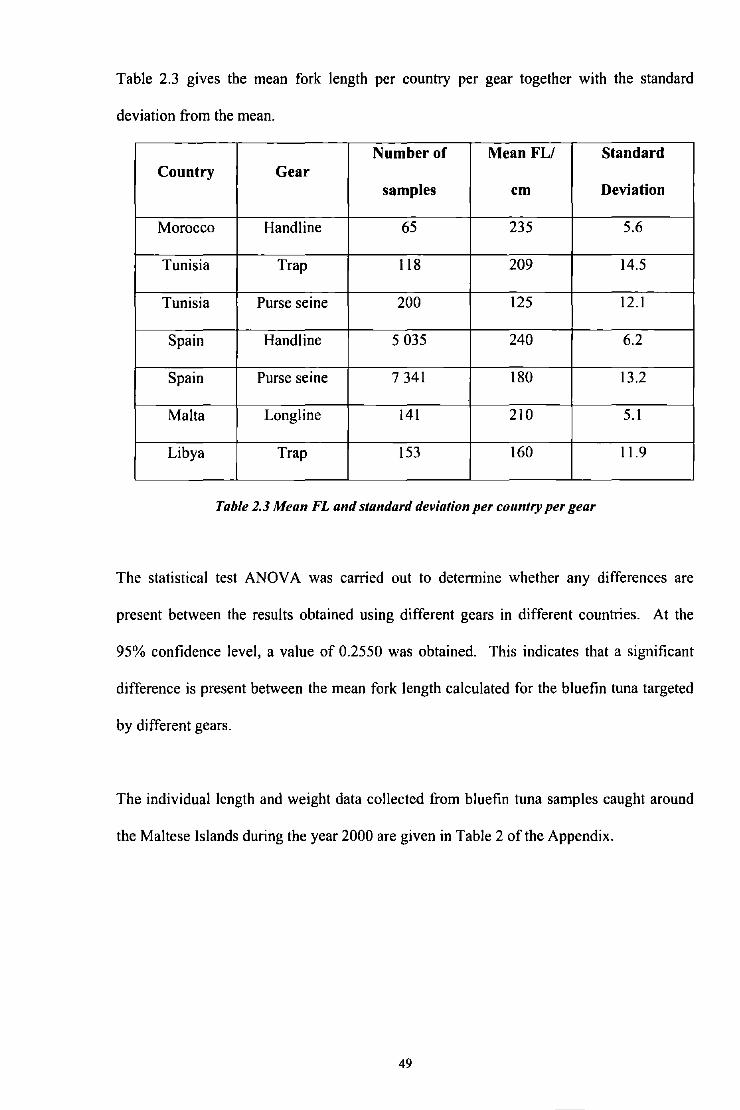
Table 2.3 gives the mean fork length per country per gear together with the standard
deviation from the mean.
Number of Mean FL/ Standard Country Gear
samples cm Deviation
Morocco Handline 65 235 5.6
Tunisia Trap 118 209 14.5
Tunisia Purse seine 200 125 12.1
Spain Hand line 5 035 240 6.2
Spain Purse seine 7 341 180 13.2
Malta Longline 141 210 5.1
Libya Trap 153 160 11.9
Table 2.3 Mean FL and standard deviation per country per gear
The statistical test ANOV A was carried out to detennine whether any differences are
present between the results obtained using different gears in different countries. At the
95% confidence level, a value of 0.2550 was obtained. This indicates that a significant
difference is present between the mean fork length calculated for the bluefin tuna targeted
by different gears.
The individual length and weight data collected from bluefin tuna samples caught around
the Maltese Islands during the year 2000 are given in Table 2 of the Appendix.
49
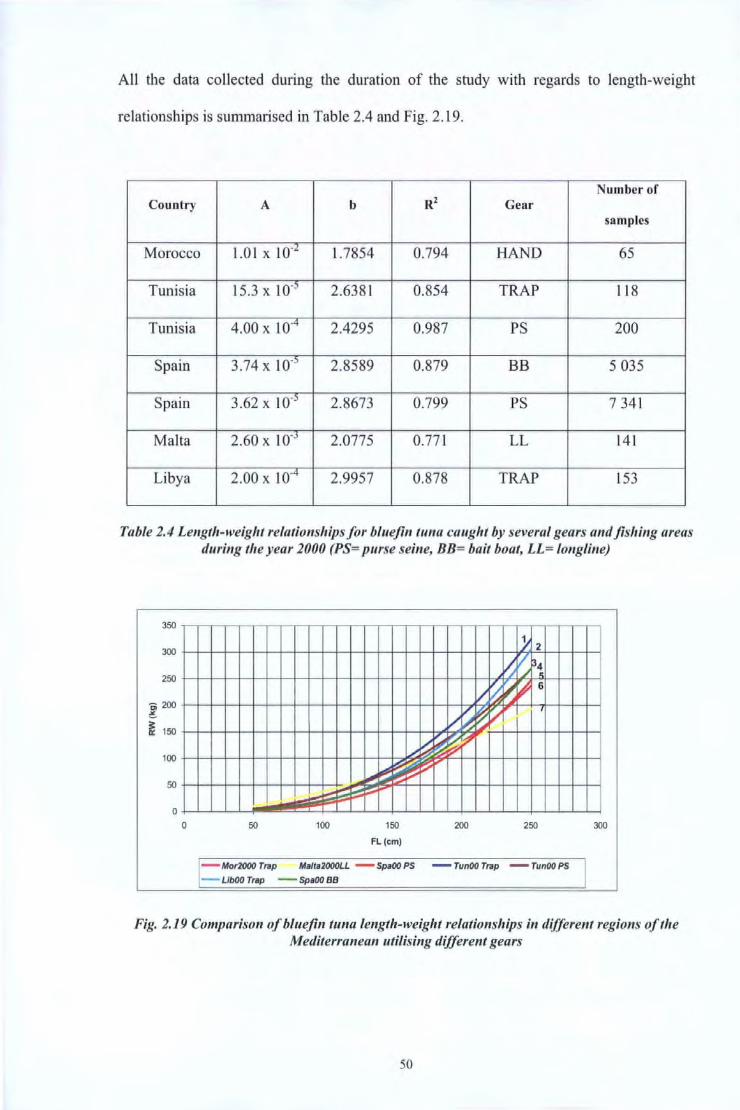
All the data collected during the duration of the study with regards to length-weight
relationships is summarised in Table 2.4 and Fig. 2.19.
Number of Country A b Rz Gear
samples
Morocco 1.01 X 10-l 1.7854 0.794 HAND 65
Tunisia 15.3 X 10⁻⁵ 2.6381 0.854 TRAP 118
Tunisia 4.00 X 10⁻⁴ 2.4295 0.987 PS 200
Spain 3.74 X 10.; 2.8589 0.879 BB 5 035
Spain 3.62 X J0-5 2.8673 0.799 PS 7 341
Malta 2.60 X 10-J 2.0775 0.771 LL 141
Libya 2.00 X 10⁻⁴ 2.9957 0.878 TRAP 153
Table 2.4 Length-weight relationships for bluefin tuna caught by several gears and fishing areas during tlte year 2000 (PS= purse seine, BB= bait boat, LL= longline)
350
300
250
Ci 200 ~
~ 150
100
50
0
0
;;...
50 100
~
Ill"": lollll' ~
150
FL(cm)
V ~ ~ ~ ~ ~ ~ ~
~ ~ ~
200
} 2
~ 'I 34 _/ <;
V ~ ~ , 6
~;( I
250
- Mor2000 Trap Malta2000LL - SpaOO PS - TunOO Trap - TunOO PS
- LlbOO Trap - SpaOO BB
I I
I
I
300
Fig. 2.19 Comparison ofbluefin tuna length-weight relationships in different regions ofthe Mediterranean utilising different gears
50
An ANOV A test was carried out to study the differences between these relationships. At
the 95 % confidence level, a value of 0.1324 was obtained indicating that a significant
difference exists between the relationships.
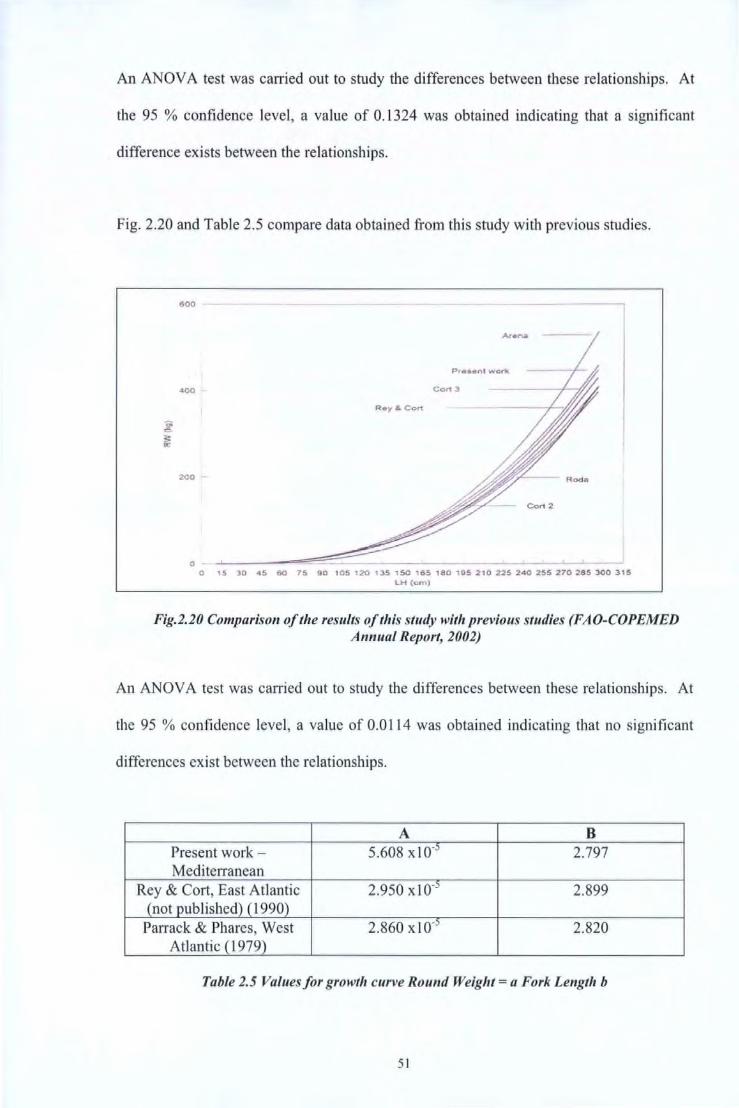
Fig. 2.20 and Table 2.5 compare data obtained from this study with previous studies.
600
20-D
0 0 15 30 '15 60 75 90 105 120 135 150 165 180 195 210 225 2'10 255 270 285 300 315
LH {cm)
Fig.2.20 Comparison of the results of this study with previous studies (FAO-COPEMED Annual Report, 2002)
An ANOV A test was carried out to study the differences between these relationships. At
the 95 % confidence level, a value of 0.0114 was obtained indicating that no significant
differences exist between the relationships.
A B Present work - 5.608 xlo-:. 2.797 Mediterranean
Rey & Cort, East Atlantic 2.950 xl0-5 2.899 (not published) (1990)
Parrack & Phares, West 2.860 xlo-:. 2.820 Atlantic ( 1979)
Table 2.5 Values for growth curve Round Weight= a Fork Length b
51
An ANOV A test was carried out to study the differences between these relationships. At
the 95 % confidence level, a value of 0.4124 was obtained indicating that a significant
difference exists between these three relationships.
2.5 Discussion
From the analysis of the data collected from the Maltese Islands, it is evident from Fig. 2.8
that there were no significant changes in the distribution of sizes over the whole study
period of 5 years (1999- 2003). In fact, the mean length remained of the same magnitude,
i.e. between 193 and 219 cm fork length. At the 95% confidence level, no significant
difference was found between the mean fork length calculated for the different years. In
fact a value of 0.0221 was obtained.
The peak in Fig 2.5 is not as distinct as in the rest of the figures since during the year 2001
only a small number of b1uefin tunas were sampled due to the reasons explained above.
From Fig. 2.3 - 2.8, one can observe that the bluefin tunas caught are rather large. In
Malta bluefin tuna is only caught using surface longlines which target tuna during its
spawning period. At this time of their life cycle, large tunas tend to swim in the upper
region of the water column to release their eggs in the surface waters and therefore are
more easily caught by the hooks of the drifting surface longlines.
Size distribution was also studied in different regions of the Mediterranean for bluefin tuna
using different gears. At the 95% confidence level, a value of 0.2550 was obtained
indicating that significant differences were present between the mean fork lengths of tuna
targeted by different gears.
52

Traps target bluefin tuna before their spawning season. As such the size distributions of
bluefin tuna caught by traps are more widely distributed. In fact the standard deviation for
the fork lengths of tuna targeted by traps ranged between 11.9 and 14.5. The mean fork
lengths determined for this gear were 209 cm and 160 cm.
Purse seines entrap whole shoals of fish. As a result, even in this case the size distribution
of bluefin tuna is very widespread and the standard deviations of the mean fork length
ranged between 12.1 and 13.2.
In the case of handlines, only larger specimens are caught since bluefin tuna would be
present in the upper region of the water column during its spawning season which in this
case coincides with the fishing season. The mean fork lengths determined were 235 cm
and 240 cm and the standard deviation ranged only between 5.6 and 6.2.
These differences in the size distributions could be mainly attributed to the differential
selectivity of the fishing gear, the different spatial - temporal stratum, the condition factors
and the number of sampled specimens.
Table 2.3 summarises the length- weight relationships determined for each region for each
main gear. Although the relationships obtained are very close, differences exist.
These can be attributed to factors such as the hydrographical characteristics of the
particular fishing area and period, the differential catchability due to the prevailing
environmental factors and the differences in the fishing strategy adopted amongst vessels.
Results obtained were also compared with prev1ous studies carried out in the
Mediterranean and the length - weight relationships agree well with each other since at the
53

95% confidence level, no statistical difference was found between the R2 values of the
different length - weight relationships calculated.
On the other hand when the length - weight relationship obtained in this study for the
Mediterranean region was compared with the reported length - weight relationships
determined for the east and west Atlantic (Table 2.4), significant differences were
observed. This could be a factor indicating that the Mediterranean stock has got a different
length - weight relationship and could therefore be considered as an independent stock
residing in the Mediterranean during its whole life cycle. More studies in the same line of
this experiment need to be carried out in the east and west Atlantic since the only reference
material available is rather old.
54

2.6 Summary
I. No significant changes were observed in the size distributions of bluefin tuna caught
around the Maltese Islands during the period 1999 - 2003.
2. Significant differences were observed in the distribution of sizes of bluefin tuna caught
by the different gears. A recommendation should be made to the SCRS of ICCA T to
utilise these separate relationships when determining population sizes from data
collected from different gears during stock assessments since these would give more
reliable results.
3. A significant difference was observed between the length - weight relationship of the
Mediterranean when compared to the east and west Atlantic length - weight
relationships. This could be an indication that the Mediterranean population has got its
own distinct characteristics and thus needs to be considered as a different sub
population.
55

i I
3.1 Introduction
Knowledge on individual growth is essential for assessment purposes. Age - length keys
allow the transformation of length distributions into age distributions which are in turn
essential in the determination of the population demographic structure as well as its
exploitation rates. Different methods have been used in the studies of age determination,
including otolith studies, studies of the vertebrae, etc. In the case of bluefin tuna, the
spines are the most commonly used skeletal parts for age determination. The first ray of
the first dorsal fin is normally used.
This experiment was sponsored by project FAO-COPEMED 'Large Pelagics Programme'.
The author attended a training course in Fuengirola, Spain in order to learn the
methodology applied for spine extraction and reading. The course was delivered by Ms.
Cristina Rodriguez from the Spanish Oceanographic Institute in Santander. The necessary
equipment was given to the Malta Centre for Fisheries Sciences by the project FAO
COPEMED and all the collection of dorsal spines and preparation of slides was carried out
in Malta by the author. The slides were then read in the Spanish Oceanographic Institute
in Santander, first by the author and then corroborated by Ms. Rodriguez in order to ensure
validity of results and standard procedures. The results obtained were presented and
published by the author during the annual ICCAT Scientific Committee for Research and
Statistics meeting in 2000.
3.2 Literature review
The dorsal fin spines are the most commonly used skeletal parts for age determination of
bluefin tuna. The first ray of the first dorsal fin is normally used. However many other
57

studies have been carried out using other bony structures like vertebrae or otoliths (Prince
et al., 1985). The otoliths are difficult to find since they are quite small compared with the
size of the head and moreover the head of tunas is very fleshy and bloody. This means that
if one can accurately pinpoint where the cut must be done, the probability of finding them
is enhanced. Tuna otoliths are rather dense and ridged, so it is necessary to prepare
sections about 0.34 mm thick.
Both vertebrae and spines present difficulties to age interpretation of large bluefin tuna.
Age reading from vertebrae differs depending on whether the whole vertebra is used or
only a horizontal section (Prince et al., 1985). Many techniques have been developed in
order to improve the visualisation of the bands or rings. One of the most common is
staining with alizarin red (Berry et al., 1977). Reading from spines is complicated by the
re-absorption of the nucleus from age 3. Nevertheless, both structures have proved to be
suitable for direct ageing and spines have been used to establish the Mediterranean bluefin
tuna growth parameters (Cort, 1991; Mather et al., 1995).
The advantage of using the dorsal spine is that the extraction and sampling preparation for
reading is more straight forward compared to otoliths or vertebrae. Also the latter involves
the purchase of fish whilst in the first case the damage done to the fish is nearly negligible
and the market price is not affected.
Compean Jimenez & Bard ( 1980, 1983) first started reading fin rays for the purpose of age
reading in bluefin tuna caught from the Atlantic. Rey & Cort ( 1984) worked out a length
age key by reading dorsal rays of Atlantic bluefin tuna. As regards the Mediterranean Sea,
Tserpes & Tsimenides ( 1995) & De Metrio & Megalonfonou ( 1989) studied growth of
other large pelagics by reading transverse sections of rays from the anal fin.
58
Many of these techniques provide good results in ageing younger fish but age estimation of
adult bluefin is more complicated. Reading interpretation of bluefin tuna spines in adult
fish is rather difficult since most of the first rings would have been reabsorbed. One must
then back calculate body size at age based on the relationship that exists between the
growth of the spine and the fish. The diameter of the first complete ring is measured and it
is used to determine the corresponding number of years. Then the subsequent rings are
added on, finally ending up with the estimated age of the bluefin tuna (Cort, 1990).
No previous studies have been made about the population dynamics of bluefin tuna caught
in the Mediterranean (ICCAT, 1997). Age-length keys allow the transformation of length
distributions into age distributions. Knowledge on individual growth is essential for
assessment purposes by means of analytical models. These are essential in order to know
the population demographic structure as well as its exploitation rates thus leading to more
sustainable management.
3.3 Materials and Methods
A total of72 bluefin tuna spines (42 males, 30 females) were collected around the Maltese
Islands during May and June 1999 (Fig.3.1 ), ranging in length from I 06 cm to 290 cm.
From the individual weights of the bluefin tuna, the individual lengths were calculated
using the length - weight conversion for bluefin tuna for the Mediterranean (ICCA T Field
Manual, 1990).
59
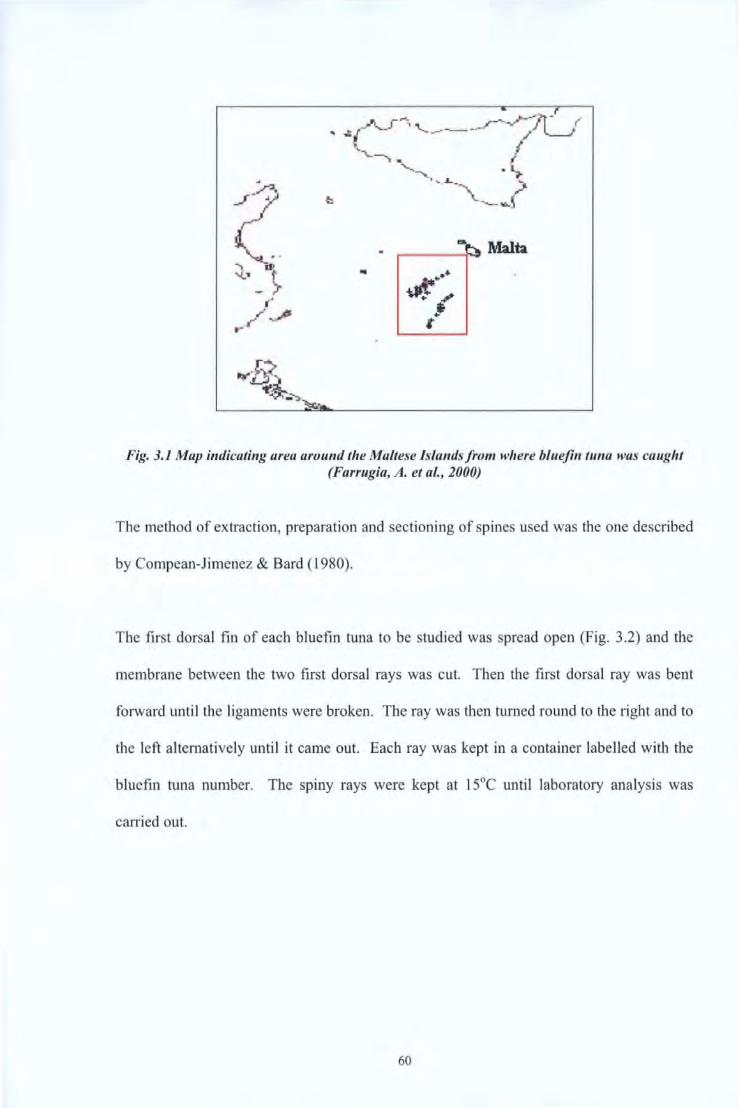
.---""-t<~~ Malta .. ..
~·.,. I
t
Fig. 3.1 Map indicating area around the Maltese Jslands from where bluefin tuna was caught (Farrugia, A. et al., 2000)
The method of extraction, preparation and sectioning of spines used was the one described
by Compean-Jimenez & Bard ( 1980).
The first dorsal fin of each bluefin tuna to be studied was spread open (Fig. 3 .2) and the
membrane between the two first dorsal rays was cut. Then the first dorsal ray was bent
forward until the ligaments were broken. The ray was then turned round to the right and to
the left alternatively until it came out. Each ray was kept in a container labelled with the
bluefin tuna number. The spiny rays were kept at l 5°C until laboratory analysis was
carried out.
60
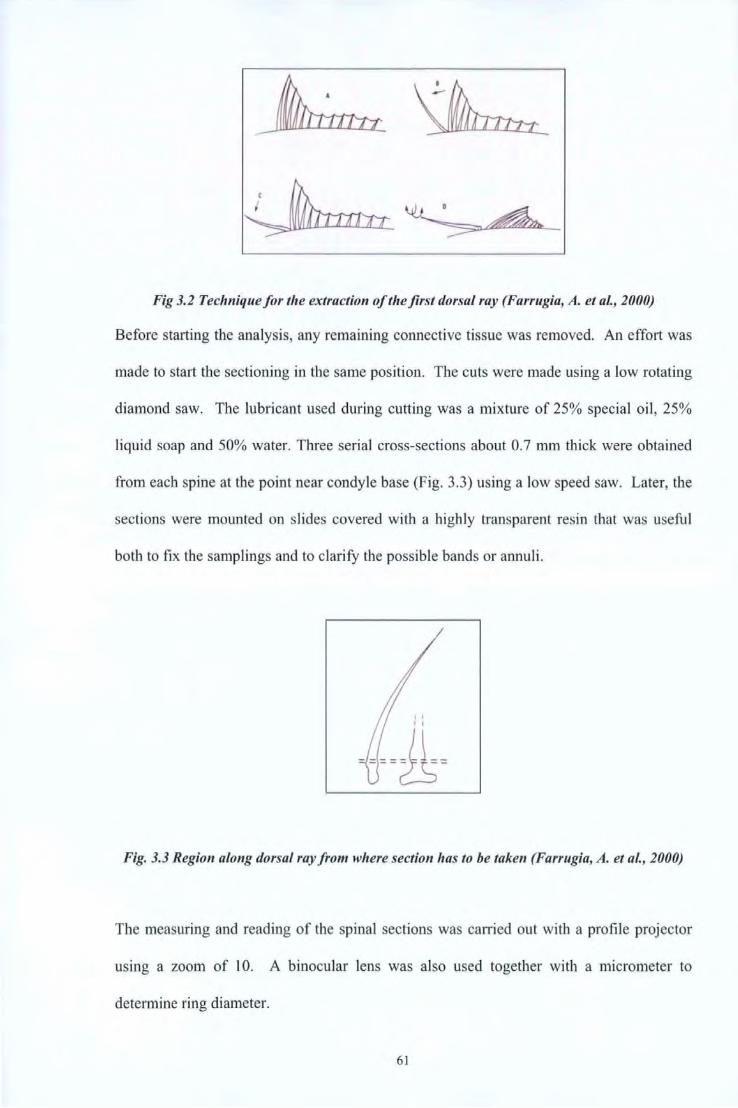
Fig 3.2 Teclmiquefor the extraction ofthefirst dorsal ray (Farrugia, A. et aL, 2000)
Before starting the analysis, any remaining connective tissue was removed. An effort was
made to start the sectioning in the same position. The cuts were made using a low rotating
diamond saw. The lubricant used during cutting was a mixture of 25% special oil, 25%
liquid soap and 50% water. Three serial cross-sections about 0.7 mm thick were obtained
from each spine at the point near condyle base (Fig. 3.3) using a low speed saw. Later, the
sections were mounted on slides covered with a highly transparent resin that was useful
both to fix the samplings and to clarify the possible bands or annuli .
I I I I
-=oolb=
Fig. 3.3 Region along dorsal ray from where section has to be taken (Farrugia, A. et al., 2000)
The measuring and reading of the spinal sections was carried out with a profile projector
using a zoom of 10. A binocular lens was also used together with a micrometer to
determine ring diameter.
61
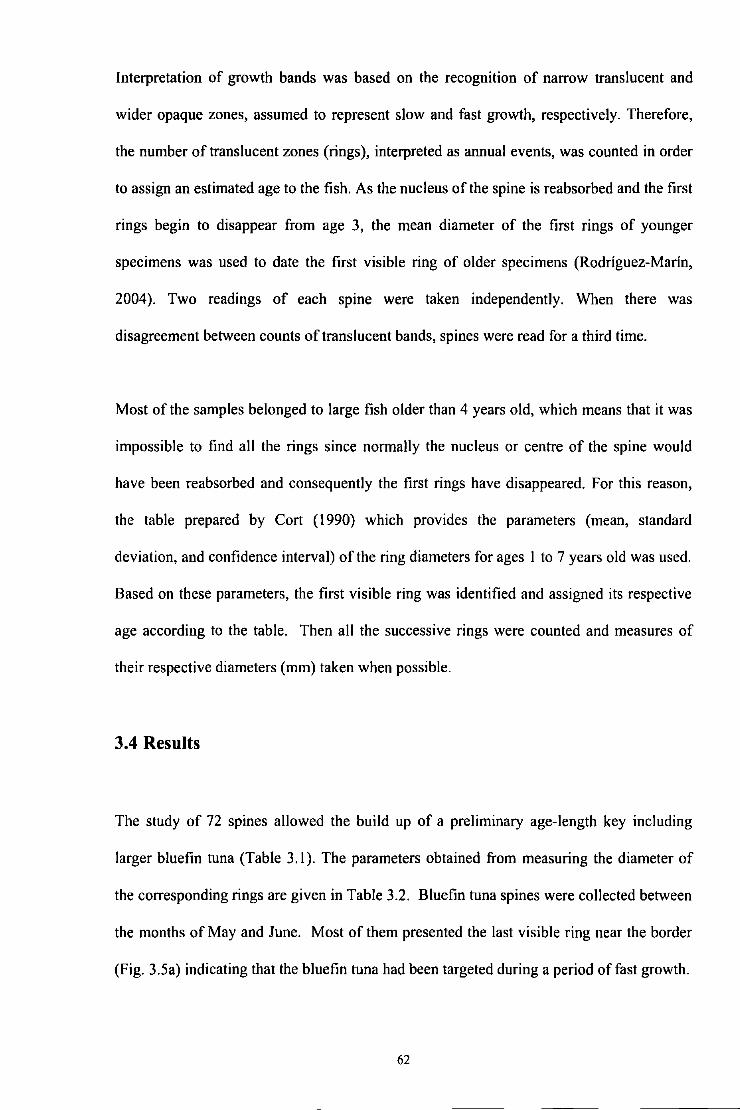
Interpretation of growth bands was based on the recognition of narrow translucent and
wider opaque zones, assumed to represent slow and fast growth, respectively. Therefore,
the number of translucent zones (rings), interpreted as annual events, was counted in order
to assign an estimated age to the fish. As the nucleus of the spine is reabsorbed and the first
rings begin to disappear from age 3, the mean diameter of the first rings of younger
specimens was used to date the first visible ring of older specimens (Rodriguez-Marin,
2004). Two readings of each spine were taken independently. When there was
disagreement between counts of translucent bands, spines were read for a third time.
Most of the samples belonged to large fish older than 4 years old, which means that it was
impossible to find all the rings since normally the nucleus or centre of the spine would
have been reabsorbed and consequently the first rings have disappeared. For this reason,
the table prepared by Cort (1990) which provides the parameters (mean, standard
deviation, and confidence interval) of the ring diameters for ages l to 7 years old was used.
Based on these parameters, the first visible ring was identified and assigned its respective
age according to the table. Then all the successive rings were counted and measures of
their respective diameters (mm) taken when possible.
3.4 Results
The study of 72 spines allowed the build up of a preliminary age-length key including
larger bluefin tuna (Table 3 .l ). The parameters obtained from measuring the diameter of
the corresponding rings are given in Table 3.2. Bluefin tuna spines were collected between
the months of May and June. Most of them presented the last visible ring near the border
(Fig. 3.5a) indicating that the bluefin tuna had been targeted during a period offast growth.
62

The bluefin tuna longline fishery was mostly composed of large fish ranging from 86 to
275 cm (Fig. 3.4). The mean fork length of the whole sample of bluefin tuna was 198 cm
with a standard deviation of 5.6. The demographic composition of the catch made in 1999
is presented in Table 3.3 using the before mentioned age-length key. individuals from
some length classes are missing since it was not possible to assign and age due to the low
number of spines in some length groups.
ln Malta, bluefin tuna are caught during their spawning season and as such large tunas are
caught. Therefore for the larger length groups there were enough samples but not for the
smaller ones. ln general most fish belong to the 8 to 10 years old age group. Fig. 3.5 are
photomicrographs of some of the dorsal spine sections indicating clearly the presence of
the annual rings, the vascularised nucleus and the regions of slow and fast growth.
Although sex data has been recorded, analysis of the spinal sections by sex has not been
possible to perform due to the wide range of lengths and the low number of samples in
each length class. The base data can still be used in the future when more samples will be
collected in order to prepare a different age length key for male and female bluefin tuna.
63
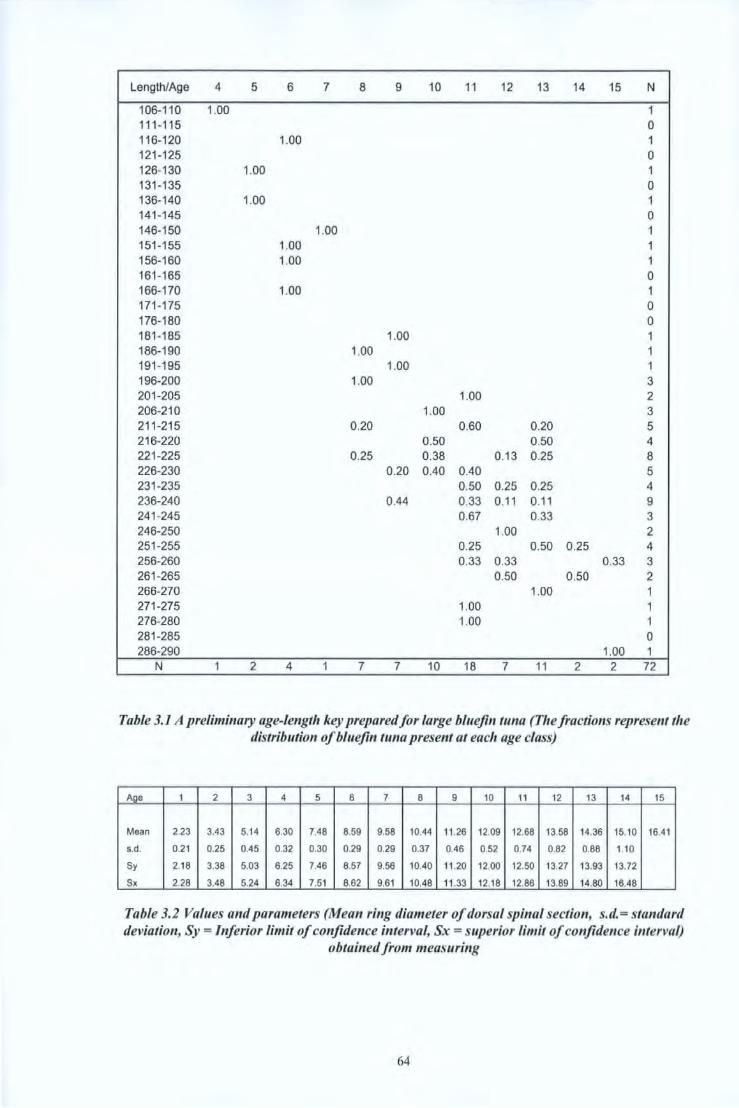
Length/Age 4 5 6 7 8 9 10 11 12 13 14 15 N
106-110 1.00 1 111-115 0 116-120 1.00 1 121 -125 0 126-130 1.00 1 131-135 0 136-140 1.00 1 141-145 0 146-150 1.00 1 151-155 1.00 1 156-160 1.00 1 161 -165 0 166-170 1.00 1 171-175 0 176-180 0 181-185 1.00 1 186-190 1.00 1 191-195 1.00 1 196-200 1.00 3 201-205 1.00 2 206-210 1.00 3 211-215 0.20 0.60 0.20 5 216-220 0.50 0.50 4 221-225 0.25 0.38 0.13 0.25 8 226-230 0.20 0.40 0.40 5 231 -235 0.50 0.25 0.25 4 236-240 0.44 0.33 0.11 0.11 9 241-245 0.67 0.33 3 246-250 1.00 2 251-255 0.25 0.50 0.25 4 256-260 0.33 0.33 0.33 3 261 -265 0.50 0.50 2 266-270 1.00 1 271-275 1.00 1 276-280 1.00 1 281-285 0 286-290 1.00 1
N 1 2 4 1 7 7 10 18 7 11 2 2 72
Table 3.1 A preliminary age-length key prepared for large bluejin tuna (The fractions represent the distribution of bluejin tuna present at each age class)
Age 1 2 3 4 5 6 7 8 9 10 11 12 13 14 15
Mean 2.23 3.43 5.14 6.30 7.48 8.59 9.58 10.44 11 .26 12.09 12.68 13.58 14.36 15.10 16.41
s.d. 0.21 0.25 0.45 0.32 0.30 0.29 0.29 0.37 0.46 0.52 0.74 0.82 0.88 1.10
Sy 2.18 3.38 5.03 6.25 7.46 8.57 9.56 10.40 11 .20 12.00 12.50 13.27 13.93 13.72
Sx 2.28 3.48 5.24 6.34 7.51 8.62 9.61 10.48 11 .33 12.18 12.86 13.89 14.80 16.48
Table 3.2 Values a11d parameters (Mean ri11g diameter of dorsal spinal section, s.d.= standard deviation, Sy = Inferior limit of confidence interval, Sx =superior limit of confidence interval)
obtained from measuring
64
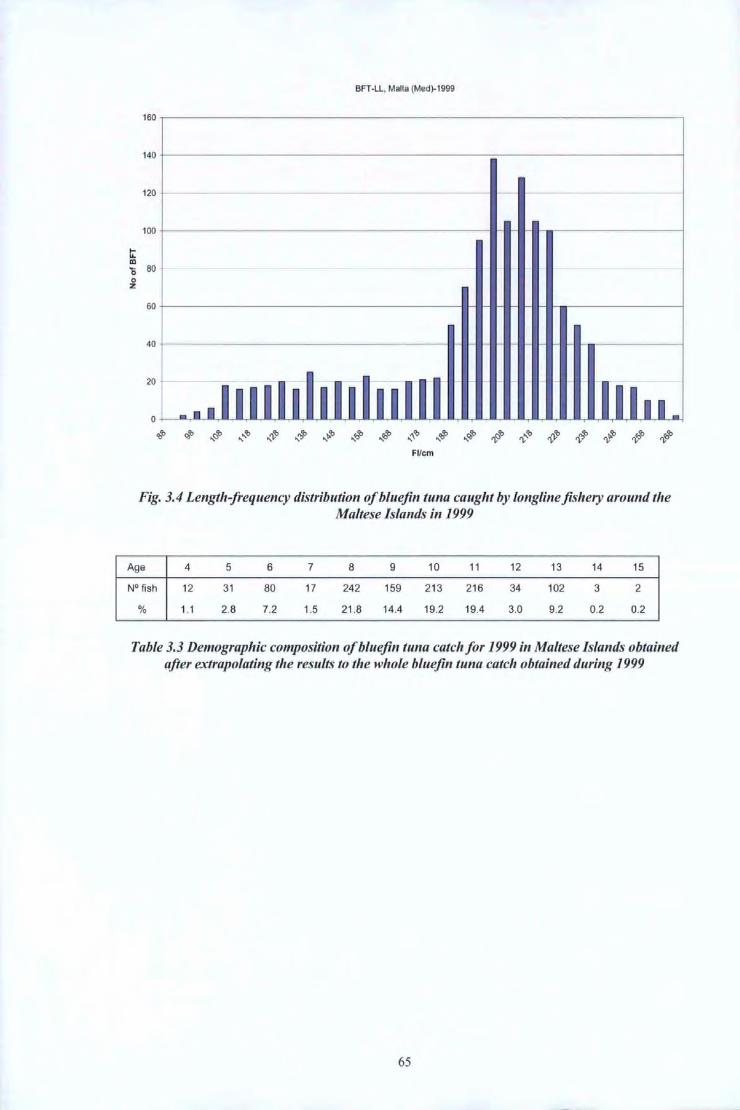
BFT-LL, Malta (Med)-1999
160 .----------------------------------------------------------------,
140 ~--------------------------------------~~--------------------~
120
100 r---------------------------------------~·----~~--------------~
t: m 0 80 0 z
60 r-------------------------------------l~~.-.---·~--------------~
"I 20
File m
Fig. 3.4 Length-frequency distribution of bluefin tuna caught by longline fiShery around the Maltese Isla11ds in 1999
Age 4 5 6 7 8 9 10 11 12 13 14 15
N° fish 12 31 80 17 242 159 213 216 34 102 3 2
% 1.1 2.8 7.2 1.5 21 .8 14.4 19.2 19.4 3.0 9.2 0.2 0.2
Table 3.3 Demographic composition ofbluefin tuna catch for 1999 in Maltese Islands obtained after extrapolating the results to the whole bluejin tuna catch obtained during 1999
65
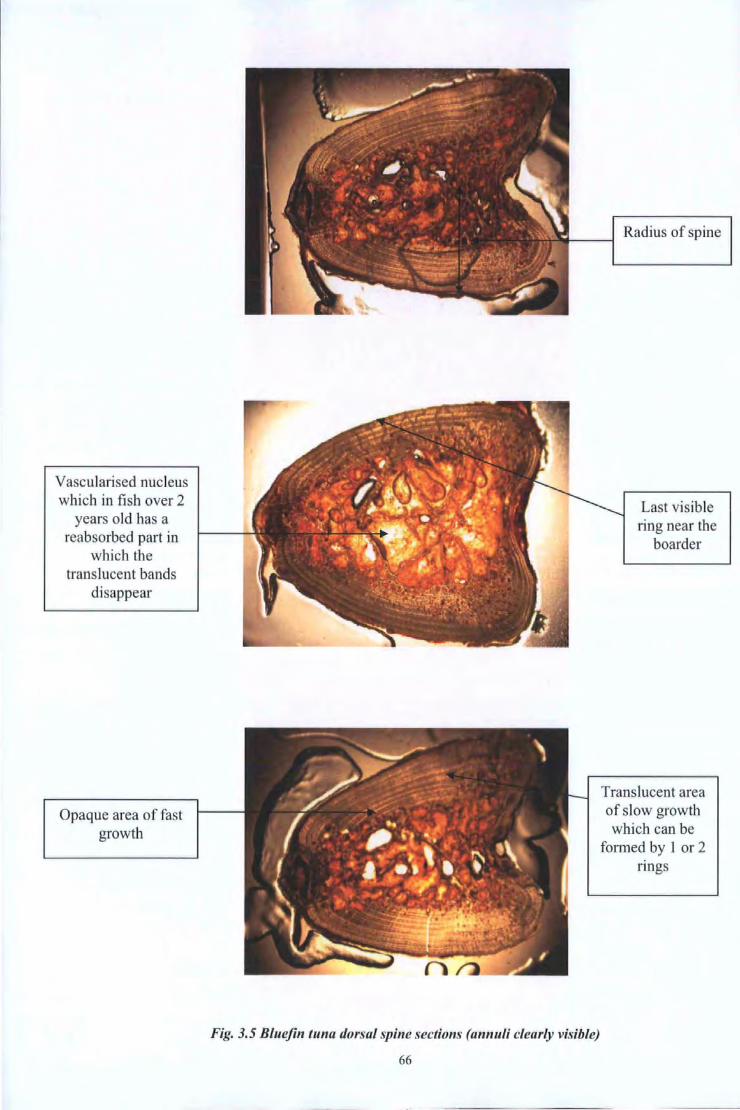
Vascularised nucleus which in fish over 2
years old has a reabsorbed part in
which the translucent bands
disappear
Opaque area of fast growth
Fig. 3.5 Bluefin tuna dorsal spine sections (annuli clearly visible)
66
Radius of spine
Last visible ring near the
boarder
Translucent area of slow growth which can be
formed by 1 or 2 nngs
3.5 Discussion
Values obtained in Table 3.1 are in good agreement with those obtained by Rey et al.,
( 1984) and Cort ( 1990). The latter studies had only been carried out on young tuna (up to
8 years of age).
The readings of these dorsal spines allowed the creation of a preliminary age-length key
for larger bluefin tuna up to the age of 15 years. The number of collected spines is rather
small and as such the collection and reading of more spines will allow the creation of a
more reliable age-length key.
As most of the bluefin tuna dorsal spines were collected during the Maltese bluefin tuna
season, i.e. between May and July, the last visible ring was found very close to the edge
and therefore was not taken into account in ageing. Regrettably, some of the length classes
were not satisfactorily represented since these length groups were less abundant. As such,
collection and reading of spines should continue. But, in general, the age-length key is
very representative of the length distribution of the bluefin tuna landed by longlines and
provides an important stage for future studies.
Differences in age and growth between males and females usually exist as has already been
described by other authors for the western stock (Butler et al., 1977; Hurley et al., 1981 ).
The collection of new data will allow the construction of age length keys taking into
account sex.
67

!f:hese age = ;Jeilgth' keys Wili provide essential. information in, all aspects of studies• carriedi
,out on bluefin' tuna• lnr this rcase,,this ag~:: -II~Qgthi ]{ey willlbe,llsecll iii therdeteitrlihatioh of
;age:at":first rriaturitwas willtbe;explained in ithe:nextchapters.
~68

3.6 Summary
I. Age determination by a range of methods has proved elusive especially in older fish.
2. This age - length key will allow the determination of the age of bluefin tuna up to the age
of 16 years. This key will provide essential information in all aspects of studies carried
out on bluefin tuna. ln this study, this will be used to determine the age at first maturity in
the experiments of reproduction.
3. As yet no age - length key has been determined for large bluefin tuna caught in the
Atlantic. This study will serve as an important step in deepening research in this field.
4. Further studies will allow age determination for bluefin tuna caught in the Atlantic. This
could then be compared with the age-length key of the Mediterranean. If significant
differences are found, this would further confirm the presence of a permanent residing
bluefm tuna stock in the Mediterranean Sea.
69
ASSESSING'THE iRIEPRODUCTfVE S:TA:TUS~OF
BLUEF:O:N 'FUN A FN, lfHIE 'MEDITERRAiNE'ANI
4.1 Introduction
The presence of potential spawning areas in a particular region could be an indication for
the completion of a full life cycle. The proposed methodology of this study was to
determine the gonadosomatic index of female bluefin tuna and then study it in relation with
the qualitative stage of the gonads. This can be based on histological studies in which the
development of the ovary cycle, the presence or absence of atresia and the presence of
postovulatory follicles can be determined. This would help to further confirm the presence
of an independent resident stock within the Mediterranean.
Although no specific studies have been carried out on the age at first sexual maturity of
bluefin tuna, there is some evidence of the presence of a difference in the attainment of the
first sexual maturity between the western and the eastern Atlantic populations. The aim of
this part of the experiment was to identify the size and age of first sexual maturity for
female bluefin tuna caught in the Mediterranean and to determine whether it differs from
that of the Atlantic stocks.
FAO-COPEMED 'Large Pelagics Project' sponsored the first part of the experiment. The
author collected all the female bluefin tuna samples for the first part of the experiment.
Two other observers, one in Italy and one in Spain helped in the collection of samples for
the second part of the experiment.
The author attended courses with regards to reproductive studies in Malaga, Spain. All
courses were delivered by Dr. David Macias, University of Malaga, Spain. Histological
samples were all prepared in Malta but then reading was done in Spain both by the author
71

and by Dr. David Macias in order to ensure validity of results. A paper has been prepared
and has been accepted by the Journal of Applied lchtyology for publishing.
4.2 Literature review
The Western Mediterranean and the Adriatic Sea are considered to be spawning areas for
bluefin tuna (Piccinetti, 1980). The highest concentrations of bluefin tuna larvae are found
in the south of Italy, to the north of Sicily and around the Balearic Islands (Dicenta, 1975,
Piccinetti, 1995). The spawning season of bluefin tuna extends from June to July in areas
with a surface temperature in the region of 24 °C (Arena, 1979).
A popular method used for the study of the sexual maturity is the calculation of the
gonadosomatic index (West, 1990; De Martini et al., 2000). This method, which is both
fast and cheap, expresses the developmental stage of the gonads in terms of gonad weight
to fork length ratio (Wootton, 1990). Unfortunately, the gonadosomatic index alone,
although able of providing useful proxies of reproductive activity, is not a reliable
parameter to distinguish between mature inactive and immature fish (West, 1990; De
Martini et al., 2000). Thus its use can introduce a consistent bias in the determination of
the size at sexual maturity.
An obsolete methodology for the calculation of the sexual maturity is represented by the
use of macroscopic arbitrary scales (Nikolsky, 1963; Holden & Raitt, 1974; Rodriguez
Roda 1964, 1967). This kind of classification, in addition to the same limitations of the
gonadosomatic index, depends on the subjective interpretation of the observer. Thus, the
histological analysis of ovaries represents the only reliable, although more expensive,
method for the assessment of sexual maturity in fish (West, 1990).
72
Western Atlantic bluefin tuna sometimes mature as early as age 6 and are considered fully
mature by age 8, at a weight of 135 kg (Baglin, 1982; NRC, 1994). This corresponds to
190 cm fork length when applying the weight-length conversion factor provided by
ICCAT (Field Manual, 1990) whereas Rodriguez-Roda ( 1967) found that Mediterranean
bluefin tuna seem to mature as early as age 3, at a weight of 15 kg and be fully mature by
age 5.
Reports from the Scientific Committee for Research and Statistics (ICCAT) have assumed
that bluefin tuna first spawn successfully at age 8 in the Atlantic compared to age 5 in the
Mediterranean. However, according to de la Serna et al. ( 1999), age at first maturity in
the Mediterranean occurs before the estimated ages. This may be due to the different
environmental conditions. Some scientists even attribute this different behaviour to over
fishing.
Taking into consideration that identifying the age at first maturity of highly exploitable
fish species like bluefin tuna is critical for the effective management (Huppell & Sullivan,
2000, SCRS, 200 I) extensive investigation to study reproductive studies and age at first
maturity was proposed. Also if different ages for the Mediterranean and the Atlantic
could be fully proven, this could lead to the conclusion that the Mediterranean population
is a different sub population with its own characteristic features.
During the last 5 years, the Standing Committee for Research and Statistics (SCRS) of
ICCAT has strongly recommended more research to further enhance the reproductive
studies of bluefin tuna since these are essential for the sustainable management of
populations.
73

4.3 Materials and Methods
4.3.1 Reproductive Studies
Sex determination of bluefin tuna can only be done by directly examining the internal
organs. Thus, information on sex could only be obtained from carcasses that have not yet
been eviscerated.
The gonads of bluefin tuna can be found in the ventral part of the body cavity and in
sexually mature fish; both male and female gonads are often over 30 cm long.
Distinguishing between male and female tuna is relatively easy. Male gonads have a
relatively uneven appearance and irregular shape, with many nodules present on the
external surface. Cross sections of male gonads have a characteristic rectangular shape and
when sexually ripe, milt is easily seen. In contrast females generally have a smooth
external appearance and in cross section, the gonad is oval in shape and occasionally has a
hole (or lumen) in the middle.
Five Maltese fishermen were asked to retain bluefin tuna on board as a whole fish i.e.
without removing the gills and guts. Upon arrival to the main landing port in Malta, the
author went to do the observations and collect the necessary samples. First identification
of sex was carried out and then the female gonads that were identified were weighed on
board using a small electronic scale.
This measurement was then used to calculate the Gonadosomatic Index (according to
Kume & Joseph, 1969) of bluefin tuna. The Gonadosomatic Index is a numerical value
74

which gives an indication of the maturity stage of the organism. It can be calculated as
follows:
Gonadosomatic Index =Weight of Gonads in g x 104
(Fork Length of Fish in cm) 3
From the value obtained, one can get an idea of the maturity stage of the fish. It also gives
an indication of the type of eggs present at different size classes.
Samples were also collected from all the 48 female gonads observed in order to study the
absolute fecundity of the species by means of histological studies. In the case of the
gonads, the samples taken were a cross section throughout the whole thickness of the ovary
because it has been demonstrated that the size and the maturity of oocytes vary radially
along the distance to the ovary centre in several teleostean fish species (Emerson et al.,
1990).
In each case, small samples of tissue were cut using a chemically cleaned scalpel as soon
as the fish was gutted. The histological processing entails the risk of variation in the
volume of tissues as well as their deformation. In the case of gonads, these variations
usually increase as the follicular development progresses. In order to avoid these as much
as possible, each sample was kept in a small bottle labelled with the tag number and full of
phosphate buffered formalin. In order to preserve the tissues well it was made sure that the
tissues for preservation did not exceed a volume of 5 cm3, that they were cut as soon as
possible and that the volume of the phosphate buffered formalin in each sample bottle was
always three times as much as the volume of the tissue.
75
In the laboratory the phosphate buffered fonnalin in each sample bottle was replaced with
a fresh solution. Afterwards the sample bottles were kept in a cool place until the
histological analysis could be perfonned.
Before starting the embedding in wax, it was important to take the tissue sample out of the
sample bottle and dry the excess fixative solution. Then a sample of around 0.5 cm
thickness was cut. This was then washed in phosphate buffered fonnalin for three times
(20 minutes each), dehydrated in a series of ethanol solutions of increasing concentration,
n-butylic alcohol and embedded in paraffin wax using an automatic tissue processor.
After the excess n-butyl alcohol was drained, the samples were submerged in liquid wax at
60 °C for 2 hours. The samples were then transferred to another container full of liquid
wax and left there for 2 hours for embedding.
5 J.lm thick sections were cut using a microtome. Before cutting, each paraffin block was
carved in a truncated pyramid fonn so that in the sectioning the order of the same series
could be easily recognisable.
During cutting the preferred thickness was in the range of 5 and I 0 micrometres since this
is the thickness of a mature oocyte. For each sample, the maximum number of sections
that fit the glass was taken. At least, two separated samples with a minimum distance
equal to the diameter of an oocyte of the greatest size were cut.
The samples were then stretched in a bath with distilled water at 40 °C. Once stretched,
the sections were gathered with the glass properly labelled and that would have been
previously treated with an adherent solution (poly-1-lysine, 0.02% in distilled water).
Sections were then dried for a minimum of24 hours in an oven at 37 °C. 76

The procedure shown below was used to dewax and stain the samples with Mallory's
Trichrome stain.
Xylene 10 minutes
Xylene 10 minutes
Xylene 10 minutes
Alcohol, I 00% 5 minutes
Alcohol, 100% 5 minutes
Alcohol, 96% 5 minutes
Alcohol, 96% 5 minutes
Alcohol, 70% 5 minutes
Alcohol, 50% 5 minutes
Rinse in distilled water 5 minutes
Sublimate corrosive 20 minutes
Distilled water, just rinse
Fuschin acid I minute
Distilled water, just rinse
Phosphomobilic acid 75 seconds
Distilled water, just rinse
Liquid Mallory 75 seconds
Distilled water, just rinse
The sections were then dehydrated after the stain by immersing in 96 % ethanol for 5
minutes and by immersing in absolute ethanol I 00 % for another 5 minutes.
77

The stain was then fixed with eucalyptol for 15 minutes and clarified with xylene for 10
minutes. Slides were mounted with DPX. After keeping for 24 hours at 37 °C for the
polymerisation of the mounting media, the sections were ready for microscopic
examination.
All slides were carefully observed under the microscope and then photographs were taken
using the camera attached to the microscope. Photographs were taken both under low and
high power.
To estimate the reproductive condition of bluefin tuna, two different histological
classifications systems were used, one for estimating sexual maturity and the other for
assessing the activity stage of mature females. Each ovary was histologically classified
according to both systems (Hunter & Goldberg, 1980).
A female is considered sexually mature when it has the capability of reproduction in a
determinate spawning season. Histological signs of sexual maturity are the presence in the
ovary of yolked oocytes, hydrated oocytes or post ovulatory follicles. The immature
females that have not yet reached sexual maturity are unable to reproduce in a determinate
season.
Four different stages of sexual activity have been considered:
• Inactive females: no yolked oocytes and no atresiac structures present
• Prespawning females: these females show signs of an imminent spawnmg like
hydrated oocytes or oocytes present in the nuclear migration phase. In this case, no
78
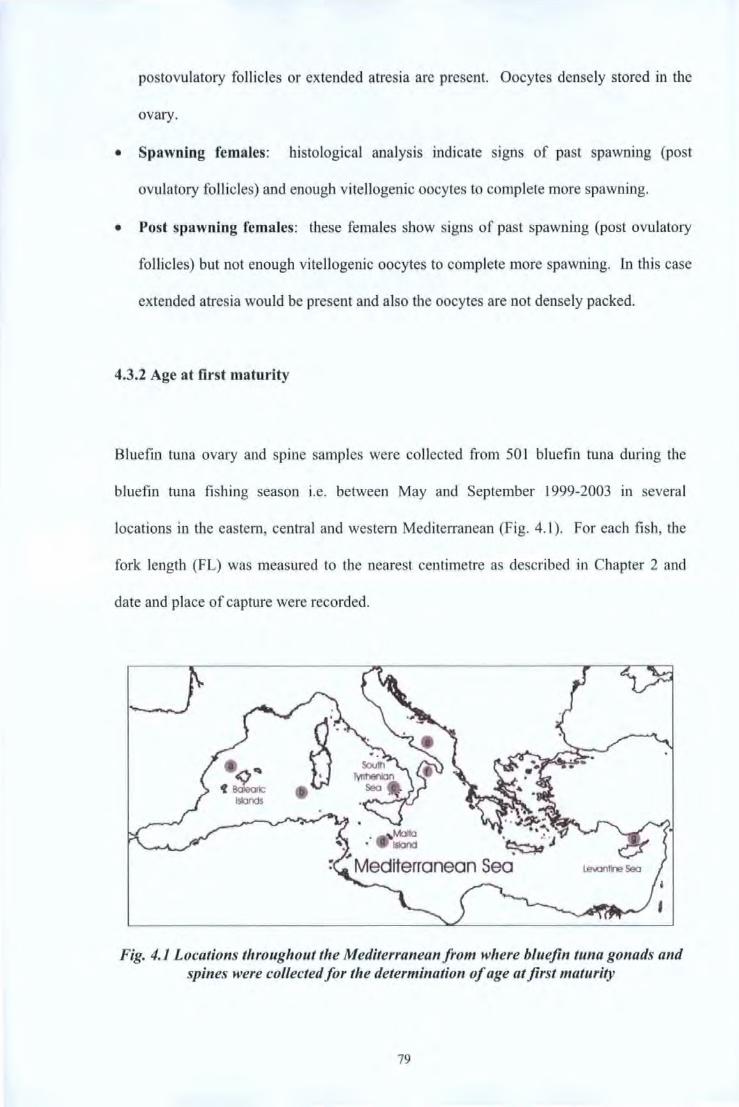
postovulatory follicles or extended atresia are present. Oocytes densely stored in the
ovary.
• Spawning females: histological analysis indicate stgns of past spawnmg (post
ovulatory follicles) and enough vitellogenic oocytes to complete more spawnjng.
• Post spawning females: these females show signs of past spawning (post ovulatory
follicles) but not enough vitellogeruc oocytes to complete more spawning. In this case
extended atresia would be present and also the oocytes are not densely packed.
4.3.2 Age at first maturity
Bluefm tuna ovary and spine samples were collected from 501 bluefin tuna during the
bluefin tuna fishing season i.e. between May and September 1999-2003 in several
locations in the eastern, central and western Mediterranean (Fig. 4.1 ). For each fish, the
fork length (FL) was measured to the nearest centimetre as described in Chapter 2 and
date and place of capture were recorded.
Fig. 4.1 Locations throughout the Mediterranean from where bluefin tuna gonads and spines were collected for the determination of age at first maturity
79
Ovary slices were fixed in 10% buffered formalin and histological analysis was carried out
as described above in section 4.3.1. Oocyte atresic stages were classified according to
Hunter and Macewicz (1985). On the basis of the classification scheme used, the
distinction between immature and mature inactive fish was based on the presence of atresia
ofvitellogenic follicles, sign of past reproductive activity. As previously reported (Corriero
et al., 2003), no sign of atresia can be observed in bluefin tuna captured some months after
the reproductive season. Therefore, for the present study the only samples used were those
collected during a temporal window (May-September). This allowed a clear distinction
between mature and immature specimens.
The body length at median sexual maturity (L50) was estimated using nonlinear regression.
A derivative-free maximum likelihood method (Proc NLIN; SAS, 1989) was used to fit
percentage maturity by 5 cm length class to the two-parameter logistic model,
P, = 100/(1 +exp(a-bFL))
Where P = percentage mature at length x; and
Lso = ( -alb ).
4.4 Results and Discussion
4.4.1 Reproductive Studies
From the analysis of the data of Table 4.1, the female bluefin tuna caught around the
Maltese Islands, were present during their spawning season and all of them were adults.
The mean gonadosomatic index for the whole sample was 4.75 with a standard deviation
80
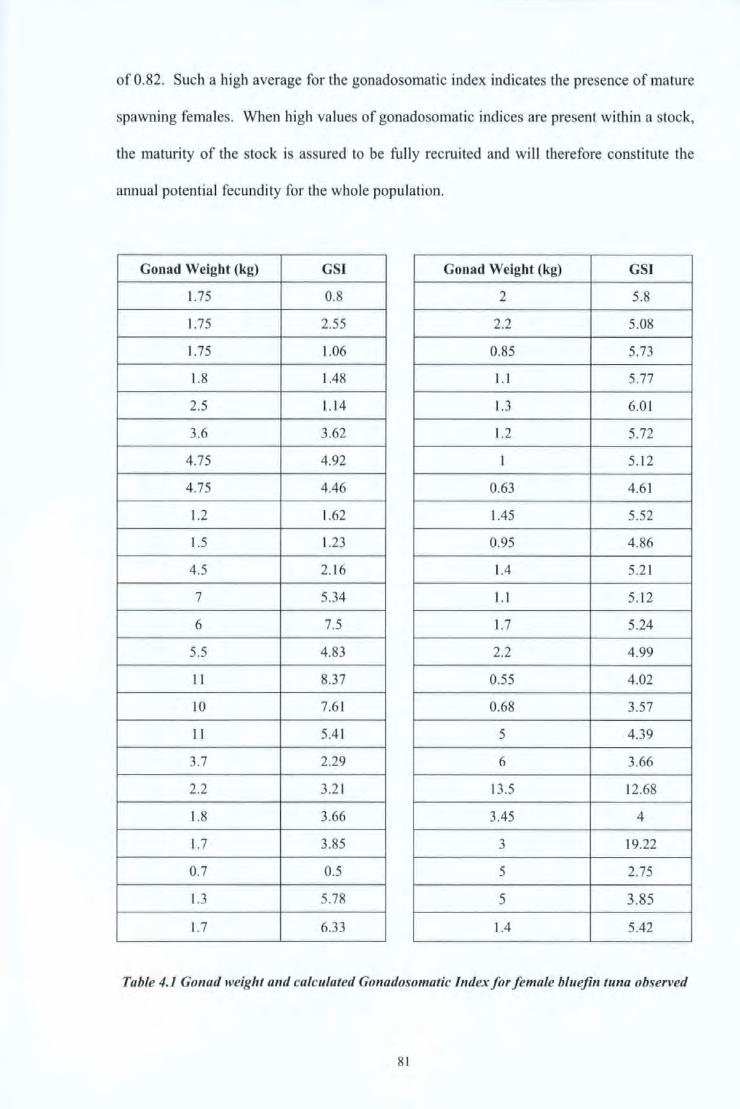
of 0.82. Such a high average for the gonadosomatic index indicates the presence of mature
spawning females. When high values of gonadosornatic indices are present within a stock,
the maturity of the stock is assured to be fully recruited and will therefore constitute the
annual potential fecundity for the whole population .
Gonad Weight (kg) GSI Gonad Weight (kg) GSI
1.75 0.8 2 5.8
1.75 2.55 2.2 5.08
1.75 1.06 0.85 5.73
1.8 1.48 I. I 5.77
2.5 1.1 4 1.3 6.01
3.6 3.62 1.2 5.72
4.75 4.92 I 5.12
4.75 4.46 0.63 4.61
1.2 1.62 1.45 5.52
1.5 1.23 0.95 4.86
4.5 2. 16 1.4 5.2 1
7 5.34 1.1 5. 12
6 7.5 1.7 5.24
5.5 4.83 2.2 4.99
! I 8.37 0.55 4.02
10 7.6 1 0.68 3.57
11 5.4 1 5 4.39
3.7 2.29 6 3.66
2.2 3.2 1 13.5 12.68
1.8 3.66 3.45 4
1.7 3.85 3 19.22
0.7 0.5 5 2.75
1.3 5.78 5 3.85
1.7 6.33 1.4 5.42
Table 4.1 Gonad weight and calculated Gonadosomatic Index for f emale bluejin tuna observed
81

Histological studies carried out on bluefin tunas caught by the Maltese longliners further
confirm that all the bluefin tuna females studied were mature. These females contained a
large number of yolked oocytes, nuclear migration stage oocytes or postovulatory follicles.
All these factors suggest an imminent or recent spawning period.
Regarding the activity stages, the studied bluefin tuna ovaries could be classified in three
different stages (Fig. 4.2, 4.3 and 4.4):
12 ovaries (or 25 % of the whole sample) were in the prespawning stage;
34 ovaries (or 70 % of the whole sample) were in the spawning period and had enough
vitellogenjc oocytes to complete several more spawnings in the same season;
whilst the remaining 2 ovaries (or 5 % of the whole sample) showed completely spent
ovaries.
Fig. 4.2 A and B Microphotographs of gonads of bluefin tuna caught in Malta. Mature spawning BFT female showing hydrated oocytes (Microphotograplts taken at the Histological
Laboratory of /EO Malaga, Spain
82

Fig. 4.3 C and D Microphotographs of gonads of b/ueji11 tuna caught in Malta) Mature female showing atresia and postovulatory follicles. (Microphotographs taken at the Histological
Laboratory of /EO Malaga, Spai11
Fig. 4.4 Microphotographs of gonads ofbluefin tuna caught in Malta. E Immature female F Mature male (Microphotographs taken at the Histological Laboratory of /EO Malaga, Spain)
The above results were compared to similar works carried out in the Mediterranean.
Hattour, A. (2002) carried out histological analysis of bluefin tuna ovaries coming from
Tunisian purse seiners. These had been caught during the months of April and May, 2001.
Results showed that in this case the bluefin tunas were present in a prespawning stage and
that they were going to spawn imminently, possibly in the central Medite1Tanean.
The histological analysis of bluefin tuna ovaries caught by Libyan fishermen during the
months of May and June, 2000 showed that all the females were mature with an imminent
or recent spawning period. These results indicate that these tunas were spawning in a
83
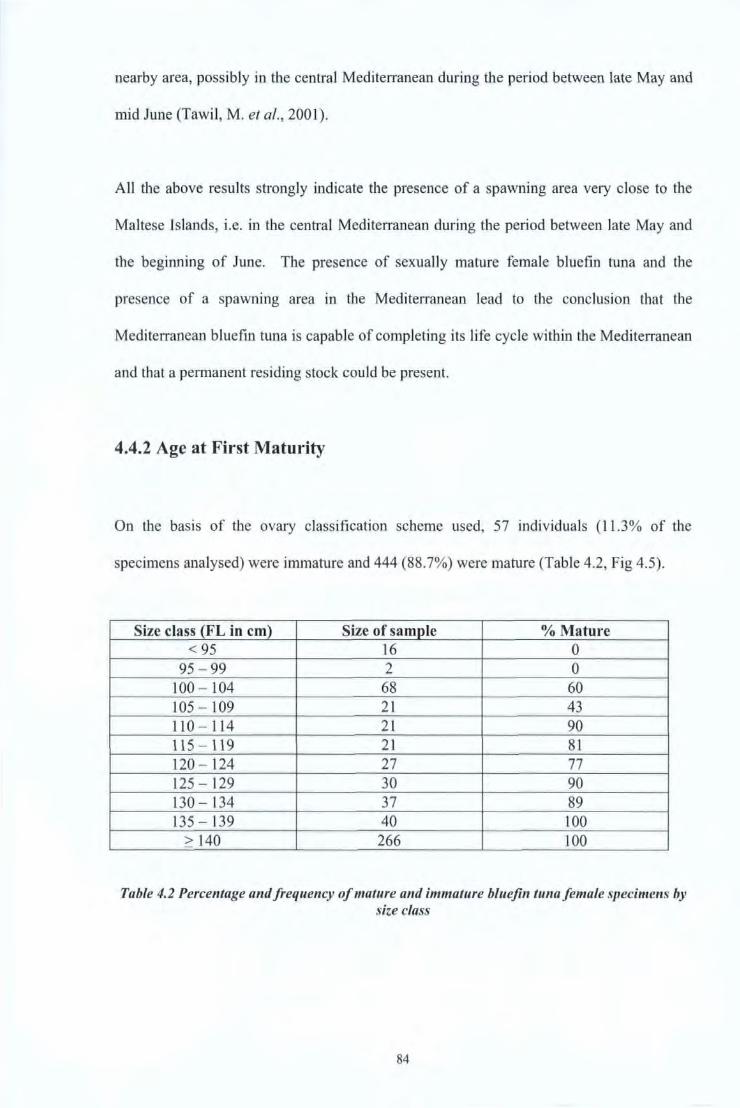
nearby area, possibly in the central Mediterranean during the period between late May and
mid June {Tawil, M. et al., 2001).
All the above results strongly indicate the presence of a spawning area very close to the
Maltese Jslands, i.e. in the central Mediterranean during the period between late May and
the beginning of June. The presence of sexually mature female bluefin tuna and the
presence of a spawning area in the Mediterranean lead to the conclusion that the
Mediterranean bluefin tuna is capable of completing its life cycle within the Mediterranean
and that a permanent residing stock could be present.
4.4.2 Age at First Maturity
On the basis of the ovary classification scheme used, 57 individuals (11 .3% of the
specimens analysed) were immature and 444 (88.7%) were mature (Table 4.2, Fig 4.5).
Size class (FL in cm) Size of sample %Mature < 95 16 0
95 - 99 2 0 100 - 104 68 60 105 - 109 21 43 110 - 114 21 90 115-119 21 81 120 - 124 27 77 125- 129 30 90 130 - 134 37 89 135 - 139 40 100
2: 140 266 100
Table 4.2 Percentage and frequency of mature and immature bluefin twrafemale specimens by size class
84
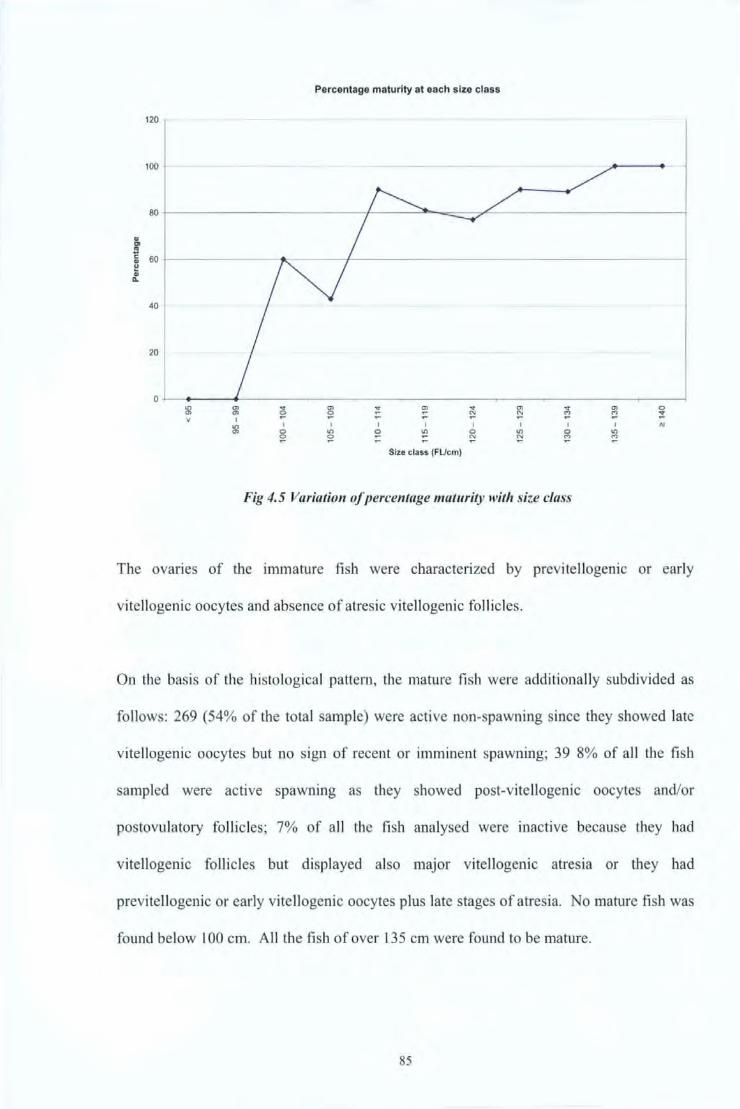
120
100
80
0
"' !! c: 60 .. 1:! ., IL
40
20
oL If) Ol Ol Ol V I
If) Ol
Percentage maturity at each size class
... ~
Ol ... ~ ... ~ N
~
I I I I I 0
~ If) 0 "' 0 ~ ~
Size class (FUcm)
I If) N
I g
Fig 4.5 Variation ofpercentage maturity with size class
I If)
"'
The ovanes of the immature fish were characterized by previtellogenic or early
vi tellogenic oocytes and absence of atresic vitellogenic follicles .
On the basis of the histological pattern, the mature fish were additionally subdivided as
follows: 269 (54% of the total sample) were active non-spawning since they showed late
vitellogenic oocytes but no sign of recent or imminent spawning; 39 8% of all the fish
sampled were active spawning as they showed post-vitellogenic oocytes and/or
postovulatory follicles; 7% of all the fish analysed were inactive because they had
vitellogenic follicles but displayed also major vitellogenic atresia or they had
previtellogen ic or early vi tellogenic oocytes plus late stages of atresia. No mature fish was
found below I 00 cm. All the fish of over 135 cm were found to be mature.
85
All the spines analysed showed the complete formation of the ring corresponding to the
previous year of their life. Among the 20 fish included in the I 00-104 cm size class, 16
belonged to the age group 3 and 4 to the age group 4. The 40 fish contained in the 135-139
cm size class belonged to the age group 4 (4 individuals) and 5 (36 specimens).
In this section, the size of first sexual maturity for the Mediterranean bluefin tuna using a
method based on the statistic elaboration of data coming from the histological analysis (De
Martini et al., 2000) was determined.
On the basis of the macroscopic evaluation of the ovary maturity stage, Rodriguez-Roda
( 1967) estimated that 50% of the female bluefin tuna of the Mediterranean stock are
reproductively active at the size of 97.5 cm (fork length), while I 00% maturity is reached
between 115 and 120 cm. Tawil et al. (200 I) in a preliminary approach to the study of
sexual maturity based on the histological analysis of the ovaries of 21 bluefin tuna,
reported mature specimens above 115 cm (fork length). In a stereological study on bluefin
tuna fecundity, Medina et al. (2002) reported that the smallest mature female sampled in
the Balearic waters was 116 cm FL. During a histological description of the ovarian cycle,
mature females over 110 cm FL were found (Corriero et al., 2003). Since none of the cited
investigations have been carried out with the methodology needed for the determination of
the first sexual maturity, the information provided are nevertheless useful for stock
management and tend to support the evidence of the author's experiment.
The present study, performed on a consistent number of specimens with the required
methodology for this type of research, indicates that 50% of the Mediterranean bluefin tuna
reaches the first sexual maturity at 104 cm (fork length).
86
The analysis of the spines indicates that all the specimens had completed the formation of
the ring corresponding to their previous year of life. This finding is in agreement with Cort
( 1991) and Megalofonou and De Metrio (2000) who reported that ring completion occurs
during April and May for bluefin tuna caught in the Mediterranean. This data indicates that
I 00% maturity is reached at the age of 4-5 years.
In the case of the Western Atlantic, no study reports the size of 50% sexual maturity. The
only data available indicates that maturation starts at the age of 6 and I 00 % maturity is
reached by the age of 8 years at a fork length of 190 cm (NRC, 1994).
87

4.5 Summary
I. The time of spawning and location in the Mediterranean appear established but
methods of determining sexual maturity need to be refined.
2. Adult bluefin tuna targeted in the Mediterranean during the months of May and June
are sexually mature and present during their spawning period.
3. The presence of spawning fish within the Mediterranean indicates that the bluefin tuna
can complete its life span in the Mediterranean without having to migrate into different
waters in order to complete its life cycle.
4. A similar study should be extended to the male bluefin tuna to determine whether they
follow the same reproductive process.
5. Mediterranean bluefin tuna start to mature at age 4-5, having reached a fork length of
100 cm.
6. At age 5-6 and having a fork length of 135 cm all Mediterranean bluefin tuna females
are sexually mature.
7. It can be concluded that for the Mediterranean, female bluefin tuna reach first sexual
maturity at a markedly lower age and size than the western Atlantic population.
8. The difference found between Western Atlantic and the Mediterranean provides further
evidence for the existence of a separate Mediterranean population.
88

THE, DlEVELOPMEN'F OF ELiE~CTRON]]C
illA!GGING lEXPEWMENTA 1']]0N OlF BL~UEFIN
illONAINt:HE' ;1\{EDI!fEimA:NEAN
5.1 Introduction
The argument for the presence of a resident stock in the Mediterranean can be strengthened
through the use of pop off satellite tags which are employed to study the large-scale
movements of large pelagics which frequent the surface.
This tagging section a1ms to identify and describe the migrations and movements of
bluefin tuna within the Mediterranean and also if present between the Mediterranean and
the Atlantic Ocean.
This part of the project was canied out in collaboration with FAO-COPEMED Large
Pelagics Project and Prof. Gregorio de Metrio (University of Bari, Italy). The author was
in charge of all the organisation of work involved. The bluefin tunas were made available
for this research by AJD Tuna Ltd. and Melita Tuna Ltd. Tags were provided by the
University of Bari. The tagging was carried out by Prof. Gregorio de Metrio because of
the very high costs of equipment involved and due to the critical situation of the bluefin
tuna once on board the fishing vessel no errors could be risked. Decoding of data was all
carried out in the University of Bari.
5.2 Literature review
To understand better the life history of bluefin tuna and develop competent management
strategies, temporal and spatial movement patterns must be identified (Gulland, 1983).
Data on bluefin tuna dispersal patterns have been difficult to obtain because of the limited
resolution of analytical tools available for studying pelagic fish. To date, tag and recapture
programs using conventional tags (fisheries dependent indicators of movement) have been
90
the method of choice for describing the distribution of Atlantic bluefin tuna (Lehodey et
al., 1997).
Conventional tags and released data indicate that trans Atlantic movements of all size
classes of Atlantic bluefin tuna occur (Brunemeister, 1980; Cort et al., 1993; Mather et al.,
1995). Recently microprocessor-based, data storage tags (archival tags) have been
developed for monitoring the geoposition (based on ambient light levels), thermal
physiology and diving behaviour of large pelagic vertebrates (Block et al., 1998; De long et
al., 1992; Metcalfe et al., 1997).
Although the data intensity of archival tags is high (2 megabytes), their major limitation is
the need to recapture the animal to access the data. This requires the deployment of large
numbers of tags in species with high exploitation rates. In addition, the multinational
nature of most oceanic fisheries complicates the coordination of archival tag recoveries.
Archival tags have been deployed recently on Atlantic bluefin tuna (Block et al., 1998) but
significant numbers of returns take years to retrieve. Block et al., (2005) analyzed the data
over a nine-year period and discovered that bluefin tuna have a complex migratory life
cycle that varies depending on the season, as well as the age and body size of the fish.
Satellite tags (conventionally towed or attached) have been employed to study the large
scale movements and physiology of marine mammals, birds and sea turtles (Jouventin et
al., 1990; Kooyman et al., 1996; Me Connell et al., 1992; Papi et al., 1995; and Renaurd et
al., 1994). These tags have been deployed successfully to basking sharks (Preide, 1984)
but are only applicable for the largest pelagic fishes that frequent the surface. The new pop
off methodology will broaden the scope of satellite tag utility to most large pelagic
orgamsms.
91
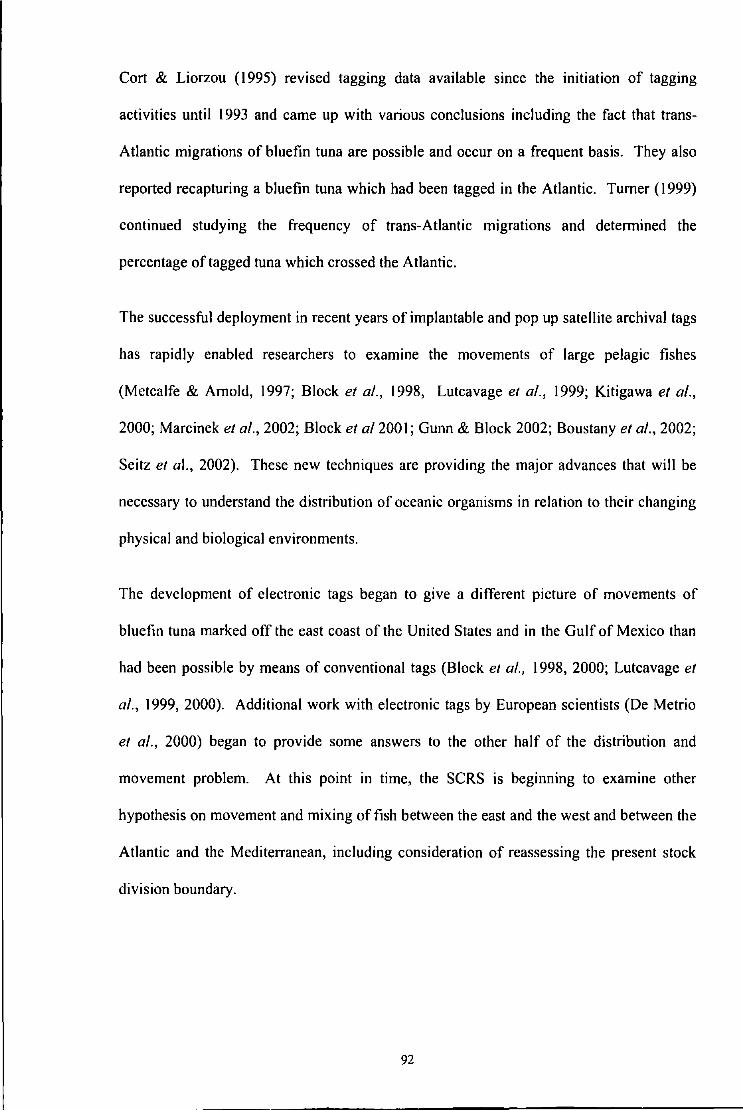
Cort & Liorzou {1995) revised tagging data available since the initiation of tagging
activities until 1993 and came up with various conclusions including the fact that trans
Atlantic migrations of bluefin tuna are possible and occur on a frequent basis. They also
reported recapturing a bluefin tuna which had been tagged in the Atlantic. Turner ( 1999)
continued studying the frequency of trans-Atlantic migrations and determined the
percentage of tagged tuna which crossed the Atlantic.
The successful deployment in recent years of implantable and pop up satellite archival tags
has rapidly enabled researchers to examine the movements of large pelagic fishes
(Metcalfe & Amold, 1997; Block et al., 1998, Lutcavage et al., 1999; Kitigawa et al.,
2000; Marcinek et al., 2002; Block et al2001; Gunn & Block 2002; Boustany et al., 2002;
Seitz et al., 2002). These new techniques are providing the major advances that will be
necessary to understand the distribution of oceanic organisms in relation to their changing
physical and biological environments.
The development of electronic tags began to give a different picture of movements of
bluefin tuna marked off the east coast of the United States and in the Gulf of Mexico than
had been possible by means of conventional tags (Block et al., 1998, 2000; Lutcavage et
al., 1999, 2000). Additional work with electronic tags by European scientists (De Metrio
et al., 2000) began to provide some answers to the other half of the distribution and
movement problem. At this point in time, the SCRS is beginning to examine other
hypothesis on movement and mixing of fish between the east and the west and between the
Atlantic and the Mediterranean, including consideration of reassessing the present stock
division boundary.
92
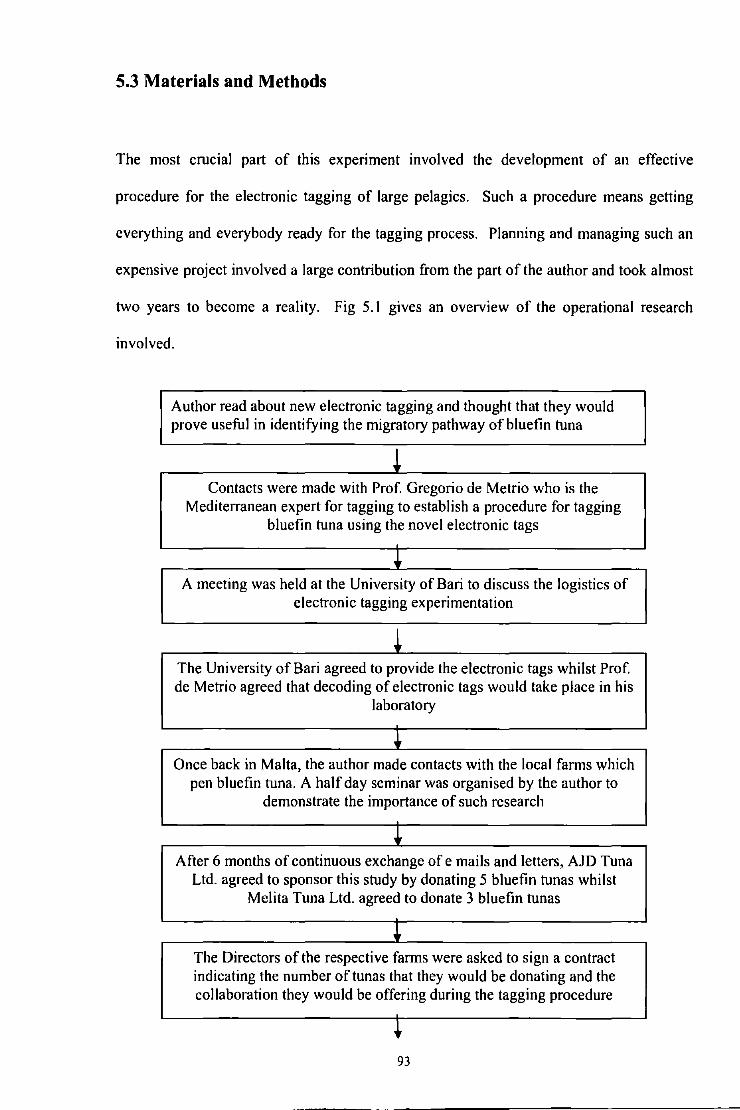
5.3 Materials and Methods
The most crucial part of this experiment involved the development of an effective
procedure for the electronic tagging of large pelagics. Such a procedure means getting
everything and everybody ready for the tagging process. Planning and managing such an
expensive project involved a large contribution from the part of the author and took almost
two years to become a reality. Fig 5.1 gives an overview of the operational research
involved.
Author read about new electronic tagging and thought that they would prove useful in identifying the migratory pathway ofbluefin tuna
~ Contacts were made with Prof. Gregorio de Metrio who is the
Mediterranean expert for tagging to establish a procedure for tagging bluefin tuna using the novel electronic tags
• A meeting was held at the University of Bari to discuss the logistics of electronic tagging experimentation
~ The University of Bari agreed to provide the electronic tags whilst Prof. de Me trio agreed that decoding of electronic tags would take place in his
laboratory
• Once back in Malta, the author made contacts with the local farms which pen bluefin tuna. A half day seminar was organised by the author to
demonstrate the importance of such research
+ After 6 months of continuous exchange of e mails and letters, AJD Tuna
Ltd. agreed to sponsor this study by donating 5 bluefin tunas whilst Melita Tuna Ltd. agreed to donate 3 bluefin tunas
• The Directors of the respective farms were asked to sign a contract indicating the number of tunas that they would be donating and the collaboration they would be offering during the tagging procedure
+ 93
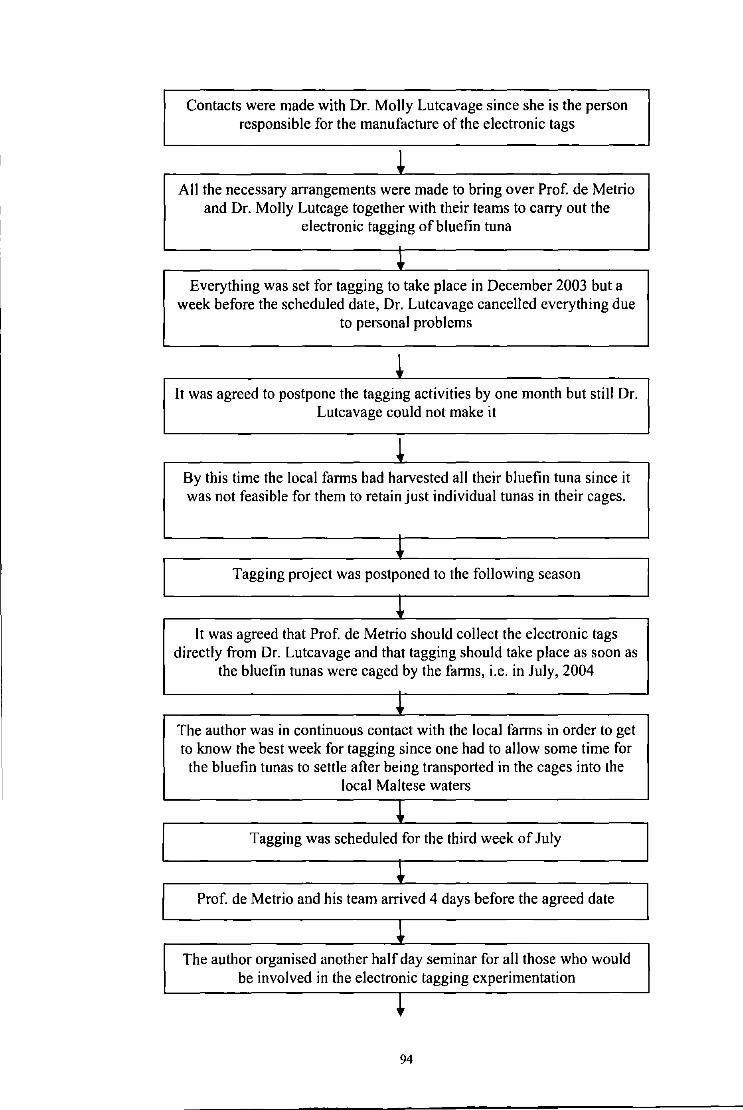
Contacts were made with Dr. Molly Lutcavage since she is the person responsible for the manufacture of the electronic tags
~ All the necessary arrangements were made to bring over Prof. de Metrio
and Dr. M oily Lutcage together with their teams to carry out the electronic tagging ofbluefin tuna
+ Everything was set for tagging to take place in December 2003 but a
week before the scheduled date, Dr. Lutcavage cancelled everything due to personal problems
~ It was agreed to postpone the tagging activities by one month but still Dr.
Lutcavage could not make it
~ By this time the local farms had harvested all their bluefin tuna since it was not feasible for them to retain just individual tunas in their cages.
~. Tagging project was postponed to the following season
~ It was agreed that Prof. de Metrio should collect the electronic tags
directly from Dr. Lutcavage and that tagging should take place as soon as the bluefin tunas were caged by the farms, i.e. in July, 2004
~ The author was in continuous contact with the local farms in order to get to know the best week for tagging since one had to allow some time for
the bluefin tunas to settle after being transported in the cages into the local Maltese waters
~ Tagging was scheduled for the third week of July
~ Prof. de Metrio and his team arrived 4 days before the agreed date
~ The author organised another half day seminar for all those who would
be involved in the electronic tagging experimentation
+ 94
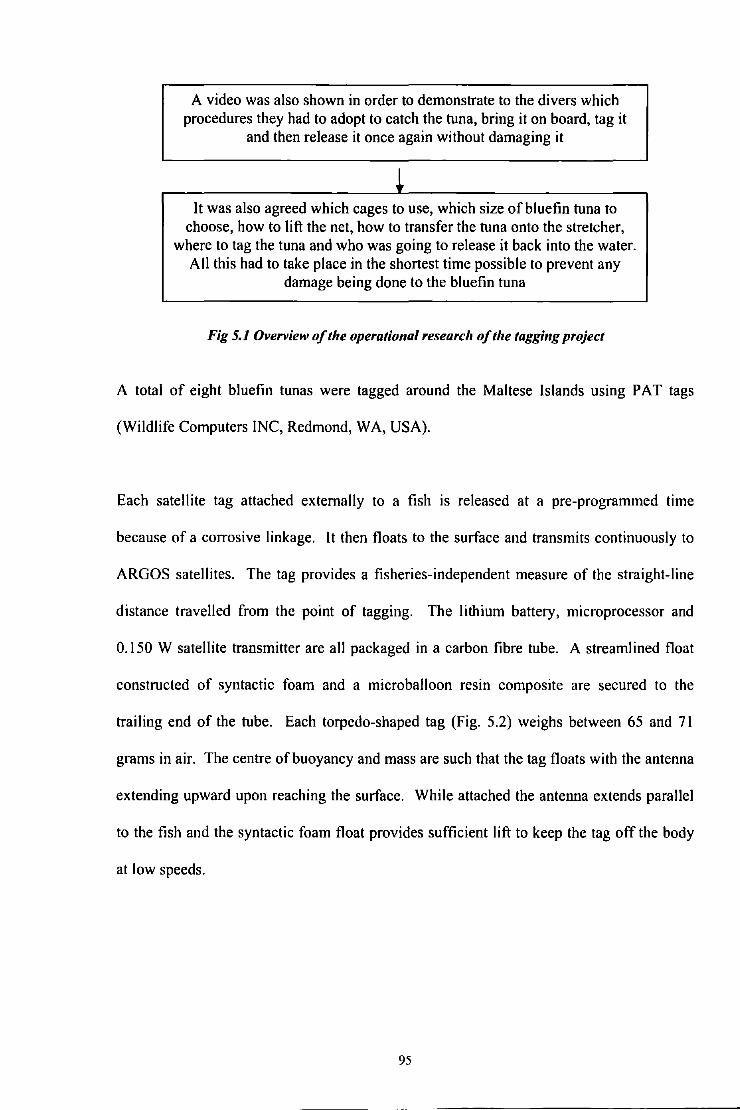
A video was also shown in order to demonstrate to the divers which procedures they had to adopt to catch the tuna, bring it on board, tag it
and then release it once again without damaging it
It was also agreed which cages to use, which size ofbluefin tuna to choose, how to lift the net, how to transfer the tuna onto the stretcher,
where to tag the tuna and who was going to release it back into the water. All this had to take place in the shortest time possible to prevent any
damage being done to the bluefin tuna
Fig 5.1 Overview oft/re operational research of the tagging project
A total of eight bluefin tunas were tagged around the Maltese Islands using PAT tags
(Wildlife Computers INC, Redmond, WA, USA).
Each satellite tag attached externally to a fish is released at a pre-programmed time
because of a corrosive linkage. It then floats to the surface and transmits continuously to
ARGOS satellites. The tag provides a fisheries-independent measure of the straight-line
distance travelled from the point of tagging. The lithium battery, microprocessor and
0.150 W satellite transmitter are all packaged in a carbon fibre tube. A streamlined float
constructed of syntactic foam and a microballoon resin composite are secured to the
trailing end of the tube. Each torpedo-shaped tag (Fig. 5.2) weighs between 65 and 71
grams in air. The centre of buoyancy and mass are such that the tag floats with the antenna
extending upward upon reaching the surface. While attached the antenna extends parallel
to the fish and the syntactic foam float provides sufficient lift to keep the tag off the body
at low speeds.
95

Fig. 5.2 Actual structure of the arc/rival pop up tag used for tagging bluefin tuna
Tagging was carried out on farmed bluefin tuna (Fig. 5.3) caught by purse seine nets. This
is the only gear which allows bluefin tuna to remain alive. All other gears including
longlines lead to the death of the bluefin tuna and as such could not be used for tagging
purposes since the tuna has to be still alive. Tuna caught by hooks remains alive for a
maximum of3 hours (Carabott, J999, pers. comm.). ]fthe hook is removed and the tuna is
released again, the tuna would eventually die due to injuries which prevent it from eating.
The tags were programmed to detach themselves from the tuna and float to the sea surface
after intervals of 120 and 300 days. A selection of the archived data could then be
obtained through the Argos satellite system including the pop up position of the tag.
After intensive planning of the actual procedures to be carried out by the whole team
involving more than 15 persons, the ftrSt tagging activity was conducted off the North East
coast of Malta (35:58:40 N and 14:25:57 E) on the 201h July, 2004. The second tagging
96

activity was conducted off the South-East coast of Malta (35:50:72 Nand 14:35:05 E) the
day after. Details of the tagging activities are summarized in Table 5.1.
The bluefin tunas were caught individually by restricting the area of the net and ·lifting it
(Fig. 5.4, Fig. 5.5 and Fig. 5.6). The individual tunas were pulled onto a prepared stretcher
(wet vinyl covered pad) on the deck of a small fishing vessel. Once on deck, a saltwater
hose was placed in the mouth of the bluefin tuna to irrigate the gills and the eyes were kept
covered with a sea water soaked blindfold (Fig 5.7).
The curved body length was measured so that later on the body mass could be estimated.
The fish could not be weighed directly since on board the weight is measured by hooking
the tuna to the scales and this procedure would have killed the tuna.
Tagging was carried out on board using a hand-held harpoon. The pop off satellite tag was
attached to the bluefin tuna by using a titanium dart machine. The dart was inserted 10 cm
deep at the base of the second dorsal fin, where it was anchored through the bony
projections and connective tissues radiating ventrally from the fin. Each tag was connected
to its anchor by a 25 cm long monofilament leader attached through the eye loop at the
front end of the tag. The eye loop was fixed in place by a thin, stainless steel wire that was
exposed to sea water externally and connected internally to a battery. At the programmed
time, the microprocessor activated the battery which then passed a low voltage across the
wire promoting corrosion and release.
Each bluefin tuna was kept on deck for an average time of 2 minutes. Experiments carried
out on captive tunas held in the Pacific indicated that because the tuna body narrows after
the second dorsal fin, tags placed here have minimal contact with the body and therefore
do no disturb with the normal swimming patterns (Block et al., 1998).
97
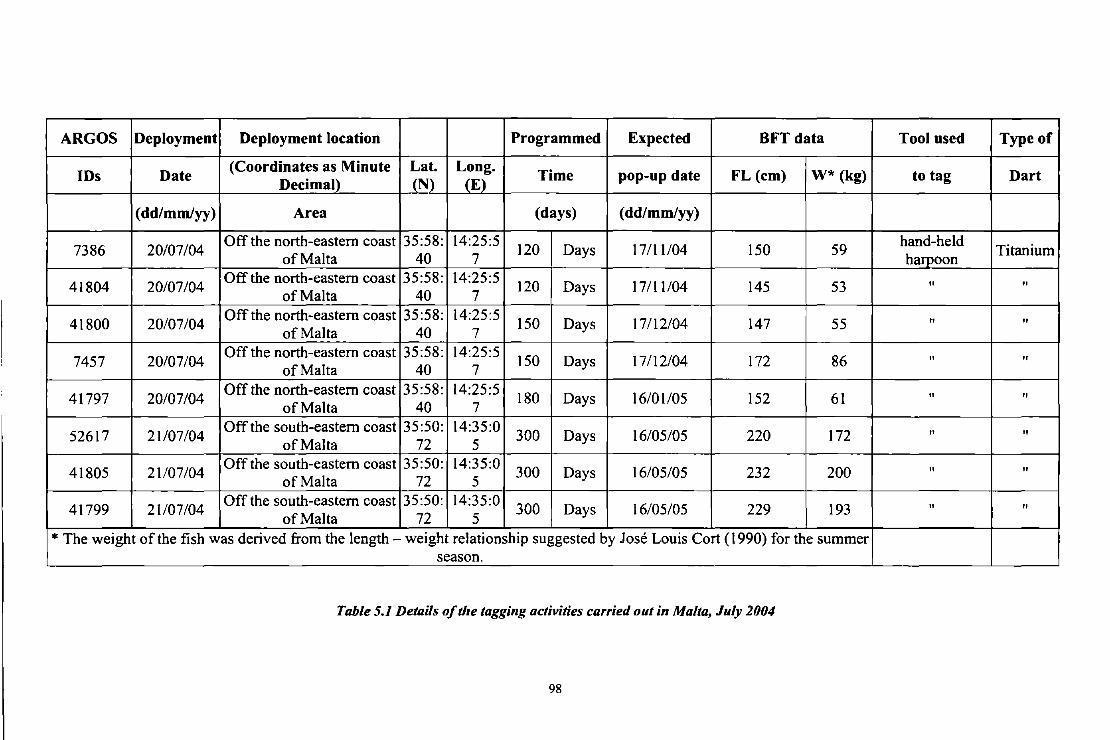
ARGOS Deployment Deployment location Programmed Expected 8FT data Tool used Type of
IDs Date (Coordinates as Minute Lat. Long.
Time pop-up date FL (cm) W* (kg) to tag Dart Decimal) (N) (E)
(dd/mm/yy) Area (days) (dd/mm/yy)
7386 20/07/04 Off the north-eastern coast 35:58: 14:25:5
120 Days 17111104 150 59 hand-held
Titanium of Malta 40 7 harpoon
41804 20/07/04 Off the north-eastern coast 35:58: 14:25:5
120 Days 17111/04 145 53 " " of Malta 40 7
41800 20/07/04 Off the north-eastern coast 35:58: 14:25:5
150 Days 17112/04 147 55 " " of Malta 40 7
7457 20/07/04 Off the north-eastern coast 35:58: 14:25:5
150 Days 17/12/04 172 86 " " ofMa1ta 40 7
41797 20/07/04 Off the north-eastern coast 35:58: 14:25:5
180 Days 16/01105 152 61 " " of Malta 40 7
52617 21/07/04 Off the south-eastern coast 35:50: 14:35:0
300 Days 16/05/05 220 172 " " of Malta 72 5
41805 21/07/04 Off the south-eastern coast 35:50: 14:35:0
300 Days 16/05/05 232 200 " " of Malta 72 5
41799 21107/04 Off the south-eastern coast 35:50: 14:35:0
300 Days 16/05/05 229 193 " " of Malta 72 5 * The weight of the fish was derived from the length- weight relationship suggested by Jose Louis Cort (1990) for the summer
season.
Table 5.1 Details oft/re tagging activities carried out in Malta, July 2004
98
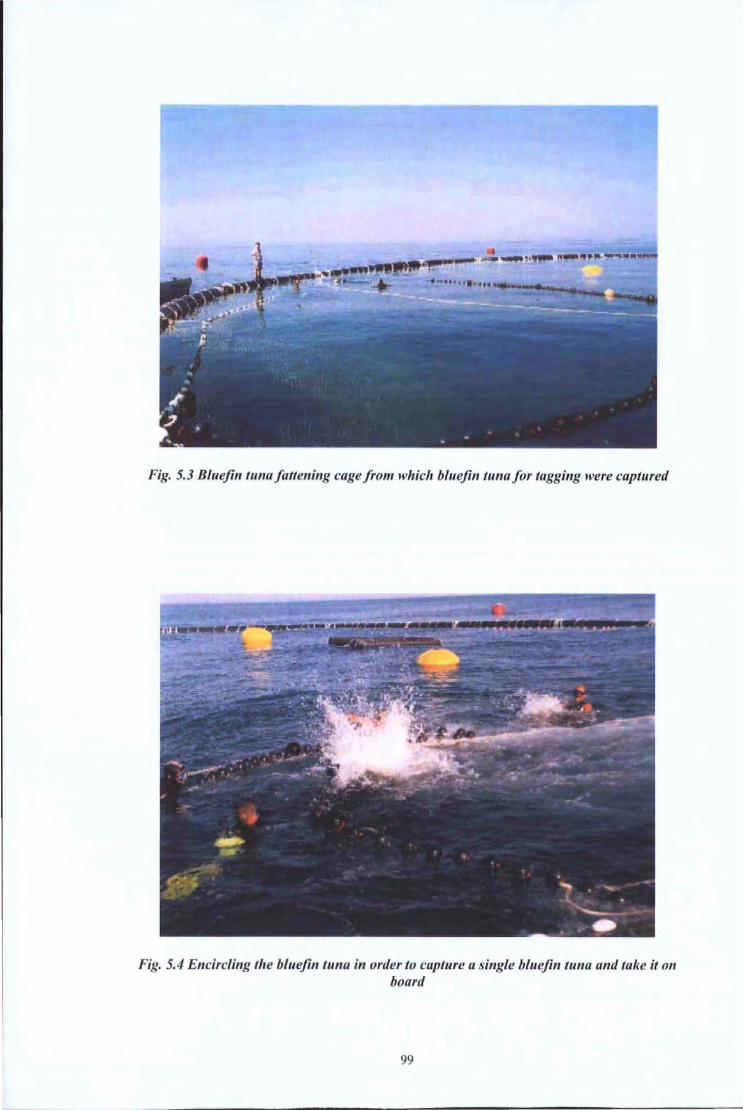
Fig. 5.3 Bluefintuna fattening cage from which bluefin tuna for tagging were captured
Fig. 5.4 Encircling the bluefin tuna in order to capture a single bluefin tuna and take it on board
99
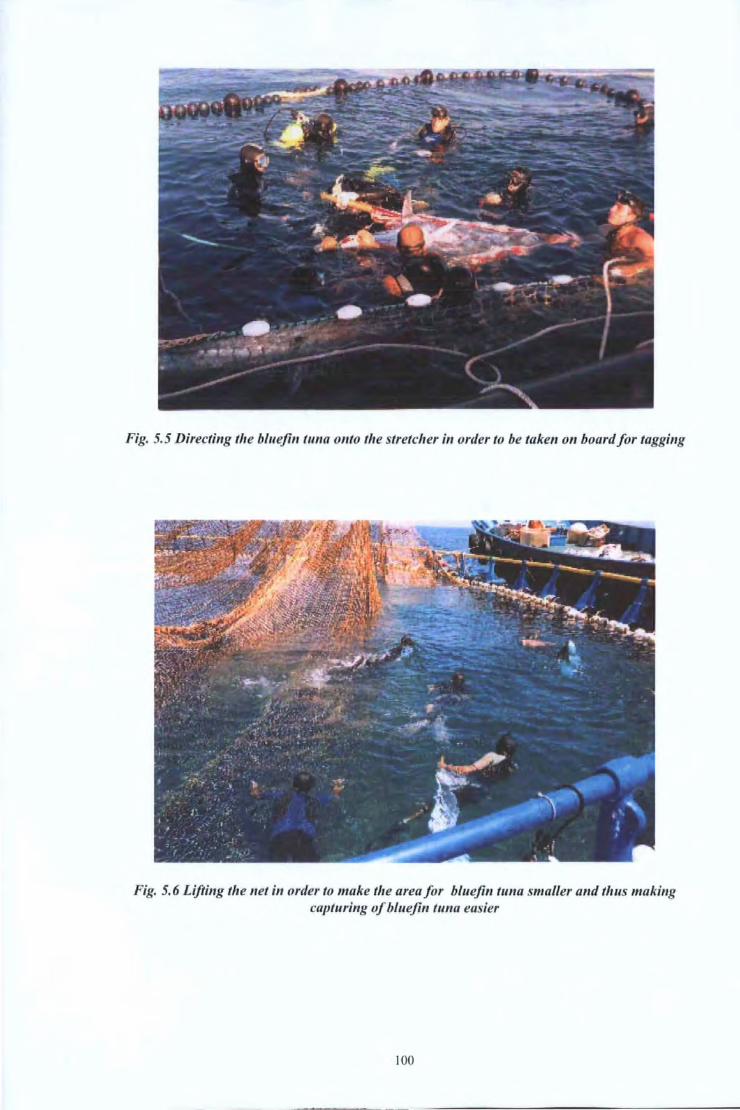
Fig. 5.5 Directing the bluefin tuna onto the stretcher in order to be taken on board for tagging
Fig. 5. 6 Lifting the net in order to make the area for bluefin tuna smaller and thus making capturing of blue fin tuna easier
100
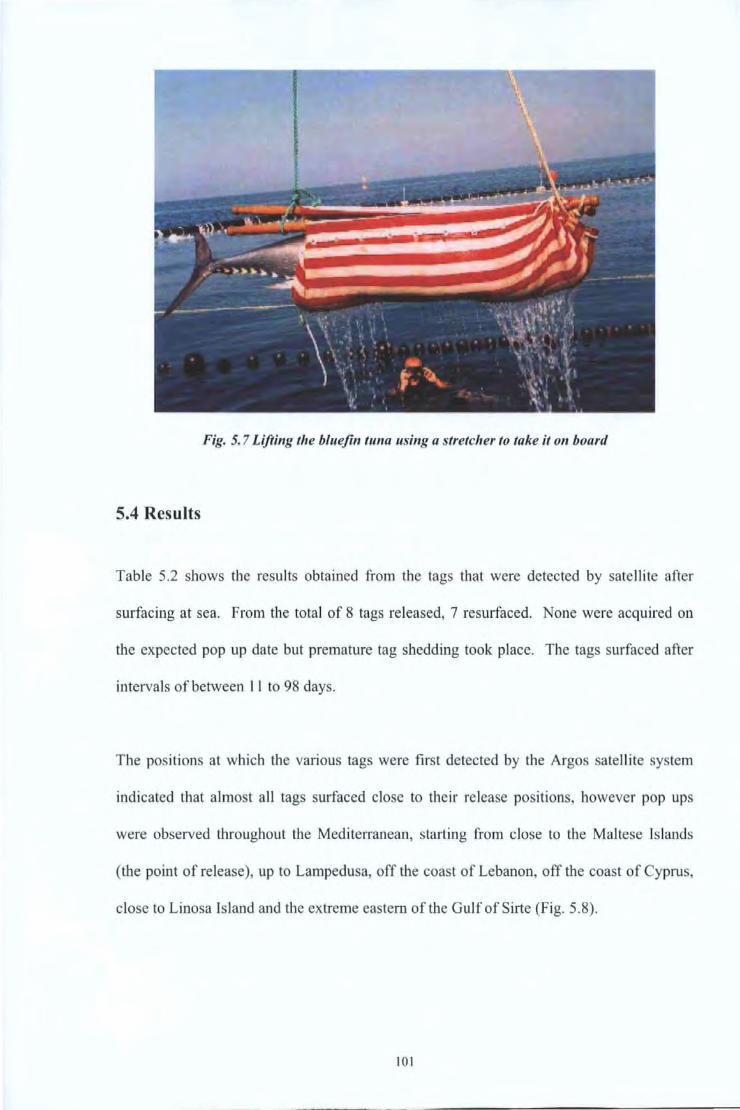
Fig. 5. 7 Lifting the bluejin tu11a usi11g a stretcher to take it 011 board
5.4 Results
Table 5.2 shows the results obtained from the tags that were detected by satell ite after
surfacing at sea. From the total of 8 tags released, 7 resurfaced. None were acquired on
the expected pop up date but premature tag shedding took place. The tags surfaced after
intervals of between I I to 98 days.
The positions at which the various tags were first detected by the Argas satellite system
indicated that almost all tags surfaced close to their release positions, however pop ups
were observed throughout the Mediten·anean, starting from close to the Maltese Islands
(the point of release), up to Lampedusa, off the coast of Lebanon, off the coast of Cyprus,
close to Linosa Island and the extreme eastern of the Gulf of Si11e (Fig. 5.8).
101
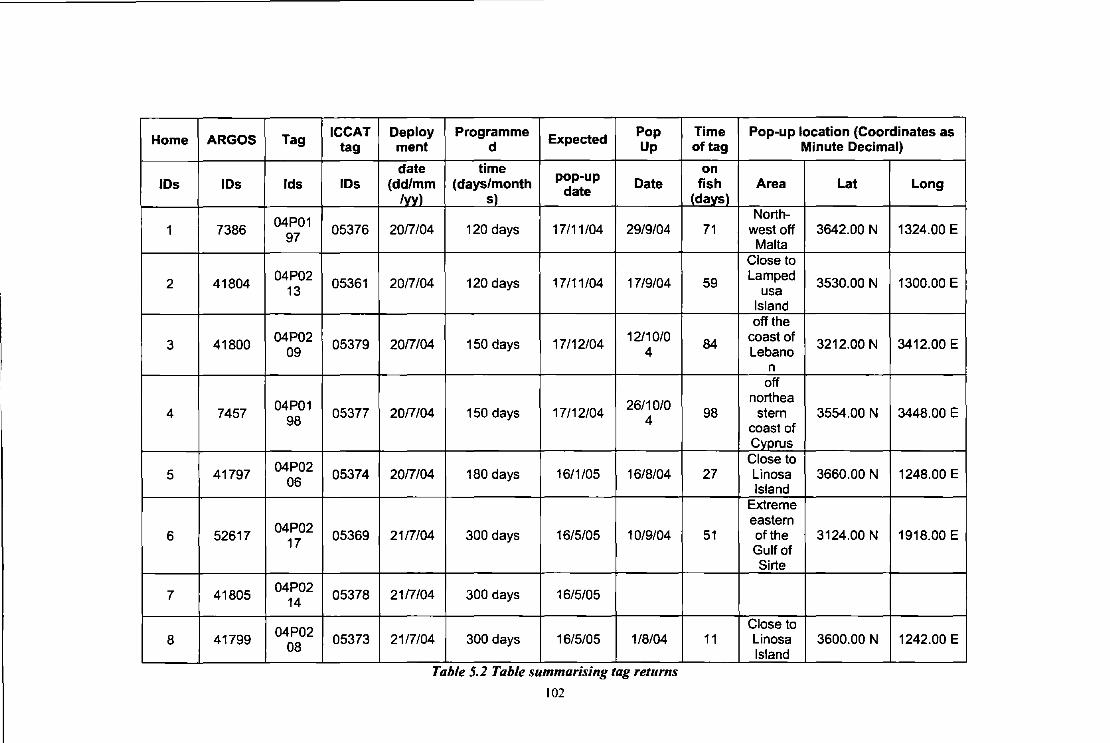
Home ARGOS Tag ICCAT
tag
lOs lOs lds lOs
04P01 1 7386 97
05376
2 41804 04P02 05361 13
3 41800 04P02 05379
09
04P01 4 7457
98 05377
04P02 5 41797 06 05374
04P02 6 52617 17 05369
7 41805 04P02 05378 14
04P02 8 41799 08
05373
Deploy Programme Expected Pop ment d Up
date time (dd/mm (days/month pop-up Date
/ffi sl date
2017104 120 days 17/11/04 29/9/04
2017104 120 days 17/11/04 17/9/04
2017104 150 days 17/12/04 12/10/0 4
26/10/0 20/7/04 150 days 17/12/04 4
2017104 180 days 16/1/05 16/8/04
21/7/04 300 days 16/5/05 10/9/04
2117104 300 days 16/5/05
2117104 300 days 16/5/05 1/8/04
.. Table 5.2 Table summansmg tag returns
102
Time Pop-up location (Coordinates as of tag Minute Decimal)
on fish Area Lat Long
(days} North-
71 west off 3642.00 N 1324.00 E Malta
Close to
59 Lamped usa 3530.00 N 1300.00 E
Island off the
84 coast of 3212.00 N 3412.00 E Lebano
n off
north ea 98 stern 3554.00 N 3448.00 E
coast of Cyprus Close to
27 Linosa 3660.00 N 1248.00 E Island
Extreme eastern
51 of the 3124.00 N 1918.00 E Gulf of Sirte
Close to 11 Linosa 3600.00 N 1242.00 E
Island
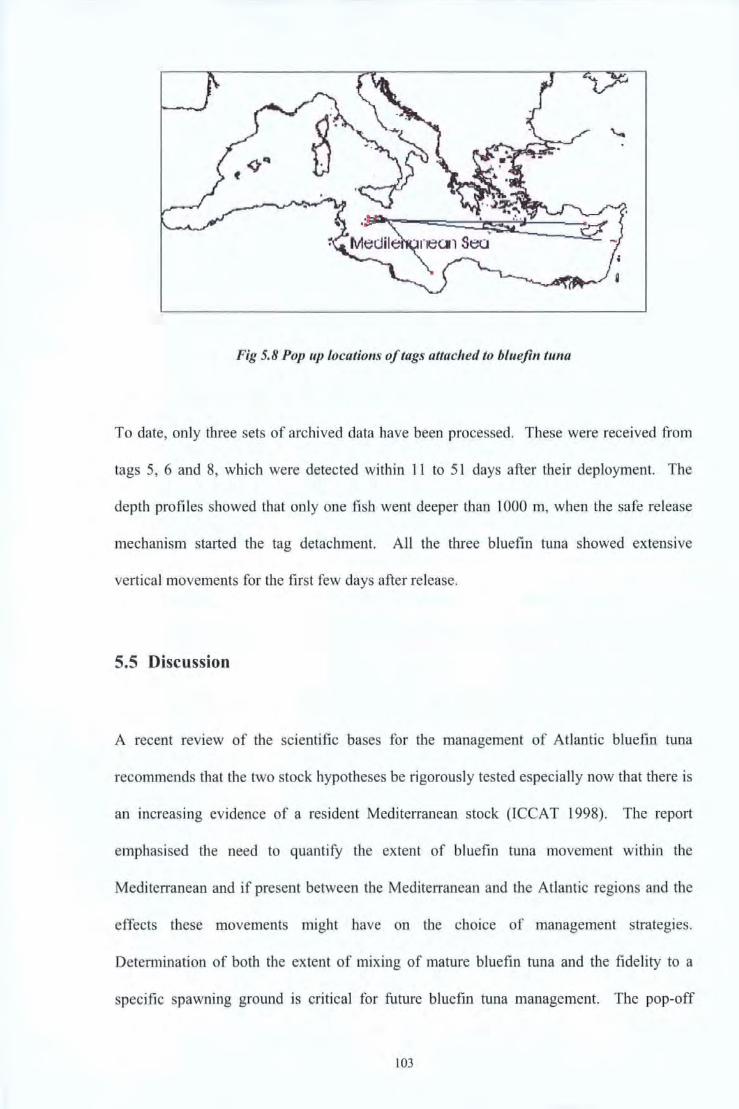
Fig 5.8 Pop up locations of tags attached to bluefin tuna
To date, only three sets of archived data have been processed. These were received from
tags 5, 6 and 8, which were detected within !I to 51 days after their deployment. The
depth profiles showed that only one fish went deeper than 1000 m, when the safe release
mechanism started the tag detachment. All the three bluefin tuna showed extensive
vertical movements for the first few days after release.
5.5 Discussion
A recent review of the scientific bases for the management of Atlantic bluefin tuna
recommends that the two stock hypotheses be rigorously tested especially now that there is
an increasing evidence of a resident Mediterranean stock (ICCAT 1998). The report
emphasised the need to quantify the extent of bluefin tuna movement within the
Mediterranean and if present between the Mediterranean and the Atlantic regions and the
effects these movements might have on the choice of management strategies.
Determination of both the extent of mixing of mature bluefin tuna and the fidelity to a
specific spawning ground is critical for future bluefin tuna management. The pop-off
103

satellite technology has the potential to improve the identification of discrete biological
stocks, which is paramount to the implementation of effective management.
The results of the tagging activities carried out indicate that all the tagged bluefin tuna
remained in the Mediterranean and none migrated into the Atlantic. In fact pop ups were
observed throughout the Mediterranean, starting close to the Maltese Islands (the point of
release), up to Lampedusa, off the coast of Lebanon, off the coast of Cyprus, close to
Linosa Island and to the extreme eastern of the Gulf of Sirte. These results may further
confirm that not all the bluefin tuna migrate back into the Atlantic but that some remain in
the Mediterranean throughout their whole life cycle. However, the timescales observed are
very short in comparison to the life span of the bluefin tuna.
A major shortcoming of this study is that the number of tagged bluefin tuna was very
small, only 8 bluefin tunas being tagged. The cost of materials was the main limiting
factor. Each pop off satellite tag costs in excess of I 000 Euros whilst each alive blue fin
tuna has a potential market value of more than I 0 Euros per kilogram. The costs of this
experiment were more than 20 000 Euros without taking into account other overheads
incurred I ike for example the cost of bringing the experts to the tagging site and paying the
divers which helped during the activity. In order to make the results significant, this type
of tagging activity has to continue both in the Atlantic and in the Mediterranean.
A further shortcoming was that the pop ups took place before the set dates. This fact was
reported to the Wildlife Computers INC, USA so that if possible it will be prevented in
future tagging activities. If pop ups could be programmed to take place after longer
periods they could be used to provide more conclusive evidence of where the bluefin tuna
104

completes its iJife cycle. 0ne has .to remembenhat ;the complete .life,cydc:: ot: .bltiefin: ffinll'
can ;take mort:: ,than ;15 years,
105

5.6 Summary
I. Advances in tagging technology will assist in defining migration patterns.
2. The results obtained so far lend support to the theory of a separate residing stock in the
Mediterranean. When further tagging activities will be carried out in the future, they
will provide the best evidence of the separate bluefin tuna stocks which are present in
the Mediterranean and in the Atlantic.
3. Early release of tags may have compromised the quality of the anticipated evidence.
106

IlNNO:VAJ'](VE' APilR:01\C1HIES: :n:N STOCK
lllD:EN'f~JiFI C:ATllON
6.1 Introduction
In the frrst part of the experiment, the stock specificity and stability of chemical signatures
in the otoliths of bluefin tuna will be analysed. Otolith chemistry of juveniles from eastern
and western Atlantic regions will be quantified to determine the discriminatory power of
otolith chemistry for stock identification.
This research was carried out in collaboration with Dr. Jay Rooker (Texas A & M University
at Galveston, USA). Organization of work and collection of samples was all carried out by
the author in Malta. Extraction of the otoliths was done under the supervision of Dr. Jay
Rooker who visited Malta for this purpose. Otoliths were then transferred to the University of
Galveston, USA where chemical analysis was carried out. The main aim of this part of the
experiment was to compare the otolith chemistry of Atlantic and Mediterranean bluefin tuna.
At the moment a paper is being prepared with the results obtained at the end of the
experiment.
Recently, several recent population genetics studies, using both nuclear (Pujolar, 2001) and
mitochondrial (Vinas, 200 I) molecular markers, could not reject the hypothesis of a single
genetic population of the Mediterranean bluefin tuna population. However the opportunity
of having samples from new localities not studied previously could corroborate the single
population supposition in the Mediterranean (Vinas et al., 2002).
This second part ofthe experiment was carried out in collaboration with FAO-COPEMED
Large Pelagics Project and in collaboration with Dr. Caries Pia (University of Girona,
Spain). Three courses were attended in Fuengirola, Spain. Samples in Malta were
collected by the author whilst the other samples were collected by observers who attended
108
the same courses and used the same sampling methodology. Genetic samples were then
processed and studied by the author in the University of Girona, Spain under the
supervision of Dr. Caries Pia. Several papers have been presented by the author during the
annual ICCA T Scientific Committee for Research and Statistics ( 1999, 2000, 200 I and
2002).
6.2 Literature review
The premise of otolith chemistry is that certain elements are incorporated into otoliths in
proportion to their concentrations in the environment and thus these elemental fingerprints
can be used to distinguish individuals from different environments or regions. It also
provides age and growth information and contains a lot of information about the
organism's habitat.
Otolith chemistry is increasingly used as a technique to differentiate stocks, and interest in
its application as a recorder of time and environmental conditions has increased
substantially in the past decade (Campana, 1999; Thresher, 1999; Secor & Rooker, 2000;
Campana & Thorrold, 200 I). Otoliths precipitate as the fish grows and elements from the
individual's surroundings are integrated into the aragonite-protein matrix. As otoliths are
metabolically inert, resorption or remobilisation of newly deposited elements during
ontogeny is negligible. Consequently, the chemical composition of otoliths may serve as
natural tags or chemical signatures that reflect differences in the chemical composition of
the individual's habitat.
Recent work suggests that otolith chemistry can be used to identify natal origin and assess the
relative contribution of different nursery areas to mixed adult stocks (Thresher, 1999;
109
Thorrold et al., 1998, 200 I). Moreover the approach has been used recently to assess stock
specificity of tunas and findings suggest that otolith elemental analysis has promise for
assessing the population connectivity of pelagic stocks (Rooker et al., 200 I b). As such
chemical analysis of the otoliths may prove an important tool in the identification of stocks.
In the Atlantic Ocean, the existence of two putative stocks is generally assumed (ICCAT,
I 997). This division is based on the knowledge of two assumed separated spawning
grounds, one in the Mediterranean Sea and one in the western Atlantic. Recent genetic
studies which have been carried out with bluefin tuna, try to confirm the possible stock
differentiation between the western Atlantic and eastern Atlantic - Mediterranean stock
(Pujolar & Pia, 2000; Alvarado Bremer et al., 1999).
Concerning the Mediterranean Sea, a series of genetic studies were carried out in recent
years (Pia et al., 1995; Pia et al., 1998; Pujolar & Pia, 2000). These studies using both
protein electrophoresis and mitochondrial DNA sequencing could not reject the hypothesis
of a single genetic population of Mediterranean bluefin tuna.
De la Serna et al., (2000) reported data on a bluefin tuna recaptured in a trap located in the
Spanish south - Atlantic coast, close to the Strait of Gibraltar. The recaptured tuna was
tagged in the Western Atlantic. Furthermore, this document reported for the first time the
preliminary genetic study of 15 bluefin tuna belonging to the same shoal as the recaptured
one. The results from the genetic analysis of the mitochondrial DNA show a distributional
pattern similar to the one found for several places in the eastern Atlantic.
110

It has been recommended by ICCAT to go deeply into genetic analysis of tuna captured
during migration in order to get to know better the migratory pathways of the bluefin tuna
and enhance the knowledge of the genetic population structure of the Mediterranean Sea.
This could shed more light on the identification of Mediterranean stocks.
6.3 Materials and Methods
6.3.1 Chemical Analysis of Bluefin Tuna Otoliths
The most crucial part of this experiment involved finding a sponsor and then developing a
method for the extraction and analysis of bluefin tuna otoliths. All the planning and
management of this experiment was carried out by the author as detailed below in Fig. 6.1.
Ill
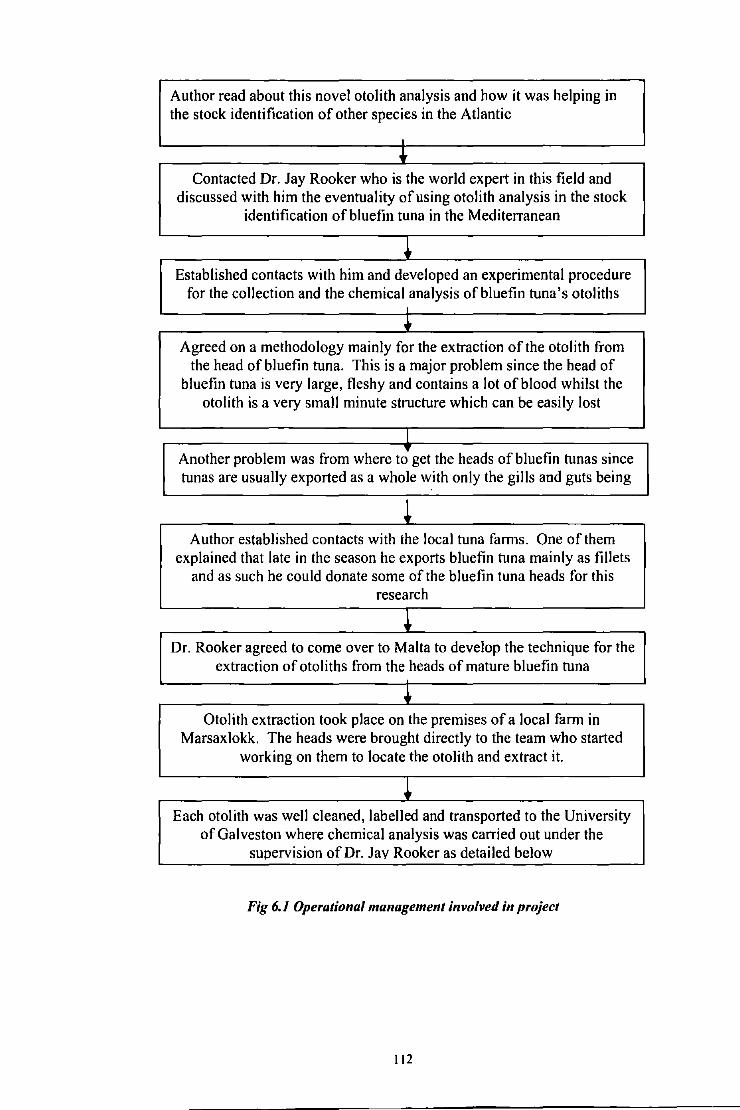
Author read about this novel otolith analysis and how it was helping in the stock identification of other species in the Atlantic
I
.t Contacted Dr. Jay Rooker who is the world expert in this field and
discussed with him the eventuality of using otolith analysis in the stock identification ofbluefin tuna in the Mediterranean
~ Established contacts with him and developed an experimental procedure
for the collection and the chemical analysis ofbluefin tuna's otoliths L
~ Agreed on a methodology mainly for the extraction of the otolith from
the head ofbluefin tuna. This is a major problem since the head of bluefin tuna is very large, fleshy and contains a lot of blood whilst the
otolith is a very small minute structure which can be easily lost
L Another problem was from where to" get the heads ofbluefin tunas since tunas are usually exported as a whole with only the gills and guts being
~ Author established contacts with the local tuna fam1s. One of them
explained that late in the season he exports bluefin tuna mainly as fillets and as such he could donate some of the bluefin tuna heads for this
research
• Dr. Rook er agreed to come over to Malta to develop the technique for the extraction of otoliths from the heads of mature bluefin tuna
+ Otolith extraction took place on the premises of a local farm in
Marsaxlokk. The heads were brought directly to the team who started working on them to locate the otolith and extract it.
~ Each otolith was well cleaned, labelled and transported to the University
of Galveston where chemical analysis was carried out under the supervision of Dr. Jay Rooker as detailed below
Fig 6.1 Operational management involved;, project
112

Samples were collected during the harvesting period of fanned bluefin tuna caught and
fattened around the Maltese Islands (September, 2003). The samples could not be
collected from wild caught tuna directly since in order to extract the otolith the whole head
is needed. Wild caught tuna are usually gilled and gutted out at sea and then after dressing
they are exported directly to Asian markets with the head still on. Therefore there were no
heads from wild caught tunas available for research purposes.
An agreement was made with one of the tuna farm owners in Malta. This arrangement
involved that the farm owner would donate the heads of the filleted tunas for otolith
extraction. Table 6.1 gives the main characteristics of the bluefin tunas from which the
otoliths were extracted. The mean fork length was 170 cm whilst the mean round weight
was I 09 kg. Selection of single otoliths (i.e. right or left sagittae) for elemental analysis
was based on random assignment. Otoliths were extracted from bluefin tunas harvested on
the 201h September, 2003 off the south-eastem coast of Malta (Lat. 35:50:72, Long.
14:35:05).
113
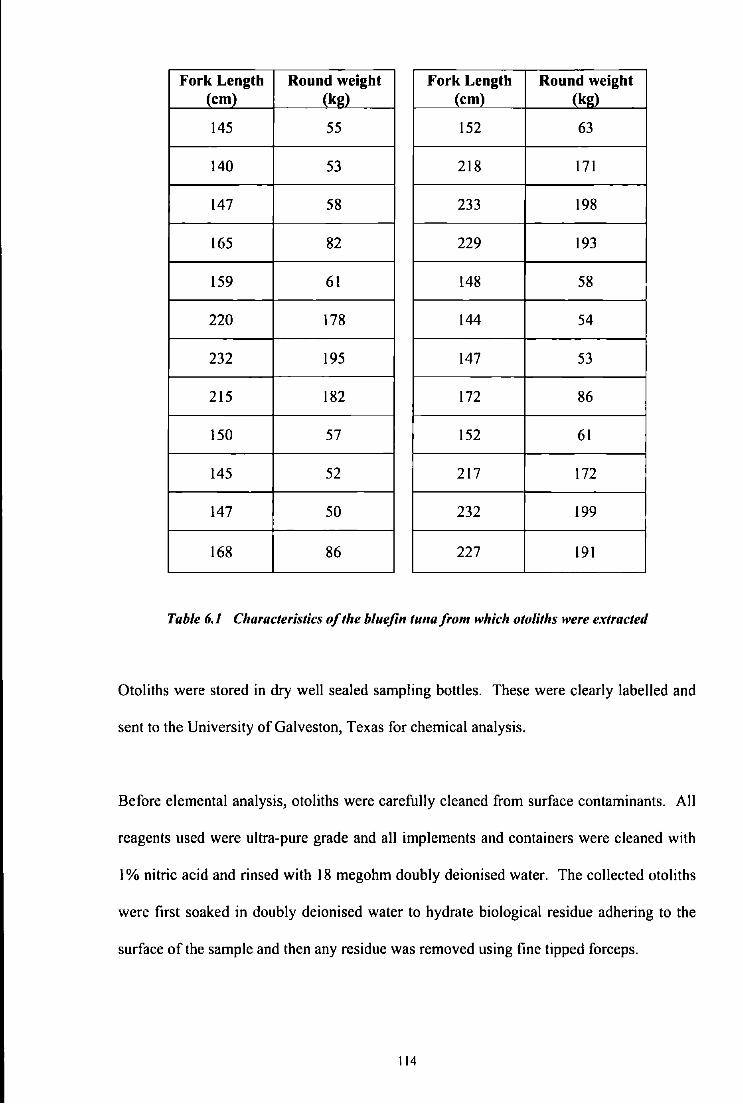
Fork Length Round weight Fork Length Round weight (cm) (kg) (cm) (kg)
145 55 !52 63
140 53 218 171
147 58 233 198
165 82 229 193
159 61 148 58
220 178 144 54
232 195 147 53
215 182 172 86
!50 57 !52 61
145 52 217 172
147 50 232 199
168 86 227 191
Table 6.1 Characteristics of the bluefin tullafrom which otoliths were extracted
Otoliths were stored in dry well sealed sampling bottles. These were clearly labelled and
sent to the University of Galveston, Texas for chemical analysis.
Before elemental analysis, otoliths were carefully cleaned from surface contaminants. All
reagents used were ultra-pure grade and all implements and containers were cleaned with
I% nitric acid and rinsed with 18 megohm doubly deionised water. The collected otoliths
were first soaked in doubly deionised water to hydrate biological residue adhering to the
surface of the sample and then any residue was removed using fine tipped forceps.
114
The otoliths were then soaked in 3 % hydrogen peroxide for 5 minutes to dissolve the
remaining biological residue and immersed for 5 minutes in I % nitric acid to remove
surface contamination. Otoliths were then flooded with doubly deionised water for 5
minutes to remove the acid. Finally, otoliths were dried under a Class I 00 laminar-tlow
hood and stored in plastic vials. Otolith mass was reduced by approximately 4% as a result
of the decontamination procedure.
In preparation for instrumental analysis, every otolith was weighed to the nearest O.Olmg.
Internal standards were added to all solutions to compensate for possible instrumental drift.
Elemental concentrations were determined using a Perkin Elmer ELAN 5000 quadrupole
inductively coupled plasma mass spectrometer (ICPMS) (Perkin Elmer, Inc., Shelton, CN,
USA). Levels of lithium, magnesium, manganese and barium were determined using
external calibration standards. Levels of calcium and strontium were quantified after I 00
fold dilution using external standards without matrix matching. Samples were analysed at
random to avoid possible sequence effects.
Procedural blanks and two certified reference materials (CRMs) were concurrently
digested and analysed following the same procedures. Limits of detection (LOOs) were
calculated based on three readings and standard deviation of the mean procedural blank
and converted to a dry weight basis. The limits of detection were lithium 0.01, magnesium
0.19, manganese 0.06, barium 0.01, strontium 0.90 and calcium 0.46 (values expressed as
J.lg g·1 dry weight, calcium in percentage).
Multivariate analysis of variance (MANOV A) was then carried out by the author to test for
spatial and temporal differences in otolith chemistry. Nursery ground and year were used
as fixed factors in separate MANOV A models. Pillai trace (V) was chosen as the test 115
statistics as it is the most robust to violations of homogeneity of covariance (Wilkinson et
al., 1996). Univariate tests for each element were analysed using analysis of covariance
(AN COY A) and a preliminary model (interaction regression) was used to determine if
slopes of regression lines (homogeneity of slopes assumption) differed. The main
significance test of ANCOVA (homogeneity of y intercepts) was performed for all
elements because the assumption of parallel slopes was met. Tukeys 's HSD test was used
to find a posteriori differences (a = 0.05) among sample means. Linear discriminant
function analysis (LDFA) was used to classifY juveniles from different nurseries and/or
year classes.
Small differences in otolith weights and fish lengths occurred among sites and years and
thus the relationships between elemental concentration and otolith weight prior to
performing LDF A were examined. The effect of the size (otolith weight used as a proxy
for fish size) to ensure that differences in fish size among samples did not confound any
site specific differences in otolith chemistry was removed. Concentrations were weight -
detrended by subtraction of the common within-group linear slope from the observed
concentration (Rooker et al., 200 I a).
The relative importance of individual elements in discriminating across spatial and
temporal scales was assessed using the F test. Elements with large F values were removed.
Correlation of elements used in the discriminant function model was evaluated using the
Tolerance statistic. Such estimates range from 0 to I and a small value indicates that a
variable is highly correlated with one or more of the other variables (Wilkinson et al.,
1996).
Prior to statistical testing, residuals were examined for normality and homogeneity among
factor levels. Within group distribution and variance were examined and an outlier was
116
removed in one case (high manganese value) to meet parametric assumptions. The results
obtained from the analysis of the otoliths (Fig. 6.2) collected in the Mediterranean were
compared with published results of otoliths (Rooker, 200 I) of bluefin tuna collected from
nursery areas in the west Atlantic. The comparison was made with bluefin tuna of the
same size class, i.e. in the range of 50 - 200 kg.
6.3.2 Genetic Studies
As stated previously, bluefin tuna targeted by longliners are usually gilled and gutted out at
sea and therefore the collection of samples had to be done on board in order to be able to
immediately collect the samples for genetic analysis and preserve them accordingly.
Small samples of liver, heart and muscle were cut using a clean scalpel as soon as the
bluefin tuna was brought on board and gutted. In order to preserve the tissues well, it was
made sure that the tissues for preservation never exceeded a volume of 5 cm3, that they
were cut as soon as possible and that the volume of the 90% alcohol in each sample bottle
was always three times as much as the volume of the tissue.
Samples of bluefin tuna were collected for mitochondrial DNA sequence analysis during
the bluefin tuna season of the year 2000. These were collected by the author in three
Mediterranean locations; Libya (22), Tunisia (23) and Malta (12) (Fig. 6.2, Table 6.2).
117
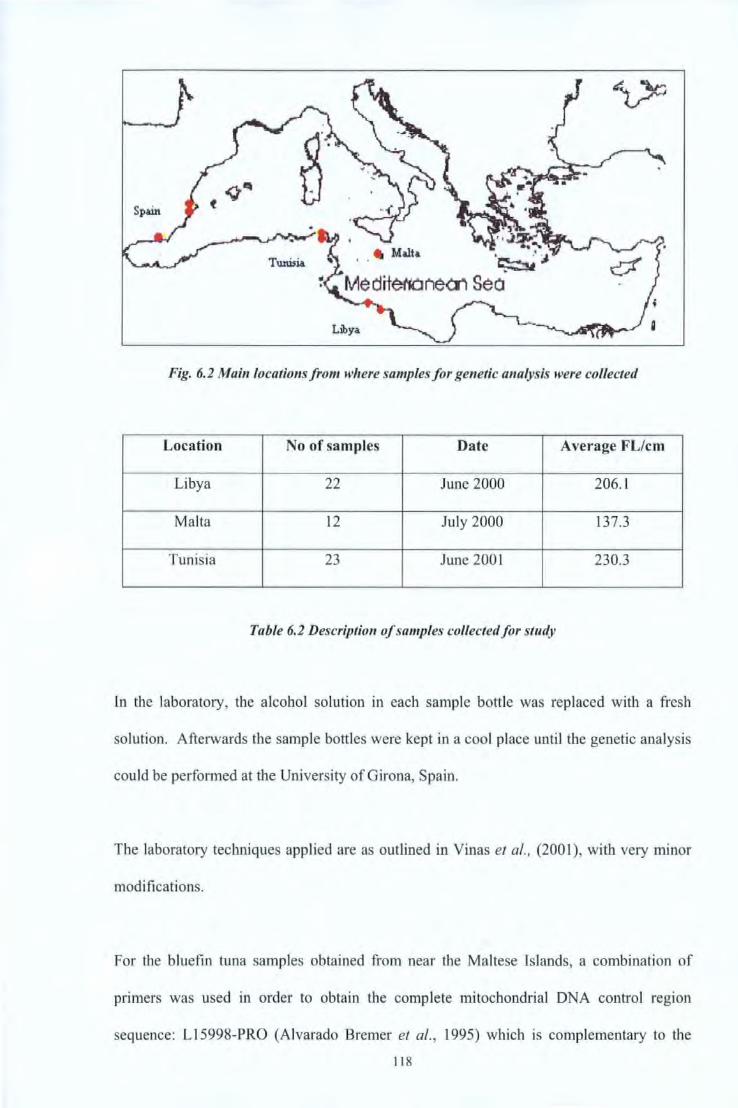
Fig. 6.2 Main locations from where samples for genetic analysis were collected
Location No of samples Date Average FL/cm
Libya 22 June 2000 206.1
Malta 12 July 2000 137.3
Tunisia 23 June 200 1 230.3
Table 6.2 Description of samples collected for study
In the laboratory, the alcohol solution in each sample bottle was replaced with a fresh
solution. Afterwards the sample bottles were kept in a cool place until the genetic analysis
could be performed at the Urtiversity of Girona, Spain.
The laboratory techniques applied are as outlined in Yinas et al., (200 I), with very minor
modifications.
For the bluefm tuna samples obtained from near the Maltese Islands, a combination of
primers was used in order to obtain the complete mitochondrial DNA control region
sequence: L 15998-PRO (Aivarado Bremer et al. , 1995) which is complementary to the
11 8
tRNApro flanking D-loop fragment. This was used in combination with the FST (Pia et al.,
1995), corresponding to the tRNAphc gene adjacent to the 3 · control region end.
The full length (863 bp) of the bluefin tuna mitonchondrial control region was edited by
eye with Programs SEQ ED. (version 1.3) and XESEE (Cabot & Bekenbach, 1989) and
aligned using Thunnus thynnus (GenBank accession number X82653) sequences as
reference. The total of sequence variation was assessed estimating nucleotide diversity
(Nei, 1987) and haplotypic diversity (Nei & Tajima, 1981 ).
Gene phylogenia was reconstructed using the Neighbour-Joining (NJ) algorithm (Saitou &
Nei, 1987) on a matrix of Kimura two parameter distance model (Kimura, 1980). A
bootstrap test (Felsenstein, 1985) of 1000 replicates was carried out to check the strength
of each branch of the tree. All these calculations were performed using the PHYLIP
package (F elsenstein, 1993 ).
For all the samples obtained from the different regions of the Mediterranean Sea, the loop
sequence of each individual was obtained following the laboratory outlines described in
Vinas (2001). The combination of primers used was: LI5998-PRO primer which was
complementary to the tRNApro flanking D-loop fragment with CSBDH (Alvarado Bremer
et al., 1995) corresponding to the control sequence block (CSB) of the mitochondrial D
loop region. Sequences were read in AB! prism 310 Genetic analyzer available in the
Laboratory of Ichthyology Genetics at the University ofGirona, Spain.
Sequences were edited by eye with the programs SEQ ED. (version 1.3) and Bioedit
(version 5.0.0; Hall, 1999) and aligned using Thunnus thynnus sequences as reference
(Genbank accession number X82653). Sequences variation was assessed estimating
nucleotide diversity (Nei, 1987) and haplotypic diversity (h; Nei & Tajima, 1981) using the
119
Arlequin package (version 2.0; Schneider, 1997). Gene phylogenia was reconstructed
using the Neighbor-Joining (NJ) algorithm (Saitou & Nei, 1987) on a matrix of gamma
Tamura Nei (alpha= 0.27) (Tamura, K. & Nei, M. 1993, Wakely, J. 1993). A bootstrap
test (Felsenstein, 1985) of 1000 replicates was carried out to check the strength of each
branch of the tree. All the phylogenetic calculations were performed using the MEGA
package (version 2.1; Kumar et al., 200 I).
The extent of the population subdivision using an analysis of molecular variance was also
analysed (AMOV A, Excoffier et al., 1992), available in the software package Arlequin.
The significance level of the population subdivision was determined by a 3000 fold non
parametric permutation procedure also implemented in the Arlequin software.
6.4 Results and Discussion
6.4.1 Chemical Analysis of Bluefin Tuna Otoliths
Multivariate analysis of variance indicated that otolith chemistry of bluefin tuna (Thunnus
thynnus) collected in the Mediterranean Sea (near the Maltese Islands) and western
Atlantic nurseries differed significantly (Pillai's trace = 3.55, P < 0.01). Univariate
contrasts indicated that concentrations of only one element, lithium, differed significantly
(AN COV A, P < 0.05) between nursery areas. The concentration of lithium was higher for
Thunnus thynnus collected in the Mediterranean than in the western Atlantic (Fig 6.4).
Discriminant analysis, based on concentrations of all six elements, indicated that 71% of
these individuals were apparently correctly assigned to their native nursery area
(Mediterranean Sea 67%, western Atlantic 75%). One record of otolith manganese from
120
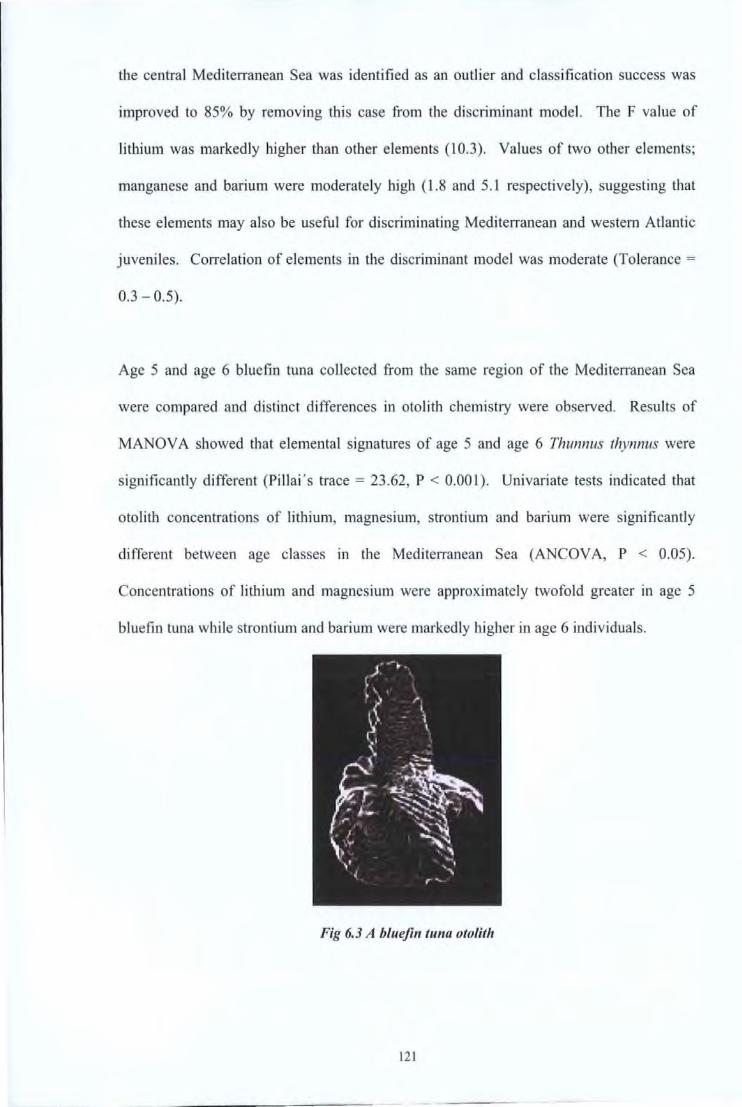
the central Mediterranean Sea was identified as an outlier and classification success was
improved to 85% by removing this case from the discriminant model. The F value of
lithium was markedly higher than other elements (1 0.3). Values of two other elements;
manganese and barium were moderately high (l.8 and 5.1 respectively), suggesting that
these elements may also be useful for discriminating Mediterranean and western Atlantic
juveniles. Correlation of elements in the discriminant model was moderate (Tolerance =
0.3 - 0.5).
Age 5 and age 6 bluefin tuna collected from the same region of the Mediterranean Sea
were compared and distinct differences in otolith chemistry were observed. Results of
MANOVA showed that elemental signatures of age 5 and age 6 Thunnus thynnus were
significantly different (Pillai ' s trace = 23.62, P < 0.001 ). Univariate tests indicated that
otolith concentrations of lithium, magnesium, strontium and barium were significantly
different between age classes in the Mediterranean Sea (AN COY A, P < 0.05).
Concentrations of lithium and magnesium were approximately twofold greater in age 5
bluefin tuna while strontium and barium were markedly higher in age 6 individuals.
Fig 6.3 A bluefin tuna otolith
121
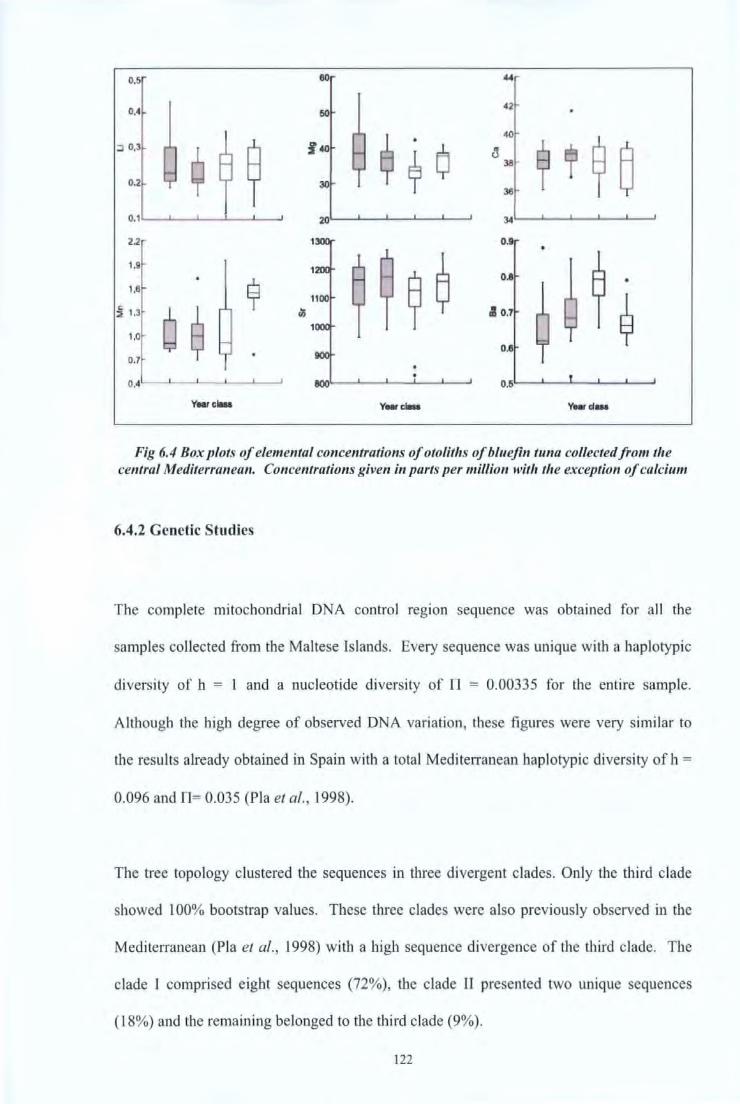
0,5 60
0,4
:J 0,3
o.
0.1
2.2
1 ,9
1,6
:§ 1.3
Q ~ 1,0
0.7
0,4
Yearollu
Fig 6.4 Box plots of elemental concentrations of otoliths of bluefin tuna collected from the central Mediterranean. Concentrations given in parts per million with the exception of calcium
6.4.2 Genetic Studies
The complete mitochondrial DNA control regwn sequence was obtained for all the
samples collected from the Maltese Islands. Every sequence was unique with a haplotypic
diversity of h = 1 and a nucleotide diversity of 0 = 0.00335 for the entire sample.
Although the high degree of observed DNA variation, these figures were very similar to
the results already obtained in Spain with a total Mediterranean haplotypic diversity of h =
0.096 and 0 = 0.035 (Pia et al. , 1998).
The tree topology clustered the sequences in three divergent clades. Only the third clade
showed 100% bootstrap values. These three clades were also previously observed in the
Mediterranean (Pia et al., 1998) with a high sequence divergence of the third clade. The
clade I comprised eight sequences (72%), the clade ll presented two unique sequences
( 18%) and the remaining belonged to the third clade (9%).
122
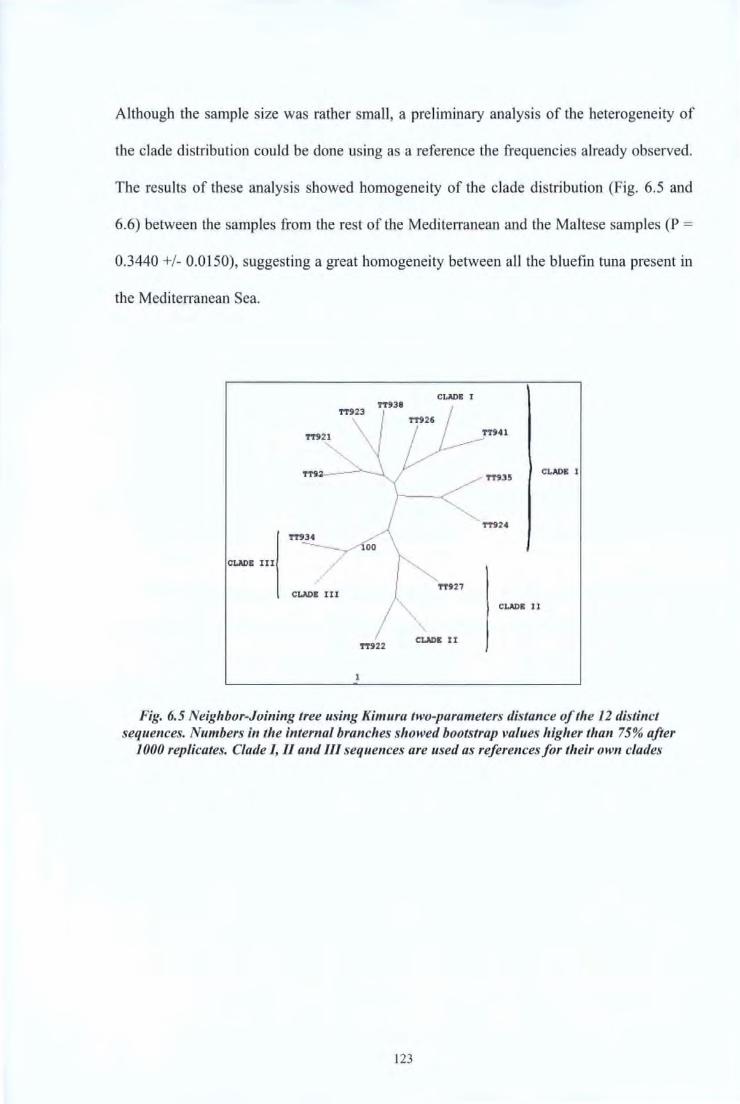
Although the sample size was rather small, a preliminary analysis of the heterogeneity of
the clade distribution could be done using as a reference the frequencies already observed.
The results of these analysis showed homogeneity of the clade distribution (Fig. 6.5 and
6.6) between the samples from the rest of the Mediterranean and the Maltese samples (P =
0.3440 +/- 0.0150), suggesting a great homogeneity between all the bluefin tuna present in
the Mediterranean Sea.
TT935 CLAOI l
TT934 ....___ _____ 7
/ 00 ~' L TTSI27
.l ~•n
CLADB III
CLADB III
CLAOB JT
Fig. 6.5 Neighbor-Joining tree using Kimura two-parameters distance of the 12 distinct sequences. Numbers in the internal branches showed bootstrap values higher than 75% after
1000 replicates. Cl a de I, II and Ill sequences are used as references for their own clades
123
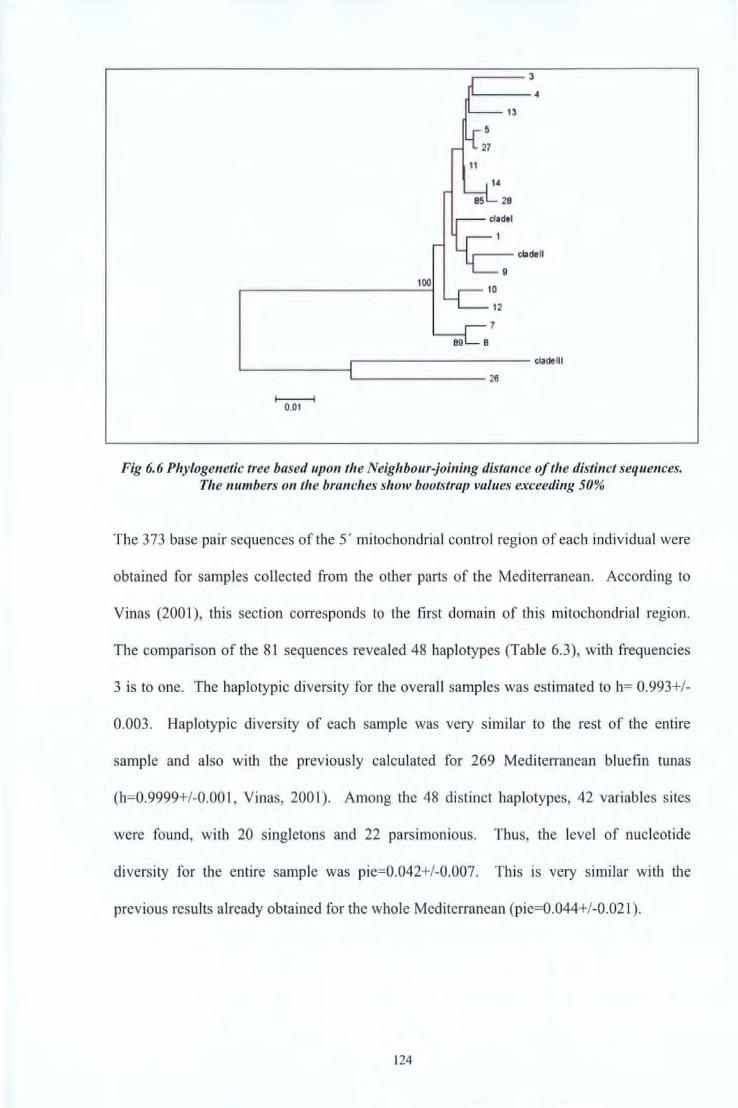
.----- 3
13
28
9
7
L _____ -f---------- eladelll
f-------i 0.01
~-------26
Fig 6.6 Phylogenetic tree based upon the Neighbour-joining distance oft/re distinct sequences. The numbers on the branches show bootstrap values exceeding 50%
The 3 73 base pair sequences of the 5, mitochondrial control region of each individual were
obtained for samples collected from the other parts of the Mediterranean. According to
Vinas (200 I), this section corresponds to the first domain of this mitochondrial region.
The comparison of the 81 sequences revealed 48 haplotypes (Table 6.3), with frequencies
3 is to one. The haplotypic diversity for the overall samples was estimated to h= 0.993+/-
0.003. Haplotypic diversity of each sample was very similar to the rest of the entire
sample and also with the previously calculated for 269 Mediterranean bluefin tunas
(h=0.9999+/-0.00 l , Vinas, 2001 ). Among the 48 distinct haplotypes, 42 variables sites
were found , with 20 singletons and 22 parsimonious. Thus, the level of nucleotide
diversity for the entire sample was pie=0.042+/-0.007. This is very similar with the
previous results already obtained for the whole Mediterranean (pie=0.044+/-0.021).
124
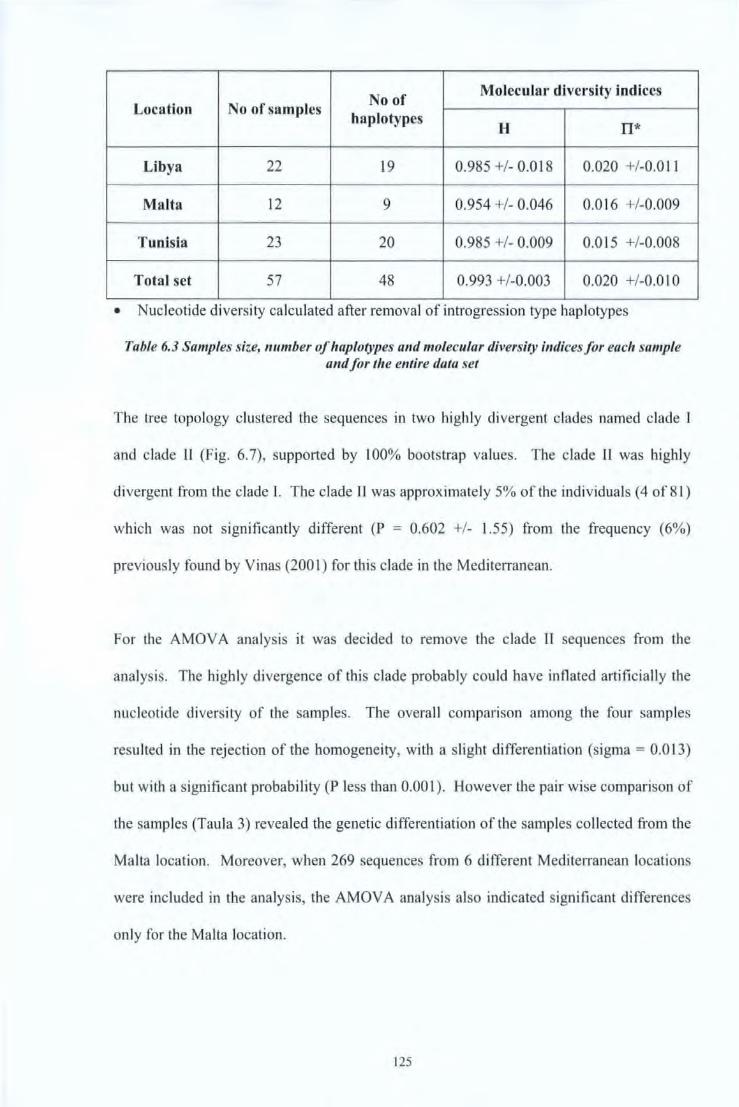
No of Molecular diversity indices
Location No of samples haplotypes
H 11*
Libya 22 19 0.985 +/- 0.018 0.020 +/-0.0 11
Malta 12 9 0.954 +/- 0.046 0.016 +/-0.009
Tunisia 23 20 0.985 +/- 0.009 0.0 15 +/-0.008
Total set 57 48 0.993 +/-0.003 0.020 +/-0.0 I 0
• Nucleotide diversity calculated after removal of introgression type haplotypes
Table 6.3 Samples size, number of haplotypes and molecular diversity indices for each sample and for the entire data set
The tree topology clustered the sequences in two highly divergent clades named clade I
and clade Jl (Fig. 6.7), supported by I 00% bootstrap values. The clade II was highly
divergent from the clade I. The cl a de II was approximately 5% of the individuals ( 4 of 81)
which was not significantly different (P = 0.602 +/- 1.55) from the frequency (6%)
previously found by Vinas (200 l) for this clade in the Mediterranean.
For the AMOVA analysis it was decided to remove the c lade li sequences from the
analysis. The highly divergence of this clade probably could have inflated artificially the
nucleotide diversity of the samples. The overall comparison among the four samples
resulted in the rejection oftbe homogeneity, with a slight differentiation (sigma = 0.013)
but with a significant probability (P less than 0.001 ). However the pair wise comparison of
the samples (Taula 3) revealed the genetic differentiation of the samples collected from the
Malta location. Moreover, when 269 sequences from 6 different Mediterranean locations
were included in the analysis, the AMOV A analysis also indicated significant differences
on ly for the Malta location.
125
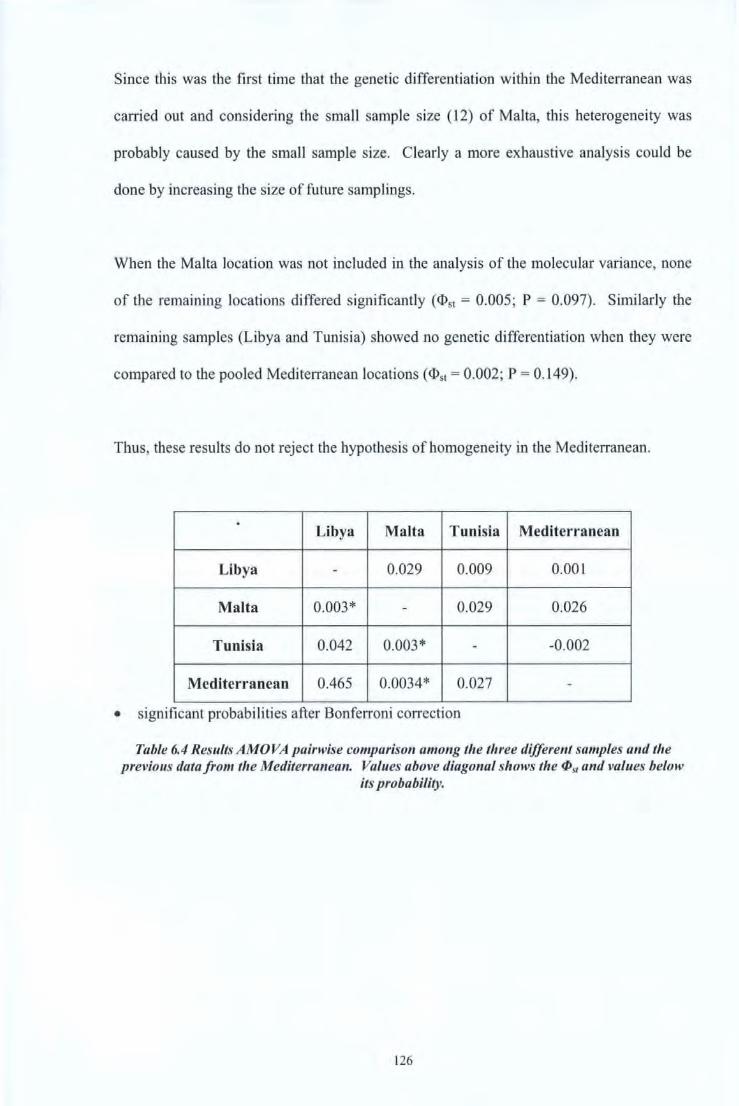
Since this was the first time that the genetic differentiation within the Mediterranean was
carried out and considering the small sample size (12) of Malta, this heterogeneity was
probably caused by the small sample size. Clearly a more exhaustive analysis could be
done by increasing the size of future samplings.
When the Malta location was not included in the analysis of the molecular variance, none
of the remaining locations differed significantly (<1>51 = 0.005; P = 0.097). Similarly the
remaining samples (Libya and Tunisia) showed no genetic differentiation when they were
compared to the pooled Mediterranean locations (<Ds1 = 0.002; P = 0.149).
Thus, these results do not reject the hypothesis of homogeneity in the Mediterranean .
. Libya Malta Tunisia Mediterranean
Libya - 0.029 0.009 0.001
Malta 0.003* - 0.029 0.026
Tunisia 0.042 0.003* - -0.002
Mediterranean 0.465 0.0034* 0.027 -
• significant probabilities after Bonferroni correction
Table 6.4 Results AMOVA pairwise comparison among the three different samples and the previous data from the Mediterranean. Values above diagonal shows the tPst and values below
its probability.
126

..:. ~ 'lt.~ 0
.. , '?1 " -\,~"'
~~ ~1()
<s ~ff
~ 2sz 208
34 146 10 211
24o 24'9 ~7
<'"!; <,r,.
<>.s-$
"~· -'.$' .,) .,~
~.! ~ - ~ ~ ,~~ '" N~~~s ~
Fig 6. 7 Neighbor-joining tree with Tamura-Nei distance (a= 0.27) of the bluefin tuna hap/otypes. Values in the branches.
The genetic studies have demonstrated the low genetic differentiation with the Libyan and
Tunisian locations. Thus, these locations are genetically closely related to each other and
also to the rest of the Mediterranean. On the other hand, the genetic differentiation of the
Maltese sample was probably due to the small size effect but clearly more analysis
involving comparisons between individuals targeted during the same year would be
desirable to corroborate these fmdings.
127
6.5 Summary
I. The chemical analysis of bluefin tuna otoliths appears to give good evidence of the
origins and spatial history of bluefin tuna.
2. The study of the otoliths has demonstrated that the chemical signatures in the otoliths
ofbluefin tuna from the Mediterranean and the Atlantic nurseries are relatively distinct
and even show some degree of temporal persistence.
3. The indications from the otolith samples examined, in comparison with similar
samples from the east and west Atlantic, are that a confidence level of more than 75%
is attainable
4. Data is critically needed to estimate exact origins ofbluefin tuna populations and findings
from future otolith based assessments will most likely play a central role in providing a
means of identifying source and relative contributions of different nursery grounds in the
Mediterranean Sea and the Atlantic Ocean.
5. Utilizing DNA 'fingerprinting' and related techniques will enable identification of
distinct units of bluefin tuna to be identified.
6. The results obtained in the genetic studies show that the samples analyzed are part of the
general distribution of bluefin tuna in the Mediterranean Sea. In this sense, this data
could be used to identify the genetic homogeneity of the bluefin tuna distribution in the
Mediterranean Sea and the hypothesis that this is a separate stock in all senses.
128

l lj
I '·
EXPJLO_IjJ A l'EON T1E.CHNI:QlJ\ES: 1F:OR BLU1E1F!EN
TUNA

7.1 Introduction
The first part of this chapter aims to analyze the old and new exploitation techniques for
the bluefin tuna in the Mediterranean in order to determine trends in landings, presence of
illegal, unreported and unregulated catches and to conclude whether the bluefin tuna
population in the Mediterranean is being overexploited or not. The second part of this
chapter analysis the difficulties arising from the new exploitation of bluefin tuna, i.e. tuna
farming.
7.2 Exploitation of Bluefin Tuna
It is well known that Japan is the main market for tuna from world fisheries. It is also the
underlying force driving the current development of the tuna fishing sector in the
Mediterranean. Farmed tuna from the Mediterranean has a higher oil content than its
Australian equivalent and is more appreciated in Japan because the oil gives the flesh a
more reddish colour which makes it more attractive. Mediterranean farmed tuna (Fig. 7.1)
is either exported fresh by air cargo or, more usually deep-frozen by means of cargo
vessels.
130
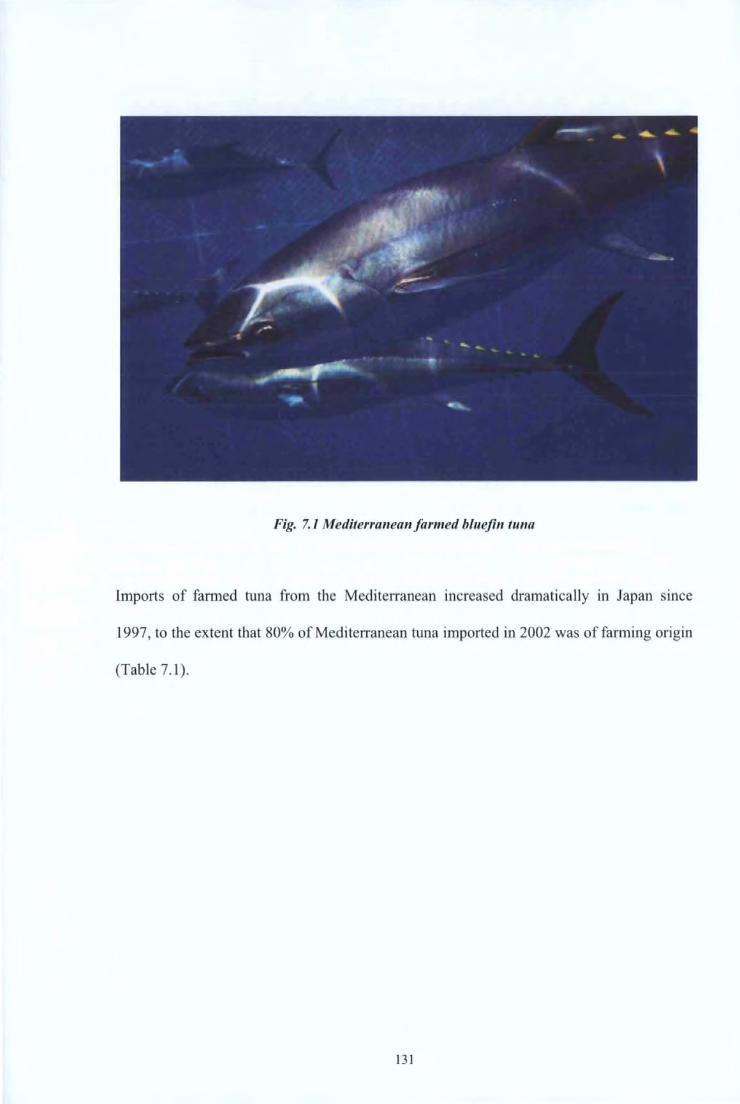
Fig. 7.1 Mediterranean farmed bluejin tuna
Imports of farmed tuna from the Mediterranean increased dramatically in Japan since
1997, to the extent that 80% of Mediterranean tuna imported in 2002 was of farming origin
(Table 7.1).
131
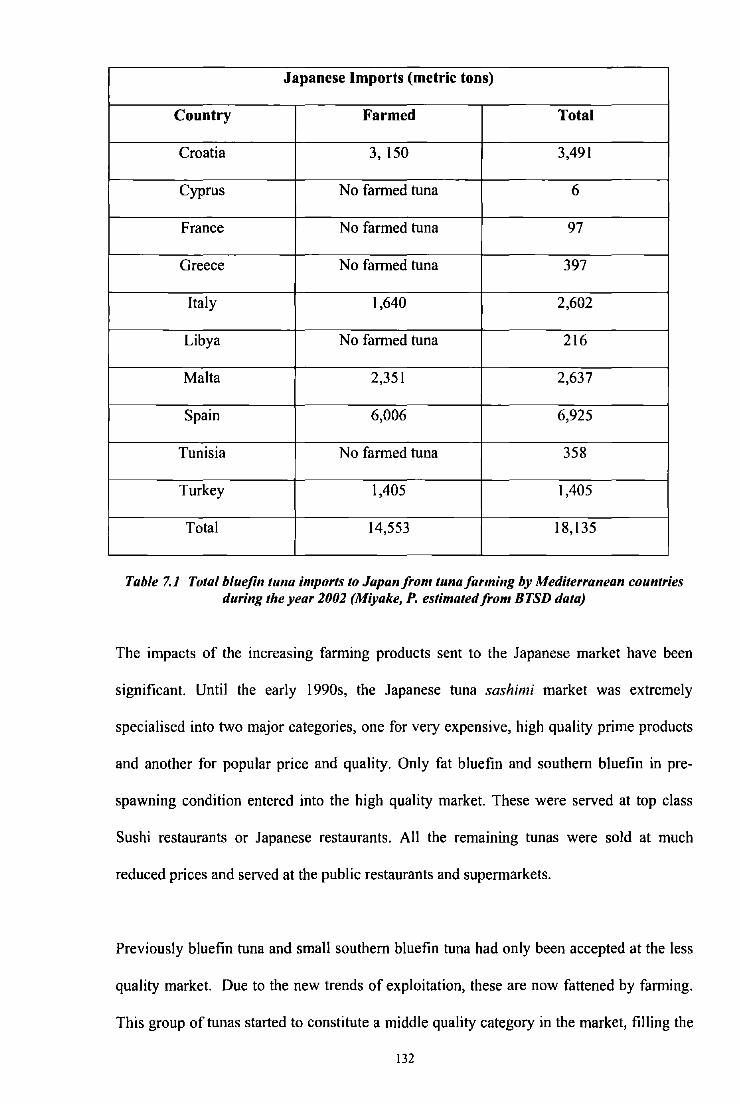
Japanese Imports (metric tons)
Country Farmed Total
Croatia 3, 150 3,491
Cyprus No farmed tuna 6
France No farmed tuna 97
Greece No farmed tuna 397
Italy I ,640 2,602
Libya No farmed tuna 216
Malta 2,351 2,637
Spain 6,006 6,925
Tunisia No farmed tuna 358
Turkey 1,405 I ,405
Total 14,553 18,135
Table 7.1 Total bluejin tuna imports to Japan from tuna farming by Mediterranean countries during the year 2002 (Miyake, P. estimated from BTSD data)
The impacts of the increasing farming products sent to the Japanese market have been
significant. Until the early 1990s, the Japanese tuna sashimi market was extremely
specialised into two major categories, one for very expensive, high quality prime products
and another for popular price and quality. Only fat bluefin and southern bluefin in pre-
spawning condition entered into the high quality market. These were served at top class
Sushi restaurants or Japanese restaurants. All the remaining tunas were sold at much
reduced prices and served at the public restaurants and supermarkets.
Previously bluefin tuna and small southern bluefin tuna had only been accepted at the less
quality market. Due to the new trends of exploitation, these are now fattened by farming.
This group of tunas started to constitute a middle quality category in the market, filling the
132

gap between the previous two extreme categories. The price for the middle quality tuna is
still much less than the top quality meat but considerably better than lean red meat tunas.
These fish (fattened farmed tuna) provide the public with fatty meat called 'toro' which
only rich people could have eaten before. These farmed tuna are now sold even in the
supermarkets and used in the popular and inexpensive sushi bars such as rotating sushi bars
(sushi being carried on conveyors which customers pick up). In a way, it brought 'toro'
taste to the public and enriched the Japanese people's food habit. On the other hand, it
dragged down the price of high quality meat tuna, as well as pushing down the lower
quality meat tuna.
All indications in late 2003 pointed to the saturation of the Japanese market due to the
overproduction of farmed tuna from the Mediterranean. As a result, in 2003, prices
fetched by Mediterranean farmed tuna in the Japanese market fell down due to an over
supply crises (WWF, 2004). This fact uncovered the paradox that the strong and extremely
rapid development in the production of farmed tuna in the Mediterranean during the last
years had been made following a purely short-term perspective, seeking immediate huge
profits, without taking into consideration the economical sustainability of the business vis-
a-vis international markets and the sustainability of the bluefin tuna fishery.
7.2.1 Changes in the fishing industry
Tuna farming has brought a revolutionary change to the Mediterranean fishing industry. It
has created a lot of new jobs for farming, the tuna fish price went up for fishermen, and
changed the operational procedure completely (including fishing area and season as well as
net lifting procedures). The fish caught by purse seiners used to be sold at the local markets
for canning and just a little was used for fresh fish consumption. Therefore the price was
133
quite low, less than a dollar per kilogram. Now there is a whole new field of farming and
there is an increasing demand for purse seine caught fish with a much higher price paid,
more than 9 dollars per kilogram.
The demands from the tuna farming industry have created increasing fishing pressure on
some small pelagic stocks targeting for feeding farmed bluefin tuna. Some of these
fisheries affect stocks already in decline, such as the anchovy. Conversion rates reported
for farms in Italy, Spain and Turkey range from 10 kg to 25 kg of baitfish consumed to
produce only I kg of tuna. This low conversion efficiency from feed to tuna meat also
makes tuna farming a wasteful practice, entailing a high ecological footprint. In fact, the
demand for bait fish, such as sardine, mackerel, squid and anchovy (Fig. 7.2) has
increased, as 3 to 5% of the mass of the fish farmed are required daily for feeding. ln the
Italian market, the prices for frozen mackerel for bait have increased by about 75% since
1998, frozen squids by 40 to 110 %, depending on the size and quality, and sardines by
80%.
134

Fig. 7.2 Baitfish used for feeding farmed blueji11 tu11a
7.2.2 Changes in fishing gear
When targeting bluefin tuna for fanning, the type of gear to be used is very important. In
fact it must take into account the stress that occurs during fishing and should provide tunas
that are able to adapt easily and rapidly to captivity. Tunas should have suffered minimum
physiological stress for better survivability.
The fishing technique most physiologically suited to target bluefin tuna for farming is the
purse seine (Doumenge, 1999). It is almost the only gear used for farming besides the
small amount caught by traps.
135

Purse seiners and traps target blue fin tuna mainly during their spawning migratory pathway
in the Mediterranean when they are travelling in shoals. Since the development of tuna
farming in the Mediterranean, a change in gear has been observed throughout the
Mediterranean. In fact the amount of bluefin tuna targeted by drift nets has completely
disappeared since the ban of drift net fishing in the Mediterranean by the European
Commission in 1998. Also the landings of longlines have dropped drastically since the
bluefin tunas landed by this gear are already dead and therefore cannot be used for
farming.
Purse seining is a modern fishing technique developed in the 1950's. It involves shooting
a large net off the stem of a fishing vessel, with a bottom weighted line and a top float line
that extends the net vertically in the water. A second smaller vessel (skiff) pulls one end of
the net from the purse seiner as both vessels encircle the shoal of fish from opposite
directions until finally reconnecting the skiff end of the net with the purse seine vessel.
The purse seiner then draws the purse line closed, creating a purse to entrap the shoal of
tuna. Purse seining is a very efficient system that can be defined as an industrial fisheries
tool, is species selective and in the Mediterranean Sea does not entail high bycatches of
cetaceans (Tudela, 2002b ). It is almost the only system that allows the transfer of live fish
to the fattening cages and is therefore an essential component for industrial tuna farming.
The high tech purse seine activity is now being privileged in front all the other fishing
gears in the Mediterranean, given the interest of the industry to secure live captures to fill
the cages. This, in turn, has resulted in an increasing vertical integration of the business
through either formal agreements between tuna fishing ship owners and farmers or,
directly, through the direct involvement of the farming industry in fishing operations (like
the case of Murcian producers who own some units of the Spanish and French purse seine
136
fleet). Another direct consequence has been the rapid increase in purse seining fishing
capacity.
Fuelled by the high demand from Mediterranean farms, the French and Spanish tuna purse
seine fleets underwent an intense modernisation during the last few years (including vessel
replacement by more highly efficient units) by utilising funds from the European Union
(Financial Instrument for Fisheries Guidance - FlFG). This has resulted in a net increase
in their fishing capacity. In other countries, projects for the building of new purse seine
fleets have been made public like Algeria and Greece.
The case of Turkey is especially paradigmatic, in the sense that tuna farming production is
currently booming linked to domestic purse seine catches, in spite of not having been
allocated any quota from ICCA T for bluefin tuna for the whole period 2003 -2006 (WWF;
2004)
The amount of bluefin tuna caged for farming in the Mediterranean in 2002, estimated
from industry data (Miyake, 2003) amounts to a total of 14, 620 metric tons. If compared
to purse seine production in 2002 (15, 830 metric tons, ICCAT, 2003), it is clear that that
year virtually all purse seine catches in the Mediterranean were caged into tuna farms.
This suggests that any further sharp increase in farmed production in the Mediterranean
with respect to 2002 figures would surely originate from illegal over quota catches, given
the current limit set by ICCAT at 32, 000 metric tons per year for 2003 - 2006, that
represents a theoretical freeze in fishing effort.
Nevertheless, by departing from this 'saturation' point reached in 2002, information
available for 2003 indicates a clearly alarming trend. The report of the second meeting of
the Ad hoc GFCM/ICCAT Working Group on Tuna Farming in the Mediterranean, held in
137

Turkey in December 2003, reports that according to data from the Japanese industry, about
21, 000 metric tons of bluefin tuna were introduced in Mediterranean cages in 2003.
Whereas it is not clear if this estimate also includes inputs into unreported farms, it agrees
with other well informed sources that pointed to a farming capacity in Mediterranean farms
in 2003 amounting to 25, 000 metric tons (WWF, 2004). Given that this live tuna was
almost exclusively supplied by purse seiners (except a marginal amount by traps), it is
worth highlighting that Mediterranean purse seine catches higher than 21, 000 metric tons
have only historically been met with total captures of 40, 000 metric tons or more. Clearly,
this level of purse seine catch is not compatible with a total annual quota of 32, 000 metric
tons for the year 2003 - 2006, as it is currently in force.
7.2.3 Changes in fishing areas
Nowadays spotter planes are used to spot the shoals of tuna. Fishermen are then informed
about the location of the shoals and they move to these areas where shoals of blue fin tuna
(reaching more than 600 individuals) would be present. Most would be caught since purse
seines and traps are very efficient gears. The areas where purse seiners move are mainly
the spawning areas of the Mediterranean. In fact the high yields of the purse seiners also
show the high vulnerability of the spawning bluefin tuna to this method. Artisanal surface
long line catches have decreased considerably from these areas apparently as a result of the
tunas being taken from the shoals by the purse seine nets.
Consequently the establishment of closed purse seme areas should be considered for
particular areas of the Mediterranean which are the main spawning areas with the main aim
of protecting bluefin tuna during their spawning season. Even small areas would
contribute to a significant protection for spawning and recruitment in the Mediterranean
138

Sea and would therefore contribute to the sustainability of tuna farming m the
Mediterranean.
7.3 Is the bluefin tuna population being overexploited?
Bluefin tuna (Thunnus thynnus) is a widely distributed species throughout temperate
waters in the Atlantic and Mediterranean Sea. Due to its highly migratory character,
several fisheries target bluefin tuna by means of different gears. Fisheries are mainly
seasonal and directed to different fractions of the bluefin tuna population.
Thus, reproductive tuna are caught during genetic migration to known spawning areas, i.e.
the Balearic Islands and the Adriatic Sea. In Morocco bluefin tuna is targeted by traps
located in the Strait of Gibraltar and close to northern African coasts. Once in the spawning
grounds, bluefin tuna is caught by longliners and purse seiners. Before and after the
spawning season, younger bluefin tuna is caught by purse seine, bait boat and trolling gears
targeting them in their feeding grounds. Furthermore, bluefin tuna is also caught by bottom
hand line, in very limited areas, for longer periods.
For the last years, bluefin tuna feeding and fattening activities (confining fish within large
floating marine netcages) has experienced a great development. Wild bluefin tuna, mostly
provided by purse seine vessels and to a lesser extent by traps, are towed to several
aquaculture units located throughout the Mediterranean Sea. From the study carried out,
the decrease in the number of traps and the subsequent in the number of purse seiners
throughout the Mediterranean Sea is quite evident.
Under and mis-reporting is the main source of uncertainty related to catch data. Though
most of the countries fishing for bluefin tuna are now ICCA T members (i.e. they have to
139
report annual catches), ICCAT official statistics are unfortunately highly misleading. This
was clearly demonstrated in 1998 when several countries asked for a revision of the
official ICCAT statistics for the 1991 - 1997 period. This request was actually motivated
by the implementation of a Total Allowable Catch in 1996; the quota of each country being
proportional to its historical catches. Not so surprisingly, this revision led to a 20 to 25 %
increase in total catches (lCCAT, 2000).
The second problem is related to the fishing of bluefin tuna less than I year of age. This
activity is still important in most coastal Mediterranean countries, but it is not reported
since the size limit of landings of bluefin tuna is fixed at 6.4 kg (with a tolerance of 15 %
for fish between 3.2 and 6.4 kg). This widespread under reporting which results from both
industrial and small-scale fisheries, is impossible to evaluate accurately and strongly biases
the assessment and management procedures.
To address unreported catches lCCAT compares the catch data reported by the different
countries (Task I data) with the import figures to Japan (biannual Bluefin Tuna Statistical
Document, BFSD). A comparison of 1999 figures amounted to an estimated 3, 242 metric
tons of unreported catch in the Mediterranean by Spain, Croatia, France, Italy, Portugal
and Morocco. This was about 10% of the quota set for that year and almost certainly still
below the actual catch (WWF, 2004).
Changes in gear technology and tactics mainly affect the purse seine fleet, which at the
moment is the largest one in the Mediterranean Sea. In comparison to 1970, a standard
purse seine was in 2000 twice as long and four times more powerful in horse power.
Though such a change can easily be modelled, it is more difficult to model objectively the
recent increasing use of powerful positioning and prospecting equipment, such as bird
140
radar, sounder, sonar and aircraft as well as new storage equipment, such as carrier vessels
with deep freezing storage and pool systems (Liorzou, 1999).
Because large tunas have a considerable value on the Japanese market, the purse seine fleet
that used to target small fish until the 1980s, now targets both small and big fish.
Subsequently, purse seiners strongly expanded their fishing area in the Mediterranean Sea.
In 2001, the Algerian Fisheries Firm Union Peche, announced that they had signed an
agreement with the Spanish-Portugese ship building company Navalfoz. According to the
agreement, the fleet of 20 tuna purse seiners with a deck length of 30 metres and I
measuring 47 metres would be built. This example illustrates the powerful economic
interest behind tuna farming activities that are fuelling the development of the sector in the
Mediterranean. The economic investments associated with this operation amounted to 20
million $. lt is also noteworthy that this development was agreed despite the fact that
Algeria did not become a Contracting Party to ICCAT until February 200 I and lacked any
quota for bluefin tuna allocated by ICCAT until 2003. With an aim to get a better quota
from ICCAT, Algeria supplied ICCAT with revised figures on national catches of bluefin
tuna for the last years. The new figures showed a peak in landings in 1993 and 1994,
surprisingly the same years that ICCA T uses as the reference point for quota allocation
among the different states. Algeria was finally given a quota of I ,500 metric tons, a
volume which does not justify the building of the enormous purse seine fishing capacity
announced. Such changes in both selectivity and fishing area are known to bias the effort
estimate. This case illustrates the powerful economic interests behind tuna farming
activities that are fuelling the development of the sector in the Mediterranean Sea.
Turkey has also seen an increase in purse seine fishing for bluefin tuna, going from 28
purse seine units in 2002 to 50 purse seine units targeting bluefin tuna in 2003. Bluefin
141
tuna catch in 2002 amounted to 2,300 metric tons, I ,400 metric tons of which were
transferred into farms. It is important to note that Turkey has only become a Contracting
Party of ICCAT since August 2003 and that there is no quota for bluefin tuna allocated
from ICCA T to this country for the whole period 2003 - 2006. In this context, all Turkish
production is arising from 'illegal' fishing.
Another source of uncertainty relates to the cooperation and competition between fishing
vessels. Purse seiners tend to work in teams of about 5 boats. As soon as a boat catches a
shoal, it shares its catch with its partners but also with boats of other teams if the latter
arrives at the fishing location before the former has finished surrounding the shoal with its
seine. The teams change from year to year and there is also strong competition between
them. These changes, which affect fishing effort positively and negatively, are highly
difficult to quantify without detailed information provided by observers on board who must
be present continuously throughout the whole bluefin tuna fishing season.
Improving standard stock assessment procedure would involve reducing these subjective
uncertainties, and it therefore appears necessary to consider the perverse effects related to
the implementation of a Total Allowable Catch on the Mediterranean bluefin tuna stock.
There is no doubt that this management measure has increased the level of m is- and under-
reporting and decreased the quantity and quality of information related to the fishing effort.
The official statistics have become less trustworthy and their deterioration will probably
continue without the implementation of efficient controls of the present rules.
Regarding the last stock assessment made by the ICCAT scientists in 2002, the low quality
of the input information available led the Scientific Committee for Research and Statistics
to conclude that it was not possible to make definitive management recommendations
based on the results obtained, since they were not considered to be reliable enough. In
142
essence, this was the ultimate explicit recognition by bluefin tuna specialists of the
impossibility to cany out a rational management of the stock under current conditions.
Consequently the standard stock assessment procedure based on official statistics is now
inoperative.
7.4 Difficulties arising from tuna farming
This new practice in the Mediterranean, i.e. tuna farming, is threatening one of our most
valuable resources. The bluefin tuna is already under considerable pressure and has been
declining for years. Now tuna farming has opened up a new section on the Japanese
market, which has further increased the demand for bluefin tuna and made the situation of
wild stocks even more perilous. Tuna farming has given rise to various problems in the
sector as will be discussed below.
7.4.1 Increasing effort
As the increase in price and demands for the purse seine caught bluefin tuna for the tuna
farming, the fishing efforts have been also concentrating on this type of tuna. This has an
undesirable impact on bluefin tuna stocks. Firstly, more effort is being exerted for smaller
fish and possible consecutive increasing proportion of smaller fish in the total catches
would result in lower yield per recruits. This indicates a sign of over fishing. Secondly the
east Atlantic population (including the Mediterranean population) had already attained the
level of a maximum sustainable yield when farming started to increase {lCCAT, 2002).
Therefore the increasing effort and consequent catches should have further reduced the
stock size, according to the analysis of the ICCA T Scientific Committee for Research and
143
Statistics. The Commission adopted a catch restriction policy smce 1995 but
implementation of quota system is getting harder and harder and non compliance seems to
be increasing, as the demands for bluefin tuna in the market continue increasing. During
the 131h Special Meeting of ICCAT held in Bilbao in 2002, lCCA T adopted an
unsustainable annual quota of 32, 000 metric tons for the years 2003 - 2006, 23% higher
than the maximum level scientifically determined.
7.4.2 Possibility of tuna 'laundering'
The current management system based on quotas is largely non operational since there are
no effective mechanisms in place ensuring a monitoring of overall catches in real time.
This means that it is not possible to stop the whole fishery when the total annual quota has
been met because neither is ICCAT receiving continuous updated information on catches
during the fishing season nor is it empowered with the political mechanisms member states
require to do so. Tuna farming is increasing this problem and total catches on the stock on
a national basis are reported to the management authority- lCCAT- a posteriori, the
following year or even two years later.
Another serious problem is the increasing uncertainties in statistics. Unfortunately, the
lCCAT Bluefin Tuna Statistical Document (BFSD) is required for only dead fresh or
frozen tuna products, and the international trade of live tuna is not recorded in these
documents. In other words, the live tuna could be imported from any country without any
documentation.
Some countries, such as Malta, require BFSD to be completed, even if the fish are alive,
and issue re-export BFSD when the products are shipped out of the country. Some other
countries require fishermen to report catches and register the sales of live fish, even though
144
BFSD is not required. On the other hand, trade between countries of the European Union
are not considered as foreign trade and hence there is no need of such actions regardless
the condition of fish (live or dead). Such a lack of documents continues to mask transfers
between fleets and farms from France, Spain, Italy, Malta and Cyprus.
Once they are transferred into the pen, the identities of origin of the fish are lost. When
these tuna are lifted, harvested and exported to other countries, a BFSD has to go with it
and the authority of the country where farming took place sign such a document. In other
words, the countries where the bluefin tuna were caught are not necessarily signing the
documents. For example, bluefin tuna farmed in Malta but caught by a Libyan vessel will
be issued with a re-export certificate from Malta and not by the catching country.
Consequently, the quantities ofbluefin tuna exports from one country can exceed their real
(reported) catches by a significant quantity. The origins of these fish are lost. Only
exception is the case where the country request BFSD even when the fish are imported live
(e.g. Malta). Thus, if one country caught over their quota and exported it as live fish, to
find out such over usage of the quota would be difficult.
Finally the transfer of European farms, mainly Spanish, toward North African countries
(even if both countries are equally bound to ICCAT obligations) to avoid control for their
activities, is already taking place. This has led some to speak about 'IUU farms' spreading
around the Mediterranean (mimicking the concept of IUU- illegal fishing). WWF (2004)
reported that Libya and Tunisia did not report their farming activities to the GFCM/ICCAT
Working Group on Tuna Farming last year, after having been formally required to do so.
145
7.4.3 Body weight increase of farmed tuna
As the fat content increases, tunas are expected to increase their body weight during the
farming period. Tuna farmers expect at least 25% increase in body weight during the few
months farming. Therefore, in order to estimate the original live weight of fish at the
beginning of farming, the weight of lifting at the end of farming has to be converted by
applying a factor of increase.
This weight increase is having strong implications for the control of quota since there is
room for countries/farms to argue high weight gains in their farms to hidden excess
catches. At this regard, it is noteworthy the broad range of weight gain percentage
reported for farms in Italy, Spain and Turkey (from 10% to 50%).
The ICCAT scientific requirements are to report 'catches' in weight. Therefore in
principle, even if the fish are captured and sold alive to the fish farmers of other countries,
the catches in weight (at the time of the capture) must be reported by the flag states.
Actually most of the countries are implementing reporting of all the captures. If they are
reported correctly, then the landing (lifting) data of farmed fish should not be added to the
bluefin catches. However, if the implementation of such a rule is not really effective and
they are not reported, the landing weight less growth during farming must be estimated and
added to the reported catches. On the other hand, if there is a large mortality during the
farming, landing can be even less than the weight of the fish entered into the cage when
farming started.
Also, in countries such as Croatia, increasing amounts of fish are now being kept over a
year in cages. This means that only a part of the catches of one year is landed in that year
and the rest would be landed in the following years. Therefore, the landing (or harvest
146
from the fanning) has no relation with the catches. These elements all add up to the
increasing uncertainties of the bluefin tuna catch statistics.
7.4.4 Conversion factors from products to the round weight of bluefin tuna
Generally, the fanned bluefin tuna products are exported to the Japanese market and
reported in the weight of products (such as gilled and gutted, dressed, loins, etc.) The
SCRS established conversion factors from products weight to live weight for bluefin tuna.
However, those are based on fish captured from the wild. Therefore, it is apparent that the
conversion would be different for fanned tunas. Further investigations should start in this
particular area.
7.4.5 Difficulties in sampling
Bluefin tuna size data used to come from size measurements of the catches made by
various gears such as purse seine, trap, etc. However, since fanning activities of bluefin
tuna started, such sampling from the catches is getting more and more difficult, because
live tunas are moved from purse seines or traps directly to the cages. This is leading to
inadequate sampling by various countries. As such no reliable stock assessments can be
carried out.
7.4.6 Effects on the environment
Dense fanning may cause water pollution in two aspects, one from the leftover of bait and
cultured fish and another from processing. ln Malta stringent Environmental Impact
Assessments are carried out prior to the start up of the operation. These data are then used
as the benchmark. Water and sediment analysis are carried out on a regular basis together
147

with benthic surveys in order to follow continuously the effects on the environment. In
order to keep control of pollutants, Spain is limiting the number of cages which could be
operated in a certain area. However, as the operations continue to expand all over the
Mediterranean, this problem will remain. This issue needs to be looked into further in
order to try and find methods which are environmentally friendly.
The effects on human sanitation of the chemicals and/or medicines possibly used with baits
need to be evaluated. In most of the places, the use of the chemicals and medicines (e.g.
hormones, antibiotics) for farming is prohibited by the law. However, the implementations
are not well studied. These should also be studied and monitored with much care.
7.4.7 Future of tuna farming
The farmed bluefin tuna industry is expected to continue increasing in the coming years
due to further technical developments and the market demand for its products. The long
term sustainability of the industry will depend on several factors:
• The supply of food fish (small pelagics)
• The development of formulated feeds
• Improvements in feed formulation to ensure meat quality
• The continued availability of seed material
• The expansion of marketing activities away from reliance on Japanese markets
• Improved harvesting techniques
• Improved offshore technologies for culture systems
148
Environmental and ethical concerns will continue to affect the functioning and image of
the industry. Regulations are needed to create and control the traceability of products as
well as quality and environmental issues, e.g. by tagging all bluefin tuna which are
transferred into cages.
The prospect of achieving the captive breeding bluefin tuna and being able to manage the
complete life cycle could represent a base from which the industry could further expand.
This issue alone would remove ecological concerns and guarantee a more sustainable
future for the sector. On the 7th July, 2005, members of the European Union funded
research team REPRO-DOTT (Reproduction and Domestication of Thunnus thynnus),
announced the first successful hormonal induction of a captive breed stock of the bluefin
tuna to obtain eggs and sperm. ln vitro fertilisation was carried out successfully and viable
larvae were produced. This is a very important achievement in controlling reproduction of
the species as it proves that it is able to mature in captivity and produce viable gametes for
successful fertilization. This might be the first step at controlling the whole life cycle of
the fish in captivity and save the bluefin tuna from extinction.
149

Chap.ter 8:
DISCUSSION, M_AINAGEMiEN'f S:fRA.J'EGIES
AND RECOMME:NDAIJj']jQNS
8.1 Introduction
This chapter aims to analyze the results obtained in the experiments described in the
previous chapters in order to determine whether the Mediterranean population is a separate
stock or not. The management strategies that should be followed together with the
recommendations for the future are given at the end of the chapter aiming to ensure the
future sustainability of the species.
8.2 Stock Identification
In the experiments discussed in the previous chapters, differences were observed between
the biometric relationships determined by this study and the biometric relationships
available for the Atlantic. Although more experiments in line with the experiments carried
out in the Mediterranean need to be carried out in the Atlantic, the results obtained indicate
that the Mediterranean stock has its own distinct characteristics and therefore needs to be
managed as a separate stock.
The age - length key determined by this study will allow the determination of the age of
Mediterranean bluefin tuna up to the age of 16 years. This key will provide essential
information in all aspects of studies carried out on bluefin tuna. As yet no age - length key
(till the age of 16 years) has been determined for bluefin tuna caught in the Atlantic. Further
studies will allow age determination for all bluefin tuna caught in the Atlantic and this could
then be compared with the age - length key of the Mediterranean. If significant differences
are found, this would lead to the hypothesis of the presence of a permanent residing blue fin
tuna stock in the Mediterranean Sea.
151
Maturity studies carried out on bluefin tunas caught by the Maltese longline fishery in the
Mediterranean indicate that most of the bluefin tuna females studied were mature. These
females contained a lot of yolked oocytes, nuclear migration stage oocytes or
postovulatory follicles that suggest an imminent or recent spawning period. The presence
of spawning areas within the Mediterranean shed light on the fact that the bluefin tuna can
complete its life cycle in the Mediterranean without having to migrate into different waters
in order to spawn.
The present study, performed on a consistent number of female specimens indicates that
50% of the Mediterranean bluefin tuna reaches the first sexual maturity at 104 cm (fork
length). The analysis of the spines indicates that all the specimens had completed the
formation of the ring corresponding to their last year of life. This finding is in agreement
with Cort ( 1991) and Megalofonou and De Metrio (2000) who reported that ring
completion occurs during April and May for bluefin tuna caught in the Mediterranean. This
data indicates that the estimated age of most of the specimens is 50 % sexual maturity at 3
years while I 00% maturity is reached at 5 years. In the case of the Western Atlantic, no
study reports the size of 50 % sexual maturity. The only data available indicates that
maturation starts at the age of 6 and I 00 % maturity is reached by the age of 8 years at a
fork length of 190 cm (NRC, 1994). It can be concluded that for the Mediterranean,
female bluefin tuna reach first sexual maturity at a markedly lower age and size than the
Atlantic population.
The pop-off satellite technology has the potential to improve the identification of discrete
biological stocks, which is paramount to the implementation of effective management. Till
now no concrete conclusions could be drawn since the number of pop up tags attached was
small. However the results obtained from this preliminary study indicate that bluefin tuna
152

present in the Mediterranean remain in the Mediterranean and that not all migrate back to the
Atlantic as was previously thought and assumed.
The study of the otoliths has demonstrated that the chemical signatures in the otoliths of
bluefin tuna from the Mediterranean and the Atlantic nurseries are relatively distinct and
even show some degree of temporal persistence. Data are critically needed to estimate
exact origins of bluefin tuna populations and findings from future otolith based
assessments will most likely play a central role in providing a means of identizying source
and relative contributions of different nursery grounds in the Mediterranean Sea and the
Atlantic ocean.
The genetic studies have demonstrated the low genetic differentiation with the Libyan and
Tunisian locations. Thus, these locations are genetically closely related to each other and
also to the rest of the Mediterranean. On the other hand, the genetic differentiation of the
Maltese sample was probably due to the small size effect but clearly more analysis
involving comparisons between individuals targeted during the same year would be
desirable to corroborate these findings. In this sense, this data could be used to confirm the
genetic homogeneity of the bluefin tuna distribution in the Mediterranean Sea and the
hypothesis that this is a separate stock in all senses.
In addition to the above research areas, evidence for stock identification was also sought
from work being done by others. The determination of the accumulation of methyl mercury
in the tissues of bluefin tuna is also a good way of identifying the stock since it can be used
together with the structural and chemical characteristics of the otoliths as an indicator of
the physiological and habitat characteristics of the species.
153

Among marine organisms, bluefin tuna tends to accumulate relatively large amounts of
mercury because they are high in the food chain and because they have a long life cycle.
In most species, mercury content increases with size (Davenport, S. 1995). Given the
commercial importance and the high demand for bluefin tuna on the food market, it was
important to determine the presence and quantities of some heavy metal pollutants in the
dorsal muscle of these fish. Mercury levels in bluefin tuna targeted in the Mediterranean
were found to be higher than the levels allowed by the Italian legislation (Storelli et al.,
1993).
Mercury levels were determined in 34 samples of bluefin tuna caught from the Libyan
coast and the concentration of mercury from the samples analysed ranged between 0.2 to
1.54 ppm. The average concentration was 0.52 ppm (Hassan, T. E., 1987). In a study
carried out by Storelli et al., (2002) total mercury concentration in bluefin tuna ranged
from 0.84 from 0.16 to 2.59 mg/kg wet weight (mean 1.18 mglkg)
When bluefin tuna samples were analysed, methyl mercury was the predominant form
present in the muscle comprising 57.4- 94.7 % of the total mercury content (Cappon &
Smith, 1982).
In a study carried out by Morales et al., (1991 ), the mercury levels in the flesh of bluefin
tuna ranged widely. In juvenile fish, they were high and significant, showing the
dependence of mercury level on fish size. The amount of mercury increased significantly
in the older fish but was poorly correlated with weight. The elemental composition of fish
otoliths was shown to reflect pollution, geographical effects and temperature of the
environment in which the fish had been living.
154
In the case of the Atlantic, the only reference material that could be found was the routine
analysis carried by the U.S Food and Drug Administration - Centre for Food Safety and
Applied Nutrition. During the Food and Drug Administration Programme (1990- 2003),
the levels of methylmercury in tuna ranged between 0.02 and 1.06 ppm. These data could
not be directly compared with data for the Mediterranean since the species of tuna was not
specified.
8.3 Management strategies
Over the past decades, the central Mediterranean has seen changes in the fleets fishing in
this area. Prior to 1994, the central area of the Mediterranean was fished predominantly by
industriallongliners of both coastal and non coastal states. Lately the industrial longlining
effort started decreasing whilst the purse seine fleet started to increase significantly as
described in the first chapter. This was mainly due to the development of the tuna farming
or penning development. Also more purse seining fleets were observed to shift their effort
to the central Mediterranean.
Prior to the development of tuna penning, the artisanal longlining fleet, the industrial
longlining fleet and purse seining fleet never reported any gear conflict. Conflicts have
now been reported pertaining more to the physical characteristics attached to the tuna
penning operation. In fact, in 2002 there were serious frictions between local Maltese tuna
fishermen (small to medium scale longliners) and the tuna penning industry and its
associated purse seine fleet. Disputes involving Italian (from the Adriatic) and Spanish
fishermen, on one hand and Maltese longliners, on the other, required the presence of the
Armed Forces. This situation, overcrowding and the high technology arising from the
physical characteristics of the penning operations have greatly affected artisanal longline
!55
fisheries in the Mediterranean. The livelihood of artisanal fishermen has been grossly
affected since it disrupts their fishing operation by causing physical damage to their
longlines which result in a decrease in landings and profits.
Members oflCCAT, Cooperating Parties and observers of ICCAT have adopted ICCA T's
recommendations to decrease fishing effort after 1994. This measure was aimed at
reducing landings throughout the Mediterranean basin. That is to say that the 25%
decrease in allowable catches has been counterbalanced by a shift that has seen effort in
this area increase by a greater percentage. The increase in efforts towards this area has
been generally by the purse seining fleets which target bluefin tuna during its spawning
season and aim at catching tuna and keeping it alive.
Purse seining exerts a more efficient fishing effort than longlining due to the technological
sophistication of this fishing operation. This means that the pressure on bluefin tuna
fisheries in the Mediterranean has increased considerably over the last years. The decline
in abundance of resources and the risk of their exhaustion has been announced by
international organisations such as the conference on the International Trade of
Endangered Species (CITES). There are various approaches to sustainability, ecological,
biological, economical and social. An ecological equilibrium and socio-economic
equilibrium greatly depend on each other and sustainability can only be guaranteed if they
are in harmony. It is vital for future fisheries management to follow the precautionary
approach by keeping a status quo in the absence of sufficient infonnation in order to assure
that the existing equilibrium is not upset.
The control of fishing effort in the Mediterranean is highly regarded as a major tool for the
sustainability of Mediterranean fisheries by regional bodies such as the General Fisheries
Commission for the Mediterranean and ICCA T.
156
Until now the total allowable catches of bluefin tuna yearly amount to around 32, 000
metric tons in the Mediterranean Sea and just 3,000 metric tons in the Atlantic Ocean. But
since the hypothesis was that trans-Atlantic migration exists, the population of Atlantic
bluefin tuna was managed by ICCA T and decisions were equally taken by all those
concerned with fishing for bluefin tuna both in the Mediterranean Sea and the Atlantic
Ocean.
This means that the countries fishing in the Atlantic were fully involved in the decisions to
be taken regarding fishing in the Mediterranean Sea. This cannot be considered to be the
best solution any more. It is right to have a single managing body like ICCA T but since
there are further studies suggesting that the Mediterranean stock is a separate one, more
power in the decision making procedures has to be given to the Mediterranean coastal
countries which fish in the Mediterranean Sea over the countries which fish only in the
Atlantic Ocean. Then lCCAT should be the managing body overall.
If more data support the evidence of a separate Mediterranean stock, then one should
consider the management of the Mediterranean bluefin tuna population to be done by a
Mediterranean regional body like GFCM (General Fisheries Commission for the
Mediterranean). This should be the regulatory body for the bluefin tuna in the
Mediterranean and then discussions should be held between GFCM and ICCAT so that
similar decisions are taken with regards to the bluefin tuna population in the Atlantic
Ocean and in the Mediterranean Sea.
Tuna farming is considered as capture based aquaculture since it depends on the wild
stocks for supplying the fish. This is having serious implications on the management of
fish of the wild stock. Bluefin tuna is just being kept for a few months in cages to be sold
157

out season and fetch higher prices. In fact it is mainly kept in cages to enhance the quality
of the meat and enhance the lipid content. But now the most important factor is not that it
has to be supplied fresh but that it must have an ideal lipid concentration in its meat. The
trend is just to enhance its lipid content, harvest it and deep freeze it and then wait until the
best market opportunities are available.
Initially tuna farming showed huge profits and this fact attracted many business people into
this new type of industry. The problem is that they invested so heavily that they have
created pressure to develop purse seine fleets with new technology with an increasing
fishing pressure. All these have lead to a huge over capacity.
A strict and immediate moratorium on the development of new tuna farms in the
Mediterranean should be considered. One needs to go beyond the simple creation of a
positive list of nationally authorised farms as recently adopted by lCCA T since this does
not provide for any kind of limitation in numbers.
A true tuna aquaculture independent of capture fisheries would involve controlling all the
stages of the life cycle of bluefin tuna. Therefore now the only remaining solution seems
to be that tuna farming must find a way in order to avoid interfering with the normal
spawning. But on the other hand it should help to enhance it. This can only be done either
by fishing after natural spawning has already occurred or by setting up closed fishing
areas. This could be achieved by shifting the bluefin tuna fishing season from May- July
as it is at present to the end of June - mid August. Another option could be the setting up
of closed spawning areas.
158

One could also suggest the collection of eggs from the bluefin tuna held in captivity,
growing them in artificial nurseries and then releasing them back into the wild in order to
re-establish the natural wild population.
8.4 Recommendations
I. Biometric relationships in line with those carried out in Chapter 2 will have to be carried
out in the Atlantic in order to fully confirm differences between the west Atlantic, the east
Atlantic and the Mediterranean.
2. As suggested in Chapter 3, the collection of new data will allow the construction of age -
length keys (from age I to age 16 or more), also taking into account sex, for the different
Atlantic and Mediterranean populations. These keys are of fundamental importance in all
aspects ofbluefin tuna being studied.
3. Further pop up tagging will need to be carried out throughout the Mediterranean and
Atlantic to make the results obtained in Chapter 5 more significant. Since the analysis was
carried throughout the Mediterranean but on a small scale, more analysis is needed to fully
confirm the hypothesis.
4. Continuation of the experiments detailed in Chapter 6 to measure otolith chemistry,
methylmercury and genetic analysis could be carried out on bluefin tuna in order to determine
their origin and further confirm the presence of a residing Mediterranean population.
5. Further collection of otoliths and muscle samples from the Mediterranean and Atlantic
tunas can be used to suggest age structure, critical life history periods, growth
159

environments stock structure, food web position and migration history. This will provide
the data needed to further confirm if a permanent residing Mediterranean population exists
or not.
6. It is vital for future fisheries management to follow the precautionary approach by keeping
a status quo in the absence of sufficient information in order to assure that the equilibrium is
not upset.
7. The control of fishing effort in the Mediterranean is highly regarded as a major tool for the
sustainability of Mediterranean fisheries by regional bodies such as the General Fisheries
Commission for the Mediterranean and ICCA T. In this respect, a possible measure for the
management ofbluefin tuna stocks in the Mediterranean could be:
1. curtailing the shifting of fleets in order to allow the historical fishing patterns to
exploit their respective areas ensuring the relative stability of fishing effort
distribution.
11. creating a specific management regime to control the fishing effort on the different
types of fishing operations taking place in any one area to avoid conflicts between all
stake holders.
m. establishing closed seasons so as to allow the juveniles to grow and the adult bluefin
tuna to spawn.
IV. establishing a direct reporting system to ICCAT through the installation of electronic
logbooks on all industrial fishing vessels targeting bluefin tuna in the Mediterranean
sea so as to have direct control of the quota.
160

8. One could also suggest trying the collection of eggs from the blue fin tuna held in captivity,
growing them in artificial nurseries and then releasing them back into the wild in order to re
establish the natural wild population. The rapid growth of tuna farming is unsustainable and
harming already depleted Mediterranean wild tuna stocks. The fast development of new tuna
farms in the Mediterranean should be halted until the implications of this activity on the
environment, the tuna stock and the fish stocks used as baits are properly addressed at the
appropriate international and national levels. Initiatives like limiting the fraction of tuna
quota susceptible of being farmed or establishing minimum farming sizes for tuna would be
the kind of measures which would lead to a more sustainable Mediterranean bluefin tuna
population.
9. New management measures have to take into account the new developments in the
bluefin tuna fishing industry and should aim for the sustainable exploitation of the species.
161


Alvarado Bremer, J. R., Mejuto, J. & Baker, A. J. 1995. Mitochondrial DNA control
region sequences indicate extensive mixing of swordfish (Xiphias gladius) populations in
the Atlantic Ocean Can. J. Fish. Aquatic Sci. 52:1720-1732
Alvarado Bremer, J. R., Naseri, I. & Ely, B. 1999. Heterogeneity of northern bluefin
tuna populations. /CCATCo/1. Vol. Sci. Pap. 49 (/): 127-129
Arena, P. 1979. Observations in the south Tyrrhenian sea with regards to the
characteristics of bluefin tuna during its genetic migratory pathway. Proc. Gen. Fish.
Coun. Medit., 7:395-411
ATRT, 2004. The tuna ranching-intelligence unit, September, 2004. In c/o 0 'Donne/1, 32
- 2 ° E, 28009, Madrid, Spain. pp I - 46
Baglin, R. E. 1982. Reproductive biology of western Atlantic bluefin tuna, Fishery
Bullettin 80, 121- 134
Beardsley, G. L. 1969. Proposed migrations for albacore in the Atlantic Oceans. Tras.
Am. Fish. Soc. 98 (4):845- 857
Beardsley, G. L. 1971. Further details on migratory pathways of albacore. Tras. Am.
Fish. Soc. 99 (8):632 - 666
Berry, F. F & Lee, D. W. 1977. Age structure in some Western North Atlantic bluefin
tuna, /CCAT SCRS/77 /46 VII (2) 248-254
Block, B. 2005. Tuna fishing policy 'misguided'. BBC news, 28th April, 2005 . 163

Block, A. B., Dewar, H., Farwell, C., & Prince, E. D. 1998. A new satellite technology
for tracking the movements of Atlantic bluefin tuna. The national academy of sciences 95
(16): 9384- 9389
Block, A. B., Dewar, H., Williams, T., Fudge, D., Farwell, C., & Prince, E. D. 1998.
Mar. Tech. Soc. 32, 37-46
Block, A. B. et al., 2000. Satellite tagging: Expanded niche for white sharks. Nature. 415
(6867): 35- 36.
Block, B. A., Dewar, H., Blackwell, S. B. et al. 2001. Migratory movements, depth
preferences and thermal biology of Atlantic blue fin tuna Science 293: 1310- 1314
Block, B. A., Costa, D. P., Boehlert, G. W. & Kochevar, R. 2002. Tagging of Pacific
pelagics. AAAS 168: A32
Block et al., 2005. Electronic tagging and population structure of Atlantic bluefin tuna
Nature 434: 1121- 1127
Boustany, A. M. et al., 2002. Nature 41: 35- 40.
Brunemeister, S. 1980. International Commission for the Conservation of Atlantic Tunas,
Collective Volume of Papers 9, 506- 527
164
Butler, M. J., Caddy, J. F., Dickson, C., Hunt, J. & Burnett, C. D. 1977. Apparent age
and growth based on otolith analysis of giant bluefin tuna (Thunnus thynnus) in the 1975-
1976 Canadian catch. JCCA T. COL. Doe. Cient., 6(2): 318-330
Cabot, E. & Beckenbach, A. T. 1989. Simultaneous editing of multiple nucleic acid and
protein sequences with Esee. Comp. App. Bios. 5: 233-234
Campana, S.E. 1999. Chemistry and composition of fish otoliths: pathways, mechanisms
and applications. Mar. Ecol. Prog. Ser. 188: 263 - 297
Campana S. E. & Thorrold, S. R. 2001. Otoliths, increments, and elements: keys to a
comprehensive understanding of fish populations. Can. J. Fish. A quat. Sci. 58: 30- 38
Cappon, C. J. & Smith, J. C. 1982. Chemical form and distribution of mercury and
selenium in canned tuna. J. Appl Toxicol; 2 (4): 181-9
Carabott, J. 1999. pers. comm.
Carron, M. T:, Anderson, J.L. & Martinez- Garmendia, J. 2001. Pricing U. S. North
Atlantic b1eufin tuna and implications for management. Agribusiness, 17:243-254
Clay, D. 1991. Atlantic bluefin tuna: a review. pp 89-179 in R. B. Deriso and W. H.
Bayliff, World Meeting on Stock Assessment of Bluefin Tuna, May 25-31 1990, La Jolla
California, /A TTC Special Report 7
Collette, B.B. and Nauen, C.E. 1983. FAO Species Catalogue Vol. 2 Scombrids of the
World: 3-5, 90-92
165
Compean-Jimenez, G. & Bard, F. X. 1980. Growth increments on dorsal spines of
eastern Atlantic bluefin tuna (Thunnus thynnus) and their possible relation to migration
patterns. NOAA Tech. Rep. NMFS, 8:77-86
COPEMED Annual Report 2000. F AO-COPEMED Annual Report on the Research on
fishing biology of bluefin tuna (Thunnus thynnus) and swordfish (Xiphias gladius) in the
Mediterranean Sea. Tunidos Final Report
COPEMED Annual Report 2002. F AO-COPEMED Annual Report on the Research on
fishing biology of bluefin tuna (Thunnus thynnus) and swordfish (Xiphias gladius) in the
Mediterranean Sea. Tunidos Final Report
Corriero, A., Desantis, S., Deflorio, M., Acone, F., Bridges, C. R., de la Serna, J. M.,
Megalofonou, P. & De Metrio, G. 2003. Histological investigation on the ovarian cycle
of the eastern Atlantic bluefin tuna (Thunnus thynnus L.) J. Fish Bioi. 63, I 08-119
Cort, J. L. 1980. Cimarron. Ed. Vascas. San Sebastian. 45 pp
Cort, J. L. 1990. Biologia y pesca del atun rojo. Thunnus thynnus (L.) del mar Cantabrico
(Thesis doctoral). Publicaciones Especiales lnstituto Espanol de Oceanografia. Num. 4,
272 pp
Cort, J. L. 1991. Age and growth of the bluefin tuna (Thunnus thynnus) of the northeast
Atlantic. ICCATColl. Vol. Scie. Papers 35: 213-230
Cort, J. L. & de la Serna, J. M. 1993. International Commission for Conservation of
Atlantic Tunas Working Document Standing Committee on Research and Statistics 93, 81
Cort, J. L. and Liorzou, B. 1990a. Larval biology - Eastern Atlantic and Mediterranean.
p 95 in D. Clay, 1991, Atlantic bluefin tuna: a review, World Bluefin Meeting, May 25-31
1990, La Jolla California
166
Cort, J. L. and Liorzou, B. 1995. Revision del marcado/recapture de atun rojo en et
Atlantico oriental y Mediterraneo./CCATCol/. Vol. Sci. Pap. 44(1): 293-304
Davenport, S. 1995. Mercury in blue sharks and deep water dogfish from around
Tasmania. Australian Fisheries 54(3) p 20- 22
De la Serna, J. M. et al., 1992. Observations on sex ratio, maturity and fecundity by
length-class for swordfish. SCRS/95/45
De la Serna, J. M. et al., 1997. Bluefin tuna egg and larval survey in the Balearic sea.
ICCAT SCRS/ 1998/082
De la Serna, J. M. et al., 1999. FAO-COPEMED Annual Report on the Research on
fishing biology of bluefin tuna (Thunnus thynnus) and swordfish (Xiphias gladius) in the
Mediterranean Sea. Tunidos
De la Serna, J. M., Srour, A., Farrugia, A., Hattour, A., El Tawil, M. & Abid, N. 2000.
Resultados prelimares del proyecto FAO-COPEMED. SCRS/00/134
De Martini, E., Uchiyama, J. & Williams, H. A. 2000. Sexual maturity, sex ratio and
sex composition of swordfish caught by the Hawaii-based pelagic longline fishery. Fish.
Bull. US. 98: 489- 506
De Metrio, G. Megalofonou, P. Tselas, S. & Tsimenides, N. 1989. Fishery and biology
of the swordfish (Xiphias gladius) in Greek waters. FAO Fisheries report No. 412. pp. 135
-145
De Metrio, G., Arnold, G., Cort, J. L., de la Serna, J. M., Yannopoulos, C.,
Megalofonou, P., Buckley, A. & Pappalepore, M. 2000. Further results of tagging
Mediterranean bluefin tuna with pop up satellite detected tags. GFCM/ICCA T Meeting,
Malta September 2000, /CCAT SCRS/00/ 109
Delong, R. L., Stewart, B. S. & Hill, R. D. 1992. Mar. Mamm. Sci. 8, 155- 159
167
Dicenta, A. 1975. ldentificacion de algunos huevos y larvas de tunidos en al
Mediterraneo. Bot. inst. Esp. Ocean 198: I - 21
Doumenge, F. 1999. L'aquaculture des thons rouge et son developpement economique.
Biologia Marina Mediterranea, 6(2): 107-148
Emerson, L. S., Greer-Walker, M. & Whittames, P. R. 1990. A stereoloical method for
estimating fish fecundity. J. Fish. Bioi. 36: 721-730
El Kebir, N. K., Rodriguez-Cabello, C. & Tawil, M. 2001. Age estimation of bluefin
tuna (Thunnus thynnus) caught by traps in Libyan waters based on spine reading. JCCAT
SCRS/0 I /135
Excoffier, L. Smouse, P. E. & Quattro, J. M. 1992. Analysis of molecular variance
inferred from metric distances among DNA haplotypes: application to human
mitochondrial DNA restriction data Genetics 131:479-491
FAO 1985. Scombrids of the World. FAO Species Catalogue 3: 90-92
Farrugia, A. & Rodriguez-Cabello, C. 2002. Preliminary study on the age estimation of
bluefin tuna (Thunnus thynnus) around the Maltese Islands. JCCAT SCRS/00/1 08
Farrugia, A. & de la Serna, J.M. 2002. Description of the Maltese bluefin tuna (Thunnus
thynnus) fisheries. JCCAT SCRS/02/095
Felsenstein, J. 1985. Confidence limits on phylogenies: an approach using the bootstrap.
Evolution 39: 783-791
168

Felsenstein, J. 1993. PHYLIP (Phylogeny interface package) version 3.5.c Department of
Genetics. University of Washington, Seattle
Gibbs, R. J. & Collette B.B. 1967. Comparative anatomy and systematics of the tunas,
genus Thunnus. Fis. Bull. US. Fis. Wild!. Serv. 66: 65- 130
Gulland, J. A. 1983. Fish Stock Assessment: A manual of basic methods. FAO/Wiley
Series on Food and Agriculture Wiley, New York
Gunn, J. & Block, B. 2002. In Tunas: Physiology, Ecology and Evolution. Academic
Press, San Diego, CA, pp 167-224
Hall, T. A. 1999 BioEdit: a user friendly biological sequence alignment editor and
analysis program for Windows 95/98/NT. Nucl. Acids. Symp. Ser. 41: 95-98
Hassan, T. E. 1987. Mercury in bluefm tuna fish (Thunnus thynnus) caught from
Jamahiriya coast. Food Sci. Res. Unit, Agric. Res. 8: 125 - 139
Hattour, A., Macias, D. & de la Serna, J. M. 2001. Bluefin tuna maturity in Tunisian
waters: A prelimary approach. /CCATSCRS/01/128
Hattour, A. & Macias, D. 2002. Bluefin tuna gonadal development. Col. Vol. Sci. Pap.
ICCAT54: 545-553
Holden, M. J. & Raitt, D. F. 1974. Manual de science halieutique. FAO Fish. Tech. Pap.
I 55 Rev. I , 131 - 140
169
Hunter, J. R. & Goldberg, S. R. 1980. Spawning incidence and batch fecundity in
nortehrn anchovy, Engarulis mordax. Fishery Bulletin., U.S.: 79: 215-230
Hunter, J. R. & Macewicz, J. 1985. Rates of atresia in the ovary of captive and wild
anchovy, Engraulis mordax. Fishery Bullettin 83, 119-135
Huppell, S. A. & Sullivan, C. V. 2000. Reproduction of bluefin tuna: Assessing
maturity using sex specific compounds present in muscle. Proceeding of a workshop on
the biology ofbluefin tuna in the mid Atlantic. Bermuda
Hurley, P & Dickson, C. 1981. Age and growth of bluefin tuna taken from Canadian
waters in recent years. ICCAT 15(2): 248-287
ICCAT. 1978. Report for biennial period, 1977. International Commission for the
Conservation of Atlantic Tunas, Madrid: 190 p
ICCAT. 1996. Report for the biennial period 1994-95, part II (2). International
Commission for the Conservation of Atlantic Tunas, Madrid: 254 p
ICCAT. 1997. Report for biennial period, 1995-1996. International Commission for the
Conservation of Atlantic Tunas, Madrid: 289 p
ICCAT. 1998. Report for biennial period, 1996-1997. International Commission for the
Conservation of Atlantic Tunas, Madrid: 266 p
ICCAT. 1999. Report fa~· biennial period, 1997-1998. International Commission for the
Conservation of Atlantic Tunas, Madrid: 220 p
ICCA T. 2000. Report for biennial period, I 998-1999. International Commission for the
Conservation of Atlantic Tunas, Madrid: 235 p
170

ICCAT. 200 l. Report for biennial period, 1999-2000). International Commission for the
Conservation of Atlantic Tunas, Madrid: 268 p
ICCAT. 2002. Report for biennial period, 2000-2001). International Commission for the
Conservation of Atlantic Tunas, Madrid: 289 p
ICCAT Field Manual for statistics and sampling Atlantic tunas and tuna like species
1990. /CCAT Pub/. l20p
IGFA. 1995.
Paperbacks.
1995 International game fishing association record Book. Trade
Jouventin, P. & Weismerskirch, H. 1990. Nature (London) 343, 746- 748
Katavic, I., Vicina, V. & Franicevic, V. 2003a. Rearing of small bluefin tuna in the
Adriatic sea, preliminary studies. Cahiers Options Mediterraneennes, 60:95-99
Katavic, I., Vicina, V. & Franicevic, V. 2003b. Bluefin tuna farming in the Croatia coast
of the Adriatic Sea - present stage and future plans. Cahiers Options Mediterraneennes,
60:101-106
Kimura, M. 1980. A simple method for estimating evolutionary rate of base substitutions
through comparative studies of nucleotide sequences. Journal of Mol. Evol. 16: Ill - 120.
Kitigawa, T. et al., 2000. Mar. Ecol. Prog. Ser. 206, 25 I
Kooyman, G. L., Kooyman, T. G., Horning, M., & Kooyman, C. A 1996. Nature
(London) 383, 392-395
171
Kumar, S., Tamura, K., Jakobsen, I. B. & Nei, M. 2001. MEGA 2: Evolutionary
Genetics Analysis software, Bioinformatics (submitted)
Kume, S. & Joseph, J. 1969. The Japanese longline fishery for tunas and billfishes in the
eastern Pacific Ocean. Bull. /A TTC 13: 275 - 418
Lehodey, P., Bertignac, M., Hampton, J., Lewls, A. & Picaut , J. 1997. Nature
(London) 389, 715-718
Linnaeus, C. 1758. Systema naturae, Vol. I, Regnum animate, Holmiae, 101h edition,
London: 823p
Liorzou, B. 1999. Consolidate Interim Report of the EU poject BFTMED
97/029.European Commuity- DG XIV Brussels
Lutcavage, M. E., Brill, R. W., Skomal, G. B. Chase, B. C. & Howey, P. W. 1999.
Results of pop up satellite tagging of spawning size class fish in the Gulf of Maine: do
North Atlanctic bleufin tuna spawn in the mid Atlantic Can. J. Fish. A quat. Sci. 56: I 73 -
177
Lutcavage, M. E., Brill, R., Porter, J., Howey, P. W., Murray, E., Mendillo, A.,
Chaprales, W., Genoves, M. & Rollins, T. 2000. Summary of pop up satellite tagging of
giant bluefin tuna in the joint US Canadian Program, Gulf of Maine and Canadian Atlantic.
ICCA T SCRS/00/95
172
Marcinek, J. et al., 2002. Mitochondrial coupling in vivo in skeletal muscle. Cell Physiol.
286: 457- 463
Mather, F. J., Mason, J. M. & Jones, A. C. 1995. National Oceanic and Atmospheric
Administration Technical Memorandum, National Marine Fisheries Service - Southeast
Fisheries Science Centre 3 70, 165
McConnell, B.J., Hambers, C., Nicholas, K. S. & Fedak, M. A. 1992. J Zoo/. (London)
226, 271 - 282
Medina, A., Abascal, F., Megina, C. & Garcia, A. 2002. Stereological assessment of the
reproductive status of female Atlantic nortehm bluefin tuna during migration to
Mediterranean spawning grounds through the Strait of Gibraltar. J. Fish. Bioi. 60: 203 -217
Megalofonou, P & De Metrio, G. 2000. Age estimation and annulus formation in dorsal
spines of juvenile bluefin tuna from the Mediterranean sea. J. Mar. Bioi. Ass. U.K. 80:
753-754
Metcalfe, J. D. & Arnold, G. P. 1997. Nature (London) 387,665 -666
Miyake, P. M. 1990. Field Manual for Statistics and Sampling of Atlantic Tunas and
Tuna-like Fishes. ICCAT
Miyake, P. M. 1994. Atlantic bluefin tuna- Research and management
173
Miyake, P. M. 1998. Tuna fisheries in the Atlantic. Fisheries management in the World.
Japan International Fisheries Society (JJFRS) 295-342
Miyake, P. M. 2002. General review of bluefin tuna farming in the Mediterranean area.
Presented to the 6th GFCM/ICCAT Joint meeting, Malta 2002
Miyake, P. M. 2003. Factors affecting on recent developments in tuna longline fishing
capacity and possible options. ICCAT Coli. Vol. 55: 193 - 197
Miyake, P. M., de la Serna, J. M. Di Natale, A. , Farrugia, A. Katavic, 1., Miyabe, N.,
& Vicina, V. 2003.General review of bluefin tuna farming in the Mediterranean area.
ICCAT Collective Volume of Scientific papers, 55: 114- 124
Morales-Nin, B. & Fortuno, J. M. 1991. Mercury body burden and otolith characteristics
of bluefin tuna from the northwest Mediterranean (Balearic Sea). Scientia Marina Vol. 54:
277-285
Nakamura, I. 1985. FAO species catalogue. Vol. 5. Billfishes of the world. An annotated
and illustrated catalogue of marlins, sailfishes, spearfishes and swordfishes known to date.
FAO Fish. Synop. 125(5):65 p
NRC (National Research Council) 1994. An assessment of Atlantic Bluefin tuna.
National Academy Press, Washington D. C.: 148 p
Nei, M. 1987 Molecular evolutionary genetics. Columbia University Press. New York
174

Nei, M. & Tajima, F. 1981. DNA polymorphism detectable by restriction endonucleases.
Genetics 97: 145-162
Nikolsky, G. V. 1963. The ecology of fishes. New York: Academic Press. 352 pp
Papi, F., Liew, H. C., Luschi, P., & Chan, E. H. 1995. Mar. Bioi. 122, 171 - 175
Parrack, K. & Phares, P. 1979. Aspects of the growth of Atlantic bluefin tuna
determined from mark-recapture data. Col. Vol. Sci. Pap. JCCAT 8 (2): 356- 366
Partridge, B. L., Johansson, J. & Kalish, J. 1983. The structure of schools of giant
bluefin tuna in Cape Cod Bay. Environmental Biology of Fishes, 9 (3/4): 253 - 262
Piccinetti, C. 1980. The bluefin seine fisheries in the Adriatic. ICCAT Colec. Doe. Cien.
11: 346-350
Piccinetti, C. 1995. Distribution des 1mvas de Thonides en Mediterranee. FAO Fisheries
Report 494, 186.
Piccinetti, G., Marano, G., De Metrio, G. & Piccinetti Manfrin, G. 1995. An attempt to
find eggs and lmvae of bluefin tuna in the Black Sea. JCCAT Volume of Scientific Papers
44:316-317
Pia, C., Pujolar, J. M. Vinas, J. & Levy , J. A. 1995. Biochemical characterisation of
large pelagic stocks (Sarda sarda, Thuunus alalunga, Thunnus thynnus) in the
Mediterranean ICCAT Coli. Vol. Sci. Pap. 44(2): 393-397
175
Pia, C. de la Serna, J. M., de Metrio, G. Magalonofou, P. & Orsi, L. 1998. Study of
fishing and biology of juvenile tuna {Thunnus thynnus) from 0-1 age class in the
Mediterranean and Eastern Atlantic. Final Report. Project DG XJV-95/010
Preide, I. G: 1984. Fish. Res. 2, 20 I - 216
Prince, E., D., Lee, D. W. & Javech, J. C. 1985. Internal zonations in sections of
vertebrae from Atlantic bleufin tuna and their potential use in age determiantio. Can. J.
Fish. Aquat. Sci. Vo1.42
Pujolar, J. M. & Pia, C. 2000. Genetic differentiation between north west Atlantic and
Mediterranean samples of bluefin tuna (Thunnus thynnus) using isozyme analysis ICCAT
Col/. Vol. Sci. 51 (3):882-891
Pujolar, J. M. 200 I. Genetic and structural characterisaion of the large pelagics
populations (Thunnus thynnus, Thunnus alalunga, Sarda sarda and Xiphias g/adius) in the
Mediterranean. Thesis dissertation. University ofGirona, Girona, Spain
Report of the 2nd meeting of the ad hoc GFCM/ ICCAT Working Group on Bluefin Tuna
Farming in the Mediterranean, Turkey, 2003
REPRODOTT symposium 2002 - Domestication of Thunnus thunnus, the Bluefin tuna
Strategies for European Development in the context of a global market, Cartagena, 2002
Renaurd, M. L. & Carpenter, J. A. 1994. Bull Mar. Sci. 55, I - 15
176
Rey, J. C. & Cort, J. L. 1984. Una clave talla-edad por lectura de espinas para el atun
rojo (Thunnus thynnus) del Atlantico Este. ICCAT, Col. Doe. Cient., Vol. 20 (2): 248- 287
Rey, J. C., Alot, E. & Cort, J. L. 1987. Analisis de las capturas de atun rojo (Thunnus
thynnus) por las almadrabas espanoles en 1984 y 1985. ICCAT Col. Doe. Cien. Vol.
26(2): 330-307
Rey, J. C. & Cort, J. L. 1990. Biologia y pesca del atun rojo del mar Cantabrico. Not
pub/.
Rey, J. C. & Cort, J. L. 2000. Una clave talla-edad por lectura de esinas para el atun rojo
(Thunnus thynnus L.) del Atlantico Este. ICCAT. Col. Doe. Cien., 20 (2): 337-340
Richards, W. J. 1976. Spawning of bluefin tuna in the Atlantic ocean and adjacent seas.
ICCAT Col. Vol. Sci. Pap., V (2): 267- 278
Richards, W. J. 1987. Mexus-Gulf ichthyoplankton research, 1977-1984. Mar. Fish.
Rev., 49 (/): 39-41
Richards, W. J. 1990. Results of a review of the U.S. bluefin tuna larval assessment with
a brief response. ICCAT Col. Vol. Sci. Pap., XXXII (2): 240- 247
Rivas, L. R. 1954. A preliminary report on the spawning of the western north Atlantic
bluefin tuna in the Straits of Florida. Bull. Mar. Sci. 4: 302- 322.
Rivas, L. R. 1978. Preliminary models of annual life history cycles of the north Atlantic
bluefin tuna. In The physiological ecology of tunas p 369-393. Acad. Press.
177
Rodriguez-Marin, E., Landa, J., Ruiz, M., Dodoy, D., & Rodriguez-Cabello, C. 2004.
Age estimation of adult bluefin tuna (Thunnus thynnus) from dorsal spine reading. Col/.
Vol. Sci. Papers. ICCAT, 56(3), 1168-1174
Rodriguez Roda, J. 1964. Biologia del atun (Thunnus thynnus) de la costa sudatlantica
espanola. Inv. Pesq, 25: 33- 146
Rodriguez Roda, J. 1967. Fecundidad del a tun, Thunnus thynnus de la costa
sudatlanctica de Espana. Investigaciones pesqueras 31 (I), 33 -52
Rodriguez Roda, J. 1983 . La funcion alometrica aplicada al crecimieto diferencial en al
atun. Estudio de las poblaciones de atunes de ambas orilla del Atlantico Norte y del
Mediterraneo. Inv. Pesq. 47: 171 - 202
Rooker, J. R., Zdanowicz, V. S. & Secor D. H. 200Ia. Chemsitry of tuna otoliths:
assessment of base composition and postmortem handling effects. Mar. Bioi. 139:35-43
Rooker, J. R., Secor, D. H, Zdanowicz, V. S. & ltoh, T. 2001b. Discrimination of
northern blufin tuna from nursery areas in the Pacific Ocean using otolith chemistry Mar.
Ecol. Prog. Ser. 218: 275-282
SAS 1989. Statistical Analysis System. SAS users' guide. Version 6.03. Cary, North
Carolina: SAS Institute
SCRS 2001. Col. Vol. Sci. Pap.ICCAT, 54 (2). 498- 506
178

Saitou, & Nei, M. 1987. Molecular evolutionary genetics. Columbia University Press.
New York
Schneider, S., Kueffer, J. M., Roessli, D. & Excoffier, L. 1997. Arlequin: a softeare for
population genetic data analysis, verion 1.1 Genetics and biometry laboratory, University
ofGeneva, Switzerland
Secor, D. H. & Rooker, J. R. 2000. Is otolith strontium a useful scalar of life cycles in
estuarine fishes Fish. Res. 46: 359-371
Seitz, A., Weng, A., Boustany, A. & Block, B. 2002. J. Fish Biol60: 1493- 1498
Sharp, G. D. and Dizon, A. D. 1978. The physiological ecology of tunas. Academic
Press, New York: 485 p
Storelli, M. M., Natale, G., Gasparre, G. & Marcotrigiano, G. 1993. Residues of
metals and HCHs in samples of the dorsal muscle of I 0 bluefin tuna caught in the Ionian
sea in 1991. Atti della Societa /taliana delle Scienze Veterinarie Vol. 47: 831 - 835
Storelli, M., Stuffier, R. G., Marcotrigiano, G., Stuffler, R. & Giacomelli, R. 2002.
Total and methylmercury residues in tuna fish from the Mediterranean sea. Food Additives
and Contaminants, Vol. 19:715-720
Tamura, K. & Nei, M. 1993. Estimation of the number of nucleotide substitutions in the
control region ofmitochondrial DNA in humans and chimpanzees Mol. Bio. Evol. 10:512-
526
179
Tawil, M. Y., Macias, D. & de la Serna, J. M. 2001. Prelimary study on age at first
maturity ofbluefin tuna in the Libyan waters.JCCAT SCRS/011127
Thorrold, S. R., Jones, C. M., Campana, S. E. McLaren, J. W. & Lam, J. W. H. 1998.
Trace element signatures in otoliths record natal river of juvenile American shad (Aiosa
sapidissima) Limnol. Oceanogr. 43: 1826-1835
Thorrold, S. R., Latkoczy, C., Swart, P. K. & Jones, C. M. 2001. Natal homing in a
marine fish metapopulation. Science 291: 297-299
Thresher, R. E. 1999. Elemental composition of otoliths as a stock delineator in fishes.
Fish. Res. 43: 165-204
Tserpes, G. & Tsimenides, N. 1995. Determination of age and grwoth of swordfish,
Xiphias gladius in the eastern Mediterranean using anal fin spines. Fish. Bull. 93: 594 -
600
Tudela, S. 2001. (pers. comm.)
Tudela, S. 2002a. Grab, cage, fatten, sell. Samudra, July 2002, 9 - 16. Article
translated by Brian O'Riordan. Ecologia Politica, June 2002
Tudela, S. 2002b. Tuna farming in the Mediterranean: the coup de grace to a dwindling
population? In WWF Document prepared with the collaboration of Niki Sporrong, WWF
European Fisheries Campaign Policy Officer and the WWF European Fisheries Working
Group, pp 1-14 180
Turner, S. 1999. Catch rates of greater amberjack caught in the handline fishery in the
Gulf of Mexico in 1990- 1998. NMFS Miami Lab. Doe. SFD 99/00 - 92
Vinas, J. 2001. Genetic and structural variability in the three scombrid species (Thunnus
thynnus, Thunnus alalunga, Sarda sarda and Xiphias gladius) based on the control region
of the mitochondrial DNA. in the Mediterranean. Thesis dissertation. University of
Girona, Girona, Spain
Vinas, J., Pia, C., Tawil, M., Hattour, A., Farrugia, A. & de la Serna , J. M. 2002.
Mitochondiral genetic characterisation of bluefin tuna (Thunnus thynnus) from three
Mediterranean (Libya, Malta, Tunisia) and one Atlantic location. ICCAT 2002.
SCRS/02/ I 72
Wakeley, J. 1993 Substitution rate variation among sites in hypervariable region I of
human mitochondrial DNA J. Mol. Evol. 37: 613-623
West, G. 1990. Methods of assessing ovanan development m fishes: a review.
Australian Journal of Marine and Freshwater research 41: 199 - 222
Wilkinson, L. Blank, G. & Gruber, C. 1996. Desktop data analysis with SYST AT.
Prentice Hall, Englewookd Cliffs, NJ
Wooton, R. J. 1990. Energetics of reproduction. In: Tytler, P. & Calow, P., eds. Fish
energetics: new perspectives. Baltimore, Maryland: John's Hopkins University Press, p
231-254
181

WWF 2004, Tuna fatiiiiilg ill the Medlterteai:t·: 1the biuefitr tuna' stock at 'stake. .www:
Panda~org/mediterranean
lhttp://www.unipv:it
lhttp:l/www .fkcom
I http://www. iccat:es
lhttp://www.fao:org:
1http://www.aguaciilture.com.au
182