Embed Size (px)
Citation preview

1
Author version: Chem. Geol.: 294-295; 2012; 217-225
A study of lead and cadmium speciation in some estuarine and coastal sediments
Parthasarathi Chakraborty*, P. V. Raghunadh Babu, and V. V. Sarma
*1National Institute of Oceanography (CSIR), India, 176 Lawsons Bay Colony, Visakhapatnam,
530017, Andhra Pradesh, India
E-mail: [email protected], Ph: 91-891-2509169, Fax-91-891-2543595
Abstract
Chemical speciation of lead (Pb) and cadmium (Cd) in the coastal and estuarine sediments along the
central east coast of India was studied by applying sequential and kinetic extraction methods. The
results of this study suggest that concentrations of non-residual and dynamic complexes (which are
good indicators of bioavailability) of these toxic metals gradually increase with increasing total metal
loading in sediments.
Increase in bioavailability of these toxic metals with increasing total metal loading in sediments can
be a potential threat to benthic organisms and aquatic biota in the system. This study shows that total
organic carbon (TOC) is one of the key factors which play a crucial role in controlling speciation of
these toxic metals in sediments. However, distribution and speciation of these metals are influenced
by their total metal loading and trace metal competitions rather than only TOC content in sediments.
An attempt was made to identify the key factors which control the speciation of these two toxic
metals in natural system and provides a better understanding to predict and control pollution of Pb
and Cd in coastal and estuarine sediments
Key words: Sequential extraction method; Kinetic extraction method; Pb speciation; Cd speciation;
Coastal sediments; estuarine sediments;

2
1. Introduction:
Estuarine and coastal sediments are generally considered as a sink for metals and metalloids (Feng et
al. 2004; Yao et al. 2007; Mishra et al. 2008). It is well understood that total metal content in
sediments can not predict the bioavailability and toxicity of that metal (Forstner and Salomons, 1980;
Luoma and Davies, 1983; Di Toro et al. 1990; Arjonilla at al. 1994; Pagnanelli et al. 2004; Clozer et
al. 2006). It is in fact the physicochemical forms of the metal that determine its potential
bioavailability and toxicity. Thus, the speciation and distribution study of metals in sediments has
become one of the most important areas of environmental research. The distribution and speciation
studies of metals in sediments not only provide an indication of the current quality of the overlaying
waters (Zhang et al. 2006; Laing et al. 2007) but also provide important information on the
transportation and fate of pollutants (Gupta and Sinha, 2007; Zhang et al. 2008; Cheng et al., 2009;
Zhao et al. 2009).
Cadmium (Cd) and lead (Pb), known to be the toxic metals (Kumar et al. 2008; Lim et al. 2008;
Weng et al. 2008) with very little (Lane et al. 2005; Xu et al. 2008) or no nutrient values, are
abundant almost everywhere in the nature. Pollution of soils, sediments and waters with Pb and Cd
cause their incorporation into the food chain, which could result in wide variety of adverse effects in
animals and humans, since it is a cumulative contaminant (Sanborn et al. 2002; IARC Monograph,
2006; Loghman-Adham, 1997; Jacobson and Turner, 1980; Stohs and Bagchi, 1995; Waalkes, 2000).
Thus, it is essential to control Pb and Cd pollution in environment.
In order to understand the mobility and potential ecological risks of Pb and Cd, particular attention
was given to identify the key factors which control distribution and speciation of these two toxic
metals in the coastal and estuarine sediments of the central east coast of India.
The sequential extraction method (Tessier et al. 1979; Martin et al. 1987; Usero et al. 1998;
Koretsky et al. 2008; Gonzalvez et al 2009; Issaro et al. 2009; Rao et al. 2010) which can provide
information about the distribution of metal associated with different specific solid phases in
sediments (Arain et al. 2007) was applied in this study to understand the distribution, mobility and
bioavailability of Pb and Cd in the estuarine and coastal sediments (It is well reported that non-
residual metal complexes determined by sequential extraction method are reliable indicators of
bioavailability). The most widely used sequential extraction protocols are those recommended by
Tessier et al.(1979), Kersten and Förstner (1986) and the Community Bureau of Reference (BCR)
(Quevauviller et al. 1993). The wide application of the sequential extraction protocols proposed by
3
Tessier for metal speciation in river, marine, estuarine and stream sediments provided the confidence
to apply this method for this study.
Kinetic extraction study (Fangueiro et al. 2002; Fangueiro et al. 2005; Chakraborty and Chakrabarti,
2006; Chakraborty et al. 2006; Vanthuvne and Maes, 2006; Reyhanitabar and Gilkes, 2010;
Chakraborty et al. 2011) was also performed to understand the nature of Pb and Cd-sediment
complexes (dynamic or inert) and determine their dissociation rate constants in the sediments
(dynamic metal complexes and their dissociation rate constants determined by single kinetic
extraction method are also considered as a good predictor of bioavailability of metals).
It has been reported (Gismera et al 2004, Chakraborty et al 2009; Chakraborty 2010 and Chakraborty
et al 2011) that the combination of two or more methods having complementary analytical
capabilities can provide a better physicochemical picture of metal speciation in natural systems than
either one of the analytical methods can do alone. Sequential and kinetic extraction methods have
been widely used (individually) for metal speciation study in natural systems (sediments and soils).
However, the combined use of these two methods for metal speciation study in natural systems is
scarce in literature.
The thrust of this study was to provide better understanding of Pb and Cd speciation in estuarine and
coastal sediments. An attempt was made to identify the key factors which regulate speciation and
bioavailability of these toxic metals in coastal and estuarine sediments.
2. Materials and methods:
2.1 Sampling location and collection
Sediment samples were collected from five different environmentally significant sites off the central
east coast of India as shown in Figure 1. Coastal sediment samples were collected from (1)
Kalingapatnam, (2) Vishakhapatnam, and (3) Machilipatnam. The Kalingapatnam site is located in
north of Andhra Pradesh. This city is not industrially developed but an important minor port is
located close to the sampling station. The approximate population of this area is 10000.
Vishakhapatnam is the second largest city in the state of Andhra Pradesh and the third largest city
(after Kolkata and Chennai) in the east coast of India. Visakhapatnam has become a hub for many
heavy industries. The Visakhapatnam port, the largest in the country, is the ideal gateway
contributing to the development of petroleum, steel and fertilizer industries. The approximate
population of Visakhapatnam city is 2,000,000. Machilipatnam is home to approximately 200,000
residents. Agriculture is the main occupation in Machilipatnam. Union Defence Ministry, of the

4
Government of India, operates a manufacturing unit to manufacture electronic equipment in
Machilipatnam. The sampling station at Machilipatnam was very close to Krishna River estuary.
Estuarine sediment samples were collected from (4) the Goutami Godavari estuary (A 100 square
kilometer area around Gautami Godavari River has an aproximate population of 560000) and (5) the
Vasishtha Godavari estuary. Being the largest part of the rich Godavari delta, agriculture and
aquaculture are major economy for these areas (Gautami and Vasistha Godavari estuary areas). With
the recent findings of sources for oil and natural gas has increased the pace of the industrial sector.
There are few major fertilizer factories and few gas based power plants and oil refineries. The
general description, geographic location of the sampling sites, the distance from the shore, and the
depth from where the sediment samples were collected are shown in Table 1.
A Van Veen stainless steel grab (with an area of 0.02 m2) was used to collect the sediments. Without
emptying the grab, a sample was taken from the centre with a polyethylene spoon (acid washed) to
avoid contamination by the metallic parts of the dredge. Multiple sampling was done at each station.
The samples were stored at -20oC for 15 days, and then dried at 60 oC in a forced air oven (Kadavil
Electro Mechanical Industry Pvt Ltd India, Model No. KOMS. 6FD). Sediments were subsequently
stored at 4oC until needed. The sediments were characterized (percentage of sandy, silt and clay
content) and the data are presented as supporting documents (Table 1SD)
2.2 Leaching procedure and Reagents
All the extraction processes were performed in Teflon containers. The reagents used in this study
were of analytical grade or better (ultrapure)
2.2.1 Sequential extraction procedure
A series of batch extractions were performed on sediment samples, following a modified Tessier
protocol (Tessier et al. 1979). In this investigation, the water soluble metal fraction (Fr. 1);
Exchangeable fraction (Fr. 2): Carbonates fraction (Fr. 3) Reducible fraction i.e., fraction of metal
associated with Fe and Mn oxides (Fr. 4): fraction of metal bound to organic matter (Fr. 5) and
Residual fraction (Fr. 6) were determined. The procedure and protocols has been elaborated
elsewhere (Tessier et al. 1979).
The extracted liquid samples (containing metals) in each fractions (5.0 mL) were acid digested to
drynenss (with a mixture of H2O2 (1.5 mL), HNO3 (1.5mL) and HClO4 (1.5mL) in Teflon vessels) on
a hot plate. The residues were redissolved in 2% ultrapure HNO3 and analyzed by ICP-MS to obtain

5
the distribution of metals in different phases of the sediments. Three replicates of each sample were
analysed.
2.2.2 Kinetic extraction procedure
Kinetic extraction experiments were conducted for sediments. Two grams of sediments were
added to 200 mL of 0.05 M EDTA solution (at pH 6.0) (Merck Pvt Ltd) in a 400 mL Teflon beaker
and the mixture was continually stirred with a Teflon-coated magnetic stirring bar throughout the
experiment. The ratio of the mass of sediment to the volume of EDTA solution (mass/volume) was
set at 0.01, as this ratio provided sufficiently high metal concentrations in the extract to be accurately
quantified, while requiring a minimum amount of sediment. A special effort was made to maintain a
homogeneous suspension in order to avoid changing the mass/volume ratio during sampling. Larger
mass/volume ratios would be undesirable, as they could cause problems with filtration. At set time
intervals (0 min, 2 min, 4 min, 6 min, 8 min, 10 min, 15 min, 20 min,25 min, 30 min, 45 min, 1 h,
2h, 5 h, 7h, 10 h, 24 h, 36 h), 2 mL aliquots of the suspension were filtered through a 0.2 μm syringe
filter (Millex,Millipore). The initial time for the kinetic measurement (i.e. t = 0) was taken as the
time just before the sediment was added to the EDTA solution. The filtrate samples (1.0 mL) were
then acid digested to dryness (with a mixture of H2O2 (0.5mL), HNO3 (0.5mL) and HClO4 (0.5mL) in
Teflon vessels) on a hot plate. The residues were then redissolved in 2% ultrapure HNO3 and
analyzed by ICP-MS to monitor the change in concentrations of metals in the extracted solution as a
function of time. The kinetic experiments were performed in triplicate for all samples to ensure
repeatability of results.
The total metals concentrations in the sediments were determined by digesting 0.1 gm of
sediment samples with 10.0 mL of acid mixtures of HF, HNO3 and HClO4 (in 7:2:1 ratio) on hot
plate. The sediments were digested and evaporated to dryness. The residues were redissolved in 2%
HNO3 and analyzed by inductively coupled plasma mass spectrometry (ICPMS). Each sediment
samples were analyzed in triplicates.
2.3 Inductively coupled plasma mass spectrometry (ICP-MS)
An ICPMS (Thermo FISCHER ICP-MS, X series 2, Germany) was used for the
determination of the total metals concentrations. The radio-frequency power was set at 1400W.
Plasma gas, auxiliary gas and carrier gas flows were 13, 0.7 and 0.87 l.min−1, respectively. The
operating condition of ICP-MS has been reported in our previous study (Chakraborty et al 2011).
To account for sensitivity of the ICP-MS instrument was monitored throughout each experiment by
analyzing marine sediment reference material (HISS-1, MESS-3, and PACS-2 from the National
6
Research Council Canada) followed by a reagent blank between every 10 samples. If the sensitivity
changed more than 5 % during an experiment, a correction factor was used to correct for the drift.
2.4 Statistical Analysis
The data presented in this study are average of three replicates. Errors are indicated along with the
average values. All the data are presented with 95.5% confidence interval. Relationship between
concentrations of metals associated with different solid phases in the sediments (obtained from
sequential extraction study) and dynamic metal complexes (obtained from kinetic extraction study)
were evaluated with Pearson’s correlation coefficient.
3. Theory
3.1 The Kinetic Model
The kinetic model proposed by Olson and Shuman (1985) was adapted (Lu et al. 1994; Mandal et al.
1999; Chakraborty and Chakrabarti, 2006; Chakraborty et al 2006; Chakraborty et al. 2011a;
Chakraborty et al. 2011b) to investigate the kinetic speciation of Pb and Cd in the coastal and
estuarine sediments of Bay of Bengal. Consider sediments samples of n different components, in
which each component, M-Sediment i, exists in equilibrium with its dissociation products: the free
metal ion or extractable metal complexes, M, and a naturally occurring, heterogeneous complexant,
sediment i, such as humic acid adsorbed on sediment and binding sites on sediments surfaces
(charges have been omitted for simplicity). The subscript, i, represents different binding sites on the
naturally-occurring heterogeneous complexant.
ii entSe dimM Sediment-M
k
k+⎯⎯⎯ →⎯
⎯⎯ ⎯←
id,
if, (slow) (i)
EDTA-M EDTA + M ⎯→⎯ (fast) (ii)
where the formation and dissociation rate constants, kf,i and kd,i, are coupled by the stability constant,
df kkK = , through the principle of microscopic reversibility.
If each complex, M-Sediment i, dissociates simultaneously and independently (at a rate that depends
on the nature of the functional group, its position on the macromolecule, and the residual charge), the
concentration of the free metal ion, cM, or extractable metal complexes and the total concentration of
all complexes, cM-Sediment, at any time, t, is given by a summation of exponentials as shown in
equations 3.
∑=
⋅−⋅n
1)kexp( = )t(
iSediment-M tcc id,iSediment-M
o (iii)

7
where oiSediment,-Mc is the initial concentration of M-Sediment i and )(tc iSediment,-M is the concentration
of M-Sediment i at any time, t.
The model assumes that a) the reactions are first-order and pseudo-first-order; b) reaction (ii) is
much faster than reaction (i), so that reaction (i) is the rate-determining step, and the measured
kinetics then represent the kinetics of the dissociation of the metal complex, M-Sediment i., c) M-
Sediment does not directly (i.e. without predissociation) react with the EDTA, and 4) the ratio
between the concentrations of complexed metal and free metal is much larger than unity (i.e. cM-
Sediment / cM >> 1).
3.2 Non-linear regression analysis for kinetic measurement
Analyzing experimental data to obtain physical parameters is a crucial point in the kinetic extraction
method. In this paper, data was fitted to the kinetic model by non-linear regression analysis using the
Marquadt-Levenberg algorithm. The minimum number of parameters required to accurately fit the
data was determined by finding the number of components in which the sum of square of the
weighted residuals shown below achieved a minimum value.
Sum of squares of the weighted residuals =2
2/1T
)t(C)t(C)t(C∑⎥⎥⎦
⎤
⎢⎢⎣
⎡ −
where, C(t) is the experimental value and CT(t) is the calculated value using the parameters obtained
from the regression analysis.
For a polyfunctional, complexant such as sediment, the number of components is not a simple issue.
The small number of components with specific rate constants may not accurately describe the
chemistry of the binding sites of sediment. A binding site may have a range of binding energy
because of the heterogeneous nature. This in turn will lead to a distribution of values for the
dissociation rate constants for the complexes. Nevertheless, the specific rate constants may represent
an average value for a group of complexes on a particular site.
4. Results and discussions:
4.1 Accumulation of heavy metals in sediments
The average values of trace metals (Sc, V, Cr, Co, Ni, Cu, Zn, Pb, Cd, and Sn) concentrations in the
coastal and estuarine sediments collected at five environmentally significant sites in the central east
coast of India are presented in Table 2.
8
It is evident that the concentrations of Zn (ranging from 254 to 3876 mg.kg-1) were high in all the
studied sediments followed by V (ranging from 59 to 205 mg.kg-1) and Cr (ranging from 24 to 83
mg.kg-1). The concentrations of Pb (ranging from 147 to 424 mg.kg-1) and Cd (ranging from 17 to 37
mg.kg-1) were also found to be high in the sediments.
The pollution load index (PLI), proposed by Tomilson et al (1980) was used in this study to
understand the quality (with respect to metals concentrations) of the estuarine and coastal sediments.
The PLI values of the studied sediments varied from one site to another. The PLI value shows an
increasing trend from Kalingapatnam (KGP) to Machilipatnam (MCP) (Table 2). The calculation of
contamination factor and PLI are provided as supporting document (Table 2SD and 3SD). The
lowest PLI was found in the sediment collected at Visakhapatnam (PLI = 1.8), followed by KGP
(PLI = 3.0), GGE (PLI = 4.0), VGE (PLI = 5.5) and MCP (PLI = 5.4). The high values of PLI for the
sediments collected at GGE, VGE and MCP were probably because of the contribution of metal
pollutants from the Godavari and Krishna rivers. It was found that Pb, Cd, Zn were the major
pollutants contributing towards the high PLI (relatively) in the coastal and estuarine sediments.
However, the total metal content in the sediments can not predict the bioavailability and toxicity of
the pollutant. Thus, systematic investigations were performed in the sediments to understand the
chemical distribution and speciation of Pb and Cd.
4.2 Chemical fractionations of Pb and Cd in coastal and estuarine sediments by sequential
extraction method:
A modified sequential extraction protocol proposed by Tessier (1979) was applied to understand the
chemical distributions and speciation of Pb and Cd in the coastal and estuarine sediments.
Figure 2 suggests that Pb had different affinities for the different solid-phases of the studied
sediments. The concentrations of water soluble Pb complexes (Fr. 1) were found to be high in all the
sediments. These water soluble Pb complexes is expexted to leach out easily from the sediments and
can increase the mobility and bioavailability of Pb in the overlaying water columns (data obtained
from sequential extraction method are presented as a supporting document, Table 4SD).
The lowest concentrations of Pb were found in the exchangeable form (Fr. 2) in the studied
sediments (Figure 2). A similar observation has also been reported in the literature (Ramos et al.
1994; Van Benschoten et al. 1994; Chen et al. 1995; Yarlaggada et al. 1995; Chlopecka et al. 1996;
Heil et al. 1996).
The concentrations of Pb as carbonate and bicarbonate (Fr.3) were found to be in the range of 3.3-
12.3 % of the total Pb content of the sediments (Figure 2) and depend upon the concentrations of

9
carbonate and bicarbonate within the sediment. Yarlaggada et al. (1995) found the distribution of Pb
from a waste site soil to contain mostly carbonate (60-70%) fractions. Similar observation was also
reported by Urija and Branica (1995). Low concentrations of Pb in the carbonate form can also be
obtained depending upon the carbonate content of sediment as found in this study. The association of
Pb with Fe-Mn oxide (Fr. 4) in the sediments were in the range of ~ 4-15% of the total Pb content in
the studied sediments.
The concentrations of water soluble Pb complexes (Fr. 1) were highest followed by the concentration
of Pb complexed with organic matter (Fr. 5) in all the studied sediments. It was found that ~15-46%
of the total Pb was complexed with organic matter present in the sediments to form
thermodynamically stable complexes.
Organic matter in the sediments was probably playing a key role in controlling Pb speciation in the
sediments under oxic condition. It is necessary to mention that Pb had specific binding sites in the
different solid phases within the sediments. However, the increasing Pb loading in the sediments
increased the water soluble Pb complexes (Fr 1) (which are usually thermodynamically less stable) in
the studied sediments. This study suggests that Pb prefers to undergo complexation reaction with
strong binding sites (probably present in organic matter in sediments) at low Pb loading. However,
this toxic metal starts to occupy weaker binding sites (after saturating relatively stronger binding
sites) with increasing concentration of Pb.
It must be kept in mind that the metals first form complexes that are kinetically favourable.
Subsequent reequilibration requires a metal and ligand double-exchange reaction, that is, both a
ligand exchange in which the ligand having stronger binding sites replaces the ligand having weaker
binding sites, and a metal exchange in which the stronger-binding metal replaces the weaker-binding
metal, to form a strong metal–ligand complex at chemical equilibrium.
It is interesting to note that the concentration of Pb as residual component (Fr 6) (expected as inert
complexes) in the studied sediments were close to the concentrations of Pb as reported in the upper
continental crust (UCC) and post archean Australian Shale (PACS). Thus, one could suggest that the
high concentrations of Pb as non residual complexes (Fr 1+ Fr 2+Fr 3+Fr 4+ Fr 5) in the studied
sediments were probably due to human activities.
Figure 3, shows the chemical distributions of Cd in the different phases of the sediments. The
concentrations of water soluble Cd content (Fr. 1) varied from ~9 to 57% of the total Cd content in
the sediments. Approximately ~ 18-38% of the total Cd was associated with organic matter. Figure 3
indicates that the concentrations of Cd associated with rest of the solid phases (Fr 2, Fr 3, Fr 4) were

10
evenly distributed in all the sediments. The residual fractions (Fr. 6) of Pb and Cd in the studied
sediments were less than 10% of the total metal content. The fractionation data obtained from the
sequential extraction method are provided as supporting documents.
The data obtained from sequential extraction method suggest that Cd also prefers to form complexes
with organic matter in the sediments. The apparent stability and lability of Cd-organic complexes in
the sediments is found to be dependent on Cd loading. Cd found to have specific binding sites on the
different phases of the sediments (Fr 2 , Fr 3, Fr 4). It is suggested that Cd prefers to form
thermodynamically strong complexes (probably with organic matter) at low Cd loading. However,
the concentration of thermodynamically weak complexes (water soluble complexes of Cd) gradually
increases with the increasing concentration of Cd in the sediments.
The total amounts of Cd associated with the organic matter (ranging from 5.6 to 6.9 mg.kg-1) were
lower than the amounts of Pb associated with the same organic matter (ranging from 42.1 to 53.2
mg.kg-1 ) in the studied sediments (the data are presented as supporting documents, see Table 5SD).
This is probably because of the fact that Pb forms thermodynamically more stable complexes with
organic matter than Cd. It has been reported in the literature that Pb forms thermodynamically more
stable complexes than Cd (Pinheiro et al. 1994; Grzybowski, 2000; Chang chien et al. 2006;
Chakraborty et al 2007). Thus it is expected to have more accumulation of Pb in the organic phases
than Cd in the sediments.
It is interesting to note that the accumulation of Pb and Cd in the organic phases (Fr. 5) did not
increase with the increasing total organic carbon (TOC) concentrations in the sediments. This
signifies that the accumulations of Pb and Cd in the organic fraction was probably influenced by
other different factors, such as total metal loading and trace metal competitions (Chakraborty and
Chakrabarti, 2008) rather than only organic matter content within the sediments.
It is important to note that validation of data obtained from the sequential extraction method is
required by using certified reference materials (CRM). Unfortunately, a CRM was not used in this
study. Validation of the sequential extraction method was done by comparing the total metal
concentration (determined by ICP-MS) with the sum of the concentrations of metal fractions
obtained by following the sequential extraction protocols. The comparable (close to 100% recovery)
values of total metal concentration support the reliability and validity of the sequential extraction
method. The data are provided as a supporting document (Table 5SD).
Sequential extraction procedures (equilibrium based) for trace metal fractionation are actually
directed to operationally defined fractionation (Templeton et al 2000) which may not represent the

11
dynamic natural systems. In order to have more precise information on Pb and Cd speciation in
sediments, the competing ligand exchange method (CLEM) was applied using EDTA as the
competing ligand, to determine the percentage of dynamic metal complexes and their dissociation
rate coefficients in the sediments.
4.3 Kinetic speciation of Pb and Cd in sediments
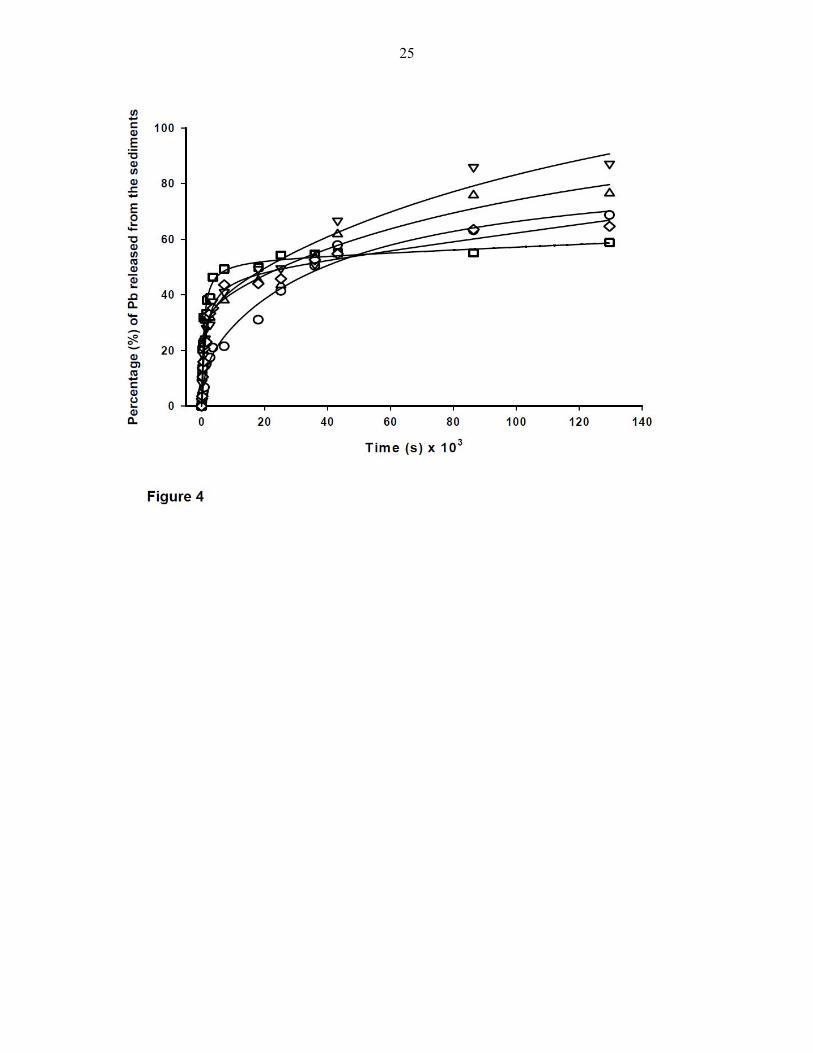
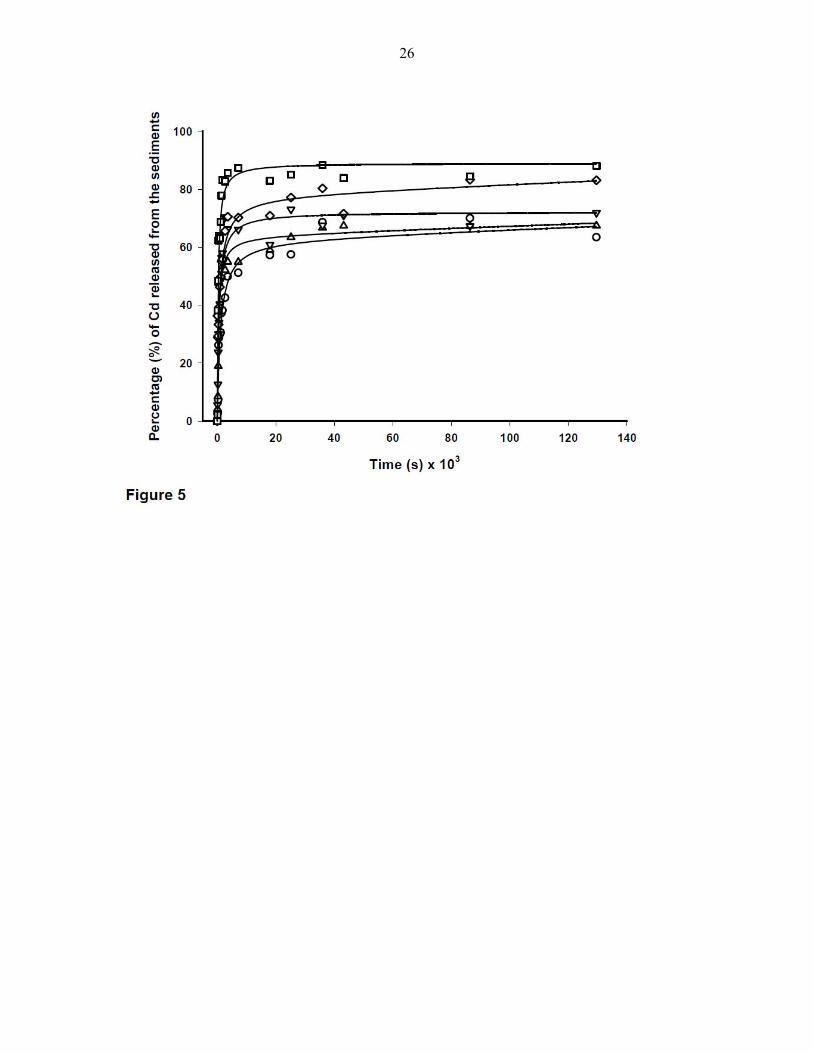
The extraction curves obtained from the kinetic speciation experiments, given in Figures 4 and 5,
show the changes in concentrations of extracted Pb and Cd as a function of time. Each curve
displayed an exponential increase in the metal concentration in the extracting EDTA solution with
respect to time. The curved solid lines represent the results from the non-linear regression analysis,
and the corresponding numerical results that describe the fitted data are presented in Table 3.
Each kinetically-distinguishable component is expressed as a fraction of the total metal (Pb or Cd)
concentrations in the sediments (i.e. as a percentage of the total Pb or Cd concentrations).
4.3.1 Kinetic speciation of Pb
The experimental data from the kinetic extraction curves were fitted to a three component model
because it was the simplest model that gave an adequate statistical and visual fit to the data (i.e. good
representation of the system) (Gutzman and Langford, 1993). Although use of more components in
the model often statistically fit the data better, the additional components were often of negligible
concentration or had a high degree of uncertainty.
The three-component system should not be considered to assume that there are only three discrete
sediment binding sites, but that it allows for diversity among sites, where the calculated parameters
can be thought of as representing average values over a distribution of similar sites with closely-
spaced rate constants (Gutzman and Langford, 1993).
Each curve (except for the sediments collected at Visakhapatnam) in Fig 4 shows three
distinguishable features: a quickly rising section that represents the rapid dissociation rate (kd1) of
weak Pb-sediment complexes (c1), and a slowly rising section which corresponds to relatively
stronger Pb complexes (c2) with slower dissociation rate constant (kd2) and the last part of the curve
that lies almost parallel to x-axis, which can be attributed to slow dissociation (kd3) of strong Pb-
sediment complexes (c3).
The first part of all the curves in Fig. 4 are almost indistinguishable from one another, suggesting
that they represent dissociation of one or more Pb complexes having very similar fast dissociation
rate constants (kd1); probably, they are all of Pb complexes with low thermodynamic stability and are

12
dynamic (within the time scale of the measurement) in nature. The dissociation rate constants of Pb-
sediment complexes are presented in Table 3 shows that the kd1 of Pb-sediment complexes are fast
and almost very similar in all the sediments collected at five different stations.
The percentage of weak Pb-sediment complexes (c1) with low thermodynamic stability were found
to be similar in three different sediments collected at Visakhapatnam, Goutami Godavari estuary and
Machilipatnam (~47.5% of the total Pb present in the sediments were easily extractable) with kd1
value of ~1.0 ×10⁻³ s-1. The lowest concentration of dynamic Pb complexes was found in the
sediment collected at Kalingapatnam (13.9% of the total Pb present in the sediment) with kd1 value
of 1.1 ×10⁻³ s-1 (Table 3).
The middle parts of all the curves in Fig. 4 are easily distinguishable from one another, suggesting
that they represent dissociation of different Pb complexes (c2) having different dissociation rate
constants (kd2); they are all of Pb complexes with higher thermodynamic stability compared to the
fast component. The dissociation rate constants (kd2) of the second component of Pb-sediment
complexes are presented in Table 3.
The percentage of slowly dissociating Pb complexes (c2) were found to be high in the sediment
collected at Kalingapatnam (56.5 % of the total Pb present in the sediment) with kd2 value of 2.7×10-
5 s-1), followed by Vasistha Godavari estuary, Goutami Godavari estuary and Machilipatnam (32.6,
28.6 and 27.5% of the total Pb present in the sediments) with kd2 value of 1.4 ×10⁻⁵ s-1 , 4.3 ×10⁻⁴ s-1
and 1.8 ×10⁻⁵ s-1 respectively. The sediment collected at Visakhapatnam station was found to have
negligible concentration of c2 component under the experimental conditions.
The last part of the curve that lies almost parallel to x-axis, which can be attributed to slow
dissociation of strong Pb-sediment complexes (represented by c3) are presented in Table 3 with very
slow dissociation rate constants (kd3). 52.1 % of the total Pb was found to be inert in the sediment
collected at Visakhapatnam with kd3 value of less than 1×10⁻⁶ s-1. Sediment samples collected at
Kalingapatnam, Goutami Godavari estuary, Vasistha Godavari estuary and Machilipatnam were
found to have 29.6, 22.8, 33.8 and 24.9% of inert Pb-sediment complexes respectively with very
slow dissociation rate constants.
4.3. 2 Kinetic speciation of Cd
The experimental data from the kinetic extraction curves were fitted to a two component model for
Cd metal. Each curve in Fig 5 shows two distinguishable features: a quickly rising section that
represents the rapid dissociation rate (kd1) of weak Cd-Sediment complexes (c1), and the last part of

13
the curve that lies almost parallel to x-axis, which can be attributed to slow dissociation (kd2) of
strong Cd-sediment complexes (c2).
The first part of all curves in Fig. 5 are almost indistinguishable from one another, suggesting that
they represent dissociation of one or more Cd complexes having very similar fast dissociation rate
constants; probably, they are all of Cd complexes with low thermodynamic stability and are dynamic
(within the time scale of the measurement). The dissociation rate constants and dynamic fractions of
Cd-sediment complexes are presented in Table 3, shows that the kd1 of Cd-sediment complexes are
fast and almost very similar in all the sediments collected at five different stations.
Leaching of weak Cd-sediment complexes (c1) with low thermodynamic stability was found to be
similar in two different sediments collected at Kalingapatnam and Visakhapatnam (~57 % and 54%
of the total Cd present in the sediments) with kd1 value of ~8 ×10⁻⁴ and 2 ×10⁻³ s-1 respectively. The
highest fraction of dynamic Cd complexes was found in the sediments collected at Machilipatnam
(~83% of the total Cd present in the sediment) with kd1 value of ~ 2.0 ×10⁻³ s-1 (Table 3).
Slow dissociating Cd complexes (c2%) were found to be high in the sediment collected at
Kalingapatnam (46.2% of the total Cd present in the sediment) with very slow kd2 value (with respect
to the time scale of measurement), followed by Visakhapatnam, Goutami Godavari estuary and
Vasistha Godavari estuary (43.2%, 34.7% and 32.4% of the total Cd present in the sediments
respectively).
5. Comparison of non residual fraction of Pb and Cd obtained from sequential extraction
method with the dynamic metal fraction obtained from kinetic extraction method.
It is well known that sediments contain a continuous distribution of metal binding sites with different
binding energies. Progress in determination of reliable physicochemical parameters to describe metal
complexation by sediment is hindered by the inherent physicochemical complexity of sediments.
Combination of two or more appropriate methods and techniques, with their associated measurement
timescales and detection windows, may provide better information of metal speciation in natural
systems (Chakraborty, 2010; Chakraborty et al., 2009). It is of clear interest in this section to
understand the dynamic behaviour of Pb and Cd in the coastal and estuarine sediments by combining
the data obtained by two different extraction methods.
Total non-residual fractions (Fr. 1 + Fr. 2 + Fr. 3 + Fr. 4 + Fr. 5) of Pb and Cd obtained from
sequential extraction method and dynamic fractions of Pb (c1+c2) and Cd (c1) obtained from kinetic
extraction method are compared. The results are presented in Table 4. The inert complexes of Pb and
Cd (i.e. c3 and c2 component of Pb and Cd respectively) obtained from kinetic extraction study were

14
assumed to be residual component of these metals in the sediments and not compared with the non-
residual fraction of these two metals obtained from sequential extraction study.
It should be noted that the total non residual fractions (Fr. 1+ Fr. 2+Fr. 3+ Fr. 4 + Fr. 5) obtained by
sequential extraction method for both the metals were higher than the dynamic metal fractions
obtained by kinetic extraction method in all the studied sediments (Table 4).
It is interesting to note that the total percentage of non residual fraction of both the metals excluding
Fr 5 (metals associated with organics in the sediments) were lower than the percentage of dynamic
complexes obtained from kinetic extraction method. This probably suggest that both the metals
formed strong (inert) and weak (dynamic) complexes with the different binding sites present in the
organic matter within the studied sediments.
It can be assumed that the metals complexes in Fr 1, Fr 2, Fr 3 and Fr 4 (obtained from sequential
extraction study) were probably dynamic in nature and having lower thermodynamic stability than
their EDTA complexes. Thus, one could infer (by comparing the non-residual and dynamic
concentrations of these metals) that a fraction of metal–organic complexes was dynamic in nature
(within the time scale of measurement in the kinetic extraction study). However, a major part of
metal-organic complexes were found to be inert (having higher stability than Pd or Cd-EDTA
complexes, within the time scale of measurement).
The physical and chemical heterogeneity of organic matters make metal–organic complexes
polydisperse and different in thermodynamic stability within the sediments. The data obtained from
sequential and kinetic extraction methods provide the evidence of the dynamic behaviour of heavy
metals in aqueous sediment suspensions.
A very good correlation was obtained between the residual fraction (excluding metal fraction
associated with organic matter) and the dynamic fraction (kinetic extraction study) of both the
metals.
The statistical correlation study among the dynamic fractions (obtained from kinetic extraction
study) and the different combination of non residual metal fractions (Fr 1, Fr1+ Fr 2, Fr1+ Fr2+ Fr3,
Fr1+ Fr2+ Fr3+Fr4, Fr1+ Fr2+ Fr3+Fr4+ Fr5) of each metal were performed and provided as
supporting documents (Tables 5SD and 6SD). A very strong correlation was obtained between the
dynamic fractions (kinetic extraction study) of Cd with its different non-residual fractions (sequential
extraction study). However, a very strong correlation was found between the dynamic fraction and
water soluble fraction of Pb. The statistical analysis suggests that both dynamic and non residual

15
fraction corresponds to the same metal fraction (except the inert complexes of metal-organic matter)
which may be bioavailable.
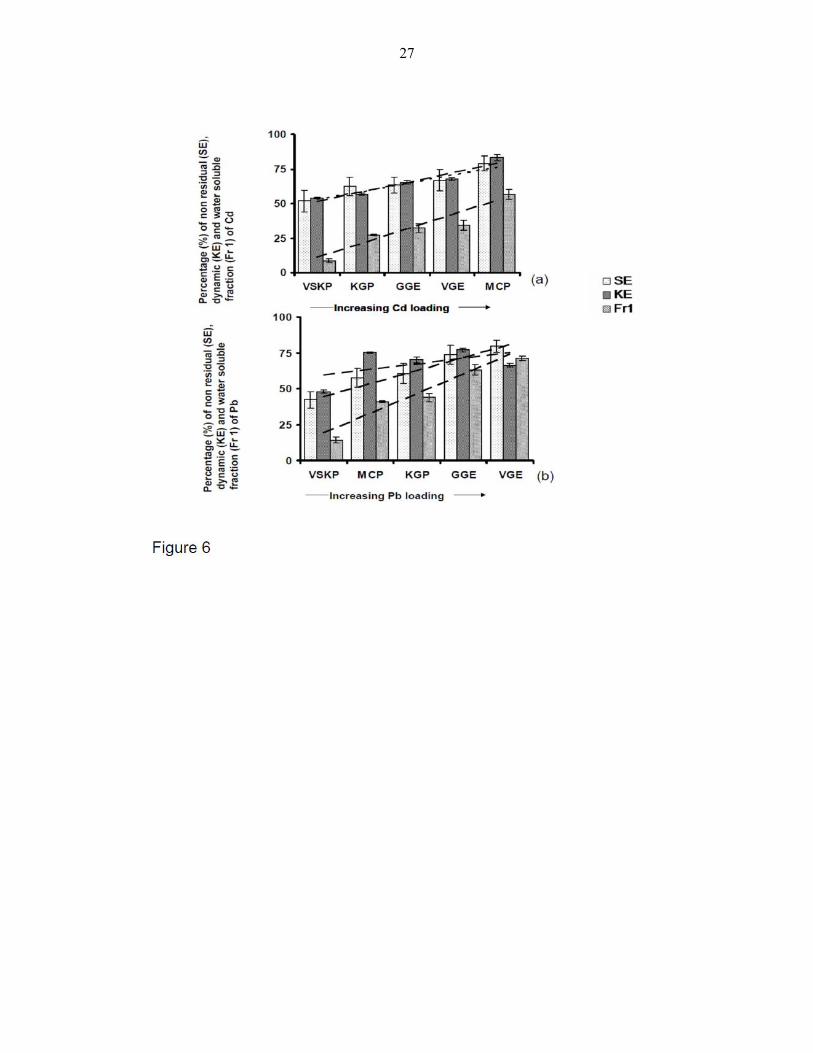
The concentrations of total non residual fractions (excluding Fr 5) (obtained by sequential extraction
method) and dynamic fractions of Pb and Cd (obtained by kinetic extraction method) linearly
increased with the increasing concentration of total Cd and Pb in the sediments. Figure 6 shows that
the water soluble fractions (% Fr. 1) of both the metals increased linearly with the increasing total
metals content within the sediments. It is interesting to note that the other fractions (Fr 2, Fr 3, Fr4
and Fr 5) decreased with the increasing concentrations of Pb and Cd in the sediments (Table 5SD).
This observation indicates that any further increase in Pb and Cd loading may increase the water
soluble fraction of these metals within the system, which can be easily leached out from the
sediments to the overlaying water column and can become bioavailable.
Combination of both the methods suggest that increase in further loading of Pb and Cd in the system
may increase the water soluble or dynamic fraction of these toxic metals which can be bioavailable.
Significance
This study reveals that the concentrations of non-residual or dynamic complexes of Pb and Cd
(which are good indicators of their bioavailability in a system) in coastal and estuarine sediments
may increase with the increasing Pb and Cd loading in sediments. These non-residual or dynamic
complexes of Pb and Cd can be easily leached out to the overlaying water column to alter the
delicate balance between the speciation, bioavailability and toxicity of these metals which is essential
to sustain life in the sediments and their overlaying water column. This study shows that total
organic carbon (TOC) is one of the key factors which play a crucial role in controlling speciation of
these toxic metals in sediments. However, the distribution and speciation of these metals are
influenced by their total metal loading and trace metal competitions rather than only TOC content
within the sediments. Combination of sequential and kinetic extraction methods, with their
associated measurement timescales and detection windows, provides evidence of the dynamic
behaviour of heavy metals in aqueous sediment suspensions.
Acknowledgement
Authors are thankful to the Director, NIO, Goa for his encouragement and support. Unconditional
help and support from Dr J.N. Pattan and Dr G. Parthiban from NIO, Goa for providing ICPMS
facility are gratefully acknowledged. This work is a part of the Council of Scientific and Industrial
Research (CSIR) supported Supra Institutional Project (SIP 1308). This article bears NIO
contribution Number XXXX
16
References:
Arain, M.B., Kazi, T.G., Jamali, M.K., Jalbani, N., Afridi, H.I., Baig, J.A., 2007, Speciation of heavy metals in sediment by conventional, ultrasound and microwave assisted single extraction methods: A comparison with modified sequential extraction procedure, J Hazard Mater, 154, 998–1006.
Arjonilla, M., Forja, J. M., Goez-Parra, A., 1994, Sediment analysis does not provide a good measure of heavy metal bioavailability to Cerastoderma glaucum in confine coastal ecosystem. Bull Environ Contam Toxicol. 52 , 810-817.
Chakraborty, P., Chakrabarti, C. L., 2008, Competition from Cu(II), Zn(II) and Cd(II) in Pb(II) Binding to Suwannee River Fulvic Acid, Water, Air, & Soil Poll, 195, 63-71.
Chakraborty, P., Chakrabarti, C.L., 2006, Chemical speciation of Co(II), Ni(II),Cu(II) and Zn(II) IN (Sudbury,Canada) Copper cliff mine effulent and the effect of dilution of effluent with the tap water on the lability of the metal-DOC complexes, Anal. Chim.Acta, 571, 260-269.
Chakraborty, P., Gopalpillai, Y., Murimboh, J., Fasfous, I.I., Chakrabarti, C.L., 2006, Kinetic speciation of nickel in mining and municipal effluents, Anal. Bioanal Chem., 386, 1803-1813.
Chakraborty, P., Fasfous, I.I., Murimboh, J., Chakrabarti, C.L., 2007, Simultaneous determination of speciation parameters of Cu, Pb, Cd and Zn in model solutions of Suwannee River Fulvic Acid by pseudopolarography, Anal Bioanal Chem 388, 463-474.
Chakraborty, P., Chakrabarti, C. L., 2008, Competition from Cu(II), Zn(II) and Cd(II) in Pb(II) Binding to Suwannee River Fulvic Acid, Water, Air, & Soil Poll, 195, 63-71.
Chakraborty, P., Zhao, J., Chakrabarti, C.L., 2009, Copper and nickel speciation in mine effluents by combination of two independent techniques, Anal Chim Acta, 636, 70-76
Chakraborty, P., Babu, P. V. R., Sarma, V. V., 2011, A new spectroflorometric method for the determination of total arsenic in sediments and its application to kinetic speciation, Int. J. of Env. Anal. Chem., doi: 10.1080/03067319.2010.500058
Chakraborty, P. Babu, P. V. R., Sarma, V. V., 2011, A multi-method approach for the study of lanthanum speciation in coastal and estuarine sediments, J. Geochem. Explo,110, 225-231
Chang Chien, S. W., Wang, M. C., Huang, C. C., 2006, Reactions of compost-derived humic substances with lead, copper, cadmium, and zinc, Chemosphere, 64, 1353-1361.
Chen, T. C., Macauley, E., Hong A., 1995, Selection and test of effective chelators for removal of heavy metals from contaminated soils. Can. J. Civ. Engrg. 22, 1185-1197.
Cheng, Y. Hu, J. Luo, B. Xu, J. Zhao, 2009, Geochemical processes controlling fate and transport of arsenic in acid mine drainage (AMD) and natural systems, J Hazard Mater, 165,13-26.
Chlopecka, A., Bacon, J. R., Wilson, M. J., Kay J. , 1996, Forms of cadmium, lead, and zinc in contaminated soils from southwest Poland. J. Environ Quality, 25, 69-79.
Clozel, B., Ruban, V., Durand, C., Conil, P., 2006, Origin and mobility of heavy metals in contaminated sediments from retention and infiltration ponds, App. Geochem, 21, 1781–1798.
17
DiToro, D. M., Mahony, J. D., Hansen, D. J., Scot, K. J., Hicks, M. B., Mayr, S. M., Redmond, M. S., 1990, Toxicity of Cadmium in Sediments - the Role of Acid Volatile Sulfide. Environ. Toxicol Chem, 9, 1487-1502.
Fangueiro, D., Bermond, A., Santos, E., Carapuca, H., Duarte, A., 2002, Heavy metal mobility assessment in sediments based on a kinetic aapproach of the EDTA extraction: search for optimal experimental conditions. Anal Chim Acta, 459, 245-256
Fangueiro, D., Bermond, A., Santos, E., Carapuca, H., Duarte, A., 2005, Kinetic approach to heavy metal mobilization assessment in sediments: choose of kinetic equations and models to achieve maximum information, Talanta, 66,844-857
Feng, H., Han, X.F., Zhang, W.G., Yu, L.Z., 2004. A preliminary study of heavy metal contamination in Yangtze River intertidal zone due to urbanization. Mar. Pollut Bull. 49, 910–915.
Forstner, U., Salomons, W., 1980, Trace metal analysis on polluted sediments. Part 2 Evaluation of Environmental Impact. Environ. Technol. Lett, 1,506–517.
Gupta, A. K., Sinha, S., 2007, Assessment of single extraction methods for the prediction of bioavailability of metals to Brassica juncea L. Czern. (var. Vaibhav) grown on tannery waste contaminated soil , J Hazard Mater, 149, 144-150.
Gismera, M. J., Lacal, J., da Silva, P., Garcia, R., Sevilla, M. T., Procopio, J. R., 2004 Study of metal Fractionation in river sediments A comparison between kinetics and sequential extraction procedures, Environ. Poll., 127,175-182
Gonzalvez, A., Cervera, M.L., Armenta,, S., Guardia de la,, M., 2009, A review of non-chromatographic methods for speciation analysis, Anal. Chim. Acta, 636, 129-157.
Grzybowski, W. 2000, Comparison between stability constants of cadmium and lead complexes with humic substances of different molecular weight isolated from Baltic Sea water. Oceanologia, 42, 473–482.
Gutzman, D. W., Langford, C. H., 1993, Kinetic study of the speciation of copper (II) bound to a hydrous ferric Oxide. Environ. Sci. Technol. 27, 1388–1393.
Heil, D., Hanson, A., Zohrab, S., 1996, The competitive binding of lead by EDTA in soils and implications for heap leaching remediation. Radioactive Waste Mgmt. and Envir; Restoration, 20, 111-127.
International Agency for Research on Cancer, Inorganic and organic lead compounds. IARC Monograph , 23 (2006) sup 7, vol 87
Issaro, N., Abi-Ghanem, C., Bermond, A., 2009, Fractionation studies of mercury in soils and sediments: A review of the chemical reagents used for mercury extraction. Anal Chim Acta, 631, 1-12.
Jacobson, K.B., Turner, J.E., 1980, The interaction of cadmium and certain other metal ions with proteins and nucleic acids. Toxicology, 16, 1–37

18
Kersten, M., Forstner, U., 1986, Chemical fractionation of heavy metals in anoxic estuarine and coastal sediments. Water Sci. Technol. 18, 121-130.
Koretsky, C. M., Cuellar, A., Haveman, M., Beuving, L., Shattuck, T., Wagner. M., 2008, Influence of Spartina and Juncus on saltmarsh sediments. II. Trace element geochemistry Chem. Geo., 255, 100-113.
Kumar, K.S., Sajwan, K.S., Richardson, J.P., Kannan, K., 2008, Contamination profiles of heavy metals, organochlorine pesticides, polycyclic aromatic hydrocarbons and alkylphenols in sediment and oyster collected from marsh/estuarine Savannah GA, USA, Mar. Pollut. Bull., 56, 136–149.
Laing, G.D., De Vos, R., Vandecasteele, B., Lesage, E., Tack, F.M.G., Verloo, M.G., 2007, Effect of salinity on heavy metal mobility and availability in intertidal sediments of the Scheldt estuary, Estuar Coast Shelf Sci, 77, 589–602.
Lane, T., Saito,, M., George, G., Pickering, I., Prince, R., Morel, F., 2005, A Cadmium Enzyme from a Marine Diatom – Nature, May 5,
Lim, H.S., Lee, J.S., Chon, H.T., Sager, M., 2008, Heavy metal contamination and health risk assessment in the vicinity of the abandoned Songcheon Au–Ag mine in Korea, J. Geochem. Expl,, 96, 223–230.
Loghman-Adham, M., 1997, Renal effects of environmental and occupational lead exposure. Environ. Health Perspect. 05, 928–938.
Luoma, S. N., Davies, J.A., 1983, Requirements for modelling trace metal partitioning in oxidized estuarine sediments. Mar Chem, 12, 159-181.
Lu, Y., Chakrabarti, C. L., Back, M. H., Gregoire, D. C., Schroeder, W. H., 1994, Kinetic studies of aluminum and zinc speciation in river water and snow, Anal. Chim. Acta, 293, 95-108.
Mandal, R., Salam, M. S. A., Murimboh, J., Hassan, N. M., Chakrabarti, C. L., Back, M. H. Gregoire, D. C., Scrhoeder, W. H., 1999, Effect of the competition of copper and cobalt on the lability of nickel(II)-organic ligand complexes, Part II: in freshwaters (Rideau River surface waters). Anal. Chim. Acta 395, 323-334
Martin, J.M., . Nirel, PA., Thomas, J., 1987, Sequential extraction techniques: Promises and problems. Mar. Chem., 22, 313-341.
Mishra, V.K., Upadhyaya, A.R., Pandey, S.K., Tripathi, B.D., 2008, Heavy metal pollution induced due to coal mining effluent on surrounding aquatic ecosystem and its management through naturally occurring aquatic macrophytes, Bioresources Technol. 99, 930–936.
Olson, D.L., Shuman, M. S., 1985, Copper dissociation from estuarine humic materials, Geochim. Cosmochim Acta. 49, 1371-1375.
Pagnanelli, F., Moscardini, E., Giuliano, V., Toro, L., 2004, Sequential extraction of heavy metals in river sediments of an abandoned pyrite mining area: pollution detection and affinity series, Environ. Poll. 132, 189–201.
19
Pinheiro, J. P., Mota, A. M., Simões Gonçalves, M. L., 1994, Complexation study of humic acids with cadmium (II) and lead (II), Anal Chim. Acta, 284, 525-537.
Quevauviller, P., Rauret, G., Griepink, B., 1993, Improvement of analytical measurements with the BCR-programme: single and sequential extraction procedure applied to soil and sediment Analysis, Int. J. Environ. Anal. Chem. 51, 231-235.
Ramos, L., Hernandez, L. M., Gonzalez, M. J., 1994, Sequential fractionation of cop per, lead, cadmium and zinc in soils from or near Donana National Park. J. Envir; Quality, 23, 50-57.
Rao, C. R. M., Sahuquillo, A., Lopez-Sanchez, J. F., 2010, Comparison of single and sequential extraction procedures for the study of rare earth elements remobilisation in different types of soils, Anal. Chim. Acta, 662, 128-136.
Reyhanitabar, A., Gilkes, R.J., 2010, Kinetics of DTPA extraction of zinc from calcareous soils, Geoderma, 154, 289-293.
Sanborn, M. D., Abelsohn, A., Campbell, M., Weir, E., 2002, Identifying and managing adverse environmental health effects: 3. Lead exposure. CMAJ 166, 1287–1292.
Stohs, S.J., Bagchi, D., 1995, Oxidative mechanisms in the toxicity of metal ions. Free Radical Biology and Medicine, 18, 321–336.
Templeton, D. M., Ariese, F., Cornelis, R., Danielsson, L. G., Muntau, H., van Leeuwen, H. P., Lobinski, R., 2000, Guidelines for terms related to chemical speciation and fractionation of elements. Definitions, structural aspects, and methodological approaches, Pure Appl. Chem., 72, 1453-1470.
Tessier, A., Campbell, P.G.C., Bisson, M., 1979, Sequential extraction procedure for the speciation of particulate traces metals. Anal. Chem., 51,844-851.
Tomlinson, D. L., Wilson, J. G., Harris, C. R., Jeffrey, ,D. W., 1980, Problems in the assessment of heavy-metal levels in estuaries and the formation of a pollution index, Helgoland Mar Res., 33, 566-575
Urija, B., Branica, M., 1995, Distribution of Cd, Pb, Cu and Zn in carbonate sediments from the Krka river estuary obtained by sequential extraction, Sci. Total Environ, 170, 101-118.
Usero, J., Gamero, M., Morillo, J., Gracia,, I., 1998. Comparative study of three
sequential extraction procedures for metals in marine sediments. Environ. Int., 24, 487-496.
Vanthuyne, M., Maes, A., 2006, Metal speciation in sulphidic sediments: A new method based on oxidation kinetics modelling in the presence of EDTA, Sci. Tot. Environ., 367, 405-417
Van Benschoten, J. E., Reed, B. E., Matsumoto, M. R., McGarvey, P. J., 1994, Metal removal by soil washing for an iron oxide coated sandy soil. Water Envir. Res., 66, 168-174.
Waalkes, M.P., 2000, Cadmium carcinogenesis in review. Journal of Inorganic Biochemistry, 79, 241–244
20
Weng, H.X., Zhu, Y.M., Qin, Y.C., Chen, J.Y., Chen, X.H., 2008, Accumulation discrepancy of heavy metal and organic pollutants in three near-shore depositional environments, southeastern China, J Asian Earth Sci, 31, 522–532.
Xu, Y., Feng, L., Jeffrey, P. D., Shi, Y. G., Morel, F. M. M., 2008, Structure and metal exchange in the cadmium carbonic anhydrase of marine diatoms. Nature, 452, 56-61.
Yarlaggada, P. S., Matsumoto, M. R., Van Benschoten, J. E. , Kathuria, A. , 1995, Characteristics of heavy metal in contaminated soils. J. Envir. Engrg., ASCE, 121, 276-286.
Yao, Q.Z., Zhang, J., Wu, Y. Xiong, H., 2007, Hydrochemical processes controlling arsenic and selenium in the Changjiang River (Yangtze River) system, Sci. Tot Environ. 377, 93–104.
Zhang, H., He, P., Shao, L. M., 2008, Fate of heavy metals during municipal solid waste incineration in Shanghai, J Hazard Mater, 156, 365-373.
Zhao, X., Dong, D., Hua, X., Dong, S., 2009, Investigation of the transport and fate of Pb, Cd, Cr(VI) and As(V) in soil zones derived from moderately contaminated farmland in Northeast, China, J Hazard Mater, 170 () 570-577.
Zhong, A. P., Guo, S. H., Li, F. M., Li, G. K., Jiang, X., 2006, Impact of anions on the heavy metals release from marine sediments, J. Environ Sci-China, 18, 1216–1220.
21
Caption and Legends for figures
Figure 1. Map of the sampling areas along the East coast (Andhra Pradesh region) of India, The
filled circles are the locations of the five environmentally significant sites.
1) Kalingapatnam (KGP) 2) Vishakhapatnam (VSP) 3) Machilipatnam (MCP). Estuarine sediment
samples were collected from 4) Goutami Godavari estuary (GGE) and 5) Vasishtha Godavari estuary
(VGE).
Figure 2. Chemical fractionation of Pb in five different sediment samples collected at five different
environmentally significant sites; KGP-Kalingapatnam; VSP-Visakhapatnam; GGE- Goutami
Godavari Estuary; VGE-Vasistha Godavari Estuary and MCP-Machilipatnam
Figure 3. Chemical fractionation of Cd in five different sediment samples collected at five different
environmentally significant sites; KGP-Kalingapatnam; VSP-Visakhapatnam; GGE- Goutami
Godavari Estuary; VGE-Vasistha Godavari Estuary and MCP-Machilipatnam.
Figure 4. Release of extractable non-residual Pb species from sediments as a function of time in
presence of 0.05M EDTA at pH 6. , (□); Visakhapatnam, (Ο); Kalingapatnam, (Δ); Vasistha
Godavari estuary, ( ); Goutami Godavari, (◊);Machilipatnam
Figure 5. Release of extractable non-residual Cd species from sediments as a function of time in
presence of 0.05M EDTA at pH 6. , (Δ); Visakhapatnam, (Ο); Kalingapatnam, (◊); Vasistha
Godavari estuary, ( ); Goutami Godavari, (□);Machilipatnam
Figure 6.: (a)Variation of water soluble fraction, non-residual and dynamic fractions of Cd with
varying concentration of total Cd, (b) Variation of water soluble fraction, non-residual and dynamic
fractions of Pb with varying concentrations of total Pb

22

23

24
25
26
27

28
Table 1: Geographical locations of sampling sites, the distance from the shore and depth from where the sediment samples were collected
Station Longtitude Latitude Sampling Date
Distance from Shore (km)
Depth (m)
Kalingapatnam (KGP) 84o10.31’ 18o18.98’ 25.12.09 5
23
Visakhapatnam
(VSP) 83o19.07’ 17o38.96’ 25.12.09 5
35
Goutami Godavari Estuary (GGE)
82o24.19’ 16o41.56’ 27.12.09 5 14
Vasistha Godavari Estuary (VGE)
81o42.94’ 16o15.65’ 26.12.09 5 4
Machilipatnam (MCP) 81o16.32’ 16o11.51’ 26.12.09 5
9
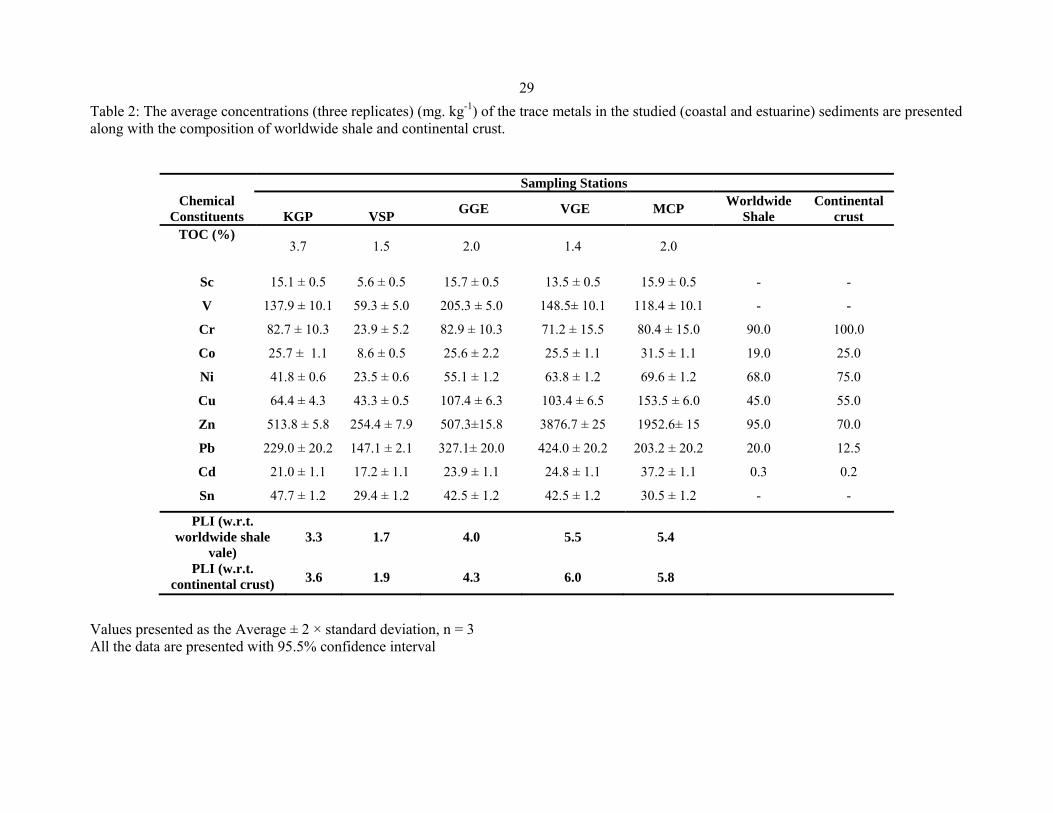
29Table 2: The average concentrations (three replicates) (mg. kg-1) of the trace metals in the studied (coastal and estuarine) sediments are presented along with the composition of worldwide shale and continental crust. Values presented as the Average ± 2 × standard deviation, n = 3 All the data are presented with 95.5% confidence interval
Chemical
Constituents
Sampling Stations
KGP
VSP GGE VGE MCP Worldwide Shale
Continental crust
TOC (%)
3.7 1.5 2.0 1.4 2.0
Sc 15.1 ± 0.5 5.6 ± 0.5 15.7 ± 0.5 13.5 ± 0.5 15.9 ± 0.5 - -
V 137.9 ± 10.1 59.3 ± 5.0 205.3 ± 5.0 148.5± 10.1 118.4 ± 10.1 - -
Cr 82.7 ± 10.3 23.9 ± 5.2 82.9 ± 10.3 71.2 ± 15.5 80.4 ± 15.0 90.0 100.0
Co 25.7 ± 1.1 8.6 ± 0.5 25.6 ± 2.2 25.5 ± 1.1 31.5 ± 1.1 19.0 25.0
Ni 41.8 ± 0.6 23.5 ± 0.6 55.1 ± 1.2 63.8 ± 1.2 69.6 ± 1.2 68.0 75.0
Cu 64.4 ± 4.3 43.3 ± 0.5 107.4 ± 6.3 103.4 ± 6.5 153.5 ± 6.0 45.0 55.0
Zn 513.8 ± 5.8 254.4 ± 7.9 507.3±15.8 3876.7 ± 25 1952.6± 15 95.0 70.0
Pb 229.0 ± 20.2 147.1 ± 2.1 327.1± 20.0 424.0 ± 20.2 203.2 ± 20.2 20.0 12.5
Cd 21.0 ± 1.1 17.2 ± 1.1 23.9 ± 1.1 24.8 ± 1.1 37.2 ± 1.1 0.3 0.2
Sn 47.7 ± 1.2 29.4 ± 1.2 42.5 ± 1.2 42.5 ± 1.2 30.5 ± 1.2 - -
PLI (w.r.t. worldwide shale
vale) 3.3 1.7 4.0 5.5 5.4
PLI (w.r.t. continental crust) 3.6 1.9 4.3 6.0 5.8

30
Table 3: Kinetically distinguishable components (c1, c2 , c3 etc) of Cd and Pb and their dissociation rate constants (kd1, kd2, kd3 etc) in the estuarine and coastal sediments obtained by kinetic extraction study using EDTA as a competing ligand.
Sampling sites
Total Cd (mg. kg-1)
c1 (%) kd1(s-1) C2 (%) kd2 (s-1)
KGP
21.0 ± 1.1
56.8 ± 0.5 7.7×10⁻⁴ 46.2 ± 0.5 <1×10⁻⁶
VSP
17.2± 1.1 53.9 ± 0.7 1.9×10⁻³ 43.2 ± 1.5 <1×10⁻⁶
GGE
23.9 ± 1.1
65.4 ± 1.5 1.1×10⁻³ 34.7 ± 0.6 <1×10⁻⁶
VGE
24.8 ± 1.1
67.6 ± 0.9 1.6 ×10⁻³ 32.4 ± 0.5 <1×10⁻⁶
MCP
37.2 ± 1.1
83.2 ± 2.3 2.1×10⁻³ 16.8 ± 0.4 <1×10⁻⁶
Sampling sites
Total Pb
(mg. kg-1)
c1 (%) kd1(s-1) c2 (%) kd2(s-1) c3 (%) kd3 (s-1)
KGP
229.0 ± 20.2
13.9± 0.5 1.1×10⁻³ 56.5± 0.5 2.7×10⁻⁵ 29.6± 0.3 <1×10⁻⁶
VSP 147.1 ± 2.1 47.9± 0.5 1.2 ×10⁻³ -- -- 52.1± 0.8 <1×10⁻⁶
GGE
327.1 ± 20.0
48.6± 0.5
2.0 ×10⁻³
28.6± 1.5
4.3 ×10⁻⁴
22.8± 0.7
<1×10⁻⁶
VGE 424.0 ± 20.2 33.6± 0.5 9.8 ×10⁻⁴ 32.6± 0.7 1.4×10⁻⁵ 33.8± 0.8 <1×10⁻⁶
MCP
203.2 ± 20.2
47.6± 0.5 8.1×10⁻⁴ 27.5± 0.8 1.8×10⁻⁵ 24.9± 0.8 <1×10⁻⁶
Values presented as the mean ± 2 × standard deviation, n = 3 All the data are presented with 95.5% confidence interval.

31
Table 4: Comparison of the sequentially extracted non-residual fractions of metals (Pb or Cd) with the kinetically extracted dynamic metal fractions of Pb (c1+c2) and Cd (c1) in the coastal and estuarine sediments. Both the fractions are presented as the percentage of the total metal content
Values presented as the mean ± 2 × standard deviation, n = 3
Method Sampling station Metal Sequentially extracted non residual
fractions (Fr. 1+ Fr.2+ Fr. 3+ Fr.4+ Fr.5) %
Kinetically extracted dynamic metal
fractions,c1 or (c1+c2)%
KGP
Cd
90.4± 7.8
56.8 ± 1.0
VSP 90.4± 6.9
53.9 ± 2.2
GGE 92.3± 5.7
65.4 ± 2.1
VGE 93.4± 10.0
67.6 ± 1.4
MCP 97.1± 6.9
83.2 ± 2.7
KGP
Pb
89.9 ± 5.6
70.4 ± 0.8
VSP 88.2± 6.6
47.9 ± 1.3
GGE 93.1 ± 7.2
77.2 ± 1.2
VGE 95.1 ± 6.7
66.2 ± 1.3
MCP 91.8 ± 5.1
75.1 ± 1.3