Embed Size (px)
Citation preview

97DOI 10.1007/s12182-013-0255-8
Li Wenqing1, Gong Jing1 , Lü Xiaofang1, Zhao Jiankui2, Feng Yaorong3 and Yu Da1
1 Beijing Key Laboratory of Urban Oil and Gas Distribution Technology, China University of Petroleum, Beijing 102249, China2 China National Oil and Gas Exploration and Development Corporation, Beijing 100034, China3
Abstract: The natural gas pipeline from Platform QK18-1 in the southwest of Bohai Bay to the onshore processing facility is a subsea wet gas pipeline exposed to high pressure and low temperature
management of the subsea pipeline.
Key words:
A study of hydrate plug formation in a subsea natural gas pipeline using
*Corresponding author. email: [email protected]
1 Introduction
gas is transported in subsea pipelines at low temperature and high pressure. The low temperature and high pressure conditions may cause natural gas and water transported in the pipelines to form gas hydrates. Upon formation, hydrate accumulation and agglomeration eventually form a slug,
more attention has been paid to developing flow assurance
and Gudmundsson, 1999; 2006; Gaillard et al, 1999; Gudmundsson and Graff, 2003; Ning et al, 2007; Wang et
et al, 2010a; 2010b; 2010c). Unfortunately, little research is focused on the phenomena involved in a hydrate plug
to provide an estimate of where and approximately when a hydrate plug may form in collaboration with the SPT Group.
hydrate formation model and to investigate the effect of experimental variables on the plugging behavior of hydrate formation in water-in-oil emulsions. Davies et al (2010) developed a model to predict hydrate plug formation by studying the mass and heat transfer resistances to hydrate formation in oil-dominated systems, and the revised hydrate formation model had been validated on both laboratory and industrial scales. Emmanuel et al (2008) presented the effects
crude oil systems by conducting tests in the flow assurance
conditions. Test results indicated that the plugging behavior of oil system is dependent on these variables and the oil-water chemical properties. Nevertheless, up to now there seldom
into real plugging practices, and the results are also system
meaningful to perform relevant studies based on real hydrate
Pet.Sci.(2013)10:97-105
98
In the southwest of Bohai Bay, the subsea gas pipeline between the QK18-1 central platform and the onshore natural
transported was wet gas containing light hydrocarbon and vapor, and the flow rate was about 9,500 Sm3/h. The operation temperature and pressure of the pipeline was 5-45
there was something wrong in the pipeline between Platform QK18-1 and the Boxi processing plant. The inlet pressure
sharply. Through adjusting the inlet and outlet pressures and the injection of methanol both upstream and downstream,
flow rate and the pressure fluctuated rapidly (the transient 3
conditions, it was inferred that three reasons may have led to the increased inlet pressure, which are listed as follows:
1) There were hydrate plugs in the subsea pipeline.
the pressure drop along the pipeline increased.
no pig lost in the pipeline, but in the processing plant a great
experimental research is done to further investigate hydrate plug formation in gas transportation pipelines.
2 Theoretical and experimental analyses of gas samples
To determine phase distribution in the pipeline, three gas
Platform QK18-1, and their compositions are listed in Table 1. The phase envelope of the gas mixture was obtained from the
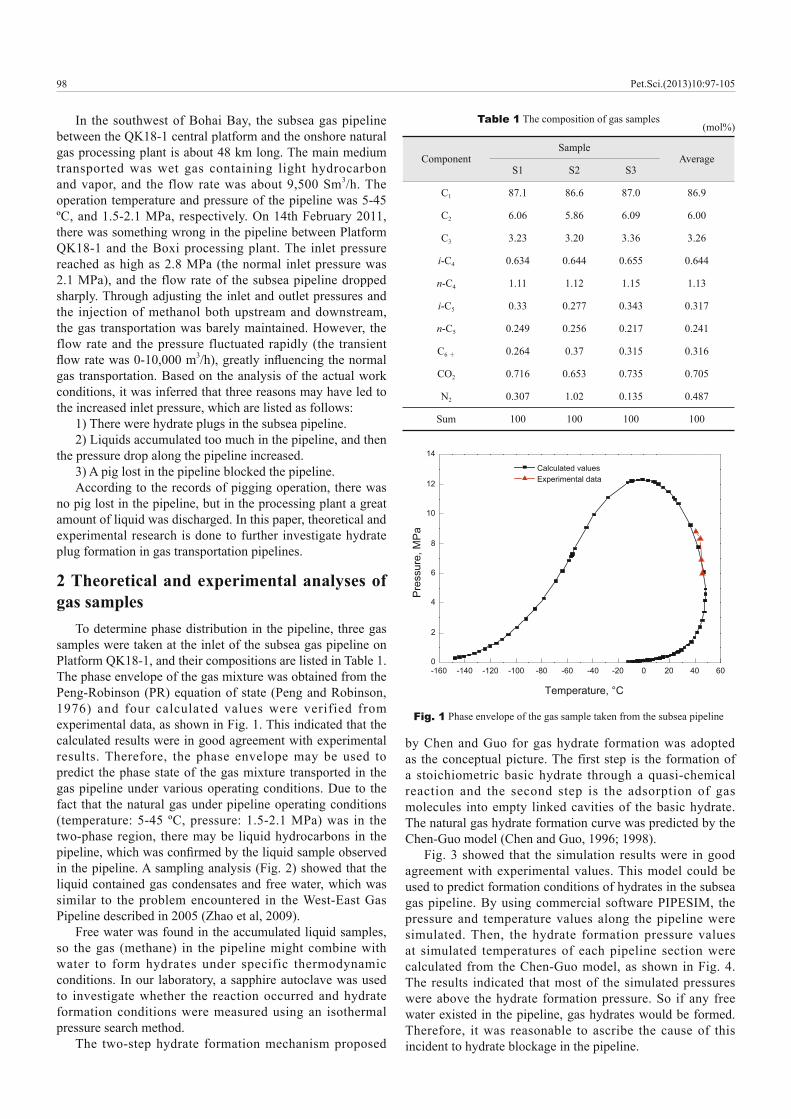
1976) and four calculated values were verified from experimental data, as shown in Fig. 1. This indicated that the calculated results were in good agreement with experimental results. Therefore, the phase envelope may be used to predict the phase state of the gas mixture transported in the gas pipeline under various operating conditions. Due to the fact that the natural gas under pipeline operating conditions
similar to the problem encountered in the West-East Gas Pipeline described in 2005 (Zhao et al, 2009).
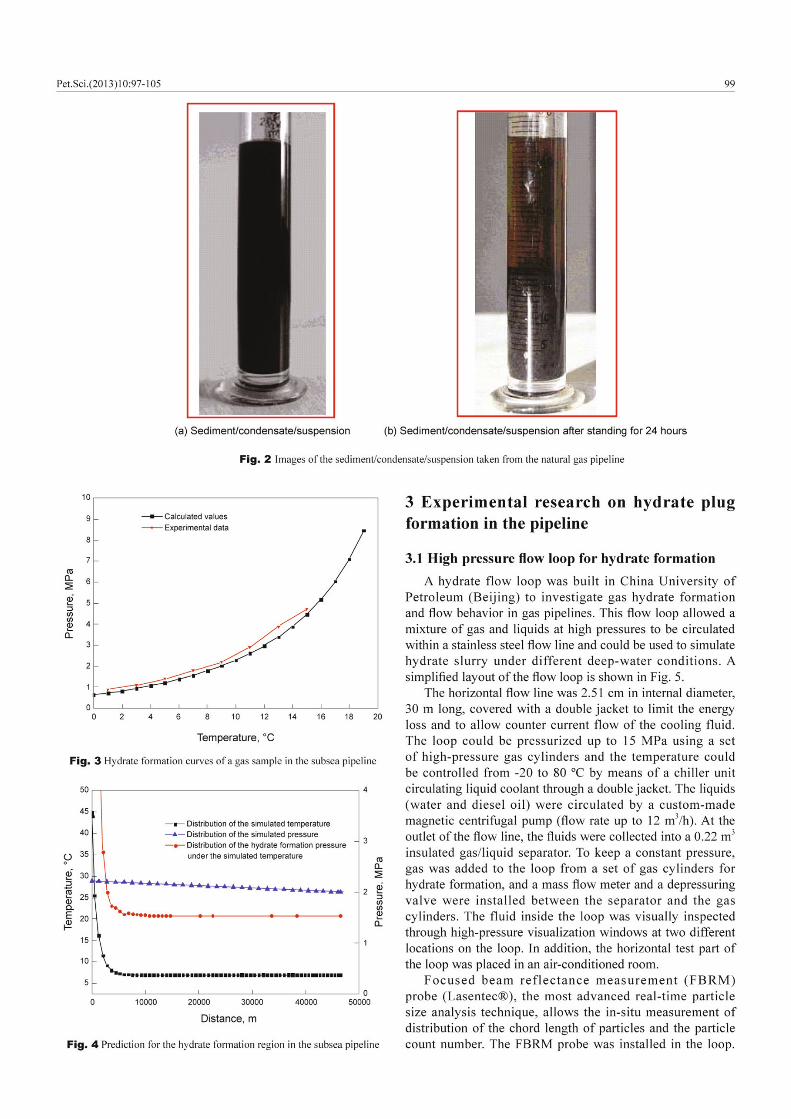
so the gas (methane) in the pipeline might combine with water to form hydrates under specific thermodynamic conditions. In our laboratory, a sapphire autoclave was used to investigate whether the reaction occurred and hydrate formation conditions were measured using an isothermal pressure search method.
The two-step hydrate formation mechanism proposed
by Chen and Guo for gas hydrate formation was adopted as the conceptual picture. The first step is the formation of
reaction and the second step is the adsorption of gas
The natural gas hydrate formation curve was predicted by the Chen-Guo model (Chen and Guo, 1996; 1998).
Fig. 3 showed that the simulation results were in good agreement with experimental values. This model could be used to predict formation conditions of hydrates in the subsea
pressure and temperature values along the pipeline were simulated. Then, the hydrate formation pressure values at simulated temperatures of each pipeline section were calculated from the Chen-Guo model, as shown in Fig. 4. The results indicated that most of the simulated pressures were above the hydrate formation pressure. So if any free water existed in the pipeline, gas hydrates would be formed. Therefore, it was reasonable to ascribe the cause of this
Fig. 1
-160 -140 -120 -100 -80 -60 -40 -20 0 20 40 600
2
4
6
8
10
12
14
Calculated values Experimental data
Pre
ssur
e, M
Pa
Temperature, °C
Table 1 The composition of gas samples
ComponentSample
S1 S2 S3
C1 87.1 86.6 87.0 86.9
C2 6.06 5.86 6.09 6.00
C3 3.23 3.20 3.36 3.26
i-C4 0.634 0.644 0.655 0.644
n-C4 1.11 1.12 1.15 1.13
i-C5 0.33 0.277 0.343 0.317
n-C5 0.249 0.256 0.217 0.241
C6 0.264 0.37 0.315 0.316
CO2 0.716 0.653 0.735 0.705
N2 0.307 1.02 0.135 0.487
Sum 100 100 100 100
Pet.Sci.(2013)10:97-105
100
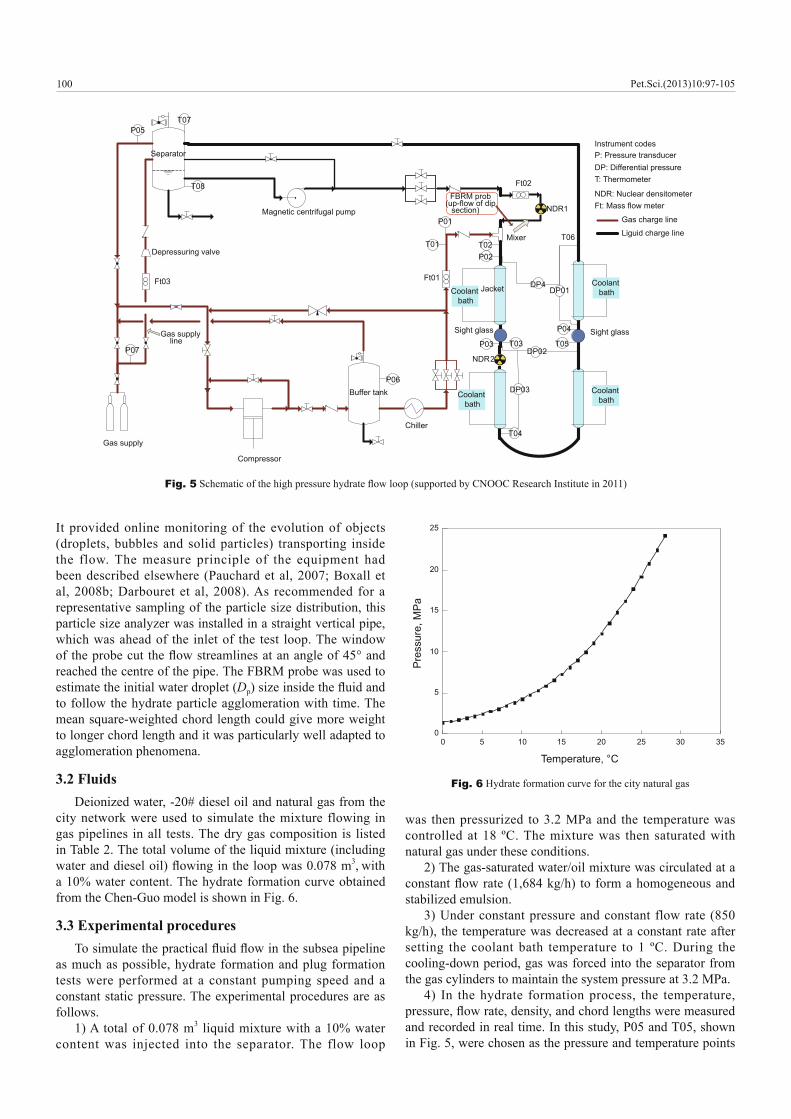
It provided online monitoring of the evolution of objects (droplets, bubbles and solid particles) transporting inside
been described elsewhere (Pauchard et al, 2007; Boxall et
which was ahead of the inlet of the test loop. The window
estimate the initial water droplet (Dp
to follow the hydrate particle agglomeration with time. The
to longer chord length and it was particularly well adapted to agglomeration phenomena.
3.2 Fluids
gas pipelines in all tests. The dry gas composition is listed
3, with
from the Chen-Guo model is shown in Fig. 6.
3.3 Experimental procedures
as much as possible, hydrate formation and plug formation tests were performed at a constant pumping speed and a constant static pressure. The experimental procedures are as follows.
3
content was injected into the separator. The flow loop
Fig. 5
Compressor
Magnetic centrifugal pump
Gas supply
Separator
Buffer tank
Chiller
Mixer
JacketFt01
P06
P01
P07P03 T03
DP03
T04
P02
P04
T05
DP01
DP02
DP4
T06T01 T02
T08 Ft02FBRM prob
(up-flow of dip section)
Depressuring valve
Ft03
Sight glassSight glass
NDR1
NDR2
Instrument codesP: Pressure transducerDP: Differential pressureT: Thermometer
NDR: Nuclear densitometerFt: Mass flow meter
Gas charge line
Liguid charge line
T07P05
Gas supply line
Coolant bath
Coolant bath
Coolant bath
Coolant bath
Fig. 6
0 5 10 15 20 25 30 350
5
10
15
20
25
Pre
ssur
e, M
Pa
Temperature, °C
natural gas under these conditions.2) The gas-saturated water/oil mixture was circulated at a
3) Under constant pressure and constant flow rate (850
cooling-down period, gas was forced into the separator from
4) In the hydrate formation process, the temperature,
and recorded in real time. In this study, P05 and T05, shown in Fig. 5, were chosen as the pressure and temperature points
Pet.Sci.(2013)10:97-105

101
2004), and the blockage time (tbTb
T
T and Tb
Table 3 Te, T , Tc and Tb
kg/hTe
ºCteh
T ºC
th
Tc
ºCTb
ºCtbh
t and blockage
Table 2
N2
CO
CO2
C1
C2
C
C4
C
C
Te), then T
Tb
Te to TT to Tb T to Tb
Tb
Te to Ttime tin Tc
T Te

102
time tb
Fig. 7
0 5500 11000 16500 22000 27500 33000 38500 44000 49500 550002.0
2.5
3.0
3.5
4.0Pressure
Temperature
Density
Flow rate
Pre
ssur
e, M
Pa
Time, s
2
4
6
8
10
12
14
16
18
20
Tf
TbTf
Tem
pera
ture
, °C
Hydrate formation equilibrium temperature at 3.2 MPa
Te
600
630
660
690
720
750
780
810
840
870
900
Den
sity
, kg
/m3
0
100
200
300
400
500
600
700
800
900
1000
Flo
w ra
te, k
g/h
Fig. 8
0 2750 5500 8250 11000 13750 16500 19250 22000 24750 275002.0
2.5
3.0
3.5
4.0
4.5 Pressure
Temperature
Density
Flow rate
Pre
ssur
e, M
Pa
0
2
4
6
8
10
12
14
16
18
20
Hydrate formation equilibrium temperature at 4.1 MPa
600
630
660
690
720
750
780
810
840
870
900
Tf
Tb
Tf
Te
0
100
200
300
400
500
600
700
800
900
1000
Flow
rate
, kg/
h
Den
sity
, kg/
m3
Tem
pera
ture
, °C
Time, s
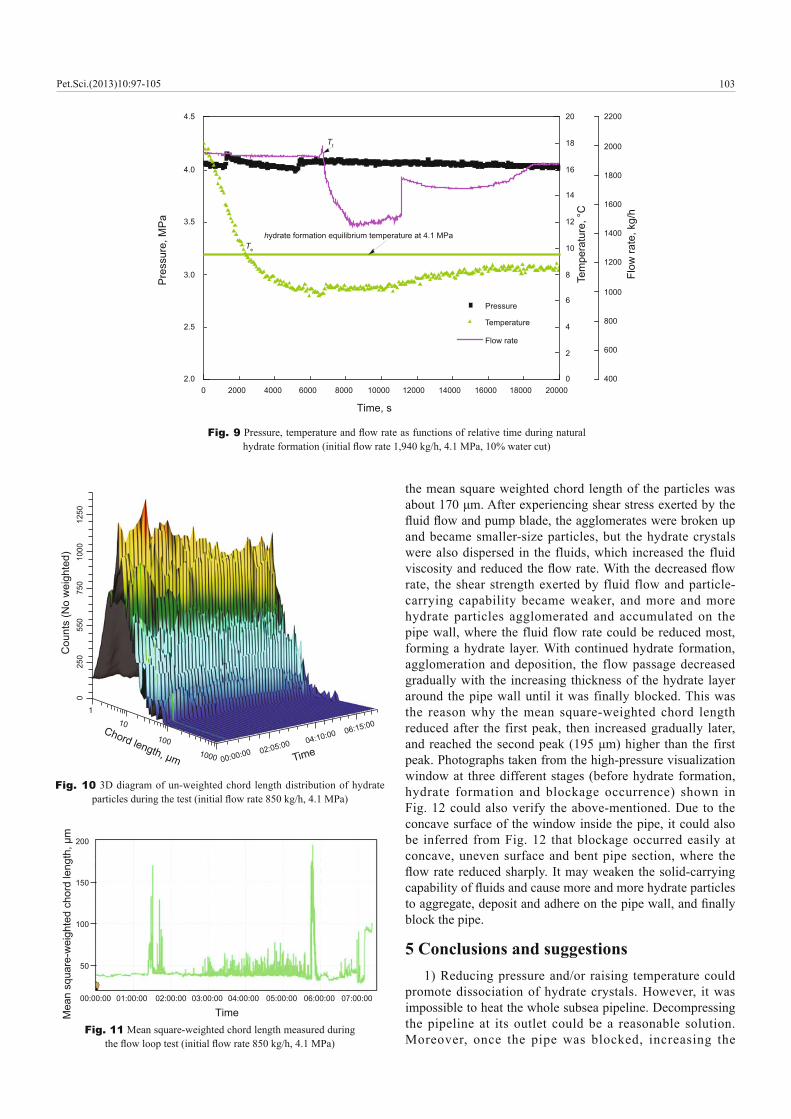
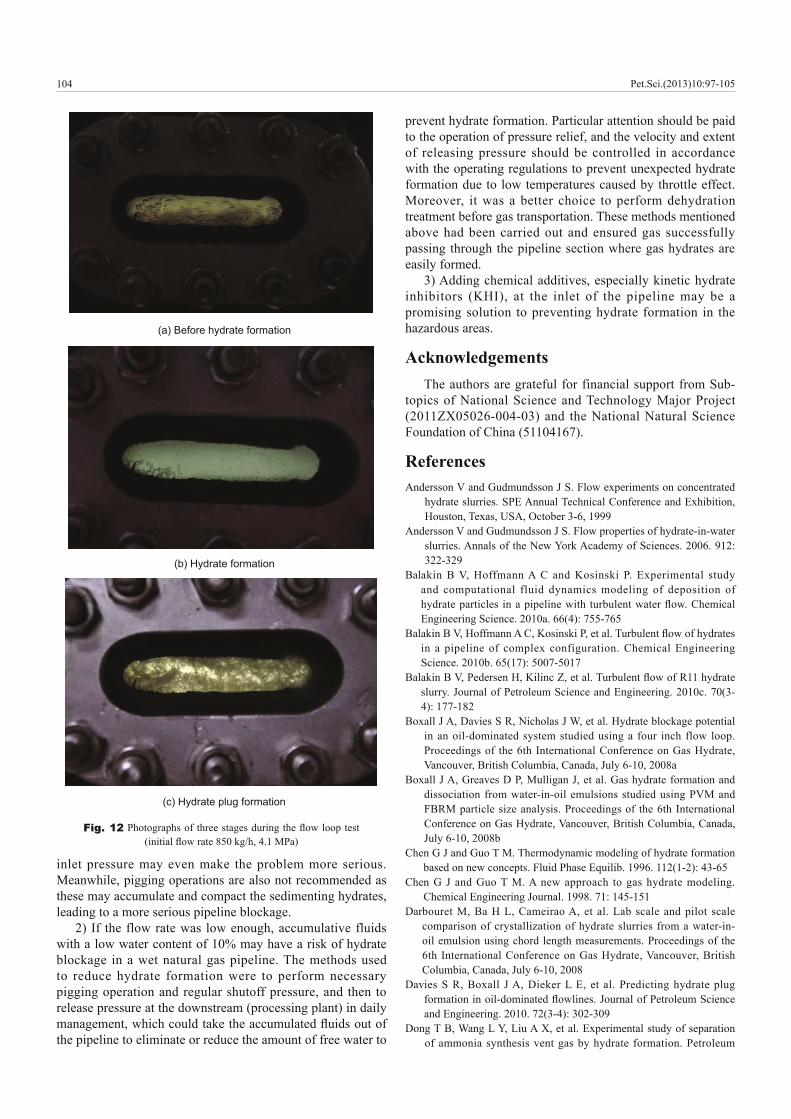
Fig. 10
1250
1000
750
550
250
0
110
1001000 00:00:00 02:05:00 04:10:00 06:15:00
Cou
nts
(No
wei
ghte
d)
0 2000 4000 6000 8000 10000 12000 14000 16000 18000 200002.0
2.5
3.0
3.5
4.0
4.5
Flow
rate
, kg/
h
Tem
pera
ture
, °C
Pressure
Temperature
Flow rate
Pre
ssur
e, M
Pa
Time, s
0
2
4
6
8
10
12
14
16
18
20
400
600
800
1000
1200
1400
1600
1800
2000
2200
Tf
hydrate formation equilibrium temperature at 4.1 MPaTe
Fig. 9
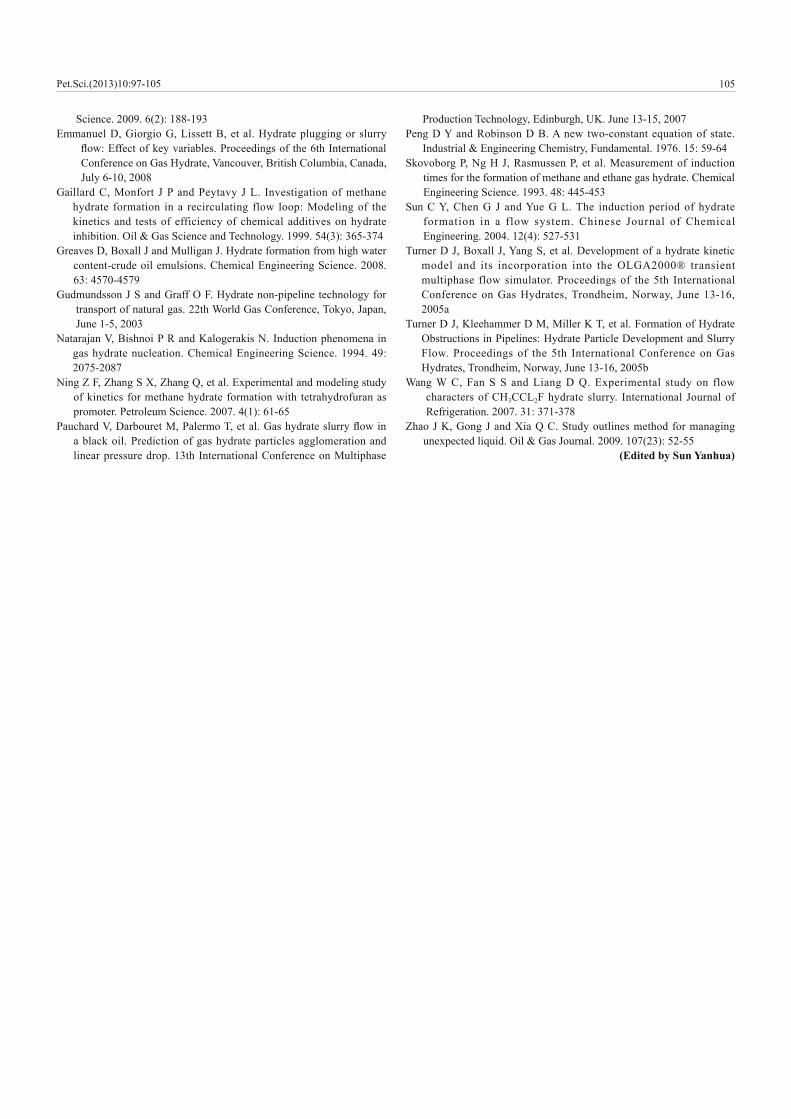
Fig. 11
200
150
100
50
00:00:00 01:00:00 02:00:00 03:00:00 04:00:00 05:00:00 06:00:00 07:00:00
104
Fig. 12
(a) Before hydrate formation
(b) Hydrate formation
(c) Hydrate plug formation
2