Embed Size (px)
Citation preview
Portland State University Portland State University
PDXScholar PDXScholar
Dissertations and Theses Dissertations and Theses
2-18-1977
A study of home range in two Neotoma fuscipes A study of home range in two Neotoma fuscipes
colonies in Klamath County, Oregon colonies in Klamath County, Oregon
Brent D. Frazier Portland State University
Follow this and additional works at: https://pdxscholar.library.pdx.edu/open_access_etds
Part of the Biology Commons
Let us know how access to this document benefits you.
Recommended Citation Recommended Citation Frazier, Brent D., "A study of home range in two Neotoma fuscipes colonies in Klamath County, Oregon" (1977). Dissertations and Theses. Paper 2546. https://doi.org/10.15760/etd.2545
This Thesis is brought to you for free and open access. It has been accepted for inclusion in Dissertations and Theses by an authorized administrator of PDXScholar. Please contact us if we can make this document more accessible: [email protected].
., '
AN ABSTRACT OF THE THESIS OF Brent D. Frazier for the Master of Science
in Biology presented February 18, 1977.
Title: A Study of the Home Range of 1foot.oma fuscipes in Two Colonies in
llama.th County", Oregon.
APPROVED BY MEMBERS OF THE THESIS COMMITTEE:
Richard B. orbes, Chairman
Robert Tinnin
Home ranges of dusky-footed wood.rats (Neotoma fuscipes) were deter
mined by the exclusive boundary strip method in two colonies 630 m apart
in Klamath County, Oregon. 2 The mean home range area was 1800 - 1900 m •
Densities or trees and shrubs were determined on selected home ranges and
densities of wood.rat houses and nests were determined on all home ranges.
No significant correlation was found between home range areas and densities
of various trees and shrubs, home range areas and densities of woodrat
houses and nests, or home range areas and weights of woodrats in those
areas.
No movement between colonies was observed.
A STUDY OF HOME RANGE IN TVl> NIDTOMA FUSCIPES
COLONI.ES IN KLAMATH COUNTY, ORlOOON
BRENT D. FRAZIER
A thesis submitted in partial fulfillment of the requirements for the degree of
MASTER OF SCIENCE in
BIOLOGY
Portland State University 1977
TO THE OFFICE OF GRADUATE STUDIES AND RESEARCH:
The msnbers Of the Committee approve the thesis of
Brent D. Frazier presented February 181 1977.
n
Ro e Tinnin
Jo~H. Wirtz
APPROVED:
Herman w. Taylar,
Stanley E. ~Dean~aduate Studies an searc dRe h
ACKNOWLEOOEMENTS
Gratitude is expressed to the Vector Control Section, Oregon
State Health Division for the use of the live traps used in this study.
I thank my wife, Nancy A. Frazier, for her assistance in the collection
of data, and Dr. Richard B. Forbes for his encouragenent and suggestions.
I also thank Dr. Robert o. Tinnin and Dr. John H. Wirtz for critical.fy
reading the thesis and Dr. Quentin D. Clarkson for his help in statis
tical application and analysis.
ACKNOWLEDClE?~NTS
LIST OF TABLES
LIST OF FIGURES
rnTRODUCTION
TABLE OF CONTENTS
DESCRIPTION OF STUDY AREA. AND METHODS
Description of Studjy' Area
Method
Methods of Data Analysis
RESULTS
Home Range
Movement Between Colonies
Behavioral Observations
Other Observations
DISCUSSION AND CONCLUSIONS
REFERENCES CITED
PAGE
iii
v
vi
1
4
4
6
7
9
9
16
16
17
27
29
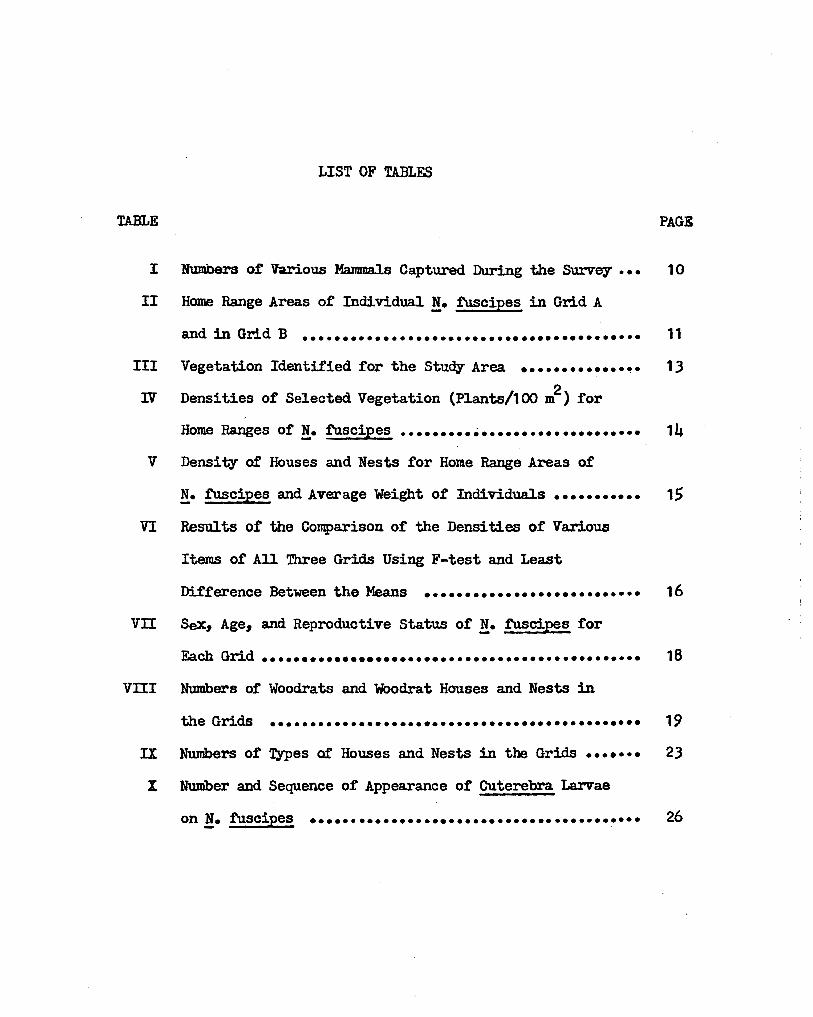
LIST OF TABLF.S
TABLE
I Numbers of Various Mammals Captured During the Survey •••
II Home Range Areas of Individual !!• fuscipes in Grid A
and in Grid B ••••••••••••••••••••••••••••••••••••••••••
III Vegetation Identified for the Study Area •••••••••••••••
IV Densities of Selected Vegetation (Plants/100 m2 ) for
Home Ranges of!!• .tnscipes ••••••••• ; ••••••••••••••••••••
v Density of Houses and Nests for Home Range Areas of
PAGE
10
11
13
14
!• .tnscipes and Average Weight of Individuals ........... 15
VI Results of the Comparison of the Densities of Various'
Items of All Three Grids Using F-test and Least
Difference Between the Means •••••••••••••••••••••••••••
Vll Sex, Age, and Reproductive Status of !!• .tnscipes for
16
Ea.ch Grid ••••••••••••••••••••••••••••••••••••••••••••••• 18
VllI
IX
x
Numbers of Woodrats and Woodrat Houses and Nests in
the Grids •••••••••••••••••••••••••••••••••••••••••••••• 19
Numbers of Types of Houses and Nests in the Grids •••••••
Number and Sequence of Appearance of Cuterebra Larvae
23
on N. i'uscipes ••••••••••••••••••••••••••••••••••••••••• 26
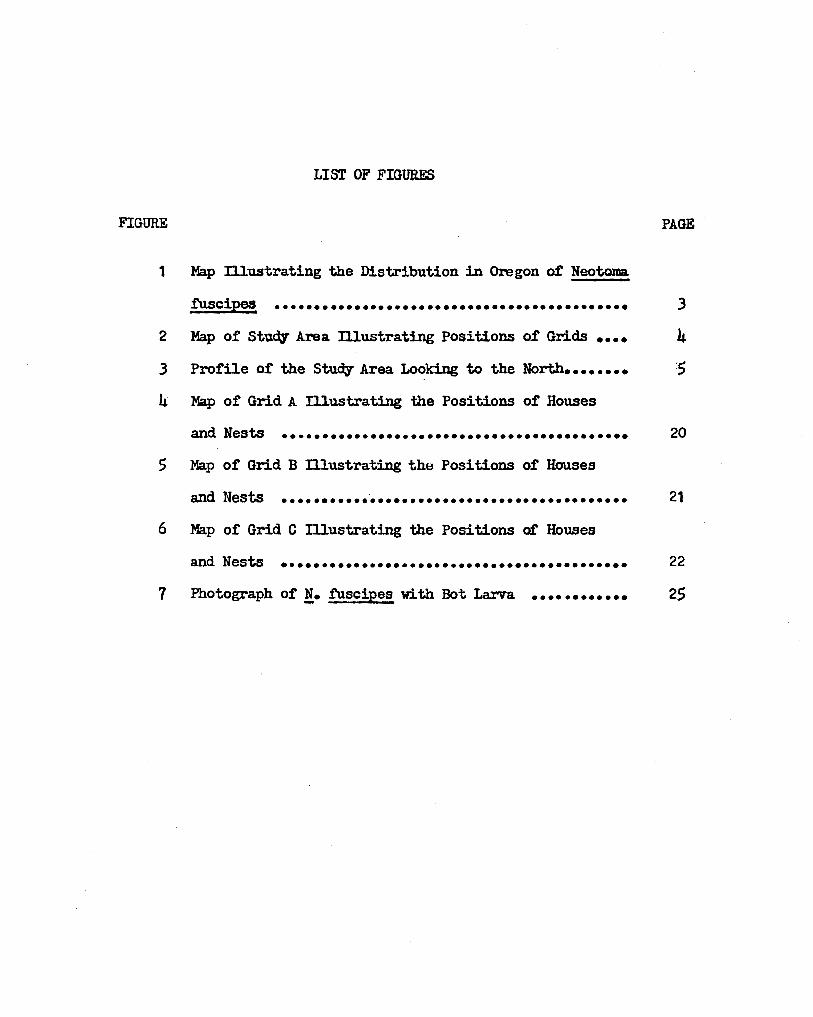
FIGURE
1
2
3
4
5
LIST OF FIGURE.S
Map Illustrating the Distribution in Oregon o£ Neotoma.
fuscipes ••••••••••••••••••••••••••••••••••••••••••••
Map of Stud;y Area Illustrating Positions o.£ Grids ••••
Profile o.£ the Study Area Looking to the North ••••••••
Map of Grid A Illustrating the Positions of Houses
and Nests •••••••••••••••••••••••••••••••••••••••••••
Map of Grid B Illustrating the Positions of Houses
and Nests •••••••••••••••••••••••••••••••••••••••••••
6 Map of Grid C Illustrating the Positions o:f Houses
and Nests •••••••••••••••••••••••••••••••••••••••••••
7 Photograph of!!• fuscipes with Bot Larva ••••••••••••
PAGE
3
4
:s
20
21
22
25
INTRODUCTION
Burt (1943) defined home range as that area transversed by the in
dividual in its normal activities of food gathering, mating, and caring
for young. Hayne (1949), Stickel (1954), Calhoun and Casby (1958), and
Ambrose (1969) reviewed and discussed methods or calculating home ranges
of small mammals. Many factors may influence the size or home range in
cluding sex, age, season, population density (Burt 1943), weight of mam
mal (McNab 1963), food supply, cover, territoriality, and other factors
(Stickel 1954).
Much has been published about the natural history of woodrats
(Dixon 1919, English 1923, Gander 1929, Donat 1933, Vestal 1938, Lay and
Baker 19.38, Horton and Wright 1944, Pearson 1952, Fitch and Rainey (19.56),
Rainey 1956, Vogl ·1967, Stones and Hayward 1968, Cameron 1971 1 Cameron
and Rainey 1972). Home ranges and movements of the dusky-footed woodrat,
Neotoma fuscipes (Vestal 1938, Linsdale and Tevis 1951, Smith 1965), and
other woodrats (Dixon 1919, Lay and Baker 19.38, Pearson 1952, Fitch and
Rainey 1956, Ireland and Hays 1969) have been studied. I found no studies
that attempted to determine which factors influence the home range size
of woodrats. Vegetation provides food (English 1923, Gander 1929, Horton
and Wright 1944) and cover (Horton and Wright 1944, Fitch and Rainey
1956) for the woodrats. Vegetation also provides material for the struc
tures called "houses" or "lodges" constructed by the woodrats and material
and shelter for nests not in woodrat houses (English 1923, Horton and
Wright 19hli, Linsdale and Tevis 1956, NetUeton 1957, Vogl 1967, Hammer
and Maser (1973). The density and the size of the vegetation may in
fluence the location of woodrats (Murray and Barnes 1969). Woodrats
appear to be colonia1 (Pearson 19.52) yet I could ,find no statement in
the literature concerning m::>vement between colonies.
In Oregon (see Figure 1 ), the dusky-footed wood.rat, Neotoma
fu.scipes, ranges from near the Columbia River south to Ca1ifornia west
of the Cascade crest (Hooper 1938 ). East of the Cascades this species
2
. ranges east to western Lake County and north to the Sprague River (Hammer
arrl Maser 1973). In western Oregon, !!• fu.scipes occupies brush thickets
along streams and roads and mixed coniferous forest or dense oak wood
land. F.ast of the Cascades !!• f'uscipes occupies primarily juniper
(Juniperus sp.) woodland (Hammer and Maser 1973).
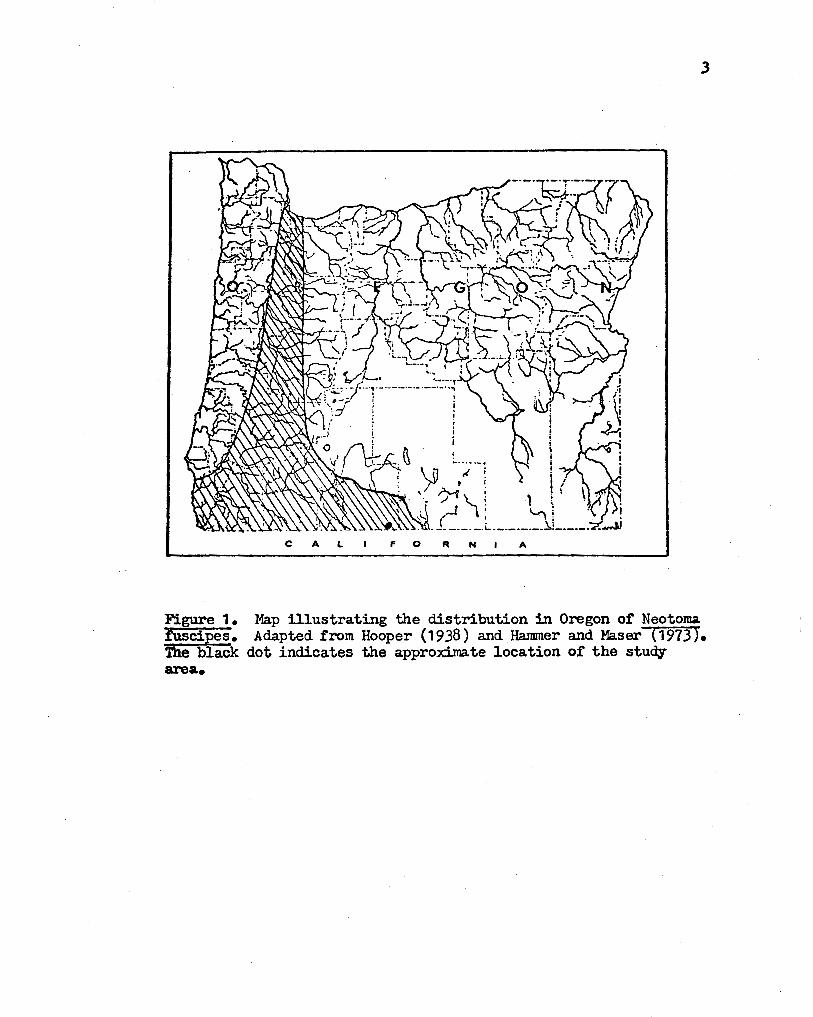
Figure 1. l'UScipes. The black area.
3
C A L F 0 R N A
Map illustrating the distribution in Oregon of Neotoma Adapted from Hooper ( 19 38 ) and Hammer and Maser ( 197 3).
dot indicates the approximate location of the study
DF.SCRIPTION OF STUDY ARFA. AND METHODS
DF.SCRIPTION·OF STUDY AREA.
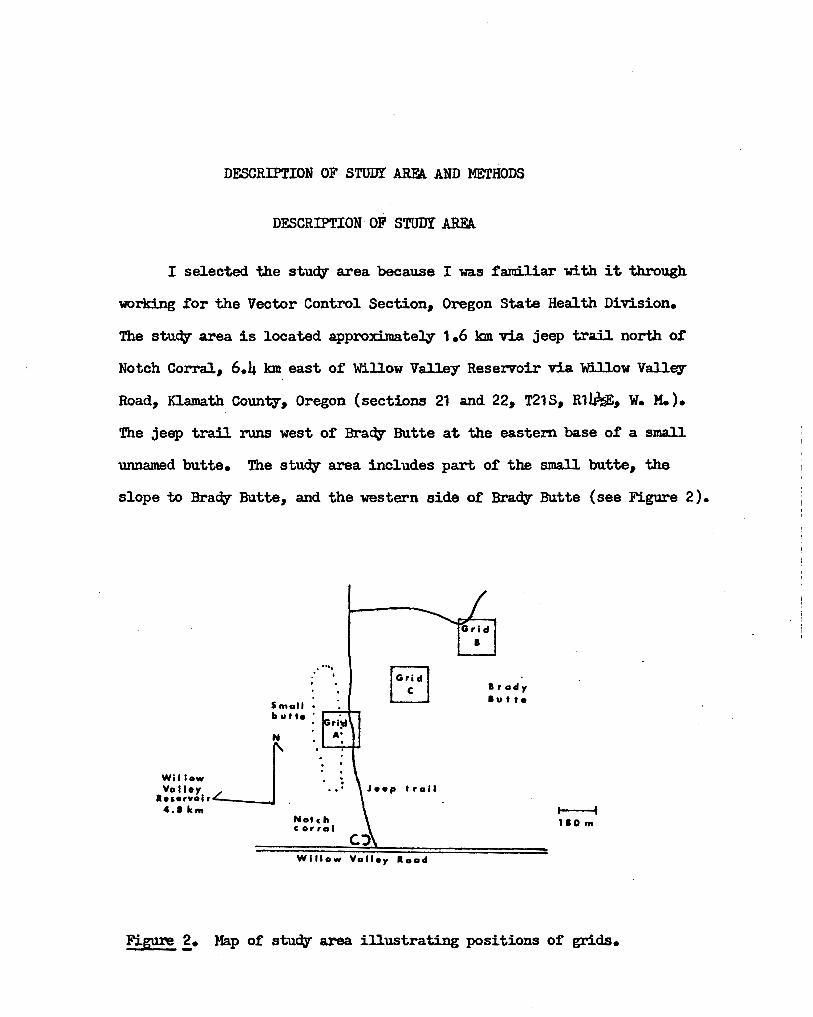
I selected the study area because I was familiar with it through
working for the Vector Control Section, Oregon State Health Division.
The study area is located approximately 1.6 km via jeep trail north of
Notch Corral, 6.4 km east of Willow Valley Reservoir via Willow Valley
Road, Klamath County, Oregon (sections 21 and 22, T21S, R1~, w. M.).
The jeep trail runs west of Brady Butte at the eastern base of a small
wmamed butte. The study area includes part or the small butte, the
slope to Brad;y Bu.tte, and the western side of Brady Butte (see Figure 2) •
5 mall • butte ·
N
. ···· .
Willow~ Valley
leservolr . 4.1 lcm
Nate h corral
tr all
Willow Valley laad
lrady lutte
~ 110 m
Figure ~· Map of study area illustrating positions of grids.
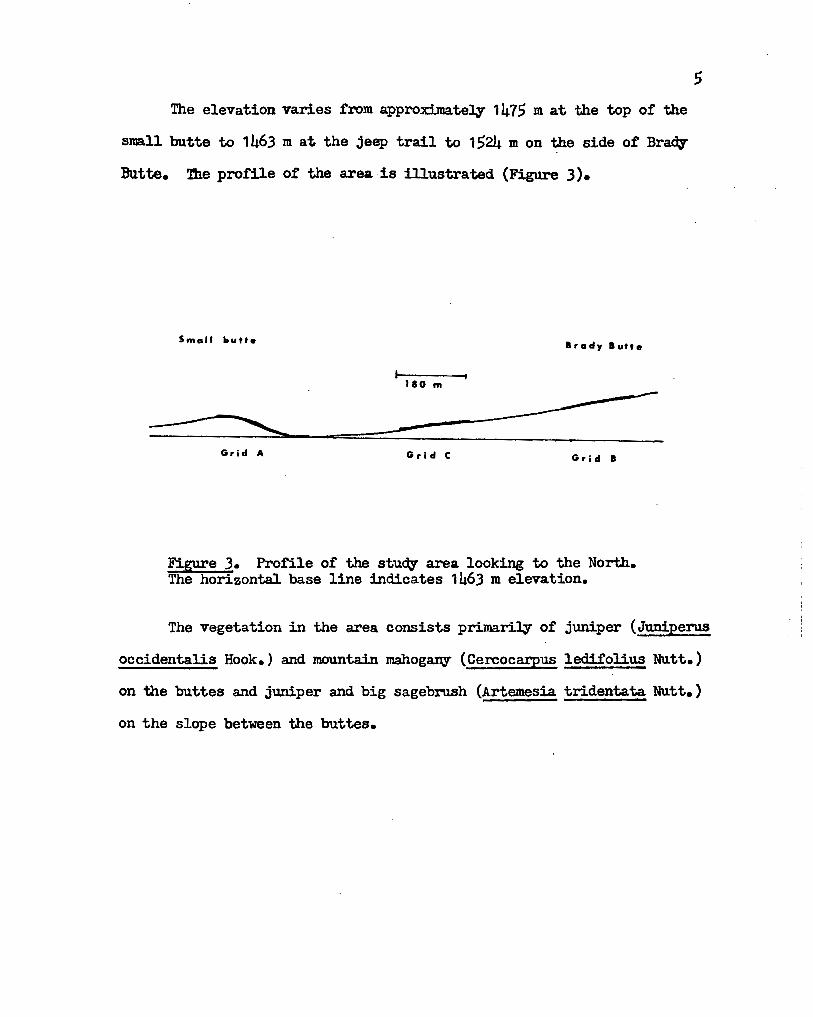
The elevation varies from approximately 1475 mat the top of the
small butte to 1463 m at the jeep trail to 1524 m on the side of Bra.d1'
Butte. '.l'he profile of the area is illustrated {Figure 3).
Small butte Ira dy I utt e
110 m
.Grid A Grid C Grid I
Figure 3. Profile of the stuczy- area looking to the North. The horizontal base line indicates 1463 m elevation.
The vegetation in the area consists primarily of juniper (Juniperus
occidentalis Hook.) and mountain mahogany (Cercocarpus ledifolius Nutt.)
on the buttes and juniper and big sagebrush (Artemesia tridentata Nutt.)
on the slope between the buttes.
METHOD
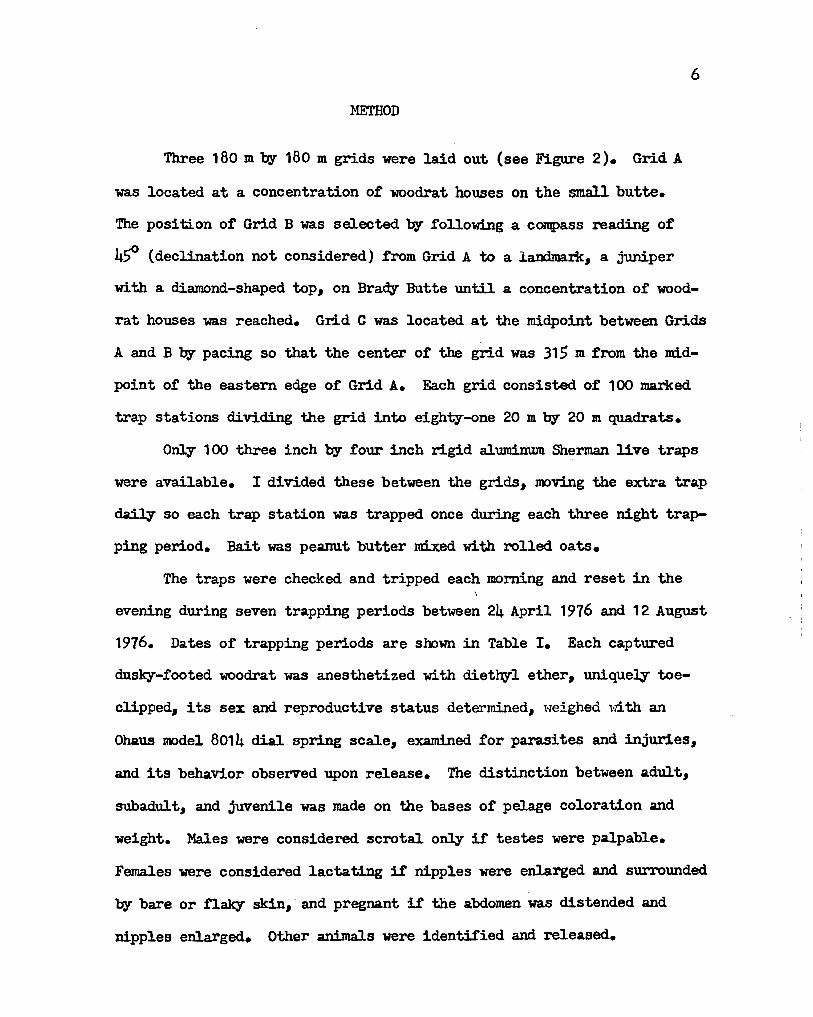
Three 180 m by 180 m grids were laid out (see Figure 2). Grid A
was located at a concentration of woodrat houses on the small butte.
The position of Grid B was selected by following a compass reading of
6
45° (declination not considered) from Grid A to a J.andmark., a juniper
with a diamond-shaped top., on Brady Butte until a concentration of wood
rat houses was reached. Grid C was located at the midpoint between Grids
A and B by pacing so that the center of the grid was 315 m from the mid
point of the eastern edge of Grid A. Each grid consisted of 100 marked
trap stations dividing the grid into eighty-one 20 m by 20 m quadrats.
Orey 100 three inch by four inch rigid aluminwn Sherman live traps
were available. I divided these between the grids., iooving the extra trap
daily so each trap station was trapped once during each three night trap
ping period. Bait was peanut butter mixed with rolled oats.
The traps were checked and tripped each morning and reset in the
evening during seven trapping periods between 24 April 1976 and 12 August
1976. Dates of trapping periods are shown in Table I. Each captured
dusky-footed woodrat was anesthetized with diethyl ether., uniquely toe
clipped., its sex and reproductive status determined., weighed i·dth an
Ohaus ioodel 8014 dial spring scale., examined for parasites and injuries,
and its behavior observed upon release. The distinction between adult,
subadult, and juvenile was made on the bases of pelage coloration and
weight. Males were considered scrotal orey if testes were palpable.
Females were considered lactating if nipples were enlarged and surrounded
by bare or Ilaky skin, · and pregnant if the abdomen was distended and
nipples enlarged. Other animals were identified and released.
7
Living an~ dead trees and living s}gubs were counted for each quadrat.
Tree diameters -were measured 20 - 30 cm from -ground -level (limbs -made
chest level measurement difficult). Grasses and small herbaceous plants '
were identified using Hayes and Garrison (1960)1 Hitchcock and Cronquist
(1973); -and Taylor-and Valura. (1974).,--but were not counted. - A collection
or plants was not made.
Because the number of woodrat houses and nests could be a means of
estimating wood.rat density and could be related to home range size, they
were mapped for each grid and if they were within 20 m of the grid edges.
Activity was detennined by' the presence of fresh scats and vegetation
clippin~1 ~~ condition of the house, ~g _woodra.t noise as discussed by'
Stones and Hayward (1968). Materials used in the houses were noted.
METHODS OF DATA ANALYSIS
The widely accepted method of .. home range calculation, a density
probability function (Calhoun and Casby' 1958 ) assumes a circular home
range. In this case this is unl.ike]J" because woodrats probably do not
forage randomly in all directions from the house (Fitch and Rainey 1956).
Also, this method does not lend itself to the mapping of items within
the determined range. Accordingly, I decided to use the exclusive boun
dary strip method described b;y Stickel (1954). Home ranges were mapped
for each !• fuscipes with two or more different captur~ point.a and approx-:
imate densities of counted vegetation were determined for each home
range by' multiplying the absolute number of a particular tree or shrub
in a quadrat by' the portion of that quadrat included in the home range
and adding the portions to obtain a density for the total home range.
This does not take into account clumping of vegetation but alternatives
were too time consuming for this stuey.
8
Wood.rat houses and nests were mapped for each grid so the nwnber of
houses and nests per home range was readily determined by drawing the
home range shape over the appropriate map of houses and nests.
RESULTS
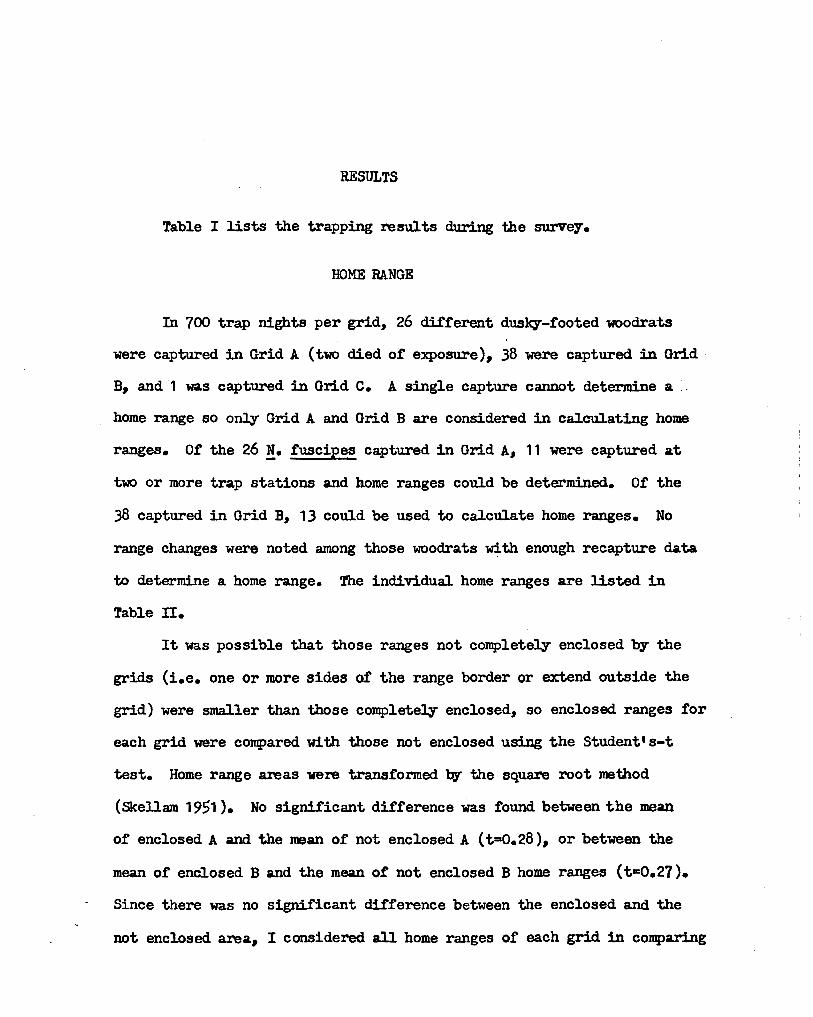
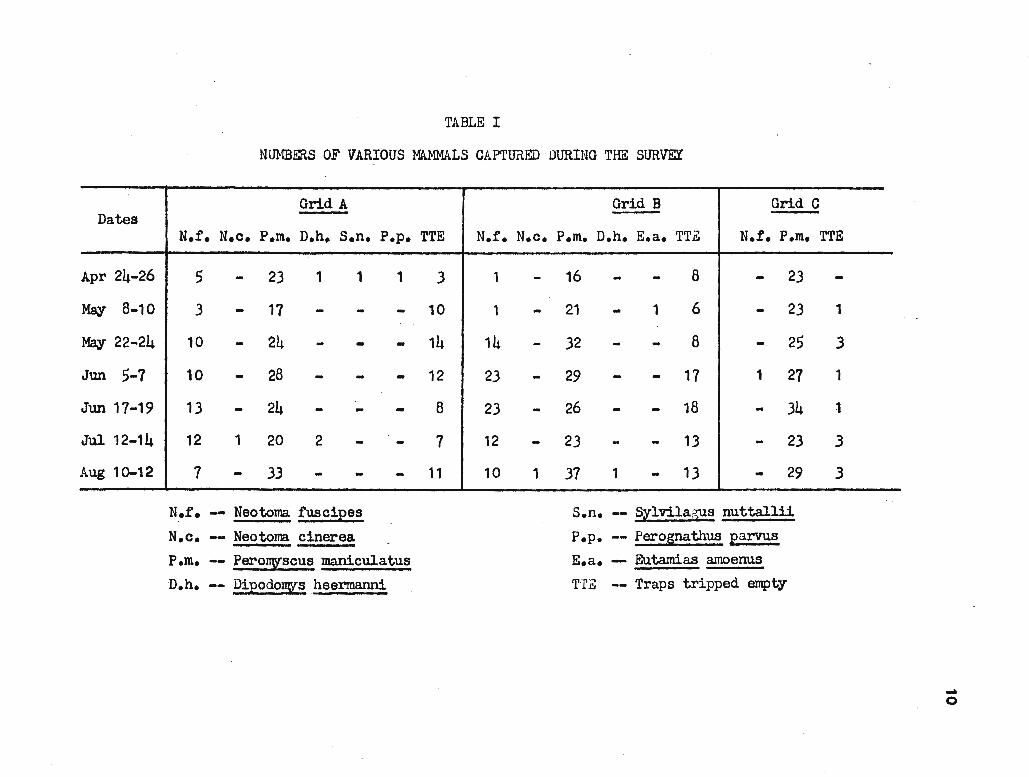
Table I lists the trapping results during the survey.
HOME RANGE
In 700 trap nights per grid, 26 d:Lff erent dusky-footed woodrats
were captured in Grid A (two died or exposure), 38 were captured in Grid ·
B, and · 1 was captured in Grid C. A single capture cannot determine a • .
home range so only Grid A and Grid B are considered in calculating home
ranges. or the 26 !• ruscipes captured in Grid A, 11 were captured at
two or more trap stations and home ranges could be determined. or the
38 captured in Grid B, 13 could be used to calculate home ranges. No
range changes were noted among those woodrats with enough recapture data
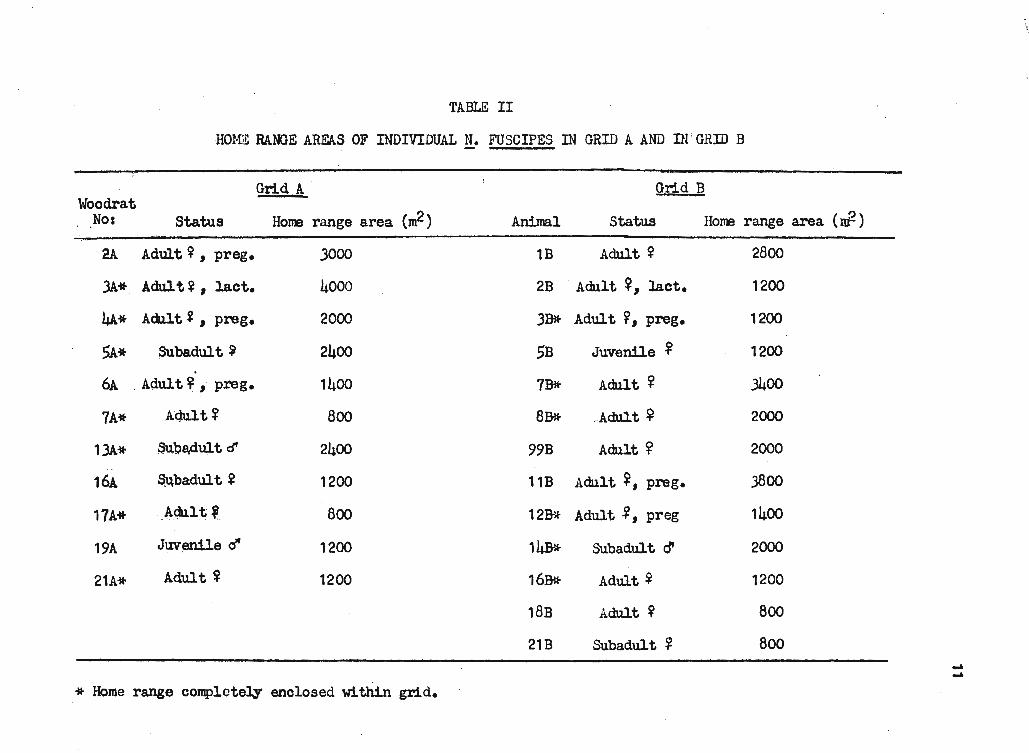
to determine a home range. '!'he individual home ranges are listed in
Table II.
It was possible that those ranges not completely enclosed by the
grids (i.e. one or more sides or the range border or extend outside the
grid) were smaller than those completely enclosed, so enclosed ranges for
each grid were compared with those not enclosed using the Student•s-t
test. Home range areas were transformed by the square root method
(Skellam 1951 ). No significant difference was found between the mean
of enclosed A and the mean of not enclosed A (t=0.28), or between the
mean of enclosed B and the mean of not enclosed B home ranges (t•0.27).
Since there was no significant difference between the enclosed and the
not enclosed area, I considered all home ranges of each grid in comparing
Dates
Apr 24-26
May 8-10
May 22-24
Jun 5-7
Jun 17-19
Jul 12-14
Aug 10-12
TABLE I
NUMBERS OF VARIOUS MAMMALS CAPTURED DURING THE SURVEY
Grid A Grid B Grid C
N.f. N.c. P.m. D.h. S.n. P.p. TTE N.f. N.c. P.m. D.h. E.a. TTE N.f. P.m. TTE
5 - 23 1 1
3 - 17 - -10 - 24 - -10 - 28 - -13 24
.. - - -12 1 20 2 -7 - 33 - -
N.r. -- Neotorna fuscipes
N.c. -- Neotoma cinerea
1
------
P.m. -- PerolT\Y'scus maniculatus
D.h. -- DipodolT\Y's heermanni
3
10
14
12
8
7
11
1 -1 -
14 -23 -23 -12 -10 1
16 - - 8 - 23
21 - 1 6 - 23
32 - - 8 - 25
29 - - 17 1 27
26 - - 18 - 34
23 - - 13 - 23
37 1 - 13 - 29
s.n. -- Sylvilagus nuttallii
P.p. -- Perognathus parvus E.a. - Eutamias amoenus
TTZ -- Traps tripped empty
-1
3
1
1
3
3
.... 0
r---=~~"'----~ _:) ...
TABLE II
HOME RANGE AREAS OF INDIVIDUAL N. FUSCIPES IN GRID A AND nr GRID B
12
the means of the home ranges of the tw grids. No significant difference
was found (t=0.04). The mean home range area of!!• f'uscipes is calculated
to be between 1800 and 1900 m2
with a minimum of 800 m2 and a maximum of
4000 m2•
The vegetation identified for the study area is listed in Table IlI.
To test the possible interaction between vegetation density and home
range area, only enclosed home ranges were considered (see Table IV).
Using product-moment correlation, no significant correlation was found
between home range areas and the densities of all junipers (r=0.29)1
live junipers (r=0.07), all junipers with diameter greater than 35 cm
(r=0.38), live mountain mahogany (r=-0.01), all zoountain mahogany (r=0.01),
currant (r=0.03)1 green rabbitbrush (r=-0.34), grey rabbitbrush (r=0.09)1
bitterbrush (r=-0.29), or big sagebrush (r=0.24). Ponderosa pine, ser-
Vice berry, and 10.ama th plUJn were not included because they were present
in Grid B only.
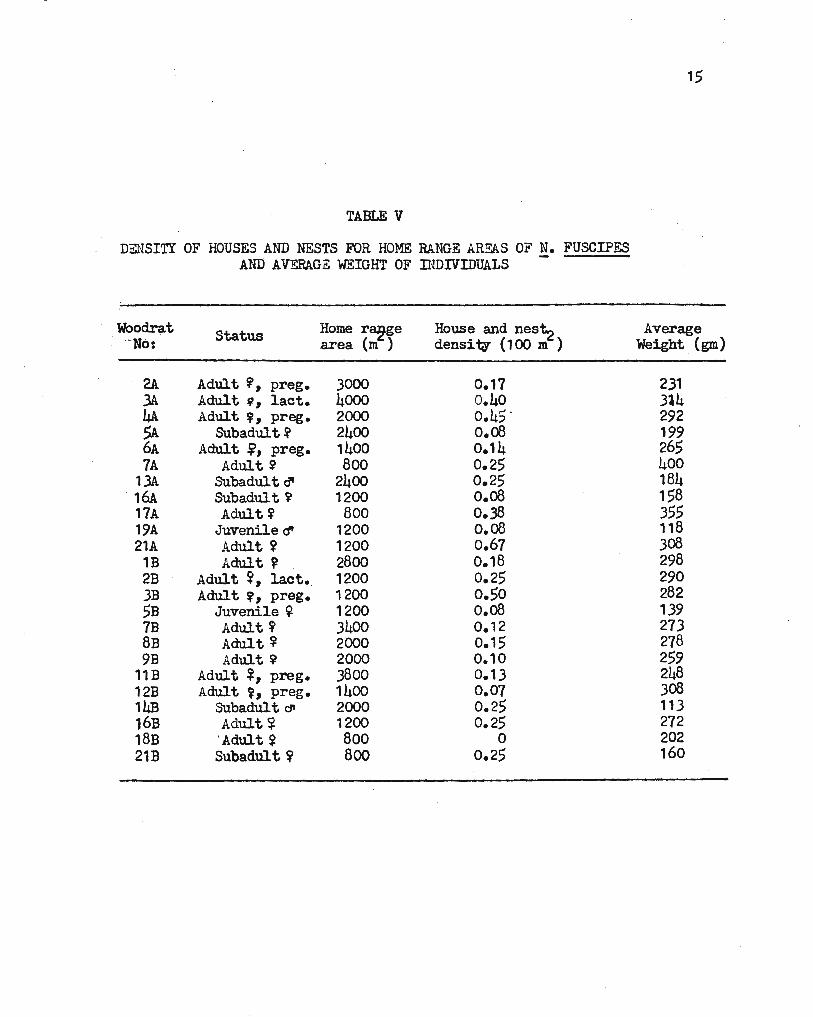
All home ranges were used in finding if home range size is related
to woodrat house and nest densities (Table V). The density of all houses
and nests, active and inactive in each home range, was used. No signi-
ficant correlation was found (r=-0.08).
There was no significant correlation (r=0.02) between all home
range areas and the average weight or the .animals in those home ranges
(Table V).
All three grids were compared with regard to neasured vegetation.
The grids were each divided into nine rows of qua.drats and the densities
of vegetation determined for each row. The grids were compared using
the F-test and least difference between the means (Table VI).
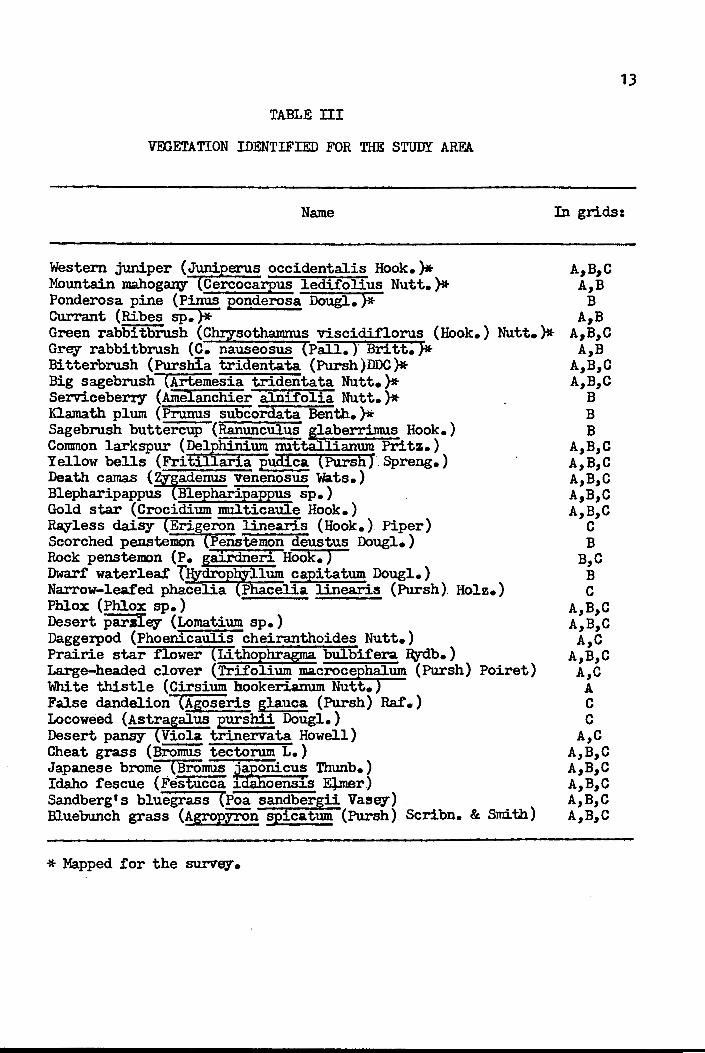
TABLE III
VIDETATION IDENTIFIED FOR THE STUDY AREA
Name
Western juniper (Juniperus occidental.is Hook.)*Mountain mahoga.IliY ( Cercocarpus ledi:f olius Nutt. )* Ponderosa pine (Pinus ponderosa Dougl. )* Currant (Ribes sp. )* Green rabbitbrush (C sothamnus viscidi:florus (Hook.) Nutt.)* Grey rabbitbrush (C. nauseosus Pall.)" Britt.}* Bitterbrush (Purslrla tridentata (Pursh)DDC}* Big sagebrush (Artemesia tridentata Nutt.)* Servicebeny (Amelanchier alni.i'olia Nutt.)* Klamath plum (Prunus subcordata Benth. )* Sagebrush buttercup (Ranunculus glaberrimus Hook.) Common larkspur (Delphinium nuttallianum Pritz.) Yellow bells (Fritillaria pudica (PurshY Spreng.) Death camas {Zy~adenus venenosus Wats.) BlepharipappusBlepharipappus sp. ) Gold star ( Crocidium mul ticaule Hook. ) Rayless daisy (Erigeron linearis (Hook.). Piper) Scorched penstemon (Penstemon deustus Dougl.) Rock penstemon (P. airdnerl Hook.) Dwarf waterleaf r dro lum capita tum Dougl. ) Na.ITow-leafed phace ia P celia linearis (Pursh). Holz.) Phlox (Phlox sp.) Desert paraley (Lomatium sp. ) Daggerpod (Phoenicaulis cheiranthoides Nutt.) Prairie star flower (Lithophragma. bulbifera Izy"db.) Large-headed clover (Trifolium macrocephalum (Pursh) Poiret) White thistle (Cirsium hookerianum Nutt.) False dandelion (Agoseris glauca (Pursh) Raf.) Locoweed {Astragalus purshii Dougl.) Desert pansy (Viola trinervata Howell) Cheat grass (Bromus tectorum L.) Japanese brome . (Bromus i(fuhnicus Thunb.) Idaho fescue (Festucca oensis E}.mer) Sandberg•s bluegrass (Poa sandbergii Vasey) Bluebunch grass {AgroplfOn spicatum {Pursh), Scribn. & Smith)
* Mapped for the survey.
13
In grids:
A,B,C A,B
B A1 B
A,B,C A,B
A,B,C A,B,C
B B B
A,B,C A,B,C A,B,C A,B,C A,B,C
c B
B,C B c
A,B,C A,B,C
A,C A,B,C
A,C A c c
A,C A,B,C A,B,C A,B,C A,B,C A,B,C
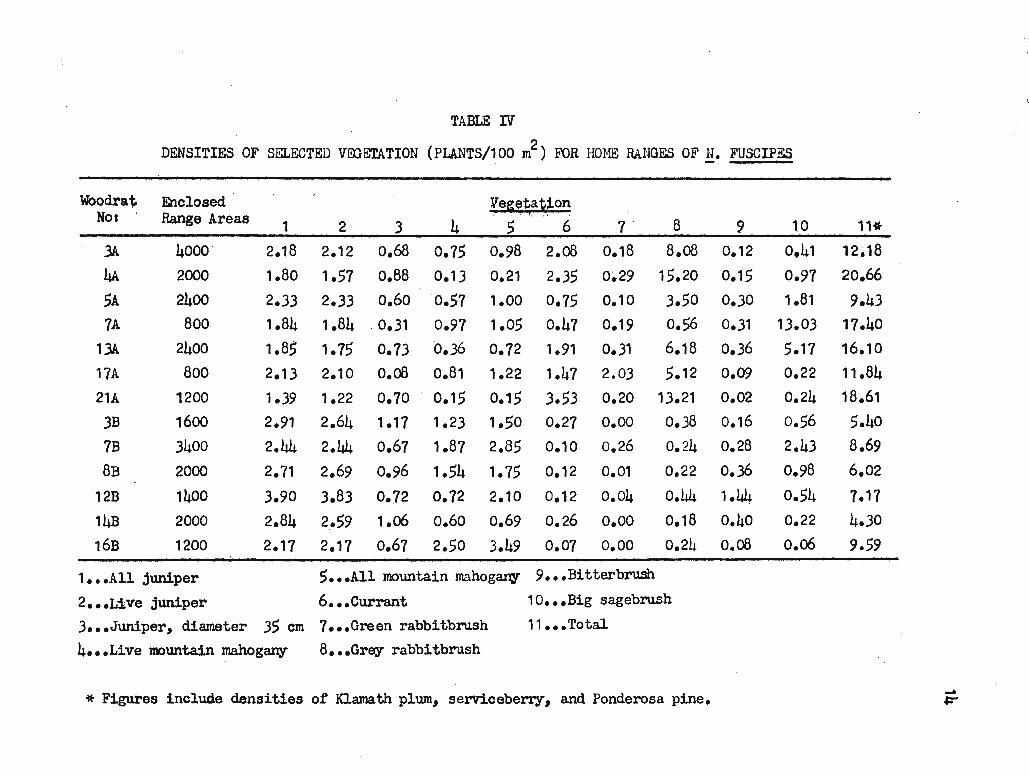
TABLE I:V
DENSITIES OF SELECTED VIDETATION (PLANTS/100 m2) FOR HOME RA.NOES OF.!!• FUSCIPES
Woo<;lra~ Enclosed Vegetation Nor Range Areas 1 2 3 4 . 5 . '· . . 6 7 . 8 9 l 0 11 *
3A 4000 2.18 2.12 o.68 0.75 0.98 2.08 0.18 8.08 0.12 o.41 12~18
4A 2000 1.80 1.57 o.88 0~13 0.21 2.35 0~29 15.20 o.15 0.97 20.66
5A 2400 2.33 2.33 0.60 0.57 1.00 0.75 0.10 3.50 0.30 1.81 9.43
7A Boo 1.84 1.84 . 0.31 0.97 1.05 o.47 0.19 o.56 0.31 13.03 11.40
13A 2400 1.85 1.75 0.13 o • .36 0.12 1.91 0.31 6.18 0.36 5.11 16.10
17A 800 2.13 2.10 0.08 0.81 1.22 1.47 2.03 5.12 0.09 0.22 11.84
21A 1200 1.39 1.22 0.70 0.15 0.15 3.53 0.20 13.21 0.02 0.24 18.61
3B 1600 2.91 2.64 1.17 1.23 1.50 0.27 0.00 0.38 0.16 0.56 5.40
7B 3400 2.44 2.44 o.67 1.87 2.85 0.10 0.26 0.24 0.28 2.43 8.69
BB 2000 2.71 2.69 0.96 1.54 1.75 0.12 0.01 0.22 0.36 0.98 6.02
12B 1400 3.90 3.83 0.72 0.12 2.10 0.12 o.o4 o.44 1.44 o.54 1.11 . .
14B 2000 2.84 2_.59 1.o6 0.60 o.69 0.26 o.oo 0.18 0.40 0.22 4.30
16B 1200 2.11 2.11 o.67 2.50 3.49 0.01 o.oo 0.24 o.08 o.o6 9.59
1 ••• All juniper 5 ••• All mountain mahogany 9 ••• Bitterbrush
2 ••• v1ve juniper 6 ••• Currant 1 o ••• Big sagebrush
3 ••• Juniper, diameter 35 cm ? ••• Green rabbitbrush 11 ••• Total
4 ••• Live mountain mahogany 8 ••• Grey rabbitbrush
* Figures include densities of Klamath plum, serviceberry, and Ponderosa pine. ~
15
TABLE V
DENSITY OF HOUSES AND NESTS FOR HOME RANGE AREAS OF N. FUSCIPES AND AVERAGE WEIGHT OF INDIVIDUALS -
Wood.rat Status Home r~ge House and nes~ Average '"NO: area (m ) densiw (100 m ) Weight {gm)
2A Adult ~, preg. 3000 0.17 231 3A Adult ~, lact. 4000 0.40 314 4A Adult ~ 1 preg. 2000 0.45 · 292 5A Subadult~ 2400 o.08 199 6A Adult ~' preg. 1400 0.14 265 7A Adult~ 800 0.25 400
13A Subadult d' 2400 0.25 184 16A Subadult ~ 1200 o.08 158 17A Adult~ 800 0.38 355 19A Juvenile <!' 1200 o.08 118 21A Adult~ 1200 o.67 308
1B Adult $! 2800 0.18 298 2B Adult ~, lact. 1200 0.25 290 3B Adult ~, preg. 1200 0.50 282 5B Juvenile 9 1200 o.08 139 7B Adult~ 3400 0.12 273 BB Adult~ 2000 0.15 278 9B Adult~ 2000 0.10 259
11 B Adult ~' preg. 3800 0.13 248 12B Adult ~' preg. 1400 0.01 308 14B Subadul t C!' 2000 0.25 113 16B Adult~ 1200 0.25 272 18B ' Adult~ 800 0 202 21B Subadult ~ 800 0.25 160
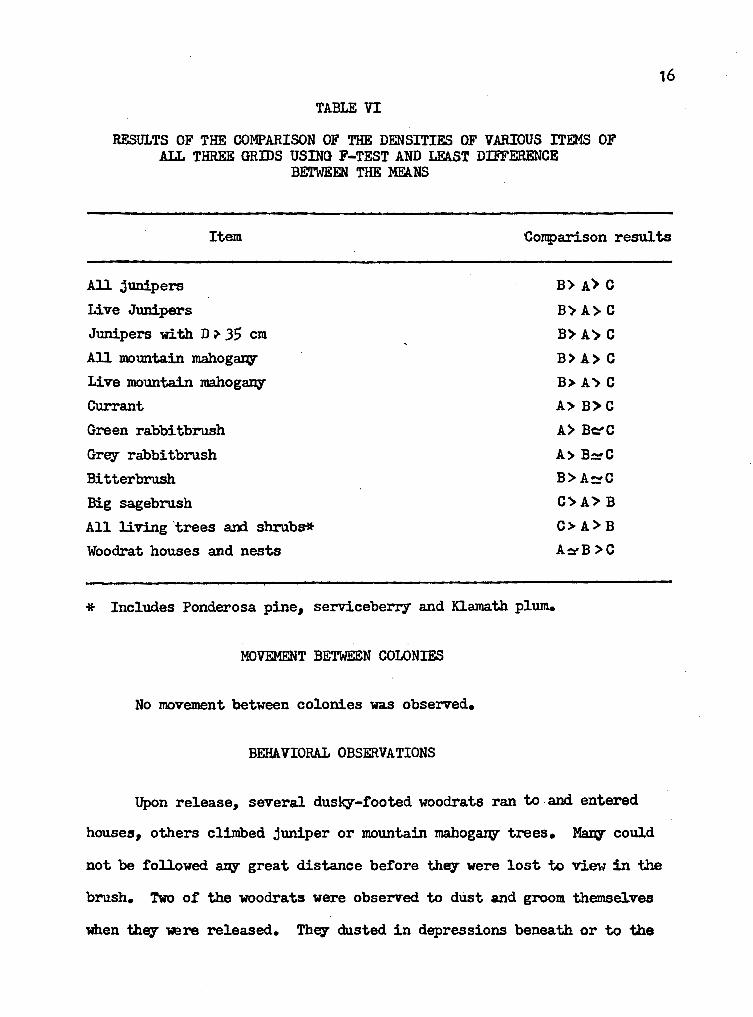
TABLE VI
RESULTS OF THE COMPARISON OF THE DENSITIES OF VARIOUS ITEMS OF ALL THREE GRIDS USING F-TEST AND LEAST DIFFERENCE
BETWEEN THE MEANS
16
Item ·Comparison results
All junipers
Live Junipers
Junipers with D > 35 cm
All mountain mahogan;y
Li Ve mowitain mahogan;y
Currant
Green rabbitbrush
Grey rabbitbrush
Bitterbrush
Big sagebrush
All living 'trees a.rd shrub8*
Woodrat houses 8'd nests
* Includes Ponderosa pine, serviceberry and Klamath plum.
MOVEMENT BETWEEN COLONIES
No movement between colonies was observed.
BEHAVIORAL OBSERVATIONS
B> A°> C
B)A> C
B> A> C
B> A> C
B> A"> C A> B>C
A> BC'C
A> B!::."C B> A::'C
C>A">B C>A>B
A~B>C
Upon release, several dusky-footed woodrats ran to .and entered
house81 others climbed juniper or mowitain mahogan;y trees. Many could
not be followed ailY' great distance before they were lost to view in the
brush. Two of the woodrats were observed to dust and groom themselves
when they -were released. They dusted in depressions beneath or to the
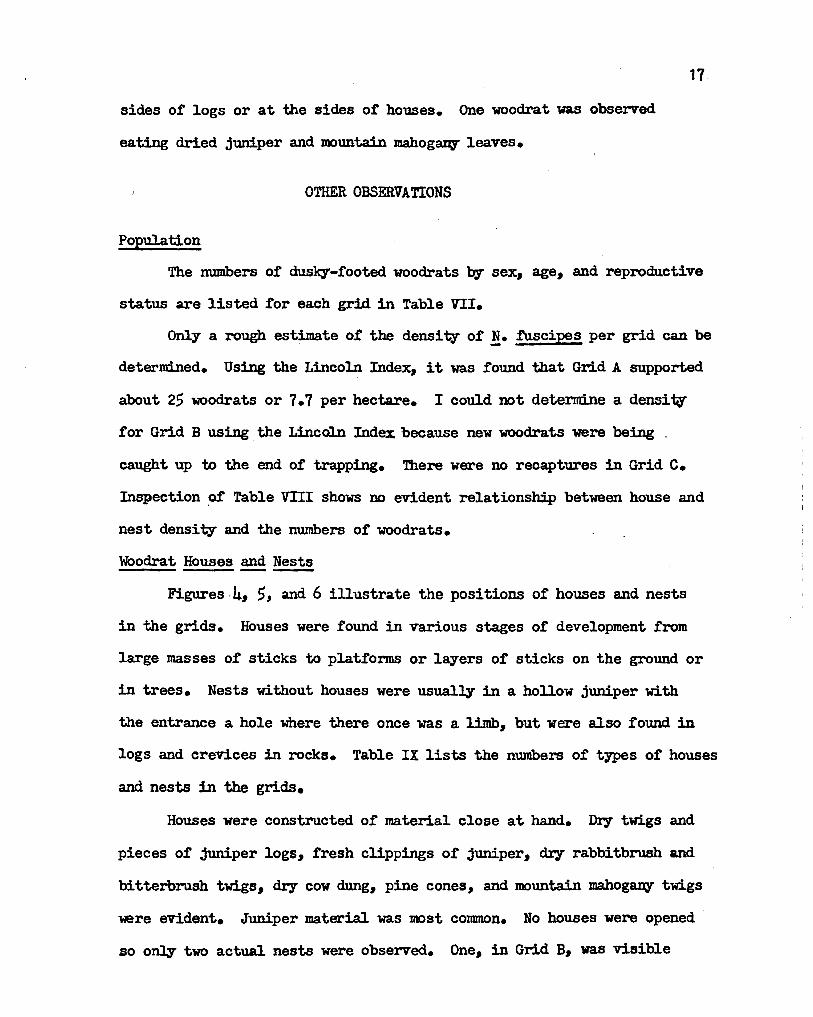
sides of logs or at the sides or houses. One woodrat was observed
eating dried juniper and mountain mahogan;r leaves.
OTHER OBSERVATIONS
Population
17 .
The numbers of dusky-tooted woodrats by se;x:, age, and reproductive
status are listed for each grid in Table VII.
Only a rough estimate or the density or !• f'uscipes per grid can be
determined. Using the Lincoln Index, it was found that Grid A supported
about 25 wodrats or 7.7 per hectare. I could not determine a density
for Grid B using the Lincoln Index. because new wood.rats were being _
caught up to the end of trapping. There were no recaptures in Grid c.
Inspection ~f Table VIII shows no evident relationship between house and
nest density and the numbers of woodrats.
Woodrat Houses and Nests
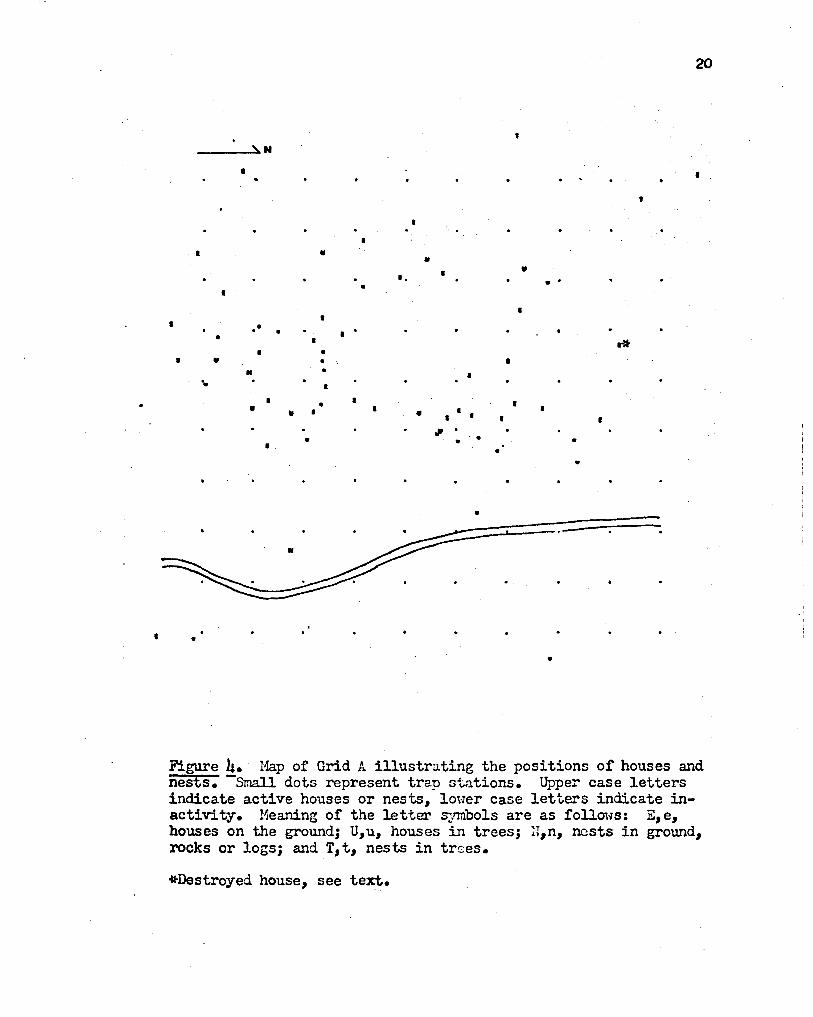
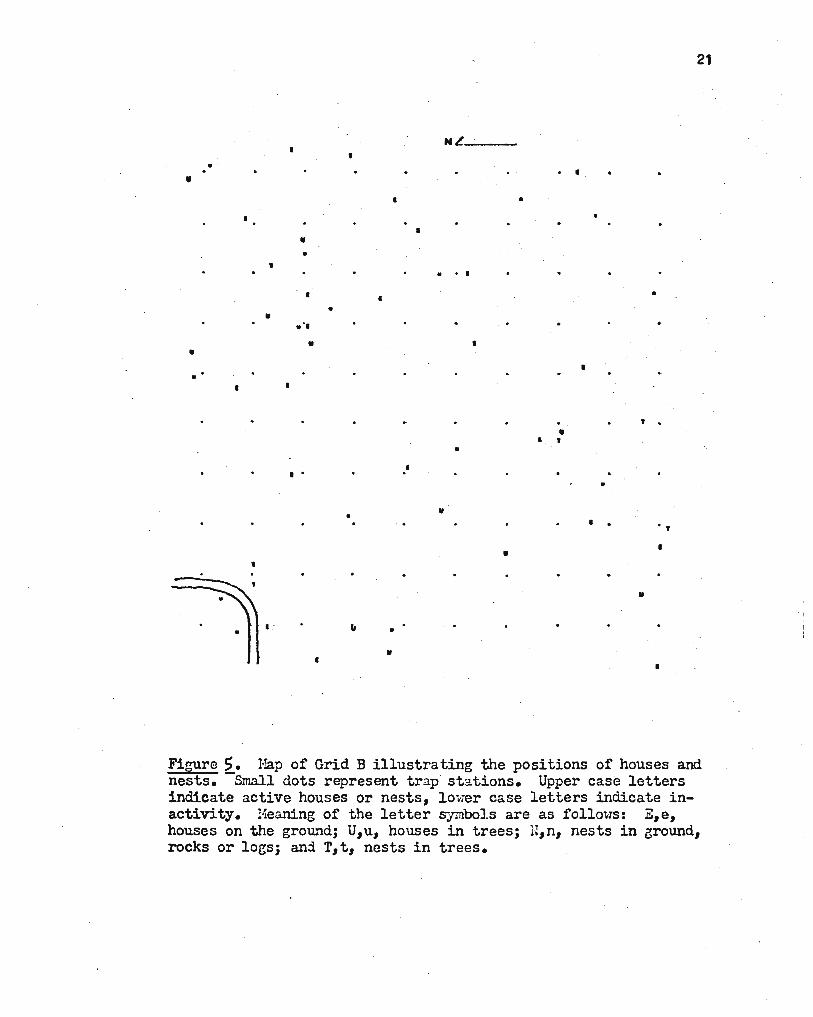
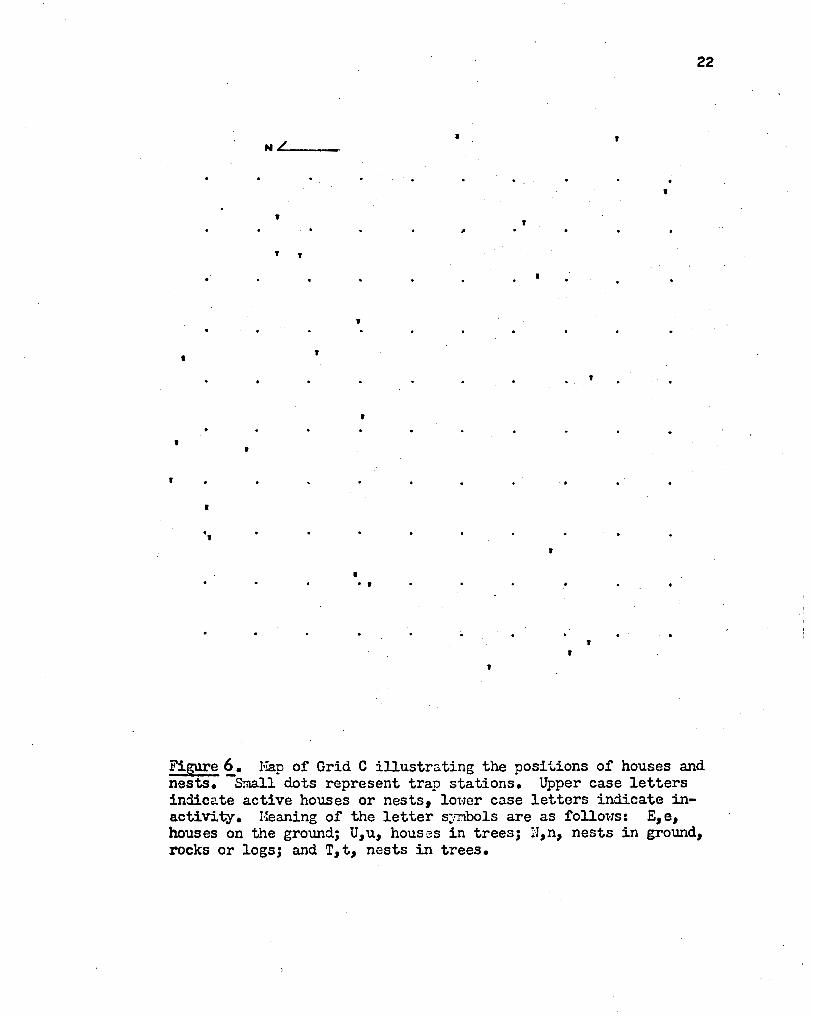
Figures -4, $, and 6 illustrate the positions of houses and nests
in the grids. Houses were found in various stages of development from
large masses of sticks to platforms or layers of sticks on the ground or
in trees. Nests without houses were usuall:y in a hollow juniper with
the entrance a hole where there once was a limb, but were also !ound in
logs and crevices in rocks. Table IX lists the nwnbers of types of houses
and nests -in the grids.
Houses were constructed of material close at hand. Dry twigs and
pieces of juniper logs, fresh clippings or juniper, dry rabbitbrush and
bitterbrush twigs, dry cow dung, pine cones, and mountain mahogcm;y twigs
-were evident. Juniper material was mst conunon. No houses were opened ·
so only two actual nests were observed. One, in Grid B, was visible
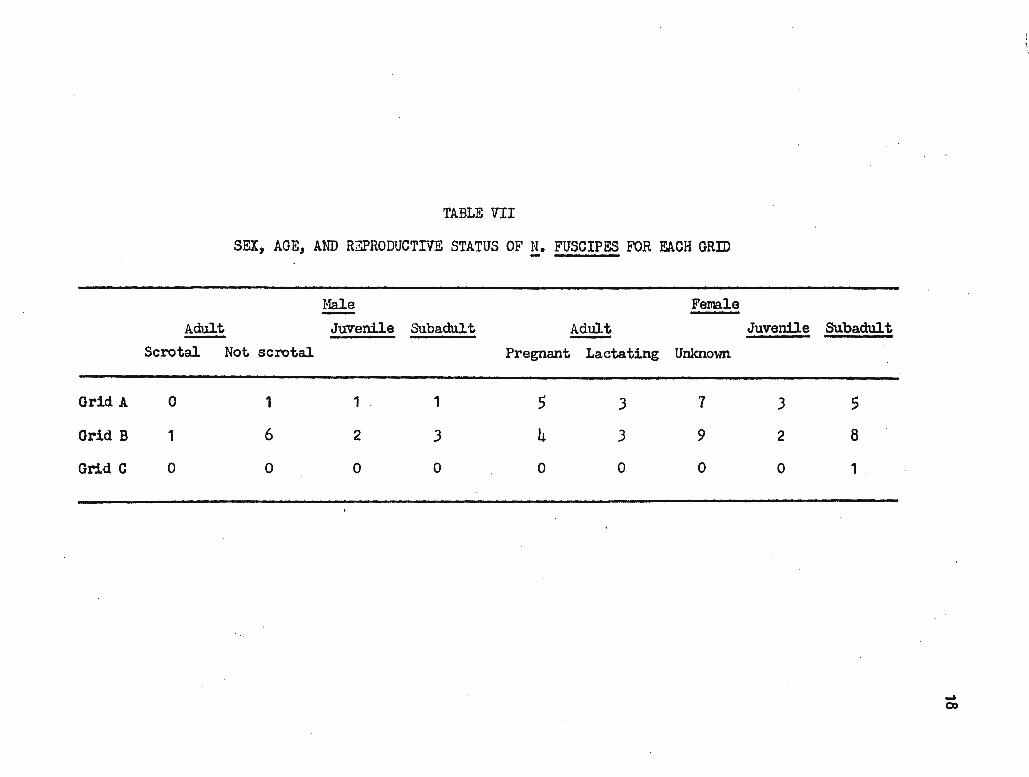
TABLE VII
SEX, AGE, AND RZPRODUCTIVE STATUS OF !!• FUSCIPES FOR EACH GRID
Ma.le Female -Adult Juvenile Subadult Adult Juvenile Subadult
Scrotal Not scrotal Pregnant Lactating Unknown
Oriel A 0 1 1 . 1 5 3 7 3 5
Grid B 1 6 2 3 4 3 9 2 8
Grid C 0 0 0 0 0 0 0 0 1
· .,
..... 0)
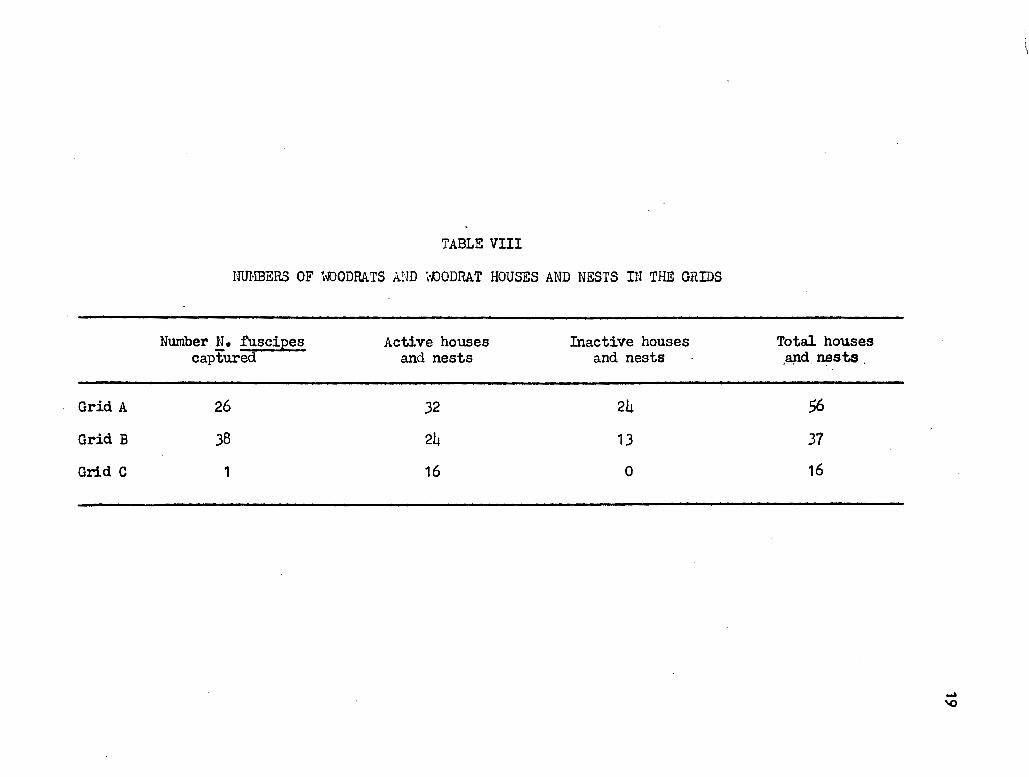
TABLE VIII
mn.mERS OF '1-.DODRATS AND \o.OODRAT HOUSES AND NESTS n~ THE GRIDS
Number ~· fuscipes Active houses Inactive houses Total houses captured and nests and nests .apd nests
-Grid A 26 32 24 56
Grid B 38 24 13 31
Grid C 1 16 0 16
~
\0
I
20
' ---~N
I I
'
• •
Figure 4. Hap of Grid A illustrating the positions of houses and nests. -Small dots represent trap st~tions. Upper case letters indicate active houses or nests, lower case letters indicate inactivity. Meaning of the letter symbols are as follows: E,e, houses on the ground; u,u, houses in trees; H,n, nests in ground, rocks or logs; and T,t, nests in trses.
*Destroyed house, see text.
l . 1
' .. •
• •
'
• • • ••
• •
I I • .
•
'
~·· " .. II
NL
• .
•
II
•
I
•
.
• I f
21
•
•
' .
•
I • . '
•
I
Figure 2_. Hap of Grid B illustrating the positions of houses and nests. Small dots represent trap· stations. Upper case letters indicate active houses or nests, lo;·;er case letters indicate inactivity. Heaning of the letter symbols are as follows: E,e, houses on the ground; U,u, houses in trees; N,n, nests in ground, rocks or logs; anj T,t, nests in trees.
• 1
'
22
I '
' ' ' ,.
' '
' I '
'
'
' '
'
·, '
. '
' '
'
Figure ~· Hap of Grid C illustrating the posit ions of houses and nests. Small dots represent trap stations. Upper case letters indicate active houses or nests, lower case letters indicate inactivity. Beaning of the letter s:rmbols are as follows: E,e, houses on the ground; U,u, hous~s in trees; H,n, nests in ground, rocks or logs; and T,t, nests in trees.
I · I
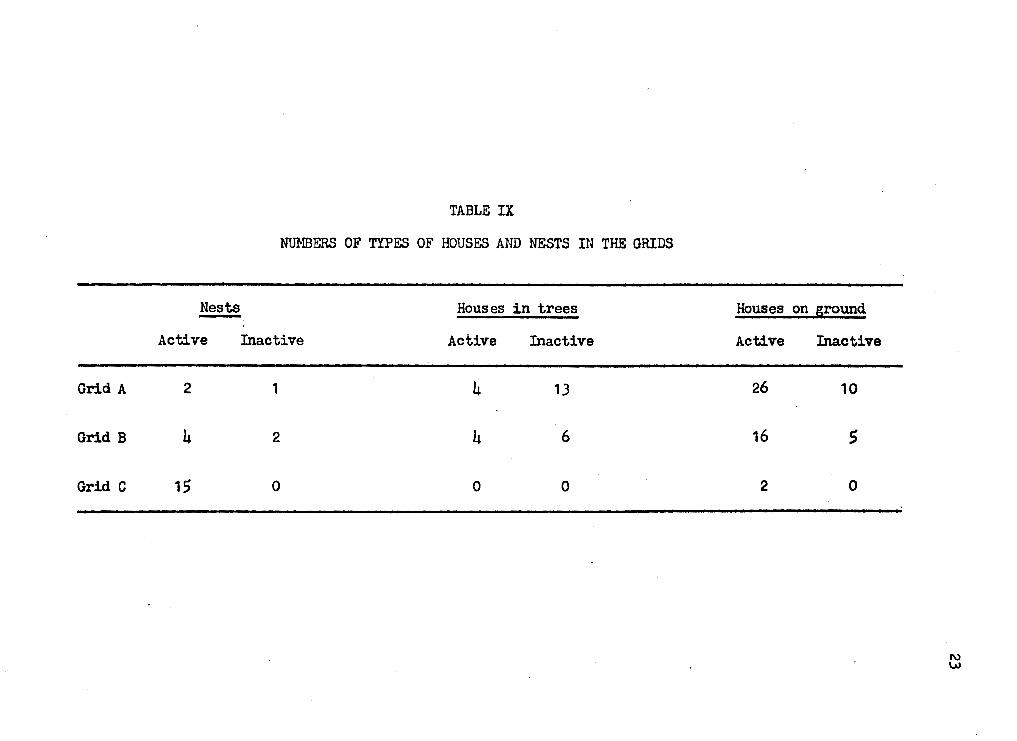
TABLE IX
NUMBERS OF TYPES OF HOUSES AND NESTS IN THE GRIDS
Nests Houses in trees -Active Inactive Active Inactive
Grid A 2 1 4 13
Grid B 4 2 4 6
Grid C 15 0 0 0
Houses on ground
Active Inactive
26 10
16 s
2 0
I\)
""'
24
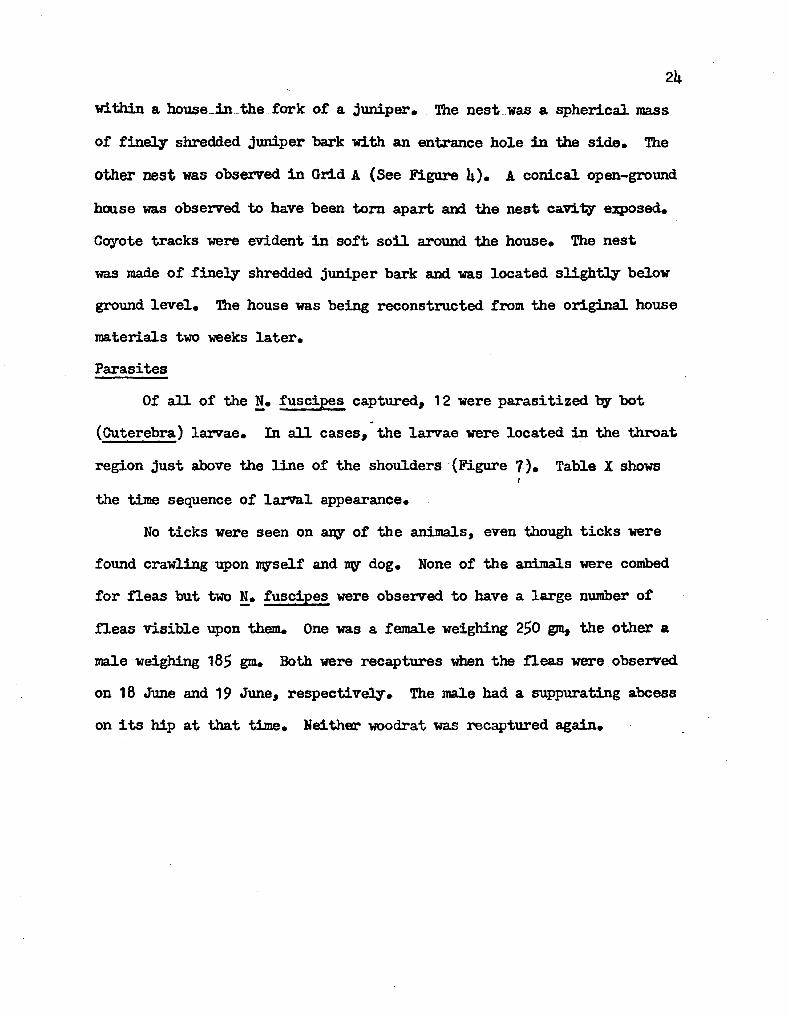
within a_ house__in _the fork _ or a juniper. The nest __ was a _spherical mass
of finely shredded juniper bark with an entrance hole in the side. The
other nest was observed in Grid A (See Figure 4). A conical open-ground
house was observed to have been torn apart am the nest cavity exposed.
Coyote tracks were evident -in-soft soil around the house. The nest
was made of finely shredded juniper bark and was located slightly below
ground level. The house was being reconstructed from the original. house
materials two weeks later.
Parasites
Of all of the N. fuscipes captured, 12 were parasitized by bot -
(Cuterebra) larvae. In all cases, the larvae were located in the throat
region just above the line of the shoulders -(Fi.grire 7~. Table X shows
the time sequence of larval appearance.
No ticks were seen on any of the animals, even though ticks were
found crawling upon Jl\VSelf and Jl\1 dog. None of the animals were combed
for fleas but two !!• fuscipes were observed to have a large number of
fleas visible upon them. One was a female weighing 250 gm, the other a
ma.le weighing 185 gm. Both were recaptures when the fleas were observed
on 18 June and 19 June, respectively. The ma.le had a suppurating abcess
on its hip at that ti.me. Heither woodrat was recaptured again.
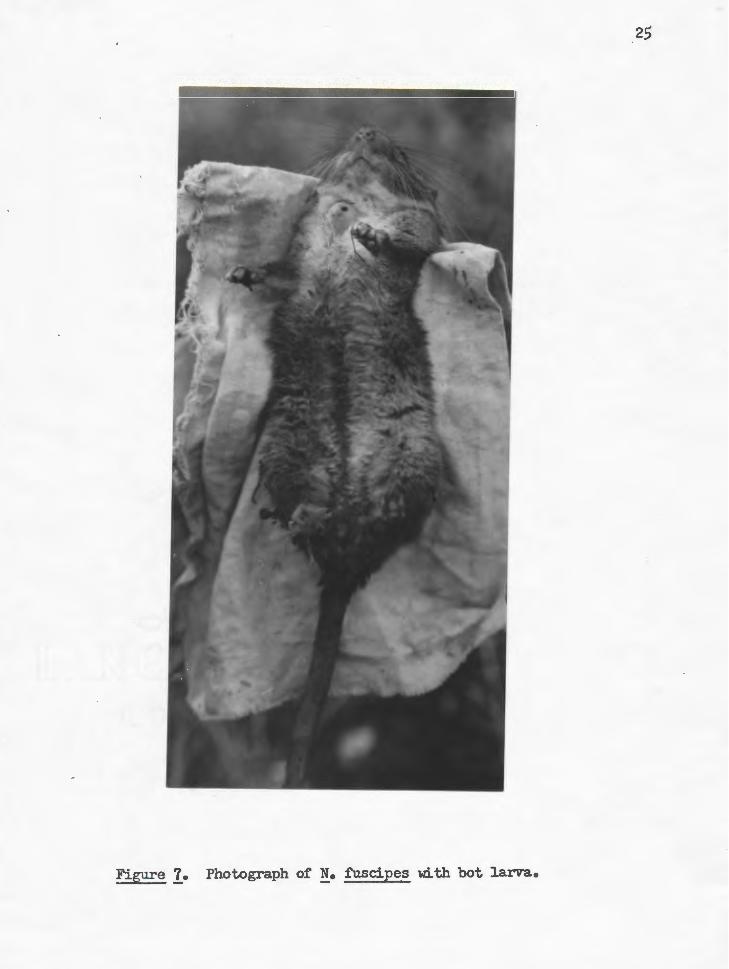
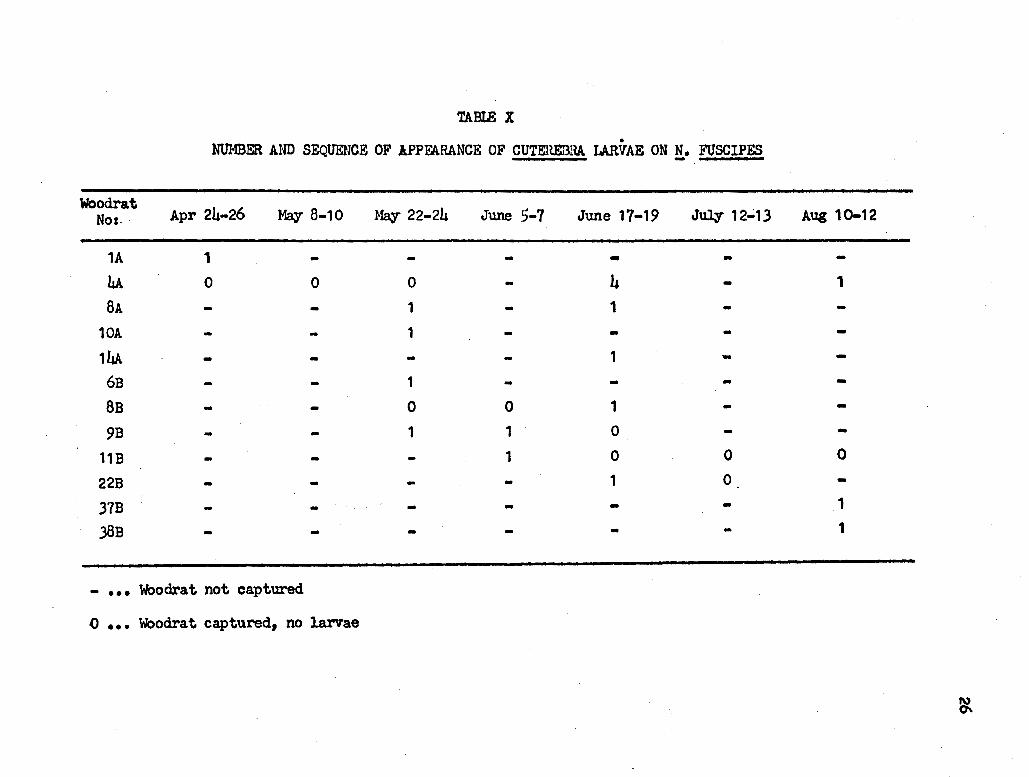
TABLE X
• NUMBER AND SEQUENCE OF APPFARANCE OF CUTEHEBRA LARVAE ON !• FUSCIPES
Woodrat Apr 24-26 May 8-10 May 22-24 No: .· June 5-7 June 17-19 JuJ.Jr 12.; 13 Aug 10-12
1A 1 - - - - - -4A 0 0 0 - 4 - 1
8A - - 1 - 1
10A - - 1 - - - -14A - - - - 1 - -
6B - - 1 - - - -8B - - 0 0 1 - -9B - - 1 1 0 - -
11B - - - 1 0 0 0
22B - - - - 1 0 -37B - - - - - - 1
.38B - - - - - - 1
- • • • Woodra t not captured
0 • • • Woodra t captured, no larvae
~
DISCUSSION AND CONCLUSIONS
Vestal (19.Jtl) observed that Neotoma fuscipes foraged within 100
feet of their houses. Fitch and Rainey (1956) observed that the foraging
distance of!!• florid.ana was less than 75 feet. Irela:rxi and Hays (1969)
found that !!· norid.ana carried foil balls 175 feet to their nests.
Pearson (1952) observed that the average distance between points of
release and recapture was 178 feet for !!• floridana~ La;y arxi Baker (1938)
had found this distance to be 108 feet for the same species. If one
asswnes a circular home -range, the home range determined for !!• fuscipes
in this study (1800 m2 - 1900 m2) is close to the home range of Neotoma
floridana foum b;r Fitch and Rainey (1956).
The area of an individual home range appears to be unrelated to
the densities of the trees and shru.bs in that home range. There appears
to be no relationship between an individual !• fuscipes home range area
and the number of woodrat houses and nests in that area, though one
would expect an increasing number of houses ani nests as home range area
increases. In these cases it is possible that a combination of variables
rray influence home range size or than none of the tested variables were
snail enough to limit the home range area. Further evidence supporting
the conclusion that home range area may not be influenced by the densities
of the trees and shrubs in the home range is the comparison between the
grids. In all cases, colony grids A and B were dissimilar in regard to
the densities of various trees and shrubs, yet the hone ranges were not
significant~ different.
28
McNab (1963) suggested a relationship between the weight of a mammal
and the home range of that mammal. Using his f onnula to dete:nnine range,
R=6.76w°•63, where R is the home range in acres and Wis the weight of
the mammal. in kilograms, one obtains for !• fuscipes, average weight
0.247 kg for those with calculated home ranges, a range of 0.93 a~res or 2 3764 m • This figure is twice as large as the mean home range of 1800 -
1900 m2, but is within the 4000 m2 maxi.mum. Since no significant corre
lation was found between individual weights and home ranges, McNab•s
lzypothesis probab~ should not be applied to individuals.
Although Neotoma. fuscipes has a dispersal capacity of from 660 m
(Linsdale and Tevis 19.51 )- to 88.5 m (Smith 1965) and the distance be-
tween colonies (630 m) was less than these values, no movement was noted
between the colonies. The juvenile woodrat captured in Grid C may have
been an immigrant from Grid B but could have originated in Grid c.
·Since it was unmarked when captured and was not recaptured, no conclusion
can be made in regards to this particular wodrat.
Conclusions that can be made from this study are that Neotoma . 2 2
fuscipes has an average home range area of from 1800 m to 1900 m using
the exclusive bounciary strip method, the densities of trees and shrubs
do not appear to influence home range size, woodrat house and nest
density within a home range is not related to the size of the home range,
and that movement between colonies is infrequent even though the distance
is within the dispersal capacity of the woodrats.
REFERENCF.S CITED
Ambrose, H. w., III. 1969. A comparison of Micro'bl.s pennsylvanicus home ranges as determined by isotope and live trap methods. Amer. Midl. Natur. 81: 535-555.
Burt, w. H. 1943. Territoriality and home range concepts as applied to mammals. J. Mamm. 24: 346-352.
Calhoun, J. B. and J. U. Casby'. 1958. Calculation of home range and density of small mammals. Pu.bl. Health Monog. No. 55. 24 P•
Cameron, G. N. 1971. Niche overlap and competition in woodrats. J. Mamm. 52: 288-296.
Cameron, G. N. and D. G. Rainey. 1972. Habitat utilization by' Neotoma lepida. in the M:>have Desert. J. Mamm. 53: 251-266.
"DixPn, J. 1919. Notes on the natural history of the bushy-tailed wood rats of California. Univ. Calif'ornia Pu.bl. Zool. 21: 49-74.
Donat, F. 1933. Notes on the life history and behavior of Neotoma tuscipes. J. Mamm. 14: 19-26.
English, P. F. 1923. The dusky-footed wood rat (Neotoma fuscipes). J. Ma.mm. 4: 1-9.
Fitch, H. s. and D. G. Rainey. 1956. Ecological observations on the woodrat, Neotoma floridana. Univ. Kansas Pu.bl., Jus. Nat. Hist. 8: 499-533.
Gander, F. P. 1929. Experiences with wood rats, Neotorna. fuscipes ma.crotis. J. Mamm. 10: 52-58.
Hammer, E. w. and c. Maser. 1973. Distribution of the dusky-footed woodrat, Neotoma fuscipes Baird, in Klamath and Lake Counties, Oregon. Northwest Sci. 47: 123-127.
Hayes, D. w. and G. A. Garrison. 1960. Key to important woody plants of eastern Oregon and Washington. USDA Agriculture Handbook . No. 148. 227 P•
Hayne, D. w. 1949. Calculation or size of home range. J. Mamm. 30: 1-11.
30
Hitchcoclc, D .. L. and A. Cronquist. 1973. Flora of the Pacific Northwest. Univ. Washington Press, Seattle. 730 P•
Hooper, E. 'l. 1938. Geographical variation in wood rats of the species Neotoma. fuscipes. Univ. California Publ. Zool. 42: 213-246.
Horton, J. s. and J. T. Wright. 1944. The wood rat as an ecological factor in southern California watersheds• -Ecole -25: 341-351.
Ireland, P • H. and H. A. Hays. home range of woodrats.
1969. A new method for determining the J. Mamm. 50: 378-379.
Lay, -D. w. and R.H. Baker. 19.38. Notes on the home -range and ecology of the Attwater wood rat. J. Mamm. 19: 418-423.
Linsdale, J. M. and L. P. Tevis, Jr. 1951. The dusky-footed woodrat. Univi California Press, Berkeley and Los Angeles. 664 P•
Linsdale, J. M. and L. Tevis, Jr. 1956. A five-year change in an assemblage of wood rat houses. J. Ma.mm. 37: 371-374.
McNab, B. '• 1963. Bioenergetics and the detennination of home range size. Amer. Natur. 91: 133-140.
Murray, K. F. and A. M. Barnes. 1969. Distribution and habitat of the woodrat, Neotoma fuscipes, in northeastern California. J. Ma.nm. 50: 43-48.
Nettleton, H. I. 1957. Wood rats damage young Douglas-fir. J. Forest. 55: 845.
Pearson, P. G. 1952. Observations concerning the life history and ecology of the wodrat, Neotoma. fioridana fioridana (Ord) •
. J. Ma.mm. 33: 459-463.
Rainey, D. G. 1956. Eastern wodrat, Neotoma floridana: and ecology. Univ. Kansas Publ., Mus. Nat. Hist.
life history B: 535-646.
Skellam, J. G. 1951. Random dispersal in theoretical populations. Biometrica. .38: 196-218.
Smith, M. H. 1965. Dispersal capacity of the dusky-footed woodrat, Neotoma fuscipes. _- Amer. Midl. Natur. -74: ·457-463.
Stickel., L. F. 1954. A comparison of certain methods of measuring ranges of small mammals. J. Mamrn. 35: 1-15.
Stones, R. C. and D. L. Hayward. 1968. Natural history of the desert woodrat, Neotoma lepida. Amer. Midl. Natur. 80: 458-475.
31
Taylor, R. J. and R. w. Valum. 1974. Wildfiowers 2: sagebrush country. Touchstone Press, Beaverton. 143 P•
Vestal, E. H • . !19.aa.. Biotic relations of the wood rat (Neotoma .f'uscipes) in the Berkeley Hills. J. Mamm. 19: 1-36.
Vogl, R. J. 1967. Wood rat densities in southern California. manzanita chaparral. Southwestern Natur. 12: 176-179.