Embed Size (px)
Citation preview

1
Issue No. 47September,
2001
www.igbp.kva.seThe International Geosphere–Biosphere
Programme (IGBP):A Study of Global Change
IGBP is sponsored by the InternationalCouncil for Science (ICSU)
The Global ChangeOpen ScienceConference –Amsterdam, July 2001This edition of the Global Change Newsletter focuses onoutcomes of the recent Open Science Conference, Chal-lenges of a Changing Earth. The Newsletter begins with anintroduction to the event and feedback from conferenceparticipants.
Four influential global change scientists, Bert Bolin, RobertWatson, Bob Scholes and Ian Noble, reach a consensusover the role of terrestrial carbon sinks in reducing green-house gas emissions (page 4). This important statementwas hammered out over lunch during the conference in re-sponse to confusion amongst journalists and others regard-ing the importance of terrestrial sinks.
From page 5, we have a series of 9 articles based on pres-entations in the abundant parallel sessions and the centre-fold presents four of the eight winners of the Student PosterAwards. On page 16, we provide a preliminary analysis ofmedia coverage resulting from the conference.
Peter Haugan takes a serious look at the future of the IGBPpost Amsterdam on page 36 and Executive Director, WillSteffen, offers a response (page 37). Also in the correspond-ence section, Gamini Seneviratne looks for new ways toenhance terrestrial carbon sinks.
Many people have asked about the plenary papers fromthe conference. These are currently being collated for pub-lication by Springer and will hopefully be available early nextyear. We’ll keep you posted.
ContentsFeedback from conference participants ................................. 2
Kyoto and Terrestrial sinks ..................................................... 4
Bridging western scientific and traditionalknowledge of Climate Change ............................................... 5
Secondary Production in the Oceans andthe Response to Climate Change .......................................... 9
Effects of Increasing Atmospheric CO2 on
Phytoplankton Communities .................................................. 12
Media at the OSC .................................................................. 16
Land cover change over the last threecenturies due to human activities ........................................... 17
How and why people and institutions matterbeyond economy ................................................................... 20
Student Posters ..................................................................... 23
Agents and their Environment: Syndromes ofland-use change in developing countries ............................... 27
Climate Change in the Tropical Pacific ................................... 30
Estimations of ENSO effects on sugarcaneyields in Cuba, Mexico and Venezuela ................................... 33
Correspondence .................................................................... 36
IGBP and Related Meetings .................................................. 41

2
The Global Change Open Science Conference, Challenges of a Changing Earth, inAmsterdam was a landmark event in many respects. It was the first time that the
three Global Environmental Change Programmes, IGBP, IHDP (International HumanDimensions Programme on Global Environmental Change) and WCRP (World
Climate Research Programme) held a combined conference on such a large scale.It was undoubtedly a turning point in the process of forging a three-way partnership
that will significantly enhance Earth System Science at the international level.
Facingthe
ChallengeThe conference was also unique in bringingtogether so many global change scientists fromall over the world. More than 400 scientists (justunder a third of the total participation) attendedfrom 62 developing countries. Overall, theconference brought together around 1400scientists representing 105 countries, making ita truly global event.
Challenges of a Changing Earth also attractedmore than 50 journalists with many morereporting from a distance. The conference wascovered by BBC World Service, Reuters,Associated Press, French, Dutch and German
press agencies, New Scientist, Nature, Science,The Los Angeles Times and many more (seepage 16 for a preliminary analysis of mediacoverage).
Many have commented on the high quality andbreadth of the presentations, with one commoncomplaint being insufficient time for questionsand discussion. Here we present more feedbackfrom participants who attended the conference.We welcome your feedback, either in the form of“Letters to the Editor” or comments for internaluse, rather than for publication. Please send yourcomments to [email protected]

3
“I’ve attended more meetings than I care to count in my30-odd years in this area. This one was by far the bestin every dimension. Most people nowadays have avague notion about human-induced changes in theglobal environment - ozone depletion, climate change,biodiversity, etc. However, hardly anyone save thepeople represented in Amsterdam truly comprehendsthe enormity and gravity of these changes - and thedesperate urgency of doing something to constrainthem. Scientists in general are far too cautious, far toocivilized, far too concerned for abstract notions ofprocess and credibility. All these considerations arelaudable when developing fundamental knowledgeover the course of generations. However, they aregrossly inappropriate when faced with the impendingglobal holocaust that is one possible scenario arisingfrom the results presented in Amsterdam.”
John Perry, Consultant to START (synthesis), USA
“The conference has successfully reviewed advanceson influence of human and natural processes on theglobal environmental changes. I think that if relevantresearch achievements regarding interaction betweenhuman and nature processes as well as how theyjointly exert their influence on the environment could beshowed more, it would contribute to understand betterthe challenges of a changing Earth we face. I suggestthat it is better to hold one such conference everyaround three years if possible.”
Yetang Hong, State Key Laboratory of Environmen-tal Geochemistry, Chinese Academy of Sciences
“The most impressive aspect of the conference was tosee the large number of scientists and scientificpresentations relating to so many different aspects ofglobal change almost all, without exception, drivinghome the same message that there is a problem i.e.that change is occurring at a pace which demands veryswift action from all countries. The participation ofdeveloping country scientists was essential becausethe meeting contextualised their research very force-fully especially for those whose research was notinitially motivated by global change concerns. Unfortu-nately, the seminar on reinforcing capacity in develop-ing countries was too short to propose concrete waysof achieving this aim in the area of global change butmany of the difficulties facing all scientists in thesecountries were highlighted.
Richard A Hall, International Foundation for Sci-ence, Sweden
“[The conference was] unique because of the largerepresentation from developing countries - thanks toIGBP for support - and because of including a social/policy perspective in the plenary and poster sessions.Causes of poor participation in global research bydeveloping countries are well known. The meeting
should have provided tangible/proactive action planswith specific targets set as well as an evaluationframework for the plans. A lot still remains to be done ifwe in the developing countries are to make any impactin global change research, and we shall continuerelying on the developed world more.”
Evans Kituyi, African Centre for Technology Stud-ies, Kenya
“The conference for the first time presented convincingevidence of major change to the global system, largelybased on paleological studies using ground-based data- demonstrating the central importance of preservingand extending ground-based monitoring of atmos-pheric and other earth system variables.”
Dr Michael Hutchinson, Centre for Resource andEnvironmental Studies, Australia
“The multi-disciplinary global congregation on climatechange made the Conference a very thought-provokingevent. However identification of collaborating themesfor research on impact and adaptation in the develop-ing countries, could have made the conference muchmore meaningful.”
Amit Garg, Indian Institute of Management, India
“This year’s “Global Change” Open Science Confer-ence in Amsterdam was a highlight in internationalscientific and environmental exchange. I was particu-larly interested in the expertise and creativity of sug-gested solutions to environmental issues from andwithin developing countries. Many of the sensitivebalances of nature may only be understood from withina local ecosystem. “Western” solutions might notalways meet the requirements. It is my hope that thisconference has stimulated and enabled broaderinformation exchange between the developed and lessdeveloped countries as well as between disciplines andscientific approaches. Modern technologies like Re-mote Sensing are highly valuable tools for interdiscipli-nary research.”
Ulrike Granoegger, Academy For Future Science,Germany
“I was generally impressed with the quality of thepresentations and the high level of co-operation amongthe programmes. It would have been nice to get a bitmore discussion though - a few questions at least (but Isuppose time was the major constraint). I was pleasedto discover that the work we are doing on nationalassessments for adaptation to climate change reso-nates with other researchers, even though we arecoming at the same problem from different angles forthe purpose of both policy and applied science.”
Bo Lim, National Communications Support Pro-gramme, UNDP-GEF, USA
4
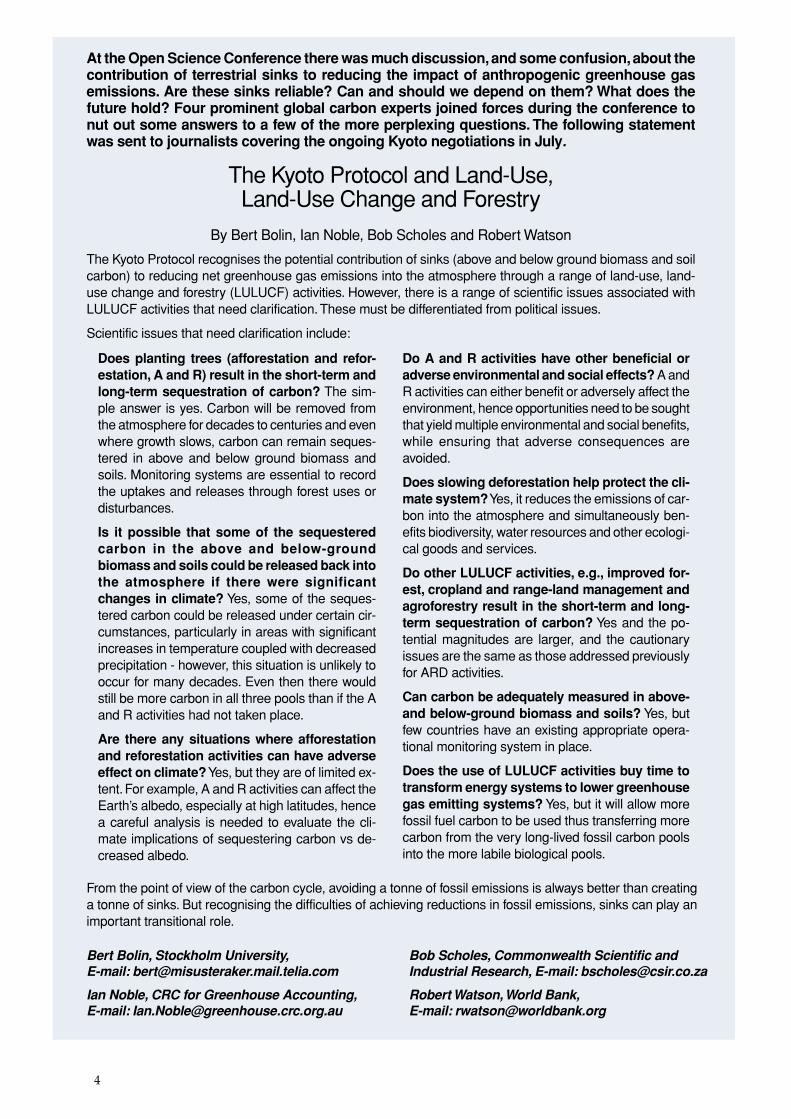
At the Open Science Conference there was much discussion, and some confusion, about thecontribution of terrestrial sinks to reducing the impact of anthropogenic greenhouse gasemissions. Are these sinks reliable? Can and should we depend on them? What does thefuture hold? Four prominent global carbon experts joined forces during the conference tonut out some answers to a few of the more perplexing questions. The following statementwas sent to journalists covering the ongoing Kyoto negotiations in July.
The Kyoto Protocol and Land-Use,Land-Use Change and Forestry
By Bert Bolin, Ian Noble, Bob Scholes and Robert Watson
The Kyoto Protocol recognises the potential contribution of sinks (above and below ground biomass and soilcarbon) to reducing net greenhouse gas emissions into the atmosphere through a range of land-use, land-use change and forestry (LULUCF) activities. However, there is a range of scientific issues associated withLULUCF activities that need clarification. These must be differentiated from political issues.
Scientific issues that need clarification include:
Does planting trees (afforestation and refor-estation, A and R) result in the short-term andlong-term sequestration of carbon? The sim-ple answer is yes. Carbon will be removed fromthe atmosphere for decades to centuries and evenwhere growth slows, carbon can remain seques-tered in above and below ground biomass andsoils. Monitoring systems are essential to recordthe uptakes and releases through forest uses ordisturbances.
Is it possible that some of the sequesteredcarbon in the above and below-groundbiomass and soils could be released back intothe atmosphere if there were significantchanges in climate? Yes, some of the seques-tered carbon could be released under certain cir-cumstances, particularly in areas with significantincreases in temperature coupled with decreasedprecipitation - however, this situation is unlikely tooccur for many decades. Even then there wouldstill be more carbon in all three pools than if the Aand R activities had not taken place.
Are there any situations where afforestationand reforestation activities can have adverseeffect on climate? Yes, but they are of limited ex-tent. For example, A and R activities can affect theEarth’s albedo, especially at high latitudes, hencea careful analysis is needed to evaluate the cli-mate implications of sequestering carbon vs de-creased albedo.
Do A and R activities have other beneficial oradverse environmental and social effects? A andR activities can either benefit or adversely affect theenvironment, hence opportunities need to be soughtthat yield multiple environmental and social benefits,while ensuring that adverse consequences areavoided.
Does slowing deforestation help protect the cli-mate system? Yes, it reduces the emissions of car-bon into the atmosphere and simultaneously ben-efits biodiversity, water resources and other ecologi-cal goods and services.
Do other LULUCF activities, e.g., improved for-est, cropland and range-land management andagroforestry result in the short-term and long-term sequestration of carbon? Yes and the po-tential magnitudes are larger, and the cautionaryissues are the same as those addressed previouslyfor ARD activities.
Can carbon be adequately measured in above-and below-ground biomass and soils? Yes, butfew countries have an existing appropriate opera-tional monitoring system in place.
Does the use of LULUCF activities buy time totransform energy systems to lower greenhousegas emitting systems? Yes, but it will allow morefossil fuel carbon to be used thus transferring morecarbon from the very long-lived fossil carbon poolsinto the more labile biological pools.
From the point of view of the carbon cycle, avoiding a tonne of fossil emissions is always better than creatinga tonne of sinks. But recognising the difficulties of achieving reductions in fossil emissions, sinks can play animportant transitional role.
Bert Bolin, Stockholm University,E-mail: [email protected]
Ian Noble, CRC for Greenhouse Accounting,E-mail: [email protected]
Bob Scholes, Commonwealth Scientific andIndustrial Research, E-mail: [email protected]
Robert Watson, World Bank,E-mail: [email protected]

5
Bridging scientific and traditionalknowledge of climate change in the
Canadian Arcticby J. Castleden
At the recent Global Change Open Science Conference in Amster-dam, it was apparent that the level of interest in diverse knowledgesystems, and the synergies between knowledge systems, is grow-ing. From discussions of sustainability science [1], - with one of itsdriving forces being the integration of knowledge and action; schol-ars and practitioners - to calls for the expansion of social participa-tion and perspectives [2], the opportunity is ripe for reflection onhow communities and local people may inform the growing field ofglobal change research.
A recent project entitled InuitObservations on Climate Changesought to bring together twoknowledge systems – TraditionalInuit Knowledge [3] and WesternScientific Knowledge [4] – tobetter understand climate-relatedchanges on an Arctic island inCanada. The following overviewof the project methodology andresults may serve as a model forglobal change researcherswishing to expand their knowl-edge of place-basedvulnerabilities, impacts, andassociated coping/adaptationstrategies.
Project OverviewSachs Harbour, NWT (72°,125°), is located on BanksIsland in Canada’s westernarctic. People from this tinycommunity have observedclimate-related changesincluding the earlier breakup and later freeze up ofsea-ice, making it moredifficult and dangerous tohunt and trap. New speciesof insects, fish and mammalsare appearing for the firsttime. Permafrost, the perma-nent layer of frozen ground,is melting, causing townbuildings to shift, andincreasing the rate of slump-
ing on the coastline and alongthe shores of inland lakes. Themelting has already caused oneinland lake to drain into theocean, killing the freshwater fish.
Given the dramatic changesthat local people have observed,the International Institute forSustainable Development (IISD)and the Hunters and TrappersCommittee of Sachs Harbourcollaborated on a year-longproject to document the evidenceof Arctic climate change andcommunicate it to Canadian andinternational audiences. TheInuit Observations on Climate
Change project set out to achievetwo goals. The first goal wasrelated to public awareness onclimate change. This goal wasmet through the production of avideo that demonstrated todecision-makers, interest-groups,civil society and the media thatclimate change is making an
impact on the traditional lifestyleand livelihood system of peoplefrom Sachs Harbour. The secondgoal was related to the relation-ship between traditional knowl-edge and scientific research onclimate change. This second goaltested a methodology for under-standing the traditional knowl-edge of Inuit people regarding
Science from the parallel sessions:The Cryosphere and Global Change

6
climate change and exploredhow traditional knowledge, localobservations and adaptivestrategies may complementscientific research on climatechange in the Arctic.
MethodologyDuring the two year initiative(June 1999 – June 2001), theproject team worked in partner-ship with specialists from fiveorganizations [5] to develop aninnovative method [6] forrecording and sharing localobservations on climate change.The approach combined partici-patory workshops, semi-struc-tured interviews, communitymeetings and fieldwork to betterunderstand the extent of localknowledge of climate change.
An initial planning sessionwas held in Sachs Harbour inJune 1999 to provide an opportu-nity for local people to describetheir livelihood system, discussthe climate change phenomenathey are experiencing and helpthe project team plan furthertrips to the community. Based onthe outcome of the planningworkshop, the team made threefurther visits to the community.The trips were scheduled on aseasonal basis so that totalimpact of climate change in anannual cycle could be under-stood and documented. These
visits focused on sea and lake icerelated changes during the fallfishing and sealing season(August 1999), impacts onwildlife during the winterhunting season (February 2000),and permafrost melting duringthe spring goose hunt (May 2000)respectively. The science teamincluded a lead scientist, atraditional knowledge advisor, agraduate student and a rotating“guest” scientist with expertiserelevant to season specific issues.
The science team membersfollowed an informal semi-directed interview approach,asking local people to elaborateon the observations that they hadidentified during the initialplanning workshop. The ques-tions asked by the science teamin relation to sea ice, weather,species health and distribution,and permafrost changes wereopen ended and meant to stimu-late discussion that would drawout the linkages between differ-ent observations. The interviewswere also intended to differenti-ate between normal and unusualclimate induced events. Addi-tionally, the interviews gave thescience group insight into theprocess and techniques neededto interview elders, hunters andcommunity members abouttraditional knowledge of climate-related change. Topographic
maps of the island were usedto geographically place theobservations. Photos wereused when available toensure that the science teamand the participant wereclear on the details of thetopic in question. Site visitswere conducted in severalcases to allow the scienceteam to see certain changes(such as permafrost relatederosion) for themselves.
ResultsSeven journal articles on thefindings from this projecthave been produced andpublished, with two furtherscientific articles being
prepared for publication in 2002.The project team met its objec-tives to: devise a process andtechniques needed to interviewelders, hunters and communitymembers about traditionalknowledge of climate-relatedchange; determine the extent oftraditional knowledge in thecommunity; and determine therelevance of that knowledge toscientific research on climatechange.
Extent and Relevance ofTraditional KnowledgeThe project visits subsequent tothe first planning mission toSachs Harbour were particularlyimportant, as the project teamexpanded on observations ofclimate change from the commu-nity workshops held during thefirst trip in June. The sciencegroup was able to get a betterunderstanding of the extent andrelevance of traditional knowl-edge in the community. Keyresults obtained from theseinterviews:
• climate-related observa-tions from non-climate-related observationscould be separated withfurther interviews by theproject team;
• observations could beplaced temporally andspatially;

7
• the context of the obser-vations was identified;
• observations could bestratified;
• community memberswho were Elders or activeharvesters were mostknowledgeable aboutclimate-related changeand traditional activities;and
• community membershave their own indicatorsof change, which isrelevant to understandingclimate change.
Science TeamThe following are several conclu-sions [7] that have been drawn bythe science group from theinterviews conducted in August(1999), February (2000) and May(2000).
1. There is an abundance ofknowledge in the com-munity related to histori-cal and current sea iceconditions, weatherpatterns, erosion/perma-frost melt and wildlifepopulations, as well asthe linkages and relation-ships between thesephenomena;
2. Understanding someaspects of climate-relatedchange, such as thoserelated to wildlife, arecomplicated by otherfactors such as harvestingpatterns or speciesinteraction;
3. Traditional knowledgeclearly contributes tocurrent western science-based knowledge ofclimate change; in manycases it is spatially andtemporally extensive andcan help “piece together”historical information;
4. While the specific impactsof climate change may bedifficult to assess, it isclear that changes will
have an impact on thecommunity and the wayin which people tradi-tionally harvest animals.
5. knowledge of perma-frost-related changes isclosely tied to commu-nity activities, includingtravel, hunting andfishing;
6. community membersinterviewed can differen-tiate between natural andabnormal climate anderosion processes;
7. discussions of perma-frost-related changes donot occur in isolationfrom other variables suchas wind, precipitation,temperature, humanactivity and seasonalchange; and
8. changes associated withmelting permafrost,while very visible, havehad less of an impact oncommunity activitiesthan the rapid springmelt and the delayedwinter freeze-up.
Coping StrategiesThe focus of the project from thebeginning was on observationsof climate change, rather than onadaptation strategies. It becameevident during the research,however, that coping strategiesare being used to dealwith the climate-related changes andincreasedunpredictability of theenvironment. Atpresent, while climatechange is having adirect impact on thecommunity, commu-nity members are ableto cope. This is prima-rily done by adjustingharvesting activities inresponse to the in-creasedunpredictability ofweather, and land and
sea ice changes. However,Riedlinger [8] cautions that thecoping strategies currentlydeveloped to alter subsistenceactivities in relation to thisunpredictability are recent, andthat they should not be inter-preted as a general indicator ofthe ability of the community tomake adaptations in the future.
Relevance to theGlobal Change
CommunityAs the global change researchcommunity is grappling with thequestions of vulnerability andresilience issues within thenature-society system, andseeking methods for integratingresearch planning, monitoring,assessment, and decision-making, the lessons learned inthe Inuit Observations on ClimateChange project may serve as onemodel for further inquiry.
Success of the Inuit Observa-tions on Climate Change projectcan be attributed to severalfactors. Full and active commu-nity participation was soughtand attained throughout allstages of the project. The dualobjectives of science and publicawareness were mutuallyreinforcing. The video documen-tary showed the human dimen-sion of climate change to deci-sion-making, media and civilsociety audiences. The science

8
References
papers added rigor and analysisthat enhanced the credibility ofthe project to academia. As well,traditional knowledge andscientific research complementedeach other to give a more com-plete understanding of climatechange. Traditional knowledgeprovided a convincing narrativethrough detailed and historicalobservations. It helped to estab-lish linkages between multipleclimate change related impactsand it was drawn from continualobservation throughout theseasons. Adopting a seasonalapproach to the project itselfcontributed to better scienceteam research.
Crossing KnowledgeBoundariesCooperation between social andphysical scientists in the area ofclimate change impact assessmenthas broadened our understandingof this field much more than whateach could have accomplishedseparately [9]. The Inuit projectprovides an example of howcrossing knowledge boundaries -in this case local and scientificexpertise – increased our under-standing of climate changeimpacts and observations onBanks Island.
Traditional knowledge, byoffering a different “way ofknowing” can increase thepossibilities of research questionsand hypotheses. In Riedlingerand Berkes (2000) [10], five areasare identified as climate changeresearch interests which may beinformed by traditional knowl-edge. These five areas of knowl-edge are:
• local scale expertise;
• a source for climatehistory and baseline data;
• developing researchquestions and hypoth-eses;
• insight into impacts andadaptation in communi-ties; and
• in long-term community-based monitoring.
By including local people fromthe beginning in the design andpractice of research, opportunitiesexist for expanding our under-standing of complex environmen-tal trends such as global change.
AcknowledgementsThis project was made possiblethrough the support and initiativeof the community of SachsHarbour and financial contribu-
tions from: the Climate ChangeAction Fund (Public Educationand Outreach); the Walter &Duncan Gordon Foundation; theClimate Change Action Fund(Science, Impacts and Adapta-tion); Indian and Northern AffairsCanada; and the Government ofthe Northwest Territories. Gener-ous in-kind support was given bythe Hunters and Trappers Com-mittee of Sachs Harbour; theInuvialuit Game Council; theInuvialuit Joint Secretariat; theInuvialuit CommunicationsSociety; the Natural ResourcesInstitute, University of Manitoba;the Department of Fisheries andOceans; the Government of theNorthwest Territories; and theGeological Survey of Canada.
For more information the finalreport, summary version of thevideo, photos, and individual tripreports may be accessed at thefollowing web site: http://www.iisd.org/casl/projects/inuitobs.htm
Jennifer CasteldenInternational Institute for
Sustainable Development161 Portage Ave. East, 6th Floor
Winnipeg, Manitoba,Canada R3B 0Y4
E-mail: [email protected]
1. Robert W. Kates, Nature-Society Interactions: Understand-ing the Environment and Development Together. Plenarypresentation, Global Change Open Science Conference,Amsterdam, The Netherlands, July 2001.
2. Julia Carabias, Challenges and Road Blocks for Localand Global Sustainability. Plenary presentation, GlobalChange Open Science Conference, Amsterdam, The Neth-erlands, July 2001.
3. Traditional knowledge, also referred to as indigenousknowledge, is local knowledge, adapted to the culture andthe ecology of each population, and matured over a periodof time encompassing thousands of years. (From Our Re-sponsibility to the Seventh Generation, IISD)
4. Western Science is a term used in this document to de-scribe the prevailing paradigm of science today.
5. The Inuvialuit Joint Secretariat; the Natural ResourcesInstitute, University of Manitoba; the Department of Fisher-ies and Oceans; the Government of the Northwest Territo-ries; and the Geological Survey of Canada.
6. Best described in Ford, Neil. “Communicating climatechange from the perspective of local people: A case study
from Arctic Canada.” Journal of Development Communica-tion 1, no. 11 (2000): 93-108.
7. Ashford, Graham and Jennifer Castleden. “Inuit Observa-tions on Climate Change: Final Report”. IISD publication(2001).
8. Riedlinger, Dyanna. “Responding to climate change inNorthern communities: Impacts and adaptations.” InfoNorth(Arctic) 54, no. 1 (2001), pp. 96-98
9. Long, Marybeth and Alastair Iles. “Assessing ClimateChange Impacts: Co-evolution of Knowledge, Communities,and Methodologies.” ENRP Discussion Paper E-97-09,Kennedy School of Government, Harvard University, August1997 and also as International Institute for Applied SystemsAnalysis Interim Report IR-97-036/August.
10. Riedlinger, Dyanna. and Fikret Berkes. “Contributions oftraditional knowledge to understanding climate change in theCanadian Arctic.” In Community-based assessments ofchange: Contributions of Inuvialuit knowledge to understand-ing climate change in the Canadian Arctic (2001).

9
Trends over the past 50 years in the ocean climate of the NorthAtlantic (convective depth, poleward heat transport, overflow fromthe Nordic Seas) are now well documented. Some of these arecorrelated with the North Atlantic Oscillation Index. What is theimpact of these large scale, low frequency climatic changes on theliving resources of the North Atlantic?
Secondary production in the oceansand the response to climate change.
by M. Heath, F. Carlotti, B. de Young, O. Fiksen andC. Werner
Economically important stocks ofmany fish species in shelf seas allaround the North Atlantic havesuffered major declines inabundance over the past half-century. Prime examples are codin the northwestern Atlantic andin the North Sea. Without doubt,fishing pressure has played themajor role in these declines, butsome aspects of the changesindicate that concurrent environ-mental changes are also in-volved. In the northwesternAtlantic, the cod stock has failedto recover despite a moratorium
on fishing, suggesting thathistoric productivity characteris-tics no longer apply. Is thisbecause of some climate-relatedchange in the underlying pro-ductivity of the food web as awhole, or some ecologicalresponse to the collapse of cod?Northern cod had an historicalbiomass on the Newfoundland
and Labrador shelves of morethan 2 million tonnes. The NorthAtlantic GLOBEC programmeaims to discover how the second-ary productivity of North Atlan-tic shelf seas is linked to basin-scale, long-term properties of theocean circulation and climatesystem.
It is obvious that, at least at agross level, there must be somerelationship between the amountof primary production in the seaand the amount of fish availablefor harvesting. However, thedetails of this relationship arevery much less clear. This ispartly because the turn-overrates of carbon (roughly thereciprocal of the life-cycleduration) are very much lower atthe top of the web compared tothe lowest trophic levels. Hence,the production by fish reflectssome long-term integral of theprimary production. In addition,the connection between primaryproduction by algae and thegrowth and recruitment of fishinvolves many predator-preysteps or trophic levels, withvarying degrees of energy loss ateach stage. Variations in thespecies composition of each
Figure 1. Long-term (1950-1999) mean abundance of adult andlate development stages of Calanus finmarchicus in theupper 10m of the North Atlantic Ocean. Composite im-age derived from data supplied by the Continuous Plank-ton Recorder Survey operated by the Sir Alister HardyFoundation for Ocean Science, UK, and from the EU-TASC project. The image shows the two main centres ofabundance, one in the Irminger/Labrador Sea south ofGreenland, and the other in the Norwegian Sea.
Science from the parallel sessions:The Oceans and Climate Change
“In the nor thwesternAtlantic, the cod stock hasfailed to recover despite amoratorium on fishing,suggesting that historicproductivity characteristicsno longer apply”

10
intervening trophic level furtherweaken the connection betweenproduction at the top and bottomof the food web.
At first sight thecomplexity of the foodweb makes the task ofassessing the sensitivity ofsecondary production toclimate changes seemintractable. However, itturns out that certain keyspecies in the food web,particularly amongst theomnivorous zooplankton(the plankton animalswhich graze directly onthe algae and are in turneaten by pelagic fish andjuvenile demersal fish),exert a particularly stronginfluence on the proportion ofprimary production which ispassed up the food web towardsthe fish, or is deposited on theseabed to support the benthosand shellfish. By studying these,
we can gain a better understand-ing of the flux of material to thehigher trophic levels.
In the sub-polar NorthAtlantic and many of the fring-ing shelf seas, one of the mostimportant of the key species isthe copepod Calanus finmarchicus.Data from the UK ContinuousPlankton Recorder Surveys
(Figure 1) show that the contri-bution of C. finmarchicus to theannual average proportion ofomnivorous zooplanktonbiomass in, for example, thenorthern North Sea has progres-sively declined from a peak ofaround 40% in the mid-1960’s toaround 5% today (Figure 2). Atthe same time, there has beenaround a four-fold increase in theabundance of larvae of benthicspecies, suggesting an increase inthe amount of primary produc-tion reaching the seabed to feedbenthic fauna. These observa-tions indicate dramatic changesover the last 40-50 years in thestructure of the food web sup-porting the North Sea fisheries.The rate at which they haveoccurred indicates that slowclimatic processes are involved.
Analysis of the ContinuousPlankton Recorder data setshows that the well documenteddecline in C finmarchicus in theNorth Sea, has occurred concur-rently over a large part of thenortheastern Atlantic Ocean,indicating that the events in theNorth Sea are probably part of alarge scale phenomenon and nota local scale event. Similarly,changes in abundance arecorrelated over a large part of the
northwestern Atlantic, but inthis case the abundance hasincreased since the 1960’s.The implication is that whilstyear-to-year variability in theshelf seas may be moredriven by local conditions,the low-frequency, longerterm changes which areimportant for higher trophiclevel productivity, are prima-rily driven by the ocean basinscale dynamics. Over the past8 years we have gained muchinsight into interactionbetween large-scale processesand C. finmarchicus popula-
tion dynamics, from the EUfunded ICOS and TASC projects,the US-GLOBEC programme,and various nationally fundedprojects. The details involveparticular life-history characteris-tics of the species, and their
Figure 2. Trends in the abundance of Calanus finmarchicus copepoditestages in the northern North Sea derived from Continuous Plank-ton Recorder Survey data. Annual mean biomass (mg C m-3) inthe upper 10m, and as a proportion of the biomass of an assem-blage of species representing all omnivorous zooplankton. Datasupplied by the Sir Alister Hardy Foundation for Ocean Science,UK.
“…observations indicatedramatic changes over the last40-50 years in the structure ofthe food web supporting theNorth Sea fisheries. The rateat which they have occurredindicates that slow climaticprocesses are involved”

11
interaction with the 3-dimen-sional basin-scale circulation ofthe North Atlantic.
The growth and reproductionof C. finmarchicus occurs inthe upper layers of the ocean(<100m). Under normalcircumstances, at surfaceocean temperatures, thespecies has a life cycle of 30-50 days involving a succes-sion of naupliar (larval) andcopepodite (juvenile) moultstages. However, the criticallife-history trait whichcouples the species to theocean circulation is itsoverwintering strategy. Late pre-adults have the ability to enter aresting state, equivalent to thediapause in some insects, ena-bling them to survive withoutfeeding for periods of up to 6-8months. Typically, late develop-
ment stages will enter diapausein mid summer, sink out of thesurface layer to the seabed orneutral buoyancy depths, form-
ing dense aggregations. Theresting copepods remain in thiscondition until the followingspring. We do not know exactlywhat cues cause emergence fromdiapause, but in spring thesurviving copepods swim backto the surface to mature, mate
and spawn a new generation. Atthe northern extreme of therange, in the Greenland Sea andDavis Strait, the population may
only produce a single genera-tion per year, whilst at thesouthern extreme off theeastern coast of the USA, southof Iceland and in the waterswest of the UK, at least twogeneration per year are moreusual.
The conditions definingsuitable overwintering habitatsfor C. finmarchicus seem to beaccessibility from the loci of
summer production in thesurface layers, dispersal rate,temperature, and predatorabundance. Low temperature ishighly advantageous because itfurther slows down the meta-bolic rate and increases theendurance of the diapause state.
Figure 3. Schematic representation of the role of oceanic population dynamics of Calanus finmarchicus in the long-term trends of abundance on the continental shelf. The oceanic circulation system supports a self-sus-taining life cycle, with diapause stages surviving through the winter at depth. Late development stagesare exported annually to the continental shelves where there is limited scope for year-to-year mainte-nance of the life cycle. Population production on the shelf supports the fisheries food web.
“…the events in the NorthSea are probably part of alarge scale phenomenonand not a local scale event”

12
In addition, visual predatorsare generally less abundant inextremes of low temperature.The appropriate combination ofconditions is rarely found inshelf sea waters, and the majorityof the overwintering stockresides at depths of 600-2000m inthe open ocean, especially in theNorwegian Sea and, it is as-sumed, in the Labrador/Irminger Sea in the northwestAtlantic. In the Norwegian Sea,these depths correspond totemperatures less than 1°C.Modelling and field observationshave shown that most of theproductive populations in shelfseas are sustained by annualrecolonisation from these oceanicoverwintering stocks. Thisexplains why the long-termtrends in abundance in, forexample, the North Sea appear tobe driven by the changes occur-ring over the wider northeastAtlantic (Figure 3).
So, the issue resolves to whatis driving the basin scale changesin C. finmarchicus abundance inthe ocean? One theory is thatchanges in the deep circulation ofthe North Atlantic and theavailability of overwintering
habitat in deep water masses areplaying a large role. Data fromthe Faroe-Shetland Channel,which lies between the FaroeIslands and the Shetland Islandsoff northern Scotland, show thatbetween October and March,dense concentrations ofoverwintering C. finmarchicus arefound in the deep (>600m) coldoverflow of Norwegian Sea DeepWater into the Atlantic. Thisoverflow is part of thethermohaline circulation systemwhich ventilates the globaloceans. Norwegian Sea DeepWater is generated by deepconvection in the Greenland Sea,and as this process has sloweddown in concert with the rise inthe NAO since the 1960s, so thevolume of Deep Water in theFaroe-Shetland Channel hasdecreased. In consequence, theabundance of overwinteringstock available to colonise theNorth Sea each spring has alsodeclined, thus providing apossible explanation for theContinuous Plankton recorderobservation in the North Sea. Aresimilar relationships responsiblefor the long-term dynamics inthe North Atlantic as a whole? A
detailed modelling and observa-tion programme in the NorthAtlantic basin scale will begetting underway in late 2001 toaddress this question. The workwill be a collaboration betweenthe UK-GLOBEC programmeand GLOBEC research pro-grammes in Canada, Iceland,Norway and USA.
Mike HeathFisheries Research Services,
Marine Laboratory,PO Box 101, Victoria Road,Aberdeen, AB11 9DB, UK.
E-mail: [email protected]
Francois CarlottiUniversity of Bordeaux, France
E-mail: [email protected]
Brad de YoungMemorial University of
Newfoundland, CanadaE-mail: [email protected]
Oyvind FiksenUniversity of Bergen, Norway
E-mail: [email protected]
Cisco WernerUniversity of North Carolina, USA
E-mail: [email protected]
Effects of increasing atmospheric CO2on phytoplankton communitiesand the biological carbon pump
by U. Riebesell, I. Zondervan, B. Rost, and R.E. Zeebe
In global assessments of potential anthropogenic CO2 sources andsinks, the oceanic biosphere has commonly been considered toremain constant over time scales relevant to ‘global change’. The‘constant oceanic biosphere’ concept is based on the assumptionthat anthropogenic perturbations of environmental conditionsdetermining ocean productivity are insignificant on a global scale.However, large-scale changes in surface ocean chemical equilibriaand elemental cycling have occurred in the framework of ‘globalchange’ and are expected to continue and intensify in the future.One of the most prominent anthropogenic perturbations, the pro-gressive increase in atmospheric CO2, affects the marine biota invarious ways: indirectly through rising mean global temperaturescausing increased surface ocean stratification, and directly throughchanges in surface ocean carbonate chemistry.
A climate-induced increase insurface ocean stratification hastwo opposing effects onphytoplankton productivity: itreduces nutrient supply fromdeeper layers and increases lightavailability due to shoaling of theupper mixed layer. Thesechanges are likely to cause anoverall decrease and – due to alonger growing season at highlatitudes – a poleward shift inoceanic primary production.Recent model calculations in factindicate large regional differ-ences in the effects of climatechange on the marine biota,predicting a 20% decrease inexport production in low lati-tudes and a 30% increase in highlatitudes for a 2 x CO2 scenario[3]. Changes in the amount anddistribution of primary produc-tion will affect higher trophic

13
levels, with likely consequencesfor key economic fisheries.
Aside from its indirect effect onclimate, the present rise in atmos-pheric CO2 concentration directlyimpacts the marine biota bychanging the surface ocean carbon-ate chemistry. By the end of thenext century, the expected increasein atmospheric CO2 will give riseto an almost three-fold increase insurface water CO2 concentrations
relative to pre-industrial values(assuming IPCC’s ‘business asusual’ scenario IS 92a). This willcause CO3
2- concentrations andseawater pH to drop by ca. 50%and 0.35 units, respectively.These changes in seawatercarbonate chemistry are likely toaffect phytoplankton taxonomicgroups differently. For instance,large differences between majorphytoplankton groups exist with
respect to the CO2 specificity ofthe predominant carboxylatingenzyme ribulose bisphosphatecarboxylase/oxygenase(Rubisco). Rubisco specificity -the enzyme’s affinity to CO2
relative to its affinity to O2 –decreases with increasing evolu-tionary age of the phytoplankton[9]. Highest Rubisco specificitiesare found in the most recentlyevolved group of phytoplankton,
5 10 15 20 25 300.2
0.4
0.6
0.8
1.0
1.2
Figure 1. Potential effects of rising CO2 on phytoplankton: A. Due to differences in CO2 sensitivity between phytoplanktontaxonomic groups, rising CO2 is likely to influence phytoplankton composition and succession. One possible con-sequence could be shift in the contribution of calcifying phytoplank on to total primary production. B. Rising CO2
decreases the ratio of calcification to organic carbon production in two coccolithophore species (Riebesell et al2000: Nature 2000).
Note that the decrease in this ratio is caused by both reduced calcification and enhanced Corg-prduction. A and Bhave opposing effects on the ratio of calcification to organic matter production.

14
the diatoms. Progressively lowervalues occur in coccolithoph-orids, green algae, dinoflagell-ates, and the most ancientphytoplankton, thecyanobacteria.
Recent studies furtherindicate that dominantphytoplankton species differin their CO2 requirement.Whereas some speciespreferably use CO2 as acarbon source, others mainlydraw their inorganic carbonfrom the large pool of HCO3
-
(e.g. [6]). Also, group-specific differences in CO2
sensitivity exist with respectto carbon metabolism. Mostnotably, the photosyntheticcarbon fixation rates of alldiatom species tested thus far, aswell as of the prymnesiophytePhaeocystis globosa, are at or closeto CO2-saturation at present dayCO2 levels [4, 5; Rost et al.unpubl.]. In contrast, thecoccolithophorids Emilianiahuxleyi and Gephyrocapsa oceanicaare well below saturation at theselevels [Rost et al. unpubl.; 8].These findings suggest largedifferences in CO2-sensitivitybetween major phytoplanktontaxonomic groups. CO2-sensitivetaxa, such as the calcifying
“It is now becomingincreasingly clear … that theassumption of a constantoceanic biosphere inassessments of future globalchange is no longer viable”
coccolithophorids, would beexpected to benefit more fromthe present increase in atmos-pheric CO2 compared to the non-calcifying diatoms and
Phaeocystis. Rising CO2 levelsmight therefore increase thecontribution of the calcifyingphytoplankton to overall pri-mary production, which wouldconsequently increase the ratio ofcalcification to organic carbonproduction in the ocean (Fig.1A). Since coccolithophoridblooms predominantly occur inwell-stratified waters, projectedclimate-induced changes in themarine environment may proveeven more advantageous for thisgroup of phytoplankton.
A shift in phytoplanktonspecies composition and succes-sion is likely to impact both
ecosystem regulation andbiogeochemical cycling. Diatoms,Phaeocystis, andcoccolithophorids each serve aspecific role in the marine
ecosystem and have distincteffects on elemental cycling.This is reflected in the‘functional groups concept’,in which phytoplanktontaxa are grouped accordingto their role in ecologicaland biogeochemical proc-esses. One of the mostprominent examples of thisis the impact calcifying andnon-calcifyingphytoplankton have on CO2
air-sea exchange. While the latterdrive the organic carbon pump,which causes a draw-down ofCO2 in the surface ocean, theformer also contribute to thecalcium carbonate pump, whichreleases CO2 into the environ-ment (Fig. 2). An increase in theratio of calcium carbonate toorganic carbon in the verticalflux of biogenic material (the so-called ‘rain ratio’), as could resultfrom an increased contribution ofcoccolithophorids to total pri-mary production, would enhancethe relative strength of thecarbonate pump. This would inturn lower biologically-mediated
CO2 uptake from theatmosphere. A basin-wideshift in the composition ofsedimenting particles -seen in a decrease of theopal:carbonate ratio – hasin fact been observedacross the entire NorthAtlantic and is suggestedto be related to large-scalechanges in climatic forcing[1].
Rising atmospheric CO2
may impact the marinebiota in yet another form.CO2-related changes inseawater carbonate chem-istry were recently shownto affect marine biogeniccalcification. A doubling inpresent-day atmosphericCO2 concentrations ispredicted to cause a 20-40% reduction in biogeniccalcification of the pre
Figure 2. The biological carbon pumps: Photosynthetic carbon fixation in the surface layerof the flux of organic matter to depth, termed organic carbon pump, generatesa CO2 sink in the ocean. In contrast, calcium carbonate production and its trans-port to depth, referred to as the calcium carbonate pump, releases CO2 in thesurface layer. The relative strengths of these two processes largely determinethe biologically-mediated ocean atmosphere CO2 exchange.

15
References
dominant calcifying organisms -the corals, foraminifera, andcoccolithophorids [2, 7, 8]. ACO2-related reduction in calcifi-cation decreases the ratio ofcalcification to organic matterproduction (Fig. 1B). With ca.80% of global CaCO3 productioncontributed by planktonicorganisms, reduced calcificationdecreases the strength of thecalcium carbonate pump andthereby increases the biologi-cally-driven uptake of CO2 intothe surface ocean [10].
As illustrated above, aclimate-induced increase in thecontribution of coccolithophoridsto total primary production,
hypothetical at present, and aCO2-related decrease in biogeniccalcification would have oppos-ing effects on the marine carboncycle. Their net effect on carboncycling will depend on theirrelative importance and sensitiv-ity to global change. Changes inmarine production andphytoplankton species composi-tion and succession will alsoimpact other biogeochemicalcycles, such as the nitrogen, opal,and sulfur cycles, which in turnis bound to feedback on theclimate. Despite the potentialimportance of global change-induced biogeochemical feed-back, our understanding of these
processes is still in its infancy. Itis now becoming increasinglyclear, however, that the assump-tion of a constant oceanic bio-sphere in assessments of futureglobal change is no longer viable.
Ulf Riebesell
Ingrid Zondervan,
Björn Rost,
Richard E. ZeebeAlfred Wegener
Institute for Polar andMarine Research,Postfach 12 01 61
27515 Bremerhaven,Germany
1. Antia, A.N., Koeve, W., Fischer, G., Blanz, T., Schulz-Bull, D., Scholten, J., Neuer, S., Kremling, K., Kuss, J.,Peinert, R., Hebbeln, D., Bathmann, U., Conte, M., Fehner,U., Zeitzschel, B. (2001) Basin-wide particulate carbon fluxin the Atlantic Ocean: regional export patterns and poten-tial for atmospheric CO2 sequestration. Global Biogeochem.Cycles (in press)
2. Bijma, J., Spero, H.J., Lea, D.W. (1999) Reassessingforaminiferal stable isotope geochemistry: Impact of theoceanic carbonate system (experimental results). In: Useof Proxies in Paleoceanography: Examples from the SouthAtlantic. G. Fischer & G. Wefer (eds.) Springer Verlag, NewYork, 489-512.
3. Bopp, L., Monfray, P., Aumont, O., Dufresne, J.-L., LeTreut, H., Madec, G., Terray, L., Orr, J.C. (2001) Potentialimpact of climate change on marine export production. Glo-bal Biogeochem. Cycles 15, 81-99.
4. Burkhardt, S., Zondervan, I., Riebesell, U. (1999) Effectof CO2 concentration on the C:N:P ratio in marinephytoplankton: A species comparison. Limnol. Oceanog. 44,683-690.
5. Burkhardt, S., Amoroso, G., Riebesell, U., Sültemeyer,D. (2001) CO2 and HCO3
- uptake in marine diatoms
acclimated to different CO2 concentrations. Limnol. Oceanogr.46, 1378-1391.
6. Elzenga, J. T., Prins, H. B. A. and Stefels, J. (2000) The roleof extracellular carbonic anhydrase activity in inorganic car-bon utilization of Phaeocystis globosa (Prymnesiophyceae):A comparison with other marine algae using the isotopic dis-equilibrium technique. Limnol. Oceanogr. 45, 372-380.
7. Kleypas, J.A., Buddemeier, R.W., Archer, D., Gattuso, J.-P., Langdon, C., Opdyke, B.N. (1999) Geochemical conse-quences of increased atmospheric CO2 on coral reefs. Sci-ence 284, 118-120.
8. Riebesell, U., Zondervan, I. Rost, B., Tortell, P.D., Zeebe,R.E., Morel, F.M.M. (2000) Reduced calcification in marineplankton in response to increased atmospheric CO2. Nature407, 364-367.
9. Tortell, P.D. (2000) Evolutionary and ecological perspec-tives on carbon acquisition in phytoplankton. Limnol.Oceanogr. 45, 744-750.
10. Zondervan, I. Zeebe, R.E., Rost, B., Riebesell, U. (2001)Decreasing marine biogenic calcification: a negative feed-back on rising atmospheric pCO2. Global Biogeochem. Cy-cles 15, 507-516.
ConferenceNewsletterHighlights from the Challenge of aChanging Earth Open ScienceConference were made availableeach day in a daily Newsletter.These 4 to 6 page Newsletters writtenby global change students can bedownloaded in PDF format from theconference web site.
www.sciconf.igbp.kva.se

16
Media at the Open ScienceConferenceThe Open Science Conference at-tracted significant media attention, with55 reporters attending the conferenceand many others reporting from a dis-tance, resulting in at least 120 media“hits”. Although most reporters who at-tended were local journalists or foreigncorrespondents, a comprehensiveweb-based “Media Room” enabledjournalists from all over the world tocover the conference regardless oftheir location. Reporters from NewsAgencies such as Reuters, AssociatedPress and Dutch, German and FrenchPress Agencies also ensured globalcoverage. A preliminary analysis ofcoverage by topic and country is pre-sented in the charts below. A more de-tailed analysis is underway and will bepresented in the December issue ofthe Newsletter.
Feedback from the media“I felt it was an extremely useful and well-organised conference,which provoked considerable interest from BBC radio news pro-grammes both in the UK and in the World Service. The press brief-ings were all very informative and gave excellent access to leadingfigures in the field. To some extent the coincidence of its timing justbefore the Bonn Climate Change Conference helped to raise theprofile of the event, but the stories which did emerge in Amsterdamwould have been of interest in their own right. Much of the detailedscience was beyond the reach of mainstream news programmesbut I have no criticism of that. My only slight gripe would be that theworking space for journalists was rather cramped — more roomnext time please!”
Tim Hirsch, Environment Correspondent, BBC News
“If I have any suggestion to make, it would be to have a largerpressroom, and a closed-circuit TV to relay speeches and details ofmeetings. …I much appreciate the way you and your colleagueshelped me so enthusiastically with other, smaller hitches.”
Richard Ingham, Science and Environment Reporter, Agence France-Presse (AFP)
“I just want to say that, as a reporter, I find that your website [OSC ‘Media Room’] is very well organized!Bravo.”
Chantal Srivastava, Reporter, Radio-Canada

17
Land cover change over the last threecenturies due to human activities
by N. Ramankutty, K. K. Goldewijk, R. Leemans, J. Foleyand F. Oldfieldc
Science from the parallel sessions:Understanding Land Use Change
The recognition of global human impact on the environment is not arecent idea. As early as 1864, Marsh [1] recognized the deleteriousconsequences of human activity on the Earth’s landscape. Morerecently, Thomas [2] lent further credence to the notion that one ofthe most obvious global changes in the last three centuries hasbeen the direct human modification and conversion of land cover.Turner et al. [3] made an excellent documentation of some of thesehistorical changes.
Recently, efforts have been madeto quantify the nature and extentof these changes at a global scale.Richards [4] estimated that overthe last 3 centuries, the totalglobal area of forests and wood-lands diminished by 12 millionkm2 (19%), grasslands andpastures declined by 5.6 millionkm2 (8%, but many grasslandshave been converted to pastures),and croplands increased by 12million km2 (466%). Such largechanges in land cover can haveimportant consequences such assignificant changes in regionaland global climate (e.g., [5-7]),modification of the global cyclesof carbon, nitrogen, and water [8-10] and increased rates of extinc-tion and biological invasion [10].
Despite the recognition of themagnitude and impact of globalscale changes in land use andland cover, there have beenrelatively few comprehensivestudies of these changes. Severalcontinental-to-regional scale landuse data sets have been com-piled. For example, Houghton[11] presents land use data fornine continental-scale regions ofthe world. Richards and Flint[12] have compiled a verycomprehensive land use data-base for South and SoutheastAsia. Unfortunately, thesedatabases are not very useful forspatially-explicit modeling. The
modeling community especiallyneeds global land use data sets ina geographically-explicit format,with regular time slices.
Two separate efforts haverecently emerged in the recon-struction of historical land usedatabases, one based at theNational Institute of PublicHealth and the Environment(RIVM) in the Netherlands, andthe other at the University ofWisconsin-Madison in the U.S.A.[13-16]. These two efforts usedhistorical statistical inventorieson agricultural land (e.g. censusdata, tax records, land surveys,historical geography estimates,etc) and applied different spatialanalysis techniques to recon-struct land cover change due toland use for thelast 300 years(e.g., Figure 1). Inparticular, thedata sets focusedon reconstructingthe historicalexpansion ofcropland andpasture areas.The data setsindicate thatcropland areasexpanded from3-4 million km2
in 1700 to 15–18million km2 in1990 (mostly at
the expense of forests), whilepasture area expanded from 4-5million km2 in 1700 to 31-33million km2 in 1990 (mostly at theexpense of grasslands). A data setof global potential natural vegeta-tion has also been created. Byoverlaying the agricultural landdata sets over the potentialvegetation data set, the change inextent of natural vegetation typeshas also been estimated. Majordifferences in the two data sets canbe explained by the use of differ-ent land use classifications,calibration techniques, andinventory datasets.
Simultaneous with the devel-opment of these land use data sets,the demand for global land usedatabases also emerged in theIGBP community. IGBP/IHDP-LUCC and IGBP-PAGES cametogether to take up the challengeof providing the global changecommunity with historical landuse data sets. PAGES, havingparticipated in the BIOME 6000project, has experience withhistorical reconstructions for 6000years before present. A new jointPAGES-LUCC initiative, labeledBIOME 300, was created to recon-struct historical land use/landcover data sets for the last 300years (1700 to 2000), with coarsetime slices in the past (50-100years) and finer time slices in thelater periods (10-25 years). A
Figure 1. An example of the historical land use data set in-cluded in the CD-ROM. This figure shows snapshotsof global cropland areas from 1700 to 1090. Thegeneral pattern of crop cover change reflects thehistory of human civilisations as well as the pat-terns of economic development and European de-velopment.

18
group of roughly 40 researchers,covering different disciplines andapproaches, came together inBern in March 2000 at the firstBIOME 300 workshop [17].Preliminary RIVM and SAGEland use datasets were presentedat this workshop and discussed.Several limitations were identi-fied in these products, andrecommendations were made tofix them. This led to the idea ofcreating a “fast-track” land usedata product, with the effort to beled by Klein Goldewijk andRamankutty. This fast-trackproduct would give the globalchange community a preliminaryproduct to use in their currentstudies.
Over the next several months,Klein Goldewijk and Ramankuttyrevised their land use databasesbased on the recommendationsfrom the Bern meeting. Ratherthan create a unified data prod-uct, the researchers decided tomaintain two separate efforts, andoffer the community two differentproducts. At this stage, the SAGEproduct offers a continuousfractional data set of land use (i.e.,the fraction of each grid cell incultivation is described), whilethe RIVM data set offers aBoolean version (each grid cell isentirely in a single land covertype). These different versionsare appropriate for differentmodeling applications dependingon the model’s ability to handlesubgrid scale landscape heteroge-neity. At the American Geophysi-cal Union meeting in San Fran-
cisco in December 2000, prelimi-nary versions of the fast-trackland use product were reviewedand plans were made to releasethe final product at the IGBPOpen Science Conference inAmsterdam in July 2001.
At the IGBP Conference inAmsterdam, in a parallel sessionchaired by Rik Leemans titled“Understanding Land-UseChanges to reconstruct, describeor predict changes in land cover”,Klein Goldewijk and Ramankuttypresented their fast-track land useproducts. They discussed thebackground for their data setdevelopment, the differentapproaches used, and invitedparticipation from the largerglobal change community in theircontinued efforts. The data setwas also released on a CD-ROM(Fig. 2). The data sets are avail-able at a spatial resolution of 0.5degree in latitude and longitude,and at an annual resolution(SAGE database) or decadal/multi-decadal resolution (RIVMdatabase), from 1700-1992.
At another parallel session inthe IGBP Conference on the“Global Carbon Cycle”, chairedby Martin Heimann and MikeRaupach, Ramankutty illustratedthe use of the global land use datain biogeochemical cyclemodeling. In particular, hepresented results from fourterrestrial ecosystem modelsimulations over the last centuryof the net carbon emissions due tothe establishment and abandon-ment of cultivated land [18].Over the 1920-1992 period, themodels simulated net emissionsof 56-91 Gt-C due to croplandchange.
Klein Goldewijk andRamankutty plan to continueimproving their historic land usedata sets. They request andwelcome the participation of theglobal change community in thiseffort as scientists in differentparts of the world might haveaccess to data and informationthat they might be willing toshare. In particular, they requestthe following kinds of informa-
tion: 1) census data on land useand land cover; 2) historical mapsof land use and land cover; 3)participation of agriculturalgeographers and historians whomight be able to critically evalu-ate the land use data products; 4)significant events information(e.g. timing of European settle-ment, expansion of cultivationinto the New Lands region of theFormer Soviet Union initiated byKhrushchev in 1954, etc.).
Navin Ramankutty andJon Foley
Center for Sustainability and theGlobal Environment (SAGE),
1225 W. Dayton Street, Room 1325University of Wisconsin
Madison, WI – 53706U.S.A.
E-mail: [email protected]: [email protected]
Kees Klein Goldewijk andRik Leemans
National Institute of Public Healthand the Environment (RIVM),
P.O. Box 13720 BA Bilthoven
The NetherlandsE-mail: [email protected]
E-mail: [email protected]
Frank Oldfield39 Caldy Rd, West Kirby,
Wirral, LH48 2HF,United Kingdom
E-mail: [email protected]
Figure 2. Data set released on a CD.ROM
To order the BIOME 300 fast-track land use data CD-ROM,please contact Kees KleinGoldewijk or NavinRamankutty. The followingvariables can be found on theCD-ROM:
Data on the CD-ROM
RIVM
1. Human Populationdensity
2. Land use (croplands,pastures, other natu-ral vegetation types)
SAGE
1. Historical Croplands
2. Potential vegetation

19
References1. Marsh, G.P. 1864. Man and Nature. Charles Scribner,New York.
2. Thomas Jr., W.L. 1956. Man’s role in changing the faceof the Earth. University of Chicago Press, Chicago.
3. Turner, B.L., Clark, W.C., Kates, R.W., Richards, J.F.,Mathews, J.T. and Meyer, W.B. (eds.). 1990. The Earth astransformed by human action. Cambridge Univ. Press, NewYork, 713 pp.
4. Richards, J.F. 1990. Land transformation. In: The Earthas Transformed by Human Action. al., B.L.T.e. (ed.) Cam-bridge Univ. Press, New York, pp. 163-178.
5. Bonan, G.B. 1999. Frost followed the plow: impacts ofdeforestation on the climate of the United States. Ecologi-cal Applications 9, 1305-1315.
6. Copeland, J.H., Pielke, R.A. and Kittel, T.G.F. 1995.Potential climate impacts of vegetation change: A regionalmodeling study. Journal of Geophysical Research 101,7409-7418.
7. Dickinson, R.E. and Henderson-Sellers, A. 1988.Modeling tropical deforestation: a study of GCM land-sur-face parameterizations. Quarterly Journal of the Royal Me-teorological Society 114, 439-462.
8. Houghton, R.A., Hobbie, J.E., Melillo, J.M., Moore, B.,Peterson, B.J., Shaver, G.R. and Woodwell, G.M. 1983.Changes in the carbon content of terrestrial biota and soilsbetween 1860 and 1980: a net release of CO2 to the at-mosphere. Ecological Monongraphs 53, 235-262.
9. Postel, S.L., Daily, G.C. and Ehrlich, P.R. 1996. Humanappropriation of renewable fresh water. Science 271, 785-788.
10. Vitousek, P.M., Mooney, H.A., Lubchenco, J. and J.M.Melillo. 1997. Human domination of Earth’s ecosystems.Science 277, 494-499.
11. Houghton, R.A. 1999. The annual net flux of carbon tothe atmosphere from changes in land use 1850-1990. Tellus51B, 298-313.
12. Richards, J.F. and Flint, E.P. 1994. Historic land use andcarbon estimates for south and southeast Asia: 1880-1980.Carbon Dioxide Information Analysis Center, Oak Ridge Na-tional Laboratory, Numerical Data Package-046, Oak Ridge,TN.
13. Klein Goldewijk, C.G.M. and Battjes, J.J. 1997. A hun-dred year (1890 - 1990) database for integrated environmen-tal assessments (HYDE, version 1.1). National Institute ofPublic Health and the Environment (RIVM), Bilthoven, TheNetherlands.
14. Klein Goldewijk, K. 2000. Estimating global land usechange over the past 300 years: the HYDE database. GlobalBiogeochemical Cycles 15, 417-434.
15. Ramankutty, N. and Foley, J.A. 1998. Characterizing pat-terns of global land use: An analysis of global croplands data.Global Biogeochemical Cycles 12, 667-685.
16. Ramankutty, N. and Foley, J.A. 1999. Estimating histori-cal changes in global land cover: Croplands from 1700 to1992. Global Biogeochemical Cycles 13, 997-1027.
17. Leemans, R., Goldewijk, K.K. and Oldfield, F. 2000. De-veloping a fast-track global database of land-cover history.LUCC Newsletter No. 5, 6-7.
18. McGuire, A.D., Sitch, S., Clein, J.S., Dargaville, R., Esser,G., Foley, J., Heimann, M., Joos, F., Kaplan, J., Kicklighter,D.W., Meier, R.A., Melillo, J.M., III, B.M., Prentice, I.C.,Ramankutty, N., Reichenau, T., Schloss, A., Tian, H., Williams,L.J. and Wittenberg, U. 2001. Carbon balance of the terres-trial biosphere in the twentieth century: Analyses of CO2,climate and land-use effects with four process-based eco-system models. Global Biogeochemical Cycles 15, 183-206.
IGBP Science Series2, 3 and 4The IGBP Science Seriesis designed to make IGBP’sresearch output accessibleto a wider range ofaudiences, in particular tothe policy and resourcemanagement communities.
These visually rich reportspresent the most recent scien-tific understanding in majorareas of Earth System Science.
To order copies send an e-mail to: [email protected]
Now Available

20
Land use and cover change is one of the most important aspects ofhuman impact on the earth, playing key roles in carbon cyclingthrough the emission of greenhouse gasses, and affecting hydro-logical processes and other earth system processes. The impor-tance of understanding these impacts was recognized by theInternational Geosphere-Biosphere Programme and the Interna-tional Human Dimensions Programme on Global EnvironmentalChange in the creation of a joint core project on Land Use andCover Change (LUCC) [1]. While closely related, the terms land useand land cover refer to quite distinct things: while land cover refersto the biophysical attributes of the earth’s surface, land use refers tothe activities undertaken in a place including the motivation for, andmediating factors shaping, those actions.
How and why people and institutionsmatter beyond economy:
People and trees in MadagascarW. McConnell
The scalar dynamics ofland use and cover
change in MadagascarMadagascar is a globalbiodiversity “hotspot”, prompt-ing international biodiversityconservation efforts based uponthe “population pressure-on-resources” thesis, which holdsthat rapid demographic growthhas caused widespread environ-mental degradation. Alternative
views have emerged, however,which either ascribe degradationto forces other than populationgrowth, or find the country’sforests expanding rapidly nearmajor population centers.Population growth can be seen tolead to deforestation in one case,while in another it leads toafforestation. This may be aproduct of the scalar dynamics ofthe relationship in question. Theterm scalar dynamics was coined
to denote the ways that phenom-ena appear differently whenobserved at different scales ofanalysis.
This case study illustrates theissues encountered in tracing therelationship between population“pressure” and land use dynam-ics, and to the ways that institu-tional factors mediate thisrelationship at different spatialand temporal levels. The terminstitutions is used here to refer tothe laws, regulations, rules andnorms that shape social behavior,with particular emphasis onaccess to land and the rights touse land-based resources.
Madagascar’s privilegedbiodiversity “hotspot” statusstems from two facts: its longseparation from the Africanmainland (about one hundredmillion years) leading to highbiological endemism; and theshort duration of human occupa-tion (less than two millennia).Through most of the 20th Cen-tury, observers largely took forgranted a causal linkage betweenpopulation “pressure” anddeforestation: while the humanpopulation grew to over tenmillion, what was presumed tobe the near complete forest coverof the island was reduced tomeager vestiges along the steepeastern escarpment, leaving thecentral plateau and most of thewestern portions of the islandcovered in poor grasslands.
This thesis was bolstered by avery influential spatially-explicitstudy published in Science in1990 [2]. The study comparedforest cover change measuredthrough the analysis of satelliteimagery with population density,concluding that deforestationhad been most rapid in areas ofhigh population density. Thisanalysis formed the cornerstoneof biodiversity conservationefforts based unequivocally uponthe fundamental understandingthat:
more people => less trees.
Science from the parallel sessions:Putting People into the Earth System: Victims or Villains?
Two aerial photographs illustrate a dramatic increase in woody biomass in the last halfof the 20th century in Alaska, on Madagascar’s central plateau. In the earlier photo-graph, from 1957, the hills around the village rice paddies are covered in grass, withonly small patches of trees.
By 19991, much of the landscape is covered in trees, especially hilltops and the steepslopes of the rivers cut bank. (The photographs show an area about 2 km x 2 km)

21
As the two main variables aredisaggregated, however, therelationship becomes less clear.In the temporal domain, ithas been shown thatfactors other than simpledemographic growth sharemuch of the responsibilityfor deforestation duringcertain periods, includingthe exodus of highlandpopulations into the forestduring the consolidation ofthe Merina Monarchyaround 1800 [3], and thefelling of huge numbers oftrees under French colonialrule a hundred years later,when population growthmay have been quite low,or even negative [4]. Similarly,disaggregating the populationdensity classes used in theScience study also weakens therelationship – differentiating thevery dense population centers ofthe highlands (containing abouta third of the island’s population)shows deforestation to haveoccurred in the moderately-populated regions along theforest’s edge. In carrying outregional analyses, taking intoaccount the afforestation that hastaken place around the capital,Antananarivo, and other majorurban centers, the oppositerelationship is much moreplausible:
more people => moretrees.
Taking the disaggregation astep further to analyze therelationship at the level of
individual landscapes canreverse the relationshiponce again. Comparingland cover dynamics inthe vicinity of villagesalong the upper (western)edge of the escarpmentforest, for example,shows forest coverconversion to be directlyproportional to villagepopulation, a relationshipmade even stronger whenthe relative “pressure” ofneighboring villages isaccounted for [5]:
more people => less trees.
Shifting the lens to focus onrural highland landscapes whichhave been cultivated for centu-ries, however, recent studiessuggest that population growthhas led to the propagation ofwoody species, both for fuel andconstruction needs, as well as forfruits and other non-timberforest products [6]:
more people => moretrees.
Meanwhile, along thecountry’s two rail linesdramatic impacts ofcolonial infrastructure onforest cover dynamics,including the influx ofpopulation related to thesupply of (involuntary)labor, the removal and laterreplacement of forest coveralong the rail lines, andsubsequent diffusion and
adaptation of afforestationgermplasm and techniques, werevisible. At such fine levels ofanalysis, it is possible to see howlocal institutions shape the landuse patterns. For example, inmost parts of the country, burialtombs are used, and often theadjacent lands are protected bycovenants that stipulate theconditions under which these“ancestral domains” may befarmed. These and other aspectsof local tenure systems, such asthe borrowing of land, affect thespatial and temporal dynamics ofland use at the local level.
Scalar Dynamicsand Institutions
At the coarsest level ofanalysis, deforestation inMadagascar is clearlylinked to the growth of thepopulation from the initialsettlers to well over 10million. At regional levelsof analysis, however, therelation between forestcover and population isquite sensitive to temporaland spatial aggregation –differentiating particularperiods or retainingdetailed population
density classes makes the rela-tionship appear very different.Distinct period effects appear toaccount for much of the temporaland spatial patterns of forestcover change, especially attemptsto control land use practices onthe part of the Merina Monarchy,the French colonial authorities,
The eucalyptus forest extending to the east of Madagas-car’s capital, Antananarivo, has been estimated at over100.00ha, and is said to supply the city with over half of itsfuel wood needs.
Aforestation of hilltops has become quite widespread inthe highlands, largely with exotic pine species, providingfor local fuel wood and construction needs.
Every year, part of Madagascar’s rainforest is felled to makeway for crops. Hillsides are planted in rain fed rice and othercrops, while bottomlands are developed into rice paddies.

22
and the independent MalagasyRepublics. The flight of highlandpopulations into the forests ofthe upper escarpment and theconstruction of the railroad arekey examples of institutionalfactors that shape spatial andtemporal forest cover dynamics.The relationship is also sensitiveto another spatial effect – thedelineation of the area of interest.The inclusion or exclusion ofmajor population centers has adramatic effect on the observedrelationship between populationdensity and forest cover dynam-ics. At local levels of analysis,simple demographic growthappears to explain much of thedynamics observed, thoughsocial institutions at the villagelevel have profound effects onthe spatial patterns produced.
Thus, there is no way tounderstand the relation betweenpeople and trees without closeattention to institutions, andaccounting for these factorsrequires an expansion of socio-economic analysis beyond thetraditional framework of neo-classical economics. The disloca-tion of large numbers of peopleinto forested landscapes is poorlyexplained as a response to“market signals”, whether theyare fleeing Merina or Frenchhegemony; both events involvedthe use of overwhelming force toachieve political aims.
Is it all just toocomplex?
The simple conclusion from suchanalysis is that land use dynam-ics are just very complex. Butsuch a reaction is not warranted.While we are unlikely to arrive ata general theory of land usedynamics that accurately pre-dicts land cover outcomes inspecific cases, we have learnedquite a bit about the key factorsthat explain most cases. Meta-analysis of case studies is yield-ing insights into regional trendsthat provide typologies andtestable hypotheses of landscapetrajectories [7]. Meanwhile, socialscience theory concerninginstitutional dynamics has mademajor strides in recent years – forexample, in the realm of landtenure, the simple dichotomybetween private and commonproperty has evolved to a morenuanced understanding of thekey dimensions of tenure, suchas the degree to which theresources in question aresubtractable (one person’s usediminishes the resource) andexcludable (users can be ex-cluded) [8]. We know that the“tragedy of the commons” [9] isnot inevitable - rather, there areexamples of local, regional andnational institutional arrange-ments that successfully accom-plish land management goals,
including protected areas,afforestation programs, andtraditional ancestral domains.
Furthermore, we havelearned that factors do NOTaggregate across levels in anysimple way - one cannot under-stand the regional dynamics bysimply summing up effects oftraditional land managementinstitutions, any more than onecan simply disaggregate theregional political-economicforces by assuming that theyplay out equally across space.Perhaps the greatest mistake is totake prima facie evidence for theculpability of simple demo-graphic growth at the broadestand finest levels and stop at that,having discovered the proximateand ultimate causes to be oneand the same. Rather, the searchmust be for solutions that bearreplication. Fortunately inMadagascar, as elsewhere,development project managersare becoming more aware ofthese scalar dynamics, and moreattuned to the institutionaldimensions of land use dynam-ics.
William McConnellLUCC Focus 1 Science Office
Indiana UniversityBloomington, USA
E-mail: [email protected]
References1. Land Use and Cover Change Project homepage: http://www.geo.ucl.ac.be/LUCC/lucc.html
2. Green, Glen M. and Robert W. Sussman. 1990. Defor-estation History of the Eastern Rainforests of Madagascarfrom Satellite Images. Science 1990(248):212-215
3. Coulaud, D. 1973. Les Zafimaniry: un group ethique deMadagascar ‡ la poursuite de la forÍt. Fanotamboky Mala-gasy; Antananarivo, Madagascar.
4. Jarosz, Lucy. 1996. “Defining Deforestation in Madagas-car”. In: Liberation Ecologies: Environment, Development,Social Movements. Richard Peet and Michael Watts (edi-tors). Routledge; New York.
5. McConnell, William J. 2000. Human Environment Rela-tions in Madagascar: The importance of spatial and tempo-ral perspective. PhD Dissertation. Clark University, Worces-ter, MA.
6. Kull, Christian A. 1998. Leimavo Revisited: Agrarian Land-Use Change in the Highlands of Madagascar. ProfessionalGeographer. 50(2):163-176
7. Geist, Helmut J. and Lambin, Eric F. 2001. What DrivesTropical Deforestation?: A meta-analysis of proximate andunderlying causes of deforestation based on subnational casestudy evidence. LUCC Report Series No. 4. LUCC IPO;Belgium.
8. Gibson, C., M. McKean and E. Ostrom (eds.). 2000. Peo-ple and Forests: Communities, Institutions and Governance.The MIT Press: Cambridge, MA.
9. Hardin, Garrett. 1968. The Tragedy of the Commons. Sci-ence. 1962:1243-1248

23
Student Poster AwardsThere were 8 winners in the student poster awards at the Open Science Conference. Winningposters were selected for the quality of their overall design, illustrations, scientific context andaccessibility to a broad audience. Here we present 4 of the 8 winning posters, the remaining 4to be featured in the December edition of the Newsletter.

24

25

26

27
Human induced changes in the Earth System are starting to en-close all scales, from the global to the local, yet the local actorplays a key role, both in terms of proximate causes and conse-quences. The analysis of the social and natural situations, options,and possible futures of people in their respective environment ishindered by the huge variety of localities throughout the world. Thisvariety is extensively documented in numerous case studies. Thereare recent efforts to scrutinize case studies in order to attain betterinsights into the nature of environmental changes, e.g. the recentLand Use and Cover Change International Project Office (LUCC-IPO) analysis of tropical deforestation.
Agents and their EnvironmentSyndromes of land-use change in
developing countriesby G. Petschel-Held
Within the work presented here,it is suggested that the interac-tions between civilization andnature can be clustered intotypical patterns. This implies that
case studies can be grouped intoensembles of similar processes,embedded into similar (dynamic)constraints of larger-scale, evenglobal, earth-system properties
(see Figure 1).The appealing of patterns of
civilization-nature interactionraises some intriguing questions:How can patterns be specified or“discovered”? How to modelthem? What to learn from thiskind of analysis? The examplepresented here is dealing withaspects of land-use changes indeveloping countries and has tobe considered as work in progress.It will demonstrate a qualitativemodeling technique whichoperationalizes the idea of func-tional similarity by utilizing setsof ordinary differential equations.These sets are defined bymonotonicity properties, e.g. twofunctions are considered to belongto the same set if in both functionsthe dependent variable increases ifthe independent variable isincreasing. The QSIM-algorithm,developed by Ben Kuipers fromthe University of Texas, Austin,
Figure 1. Grouping of case studies and Earth-System properties into typical functional patterns.

28
uses these relations as con-straints. It allows all dynamicbehaviors in which the directionsof change share these properties.Taking the example of a monoto-nously increasing relation, thisproduces, e.g., behaviors inwhich both variables are increas-ing, then simultaneously reachan extremum and decrease orincrease again afterwards. The“or” indicates that the modelingtechnique produces a set ofdynamic behaviors instead of asingle solution as conventionalmodeling does. This set ofpossible behaviors again corre-sponds to a cluster of casestudies: Different stories fromdifferent case studies can begenerated by a single qualitativemodel [3].
The “wiring diagram” of theexemplary qualitative model ofsmallholder agriculture in fragileecosystems in developingcountries is presented in Figure2. The Available Labor is a mo-notonously increasing function(M+) of the population, which isincreasing within the experi-ments described in the following.Labor can be allocated into Off-farm Activities and AgriculturalLabor, which in turn can bedivided into Yield Oriented orConservation oriented labor. Eachallocation is constrained by aqualitative addition ⊕ whichallows changes in signs of thevariables as in the usual addi-tion, e.g. if both “independent”variables increase, their sum isincreasing as well, etc. YieldOriented labor constitutes one
factor of the agricultural produc-tion function and has negativeimpact on the change (dottedarea) of the Quality of Resources,i.e. it induces an environmentaldegradation. In contrast, thesecond type of agricultural laboris assumed to have solely apositive impact on the change ofresource quality, but no directyield effect.
It is obvious that this schemeof impact of human activities isby no means applicable to allsituations of smallholder land-use, but the qualitative characterof the relations implies also thatit should be applicable to morethan one situation. The interme-diate generality of the cause-effect scheme thus represents thefirst level of pattern formaliza-tion. The global and regionalcontext, both in terms of naturalas well as social conditions, e.g.climate, societal and economicstratification, etc., determines theactual regions where it should bevalid. The analysis of the poten-tial regions for a particularpattern is based on data andmodel results and yields, whatwe call, the disposition [2, 4].
The graph of the remainingparts of the model is self-explain-ing, if we take the symbols ø and⊗ to mean qualitative divisionand multiplication, respectively.We underline that agriculturaltechnology is taken as a furtherproduction factor and is assumedto be increasing. This relates toBoserup’s argument of anincreasing technologicaleffectivity induced by population
growth. In contrast, the fact thatpopulation growth itself affectsthe Income relative to basic needsallows the Malthusian type ofoutcome, i.e. a limited carryingcapacity inevitably deterioratesliving conditions.
Within the framework of themodel, local agricultural decisionmaking (ADM) comprises thetwo aspects of labor allocation.There is a long ongoing debateabout rationalities and objectivesof ADM, which consider, forexample, economic rationality,i.e. the smallholder familyoptimizes its utility, or riskaverting strategies by diversifica-tion. As long as only the summa-tion rules depicted in Figure 2are taken into account, nodecision-making rationale isimplemented. This opennesswould allow a vastness ofbehaviors, which makes theidentification of patterns difficultand hardly helpful. We thereforehave implemented simpleallocation rules: off-farm labor isincreased if it is more productivethan agriculture, correspondingto a bias towards agriculture.Secondly, conservation orientedlabor is not increased if either theresource quality is enhancinganyway or if the income percapita falls below a certain level.In qualitative terms, it is suffi-cient to assume a “certain level”to exist. It is not necessary toknow its actual level in terms ofnumbers, which would bedifferent in different contexts.
How to validate a qualitativemodel or, more adequately, howto specify which cases arerepresented by the correspond-ing functional pattern? Besidesthe comparison of the qualitativeproperties of the relation be-tween variables, the validationuses the story each case studytells. When analyzing studies onsmallholder agriculture, how-ever, one can identify a few,typical stories, which we callstylized narratives. Kates andHaarman [1], for example, haveidentified three types of povertyinduced environmental degrada
Figure 2. “Wiring diagram” of the qualitative model of smallholder agriculture.

29
tion: the well-known impover-ishment -degradation spiral andcases of degradation inducedeither by division of land or bydisplacement. In another stylizednarrative to be found in theliterature increasing off-farmactivities reduces the workavailable for conservation. Inmany of these cases this leads tosignificant environmentaldegradation, sometimes stimu-lating diminishing returns.
The question of validation is:Does the model tell the stylizednarratives? Leaving out thetechnical representation of theresults, we state that this is thecase for the spiral and the off-farm induced degradationnarratives, but not yet for thedivision and displacement cases.
The next question is: what tolearn from this qualitativemodel? It turns out that themodel produces “good” stories,e.g. off-farm activities are paidwell enough to increase incomes
and allow preservation of naturalresources. Yet constellations arisewhich inevitably lead to deterio-rating environmental conditionsand diminishing incomes. Wecall such an unsustainableconstellation a syndrome. Such asituation arises when no off-farmalternatives are available, therate of technological progress isdecreasing, and impoverishmentoccurs. It is important to notethat the inevitability happensthough technological efficiencyincreases. Yet, the increase in soildegradation might only becompensated if this efficiencygrows with an increasing rate or,in other words, only in this caseBoserup’s argument for the non-existence of a carrying capacitymight hold.
Finally, we might ask: can weidentify regions of the world thatare already characterized by theunsustainable constellation or atleast close to it? Using data fromthe early 1990s the direction of
change of the five relevantvariables (wage labor, agricul-tural intensification, soil degra-dation, agricultural yield andrural poverty) are analyzed.Figure 3 depicts the result, where“-n” means that the direction ofchanges of n variables differsfrom the unsustainable constella-tion, i.e. in red one identifiesregions where the syndrome isactive.
It has to be stressed again thatthe present model representswork in progress. Yet the resultsindicate that this kind of syn-drome analysis might be apowerful method for the identifi-cation of barriers againstsustainability and thus for, whatis now called, sustainabilityscience.
Gerhard Petschel-HeldPotsdam Institute for Climate
Impact Research,Potsdam, Germany
E-mail: [email protected]
References1. Kates, Robert W., and V. Haarman. 1992. Where the Poorlive: Are the assumptions correct? Environment 34:4-11,25-28.
2. Petschel-Held, Gerhard et al. 1999. Syndromes of GlobalChange - A qualitative modelling approach to Assist Global En-vironmental Management. Environmental Modeling and Assess-ment 4 (4):295-314.
Figure 3. Geographical distribution of regions with unsustainable constellations of smallholder agriculture (see text).
3. Petschel-Held, Gerhard and Matthias K.B. Lüdeke. 2001. Inte-grating Case Studies on Global Change by Means of QualitativeDifferential Equations. Integrated Assessment in press.
4. Schellnhuber, Hans-Joachim et al. 1997. Syndromes of GlobalChange. GAIA 6 (1):19-34.

30
Science from the parallel sessions:El Niño Southern Oscillation in the context of past and future
climate variability
Climate change in the Tropical Pacific:Understanding and quantifying
uncertaintiesby M. Collins
The El Niño Southern Oscillation (ENSO) is a well know modulatorof global climate on seasonal to interannual time scales. The quasi-period warming and cooling of Sea Surface Temperatures (SSTs) inthe eastern Tropical Pacific, and corresponding shifts in atmos-pheric pressure and precipitation patterns, cause climatic variationsboth locally and via teleconnection patterns to remote areas. Theseshort-term climate variations have significant impacts on ecology,society and economics. What role then does the Tropical Pacificplay in the global change problem?
There are an increasing numberof studies of climate and environ-mental change that point to theTropical Pacific as an importantmodulator of the global climatesystem. The studies of Latif et al.
[9] and Thorpe et al. [10] bothexamine the potential for areduction in the strength of theNorth Atlantic OceanThermohaline Circulation (THC)as greenhouse gases increase.They find that the rate of thereduction in strength (and hencethe potential for a permanentshut-down) is controlled by theadvection of salty water fromlower latitudes - the saltier theTropical Atlantic ocean, thesmaller the reduction in THCstrength. During an El Nino
event the Tropical Atlantic Oceanbecomes more salty through acombination of changes inevaporation, precipitation andriver run-off. In both the Latif etal. [9] and Thorpe et al. [10]
studies the climate modelsproduce a climate changetowards more El Nino likemean conditions in theTropical Pacific and thisresults in changes to thefreshwater cycle whichcause a more salty TropicalAtlantic ocean and thuslimits THC slow down.
The work of Cox et al.[5] also points to an impor-tant role for the TropicalPacific in global climatechange. In their study they
include representations of theterrestrial and marine carboncycles in a global climate modeland find a positive feedback inwhich the terrestrial biospherecan flip from being a carbon sinkto a carbon source. The corre-sponding increase in atmos-pheric CO2 amplifies the rate ofglobal warming in the modelconsiderably. One of the majorcomponents of the flip is a die-back of the Amazonian rainforest during the middle 21stcentury. A possible cause of this
die-back is a reduction in precipi-tation over the Amazon regioncaused by a shift in atmosphericcirculation and correspondingprecipitation patterns associatedwith, again, a shift towards moreEl Nino like mean conditions intheir model.
Understanding the climate ofthe Tropical Pacific is a complexproblem because of the tightcoupling of the ocean andatmosphere in the region. Cou-pled ocean-atmosphere globalcirculation models (AOGCMs),which are now the principal toolsfor global change studies, showlarge differences in their predic-tions for Tropical Pacific climatechange [6]. We can begin byexamining two models forchanges in the mean climate andchanges in the ENSO cycle.
Collins [2], using version 2 ofthe Hadley Centre CoupledModel (HadCM2), found that atfour times pre-industrial levels ofCO2 ENSO events became largerin amplitude and more frequentthan present day ENSO events.Thus in addition to the impactsof climate change, the impacts ofENSO events would be felt moreoften and with greater magni-tude. Using version 3 of theHadley Model (HadCM3) Collins[3] found that magnitude andfrequency of ENSO eventsremained unchanged as green-house gases increased, contra-dicting the results of the earlierstudy and highlighting a level ofuncertainty. This range of uncer-tainty in the future of ENSO isfurther widened when oneexamines the responses of otherAOGCMs [6].
The difference in the ENSOresponse to global warming inHadCM2 and HadCM3 wasfound by Collins [3] to be due todifferences in the response of themean climate of the two modelsin the Tropical Pacific region.HadCM2 produced a pro-nounced broad maximum in SSTwarming on the equator while
“How … can we resolveuncertainties in climatechange in the Tropical Pacific(and indeed globally) if modelsare highly sensitive to smallchanges the parameters oftheir physical schemes?”
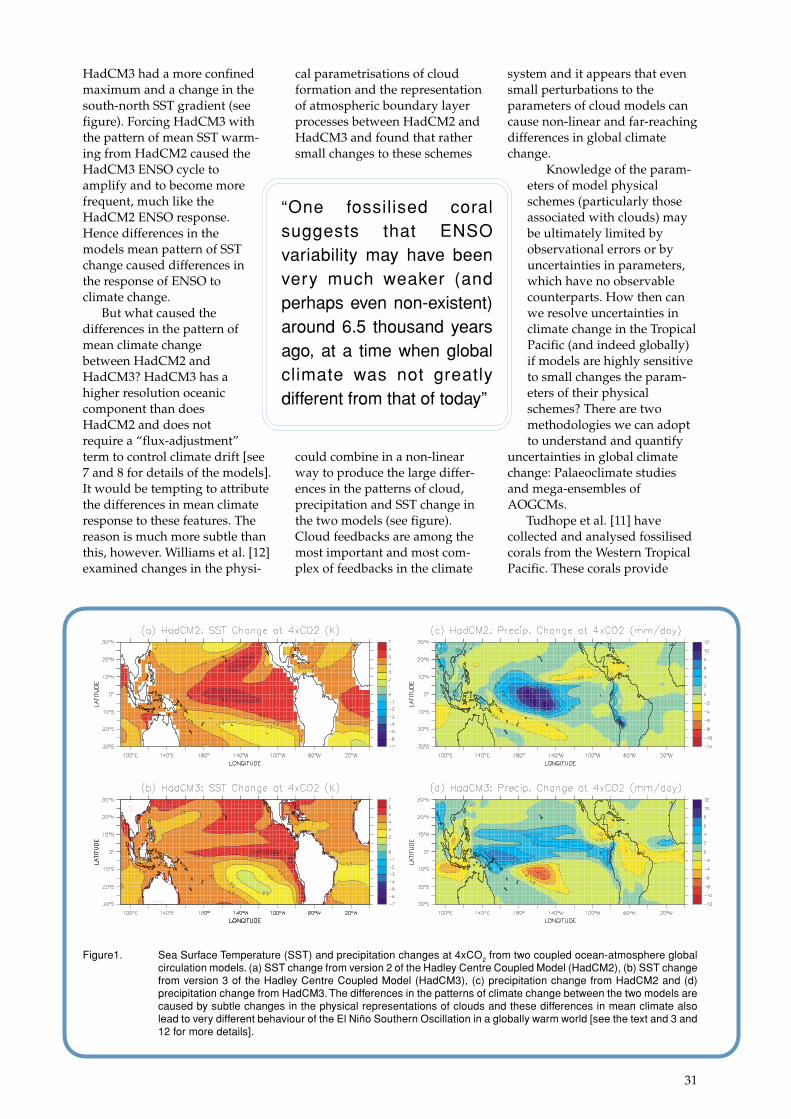
31
HadCM3 had a more confinedmaximum and a change in thesouth-north SST gradient (seefigure). Forcing HadCM3 withthe pattern of mean SST warm-ing from HadCM2 caused theHadCM3 ENSO cycle toamplify and to become morefrequent, much like theHadCM2 ENSO response.Hence differences in themodels mean pattern of SSTchange caused differences inthe response of ENSO toclimate change.
But what caused thedifferences in the pattern ofmean climate changebetween HadCM2 andHadCM3? HadCM3 has ahigher resolution oceaniccomponent than doesHadCM2 and does notrequire a “flux-adjustment”term to control climate drift [see7 and 8 for details of the models].It would be tempting to attributethe differences in mean climateresponse to these features. Thereason is much more subtle thanthis, however. Williams et al. [12]examined changes in the physi-
cal parametrisations of cloudformation and the representationof atmospheric boundary layerprocesses between HadCM2 andHadCM3 and found that rathersmall changes to these schemes
could combine in a non-linearway to produce the large differ-ences in the patterns of cloud,precipitation and SST change inthe two models (see figure).Cloud feedbacks are among themost important and most com-plex of feedbacks in the climate
system and it appears that evensmall perturbations to theparameters of cloud models cancause non-linear and far-reachingdifferences in global climatechange.
Knowledge of the param-eters of model physicalschemes (particularly thoseassociated with clouds) maybe ultimately limited byobservational errors or byuncertainties in parameters,which have no observablecounterparts. How then canwe resolve uncertainties inclimate change in the TropicalPacific (and indeed globally)if models are highly sensitiveto small changes the param-eters of their physicalschemes? There are twomethodologies we can adoptto understand and quantify
uncertainties in global climatechange: Palaeoclimate studiesand mega-ensembles ofAOGCMs.
Tudhope et al. [11] havecollected and analysed fossilisedcorals from the Western TropicalPacific. These corals provide
Figure1. Sea Surface Temperature (SST) and precipitation changes at 4xCO2 from two coupled ocean-atmosphere globalcirculation models. (a) SST change from version 2 of the Hadley Centre Coupled Model (HadCM2), (b) SST changefrom version 3 of the Hadley Centre Coupled Model (HadCM3), (c) precipitation change from HadCM2 and (d)precipitation change from HadCM3. The differences in the patterns of climate change between the two models arecaused by subtle changes in the physical representations of clouds and these differences in mean climate alsolead to very different behaviour of the El Niño Southern Oscillation in a globally warm world [see the text and 3 and12 for more details].
“One fossilised coralsuggests that ENSOvariability may have beenvery much weaker (andperhaps even non-existent)around 6.5 thousand yearsago, at a time when globalclimate was not greatlydifferent from that of today”

32
windows of ENSO variability inperiods of history back 130,000years. One fossilised coralsuggests that ENSO variabilitymay have been very muchweaker (and perhaps even non-existent) around 6.5 thousandyears ago, at a time when globalclimate was not greatly different
from that of today. AOGCMs canbe forced with boundary condi-tions from different epochs andvalidated using the palaeorecord. Given the sensitivities ofAOGCMs, the validation processneeds to be quantitative and thisrequires careful use of both thepalaeo proxies, which are indi-rect measures of climate, and themodel that simulates climate inlarge-scale grid-boxes with
dimensions of several hundredsof kilometres [see e.g. 4]. Onepossible future developmentwould be to include models ofcoral growth within theAOGCMs themselves.
A brute-force method ofquantifying uncertainty inAOGCM estimates of climate
change is to systematicallyexplore all the parameters ofthe model physical schemesand map the potentialclimate change. This wouldallow the construction of theprobability density function(PDF) of future climatescenarios for use by policymakers. Because of thecomplexity of AOGCMs andbecause of potential non-linear interactions betweenthe parametrisation schemes
(recall the Williams et al. [12]study) this requires manythousands and perhaps millionsof AOGCM simulations. Such astudy is beyond the capacity ofthe world’s currentsupercomputer resource. A novelsolution was suggested by Allen[1] who proposed that if theAOGCM could be run on aPersonal Computer then mem-bers of the public could each
produce a climate change predic-tion with a combination ofparameter perturbations, and thePDF could be made. Theclimateprediction.com project isnow underway - more details areavailable fromwww.climateprediction.com.
It appears that, just as theTropical Pacific is an importantmodulator of global climate onseasonal and interannual timescales, it also plays an importantrole in the global climate changeproblem. The coupled AOGCMscurrently show a wide range ofpossible changes in both themean and the ENSO variabilityin the region and hence there is alarge degree of uncertainty bothin local and in global human-induced climate change. It ishoped that future palaeoclimatestudies and mega-ensembleapproaches will help in under-standing and quantifying theseuncertainties.
Matthew Collins,Centre for Global
Atmospheric Modelling,Department of Meteorology,
University of Reading,Reading, RG6 6BB, UK.
E-mail: [email protected]
References1. Allen, M. R. (1999): Do-it-yourself climate prediction, Na-ture, 401, 642.
2. Collins, M. (2000a): The El-Nino Southern Oscillation inthe second Hadley Centre coupled model and its responseto greenhouse warming. J. Climate, vol 13(7), 1299-1312.
3. Collins, M. (2000b): Understanding Uncertainties in theresponse of ENSO to Greenhouse Warming. Geophys. Res.Letts., vol 27(21), 3509-3513.
4. Collins, M., Osborn, T. J., Tett, S. F. B., Briffa, K. R. andSchweingruber, F. H. (2001): A comparison of the variabilityof a climate model with palaeo-temperature estimates froma network of tree-ring densities. J. Climate, in press.
5. Cox, P. M., Betts, R. A., Jones, C. D., Spall, S. A. andTotterdell, I. J. (2000): Acceleration of global warming due tocarbon-cycle feedbacks in a coupled climate model. Nature,408, 184-187.
6. Cubash, U., Meehl G. A., et al. (2001): Projections of Fu-ture Climate Change. Chapter 9, IPCC Third AssessmentReport.
7. Gordon, C., Cooper, C., Senior, C. A., Banks, H., Gregory,J. M., Johns, T. C., Mitchell, J. F. B. and Wood, R. A. (2000):The Simulation of SST, sea ice extents and ocean heat trans-
port in a version of the Hadley Centre coupled model with-out flux adjustments. Climate Dynamics, 16, 147-168.
8. Johns, T. C., Carnell, R. E., Crossley, J. F., Gregory, J. M.,Mitchell, J. F. B., Senior, C. A., Tett, S. F. B. and Wood, R. A.(1997): The Second Hadley Centre Coupled Ocean-Atmos-phere GCM: Model Description, Spinup and Validation. Cli-mate Dynamics, 13, 103-134.
9. Latif, M., Roeckner, E, Mikolajewicz, U. and Voss, R. (2000):Tropical Stabilisation of the thermohaline circulation in agreenhouse warming simulation, J. Climate, 13, 1809-1813.
10. Thorpe, R. B., Gregory, J. M., Johns, T. C., Wood, R. A.and Mitchell, J. F. B. (2001): Mechanisms determining theAtlantic Thermohaline Circulation response to greenhousegas forcing in a non-flux adjusted coupled climate model. J.Climate, 14, 3102-3116.
11. Tudhope, A. W. et al. (2001): Variability in the El Nino-Southern Oscillation through a glacial-interglacial cycle. Sci-ence, 291, 1511-1517.
12. Williams, K. D., Senior, C. A. and Mitchell, J. F. B. (2001):Transient climate change in the Hadley Centre models: Therole of physical processes, J. Climate, 14, 2659-2674.
“…just as the Tropical Pacificis an important modulator ofglobal climate on seasonaland interannual time scales,it also plays an important rolein the global climate changeproblem”

33
One of the approaches for recommending crop and water manage-ment practices under variable climate conditions is the use of crop-growth simulation models linked with weather forecasts [1]. Thisapproach has been pointed out as the soundest available during theSTART-WMO* supported Climate Prediction and Agriculture(CLIMAG) workshop. The approach was used to develop a methodol-ogy for predicting ENSO-caused climate-variability effects on sugarcane yields at farms in Cuba, Mexico and Venezuela; in the frame-work of a proposal supported by the Inter-American Institute forGlobal Change Research (IAI). Our starting hypothesis was thatENSO effects on rain fed sugarcane mainly due to water deficits/excess as a result of droughts/rainfall events associated with ENSO.
Estimations of ENSO effects on sugarcaneyields in Cuba, Mexico and Venezuela
by A. Utset*, J. López and M. Alvarez
Local daily climatic variableseries are not usually longenough for assessing ENSOeffects on crop yields. Hence, weused a weather generator forobtaining an ENSO-conditionedclimate series. A mechanisticmodel, based on the Richardsequation for simulating the soilwater content and crop wateruse, was selected. These modelsprovide the most accurateestimates of water effects on cropyields [2].
Therefore, the tested method-ology combines a weathergenerator, able to provide anENSO-conditioned climateseries, with a mechanistic cropmodel for estimating ENSOeffects on sugarcane water useand yields in rain fed conditions.This paper presents our mainresults.
Crop model andmodel validations
The model SWAP [5] was usedfor sugarcane yield estimations.SWAP requires some particularcrop function, which wereexperimentally determined forsugarcane by Ruiz et al. [3].
Experimental farms of severalhundred hectares were selectedin each country. Climate datawere assumed as constant for
each experimental zone. The soilhydraulic properties werecalculated from pedotransferfunctions, using available soildata. Average values of thoseproperties were assigned to eachsugarcane field through a GISoperation.
Simulations were performedfor the 1995-1996 croppingseason in the three countries. ThePenman-Monteith potentialevapotranspiration was calcu-lated daily and was taken as thetopsoil boundary condition. Freewater flux was taken as thebottom boundary condition.Daily rainfall was considered asthe only water supply.
The simulated and actualyields as well as the Root MeanSquare Errors (RMSE) aredepicted in Figure 1. The correla-tion coefficients between actualand estimated yield are 0.46,0.36, 0.54 and 0.41 for the Cuban,Mexican, Venezuelan and overalldata cases, respectively. As canbe seen in Figure 1, the averageestimated and actual yields areequivalent. Furthermore, wefound that the model mimics notonly the final yields, but also thesprouting month effects, andhence the weather influence onthe yields. However, the model’spredictive accuracy can beimproved if local conditions are
considered. Utset et al. [4]provides all the details of themodel validations.
Comparison betweenactual and generated
precipitation andevapotranspiration
A daily series of precipitation,maximum, minimum and meantemperatures, wind speed, sunradiation and relative humidityfor more than 25 years wasavailable in each country. TheJapan Meteorological AgencyENSO index was used to classifyENSO years.
One hundred years of dailyevapotranspiration and rainfalldata were generated in eachcountry for El Niño, La Niña andNeutral conditions. A daily-basinweather generator was used. Thecorrelation coefficients betweenactual and generated data are0.97 and 0.92 for the monthlyprecipitation and its standarddeviation, respectively. However,the weather generator underpredicts very large rainfalls andslightly over predicts the stand-ard deviation of the monthlyrainfall. The correlation coeffi-cient between actual and gener-ated evapotranspiration is 0.97.Still, the weather generatorsystematically under estimatesthe ETP. Conversely, it overestimates the ETP standarddeviation, even though thecorrelation coefficient remainsrelatively high (0.84). Despitethese inaccuracies, we considerthat the weather generator is ableto mimic ENSO effects on thestudied variables, particularly onprecipitation.
Simulated ENSOeffects on sugarcaneyields and possible
recommendations fordecision-makers
The 100 generated years of dailyevapotranspiration and precipi-tation data for each ENSO phaseand country were used in the

34
simulations. The consideredsprouting and harvest dates in allsimulations were January 1 andDecember 20, respectively. Rainfed conditions and perfectdrainage at the bottom of the 1-msimulation layer were assumed.The “average” values of the soilhydraulic properties at each farmwere calculated through thescaling procedure. Relative finalyields [5] were estimated at theend of each SWAP run.
The basic statistics of thesimulated relative yields for eachENSO phase and country isshown in Table I. Significantlylower yields are obtained inCuba and significantly higheryields in Mexico during El Niñoyears. The yields are significantlylower in Neutral years in Ven-ezuela. El Niño increases yieldvariability in the Cuban farm,whereas this variability is higherin Neutral years in Venezuela.The temporal behavior of relativeyields (figures not shown)provides evidence that most ofthe negative effect is due towater stress in the first months,during the sugarcane intensivegrowing period. Accordingly,sugarcane farmers should
provide irrigation in thesemonths in El Niño years in Cubaand in Neutral years in Ven-ezuela.
The correlations betweenrelative yields and the simulatedcomponents of the water balance,i.e. effective rainfall, transpira-tion, soil evaporation and waterflux at the bottom of the simu-lated soil layer, are shown inTable II for each ENSO phase andcountry. As expected, transpira-tion is significantly positivelycorrelated to the yields in all thecases. Soil evaporation is signifi-cantly negatively correlated tothe relative yields in Cuba in ElNiño years, when the lowestyields are predicted. Hence,farmers should prevent evapora-tion through any managementpractice. However, soil evapora-tion increases the sugarcanerelative yields in Mexico andVenezuela. Rainfall is negativelycorrelated and bottom fluxpositively correlated in theCuban farm, which indicates thata drainage solution for the heavyclayey soils of the farm couldimprove the yields. Rainfall ispositively correlated in theMexican farm, since the precipi-
tation is usually scarce at thebeginning of the crop season andirrigation supply is required, ascan be concluded from the lowmean relative yields obtained inthe Mexican farm (see Table I)under the simulated rain fedconditions. The water lost bydeep drainage affects sugarcanegrowing in Venezuela in Neutralyears, when the lowest yields areachieved. This can be concludedfrom the significant negativecorrelation coefficient betweenbottom flux and relative yields inthis case, as shown in Table I. Allof these results depend on themodeling assumptions and onthe soil hydraulic properties.
ConclusionsIndeed, the combination of aphysically based model and aweather generator could providemany useful recommendations tosugarcane and agriculturaldecision-makers regarding cropwater management under ENSOconditions. The crop modelmimics climate effects on theyields and the weather generatoreffectively reproduces climatebehavior. However, the simula-tion outputs rely on the model
Figure 1. Mean actual and simulated yields and corresponding RMSE. The Y-bars show the standard deviations.

35
Table I. Means, standard deviations (SD), coefficients of variation (CV), medians and maximum (Max) andminimum (Min) values of the Relative yields estimated from the 100 simulations at each country andENSO phase.
* Significantly at the 95% confidence level
References1. Hoogenboom, G. 2000 Contribution of agrometeorologyto the simulation of crop production and its applications. Agric.For. Meteorol. 103:137-157
2. Leenhardt, D., M. Voltz, S. Rambal, 1995. A survey of sev-eral agroclimatic soil water balance models with referenceto their spatial application. Eur. J. Agron. 4 (1), 1-14.
3. Ruiz, M., Utset A., Medina, H., García, J., Fleitas, E.,Ruiz, J., Ferrer, M., 1999. Modelo determinístico para estimarel rendimiento de la caña de azúcar. Research Report
050130016, Ministry of Sciences and Technology, Havana.
4. Utset, A. 2001. Estimation of ENSO effects on sugar caneyields in several Latin-American countries. IAI Proposal ISP-III 41. Final Report. Inter-American Institute for Global ChangeResearch (IAI).
5. Van Dam, J. C., Huygen, J., Wesseling, J. G., Feddes, R.A., Kabat, P., van Walsum, P. E. V., Groenendijk, P., vanDiepen, C. A., 1997. Theory of SWAP version 2.0. Report71. Technical Document 45, Wageningen, 167 pp.
assumptions and on the weathergenerator performance. There-fore, validation studies in severalyears are required before usingthe methodology for decision-making. The simulation resultsand the corresponding recom-mendations for decision-makersare highly site specific and henceparticular studies should be
Table II. Correlation coefficients between the estimated relative yields and the components of the waterbalance, as obtained from the 100 simulations.
carried out at several places ofeconomic interest or climaticrisk.
Angel Utset+
Agrophysics Research Unit, Agricul-tural University of Havana,
Apdo. 5117, La Habana 10500,Cuba.
E-mail: [email protected]
José LópezInstitute of Geography,
National University of México(UNAM), Mexico
Manuel AlvarezUniversity of Los Llanos “Ezequiel
Zamora” (UNELLEZ),Guanare, Portuguesa, Venezuela
+Author for correspondence

36
Down to Earthafter AmsterdamLetter to the Editor,from Peter M. Haugan
The Global Change Open Science Conference in Am-sterdam 10-13 July 2001 was an unprecedentedevent, a celebration and a success in many ways.Many good overview talks, detailed information inparallel and poster sessions, active communicationbetween scientists and policy makers, and an op-portunity to meet colleagues for off-line discus-sions about projects, activities and scientific sta-tus. As one of the many conference participants, Iwould like to thank the IGBP leadership and or-ganization for their efforts in collaboration withWCRP and IHDP, and congratulate the rapidprogress obtained by the IGBP programme in therelatively few years that it has existed. The fu-ture evolution of the IGBP can play a very impor-tant role for development of many branches ofscience. It is therefore critical to examine and dis-cuss the path that the programme is presently tak-ing. As an outsider to IGBP until very recently, Iwould like to raise some questions, which I hope toget answered or discussed.
My first question is, how is the research agenda ofthe IGBP set? During the first day of the OpenScience Conference, following an appropriate, col-ourful and stimulating overview by the chair of theIGBP, and information on recent actions in indus-try, the following plenary talks discussed a numberof so-called research challenges. These were allassociated with legal aspects of the Kyoto proto-col and how nations could comply with or circum-vent various paragraphs there. The research chal-lenges all dealt with short-term behaviour of ter-restrial carbon sinks. These issues have made theirway into the new proposed (or already endorsed?)IGBP/WCRP/IHDP joint project on the CarbonCycle, where one of the three especially highlightedmajor goals is to explain the current patterns ofsources and sinks.
In the session on sustainability science on the fol-lowing day in Amsterdam, professor Bert Bolin inhis very polite way, made the point that in the broadflow of information from the IGBP to policymakers,some key messages can easily get lost. One of themis that the carbon problem is primarily a problemon a centennial time scale. It is an important meth-odological question in earth system modelling to ag-gregate unnecessary details and retain importantsystem-level features (IGBP Science #4, p. 24).Has this message made its way to IGBP planning onthe carbon issue? Based on the way the Amster-dam conference was structured, it is tempting tosuggest that there has been perhaps too much in-fluence from short-term concerns of politicians
and/or some terrestrial ecosystem scientists. Isincerely hope this is not the case, but it didemerge as a take-home message from the firstpart of the conference. It can in fact be verydamaging to national and other research policiesif the most important aspects of an issue get lostin a flow of less essential side tracks. In thiscase it does make a difference. The research thatcan shed light on centennial scale carbon trans-ports may be quite different from that whichilluminates interannual and geographical variationsin sinks.
More generally, should it not be the role of IGBPand ICSU to come up with independent adviceand highlight themes that are important, but arenot necessarily high up on the short-term politi-cal agenda? In the broad new structure of theIGBP (see IGBP brochure: A study of globalchange) most other compartments and interfacesare mentioned, but I miss something on the deepocean sea floor, and, if you wish, its interactionwith the ocean above. This boundary surface cov-ers 70 % of the planet and probably contains ge-netic and other resources which may be crucialin a long-term perspective. The deep ocean chem-istry and the sea floor are already affected byanthropogenic carbon and trace gases. It is notcurrently high on the political agenda and has notmade its way to IGBP priorities. It is in fact notmentioned at all. Is this another reflection ofexternal determinants of IGBP priorities?
The IGBP is marching at a rapid pace. Motivatedby the possibility for science to contribute sig-nificantly and actively to political processes linkedto sustainable development, present emphasis ison synthesis, integration and cross-disciplinaryactivities. This has been spelled out e.g. in therecent IGBP Science Series #4. My second ques-tion is whether framework programmes, consen-sus building, capacity building, and advice topolicymakers should be prioritised tasks of theIGBP in the future? It is perfectly appropriatethat science coordinated by ICSU and IGBP un-derpins intergovernmental processes and panels,and that prominent scientists in the IGBP arealso advisers to governments and political insti-tutions. But are these activities as such suitablefor a non-governmental scientific programme?
Over the past decade, an unprecedented numberof scientific panels have been set up to advisegovernments on various environment and sustain-able development issues. More than 3000 expertsare currently appointed to UN-sponsored advi-sory processes alone (www.unep.ch/earthw/sciadv2.htm). Can too much eagerness to contrib-ute to action-oriented programmes in the longrun jeopardize the role of the IGBP as an inde-pendent scientific advisor? Policy and action pro

37
grammes rely on value-based judgements. Scien-tific consensus building and synthesis are re-source-demanding and challenging tasks. Whoshall champion the basic research efforts neededif even the IGBP prioritises integration and in-terpretation that semi-political panels are per-haps better placed to deal with? How to organ-ize capacity building is a related aspect. It is easyto agree that capacity building is a good invest-ment for global earth science as well as for de-velopment and alleviation of poverty. However,rather than embarking on capacity building or-ganized by the IGBP, perhaps it would be moreproductive to recommend governments tostrengthen capacity building programmes of ex-isting intergovernmental organizations. When ap-propriate, they will certainly consult the IGBPand IGBP scientists anyway.
A third question is, how to ensure quality of IGBPscience in the future? This may seem an improperquestion to ask since it is easy to convince one-self that the IGBP presently enjoys input from alarge number of highly qualified scientists. How-ever, in the long run, mechanisms may need to beinstitutionalised in order to secure a similar con-tinued quality. My, possibly biased, impression isthat with the presently expressed sense of ur-gency in global change research, there is a ten-dency for the IGBP to formulate research plansrapidly with limited independent review. The plansdefinitely tend to be very broad, effectively ac-cepting proposals and formulations put togetherby many active subgroups. Are there satisfac-tory procedures in place to prioritise? This wouldimply the need to sometimes say no, and to beable to give lower priority to some issues thanothers. Admittedly that is very hard to do, sincevery much research is in some way relevant toglobal change. But unless it is done, the IGBP sci-ence plans can be counter-productive. If too manyscientists can find a home for their pet activityin some corner of IGBP plans, one runs the riskof attracting mainly well-established and politi-cally active subgroups. In the mean time the mostimportant and most challenging scientific prob-lems representing new areas of research thatrequire top intellectual resources and effortsmight not get the attention they deserve, nei-ther from the IGBP nor from the funding agen-cies who could look to IGBP for advice.
Emphasis on broad reviews, synthesis, frame-works, dialogue with non-scientific groups andtight integration with policymakers does not haveto, but can, reduce the possibilities for classicalscientific peer review activities. We heard manyexcellent review presentations in Amsterdam, ande.g. recently published reviews from PAGES andJGOFS science provides testimony to the impor-tance of such activities. There were also presen-
tations in Amsterdam containing mistakes whichwould not have survived peer review, and examplesof improper mix of science and non-scientific in-teractions with society. The format of the con-ference did not allow much interventions or dis-cussion. Is there a danger that the “scientificmethod” as such, with formulation and possible re-jection of hypotheses, discussion and critique, mayget lost in the strive for usefulness and immedi-ate policy relevance? It is more important thanever to stress that minimum scores on the “old”quality dimensions are required. How do we ensuretraditional quality in interdisciplinary research?There are not many experts in “earth system sci-ence”. Perhaps it is too easy to trust specialists.Those specialists who articulate well are not al-ways those who have the deepest insight.
These may seem like primarily critical remarks. Butmy comments are meant to be constructive. I hopethat others who care about the future of earthscience as much as I do, take part not only in theindividual scientific activities, but also in the dis-cussion about the appropriate role of the IGBP, aswell as ways and means to secure this role.
I am professor of physical oceanography at theUniversity of Bergen, Norway, member of theJGOFS SSC and the IOC/SCOR Carbon AdvisoryPanel, president of the Norwegian GeophysicalSociety, and Norwegian delegate to Intergovern-mental Oceanographic Commission. My research ispresently funded by the Norwegian Research Coun-cil, the European Union and industry. This contri-bution contains viewpoints on behalf of myself onlyand does not necessarily represent any of the men-tioned organisations or institutions.
Peter M. Haugan
Response to Peter Haugan’sLetterPeter Haugan’s letter raises some critical issuesconcerning the ways in which IGBP determines andcarries out its research agenda and indeed somefundamental questions about the place of IGBP inthe broader set of activities associated with glo-bal environmental issues.
1. How is the research agenda of IGBP set?1. How is the research agenda of IGBP set?1. How is the research agenda of IGBP set?1. How is the research agenda of IGBP set?1. How is the research agenda of IGBP set?
The research questions tackled within IGBP areset by a combination of ‘bottom-up’ and ‘top down’approaches. Thousands of scientists around theworld contribute to IGBP. Through their work inIGBP-initiated activities, they generate both newunderstanding of critical Earth System processesand new questions that must be tackled if progressis to continue. In addition, IGBP is undertaking amore formal process to define the agenda for the

38
next decade of its research. This process involves(i) the addition of ‘new blood’ to the planning teams- scientists not currently associated with IGBP;(ii) interaction with the assessment community,most notably the Intergovernmental Panel on Cli-mate Change (IPCC) and the Millennium EcosystemAssessment (MA), regarding the priority questionsarising from their assessments; (iii) open sciencemeetings on proposed new projects to allow thescientific community as a whole to have appropri-ate and timely input into the process; and (iv) muchelectronic communication with a very broad rangeof scientists throughout the whole process.
The Scientific Committee of the IGBP provides a‘top down’ approach to ensure that the overall re-search agenda of the programme is well focused,manageable, balanced and able to address the largesystem-level questions that are now arising in EarthSystem Science. The SC-IGBP carefully reviewsall proposed new research projects and revisionsto existing projects in the context of the pro-gramme as a whole. The aim is to prevent projectsfrom becoming collections of many individual orsmall-group agendas and ensures the coherence ofthe programme as a whole. Although this bottom-up/top-down approach is long and somewhat cum-bersome in terms of multiple reviews at variousstages (contrary to Peter Haugan’s impression), itdoes produce a cutting-edge, achievable, widelyaccepted research agenda for the programme.
In terms of the more specific issues raised in Pe-ter Haugan’s letter: (i) Long time-scale processesare indeed included in the new Carbon Joint Projectand explicitly noted in the Project’s prospectus,available at the Global Change Open Science Con-ference and from the IGBP Secretariat in Stock-holm. (ii) Scientific questions in the deep ocean inan Earth System context are under considerationas new ocean research within IGBP is being devel-oped. The planning process is still in its early stageswith an IGBP-SCOR Planning Committee develop-ing a set of draft questions for further consid-eration by the community.
2. Should framework programmes, consensus build-2. Should framework programmes, consensus build-2. Should framework programmes, consensus build-2. Should framework programmes, consensus build-2. Should framework programmes, consensus build-ing, capacity building, and advice to policymakersing, capacity building, and advice to policymakersing, capacity building, and advice to policymakersing, capacity building, and advice to policymakersing, capacity building, and advice to policymakersbe prioritised tasks of the IGBP in the future?be prioritised tasks of the IGBP in the future?be prioritised tasks of the IGBP in the future?be prioritised tasks of the IGBP in the future?be prioritised tasks of the IGBP in the future?
Dealing with each of the issues in turn: (i) IGBP doesnot directly fund individual research projects them-selves but rather provides a framework within whichthese projects can work together towards commonobjectives. IGBP focuses on those questions and ac-tivities where an international approach is the onlyor best way to tackle the question. Building widelyaccepted and agreed frameworks is a key IGBP ac-tivity.
(ii) IGBP periodically carries out synthesis of its ownwork (syntheses are not the same as either assess-
ments or consensus building) to attempt to answerthe broad questions around which it has organisedits research and to build a new level of insight andunderstanding that provides the foundation for thenext phase of research.
(iii) IGBP cannot continue to be dominated by thewealthy countries of the North and claim to be atruly international research programme. Capacitybuilding is crucial and central to the work of theprogramme. Through START, jointly sponsored byIGBP, IHDP and WCRP, the programmes are build-ing up stronger participation of developing countryscientists in their research networks. Much remainsto be done, but all three programmes strongly feelthat capacity building cannot be left to others. Itis vitally important for the programmes themselves.
(iv) IGBP’s activities are almost entirely funded bythe public sector in about 50-60 countries aroundthe world. They quite appropriately expect thatIGBP’s research be relevant to the global environ-mental issues that are affecting their countries,and furthermore that IGBP communicate the re-search in ways that inform (but not prescribe)policy debate.
3. How can the quality of IGBP science be en-3. How can the quality of IGBP science be en-3. How can the quality of IGBP science be en-3. How can the quality of IGBP science be en-3. How can the quality of IGBP science be en-sured in future?sured in future?sured in future?sured in future?sured in future?
All of the research published as a result of IGBPactivities must go through the normal peer-reviewprocess. The IGBP website (www.igbp.kva.se) con-tains a list of publications arising from IGBP-spon-sored activities. The websites of the core projectscontain even more extensive lists. All of these pub-lications have been peer-reviewed in the normalfashion. The set of synthesis volumes now nearingcompletion have gone through an exhaustive re-view process that has added about six months totheir publication schedules but has ensured thequality of the volumes.
In terms of the programme as a whole, IGBP wasreviewed in 1995 by its parent organisation ICSU(International Council for Science) and by IGFA(International Group of Funding Agencies). Over-sight of the programme is carried out annually byICSU’s Advisory Committee on the Environment. Amajor review of the programme by ICSU is dueagain soon.
In the final analysis, the quality of the programme’sscience is best ensured by attracting the highestquality scientists to the programme. In this re-gard, IGBP continues to be very successful, andthe future for international Earth System Sciencewithin the framework of IGBP and its partner pro-grammes IHDP, WCRP and DIVERSITAS appearsexceptionally bright.
Will Steffen, Executive Director, IGBP

39
New members of the Scientific Committee of the IGBPProfessor Karin Lochte is a biological oceanographer with a wide ex-perience in the investigation of marine microbial processes in the openocean and coastal seas. Her scientific interests focus on the role ofmicroorganisms in the cycling of carbon in the ocean, particularly inthe deep sea. She has been actively involved in the JGOFS researchprogrammes since the beginning of this core project and is a memberof the JGOFS scientific steering committee. After her PhD in 1985,
which she obtained at the School of Oceanography in Bangor North Wales, UK, Karin worked asa scientist at the Institut of Marine Sciences at the University of Kiel, and at the Alfred-Wegener-Institut for Polar and Marine Research in Bremerhaven. Since 1995 she has taught biologicaloceanography, at first as a Professor at the Baltic Sea Research Institute at the University ofRostock and since 2000 at the Institut of Marine Sciences at the University of Kiel, where she ishead of the Department of Biologial Oceanography. She has contributed to the development ofmarine science plans of the European Science Foundation. As a member of the German NationalCommittee for Global Change Research and of the Senate Commission of the German ResearchCouncil for Oceanography she is involved in the development of global change research on anational level.
Professor An Zhisheng is well-known in the past global change and qua-ternary science Communities. He is a member of the Chinese Academyof Sciences and the Third World Academy of Sciences. He has beenworking on East-Asian Monsoon changes, dust accumalation, and theinteractions of these with global change. He was invited as key-notespeaker at the SAC IV meeting, Beijing in 1995 and at the 1st IGBPPAGES Open Science Meeting, London in 1998. He worked at the StateKey Laboratory of Loess and Quaternary Geology as director from 1989to 1999; he is at present the director of the Institute of Earth Environment,Chinese Academy of Sciences. In 1999 he was elected the vice presi-
dent of INQUA after being the president of INQUA Loess Commission for two terms (1991-1999).His contributions to science won him Chinese Natural Scientific Awards both in 1991 and in 1999.
Manipulating terrestrialcarbon sinksLetter to the Editor, from CaminiSeneviratne
It is reported that both forestry and agriculturalmanagement have the potential to increase terres-trial C sinks (IGBP Newsletter, No. 46, p. 26, June2001). However, recent studies showed that fastturnover rates of organic C in the forest floor litterlayer result in quick return of the C to the atmos-phere in little over 3 years (Nature 411: 466, 2001).Additional C taken up by some forests in responseto atmospheric CO
2 enrichment is partitioned pref-
erentially to fast turnover pools (i.e. leaves and fineroots) (R. Norby et al., 86
th annual meeting of ESA,
5-10 August, 2001). Production of slower turnoverpools like refractory humus substances in soils, whichhave turnover times over 1000 years, sequesters only0.7% of terrestrial net primary production (Nature348: 232, 1990). This justifies that terrestrial C
sinks would be short-term, one-off benefits thatshould not be considered as long term alternatives tocutting emissions (Nature 412: 108, 2001). The ques-tion here is how can we increase the production ofthe humus substances to enhance long term C stor-age? This can easily be done by direct inoculation ofsoil fauna to the litter layer. In a spruce forest inGermany, the inoculation of earthworms markedly in-corporated organic matter to a depth of 20 cm (SoilBiol. Biochem. 29: 677, 1997). In a woodland floodplain in U.S., earthworms consumed all the litter de-posited on the soil surface within several weeks (Am.Midl. Nat. 113: 1, 1985). Soil faunal activities increaseN availability and hence C sequestration in plants (Ecol-ogy 72: 665, 1991). Therefore, soil faunal inoculationhas a two-fold advantage; increased C sequestrationin soils as well as in plants. Further C sequestration inforest trees may be possible by foliar application ofboth macro- and micronutrients to the canopy usingaeroplanes.
Camini Seneviratne, Institute of Fundamental Stud-ies, Sri Lanka. E-mail: [email protected]
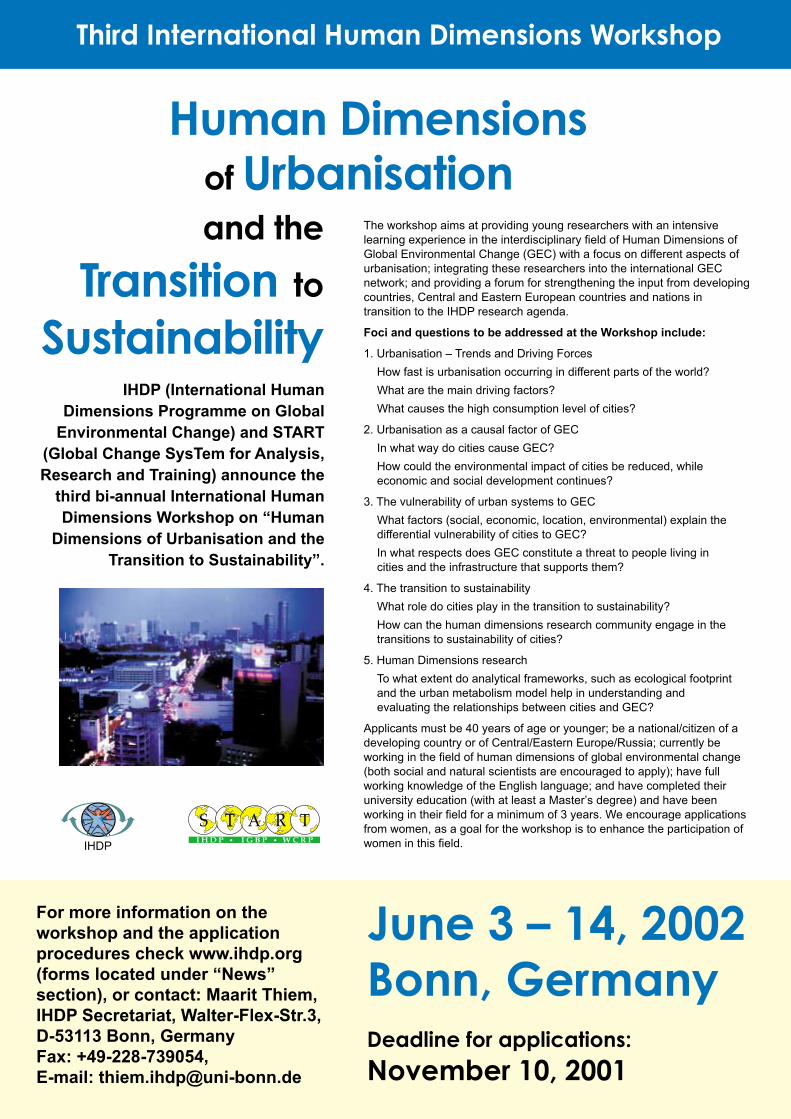
40
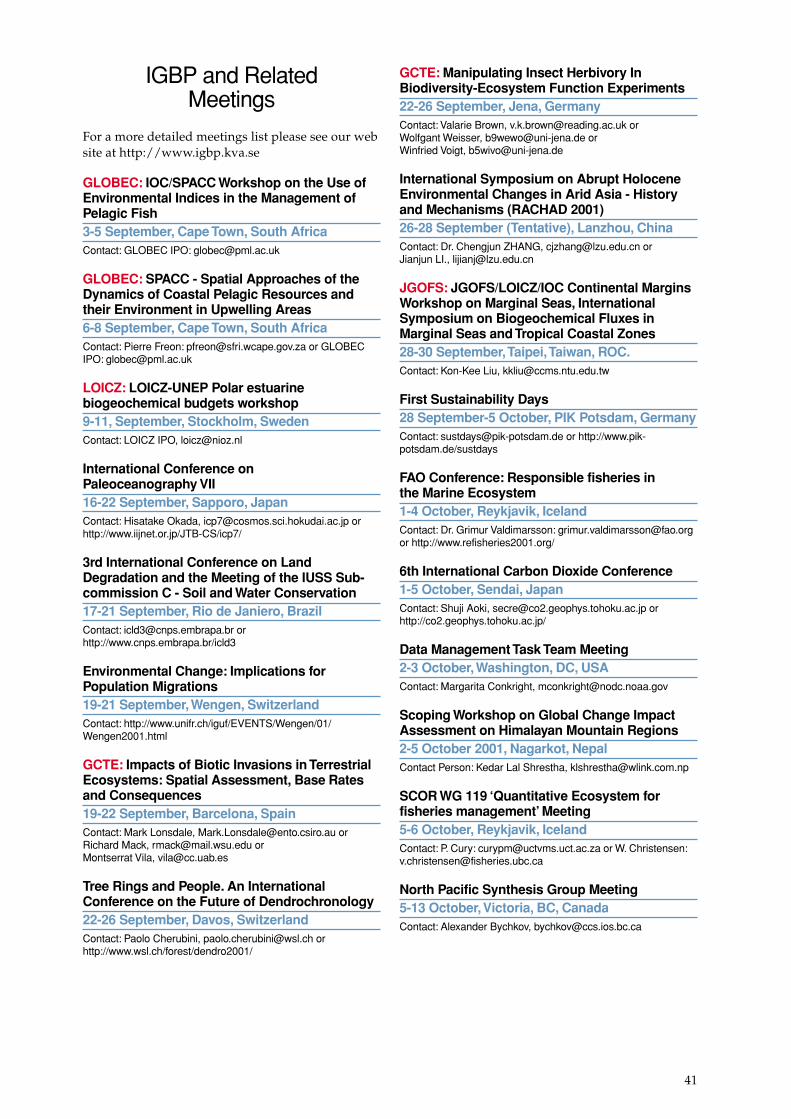
41
IGBP and RelatedMeetings
For a more detailed meetings list please see our website at http://www.igbp.kva.se
GLOBEC: IOC/SPACC Workshop on the Use ofEnvironmental Indices in the Management ofPelagic Fish3-5 September, Cape Town, South AfricaContact: GLOBEC IPO: [email protected]
GLOBEC: SPACC - Spatial Approaches of theDynamics of Coastal Pelagic Resources andtheir Environment in Upwelling Areas6-8 September, Cape Town, South AfricaContact: Pierre Freon: [email protected] or GLOBECIPO: [email protected]
LOICZ: LOICZ-UNEP Polar estuarinebiogeochemical budgets workshop9-11, September, Stockholm, SwedenContact: LOICZ IPO, [email protected]
International Conference onPaleoceanography VII16-22 September, Sapporo, JapanContact: Hisatake Okada, [email protected] orhttp://www.iijnet.or.jp/JTB-CS/icp7/
3rd International Conference on LandDegradation and the Meeting of the IUSS Sub-commission C - Soil and Water Conservation17-21 September, Rio de Janiero, BrazilContact: [email protected] orhttp://www.cnps.embrapa.br/icld3
Environmental Change: Implications forPopulation Migrations19-21 September, Wengen, SwitzerlandContact: http://www.unifr.ch/iguf/EVENTS/Wengen/01/Wengen2001.html
GCTE: Impacts of Biotic Invasions in TerrestrialEcosystems: Spatial Assessment, Base Ratesand Consequences19-22 September, Barcelona, SpainContact: Mark Lonsdale, [email protected] orRichard Mack, [email protected] orMontserrat Vila, [email protected]
Tree Rings and People. An InternationalConference on the Future of Dendrochronology22-26 September, Davos, SwitzerlandContact: Paolo Cherubini, [email protected] orhttp://www.wsl.ch/forest/dendro2001/
GCTE: Manipulating Insect Herbivory InBiodiversity-Ecosystem Function Experiments22-26 September, Jena, GermanyContact: Valarie Brown, [email protected] orWolfgant Weisser, [email protected] orWinfried Voigt, [email protected]
International Symposium on Abrupt HoloceneEnvironmental Changes in Arid Asia - Historyand Mechanisms (RACHAD 2001)26-28 September (Tentative), Lanzhou, ChinaContact: Dr. Chengjun ZHANG, [email protected] orJianjun LI., [email protected]
JGOFS: JGOFS/LOICZ/IOC Continental MarginsWorkshop on Marginal Seas, InternationalSymposium on Biogeochemical Fluxes inMarginal Seas and Tropical Coastal Zones28-30 September, Taipei, Taiwan, ROC.Contact: Kon-Kee Liu, [email protected]
First Sustainability Days28 September-5 October, PIK Potsdam, GermanyContact: [email protected] or http://www.pik-potsdam.de/sustdays
FAO Conference: Responsible fisheries inthe Marine Ecosystem1-4 October, Reykjavik, IcelandContact: Dr. Grimur Valdimarsson: [email protected] http://www.refisheries2001.org/
6th International Carbon Dioxide Conference1-5 October, Sendai, JapanContact: Shuji Aoki, [email protected] orhttp://co2.geophys.tohoku.ac.jp/
Data Management Task Team Meeting2-3 October, Washington, DC, USAContact: Margarita Conkright, [email protected]
Scoping Workshop on Global Change ImpactAssessment on Himalayan Mountain Regions2-5 October 2001, Nagarkot, NepalContact Person: Kedar Lal Shrestha, [email protected]
SCOR WG 119 ‘Quantitative Ecosystem forfisheries management’ Meeting5-6 October, Reykjavik, IcelandContact: P. Cury: [email protected] or W. Christensen:[email protected]
North Pacific Synthesis Group Meeting5-13 October, Victoria, BC, CanadaContact: Alexander Bychkov, [email protected]

42
IHDP: Open Meeting of the Human Dimensionsof Global Environmental Change ResearchCommunity6-8 October, Rio de Janiero, BrazilContact: [email protected],http://sedac.ciesin.org/openmeeting/
Workshop on IMAGE ANALYSIS, sediments andpaleoenvironments8-10 October, Amherst, USAContact: [email protected] orhttp://www.geo.umass.edu/climate/imagewks.html
Chapman Conference on State-of-the-ArtHillslope Hydrology8-12 October, Sunriver, Oregon, USAContact: Jeff McDonnell, [email protected] orhttp://agu.org/meetings/cc01ecall.html
SPACC/GLOBEC Workshop onPaleoceanography10-13 October, Munich, GermanyContact: Dr. Juergen Alheit: [email protected] Dr. Uli Struck: [email protected]
START: START Scientific Steering CommitteeMeeting15-18 October, Washington, D.C., USAContact: Ching Wang, [email protected]
International Water Association World WaterCongress15-19 October, Berlin, GermanyContact: http://www.iwa-world-water-congress.de/netscape/index.html
GCTE: GCTE Focus 1 Workshop: Tracing Carbonin Elevated CO2 Experiments19-21 October, Durham, NC, USAContact: Diane Pataki, [email protected]
Joint IAPSO/GLOBEC Symposium21-28 October, Mar del Plata, ArgentinaContact: Paola Rizzoli: [email protected] or GLOBEC IPO:[email protected] or Hugh Ducklow, [email protected] or KarinLochte, [email protected]
SEARCH/APD Show Case Workshop; PastLandcover Changes; the Human Impact – AnAfrican Database and Network Symposium22-26 October 2001, Nairobi, Kenya
Contact Person: Eric Odada, Email: [email protected]
International Conference on Carbon Sinks andBiodiversity24 - 26 October, Liège, BelgiumContact: N. Baute, [email protected] orhttp://environnement.wallonie.be/presidence/en/event7/detail.htm
5th International Conference on the CenozoicEvolution of the Asia-Pacific Environment29 October-1 November, Hong Kong, ChinaContact: Dr Wyss Yim, [email protected] orProf. Jiamao Han, [email protected]
Afri Basins II Workshop on African RiverCatchments/Coastal Fluxes and HumanDimensions29 October-1 November, Nairobi, KenyaContact: LOICZ IPO, [email protected]
LOICZ AfriBASINS II Meeting; Workshop onAfrican River Catchment/Coastal ZoneInteraction and Human Dimensions29 October-1 November 2001, Nairobi, KenyaContact: Hartwig Kremer, [email protected]
Changes in Climate and Environment at High-Latitudes31 October-2 November, Tromsø, NorwayContact Kai-Rune Mortensen, [email protected] orhttp://www.ibg.uit.no/geologi/konferanser/clienvir/index.html
VI International Symposium and Field Workshopon Paleopedology (ISFWP)TBA, October, Mexico CityContact: Dr. Elizabeth Solleiro-Rebolledo,[email protected] orhttp://inqua.nlh.no/commpl/pedmeet2.htm
First ARTS Open Sciences Meeting4-7 November, Nouméa, New CaledoniaContact: Rob Dunbar (Stanford University) orThierry Correge, [email protected] orBrad Linsley, [email protected] orSandy Tudhope, [email protected] orhttp://pangea.stanford.edu/Oceans/ARTS/ orhttp://pangea.stanford.edu/Oceans/ARTS/Noumea2001.html
Africagis 2001 Conference and Exhibition5 -9 November, Nairobi, KenyaContact: Nasser Olwero, [email protected] or The WorldBank/EIS Program, c/o CSIR-Environmentek,[email protected]
International Conference on AgriculturalScience and Technology7-9 November, Beijing, ChinaContact: ICAST, China Science and Technology ExchangeCenter, [email protected] or http://www.agscience2001.org
GCTE: Trophic Interactions in a Changing World7-11 November, TBA, The NetherlandsContact: Peter de Ruiter, [email protected] or W.H. van derPutten, [email protected] or Jeff A. Harvey,[email protected] or Martin Wassen,[email protected]

43
GCTE: Workshop on IMAGES ANALYSIS8-10 November, University of MassachussetsContact: Pierre Francus, [email protected] orhttp://www.geo.umass.edu/climate/imagewks.html
PAGES: Abrupt Climate Change Dynamics10-15 November, Il Ciocco, ItalyContact: Keith Alverson, [email protected] orhttp://www.esf.org/euresco/01/lc01170a.htm
LOICZ: LOICZ/UNEP Global Synthesis ExpertWorkshop on Coastal Biogeochemistry andScaling11-14 November, Lawrence, Kansas, USA
Contact: LOICZ IPO, [email protected]
ICARDA/IGBP/IDDC Workshop: Agriculture,Environment and Human Welfare in West Asiaand North Africa. The Search for 'Sustainability'12-14 November, Aleppo, Syria
Contact: Dr Adel El Beltagy, [email protected]
Global Change and Fire Effects atLandscape Scales12-16 November, Santa Barbara, CA, USAContact: Mike Flannigan, [email protected] or SandraLavorel, [email protected]
RICAMARE Training Course on theSocio-Economic Effects of Climate Change inthe Mediterranean Region12-16 November 2001, Trieste, ItalyContact: Gerard Begni, [email protected]
JGOFS: Paleo-JGOFS Task Team and Workshop12-17 November, Germany or FranceContact: Karen Lochte, [email protected]
1st SARCS Regional Scientific CommitteeMeeting15-16 November, National Central University,TaiwanContact: Connie Chiang, [email protected]
Indicators of Sustainable DevelopmentWorkshop17-19 November 2001, National Central Univer-sity, TaiwanContact: Connie Chiang, [email protected]
GAIM: GAIM Task Force Meeting18-20 November, PIK Potsdam, GermanyContact: [email protected]/
IV International Symposium on SustainableDevelopment in the Andes: The AndeanStrategy for the XXI Century, AMA-Mérida 200125 November-2 December, Mérida, VenezuelaContact: http://www.forest.ula.ve/ama-merida2001
GLOBEC: 1st Symposium GLOBEC-Spain28- 30 November, Cadiz, SpainContact: Fidel Echevarria, [email protected] orGLOBEC IPO: [email protected] or http://www.uca.es/symposium_globec/
Scientific Forum on Global Change Studies28-30 November, Havana, CubaContact: [email protected]
Workshop for the DIAL Network for SupportingGlobal Change Research in the Asia-PacificRegionTBA, November, Malaysia Center for RemoteSensing, MalaysiaContact: Liping Di, [email protected]
African Groundwater Resources WorkshopTBA, November, Natal, South AfricaContact: Eric Odada, [email protected]
Global Conference on Oceans and Coasts atRio+103-7 December, UNESCO, ParisContact: Dr. Biliana Cicin-Sain, [email protected]
International Conference on Freshwater3-7 December, Bonn, GermanyContact: http://www.water-2001.de
Regional Climate Model Intercomparison Projectfor Asia Workshop10-13 December 2001, Kobe, JapanContact: Congbin Fu, [email protected]
LUCC: International Symposium on LUCCContribution to Asian EnvironmentalProblems13-14 December, Tokyo, JapanContact: http://shiba.iis.u-tokyo.ac.jp/LUCC/symp
44
ISSN 0284-5865
Edited by Susannah Eliott
Technical Editing by John Bellamy
Requests for reproduction of articlesappearing in this distribution should beaddressed to the Editor:
(E-mail: [email protected])
Newsletter requests and change ofaddress information should be sent to:
IGBP Secretariat
The Royal Swedish Academy ofSciences
Box 50005,S-104 05 Stockholm, Sweden
Tel: (+46-8) 16 64 48
Fax: (+46-8) 16 64 05
E-mail: [email protected]
http://www.igbp.kva.se
The IGBP Report Series is published inannex to the Global Change NewsLetter
Note to contributorsArticles should achieve a balance of (i) solid scientific content, and(ii) appeal to the broad global change research community ratherthan to a narrow discipline. Articles should be between 800 and 1500words in length, and be accompanied by one to three key graphicsor figures (colour or black and white).
Letters in response to an article in this Newsletter or relating to Glo-bal Change issues generally should be a maximum of 200 words inlength and include author and contact details.
Image qualityTo ensure clear and presentable reproduction, images for reproduc-tion need to be saved in the correct way.
Photographic images need to be saved in TIFF format. All other im-ages including charts, graphs, illustrations, maps and logos need tobe saved in EPS format. All pixel images need to be high resolution(at least 300 pixels per inch).
Some charts, graphs and illustrations can be reconstructed at theIGBP Secretariat, however, poor quality photographic images, mapsand logos can not be improved. Material “borrowed” from the Internetcan not be used for publication, as it does not fit the requirementslisted above.
Deadlines for 2001/2002:December issue Deadline for material: November 2
March 2002 issue Deadline for material: February 8
June issue Deadline for material: May 10
September issue Deadline for material: August 9
December issue Deadline for material: November 1
Send contributions by email to the Editor, Susannah EliottEmail: [email protected]; Phone: +46 8 16 64 48;Fax: +46 8 16 64 05
In coming edition of the IGBP Newsletter...
More highlights from the Open Science Conference
Skin cancer and global change
Special edition on IGBP Phase II