Embed Size (px)
Citation preview

1
A Study of Geophysical and Geochemical Data for the
Sinclair Mineral Claim
St. Mary River Region (N.T.S. 082F09)
East Kootenay - Purcell Range
Lat, Lon: 49o34’16”N, 116o17’17”W
Ft. Steele Mining Division
Kimberley, British Columbia
Reported by
E. (Ted) Sanders, prospector
August, 2015

2

3
TABLE OF CONTENTS Page
TITLE PAGE AND SUMMARY…………………………………... 1 - 2
LIST OF ILLUSTRATIONS.............................................. 4
1.0 INTRODUCTION……………………………………………………... 5
2.0 PROPERTY …………………………………………...................... 5
3.0 LOCATION AND ACCESS ……………………………………….... 6
4.0 PHYSICAL GEOGRAPHY...………………………………………... 6
5.0 HISTORY ......................…………………………………………... 7
6.0 REGIONAL GEOLOGY……………………………………………... 8
7.0 LOCAL GEOLOGY……………………………………………………. 10
8.0 GEOPHYSICAL DATA OVERVIEW ……………………………. 11
8.1 Aeromag Survey and Interpretation.............. 13
8.2 Gravity Data and Interpretation………............ 21
8.3 GSC Aeromag EM Conductivity Map............. 23
9.0 REGIONAL GEOCHEMISTRY SURVEY DATA............... 24
9.1 Table 2 – Local Samples, Element Rankings.. 26
10.0 TOPOGRAPHY and GEOLOGY CROSS-SECTION..…….. 27
11.0 SUMMARY..............................................……………….. 30
12.0 RECOMMENDATIONS..................………………………….. 31
13.0 COST STATEMENT........................………………………….. 32
14.0 STATEMENT OF QUALIFICATIONS………………………….. 33
15.0 REFERENCES........................…………………………........... 33
16.0 APPENDIX- Table 1.......................………………………….. 34

4
LIST OF ILLUSTRATIONS Page
Figure 1 – Kootenay Regional Map....................…..……………………………….. 5
Figure 2 – Mineral Titles Online Map – Sinclair Claim........………………….... 6
Figure 3 – GSC Geology - St. Mary Map sheet 082F09 (SW Quadrant)..... 7
Figure 4 – Belt-Purcell Basin - Purcell Anticlinorium................................. 8
Figure 5 – East Kootenay Surface Geology........................….…………......... 9
Figure 6 – GSC Geology - St. Mary Map sheet – Sullivan Horizon….…….…. 10
Figure 7 –GSC Geology – Cominco 1994 UTEM Survey Maps.………………… 11
Figure 8 – East Kootenay Geology - EKGDB Gravity Stations…….………….... 12
Figure 9 – East Kootenay Aeromag - Total Field Mag..............……….......... 13
Figure 10 – East Kootenay Aeromag- Low Pass Filter (Regional Mag)....... 14
Figure 11a – Sullivan Area Aeromag- Low Pass Filter (Regional Mag)........15
Figure 11b – Sullivan Area Aeromag- Medium Pass Filter…………………....... 16
Figure 11c – Sullivan Area Aeromag- Total Mag Intensity......................... 16
Figure 12a – Pakk-Sinclair Aeromag- Low Pass Filter (Regional Mag)..……. 17
Figure 12b – Pakk-Sinclair Aeromag- Medium Pass Filter.................…..…. 18
Figure 12c – Pakk-Sinclair Aeromag- Total Mag Intensity.......................... 18
Figure 12d – Pakk-Sinclair Aeromag- Re-gridded Total Field (RTF) Data.... 19
Figure 12e – Pakk-Sinclair Aeromag- Problem Flight Line Posting............. 19
Figure 12f – Pakk-Sinclair Aeromag- Residual Mag (High Cut & Low Cut).. 20
Figure 13 – East Kootenay– Residual Gravity (High Cut & Low Cut).......... 21
Figure 14 – Pakk-Sinclair – Residual Gravity (High Cut & Low Cut)............ 22
Figure 15 – Pakk-Sinclair Aeromag - EM Survey Map - UTEM Conductors. 23
Figure 16 – Pakk-Sinclair – Regional Geochem Survey Data...................... 24
Figure 17 – Pakk-Sinclair Aeromag - Potassium Map................................. 27
Figure 18 – Pakk-Sinclair – Topography Overlay on Shaded Relief............ 28
Figure 19 – Middle Aldridge Laminate Markers & Geology Maps....... ..... 28
Figure 20 – Pakk Property – Geology Cross Section A-B............................ 29

5
1.0 INTRODUCTION
The Sinclair mineral claim is located in southeastern British Columbia approximately 35 kilometres west
of Cranbrook. The claim lies within the former Cominco Roar property, which was explored and drilled by
Cominco in their search for new Sedex deposits in the 1990’s. In 1999 the area was staked (as the Pakk
claims) by Super Group Holdings Ltd. In 1999 Chapleau Resources drilled in two locations south and east
of the Sinclair claim and in 2000 they extended drilling of a Cominco hole located 500 metres south of the
claim. In 2004 Klondike Gold drilled two kilometres south of the claim. No major sulphide mineralization
was intersected in any of the holes. However, the west side of the Sinclair and remaining adjacent Pakk
claims have not been fully tested and possess favourable similarities to the Sullivan mine area that will be
shown in this report.
Figure 1 Kootenay Regional Map
This report presents a compilation of existing geoscience information regarding the Sinclair claim, and
establishes a precedent for future exploration work. Geology information was acquired from previous
assessment reports, related papers, and discussions with Paul Ransom (P.Geo.) and Craig Kennedy.
Sources of geoscience data include the 1995 East Kootenay Regional Aeromag Survey, the East Kootenay
Digital Gravity Database (GeoscienceBC data file #2013-23), and ARIS assessment reports. A spreadsheet
of local British Columbia RGS geochemical data was obtained from Fiona Katay (Regional Geologist).
2.0 PROPERTY
The Sinclair mineral claim lies within the Pakk property. It is located on NTS map sheet 82F09 (BCGS 82F059) having total area 628.28 hectares and 100% owned by E. (Ted) Sanders of Fernie, B.C.
CLAIM NAME TENURE NUMBER AREA (Hectares) DATE of REGISTRY (#)
Sinclair 1028693 628.28 June 2, 2014 (5507053)

6
3.0 LOCATION AND ACCESS
The Sinclair claim is located approximately 25 kilometres southwest of the historic world-class Sullivan
lead/zinc/silver mine in Kimberley, British Columbia. The claim can be accessed by travelling west along
the partially paved St. Mary Lake Road which intersects Hwy. 95A one kilometre north of downtown
Marysville. After travelling 16 kilometres, turn left on the St. Mary River Road and proceed (across the
bridge) for 0.6 kilometres, turning right on the Hellroaring Creek Forest Service Road. Follow this road for
1 kilometre and turn right onto the Meachen Creek FSR (west). After travelling approximately 8 km, a
logging road on the left, in the Sinclair Creek drainage, provides some access to the northeast corner of
the claim. Continuing southwest along the Meachen Creek FSR provides foot access to the northern
boundary of the claim and this logging road also intersects the northwest corner of the claim.
Figure 2 Mineral Titles Online – Sinclair Mineral Claim
4.0 PHYSICAL GEOGRAPHY
The mineral claim is situated within the Purcell Mountain range west of the Rocky Mountain Trench and
is 8 kilometres southwest of St. Mary Lake. Elevations range from 1200 metres in the northwest corner to
over 2400 metres on some mountain ridges. The Sinclair Creek drainage flanks the eastern portion of the
claim and has been partially logged in the last 40 years. A logging road in this drainage was used (and
extended by Cominco) for transport of a diamond drill rig into an upper basin of the Sinclair Creek
drainage in 1995. A second north flowing drainage (the Pollen Basin) is 3 kilometres west of Sinclair Creek
on the Sinclair and adjacent Pakk claims but has no road access. The two basins are separated by a ridge
which extends north from Mount Evans. Forest cover consists of mature and immature stands of a
mixture of pine, fir and larch with local patches of spruce and cedar.

7
5.0 HISTORY
The Sinclair claim and Pakk property area has been explored for over 100 years and hosts several mineral
occurrences of interest although no significant ore deposit has been discovered. Early exploration in the
late 1800’s focused on the copper mineralization associated with the Moyie intrusions west of the
Sinclair claim (see Minfile locations, Figure 3). There was reported malachite, chalcopyrite, pyrrhotite and
pyrite mineralization in quartz or quartz-calcite veins, all within or bounding diorite or gabbro intrusions
(Moyie Sills), which occurred in at least three separate areas. There was excavation work and adits dug
on several sites.
Figure 3
In 1994/95 Cominco explored the area. “The work entailed geological mapping, soil geochemistry, and
ground UTEM geophysics. A single DDH (now called P-00-15) was drilled in an upper tributary of Sinclair
Creek in 1995. In 1999, Super Group Holdings became interested in the area due to the presence of
Sullivan Horizon and much improved access. Prospecting led to the discovery of mineralized float of
tourmalinized fragmental in the Jack Creek drainage. Subsequent mapping and prospecting established
the source of the float higher in the drainage and three short holes were drilled on the gabbro-fragmental
dyke complex. More mapping established the presence of significant synsedimentary faulting and
deepening of the Cominco hole (P-00-15) intersected laminated Sullivan Horizon rocks and footwall
fragmental in 2000. In late 2003 Klondike Gold optioned the property and in 2004 drilled a hole (P-04-1)
about 1.5 kilometres SSW of the original Cominco hole.1
At the Sinclair showing (Minfile 082FNE117), thin bedded lead-zinc mineralization occurs in a mudstone
unit 60 metres thick which has been traced on surface for 600 metres. In 1999 Chapleau Resources
drilled near the showing. One drill hole (P-99- 5) cut forty, thin, bedding-parallel bands of disseminated
sphalerite and pyrrhotite ranging in thickness from 1 to 10 centimetres.

8
6.0 REGIONAL GEOLOGY The St. Mary River area is located within the Purcell Anticlinorium, a broad, gently north-plunging
structure with dominantly east-verging faulting and folding (see Figure 4). The Purcell Anticlinorium is
cored by the Proterozoic Purcell Supergroup, a siliciclastic (and lesser) carbonate sequence over 12
kilometres thick deposited in an intracratonic rift basin. The entire basin straddles the 49th parallel and is
known as the Belt Basin in the U.S. and Purcell Basin to the north, and collectively as the Belt-Purcell
Basin. It is over 750km long and 550km wide, extending from southeastern British Columbia southwards
into Idaho, western Montana, and eastern Washington in the U.S.A.
Figure 4 Belt-Purcell Basin – Purcell Anticlinorium
The Aldridge Formation (Pa) is considered the lowermost division of the Purcell Supergroup. The Aldridge
is divided into Lower (Pa1), Middle (Pa2) and Upper (Pa3) units (see Figure 5). The Lower Aldridge is
typically thin bedded, rusty weathering, fine-grained quartzitic wackes, siltstones and argillite. The top of
the Lower Aldridge is characterized by a package of laminated siltstones and mudstones, known as the
“Sullivan Horizon”. The massive sulphide ore body of the Sullivan deposit is hosted in this package.
Various geological sources refer to the contact between the Lower and Middle Aldridge as the “LMC”,
indicated on Figure 5 by the red dashed line (as defined on the GSC St. Mary Geology map). The Middle
Aldridge (Pa2) is typically thin, medium to thick bedded grey weathering quartz wackes, quartzitic
wackes, wackes and siltstone interbedded with argillite and silty argillite. The Middle Aldridge contains
about 15 marker units between 0.1 to 10 metres thick that have distinctive thin, alternating patterns of
light and dark siltstone laminas. Each marker unit has unique thickness and can be correlated over
several hundred kilometres. Some of these marker units will be discussed in section 10.
9
Figure 5
Both the Lower and Middle divisions of the Aldridge Formation are intruded by Middle Proterozoic
(dioritic to gabbroic) sills called the Moyie Sills (light purple areas seen on Figure 6). These sills (and
rarely, dikes) can vary in thickness from a few to several hundred metres, and their cumulative thickness
constitutes up to 30% of the Lower and up to 15% of the Middle Aldridge successions. Contact
relationships between sills and Aldridge rocks indicate that some were extruded at very shallow depths
into unconsolidated, water-saturated sediments. Others, with fine-grained chilled margins, have contact
metamorphosed the country rocks.
The Upper Aldridge Formation (Pa3) consists of rusty weathering and dark grey, very thin-bedded to
laminated siltstone and argillite. The contact with the overlying Creston Formation is relatively abrupt,
and is placed where green tinged siltite layers first appear. The Creston Formation is composed of grey,
green and maroon quartz wacke and siltstone with minor white quartz arenite. Above the Creston
Formation is the Kitchener Formation, largely consisting of dolomitic siltstone and dolomitic quartzite.
Rocks of the Purcell Supergroup have undergone several separate phases of deformation dating from
Middle Proterozoic through to Paleocene. Purcell sedimentation may have ended with the onset of the
East Kootenay Orogeny (1300-1350 Ma), a metamorphic and extensional event. This event was
associated with folding, local development of cleavage, and granitic intrusions.
10
The extensional Goat River Orogeny (800-900 Ma) resulted in rifting, large-scale block faulting, and
erosion of up to 4 kilometres of Purcell strata. It is interpreted to have occurred during initiation of the
Cordilleran miogeocline.
By early Paleozoic time, continental separation had occurred as platformal and miogeoclinal sediments
were deposited on a western continental margin. The Columbia Orogeny (150-160 Ma) during Middle
Jurassic was characterized by the pasting of island arc terranes onto western North America with
deformation, metamorphism and plutonism. The Laramide Orogeny (70-100 Ma) resulted in the
horizontal, northeast directed compression of Proterozoic strata and the overlying Paleozoic miogeoclinal
prism onto the western margin of North America. Easterly verging thrust faults and folds developed with
normal faults and westerly verging back thrusts, contributing to the development of the broad northerly
striking anticlinal structure seen in the Hall Lake Block north of the St. Mary Fault.
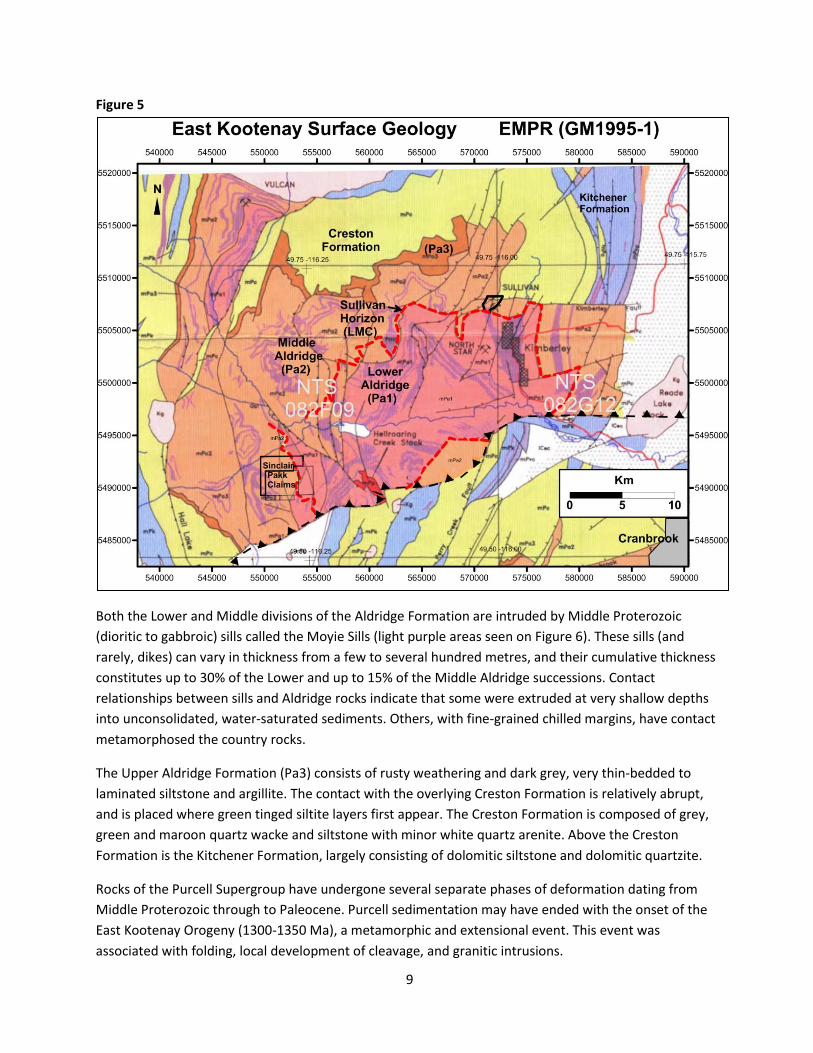
7.0 LOCAL GEOLOGY
The Sinclair claim lies in Aldridge metasediments in the hanging wall of the St. Mary Fault on the western
limb of the Purcell Anticlinorium. Stratigraphy primarily dips southwest at the Sinclair claim area and
northeast at the Sullivan deposit, located on the eastern limb of the Anticlinorium. The northeast corner
Figure 6

11
of the Sinclair claim has Lower Aldridge Formation rocks at surface while the remainder to the west is
Middle Aldridge Formation (Figure 6), and thus hosts the LMC at depth. The LMC is known to lie just
above the stratigraphic horizon hosting the historic Sullivan lead/zinc/silver deposit in Kimberley, British
Columbia. To date, the Sullivan ore body and the much smaller Kootenay King deposit 30 kilometres to
the east are the only sedimentary exhalative (Sedex) deposits that have been discovered in the region.
“Structurally the Pakk is more complex than initially appeared to be the case. Located in the hangingwall
to the regional St.Mary fault, the Lower Aldridge through Middle Aldridge sediments and intrusives are
displaced along east-west, northwest, and northeast trending faults which have translational movements
up to about one kilometer. The down-dip component appears to be several hundreds of metres. The
northeast-striking Pakk fault has been established as a syndepositionally active structure which influenced
sedimentation within this active sub-basin at about Sullivan Time and later. The entire package is also
folded on various scales with dominant north-south fold axes.”1
8.0 GEOPHYSICAL DATA OVERVIEW
The first reported ground survey on the Roar (Pakk) property was a UTEM survey by Cominco in 1994
(see Cominco map overlays on the GSC St. Mary Geology map, Figure 7). Several conductors (red X’s, with
annotated crossover numbers) and a zone of conductivity (between the two red triangles) were isolated
on and near the Sinclair claim. At the time of the survey UTEM was believed to be capable of detecting
conductive sources to a depth of 500 metres. In 1995 Cominco drilled a hole (TD=528m), labelled P-00-15
on Figure 7, to test a single conductor one kilometre south of the main body of the Sinclair claim.
Figure 7

12
In 1995 a consortium of the BC Ministry of Employment and Investment, the BCGS, and the GSC funded
high resolution Aeromag surveys in three areas within the East Kootenay region of British Columbia. One
of the three surveys was flown over the St. Mary River area north of the St. Mary Fault. The survey
included Aeromag, EM Conductivity, VLF, Radiometric and Potassium sampling. The Aeromag data is
available from NRCAN in map, 100 metre Total Field or Residual Total Field grid, and raw flight-line data
file formats. By analyzing the Residual Total Field grid using variable dimension filters, a conceptual
model was developed and forms the key area of focus for this report (refer to section 8.1). The magnetic
model in conjunction with local geology shows a similarity between the Sinclair claim area and the
Sullivan mine area. Due to a suspected error and survey challenges of the mountainous terrain reported
by the survey contractor, the raw Mag data was analyzed for the Sinclair claim and Pakk property area.
Background gravity data (the blue dots on Figure 8) is available from Geoscience BC (data file #2013-23).
The updated East Kootenay Digital Gravity Database (EKDGB) includes GSC gravity data and gravity survey
data acquired from reports on the ARIS assessment report website, as well as 217 stations acquired in a
2013 gravity survey funded by the SEEK stimulus program through Geoscience BC. The 2013 SEEK survey
confirmed a significant gravity low in an area known, geologically, as the Matthew Creek Metamorphic
Zone (see section 8.2).
In addition to geophysical data, the BC Regional Geochemistry Survey data for the district was assessed.
Figure 8

13
8.1 Aeromag Survey and Interpretation
The Residual Total Field (RTF) grid (available from NRCAN) has the IGRF field removed from the levelled
Total Field data, but maps made directly from this grid are still referred as Total Field or Total Mag
Intensity (TMI) maps in this report. This is to avoid confusion with Regional/Residual separation
terminology associated with filtered grid products. Because of the large amplitude range of the Mag data
for this area, colour (no contour lines) is the best way to show the Total Field map (Figure 9) which covers
the same region shown on Figure 8. Magnetic susceptibilities of Aldridge Formation rocks in the central
part of the map are relatively low compared to rocks of the Middle Creston Formation which have higher
magnetite content. River detritus from Middle Creston Formation rock (upstream) are believed to be the
primary source of the shallow-sourced Mag highs seen along the floor of the St. Mary River valley.
Figure 9
As can be seen, the survey identified numerous magnetic anomalies ranging from smaller, short
wavelength anomalies generally coming from shallow sources to large, longer wavelength anomalies
from potentially deeper magnetic sources. To attenuate the anomalies from shallow sources for this
large area, a Low Pass (23-point matrix) filter was applied to the 100 metre grid. The resulting Regional
Mag contour map is shown on Figure 10 (next page). The Low Pass filter has removed the shorter
wavelength components (generally having shallower magnetic sources) from the Total Field (RTF) grid.
This creates a Regional Mag map that provides a conceptual view of primarily deeper magnetic sources in
the area of outcropping Aldridge Formation sediments, outlined by the black dashed lines.

14
Figure 10
The central part of the map containing outcropping Aldridge Formation rock tends to be magnetically
quieter (green, yellow, and orange shades) relative to the surrounding area. Higher amplitude anomalies
(darker blues, reds and magenta) are associated with Cretaceous intrusives and areas of Middle Creston
Formation rock which outcrop south of the St. Mary Fault and on the north and west sides of this map.
The filter has attenuated most of the smaller Mag anomalies caused by accumulations of shallow
magnetite-bearing alluvial sediments in the St. Mary River valley. However, Figure 10 retains several
significant Regional Mag highs within the region of Aldridge Formation metasediments.
For maps related to Total Field Mag data in mid-latitudes, solitary magnetic sources generally reside
beneath the gradient between a dipolar Mag anomaly, which by definition has both a Mag high and Mag
low component. Of the dipolar anomalies seen within Aldridge Formation sediments on Figure 10, only
the Mag high southwest of the Sullivan deposit and the Mag high northeast of the Pakk-Sinclair claims
reside within Lower Aldridge Formation (Pa1) rock and have a gradient in Middle Aldridge Formation
(Pa2) shared with a distinct dipolar Mag low across the LMC. This observation provided an impetus to
compare the Aeromagnetic data for the Pakk-Sinclair claims area and the Sullivan areas in more detail.
The following text is an excerpt from a report on Sedex deposits, by Dr. Trigve Hoy.
Lead-zinc-silver massive sulphide or Sedex deposits were deposited on or near the ocean floor, in basins
that generally formed during periods of regional extension. The middle Proterozoic Sullivan deposit, one

15
of the largest Sedex deposits known, is characteristic of these deposits. It comprises a central zone of
dense massive sulphides of zinc, lead and iron with a variety of other metals, most notably silver,
surrounded by more distal finely layered or disseminated mineralization. It is underlain by a stringer zone
comprising dominantly vein mineralization that is inferred to represent the conduit for upwelling metal
bearing fluids that exhaled on to the seafloor.
Sedex deposits typically occur in small structural basins, commonly bounded by faults, and recognition of
these basins in the geological history is an important tool for their exploration. Sedex deposits are very
attractive exploration targets, due in large part to their form and shape as massive deposits of metallic
sulphides. As they formed during sedimentation, exploration for them is directed initially to locating a
favourable stratigraphic and structural setting – a small structural basin, bounded by faults, in an area of
enhanced heat flow. Subsurface exploration typically includes both magnetic and conductance studies.
Viewing a portion of Figure 10 for the Sullivan deposit area, a Regional Mag high-low pair is evident
(Figure 11a). The Mag high is in Lower Aldridge sediments and the gradient of the dipolar anomaly is in
Middle Aldridge Formation rock and correlates with the projected outline of the ore body. Magnetic
theory infers that a deep magnetic source (between the Mag high and low) lies beneath the ore body.
Figure 11a Regional Mag Map using 23-point Matrix Filter
When the Aeromag TMI grid is filtered using a smaller 9-point matrix filter (see Figure 11b) shorter
wavelength anomalies appear, including a Mag high within the projected outline of the Sullivan deposit.
A portion of the larger body of the Mag high appears to be controlled by the Sullivan Fault.

16
Figure 11b Regional Mag Map using 9-point Matrix Filter
Figure 11c is the unfiltered Total Magnetic Intensity map. Mag sources at the Sullivan deposit include
surface and subsurface quantities of magnetite and pyrrhotite. The ore deposit lies within a fault-bound
graben. The mine (now closed) was in operation when the Aeromag survey was flown.
Figure 11c Total Field Mag

17
Figure 12a, covering the Pack-Sinclair claims area, uses the same (Regional Mag) grid shown on Figures
10 and 11a. As can be seen, the Pack-Sinclair claims also project over the gradient between a Regional
Mag high-low pair, across the LMC. The horizontal extent of this anomaly, from Mag high (NE) to Mag
low (SW), also suggests a deep Mag source beneath the claims area. The Mag low to the southeast has a
dipolar Mag high further south. The following text is from AR #28424 regarding the Pakk property:
Figure 12a
“Located in the hangingwall to the regional St. Mary Fault, the Lower Aldridge through Middle Aldridge
sediments and intrusives are displaced along east-west, northwest, and northeast trending faults which
have translational movements up to about one kilometer. The down-dip component appears to be several
hundreds of metres. The northeast-striking Pakk fault has been established as a syndepositionally active
structure which influenced sedimentation within this active sub-basin at about Sullivan Time and later.
The character of Sullivan Time changes dramatically across the Pakk fault from a simple interface of
Lower Aldridge to Middle Aldridge sediments to a thick fragmental footwall capped by about 15 metres of
laminated subwacke characteristic of a Sullivan sub-basin facies”.1
When the 100 metre Total Field (RTF) grid is filtered using the smaller 9-point matrix filter (as for Figure
11b) the result is shown on Figure 12b. Again, reducing the filter size allows shorter wavelength
components of the Total Field data to appear, including shallower-sourced anomalies within the St. Mary
River channel. A correlation of the Pakk Fault and its noted offset can be seen. This map also exposes a
single, subtle anomalous Mag high (see arrow) approximately 1200 metres WNW of where drill-hole
P-00-15 (az. 090, dip 80o) intersected the LMC, and 2000 metres NNW of drill-hole P-04-1E.

18
Figure 12b
Figure 12c is the Total Field (RTF) map showing the low amplitude (25-40 nT) anomalous high and
locations of the 1994 Cominco UTEM conductors, in a magnetic area of interest (red circle) within a fault-
bound sub-basin. The red circle defining the Mag AOI will appear on many images throughout the
remainder of this report.
Figure 12c

19
The rows of small dots on Figure 12c are a subset of the Aeromag survey flight line data (available from
NRCAN). On close inspection, contours related to a survey flight line (below the “AOI” label) do not show
the Mag high seen on the lines immediately north and south of it. To check the data for this flight line, a
separate 100 metre grid of the Total Field (= SRVMGLEV-IGRF fields) data for the claims area was created
and contoured. The resulting contour map is shown on Figure 12d. The arrow points to an obvious
problem in the map contours on the noted flight line. Several other potential problem areas are shown.
Figure 12d Re-gridded Residual Total Field (RTF) Data
A map posting of data values was assessed and the flight line containing the mistie had two longer
segments (L10762 & L10768) and two re-flown segments between them (L10764 & L10765) as shown
over topographic relief on Figure 12e. Misties were noticed on this traverse between Mag values from
different line segments. Adjustments to these data may improve the 100 metre grid of the edited TMI
data but, due to the subjective nature of editing and gridding, are shown on the next page as an example
of one possible fix. Details of an absolute fix for this entire area lie beyond the scope of this report.
Figure 12e Flight Lines L10762, L10764, L10765, L10768, L19078

20
A data mistie of [-15] gammas was noticed between overlapping points of L10765 and L10762, and [-10]
gammas between L10765 and tie-line L19078. L10764 was deemed to be superfluous and was removed.
A value of 10 gammas was added to all data on L10765, reducing the mistie with L10762 to [-5] gammas
and the mistie with tie-line L19078 to [0] gammas. However, this adjustment increased the mistie at the
overlap between L10765 and L10768 to [>15] gammas. Further investigation revealed that the
helicopter’s flight elevation for L10768 in the overlap area with L10765 was ~450m higher than L10765
(the start of L10768 was not draped). To address this problem, 28 seconds of data was removed from the
beginning of L10768, creating a 500m gap between the two line segments; data gaps of this size on other
lines were common in this area. These were the primary data adjustments made as part of this exercise.
To create a map, the grids for the original GSC 100m Total Field and the new smaller area grid (using
edited data) were both filtered similar to Figure 12b. As an alternative way of displaying the data, the
filtered grids for the two products were subsequently filtered with a Low Cut filter to remove long
wavelength components from each grid thus creating (two-pass) Residual Mag grids. On Figure 12f the
filtered original TMI grid is semi-transparent (over the GSC geology map) and the re-gridded (edited) area
is shown in the claims area using solid colours. This map highlights an alternative way of viewing the
edited Mag data in the claims area. Compared to Figure 12b the Low Cut filter has reduced the overall
amplitude of the AOI anomaly, but the horizontal dimension of this anomaly is now larger, suggesting a
potentially deeper and larger source than the original version indicates; potential field theory infers that
as the depth to source increases, anomaly amplitudes are reduced but wavelengths increase.
Figure 12f

21
8.2 Gravity Data and Interpretation
A 250 metre grid of Bouguer Anomaly data (density 2.75 gm/cc) was made using the East Kootenay
Digital Gravity Database (Geoscience BC data file #2013-23). A 4 km High Cut and a 10 km Low Cut filter
were both applied to the Bouguer Anomaly grid to remove the effects of shallow sources (ie. lower
density alluvial river sediments) and the regional gravity gradient coming from very deep sources,
respectively. This produces a gravity map (Figure 13) highlighting mid-wavelength components of the
data coming from deeper sources possibly having geologic and/or exploration significance. A version of
this gravity map using density 2.70 gm/cc (not shown) was also made for comparison.
Figure 13
Figure 13 shows gravity highs generally corresponding to Aldridge Formation rocks (and higher density
Moyie Sills intruded into Lower and Middle Aldridge Formation rock) relative to surrounding lower
density Creston and Kitchener Formation rock and Cretaceous intrusives. The gravity low near the centre
of the map, within Aldridge Formation rock, correlates with the Matthew Creek Metamorphic Zone
(MCMZ), dating to ~100 My after Sullivan Time. The anomaly quite possibly has a granitic intrusive
(pluton) as the source, having lower density than the surrounding metasediments. Resulting stratigraphic
uplift (roof lifting) from the intrusion would explain the domed structure seen in surrounding
metasediments in the Matthew Creek area and may have contributed to the local arched structure of this

22
region of the Purcell Anticlinorium. The full geological impact of this feature and whether the area was
active before and after Sullivan Time, possibly as a source of local Moyie Sills, is uncertain. It is interesting
to note that the described geology and (Mag) geophysical traits (section 8.1) for the Sullivan area and
Pakk-Sinclair claims share similarities while the fault structures are mirror images of each other and on
opposite sides of this broad anticline and anomalous gravity low.
Figure 14 is from the southwest quadrant of Figure 13 and shows the Sinclair and Pakk claims. Data
coverage for the property is sparse with a station spacing of more than 1.5 kilometres, and the 250m
map grid is highly aliased in the AOI having only one station. The limited data is suggestive of a possible
residual gravity high in the AOI but more data is required if any support for subsurface mineralization is
to be offered.
Figure 14
Gravity modelling has shown that a deeply (800-1000m) buried Sullivan-sized ore mass might produce a
gravity anomaly close to 1.0 milligal. However, even with additional gravity data an anomaly of this
amplitude may be difficult to isolate due to increased survey noise caused by data reduction processes
(primarily terrain corrections) associated with the rugged terrain in the survey area.

23
8.3 East Kootenay Aeromag – EM Conductivity Map
The 1995 airborne EM survey data was acquired in conjunction with the high resolution Aeromag survey.
The conductivity map shown below is available on the NRCAN website in two map pieces. The black fault
lines shown on these EM maps were transferred from the EMPR Southeast BC Regional Geology Map
(GM 1995-1). Two of these (roughly) north-south striking faults, through the Pakk-Sinclair claims and AOI,
do not appear on the newer version of St. Mary Geology (GSCof6308_e_2011) map, which is the source
of the blue dashed faults seen on maps in this report.
No specific conductors are indicated on the Sinclair claim. The EM contours shown in the claims area are
low amplitude but have longer wavelengths suggesting deeper sources however, it is unlikely that the
airborne EM system can respond to conductive sources coming from deeper than 100 metres in this area.
In any case, some of the low amplitude EM anomalies on this conductivity map coincide with conductor
crossover locations on the 1994 Cominco UTEM map. These are encouraging correlations but could be
coincidental. The UTEM conductor drilled by Cominco (DDH Pakk-00-15, which did not intersect
mineralization) shows no anomaly on the EM map however another UTEM conductor 1 kilometre NNW
on the Sinclair claim does correlate with a low amplitude anomaly on the EM conductivity map. A low
amplitude EM anomaly also appears throughout the two kilometre long Pollen Basin on the western half
of the claims and can be seen inside the red circle defining the area hosting the magnetic AOI.
Figure 15

24
9.0 REGIONAL GEOCHEMISTRY SURVEY DATA
Geochemical data from the RGS database was assessed for five “stream sediment and water”
samples on, or near, the Pakk-Sinclair mineral claims. Figure 16 shows the southwest portion of GSC
St. Mary Surface Geology map (082F09) with annotated RGS sample locations for the 5 samples
assessed. Two of these RGS samples showed anomalous chalcophilic (sulphide ore-loving, or ore
pathfinder) element values and one of these samples (82F779102) is located on the Sinclair claim.
Figure 16
The eastern-most RGS sample shown (779104) was collected from Sinclair Creek in Lower Aldridge
Formation sediments (Pa1). The other four sample locations are in Middle Aldridge Formation
sediments (Pa2). Sample sites on Meachen Creek (779099) and Fiddler Creek (779100) are two
kilometres west of the mineral claims and sample 779098 is another two kilometres further west.
Sample 779102 is located on the Sinclair claim at a lower elevation of the creek flowing north out of
the Pollen Basin in the western half of the mineral claims. This RGS sample site is proximal to the
Sinclair Fault and downstream of the prospective Mag AOI shown on previous images.

25
One ore deposit geochemistry paper that was researched indicated the following:
“Stratiform or stratabound ... sequences hosting stratiform Zn-Pb-Ag deposits are
anomalous in Zn, Fe, Mn and Ti, and other associated elements in the ores include As, Sb, Bi, Cd, Hg and In.”2
In a number of Proterozoic deposits, carbonate minerals in the host rocks show increasing Fe and Mn contents towards mineralization. The metal zoning and alteration can provide vectors to ore. Typically Fe, Mn, B, P and Zn indicate a hydrothermal-exhalative source and Al and Ti a clastic source. Thus, Fe+Mn/Al, Fe/Ti, Mn/Ti and P/Ti ratios and increasing concentrations of ore and associated elements (e.g., Cu, Pb, Zn, Ag, As, Au, Bi, Cd, Co, Hg, Mo, Ni, Sb, S, Se, Te, Ti, F and Cl) are suggested as useful geochemical indicators to ore proximity.”3
Using the RGS database, and comments by Paul Ransom (P.Geo) regarding elevated Hg levels associated with the Sullivan deposit, AAS & ICP values for Hg and Mn were examined for the five samples. After a table of element values was made, the Hg and Mn values for 779098 and 779102 were seen to be significantly higher than values in each of the three other samples. Other element comparisons showed similar results. Additional information regarding mercury and radioelement (K, Th, U) levels are noted below:
“Due to the chalcophilic nature of its associations, mercury is found in higher
abundances in intrusive magmatic rocks and locations of subaerial and submarine volcanism. These rocks and their weathered products are rich in other metals as well, and emission of mercury from soils and rock has been used as a tool for large-scale ore and petroleum exploration as well as an indicator of tectonic activity.” 4, 5, 6
Transport of mercury to and from ore bodies invariably involves hydrothermal systems in the subsurface with HgS solubility strongly controlled by fluid pH, temperature, chloride, sulfide, and organic carbon contents.” 7, 8
“For sediment-hosted massive sulphide deposits like the Sullivan and North Star mines, coincident elevated magnetic anomaly values, moderate to strong bedrock conductors, elevated K levels and low eTh/K ratios are characteristic.”9
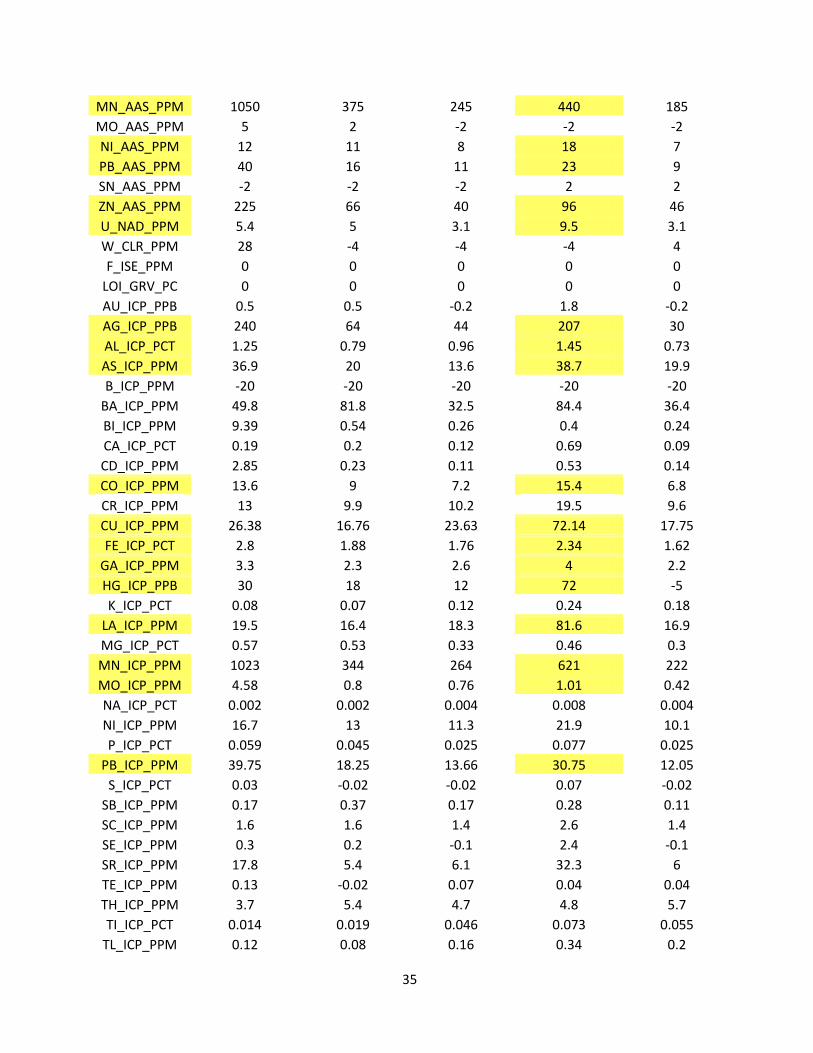
The RGS element listing for the five local samples is provided in Table 1 (see Appendix). Most of
the AAS and ICP chalcophilic elements and their values for sample 779102 have been highlighted
but there may be other significant values that have not. In almost all cases, values for samples
779098 and 779102 are significantly higher than for the other three samples in the claims area.
To analyze the data on a regional scale, a second table was created ranking the five local
samples’ element values relative to the values from the 87 RGS samples located within the St.
Mary map sheet (NTS 082F09). 65-70% of this 1000 km2 sample population area (082F09) is
Lower Aldridge, LMC (Sullivan Horizon), and Middle Aldridge Formation metasediments at
surface, and includes the historic Sullivan Pb-Zn-Ag deposit. The other 30-35% of the area is
younger Creston and Kitchener Formations, and/or quaternary/alluvium cover, at surface.

26
Table 2 indicates the element values for the five samples, ranked as a percentage position within
a population of 87 RGS samples located within the St. Mary map sheet. The table includes AAS
and ICP rankings for 17 chalcophilic elements plus U, K, Th and Th/K ratio rankings.
9.2 Table 2- Local Samples, Element Rankings
Sample > 779098 779099 779100 779102 779104
AAS_Cu 67 31 51 93 31
AAS_Fe 90 59 38 86 20
AAS_Hg 58 37 2 91 2
AAS_Mn 97 59 12 67 3
AAS_Ni 59 51 15 82 9
AAS_Pb 94 44 18 73 4
AAS_Zn 100 65 23 84 39
ICP_Au 25 25 0 86 0
ICP_Ag 97 25 12 91 1
ICP_Al 58 11 29 80 7
ICP_As 91 67 53 92 66
ICP_Cd 100 53 16 86 29
ICP_Cu 59 27 50 95 28
ICP_Fe 82 40 27 69 17
ICP_Hg 53 22 13 90 0
ICP_K 34 25 43 92 62
ICP_Mn 95 40 17 82 6
ICP_Mo 98 59 56 76 18
ICP_Ni 60 28 17 79 9
ICP_P 62 30 0 86 0
ICP_Pb 90 38 18 79 12
ICP_S 48 - - 92 -
ICP_Se 48 37 - 100 -
ICP_Th 22 48 34 37 55
ICP_Ti 16 25 49 85 60
ICP_U 54 30 0 93 0
ICP_Zn 100 53 22 82 34
ICP_Th/K Ratio 56 79 49 19 35
Percentage rank among 87 RGS samples within NTS 082F09

27
Results:
RGS Sample 779098 ranked very high for Ag, As, Cd, Fe, Mn, Mo, Pb, and Zn. The nearby
Cretaceous (Km) Ailsa Lake Stock (southwest corner of Figure 16) intruded into Creston
Formation is known to contain quartz veins, galena, magnetite, and disseminated pyrite and
sphalerite mineralization (AR #28323). Soil sampling (AR #30057) confirmed a zone of copper
bearing iron-oxides within gabbro sills near the RGS sample site and may also be a source of the
magnetic anomaly, seen in the southwest corner of Figure 12f.
RGS Sample 779102 ranked high to very high for all elements listed, and a high K and low Th/K
ratio as for the Sullivan area (reference 9, page 25). However, there are no reported or visible
surface geology sources nearby to cause this as was noted for sample 779098. Since the sample
is located well above Sullivan Horizon depth, if the elements noted are related to subsurface
mineralization they are inferred to have been leached to the surface via faults, or some other
mechanism.
Figure 17 is the Potassium map for the Pakk-Sinclair claims area. The map grid is from the 1995
St. Mary River Aeromag survey set and available from NRCAN. The higher %K values on the map
(an upstream anomaly) correlate with the high ranking shown for K in RGS 779102 (Table 2).
Figure 17

28
10.0 TOPOGRAPHY MAP and GEOLOGY CROSS SECTION
Figure 18 is a map of colour topography overlaid on shaded relief for the Sinclair claim area. Elevations
on the Sinclair claim range from 1200 metres at Meachen Creek to 2400 metres on mountain ridges.
Figure 18
As previously mentioned, the Middle Aldridge contains about 15 laminate markers between 0.1 to 10 metres thick that have distinctive thin, alternating patterns of light and dark siltstone laminas. Each marker unit has unique thickness and can be correlated over several hundred kilometres.
Figure 19
Figure 19 includes a portion of the GSC Laminate Marker table and two similar versions of geology maps
for the prospective Mag area of interest (red circle) shown on Figure 18 above. Both geology maps show
a Hiawatha laminate marker west (uphill) of the collar of drill-hole P-00-15. Estimating the marker at
approximately 50 metres above the drill collar elevation and using DDH Pakk-00-15 Sullivan Horizon
intersection (620 metres) places the Hiawatha at ~670 metres above Sullivan Horizon. This is
approximately 200 metres higher than the average (475 metres) shown on the Laminate Marker table.

29
Using Figure 19, there is either a Beehive (GSC) or Hiawatha (BCGS) marker shown in the Pollen Basin
near 1780 metres elevation (see arrows). Some Geologists have interpreted the Beehive as a variation of
the Hiawatha. Using the adjusted Hiawatha elevation (+670 m) above Sullivan Horizon infers that Sullivan
Horizon (LMC) may only be 700 metres below grade in the Pollen Basin where the Mag AOI is located.
A geology cross section (Figure 20) was created for the profile (A-B) shown on Figure 18. The section
assumes that the Sullivan Horizon (LMC) dip angle created between its outcrop location on the surface
geology maps and intersection in DDH P-00-15 (620 m) continues to the southwest for some distance.
DDH P-04-1E was projected 1400 metres NNW to the profile but its intersection with the top of the LMC
(1452m) fits the depth to the LMC in the section. Further west, folding or faulting is required to satisfy
the approximate LMC depth below the laminate markers in the Pollen Basin. As was noted in section 7,
”The entire package is also folded on various scales with dominant north-south fold axes.”1
The trajectory shown for P-04-1E (veering northwest and down-dip) is based on the drilling summary
provided in the drilling results in ARIS #28424. Drilling results in the report mention that Sullivan Time
(ST) was intersected from 1452-1741m. “Such a long intersection is indicative of a much thickened
interval but also of the lower bedding angle. The interval can be broken out into: (1) About 90 metres true
of laminates; disrupted, massive wackes; and thin bedded sediments and blocky fragmentals, portions of
which are highly altered to albite/chlorite-rich rocks. (2) About 120 metres true of sedimentary
fragmental with varied clast types set in a disrupted fabric. (3) Approximately 30 metres true of bedded,
to disrupted, to fragmental rocks representing the initiation phase of the Sullivan Time sequence.”1
Figure 20
Based on known geology and section shown, the estimated depth from ground elevation in the Pollen
Basin to Sullivan Horizon (and an inferred Mag source body) could vary from 650-900 metres below
grade. The section also includes red markings to indicate a magnetic high and low (using Figure 12f) and
an inferred Mag source body. 2D-Mag modelling of a dipping Sullivan-sized source body with top at 650m
and susceptibility 0.050 SI produced a dipolar anomaly with amplitude of 20-25 gammas and horizontal
distance between the high and low of ~1300m. These results are similar to what is seen on Figure 12f.

30
11.0 SUMMARY
The Sinclair claim is located 25 kilometres southwest of the Sullivan lead/zinc/silver deposit in Kimberley,
British Columbia. The Sullivan Sedex deposit formed near the contact between Lower and Middle
Aldridge Formation (the LMC) metasediments and this zone (Sullivan Horizon) has been a target of
exploration for many years. From east to west, sediments on the Sinclair and adjacent Pakk claims grade
from Lower Aldridge to Middle Aldridge Formation and dip southwest, implying that the target Sullivan
Horizon (LMC) resides below surface, but gets increasingly deeper to the west and southwest.
Geophysical data available from MTO assessment reports, the GSC, and Geoscience BC were analyzed
and assessed. In addition, data from the BC Regional Geochemical Survey were utilized. Using the GSC
100 metre grid of the 1995 St. Mary River Aeromag Residual Total Field data, a conceptual magnetic
model comparing the Sullivan and Sinclair claim areas was developed.
When the Total Field (RTF) grid is filtered using a large matrix (Low Pass) filter, only the Sullivan and
Sinclair claim areas reveal deep sourced (Regional) Mag highs over Lower Aldridge sediments and a
gradient (between a paired dipolar Mag low) over Middle Aldridge Formation, across the LMC. When the
Total Field Mag grid is filtered using a smaller filter, an anomaly which correlates with the iron core of the
Sullivan deposit appears. Similarly, an anomalous Mag high appears on the western half of the Pakk-
Sinclair claims although having lower amplitude than the near-surface Sullivan deposit. Analysis of the
raw Total Field Mag data revealed flight line data misties in the noted Pakk-Sinclair Mag anomaly area.
Editing, re-gridding and filtering of these data suggest that the anomalous magnetic high likely extends
over a larger area, inferring a deeper and larger source than the original NRCAN Total Field grid suggests.
The GSC electromagnetic (EM) maps were assessed for conductivity in the claim area. Again, a low
amplitude EM anomaly was noted in the same region that the AOI Mag anomaly was isolated. Some low
amplitude EM anomalies correlate with UTEM conductors noted from a 1994 survey by Cominco. UTEM
conductors close to the anomalous Mag high were noted on the Sinclair claim however no UTEM data
was acquired directly over, south, or west of the Mag anomaly noted from the Aeromag survey.
BC Regional Geochemical Survey data was assessed for five samples on and near the Pakk-Sinclair claims.
Two samples (779098 & 779102) showed significantly elevated levels of chalcophilic (sulphide ore
pathfinder) elements relative to local and regional sample populations. Reported geological assessment
work has detected the probable sources of mineralization for anomalous values in sample 779098
however a geological source for the significant 779102 sample values (on the Sinclair claim) has not been
identified. RGS sample 779102 is located near the Sinclair Fault, at a lower elevation of the creek flowing
out of the Pollen Basin which is the site of a magnetic area of interest, in an area that has been defined
geologically as a fault-bound sub-basin.
Gravity data from the EKDGB was utilized but there is a lack of sufficient data in the claims area. More
data is required for interpretation but due to the rugged terrain it may be difficult to attain a reasonably
low signal-to-noise ratio in the data in order to discern an inferred deep source of mineralization.
The existing gravity data (Figure 13), does reveal a significant gravity low which correlates with the
location of the Matthew Creek Metamorphic Zone which dates to the East Kootenay Orogeny, 100 Ma
Sullivan Time. Since granite has a lower density than the Aldridge Formation country rock, the anomaly

31
quite possibly has a granitic intrusive (pluton) as the source, and would account for the Matthew Creek
pegmatite stock (dating to the East Kootenay Orogeny) located at the surface here. Resulting
stratigraphic uplift (roof lifting) from the intrusion would explain the domed structure seen in
surrounding metasediments in the Matthew Creek area and may have contributed to the arched
anticlinal structure of this region. The full geological impact of this gravity anomaly and whether the area
was active before and during Sullivan Time, possibly as a source of local Moyie Sills, is uncertain.
The fault structures and interpretive Aeromagnetic maps for the Sullivan and Pakk-Sinclair claim areas
share many similarities yet appear as mirror images of each other on maps (section 8.1). The two areas
are described as fault-bound sub-basins but reside on opposite sides of a north-striking anticline.
12.0 RECOMMENDATIONS
Two vintages of surface geology maps (Figure 19) differ in the naming and placement of Middle Aldridge
laminate markers in the magnetic AOI in the Pollen Basin. Geology fieldwork dedicated to this area may
assist in determining correct marker identification and locate new outcrops which confirm inferred
faulting and folding in the area. This information will assist in determining more accurate structure and
depths to Sullivan Horizon in this location.
Geochemical sampling acquired in conjunction with the geology fieldwork may help to confirm or dismiss
the results attained from analysis of the single RGS sample from the stream which exits the Pollen Basin.
Due to the inferred deep source of a potential ore body within the perimeter of the Sinclair and adjacent
Pakk claims, geophysical methods capable of detecting mineralization at depths greater than 500 metres
will be required. Although several companies offer methods which purport this ability, it is not known
how these systems will work in the rugged terrain in this area. Some options include:
1) Conduct a down-hole EM / TDEM survey in drill holes P-00-15 & P-04-1E. With both drill-hole
depths greater than 800 metres, a combined surface/borehole EM survey may identify if there
are nearby subsurface conductors.
2) A 13 x 13 Km, 250-300 metre spaced high resolution Aeromag survey, flown at a fixed elevation
(to clear most mountain tops) with reduced drape. This will allow detailed frequency depth
characterization of the data without the distortion, noise and flight challenges caused by draped
surveys in rugged terrain. The ZTEM system uses passive global thunderstorm activity as a source
of transmitted energy and may be a complementary survey method for identifying deep
conductive sources.
3) A heli-assisted ground UTEM survey, with modern equipment and charge loop in the Pollen Basin
or in a previous location to the east might establish new results and/or reconfirm prior results.
The Pollen Basin region (not done in 1994) would need to be surveyed in order to be effective.

32
4) A ground gravity survey (50-100 stations) would suffice but require heli-support for ground
traverses for half of the survey. There is excellent background gravity data available. Modelling
has shown that a deeply buried Sullivan-sized ore mass produces a gravity anomaly <1.0 mGal.
This may be difficult to isolate due to increased survey noise caused by the rugged terrain within
the survey area.
13.0 COST STATEMENT
Exploration Work type Comment Days
Totals
Personnel (Name)* / Position
Field Days (list actual days) Days Rate Subtotal*
Ted Sanders/owner (visit Meachen/Sinclair FSR) 01-Oct-14 n/c $0.00 $0.00
$0.00 $0.00
$0.00 $0.00
Office Studies List Personnel (note - Office only
Literature search Ted Sanders (all) -1995 GSC Aeromag Survey Technical Report
1.0 $450.00 $450.00
-ARIS assessment reports (~20)
2.0 $450.00 $900.00
-Geochemical reports/research
1.5 $450.00 $675.00
-Minfile reports for region
0.5 $450.00 $225.00 -Aeromag Survey Report-1998 (Lowe &
Brown)
1.0 $450.00 $450.00 Database compilation
$0.00 $0.00
-local RGS Geochem samples - R&D
2.0 $450.00 $900.00
Computer mapping
$0.00 $0.00
-1995 GSC Aeromag Survey
1.5 $450.00 $675.00 -1995 GSC Aeromag - EM Survey
1.0 $450.00 $450.00
-East Kootenay Gravity Database
1.0 $450.00 $450.00
-RGS Geochem samples – Potassium Map
.25 $450.00 $112.50
- Topography map and Geology Cross-Section
1.0 $450.00 $450.00 Processing of data
$0.00 $0.00
-1995 GSC Aeromag Survey
2.0 $450.00 $900.00
-East Kootenay Gravity Database
0.5 $450.00 $225.00
-local RGS Geochem -develop rankings table
.75 $450.00 $337.50 General research
1.0 $450.00 $450.00
Report preparation
5.0 $450.00 $2,250.00
Other (specify)
$9,900.00 $9,900.00
Miscellaneous
Telephone
$0.00 $0.00
Other (Specify)
$0.00 $0.00
TOTAL Expenditures $9,900.00
33
14.0 STATEMENT of QUALIFICATIONS
I, Edward (Ted) Sanders, certify that:
1) I am an independent prospector, presently residing in Fernie, British Columbia.
2) I have been actively prospecting for minerals in British Columbia for five years.
3) I was formerly employed (7 years) as a Geophysical Technician for an oil & gas company
(Potential Fields Dept.) and have been a Geophysical Consultant for 15 years.
4) I am a graduate of Waterloo University with a degree of Bachelor of Mathematics.
5) I own and maintain mineral claims in British Columbia.
6) I am the creator the East Kootenay Digital Gravity Database, now property of Geoscience BC.
15.0 REFERENCES
1 Anderson, D. 2006. Diamond Drilling on the Pakk Property.
History of Exploration (p.2), Property Geology and Summary of Work Done (p.3), ARIS report # 28,424.
2 McGoldrick, P. and Large, R., 2005. Proterozoic stratiform sediment-hosted Zn-Pb-Ag deposits.
AGSO Journal of Australian Geology and Geophysics, 17: 189-196.
3 Spry, P.G., Peter, J.M. and Slack, J.F., 2000. Meta-exhalites as exploration guides to ore. In: P.G. Spry, B.
Marshall and F.M.Vokes (Editors), Metamorphosed and Metamorphogenic Ore Deposits.
Reviews in Economic Geology, Volume 11. Elsevier, Amsterdam, pp.163-201.
4 McCarthy J. H. (1968) Experiments with mercury in soil gas and air applied to exploration. Min. Eng. 20, 46.
5 Varekamp J. C. and Buseck P. R. (1983) Mercury anomalies in soils: a geochemical exploration method for
geothermal areas. Geothermics 12(1), 29–47.
6 Klusman R. W. and Jaacks J. A. (1987) Environmental influences upon mercury, radon and helium
concentrations in soil gases at a site near Denver, Colorado. J. Geochem. Explor. 27, 259–280.
7
Varekamp J. C. and Buseck P. R. (1984) The speciation of mercury in hydrothermal systems, with applications to
ore deposition. Geochim. Cosmochim. Acta 48(1), 177–185.
8 White D. E. (1967) Mercury and base-metal deposits with associated thermal and mineral waters. In
Geochemistry of Hydrothermal Ore Deposits (ed. H. L.Barnes). Holt, Rinehart and Winston, New York, chap. 13, pp.
575–631.
9 Lowe C. and Brown D.A. (1999) Characterization of Mineralization in the Sullivan - North Star Corridor,
Explor. Mining Geology, Vol. 7, No.3, pp. 237-252, 1998

34
16.0 APPENDIX - RGS Geochemical Data for Five Samples on Pakk Property
TABLE 1 ID082F779098 ID082F779099 ID082F779100 ID082F779102 ID082F779104
ORIGINAL_R GSC OF 514 GSC OF 514 GSC OF 514 GSC OF 514 GSC OF 514
UPDATE_REP GSC OF 2355 GSC OF 2355 GSC OF 2355 GSC OF 2355 GSC OF 2355
UPDATE_R_1 GBC 2013-09 GBC 2013-09 GBC 2013-09 GBC 2013-09 GBC 2013-09
NAME NELSON NELSON NELSON NELSON NELSON
TYPE2 STRM STRM STRM STRM STRM
MAP250 082F 082F 082F 082F 082F
MAP50 082F09 082F09 082F09 082F09 082F09
MAP20 082F.059 082F.059 082F.059 082F.059 082F.059
YEAR 1977 1977 1977 1977 1977
ID 9098 9099 9100 9102 9104
STATUS 0 0 0 0 0
UTMZ 11 11 11 11 11
UTME83 545585 547344 547753 550664 553641
UTMN83 5489144 5491456 5489369 5492913 5493311
LAT 49.55318 49.57384 49.55504 49.58668 49.59
LONG -116.36975 -116.34516 -116.33975 -116.29905 -116.25781
ELEV 1400 1400 1600 1400 1200
ROCK_LITHO QRTZ QRTZ QRTZ QRTZ QRTZ
STRAT mPrPu mPrPu mPrPu mPrPu mPrPu
MAT Str Sed/Water Str Sed/Water Str Sed/Water Str Sed/Water Str Sed/Water
SORC Groundwater Groundwater Groundwater Groundwater Groundwater
ORDR Quaternary Quaternary Quaternary Quaternary Quaternary
TYPE Permanent Permanent Permanent Permanent Permanent
PHYS Youthful Mts Youthful Mts Youthful Mts Youthful Mts Youthful Mts
DRNP Dendritic Herringbone Dendritic Dendritic Dendritic
CONT Forestry Forestry Forestry None Forestry
WDTH 1.5 6.1 2.4 0.9 2.4
DPTH 2 8 3 2 2
FLOW Moderate Moderate Moderate Moderate Moderate
WTRC Clear Clear Clear Clear Clear
BANK Glacial Till Glacial Till Bare Rock Glacial Till Glacial Till
BNKP Red None None Red None
COMP 1\3\0 2\2\0 2\1\0 1\2\1 1\3\0
SEDC White/Buff White/Buff White/Buff Black White/Buff
SEDP None None None None None
AG_AAS_PPM 0.2 -0.2 0.2 -0.2 -0.2
CO_AAS_PPM 14 9 7 15 6
CU_AAS_PPM 26 16 22 58 16
FE_AAS_PCT 2.75 1.85 1.6 2.6 1.4
HG_AAS_PPB 30 20 10 50 10
35
MN_AAS_PPM 1050 375 245 440 185
MO_AAS_PPM 5 2 -2 -2 -2
NI_AAS_PPM 12 11 8 18 7
PB_AAS_PPM 40 16 11 23 9
SN_AAS_PPM -2 -2 -2 2 2
ZN_AAS_PPM 225 66 40 96 46
U_NAD_PPM 5.4 5 3.1 9.5 3.1
W_CLR_PPM 28 -4 -4 -4 4
F_ISE_PPM 0 0 0 0 0
LOI_GRV_PC 0 0 0 0 0
AU_ICP_PPB 0.5 0.5 -0.2 1.8 -0.2
AG_ICP_PPB 240 64 44 207 30
AL_ICP_PCT 1.25 0.79 0.96 1.45 0.73
AS_ICP_PPM 36.9 20 13.6 38.7 19.9
B_ICP_PPM -20 -20 -20 -20 -20
BA_ICP_PPM 49.8 81.8 32.5 84.4 36.4
BI_ICP_PPM 9.39 0.54 0.26 0.4 0.24
CA_ICP_PCT 0.19 0.2 0.12 0.69 0.09
CD_ICP_PPM 2.85 0.23 0.11 0.53 0.14
CO_ICP_PPM 13.6 9 7.2 15.4 6.8
CR_ICP_PPM 13 9.9 10.2 19.5 9.6
CU_ICP_PPM 26.38 16.76 23.63 72.14 17.75
FE_ICP_PCT 2.8 1.88 1.76 2.34 1.62
GA_ICP_PPM 3.3 2.3 2.6 4 2.2
HG_ICP_PPB 30 18 12 72 -5
K_ICP_PCT 0.08 0.07 0.12 0.24 0.18
LA_ICP_PPM 19.5 16.4 18.3 81.6 16.9
MG_ICP_PCT 0.57 0.53 0.33 0.46 0.3
MN_ICP_PPM 1023 344 264 621 222
MO_ICP_PPM 4.58 0.8 0.76 1.01 0.42
NA_ICP_PCT 0.002 0.002 0.004 0.008 0.004
NI_ICP_PPM 16.7 13 11.3 21.9 10.1
P_ICP_PCT 0.059 0.045 0.025 0.077 0.025
PB_ICP_PPM 39.75 18.25 13.66 30.75 12.05
S_ICP_PCT 0.03 -0.02 -0.02 0.07 -0.02
SB_ICP_PPM 0.17 0.37 0.17 0.28 0.11
SC_ICP_PPM 1.6 1.6 1.4 2.6 1.4
SE_ICP_PPM 0.3 0.2 -0.1 2.4 -0.1
SR_ICP_PPM 17.8 5.4 6.1 32.3 6
TE_ICP_PPM 0.13 -0.02 0.07 0.04 0.04
TH_ICP_PPM 3.7 5.4 4.7 4.8 5.7
TI_ICP_PCT 0.014 0.019 0.046 0.073 0.055
TL_ICP_PPM 0.12 0.08 0.16 0.34 0.2

36
U_ICP_PPM 2.5 1.9 0.9 10.4 0.9
V_ICP_PPM 18 15 16 27 15
W_ICP_PPM 12.4 0.7 -0.1 0.8 0.7
ZN_ICP_PPM 203.9 60.6 41.7 96.7 49.3
BE_ICP_PPM 0.7 0.3 0.3 0.5 0.2
CE_ICP_PPM 38.3 35.4 45.7 118.6 40.7
CS_ICP_PPM 2.57 1.81 2.68 8.38 4.07
GE_ICP_PPM -0.1 -0.1 -0.1 -0.1 -0.1
HF_ICP_PPM -0.02 -0.02 -0.02 0.04 -0.02
IN_ICP_PPM 0.04 -0.02 -0.02 0.03 -0.02
LI_ICP_PPM 11.8 12.2 11.1 20.5 13.2
NB_ICP_PPM 0.44 0.32 0.8 2.35 0.6
RE_ICP_PPB -1 -1 -1 -1 -1
RB_ICP_PPM 11.6 10.6 21.5 40.3 29.1
SN_ICP_PPM 0.2 0.1 0.2 0.5 0.3
TA_ICP_PPM -0.05 -0.05 -0.05 -0.05 -0.05
Y_ICP_PPM 9.21 5.82 7.59 35.95 5.87
ZR_ICP_PPM 0.3 0.4 0.5 2 0.6
PT_ICP_PPB -2 -2 -2 -2 -2
PD_ICP_PPB -10 -10 -10 -10 -10
AU_INA_PPB 3 -2 -2 -2 -2
AU1_INA_PP 0 0 0 0 0
AS_INA_PPM 40 22 10 36 20
BA_INA_PPM 470 450 420 410 520
BR_INA_PPM 18 3.8 3.2 44 1.6
CE_INA_PPM 100 100 79 100 81
CO_INA_PPM 15 10 13 14 10
CR_INA_PPM 44 47 47 33 30
CS_INA_PPM 8.4 5.4 5.2 10 6
FE_INA_PCT 3.6 2.9 3.5 2.8 2.7
HF_INA_PPM 5 8 8 4 10
LA_INA_PPM 61 59 42 67 45
LU_INA_PPM -0.2 -0.2 0.3 -0.2 0.4
MO_INA_PPM 5 -1 -1 -1 -1
NA_INA_PCT 1.1 0.8 1.3 0.9 1.3
NI_INA_PPM 23 17 22 25 12
RB_INA_PPM 140 120 91 94 100
SB_INA_PPM 0.6 1.9 0.7 0.4 0.5
SC_INA_PPM 12 11 13 10 10
SM_INA_PPM 10.5 10 13.7 13 8.1
TA_INA_PPM 1.9 1.7 1.5 0.8 1.3
TB_INA_PPM 1.5 1.5 1.2 2 1.2
TH_INA_PPM 15 13 11 10 12

37
U_INA_PPM 5.8 5.7 3.7 10 3.7
W_INA_PPM 21 3 -2 -2 -2
YB_INA_PPM 4 3 3 3 3
ZR_INA_PPM 230 440 440 210 500
WT_INA_gr 20 27 31 6 32
pHw_GCE 7.3 7.9 7.3 7 7