Embed Size (px)
Citation preview
UNR Economics Working Paper Series Working Paper No. 14-001
A Study of Financial Education in the Clark County
School District
Dimitra Papadovasilaki Elliott Parker Mark Pingle
Department of Economics /0030 University of Nevada, Reno
Reno, NV 89557-0207 (775) 784-6850│ Fax (775) 784-4728
email: [email protected]
February, 2014
Abstract: This study reports the results of a financial literacy test given to more than four thousand students in 19 Southern Nevada secondary schools as a pre-test in advance of a financial education curriculum and again as a post-test. The schools vary demographically, and the delivery of the curriculum also varied. The results indicate male and Hispanic students exhibit lower levels of financial literacy; Asian and Black students improved less significantly. Financial literacy improved more when students had higher math scores, when the families of students had higher incomes and did not qualify for lunch support, when class sizes were smaller, and when teachers were more experienced. In general, the results of this study indicate actions that would improve education and would also improve financial literacy.
JEL Classification: A2, G2 Keywords: Financial Literacy, Clark County Nevada
A Study of Financial Education in the Clark County School District
Dimitra Papadovasilaki, Elliott Parker, and Mark Pingle
February 9, 2014
Abstract
This study reports the results of a financial literacy test given to more than four
thousand students in 19 Southern Nevada secondary schools as a pre-test in
advance of a financial education curriculum and again as a post-test. The schools
vary demographically, and the delivery of the curriculum also varied. The results
indicate male and Hispanic students exhibit lower levels of financial literacy;
Asian and Black students improved less significantly. Financial literacy improved
more when students had higher math scores, when the families of students had
higher incomes and did not qualify for lunch support, when class sizes were
smaller, and when teachers were more experienced. In general, the results of this
study indicate actions that would improve education and would also improve
financial literacy.

1
“Just as it was not possible to live in an industrialized society without print literacy – the
ability to read and write – so it is not possible to live in today’s world without being
financially literate. To fully participate in society today, financial literacy is critical.”-Annamaria Lusardi
1. INTRODUCTION
As much as any state, Nevada is in need of improved financial literacy. Nevada’s
economy suffered more than any state economy during the Great Recession. Though its
poverty rate remains below the national average, Nevada still has the highest personal
bankruptcy rate in the nation, the highest foreclosure rate, and the largest share of
mortgages under water. While these facts are mostly the result of factors beyond the
control of individuals or families (e.g. bursting of a housing bubble, national financial
crisis), it is also clear that financially illiteracy is responsible for much hardship. In
general, financial literacy allows individuals and families to better prepare for tough
times and more effectively prosper in good times.
In 2009, the Nevada Legislature passed NRS 389, requiring the public and charter
high schools to teach financial literacy. In 2012, as part of an effort to encourage
participation in state-managed college savings plans, Nevada State Treasurer, Kate
Marshall, began to team up with community organizations to teach financial literacy in
after-school programs. The Treasurer’s Office also funded a high school financial literacy
program in Clark County School District (CCSD) using the Financial Fitness For Life
(FFFL) curriculum. These efforts were unique enough that the Nevada State Treasurer’s
Office was named the 2013 Government Organization of the Year by the Institute for
Financial Literacy (IFL, 2013).
2
CCSD is the fifth-largest school district in the nation, with over 310 thousand
students distributed over 8000 square miles. It includes Las Vegas, Henderson, Boulder
City, and other surrounding cities in the southern tip of the state. Three pilot
implementations of the FFFL curriculum were implemented in CCSD so the
effectiveness of the FFFL curriculum could be evaluated.
The first pilot, conducted in Spring 2012, was just six weeks long. It included 12
teachers, 10 schools, and approximately 1000 students. Because time was limited,
teachers on average covered 7 of the 22 lessons in the FFFL curriculum. A 50-question
test was administered pre and post to access the improvement in financial literacy
(Marshall, 2014).
The second pilot was smaller, with only 7 teachers in 5 schools and 360 students,
but teachers had 16 weeks, which enabled most of the 22 lessons to be covered. The 50
assessment questions were again administered pre and post. However, because of the
long teaching period, the questions were divided into two parts, and administered
separately.
A third pilot was conducted in Spring 2013. It included 5 teachers, 4 schools, and
about 500 students. The program was 20-weeks in length. The full 50 question
assessment was given both pre and post.
Finally, a fourth short pilot was also conducted in Spring 2013. This pilot differed
from the others in that it used a different curriculum called Everfi. This curriculum
covered seven lessons, and a different 24-question assessment test was used pre and post.
This pilot included 36 teachers in 15 schools. Test results for approximately 2,500
students were received from 29 of these teachers.
3
In this study, we consider the impacts of these four pilot financial literacy
programs. We seek to identify factors that help explain student performance on the pre-
test scores and post-test scores on the financial literacy assessment exams. We are
especially interested in identifying any factors associated with improvement, pre-test to
post-test. Section 2 reviews the economic literature on financial literacy, and section 3
describes the data. Section 4 presents an analysis of the data, explaining pre-test and post-
test scores before considering the factors explaining student score improvement. Section
5 concludes with the implications of the study for improving financial literacy.
2. LITERATURE
Financial Literacy is defined as “the ability of people to make financial decisions
in their own best short and long term interests” (Carlin and Robinson, 2012). Financial
education can enhance this ability. However, as financial knowledge increases,
subsequent financial behavior is not always affected. Studies in behavioral economics
have found varying reasons why individuals may not make optimal choices.
Consequently, mechanisms exist that can improve financial behavior. With regard to
financial literacy, such mechanisms will tend to involve an interaction of financial
knowledge and cognitive skills, so financial knowledge is actually applied when financial
decisions are made (Carlin and Robinson, 2012). For example, a person’s propensity to
spend will tend to depend not only upon their financial knowledge, but it will also depend
upon a variety of other personal perceptions (Perry and Morris, 2005).
Because an individual’s personality limits financial literacy, improving financial
literacy through financial education is challenging. It has been demonstrated that
4
improving financial education can improve financial decisions. However, two other
effective policies are (1) support for making timely decisions and (2) default options that
limit the harm uninformed choices can cause (Carlin and Robinson, 2012).
The complexity of financial products, increases in the life expectancy, and
changes in pension arrangements all increase the need for financial literacy (OECD,
2005). Financial markets and financial instruments have developed substantially over
recent decades. The financial literacy level of the average citizen has not developed as
rapidly. Yet, portfolio and pension management are increasingly being made at an
individual level. Today, individuals are faced with decisions about Individual Retirement
Accounts and various other financial products, mortgages, multiple savings options,
opportunities to hold wealth in the form of commodities like gold, and more. This only
reinforces the need to improve personal financial knowledge (Lusardi and Mitchell,
2011a).
There is evidence that people have become increasingly interested in financial
education. A 2011 national survey conducted by the Charles Schwab financial services
firm found 86% of teens “would rather learn about money management in a class before
making mistakes in the real world;” 75% say that “learning more about money
management, including budgeting, saving and investing, is one of their top priorities”
(Schwab, 2011). Nevertheless, only 14 states require a personal finance course in high
schools, and only 22 states require an economics course (CEE, 2011).
The greater use and abuse of credit is another rationale for improving financial
literacy. The average undergraduate student loan debt increased by 58% between 1997
and 2007, while the number of student credit card holders increased by 74% between
5
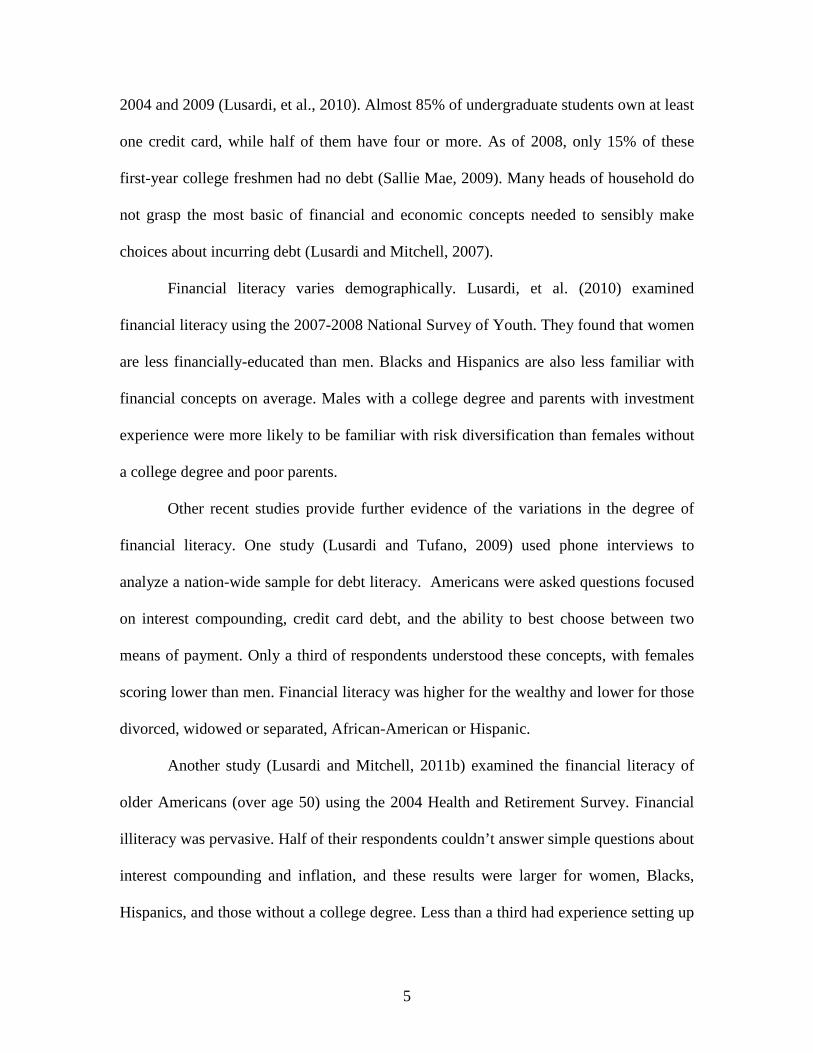
2004 and 2009 (Lusardi, et al., 2010). Almost 85% of undergraduate students own at least
one credit card, while half of them have four or more. As of 2008, only 15% of these
first-year college freshmen had no debt (Sallie Mae, 2009). Many heads of household do
not grasp the most basic of financial and economic concepts needed to sensibly make
choices about incurring debt (Lusardi and Mitchell, 2007).
Financial literacy varies demographically. Lusardi, et al. (2010) examined
financial literacy using the 2007-2008 National Survey of Youth. They found that women
are less financially-educated than men. Blacks and Hispanics are also less familiar with
financial concepts on average. Males with a college degree and parents with investment
experience were more likely to be familiar with risk diversification than females without
a college degree and poor parents.
Other recent studies provide further evidence of the variations in the degree of
financial literacy. One study (Lusardi and Tufano, 2009) used phone interviews to
analyze a nation-wide sample for debt literacy. Americans were asked questions focused
on interest compounding, credit card debt, and the ability to best choose between two
means of payment. Only a third of respondents understood these concepts, with females
scoring lower than men. Financial literacy was higher for the wealthy and lower for those
divorced, widowed or separated, African-American or Hispanic.
Another study (Lusardi and Mitchell, 2011b) examined the financial literacy of
older Americans (over age 50) using the 2004 Health and Retirement Survey. Financial
illiteracy was pervasive. Half of their respondents couldn’t answer simple questions about
interest compounding and inflation, and these results were larger for women, Blacks,
Hispanics, and those without a college degree. Less than a third had experience setting up
6
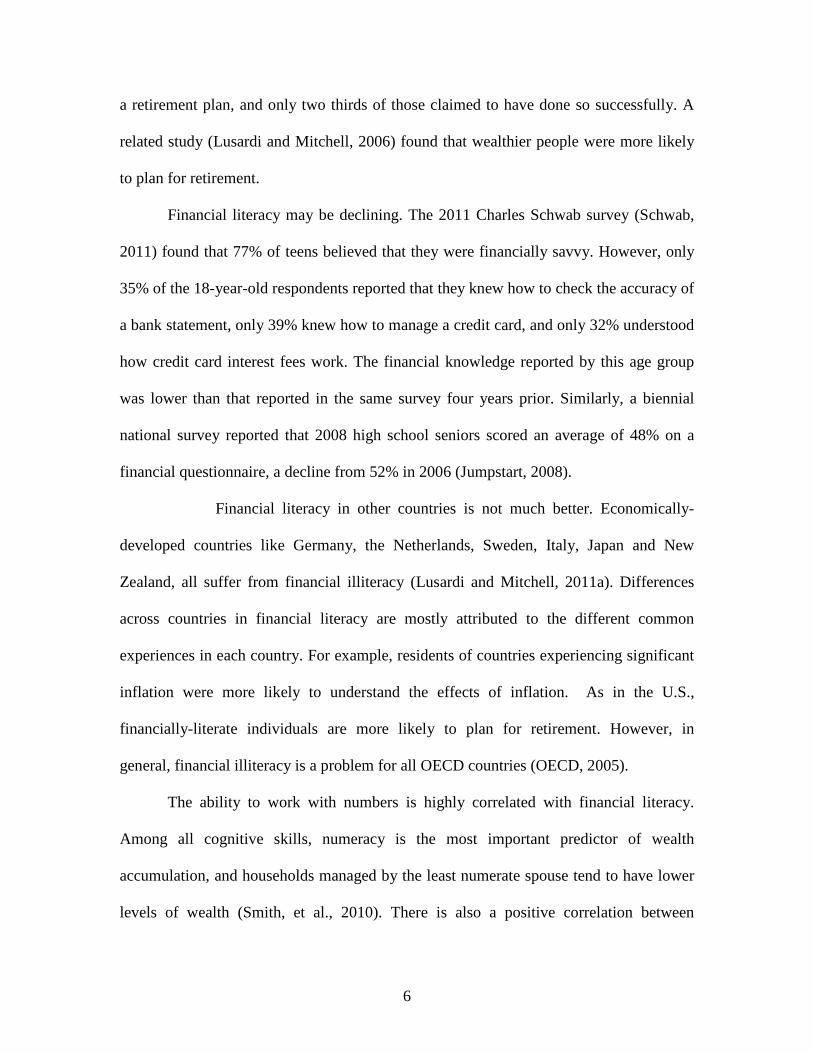
a retirement plan, and only two thirds of those claimed to have done so successfully. A
related study (Lusardi and Mitchell, 2006) found that wealthier people were more likely
to plan for retirement.
Financial literacy may be declining. The 2011 Charles Schwab survey (Schwab,
2011) found that 77% of teens believed that they were financially savvy. However, only
35% of the 18-year-old respondents reported that they knew how to check the accuracy of
a bank statement, only 39% knew how to manage a credit card, and only 32% understood
how credit card interest fees work. The financial knowledge reported by this age group
was lower than that reported in the same survey four years prior. Similarly, a biennial
national survey reported that 2008 high school seniors scored an average of 48% on a
financial questionnaire, a decline from 52% in 2006 (Jumpstart, 2008).
Financial literacy in other countries is not much better. Economically-
developed countries like Germany, the Netherlands, Sweden, Italy, Japan and New
Zealand, all suffer from financial illiteracy (Lusardi and Mitchell, 2011a). Differences
across countries in financial literacy are mostly attributed to the different common
experiences in each country. For example, residents of countries experiencing significant
inflation were more likely to understand the effects of inflation. As in the U.S.,
financially-literate individuals are more likely to plan for retirement. However, in
general, financial illiteracy is a problem for all OECD countries (OECD, 2005).
The ability to work with numbers is highly correlated with financial literacy.
Among all cognitive skills, numeracy is the most important predictor of wealth
accumulation, and households managed by the least numerate spouse tend to have lower
levels of wealth (Smith, et al., 2010). There is also a positive correlation between
7
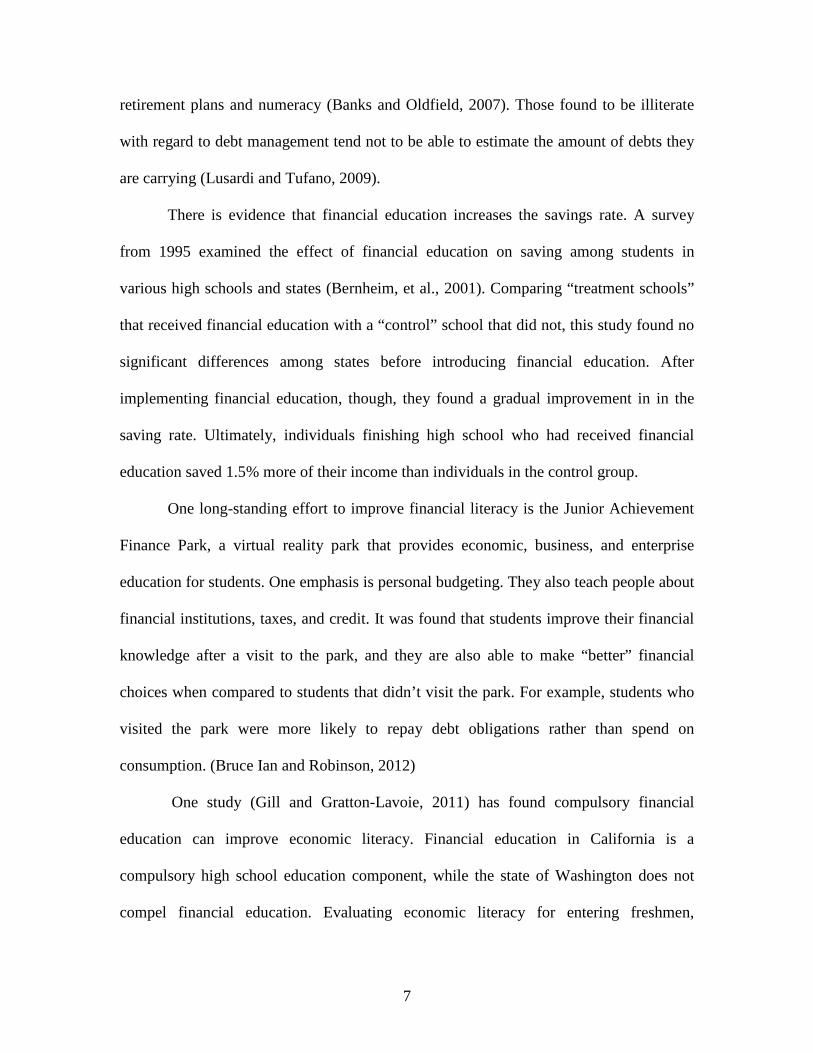
retirement plans and numeracy (Banks and Oldfield, 2007). Those found to be illiterate
with regard to debt management tend not to be able to estimate the amount of debts they
are carrying (Lusardi and Tufano, 2009).
There is evidence that financial education increases the savings rate. A survey
from 1995 examined the effect of financial education on saving among students in
various high schools and states (Bernheim, et al., 2001). Comparing “treatment schools”
that received financial education with a “control” school that did not, this study found no
significant differences among states before introducing financial education. After
implementing financial education, though, they found a gradual improvement in in the
saving rate. Ultimately, individuals finishing high school who had received financial
education saved 1.5% more of their income than individuals in the control group.
One long-standing effort to improve financial literacy is the Junior Achievement
Finance Park, a virtual reality park that provides economic, business, and enterprise
education for students. One emphasis is personal budgeting. They also teach people about
financial institutions, taxes, and credit. It was found that students improve their financial
knowledge after a visit to the park, and they are also able to make “better” financial
choices when compared to students that didn’t visit the park. For example, students who
visited the park were more likely to repay debt obligations rather than spend on
consumption. (Bruce Ian and Robinson, 2012)
One study (Gill and Gratton-Lavoie, 2011) has found compulsory financial
education can improve economic literacy. Financial education in California is a
compulsory high school education component, while the state of Washington does not
compel financial education. Evaluating economic literacy for entering freshmen,
8
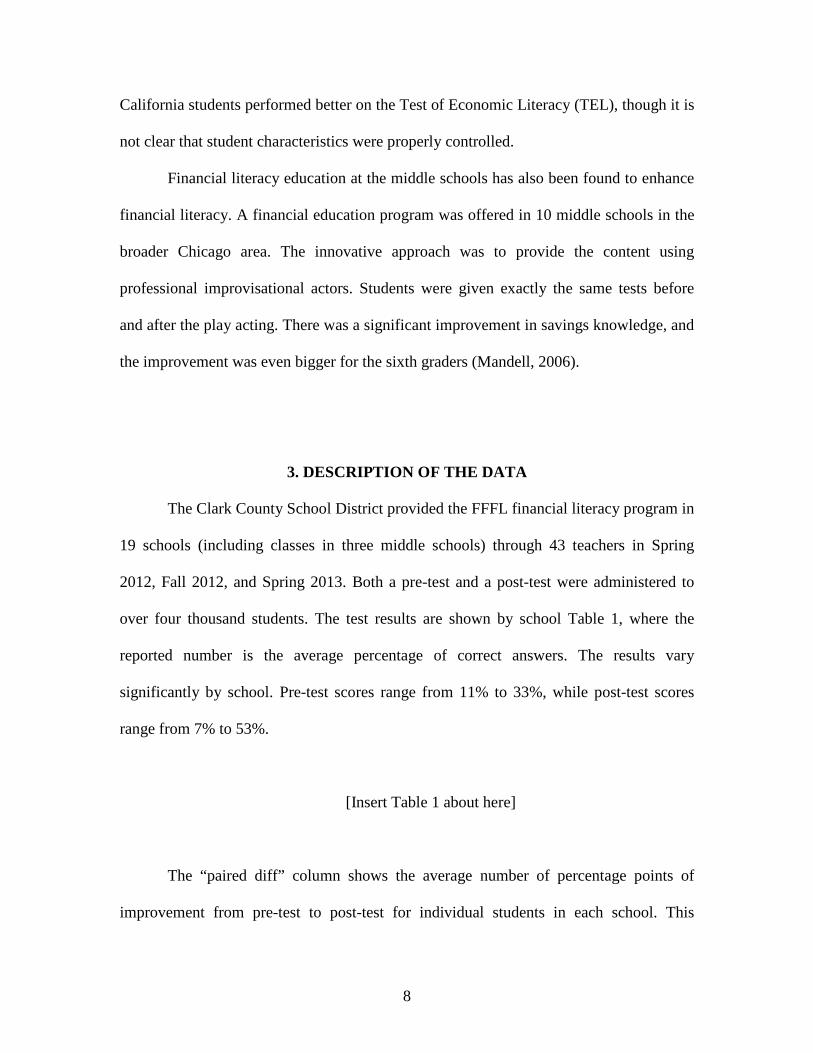
California students performed better on the Test of Economic Literacy (TEL), though it is
not clear that student characteristics were properly controlled.
Financial literacy education at the middle schools has also been found to enhance
financial literacy. A financial education program was offered in 10 middle schools in the
broader Chicago area. The innovative approach was to provide the content using
professional improvisational actors. Students were given exactly the same tests before
and after the play acting. There was a significant improvement in savings knowledge, and
the improvement was even bigger for the sixth graders (Mandell, 2006).
3. DESCRIPTION OF THE DATA
The Clark County School District provided the FFFL financial literacy program in
19 schools (including classes in three middle schools) through 43 teachers in Spring
2012, Fall 2012, and Spring 2013. Both a pre-test and a post-test were administered to
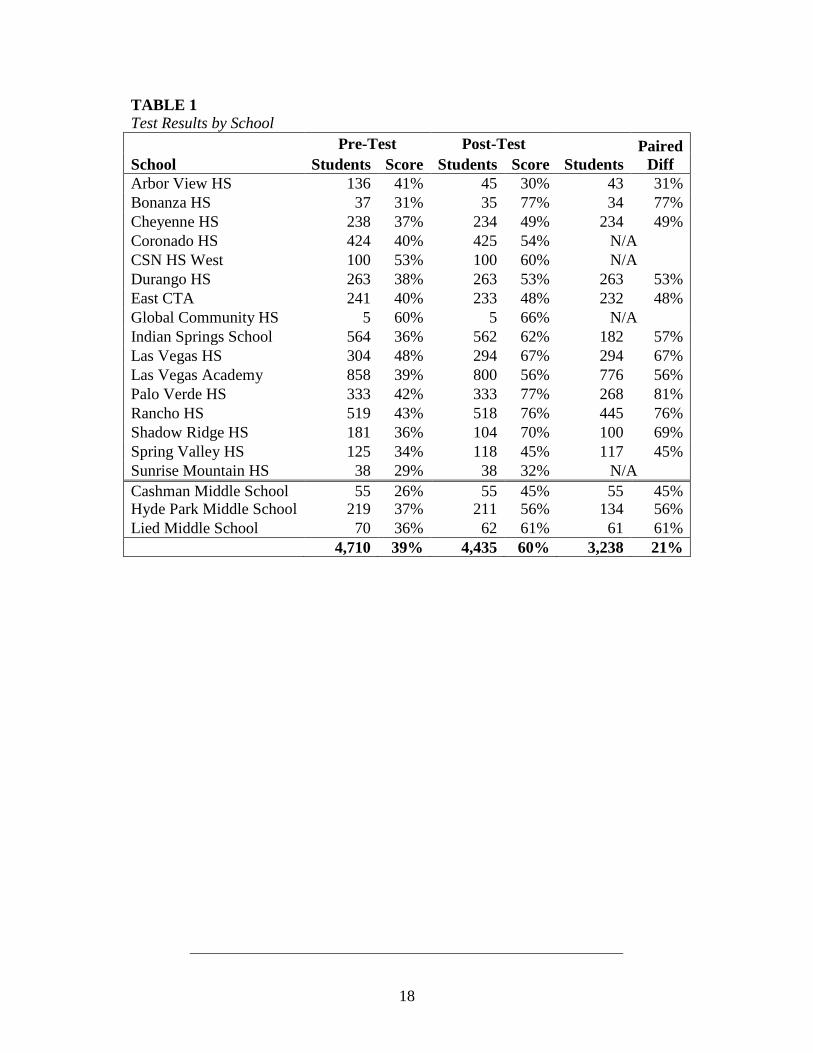
over four thousand students. The test results are shown by school Table 1, where the
reported number is the average percentage of correct answers. The results vary
significantly by school. Pre-test scores range from 11% to 33%, while post-test scores
range from 7% to 53%.
[Insert Table 1 about here]
The “paired diff” column shows the average number of percentage points of
improvement from pre-test to post-test for individual students in each school. This

9
difference can only be calculated when a pre-test can be matched with a post-test for the
same student, which we could do for 3,238 students. Data for a student who only took the
pre-test was included in the pre-test column average, but not in the paired diff calculation.
Similarly, data for a student who only took the post-test was included in the post-test
column average, but not in the paired diff calculation. The “not available” N/A entry
appears in the paired diff column when the school did not provide student identification,
making the pairing of pre-test and post-test scores impossible. The paired difference
results indicate improvement occurred on average at each school and for each student.
The improvement varied greatly, ranging from just 2 percentage points to a very
substantial 44 percentage points.
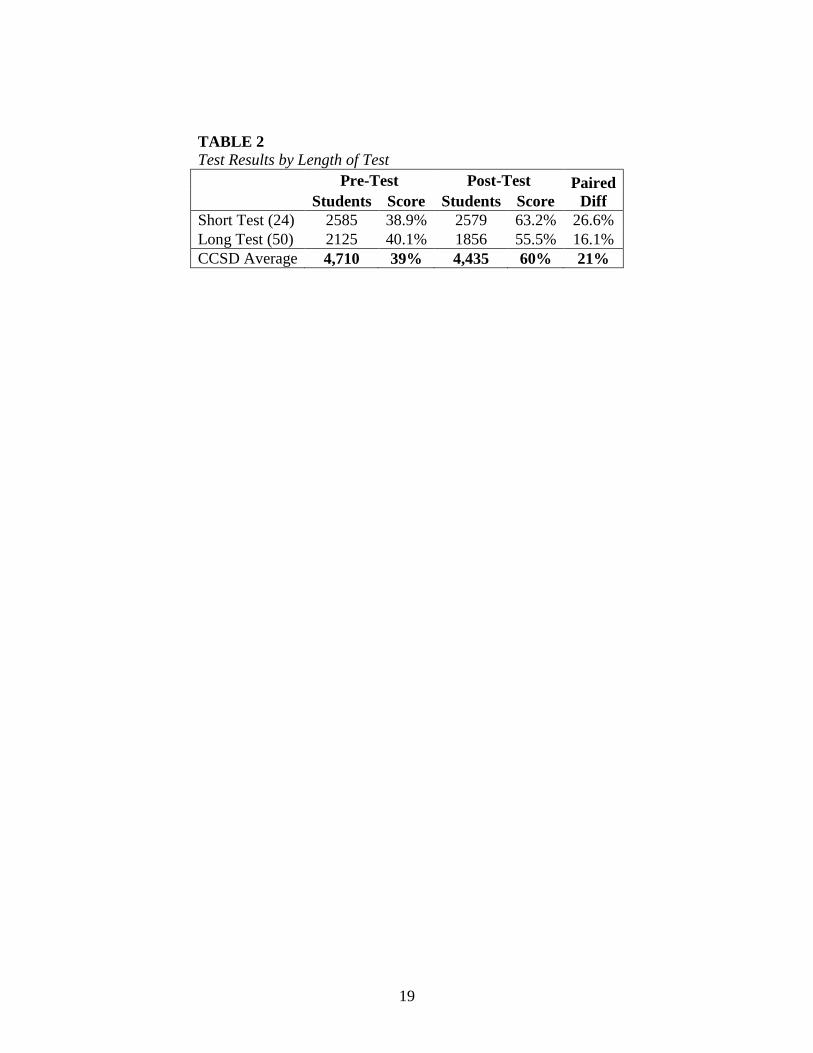
The test contained 50 questions, though for a majority of students the financial
literacy program was reduced and a test with only 24 questions was administered. These
two groups are compared in Table 2. There is almost no difference in the average pre-test
scores of those who took the shorter test and those who took the longer test. However, the
average post-test scores were higher for those who took the shorter test. Moreover, the
improvement was greater among those who took the shorter test.
[Insert Table 2 about here]
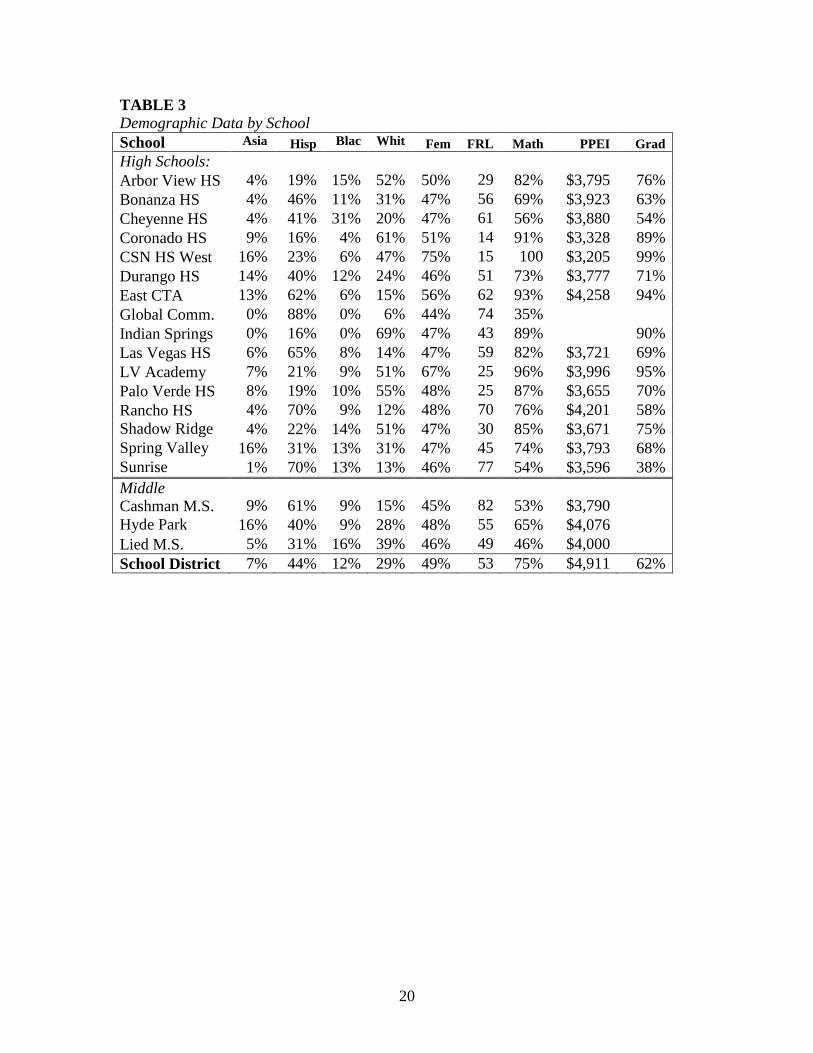
For privacy reasons, demographic data are not available for the individual
students who took these financial literacy tests. However, demographic data for each
school are reported publicly in the CCSD 2012-13 Accountability Report. These are
summarized for the schools in our sample in Table 3.

10
[Insert Table 3 about here]
The demographic data includes the percentage of students in each school reported
as Asian, Hispanic, Black/African American, White, or Female. Also available are
percentages for the number of students who qualify for free or reduced-price lunch
(FRL), the percentage of students who were meeting or exceeding expectations on the
district’s tests in mathematics (Math), and the per-pupil expenditures on instruction
(PPEI). Graduation rates are also reported in Table 3, though they are not available for
one of the newest high schools nor, of course, for the middle schools.
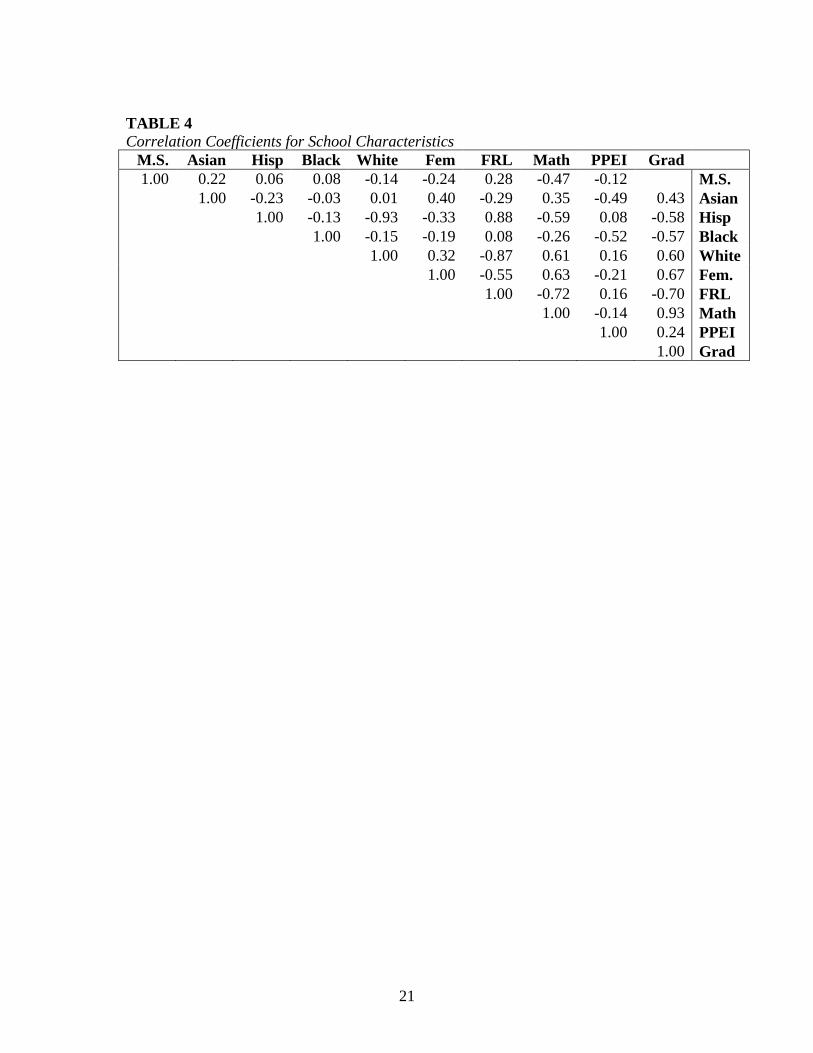
Correlation coefficients for the demographic data presented in Table 3 are
reported in Table 4. The critical value for a two-tailed test of 5% significance is +/- 0.46.
What relationships meet this level of significance? High schools with more Asian or
more Black students spend less per pupil on instruction. Middle schools have fewer
students who meet or exceed expectations on their standardized math tests, as do high
schools with more Hispanic students, fewer White students, fewer Female students, and
more students who qualify for lunch support. Schools with more Hispanic students, fewer
White Students, or fewer Female students have more students who qualify for lunch
support. Schools with more Hispanic students have fewer students identified as White.
[Insert Table 4 about here]
A difference in the graduation rate is likely explained by many of the same factors
that would explain a difference in performance on a financial literacy test. Thus, the
graduation rate is not included in the regressions presented below. Nonetheless, it is
11
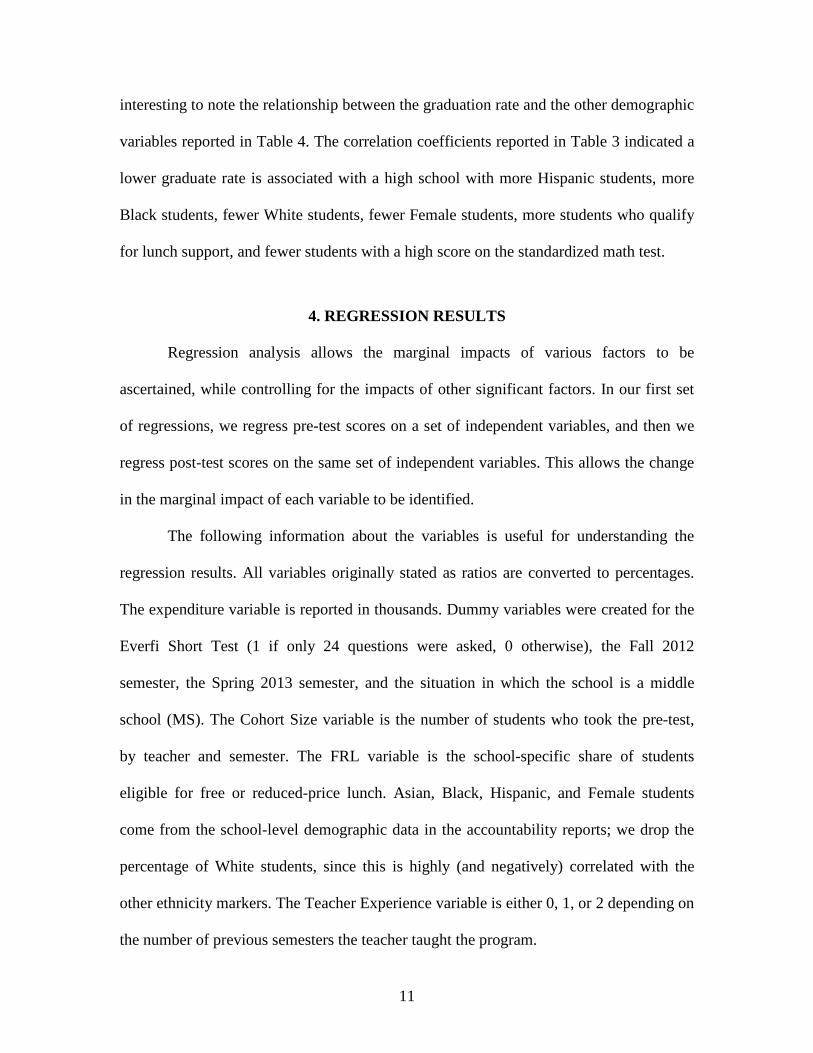
interesting to note the relationship between the graduation rate and the other demographic
variables reported in Table 4. The correlation coefficients reported in Table 3 indicated a
lower graduate rate is associated with a high school with more Hispanic students, more
Black students, fewer White students, fewer Female students, more students who qualify
for lunch support, and fewer students with a high score on the standardized math test.
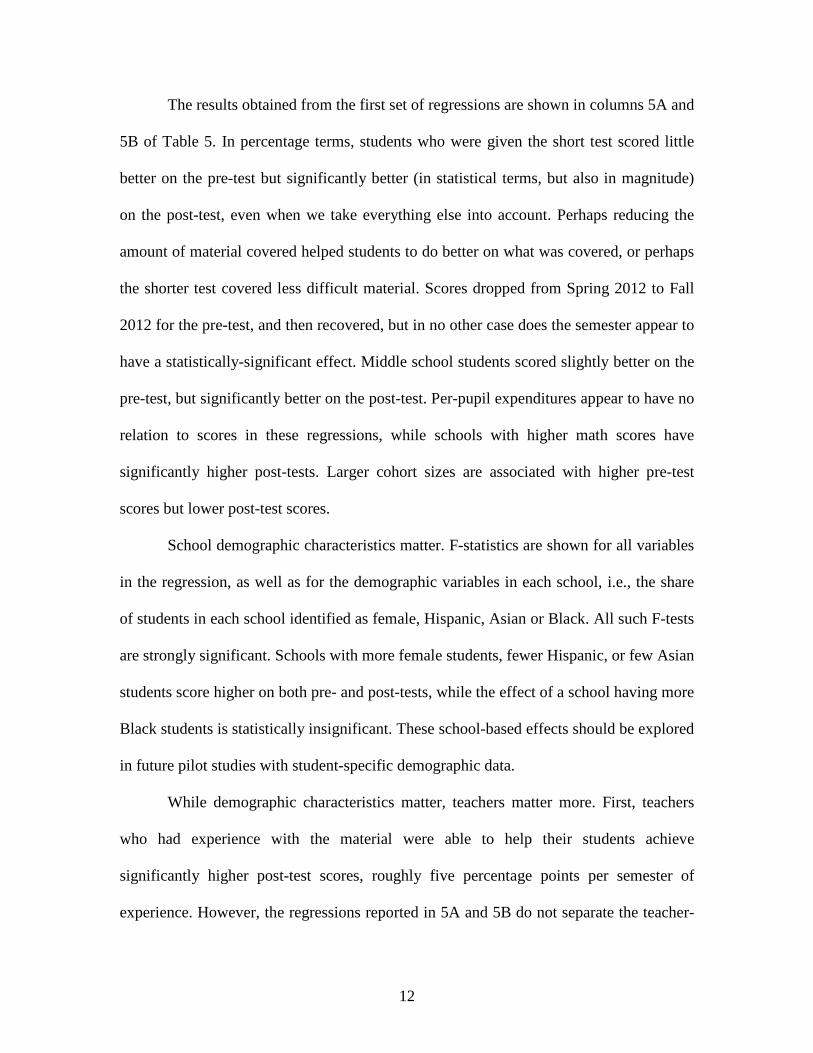
4. REGRESSION RESULTS
Regression analysis allows the marginal impacts of various factors to be
ascertained, while controlling for the impacts of other significant factors. In our first set
of regressions, we regress pre-test scores on a set of independent variables, and then we
regress post-test scores on the same set of independent variables. This allows the change
in the marginal impact of each variable to be identified.
The following information about the variables is useful for understanding the
regression results. All variables originally stated as ratios are converted to percentages.
The expenditure variable is reported in thousands. Dummy variables were created for the
Everfi Short Test (1 if only 24 questions were asked, 0 otherwise), the Fall 2012
semester, the Spring 2013 semester, and the situation in which the school is a middle
school (MS). The Cohort Size variable is the number of students who took the pre-test,
by teacher and semester. The FRL variable is the school-specific share of students
eligible for free or reduced-price lunch. Asian, Black, Hispanic, and Female students
come from the school-level demographic data in the accountability reports; we drop the
percentage of White students, since this is highly (and negatively) correlated with the
other ethnicity markers. The Teacher Experience variable is either 0, 1, or 2 depending on
the number of previous semesters the teacher taught the program.
12
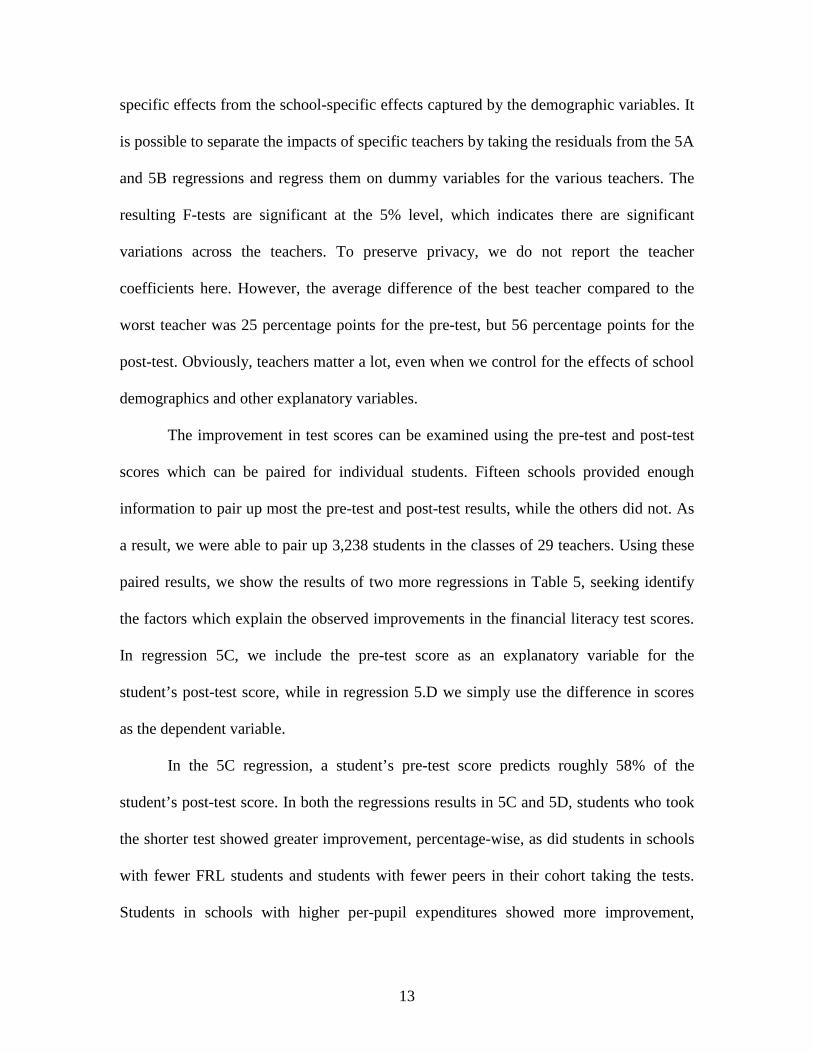
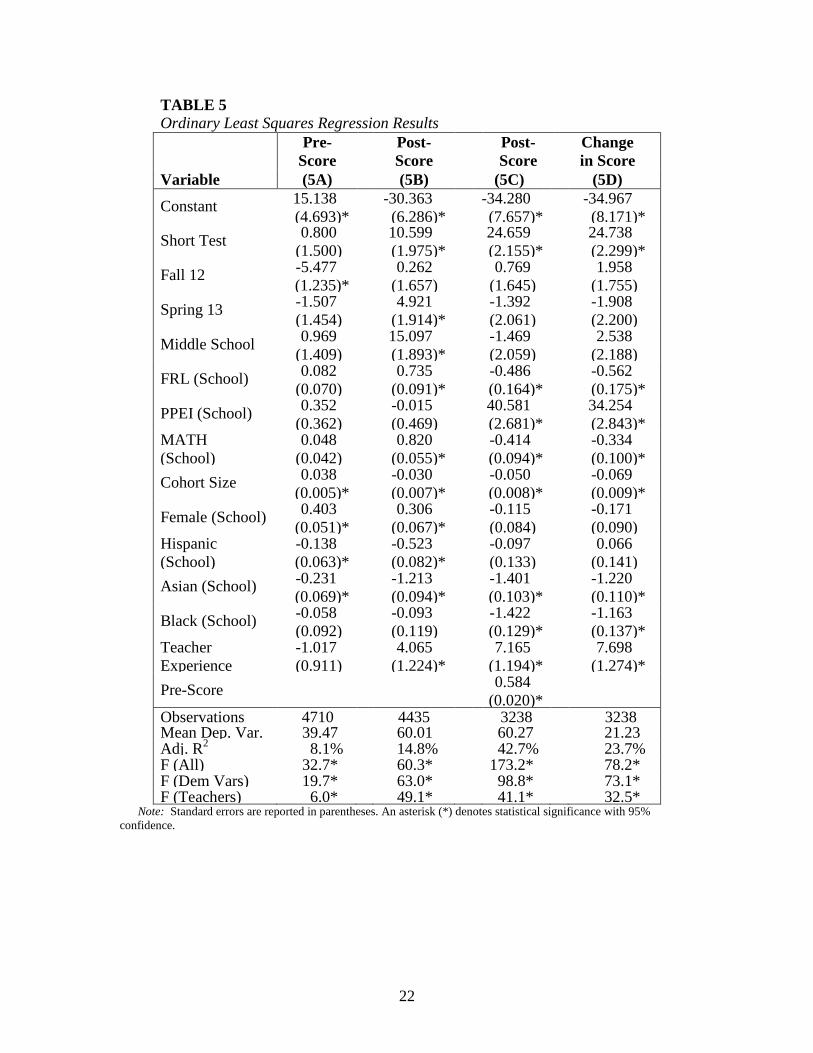
The results obtained from the first set of regressions are shown in columns 5A and
5B of Table 5. In percentage terms, students who were given the short test scored little
better on the pre-test but significantly better (in statistical terms, but also in magnitude)
on the post-test, even when we take everything else into account. Perhaps reducing the
amount of material covered helped students to do better on what was covered, or perhaps
the shorter test covered less difficult material. Scores dropped from Spring 2012 to Fall
2012 for the pre-test, and then recovered, but in no other case does the semester appear to
have a statistically-significant effect. Middle school students scored slightly better on the
pre-test, but significantly better on the post-test. Per-pupil expenditures appear to have no
relation to scores in these regressions, while schools with higher math scores have
significantly higher post-tests. Larger cohort sizes are associated with higher pre-test
scores but lower post-test scores.
School demographic characteristics matter. F-statistics are shown for all variables
in the regression, as well as for the demographic variables in each school, i.e., the share
of students in each school identified as female, Hispanic, Asian or Black. All such F-tests
are strongly significant. Schools with more female students, fewer Hispanic, or few Asian
students score higher on both pre- and post-tests, while the effect of a school having more
Black students is statistically insignificant. These school-based effects should be explored
in future pilot studies with student-specific demographic data.
While demographic characteristics matter, teachers matter more. First, teachers
who had experience with the material were able to help their students achieve
significantly higher post-test scores, roughly five percentage points per semester of
experience. However, the regressions reported in 5A and 5B do not separate the teacher-
13
specific effects from the school-specific effects captured by the demographic variables. It
is possible to separate the impacts of specific teachers by taking the residuals from the 5A
and 5B regressions and regress them on dummy variables for the various teachers. The
resulting F-tests are significant at the 5% level, which indicates there are significant
variations across the teachers. To preserve privacy, we do not report the teacher
coefficients here. However, the average difference of the best teacher compared to the
worst teacher was 25 percentage points for the pre-test, but 56 percentage points for the
post-test. Obviously, teachers matter a lot, even when we control for the effects of school
demographics and other explanatory variables.
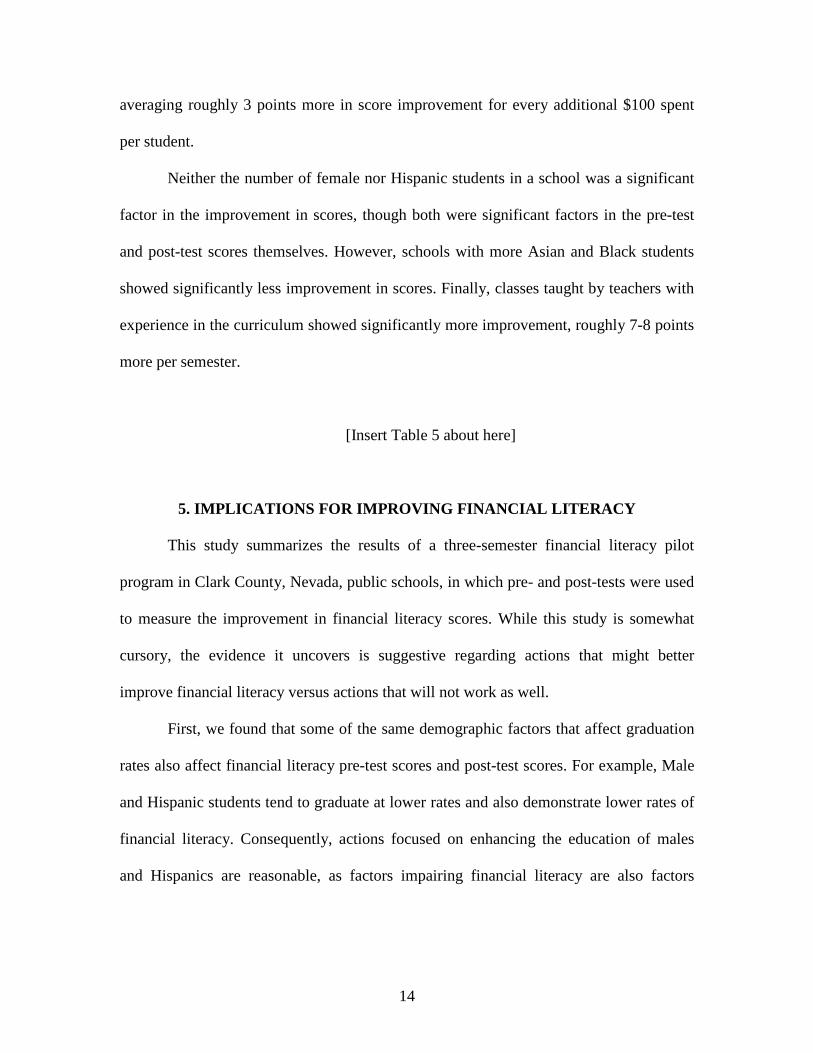
The improvement in test scores can be examined using the pre-test and post-test
scores which can be paired for individual students. Fifteen schools provided enough
information to pair up most the pre-test and post-test results, while the others did not. As
a result, we were able to pair up 3,238 students in the classes of 29 teachers. Using these
paired results, we show the results of two more regressions in Table 5, seeking identify
the factors which explain the observed improvements in the financial literacy test scores.
In regression 5C, we include the pre-test score as an explanatory variable for the
student’s post-test score, while in regression 5.D we simply use the difference in scores
as the dependent variable.
In the 5C regression, a student’s pre-test score predicts roughly 58% of the
student’s post-test score. In both the regressions results in 5C and 5D, students who took
the shorter test showed greater improvement, percentage-wise, as did students in schools
with fewer FRL students and students with fewer peers in their cohort taking the tests.
Students in schools with higher per-pupil expenditures showed more improvement,
14
averaging roughly 3 points more in score improvement for every additional $100 spent
per student.
Neither the number of female nor Hispanic students in a school was a significant
factor in the improvement in scores, though both were significant factors in the pre-test
and post-test scores themselves. However, schools with more Asian and Black students
showed significantly less improvement in scores. Finally, classes taught by teachers with
experience in the curriculum showed significantly more improvement, roughly 7-8 points
more per semester.
[Insert Table 5 about here]
5. IMPLICATIONS FOR IMPROVING FINANCIAL LITERACY
This study summarizes the results of a three-semester financial literacy pilot
program in Clark County, Nevada, public schools, in which pre- and post-tests were used
to measure the improvement in financial literacy scores. While this study is somewhat
cursory, the evidence it uncovers is suggestive regarding actions that might better
improve financial literacy versus actions that will not work as well.
First, we found that some of the same demographic factors that affect graduation
rates also affect financial literacy pre-test scores and post-test scores. For example, Male
and Hispanic students tend to graduate at lower rates and also demonstrate lower rates of
financial literacy. Consequently, actions focused on enhancing the education of males
and Hispanics are reasonable, as factors impairing financial literacy are also factors
15
impairing graduation, and finding a way to improve one will likely be finding a way to
improve the other.
Second, we found that while financial literacy scores tended to be higher when
students had higher math scores, the improvement is scores tended to be less as less-
prepared students were able to catch up to some extent. There is similar evidence of a
catch-up effect for males, though it is not statistically significant. However, financial
literacy scores improved more when fewer students qualified for lunch support, when
schools were better funded, when class sizes were smaller, and when teachers were more
experienced. That is, some factors we would reasonably expect to improve education in
general would also seem to improve financial literacy. Consequently, it is reasonable to
expect actions that improve education in general will also improve financial literacy.
Finally, those who participated in a shorter program, with a different curriculum
and a shorter test, demonstrated more improvement. Because multiple factors were
different from the other pilot programs which were impossible to isolate, it is not clear
what made the difference. However, the difference suggests some approaches may be
better than others. In particular, different curriculum should be tried.
16
References Banks, James, and Zoë Oldfield. 2007. "Understanding pensions: Cognitive function,
numerical ability and retirement saving." Fiscal Studies 28, no. 2 : 143-170.
Bernheim, B. Douglas, Daniel M. Garrett, and Dean M. Maki. 2001."Education and saving: The long-term effects of high school financial curriculum mandates. "Journal of Public Economics 80, no. 3: 435-465.
Carlin, Bruce Ian, and David T. Robinson. 2012."What does financial literacy training teach us?." The Journal of Economic Education 43, no. 3: 235-247.
Clark County School District Accountability Reports. 2012-2013. http://www.ccsd.net/schools/pdf/acc_pdfs_2012 2011-2012_District_Accountability_Report.pdf
Council for Economic Education. 2011. Survey of the States 2011: Economic and Personal Finance Education in Our Nation's Schools. http://www.councilforeconed.org/ wp/wp-content/uploads/2011/11/2011-Survey-of-the-States.pdf.
Gill, Andrew M., and Chiara Gratton-Lavoie. 2011. "Retention of high school economics knowledge and the effect of the California state mandate." The Journal of Economic Education 42, no. 4: 319-337.
IFL. 2013. Institute for Financial Literacy Announces Winners of the 2013 Excellence In Financial Literacy Education (EIFLE) Awards, Institute for Financial Literacy, https://financiallit.org/institute-for-financial-literacy-announces-winners-of-the-2013-excellence-in-financial-literacy-education-eifle-awards/.
Jumpstart. 2008. Jump$tart Coalition Survey of Personal Financial Literacy among Students. http://jumpstart.org/survey.html.
Lusardi, Annamaria and Olivia S. Mitchell. 2006. “Baby boomer retirement security: the roles of planning, financial literacy, and housing wealth.” Working Paper 12585, National Bureau of Economic Research.
Lusardi, Annamaria, and Olivia Mitchelli. 2007. "Financial literacy and retirement preparedness: Evidence and implications for financial education." Business Economics 42, no. 1: 35-44.
Lusardi, Annamaria, and Olivia S. Mitchell. 2011. “Financial literacy around the world: an overview.” Working Paper 17107, National Bureau of Economic Research.
Lusardi, Annamaria, and Olivia S. Mitchell. 2011b. “Financial literacy and planning: Implications for retirement well-being”. Working Paper 17078, National Bureau of Economic Research.
Lusardi, Annamaria, Olivia S. Mitchell, and Vilsa Curto. 2010. "Financial literacy among the young." Journal of Consumer Affairs 44, no. 2: 358-380..
Lusardi, Annamaria, and Peter Tufano. 2009. “Debt literacy, financial experiences, and overindebtedness.” Working Paper 14808, National Bureau of Economic Research.
17
Mandell, Lewis. 2008. "Teaching young dogs old tricks: The effectiveness of financial literacy intervention in pre-high school grades." Thomas A. Lucey and Kathleen S. Cooter, Financial Literacy for Children and Youth, Digitaltextbooks. biz.
Marshall, Kate. 2014. State Treasurer’s Office Financial Literacy Activities Summary, Kate Marshall 2012-2014. Mimeo.
OECD. 2005. Improving Financial Literacy: Analysis of Issues and Policies, Paris, France: Organization for Economic Co-Operation and Development.
Perry, Vanessa G., and Marlene D. Morris. 2005. "Who is in control? The role of self‐perception, knowledge, and income in explaining consumer financial behavior." Journal of Consumer Affairs 39, no. 2: 299-313.
Sallie Mae. 2009. How Undergraduate Students Use Credit Cards: Sallie Mae’s National Study of Usage Rates and Trends. http://static.mgnetwork.com/rtd/pdfs/20090830_iris.pdf.
Schwab, Charles. 2011. Teens and Money Survey Findings. http://www.aboutschwab.com/ images/press/teensmoneyfactsheet.pdf
Smith, James P., John J. McArdle, and Robert Willis. 2010. "Financial decision making and cognition in a family context." The Economic Journal 120, no. 548: F363-F380.
18
TABLE 1 Test Results by School
School Pre-Test Post-Test
Students Paired
Diff Students Score Students Score Arbor View HS 136 41% 45 30% 43 31% Bonanza HS 37 31% 35 77% 34 77% Cheyenne HS 238 37% 234 49% 234 49% Coronado HS 424 40% 425 54% N/A CSN HS West 100 53% 100 60% N/A Durango HS 263 38% 263 53% 263 53% East CTA 241 40% 233 48% 232 48% Global Community HS 5 60% 5 66% N/A Indian Springs School 564 36% 562 62% 182 57% Las Vegas HS 304 48% 294 67% 294 67% Las Vegas Academy 858 39% 800 56% 776 56% Palo Verde HS 333 42% 333 77% 268 81% Rancho HS 519 43% 518 76% 445 76% Shadow Ridge HS 181 36% 104 70% 100 69% Spring Valley HS 125 34% 118 45% 117 45% Sunrise Mountain HS 38 29% 38 32% N/A Cashman Middle School 55 26% 55 45% 55 45% Hyde Park Middle School 219 37% 211 56% 134 56% Lied Middle School 70 36% 62 61% 61 61%
4,710 39% 4,435 60% 3,238 21%
19
TABLE 2 Test Results by Length of Test
Pre-Test Post-Test Paired Diff Students Score Students Score
Short Test (24) 2585 38.9% 2579 63.2% 26.6% Long Test (50) 2125 40.1% 1856 55.5% 16.1% CCSD Average 4,710 39% 4,435 60% 21%
20
TABLE 3 Demographic Data by School School Asia
Hisp Blac
Whit
Fem FRL Math PPEI Grad
High Schools: Arbor View HS 4% 19% 15% 52% 50% 29
82% $3,795 76%
Bonanza HS 4% 46% 11% 31% 47% 56
69% $3,923 63% Cheyenne HS 4% 41% 31% 20% 47% 61
56% $3,880 54%
Coronado HS 9% 16% 4% 61% 51% 14
91% $3,328 89% CSN HS West 16% 23% 6% 47% 75% 15
100
$3,205 99%
Durango HS 14% 40% 12% 24% 46% 51
73% $3,777 71% East CTA 13% 62% 6% 15% 56% 62
93% $4,258 94%
Global Comm. 0% 88% 0% 6% 44% 74
35%
Indian Springs 0% 16% 0% 69% 47% 43
89%
90%
Las Vegas HS 6% 65% 8% 14% 47% 59
82% $3,721 69% LV Academy 7% 21% 9% 51% 67% 25
96% $3,996 95%
Palo Verde HS 8% 19% 10% 55% 48% 25
87% $3,655 70% Rancho HS 4% 70% 9% 12% 48% 70
76% $4,201 58%
Shadow Ridge
4% 22% 14% 51% 47% 30
85% $3,671 75% Spring Valley
16% 31% 13% 31% 47% 45
74% $3,793 68%
Sunrise
1% 70% 13% 13% 46% 77
54% $3,596 38% Middle
Cashman M.S. 9% 61% 9% 15% 45% 82
53% $3,790 Hyde Park
16% 40% 9% 28% 48% 55
65% $4,076 Lied M.S. 5% 31% 16% 39% 46% 49
46% $4,000 School District 7% 44% 12% 29% 49% 53
75% $4,911
62%
21
TABLE 4 Correlation Coefficients for School Characteristics
M.S. Asian Hisp Black White Fem FRL Math PPEI Grad 1.00 0.22 0.06 0.08 -0.14 -0.24 0.28 -0.47 -0.12
M.S.
1.00 -0.23 -0.03 0.01 0.40 -0.29 0.35 -0.49 0.43 Asian
1.00 -0.13 -0.93 -0.33 0.88 -0.59 0.08 -0.58 Hisp
1.00 -0.15 -0.19 0.08 -0.26 -0.52 -0.57 Black
1.00 0.32 -0.87 0.61 0.16 0.60 White
1.00 -0.55 0.63 -0.21 0.67 Fem.
1.00 -0.72 0.16 -0.70 FRL
1.00 -0.14 0.93 Math
1.00 0.24 PPEI
1.00 Grad
22
TABLE 5 Ordinary Least Squares Regression Results
Variable
Pre- Score
Post- Score
Post- Score
Change in Score
(5A) (5B) (5C) (5D)
Constant 15.138 (4.693)*
-30.363 (6.286)*
-34.280 (7.657)*
-34.967 (8.171)*
Short Test 0.800 (1.500) 10.599
(1.975)* 24.659 (2.155)* 24.738
(2.299)* Fall 12 -5.477
(1.235)* 0.262 (1.657) 0.769
(1.645) 1.958 (1.755)
Spring 13 -1.507 (1.454) 4.921
(1.914)* -1.392 (2.061) -1.908
(2.200) Middle School 0.969
(1.409) 15.097 (1.893)* -1.469
(2.059) 2.538 (2.188)
FRL (School) 0.082 (0.070) 0.735
(0.091)* -0.486 (0.164)* -0.562
(0.175)* PPEI (School) 0.352
(0.362) -0.015 (0.469) 40.581
(2.681)* 34.254 (2.843)*
MATH (School)
0.048 (0.042) 0.820
(0.055)* -0.414 (0.094)* -0.334
(0.100)* Cohort Size 0.038
(0.005)* -0.030 (0.007)* -0.050
(0.008)* -0.069 (0.009)*
Female (School) 0.403 (0.051)* 0.306
(0.067)* -0.115 (0.084) -0.171
(0.090) Hispanic (School)
-0.138 (0.063)* -0.523
(0.082)* -0.097 (0.133) 0.066
(0.141) Asian (School) -0.231
(0.069)* -1.213 (0.094)* -1.401
(0.103)* -1.220 (0.110)*
Black (School) -0.058 (0.092) -0.093
(0.119) -1.422 (0.129)* -1.163
(0.137)* Teacher Experience
-1.017 (0.911) 4.065
(1.224)* 7.165 (1.194)* 7.698
(1.274)* Pre-Score 0.584
(0.020)*
Observations 4710 4435 3238 3238 Mean Dep. Var. 39.47 60.01 60.27 21.23 Adj. R2 8.1% 14.8% 42.7% 23.7% F (All) 32.7* 60.3* 173.2* 78.2* F (Dem Vars) 19.7* 63.0* 98.8* 73.1* F (Teachers) 6.0* 49.1* 41.1* 32.5*
Note: Standard errors are reported in parentheses. An asterisk (*) denotes statistical significance with 95% confidence.