Embed Size (px)
Citation preview
A study of communication pathways in methionyl-tRNA synthetase by molecular dynamics simulationsand structure network analysisAmit Ghosh and Saraswathi Vishveshwara*
Molecular Biophysics Unit, Indian Institute of Science, Bangalore 560012, India
Edited by John Kuriyan, University of California, Berkeley, CA, and approved August 21, 2007 (received for review May 15, 2007)
The enzymes of the family of tRNA synthetases perform their func-tions with high precision by synchronously recognizing the anticodonregion and the aminoacylation region, which are separated by �70 Åin space. This precision in function is brought about by establishinggood communication paths between the two regions. We havemodeled the structure of the complex consisting of Escherichia colimethionyl-tRNA synthetase (MetRS), tRNA, and the activated methi-onine. Molecular dynamics simulations have been performed on themodeled structure to obtain the equilibrated structure of the complexand the cross-correlations between the residues in MetRS have beenevaluated. Furthermore, the network analysis on these simulatedstructures has been carried out to elucidate the paths of communi-cation between the activation site and the anticodon recognition site.This study has provided the detailed paths of communication, whichare consistent with experimental results. Similar studies also havebeen carried out on the complexes (MetRS � activated methonine)and (MetRS � tRNA) along with ligand-free native enzyme. A com-parison of the paths derived from the four simulations clearly hasshown that the communication path is strongly correlated and uniqueto the enzyme complex, which is bound to both the tRNA and theactivated methionine. The details of the method of our investigationand the biological implications of the results are presented in thisarticle. The method developed here also could be used to investigateany protein system where the function takes place through long-distance communication.
dynamic cross-correlations � methionyl-AMP � protein structure network �shortest pathways of communication � stacking
A crucial step in the translation of the genetic code is theaminoacylation of tRNA, which involves the molecular rec-
ognition between the aminoacyl-tRNA synthetases (aaRS) andtheir cognate tRNA. Each synthetase consists of the catalyticdomain and the anticodon domain that are separated by �70 Å.Each tRNA connects these two regions with its anticodon and theacceptor stems. The mechanism of differentiations between cog-nate and noncognate tRNAs depends on contacts of anticodondomain of synthetase and anticodon stem of tRNA. The efficiencyof the selection mechanism controls the overall accuracy of proteinsynthesis (1, 2). Recognition of the protein (aaRS) and the tRNAis explained by using the induced-fit mechanism, which suggestsconformational changes in protein, tRNA, or both, leading to thefinal bound complex (3). However, the details of communicationbetween the anticodon region and the aminoacylation region areless understood.
In all living cells, protein synthesis starts with methionine.Methionyl-tRNA synthetase (MetRS) binds to free methionine inits catalytic site, and the charging of amino acid takes place in thepresence of ATP, which then is finally transferred to 2�-OH moietyof the terminal adenosine of tRNA. MetRS acylates two tRNAs(tRNAf
Met and tRNAmMet), which have different nucleotide se-
quences. However, their common anticodon (CAU) is responsiblefor discriminating other noncognate tRNAs against cognate ones.The C-terminal �-helical domain (anticodon domain) of MetRS isresponsible for the recognition of three anticodon bases of
tRNAMet (4). Extensive experiments have been carried out toestablish the importance of several amino acid residues in MetRSand the nucleotides of tRNA in the recognition processes. Forinstance, the loop containing highly conserved residue Trp-461plays a crucial role in the recognition of anticodon bases, asconfirmed by affinity-labeling experiments (5), isolation of secondsite mutants (6), and docking studies of glutaminyl-tRNA onMetRS (7). Substitution of highly conserved residues Trp-461,Asn-452, or Arg-395 shows their involvement in the binding ofMetRS to anticodon site of tRNA (8–10). Two negatively chargedresidues, Asp-449 and Asp-456, also contribute to the overallspecificity of the anticodon recognition, although they do not makedirect contact with tRNA (11). Because of their acidic nature, theseresidues are able to reject all other noncognate tRNAs from bindingto the anticodon sites of MetRS.
Various investigations have been carried out to understand themode of communication between the anticodon and the activationsite in aaRS. Interdomain signaling has long been recognized to beimportant in establishing contacts (12, 13). It also has been pointedout that the interface region is sensitive to structural perturbations,which affect the noncovalent packing interaction between the twofunctional domains (14, 15) in MetRS. The importance of covalentconnectivity in domain–domain communication also has beeninvestigated in CysRS (16). The idea of communication betweenthe two sites through a network of residues, interacting in space hasbeen put forward (12). Thus, it is a challenging task to identify suchnetworks in aaRS. The identification of cooperative network ofinteractions between residues in the protein (U1A)–RNA complexhas been carried out by NMR experiments (17, 18). More details ofcommunications in this system have been obtained through mo-lecular dynamics (MD) simulations (19, 20). This investigation hasconfirmed that the collective atomic fluctuations obtained fromMD simulations agree very well with the experimentally observedcooperativity.
In this article, we have identified the communication pathsbetween the anticodon binding region and the aminoacylation sitein MetRS. Two approaches are combined to achieve this goal. First,the dynamically cross-correlated residues in MetRS have beenidentified from MD simulations by using a method similar to theone used in U1A–RNA complex (19, 20). Although this method ispowerful in identifying the highly correlated residues involved in the
Author contributions: A.G. and S.V. designed research; A.G. performed research; A.G. andS.V. analyzed data; and A.G. and S.V. wrote the paper.
The authors declare no conflict of interest.
This article is a PNAS Direct Submission.
Abbreviations: aaRS, aminoacyl-tRNA synthetase; MetRS, methionyl-tRNA synthetase; MD,molecular dynamics; MetAMP, methionyl-AMP; RMSD, root mean square deviation; DCCM,dynamic cross-correlation map; PSN, protein structure network; PSG, protein structuregraphs.
*To whom correspondence may be addressed. E-mail: [email protected].
This article contains supporting information online at www.pnas.org/cgi/content/full/0704459104/DC1.
© 2007 by The National Academy of Sciences of the USA
www.pnas.org�cgi�doi�10.1073�pnas.0704459104 PNAS � October 2, 2007 � vol. 104 � no. 40 � 15711–15716
BIO
PHYS
ICS
Dow
nloa
ded
by g
uest
on
May
26,
202
0
communication path, the correlated residues are not necessarilyconnected in space; hence, the paths that are spatially connectedcannot be detected by this method alone. In the present work, webridge this gap by analyzing the protein structure graphs (PSG).This approach, developed in our laboratory (21–25), identifies theresidues connected spatially by noncovalent interactions. The non-covalently interacting direct links, connecting the anticodon regionand the aminoacylation region, have been identified by the analysisof the protein-structure graph of MetRS. In the final step, theshortest paths of connected networks, consistent with the dynam-ically cross-correlated set of residues, have been selected as thepaths of communication between the anticodon and the amino-acylation regions. Such paths have been identified in the ligand-freeform of Escherichia coli MetRS (system A) and also in threecomplexed structures of E. coli MetRS: with methionyl-AMP(MetAMP) (system B), with tRNA (system C), and with bothMetAMP and tRNA (system D). A comparison of the paths inthese four systems has shown that the set of communication pathsare shortest and strongly correlated in MetRS bound to bothMetAMP and tRNA (system D). Several of the residues identifiedin these paths have been shown by experiments to be important inrecognition. The methodology followed in the identification ofpaths and the important results are presented in this article.
Results and DiscussionModeling of the tRNAf
Met-bound structure of E. coli MetRS. Thecrystal structure of the complex of E. coli MetRS with tRNAMet isnot available, although the structures of tRNAMet (26) and MetRS(27, 28) are available. Hence, we modeled the structure of MetRS–tRNAf
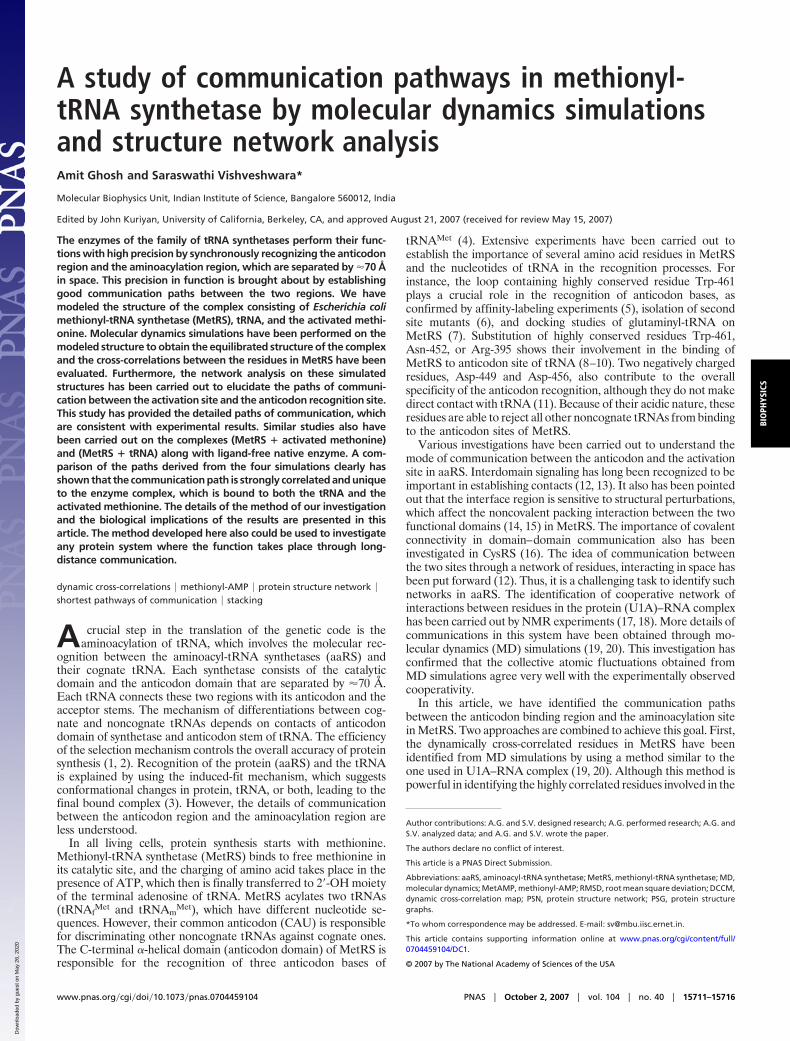
Met complex by using the Aquifex aeolicus (29) as a template.A major difference between the structures of the bound form ofAquifex tRNA and the unbound form of E. coli–tRNA was foundin the anticodon loop consisting of 11 bases. Therefore we replacedthe conformation of E. coli tRNA in this region by that of theAquifex tRNA in the complex, and some details of this modeledstructure of E. coli tRNA are given in supporting information (SI)Fig. 7. The structure of E. coli MetRS–tRNAMet complex thusmodeled is shown in Fig. 1.
The communication paths between the anticodon recognitionsite and the activated amino acid binding region (active site region)in E. coli MetRS has been identified by analyzing and comparing theMD trajectories of four systems (systems A, MetRS; B, MetRSbound to MetAMP; C, MetRS bound to tRNA; and D, MetRSbound to MetAMP and tRNA). The simulation results along withthe analyses of the dynamic cross-correlations and the proteinstructure networks (PSN) are presented in the following sections.
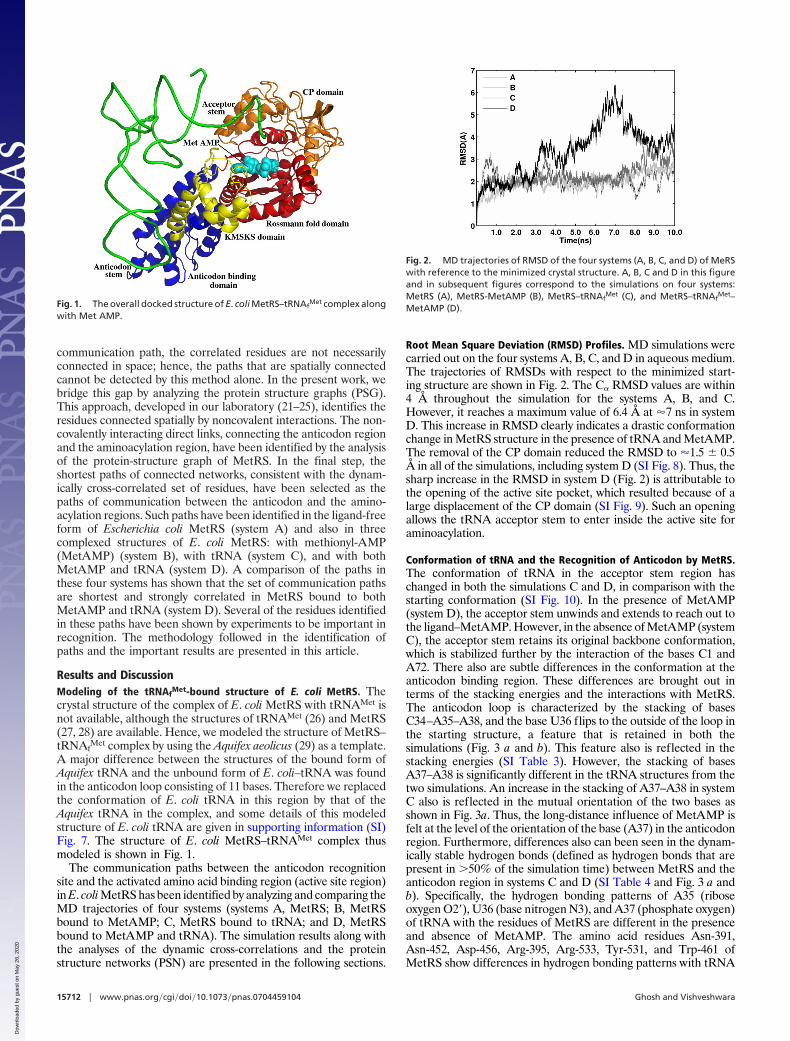
Root Mean Square Deviation (RMSD) Profiles. MD simulations werecarried out on the four systems A, B, C, and D in aqueous medium.The trajectories of RMSDs with respect to the minimized start-ing structure are shown in Fig. 2. The C� RMSD values are within4 Å throughout the simulation for the systems A, B, and C.However, it reaches a maximum value of 6.4 Å at �7 ns in systemD. This increase in RMSD clearly indicates a drastic conformationchange in MetRS structure in the presence of tRNA and MetAMP.The removal of the CP domain reduced the RMSD to �1.5 � 0.5Å in all of the simulations, including system D (SI Fig. 8). Thus, thesharp increase in the RMSD in system D (Fig. 2) is attributable tothe opening of the active site pocket, which resulted because of alarge displacement of the CP domain (SI Fig. 9). Such an openingallows the tRNA acceptor stem to enter inside the active site foraminoacylation.
Conformation of tRNA and the Recognition of Anticodon by MetRS.The conformation of tRNA in the acceptor stem region haschanged in both the simulations C and D, in comparison with thestarting conformation (SI Fig. 10). In the presence of MetAMP(system D), the acceptor stem unwinds and extends to reach out tothe ligand–MetAMP. However, in the absence of MetAMP (systemC), the acceptor stem retains its original backbone conformation,which is stabilized further by the interaction of the bases C1 andA72. There also are subtle differences in the conformation at theanticodon binding region. These differences are brought out interms of the stacking energies and the interactions with MetRS.The anticodon loop is characterized by the stacking of basesC34–A35–A38, and the base U36 flips to the outside of the loop inthe starting structure, a feature that is retained in both thesimulations (Fig. 3 a and b). This feature also is reflected in thestacking energies (SI Table 3). However, the stacking of basesA37–A38 is significantly different in the tRNA structures from thetwo simulations. An increase in the stacking of A37–A38 in systemC also is reflected in the mutual orientation of the two bases asshown in Fig. 3a. Thus, the long-distance influence of MetAMP isfelt at the level of the orientation of the base (A37) in the anticodonregion. Furthermore, differences also can been seen in the dynam-ically stable hydrogen bonds (defined as hydrogen bonds that arepresent in �50% of the simulation time) between MetRS and theanticodon region in systems C and D (SI Table 4 and Fig. 3 a andb). Specifically, the hydrogen bonding patterns of A35 (riboseoxygen O2�), U36 (base nitrogen N3), and A37 (phosphate oxygen)of tRNA with the residues of MetRS are different in the presenceand absence of MetAMP. The amino acid residues Asn-391,Asn-452, Asp-456, Arg-395, Arg-533, Tyr-531, and Trp-461 ofMetRS show differences in hydrogen bonding patterns with tRNA
Fig. 1. The overall docked structure of E. coli MetRS–tRNAfMet complex along
with Met AMP.
Fig. 2. MD trajectories of RMSD of the four systems (A, B, C, and D) of MeRSwith reference to the minimized crystal structure. A, B, C and D in this figureand in subsequent figures correspond to the simulations on four systems:MetRS (A), MetRS-MetAMP (B), MetRS–tRNAf
Met (C), and MetRS–tRNAfMet–
MetAMP (D).
15712 � www.pnas.org�cgi�doi�10.1073�pnas.0704459104 Ghosh and Vishveshwara
Dow
nloa
ded
by g
uest
on
May
26,
202
0
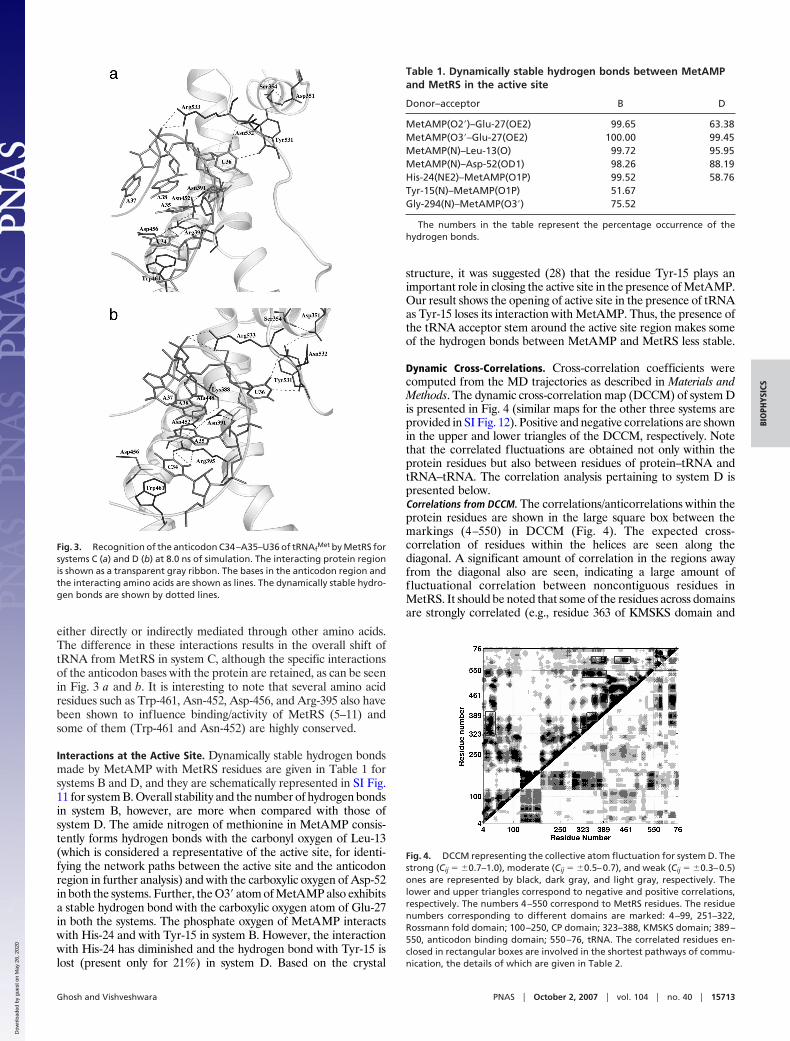
either directly or indirectly mediated through other amino acids.The difference in these interactions results in the overall shift oftRNA from MetRS in system C, although the specific interactionsof the anticodon bases with the protein are retained, as can be seenin Fig. 3 a and b. It is interesting to note that several amino acidresidues such as Trp-461, Asn-452, Asp-456, and Arg-395 also havebeen shown to influence binding/activity of MetRS (5–11) andsome of them (Trp-461 and Asn-452) are highly conserved.
Interactions at the Active Site. Dynamically stable hydrogen bondsmade by MetAMP with MetRS residues are given in Table 1 forsystems B and D, and they are schematically represented in SI Fig.11 for system B. Overall stability and the number of hydrogen bondsin system B, however, are more when compared with those ofsystem D. The amide nitrogen of methionine in MetAMP consis-tently forms hydrogen bonds with the carbonyl oxygen of Leu-13(which is considered a representative of the active site, for identi-fying the network paths between the active site and the anticodonregion in further analysis) and with the carboxylic oxygen of Asp-52in both the systems. Further, the O3� atom of MetAMP also exhibitsa stable hydrogen bond with the carboxylic oxygen atom of Glu-27in both the systems. The phosphate oxygen of MetAMP interactswith His-24 and with Tyr-15 in system B. However, the interactionwith His-24 has diminished and the hydrogen bond with Tyr-15 islost (present only for 21%) in system D. Based on the crystal
structure, it was suggested (28) that the residue Tyr-15 plays animportant role in closing the active site in the presence of MetAMP.Our result shows the opening of active site in the presence of tRNAas Tyr-15 loses its interaction with MetAMP. Thus, the presence ofthe tRNA acceptor stem around the active site region makes someof the hydrogen bonds between MetAMP and MetRS less stable.
Dynamic Cross-Correlations. Cross-correlation coefficients werecomputed from the MD trajectories as described in Materials andMethods. The dynamic cross-correlation map (DCCM) of system Dis presented in Fig. 4 (similar maps for the other three systems areprovided in SI Fig. 12). Positive and negative correlations are shownin the upper and lower triangles of the DCCM, respectively. Notethat the correlated fluctuations are obtained not only within theprotein residues but also between residues of protein–tRNA andtRNA–tRNA. The correlation analysis pertaining to system D ispresented below.Correlations from DCCM. The correlations/anticorrelations within theprotein residues are shown in the large square box between themarkings (4–550) in DCCM (Fig. 4). The expected cross-correlation of residues within the helices are seen along thediagonal. A significant amount of correlation in the regions awayfrom the diagonal also are seen, indicating a large amount offluctuational correlation between noncontiguous residues inMetRS. It should be noted that some of the residues across domainsare strongly correlated (e.g., residue 363 of KMSKS domain and
Fig. 3. Recognition of the anticodon C34–A35–U36 of tRNAfMet by MetRS for
systems C (a) and D (b) at 8.0 ns of simulation. The interacting protein regionis shown as a transparent gray ribbon. The bases in the anticodon region andthe interacting amino acids are shown as lines. The dynamically stable hydro-gen bonds are shown by dotted lines.
Table 1. Dynamically stable hydrogen bonds between MetAMPand MetRS in the active site
Donor–acceptor B D
MetAMP(O2�)–Glu-27(OE2) 99.65 63.38MetAMP(O3�–Glu-27(OE2) 100.00 99.45MetAMP(N)–Leu-13(O) 99.72 95.95MetAMP(N)–Asp-52(OD1) 98.26 88.19His-24(NE2)–MetAMP(O1P) 99.52 58.76Tyr-15(N)–MetAMP(O1P) 51.67Gly-294(N)–MetAMP(O3�) 75.52
The numbers in the table represent the percentage occurrence of thehydrogen bonds.
Fig. 4. DCCM representing the collective atom fluctuation for system D. Thestrong (Cij � �0.7–1.0), moderate (Cij � �0.5–0.7), and weak (Cij � �0.3–0.5)ones are represented by black, dark gray, and light gray, respectively. Thelower and upper triangles correspond to negative and positive correlations,respectively. The numbers 4–550 correspond to MetRS residues. The residuenumbers corresponding to different domains are marked: 4–99, 251–322,Rossmann fold domain; 100–250, CP domain; 323–388, KMSKS domain; 389–550, anticodon binding domain; 550–76, tRNA. The correlated residues en-closed in rectangular boxes are involved in the shortest pathways of commu-nication, the details of which are given in Table 2.
Ghosh and Vishveshwara PNAS � October 2, 2007 � vol. 104 � no. 40 � 15713
BIO
PHYS
ICS
Dow
nloa
ded
by g
uest
on
May
26,
202
0
Asn-452 of the anticodon binding domain). The correlated residuesinvolved in the shortest pathways of communication (which isdiscussed in a later section) are enclosed in rectangular boxes.There also is a significant amount of anticorrelated fluctuationwithin the protein. The residues (101–250) of the CP domain aremoderately anticorrelated with the residues (1–100) of the catalyticdomain and the stem-contact fold domain (323–389), which meansthat the CP domain moves away from the catalytic and thestem-contact fold domains by an anticorrelated fashion.
The correlated and the anticorrelated fluctuations of tRNA withMetRS are shown in the rectangles between the markings (550–76)and (4–550), respectively, at the top and on the right of Fig. 4. It isinteresting to see that the loop and the stem of the anticodon regionof tRNA (bases 33 to 38) are strongly correlated with the residues452–465 and 388–395 of the anticodon binding domain of MetRS.This feature may assist in binding to the cognate tRNA containingthe bases C34–A35–U36. The rest of tRNA (bases 14 to 21 and 48to 63) is strongly anticorrelated with the anticodon domain regionof MetRS, indicating that the interaction between tRNA andMetRS is dominated mainly through the cognate stem region of thetRNA.
The fluctuational correlations of tRNA within itself are shown inthe small box in the top right of Fig. 4. Correlations and anticor-relations are negligible between bases of the acceptor stem (bases39 to 44 and 27 to 31) and the anticodon loop (bases 32 to 38) oftRNA. Thus intramolecular long-range signaling from the antico-don loop of tRNA to the active site of MetRS is very poor along thelength of the L-shaped tRNA. This finding is consistent with theobservation made earlier (14).Correlated fluctuations and shortest pathways of cooperativity. Thecollective atomic f luctuations for MetRS–tRNA complex formcooperative networks among residues of MetRS. DCCMs areanalyzed to obtain networks (paths) of such correlated resi-dues. The shortest network of correlated residues between twoselected residues in MetRS is extracted from DCCM. Asmentioned earlier, the carbonyl oxygen of Leu-13 makes astrong hydrogen bond with the nitrogen of methionine part ofMetAMP, which is stable throughout the simulation, and a setof residues (Asn-391, Arg-395, and Trp-461) interacts with theanticodon part of tRNA. Hence, Leu-13 from the activationsite and the residues such as Trp-461, Arg-395, and Asn-391from the anticodon region have been selected as the terminalresidues between which the shortest paths have been exploredThese paths have been identified at different levels of corre-lations (strong: Cij � 1.0–0.7; moderate: Cij � 0.7–0.5; andweak: Cij � 0.3–0.5). The correlated residues involved (at alllevels) in the shortest paths between Leu-13 and Trp-461,Arg-395, and Asn-391 are marked as rectangles in the DCCMof system D (Fig. 4), and all of the identified paths are givenin Table 2 (some of the correlated paths are depicted picto-rially in SI Fig. 13).
Influence of tRNA and MetAMP on correlations within MetRS. TheDCCMs also have been generated for systems A, B, and C (SI Fig.12 a–c). A striking contrast between the DCCM of system D andthose of systems A, B, and C is the reduction in the magnitude ofcross-correlated/anticorrelated fluctuations. The correlations arereasonably high in the tRNA bound structure C, although they arenot as high as in system D. Drastic reduction in the correlations isobserved in systems A and B, both of which lack tRNA as the ligand,which clearly indicates that the binding of tRNA is required forefficient communication between the active site and the anticodonbinding region in MetRS, and this communication is enhanced inthe presence of MetAMP. Shortest pathways of communicationbetween the two regions have been evaluated in all of the threesystems (A, B, and C) (SI Table 5). It is interesting to note that thestrongly correlated paths between the active site and the anticodonregion are present only in system D and not in the other threesystems.
Communication Pathways from PSN. The patterns of cross-correlation between different residues in MetRS have providedvaluable information from which the paths of communicationsbetween the activation site and the anticodon binding region havebeen constructed. However, it does not provide the details ofcomplete connections. Here we make use of the paths derived fromcross-correlation (Table 2) and find the missing links from PSNanalysis (tRNA is not included in this calculation, because there wasno correlation between the anticodon and the acceptor stemregions of tRNA). First, we evaluate all noncovalent residue–residue connections as described in Materials and Methods. Then,we select important residues interacting with MetAMP and theanticodon region as the end residues of the communication path, asmentioned in the previous section. Finally, we identify the shortestpaths that connect the two end members by a series of noncovalentinteractions and also incorporate the residues with strong ormedium cross-correlations. Such an analysis has been carried outfor all four systems, and the detailed results are given in SI Table6. Average shortest path length between the two end residues isobtained by averaging the lengths of the shortest path obtainedfrom all of the snapshots. The shortest of the shortest path obtainedfrom the snapshots that incorporated the correlated residues alsois given in SI Table 6 along with path details. Interestingly, this ismuch smaller for system D than that of the other three systems,indicating an efficient mode of communication in system D. Inaddition, the correlated shortest paths in system D are significantlyshorter than the average shortest path lengths, in contrast to systemsA and B, which again emphasizes the fact that the correlated pathsare shortest in system D.
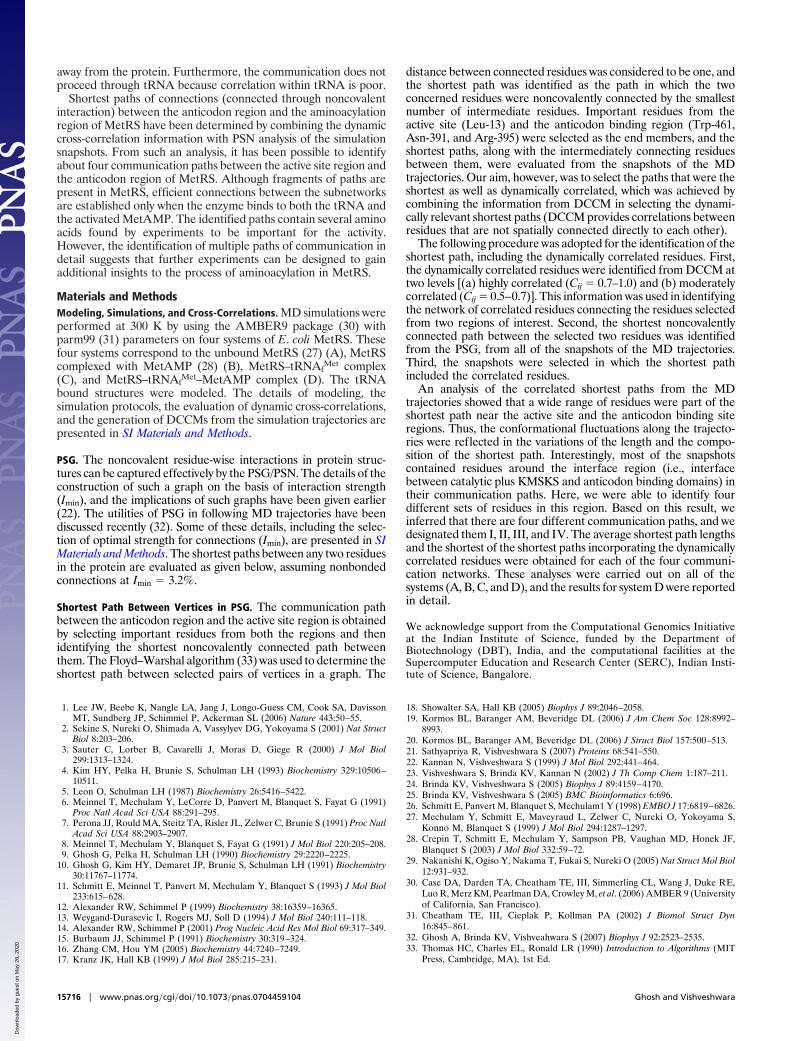
Because strong correlations are seen only in the case of systemD, extensive analysis is presented for this system. Several paths (SITable 6) identified from the analysis have been summarized in Fig.5. Four paths (I, II, III, and IV) have been identified, which aredepicted pictorially in Fig. 6. As mentioned in Materials andMethods, these paths were identified on the basis of the set ofresidues connecting the domain interface regions. Paths (Figs. 5 and6) are more diverse toward the activation site, whereas they aremore focused toward the anticodon binding region because of thefact that the residue connections from the anticodon region to theinterdomain region are mainly through helices as shown in Fig. 6.This is achieved through connections Leu-363–Phe-437–Trp-432,Tyr-539–Leu-355–Phe-377, Trp-346–Phe-350–Gln-538, and Arg-36–Leu-495, respectively, in paths I, II, III, and IV (Fig. 5).Interestingly, several of these residues are in the linker peptide(348–362), which is at the domain (active site)–domain (anticodonrecognition) interface and have been shown to play an importantrole in the communication (12). Furthermore, it may be noted thatpaths I and II (Figs. 5 and 6) incorporate the strongly correlatedresidues, whereas paths III and IV contain the moderately corre-lated residues, and the path lengths are smaller (Leu-13–Asn-452 is
Table 2. Network of correlated residues identified from DCCMfor system D
Strong Moderate
Leu-13 His-323 Leu-363 Leu-13 His-28Asn-452 Trp-461 Lys-388 Trp-461Leu-13 Val-326 Leu-355 Leu-13 Ile-534Val-381 Asn-391 Arg-395 Arg-395Leu-13 Val-326 Leu-355 Leu-13 His-28Val-381 Asn-391 Asn-391
Correlation coefficient values for strong (Cij � 0.7–1.0) and moderate (Cij �0.5–0.7) levels. The paths are evaluated between the residues shown inboldface.
15714 � www.pnas.org�cgi�doi�10.1073�pnas.0704459104 Ghosh and Vishveshwara
Dow
nloa
ded
by g
uest
on
May
26,
202
0
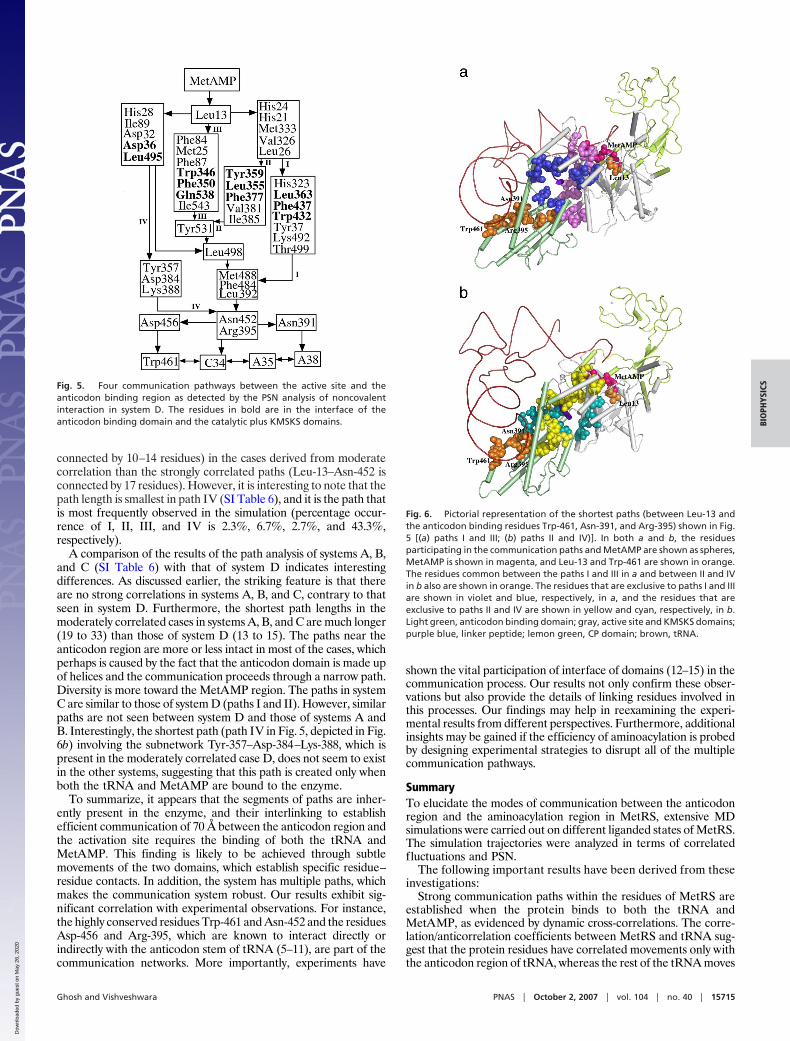
connected by 10–14 residues) in the cases derived from moderatecorrelation than the strongly correlated paths (Leu-13–Asn-452 isconnected by 17 residues). However, it is interesting to note that thepath length is smallest in path IV (SI Table 6), and it is the path thatis most frequently observed in the simulation (percentage occur-rence of I, II, III, and IV is 2.3%, 6.7%, 2.7%, and 43.3%,respectively).
A comparison of the results of the path analysis of systems A, B,and C (SI Table 6) with that of system D indicates interestingdifferences. As discussed earlier, the striking feature is that thereare no strong correlations in systems A, B, and C, contrary to thatseen in system D. Furthermore, the shortest path lengths in themoderately correlated cases in systems A, B, and C are much longer(19 to 33) than those of system D (13 to 15). The paths near theanticodon region are more or less intact in most of the cases, whichperhaps is caused by the fact that the anticodon domain is made upof helices and the communication proceeds through a narrow path.Diversity is more toward the MetAMP region. The paths in systemC are similar to those of system D (paths I and II). However, similarpaths are not seen between system D and those of systems A andB. Interestingly, the shortest path (path IV in Fig. 5, depicted in Fig.6b) involving the subnetwork Tyr-357–Asp-384–Lys-388, which ispresent in the moderately correlated case D, does not seem to existin the other systems, suggesting that this path is created only whenboth the tRNA and MetAMP are bound to the enzyme.
To summarize, it appears that the segments of paths are inher-ently present in the enzyme, and their interlinking to establishefficient communication of 70 Å between the anticodon region andthe activation site requires the binding of both the tRNA andMetAMP. This finding is likely to be achieved through subtlemovements of the two domains, which establish specific residue–residue contacts. In addition, the system has multiple paths, whichmakes the communication system robust. Our results exhibit sig-nificant correlation with experimental observations. For instance,the highly conserved residues Trp-461 and Asn-452 and the residuesAsp-456 and Arg-395, which are known to interact directly orindirectly with the anticodon stem of tRNA (5–11), are part of thecommunication networks. More importantly, experiments have
shown the vital participation of interface of domains (12–15) in thecommunication process. Our results not only confirm these obser-vations but also provide the details of linking residues involved inthis processes. Our findings may help in reexamining the experi-mental results from different perspectives. Furthermore, additionalinsights may be gained if the efficiency of aminoacylation is probedby designing experimental strategies to disrupt all of the multiplecommunication pathways.
SummaryTo elucidate the modes of communication between the anticodonregion and the aminoacylation region in MetRS, extensive MDsimulations were carried out on different liganded states of MetRS.The simulation trajectories were analyzed in terms of correlatedfluctuations and PSN.
The following important results have been derived from theseinvestigations:
Strong communication paths within the residues of MetRS areestablished when the protein binds to both the tRNA andMetAMP, as evidenced by dynamic cross-correlations. The corre-lation/anticorrelation coefficients between MetRS and tRNA sug-gest that the protein residues have correlated movements only withthe anticodon region of tRNA, whereas the rest of the tRNA moves
Fig. 5. Four communication pathways between the active site and theanticodon binding region as detected by the PSN analysis of noncovalentinteraction in system D. The residues in bold are in the interface of theanticodon binding domain and the catalytic plus KMSKS domains.
Fig. 6. Pictorial representation of the shortest paths (between Leu-13 andthe anticodon binding residues Trp-461, Asn-391, and Arg-395) shown in Fig.5 [(a) paths I and III; (b) paths II and IV)]. In both a and b, the residuesparticipating in the communication paths and MetAMP are shown as spheres,MetAMP is shown in magenta, and Leu-13 and Trp-461 are shown in orange.The residues common between the paths I and III in a and between II and IVin b also are shown in orange. The residues that are exclusive to paths I and IIIare shown in violet and blue, respectively, in a, and the residues that areexclusive to paths II and IV are shown in yellow and cyan, respectively, in b.Light green, anticodon binding domain; gray, active site and KMSKS domains;purple blue, linker peptide; lemon green, CP domain; brown, tRNA.
Ghosh and Vishveshwara PNAS � October 2, 2007 � vol. 104 � no. 40 � 15715
BIO
PHYS
ICS
Dow
nloa
ded
by g
uest
on
May
26,
202
0
away from the protein. Furthermore, the communication does notproceed through tRNA because correlation within tRNA is poor.
Shortest paths of connections (connected through noncovalentinteraction) between the anticodon region and the aminoacylationregion of MetRS have been determined by combining the dynamiccross-correlation information with PSN analysis of the simulationsnapshots. From such an analysis, it has been possible to identifyabout four communication paths between the active site region andthe anticodon region of MetRS. Although fragments of paths arepresent in MetRS, efficient connections between the subnetworksare established only when the enzyme binds to both the tRNA andthe activated MetAMP. The identified paths contain several aminoacids found by experiments to be important for the activity.However, the identification of multiple paths of communication indetail suggests that further experiments can be designed to gainadditional insights to the process of aminoacylation in MetRS.
Materials and MethodsModeling, Simulations, and Cross-Correlations. MD simulations wereperformed at 300 K by using the AMBER9 package (30) withparm99 (31) parameters on four systems of E. coli MetRS. Thesefour systems correspond to the unbound MetRS (27) (A), MetRScomplexed with MetAMP (28) (B), MetRS–tRNAf
Met complex(C), and MetRS–tRNAf
Met–MetAMP complex (D). The tRNAbound structures were modeled. The details of modeling, thesimulation protocols, the evaluation of dynamic cross-correlations,and the generation of DCCMs from the simulation trajectories arepresented in SI Materials and Methods.
PSG. The noncovalent residue-wise interactions in protein struc-tures can be captured effectively by the PSG/PSN. The details of theconstruction of such a graph on the basis of interaction strength(Imin), and the implications of such graphs have been given earlier(22). The utilities of PSG in following MD trajectories have beendiscussed recently (32). Some of these details, including the selec-tion of optimal strength for connections (Imin), are presented in SIMaterials and Methods. The shortest paths between any two residuesin the protein are evaluated as given below, assuming nonbondedconnections at Imin � 3.2%.
Shortest Path Between Vertices in PSG. The communication pathbetween the anticodon region and the active site region is obtainedby selecting important residues from both the regions and thenidentifying the shortest noncovalently connected path betweenthem. The Floyd–Warshal algorithm (33) was used to determine theshortest path between selected pairs of vertices in a graph. The
distance between connected residues was considered to be one, andthe shortest path was identified as the path in which the twoconcerned residues were noncovalently connected by the smallestnumber of intermediate residues. Important residues from theactive site (Leu-13) and the anticodon binding region (Trp-461,Asn-391, and Arg-395) were selected as the end members, and theshortest paths, along with the intermediately connecting residuesbetween them, were evaluated from the snapshots of the MDtrajectories. Our aim, however, was to select the paths that were theshortest as well as dynamically correlated, which was achieved bycombining the information from DCCM in selecting the dynami-cally relevant shortest paths (DCCM provides correlations betweenresidues that are not spatially connected directly to each other).
The following procedure was adopted for the identification of theshortest path, including the dynamically correlated residues. First,the dynamically correlated residues were identified from DCCM attwo levels [(a) highly correlated (Cij � 0.7–1.0) and (b) moderatelycorrelated (Cij � 0.5–0.7)]. This information was used in identifyingthe network of correlated residues connecting the residues selectedfrom two regions of interest. Second, the shortest noncovalentlyconnected path between the selected two residues was identifiedfrom the PSG, from all of the snapshots of the MD trajectories.Third, the snapshots were selected in which the shortest pathincluded the correlated residues.
An analysis of the correlated shortest paths from the MDtrajectories showed that a wide range of residues were part of theshortest path near the active site and the anticodon binding siteregions. Thus, the conformational fluctuations along the trajecto-ries were reflected in the variations of the length and the compo-sition of the shortest path. Interestingly, most of the snapshotscontained residues around the interface region (i.e., interfacebetween catalytic plus KMSKS and anticodon binding domains) intheir communication paths. Here, we were able to identify fourdifferent sets of residues in this region. Based on this result, weinferred that there are four different communication paths, and wedesignated them I, II, III, and IV. The average shortest path lengthsand the shortest of the shortest paths incorporating the dynamicallycorrelated residues were obtained for each of the four communi-cation networks. These analyses were carried out on all of thesystems (A, B, C, and D), and the results for system D were reportedin detail.
We acknowledge support from the Computational Genomics Initiativeat the Indian Institute of Science, funded by the Department ofBiotechnology (DBT), India, and the computational facilities at theSupercomputer Education and Research Center (SERC), Indian Insti-tute of Science, Bangalore.
1. Lee JW, Beebe K, Nangle LA, Jang J, Longo-Guess CM, Cook SA, DavissonMT, Sundberg JP, Schimmel P, Ackerman SL (2006) Nature 443:50–55.
2. Sekine S, Nureki O, Shimada A, Vassylyev DG, Yokoyama S (2001) Nat StructBiol 8:203–206.
3. Sauter C, Lorber B, Cavarelli J, Moras D, Giege R (2000) J Mol Biol299:1313–1324.
4. Kim HY, Pelka H, Brunie S, Schulman LH (1993) Biochemistry 329:10506–10511.
5. Leon O, Schulman LH (1987) Biochemistry 26:5416–5422.6. Meinnel T, Mechulam Y, LeCorre D, Panvert M, Blanquet S, Fayat G (1991)
Proc Natl Acad Sci USA 88:291–295.7. Perona JJ, Rould MA, Steitz TA, Risler JL, Zelwer C, Brunie S (1991) Proc Natl
Acad Sci USA 88:2903–2907.8. Meinnel T, Mechulam Y, Blanquet S, Fayat G (1991) J Mol Biol 220:205–208.9. Ghosh G, Pelka H, Schulman LH (1990) Biochemistry 29:2220–2225.
10. Ghosh G, Kim HY, Demaret JP, Brunie S, Schulman LH (1991) Biochemistry30:11767–11774.
11. Schmitt E, Meinnel T, Panvert M, Mechulam Y, Blanquet S (1993) J Mol Biol233:615–628.
12. Alexander RW, Schimmel P (1999) Biochemistry 38:16359–16365.13. Weygand-Durasevic I, Rogers MJ, Soll D (1994) J Mol Biol 240:111–118.14. Alexander RW, Schimmel P (2001) Prog Nucleic Acid Res Mol Biol 69:317–349.15. Burbaum JJ, Schimmel P (1991) Biochemistry 30:319–324.16. Zhang CM, Hou YM (2005) Biochemistry 44:7240–7249.17. Kranz JK, Hall KB (1999) J Mol Biol 285:215–231.
18. Showalter SA, Hall KB (2005) Biophys J 89:2046–2058.19. Kormos BL, Baranger AM, Beveridge DL (2006) J Am Chem Soc 128:8992–
8993.20. Kormos BL, Baranger AM, Beveridge DL (2006) J Struct Biol 157:500–513.21. Sathyapriya R, Vishveshwara S (2007) Proteins 68:541–550.22. Kannan N, Vishveshwara S (1999) J Mol Biol 292:441–464.23. Vishveshwara S, Brinda KV, Kannan N (2002) J Th Comp Chem 1:187–211.24. Brinda KV, Vishveshwara S (2005) Biophys J 89:4159–4170.25. Brinda KV, Vishveshwara S (2005) BMC Bioinformatics 6:696.26. Schmitt E, Panvert M, Blanquet S, Mechulam1 Y (1998) EMBO J 17:6819–6826.27. Mechulam Y, Schmitt E, Maveyraud L, Zelwer C, Nureki O, Yokoyama S,
Konno M, Blanquet S (1999) J Mol Biol 294:1287–1297.28. Crepin T, Schmitt E, Mechulam Y, Sampson PB, Vaughan MD, Honek JF,
Blanquet S (2003) J Mol Biol 332:59–72.29. Nakanishi K, Ogiso Y, Nakama T, Fukai S, Nureki O (2005) Nat Struct Mol Biol
12:931–932.30. Case DA, Darden TA, Cheatham TE, III, Simmerling CL, Wang J, Duke RE,
Luo R, Merz KM, Pearlman DA, Crowley M, et al. (2006) AMBER 9 (Universityof California, San Francisco).
31. Cheatham TE, III, Cieplak P, Kollman PA (2002) J Biomol Struct Dyn16:845–861.
32. Ghosh A, Brinda KV, Vishveahwara S (2007) Biophys J 92:2523–2535.33. Thomas HC, Charles EL, Ronald LR (1990) Introduction to Algorithms (MIT
Press, Cambridge, MA), 1st Ed.
15716 � www.pnas.org�cgi�doi�10.1073�pnas.0704459104 Ghosh and Vishveshwara
Dow
nloa
ded
by g
uest
on
May
26,
202
0

![bAcids Nucleosides, Nucleotides and Nucleic - UMEXPERT · Role of Initiator tRNA i met in Fidelity of Initiation of Protein Synthesis 727 (aa-tRNA) ternary complex.[1] The tRNA binding](https://img.pdfslide.us/doc/110x75/5c25d16309d3f28d198c11f7/bacids-nucleosides-nucleotides-and-nucleic-umexpert-role-of-initiator-trna.jpg)